www.elsevier.com/locate/jneuroim
Journal of Neuroimmunology 143 (2003) 74–78
Genetic analysis of multiple sclerosis in Europeans: French data
Mehdi Alizadeha,b,1, Emmanuelle Geninc,1,Marie-Claude Babronc,1, Brigitte Birebenta,b, Isabelle Cournu-Rebeixd, Jacqueline Yaouanqe,f,Stephane Dreanoa,b, Stephen Sawcerg, Alastair Compstong, Michel Claneth, Gilles Edane,f,
Bertrand Fontained, Franc�oise Clerget-Darpouxc, Gilbert Semana a,b,*
the French Multiple Sclerosis Genetics GroupaLaboratoire d’Immunologie, UPRES EA 1257 (IFR97), Faculte de Medecine, 2 Avenue du Pr Leon Bernard CS 34317, 35043 Rennes Cedex, France
bLaboratoire d’Immuno-Genetique, Etablissement Franc�ais du Sang Bretagne, Rue Pierre Jean Gineste, 35000 Rennes, Francec INSERM U535, Genetique epidemiologique et structure des populations humaines, Batiment Gregory Pincus,
80 Rue du General Leclerc, 94276 Le Kremlin Bicetre Cedex, Franced INSERM U546, Faculte de Medecine Pitie-Salpetriere, 105 Boulevard de l’Hopital, 75013 Paris, France
eService de Neurologie, CHU Pontchaillou, Rue Henri Leguillou, 35043 Rennes, FrancefLaboratoire Universitaire d’Immunologie, UPRES EA 1257 (IFR97), Faculte de Medecine, 2 Avenue du Pr Leon Bernard CS 34317,
35043 Rennes Cedex, FrancegNeurology Unit, Addenbrooke’s Hospital, University of Cambridge, Box 165, Hills Road, Cambridge CB22 QQ, UK
hDepartement de Neurologie, CHU Purpan, Pavillon Riser, Place du Docteur Baylac, 31059 Toulouse, France
Abstract
We report the results of a genome-wide screen for linkage disequilibrium (LD) in multiple sclerosis (MS) performed on 200 cases, 200
controls and 200 case–parent trios from France employing pooled DNA methodology. A total of 3510 microsatellite markers supplied
through the GAMES collaborative were analysed and ranked according to their evidence for association. The most promising 117 markers
were then followed up in a two-step validation process. In the first step, additional PCR of the DNA pools was performed in order to refine
the ranking order. In the second step, markers were genotyped in individual cases and parents from the trio families. Seven markers showing
nominally significant allele frequency differences between affected and unaffected emerged—D6S265, D12S1064, TNFa, D7S1824,
D14S1426, D14S605 and D21S2051. These potential associations will require confirmation in further studies.
D 2003 Elsevier B.V. All rights reserved.
Keywords: Genome screen; Linkage disequilibrium; French; Multiple sclerosis; DNA pooling
1. Introduction the genetic risk factors involved may be difficult to find by
Multiple sclerosis (MS) is a complex, multifactorial dis-
ease of the central nervous system. The prevalence of the
disease varies with latitude, from about 120/100,000 in
Scandinavia to less than 20/100,000 in the Mediterranean
area. In France, MS prevalence reaches about 40/100,000.
Apart from the HLA region (Yaouanq et al., 1997), no other
genetic risk factor has so far been identified. Whole genome
linkage studies have remained inconclusive and suggest that
0165-5728/$ - see front matter D 2003 Elsevier B.V. All rights reserved.
doi:10.1016/j.jneuroim.2003.08.015
* Corresponding author. Laboratoire d’Immunologie, UPRES EA 1257
(IFR97), Faculte de Medecine, 2 Avenue du Pr Leon Bernard CS 34317,
35043 Rennes Cedex, France. Tel.: +33-2-99-54-83-41; fax: +33-2-99-54-
83-20.
E-mail address: [email protected] (G. Semana).1 These authors contributed equally.
linkage strategies and that association studies could be more
powerful.
Here, we report the results of a whole genome screen
for linkage disequilibrium (LD) performed using a dense
map of microsatellite markers in pooled DNA from
French cases, controls and family trios. Compared to
other studies performed as part of the GAMES project,
our analysis presents two original aspects. First, DNAs
were pooled on the basis of Taq Man results and second,
we employed our own statistical method for ranking the
markers in terms of their evidence for association. The
most promising markers identified in this screening
experiment were then followed up in a two-step valida-
tion process: Firstly by performing additional PCR of the
pooled samples and then by individually typing cases and
parents in the trios.
M. Alizadeh et al. / Journal of Neuroimmunology 143 (2003) 74–78 75
2. Patients and controls
MS French family trios and individual cases were pro-
spectively recruited as part of a survey of MS patients
identified from throughout France by the French Genetics
Group. Trios were ascertained through one patient per
family and two parents available for typing. All patients
included in the study were examined by one of us and
fulfilled diagnosis criteria for definite MS (Poser et al.,
1983). A total of 200 family trios, 200 unrelated MS cases
and 200 blood donor unrelated healthy controls were
included in this study. Unrelated cases and controls were
matched for sex. Informed consent was given by each
individual participation in the study according to the Hel-
sinki convention (1964) and French law relating to biomed-
ical research.
3. Method
3.1. DNA pooling
DNA pools were constructed using results from Taq Man
PCR of each sample. The effective amount of amplifiable
DNA input in each sample was assessed using a pair of
primers and a Taq ManR probe specific for the gene
(GAPD). Probe and primers sequences were as previously
described (Alizadeh et al., 2002). Four pools were constitut-
ed: (i) pool 1: 200 cases, (ii) pool 2: 200 controls, (iii) pool 3:
200 index cases, (iv) pool 4: parents of 200 index cases.
3.2. Markers
The microsatellite markers used to screen the whole
genome were provided by the GAMES collaborative and
are described elsewhere (Sawcer et al., 2002). Each marker
was amplified for each pool and resulting PCR products
were electrophoresed twice. Electropherograms with at least
one peak >10,000, or with all peaks < 200 were excluded.
3.3. Statistical analysis
The idea of the analysis is to rank the markers according
the difference they show in the patient and control samples.
It is already well established that stutter artefacts and
preferential amplification of the shorter alleles confound
the relationship between the allele image pattern (AIP)
obtained in the analysis of pooled DNA and the underlying
allele frequency distribution. However, Barcellos et al.
(1997) have argued that ‘‘artefacts produced by stutter or
preferential amplification act without bias on both patient
and control samples. If a marker association is strong
enough, significant differences will be observed between
pooled patient and control allele frequencies, even without
adjustment for stutter artefact’’. For each marker, allele
frequencies in the different pools were deduced from the
AIP by dividing peak heights for the different alleles by the
sum of the peak heights. The 5% of markers showing the
greatest difference between the two replicated electrophore-
sis were excluded. In all following analyses, the allele
frequencies used were the average over the two experiments
on the 3510 remaining markers.
For the case–parent trios, non-transmitted allele frequen-
cies were inferred from observed allele frequencies in the
parent and case pools. The frequency fNT(i,j) of a given
allele i at marker j in non-transmitted is simply obtained
from the frequencies fPAR(i,j) and fCAS(i,j) of this allele in
parents and cases:
fNTði; jÞ ¼ 2fPARði; jÞ � fCASði; jÞ:
To test for association between the trait and the different
markers, three comparisons of allele frequency distributions
were performed:
– test C1: cases (pool P1) versus controls (pool P2),
– test C2: index (pool P3) versus non-transmitted,
– test C3: combined test : cases + index versus controls +
non-transmitted.
Test C1 was performed on all 3510 markers. Tests C2 and
C3 were only performed on 3210 autosomal markers: 160
markers on the X chromosome and 140 autosomal markers
for which one of the non-transmitted allele frequencies was
negative, were excluded. The rationale for excluding these
markers from tests C2 and C3 was
– for markers on the X chromosome, in trios, only the
transmissions from the mothers are informative but
mothers and fathers were pooled together in pool 4.
– for autosomal markers, when inferred non-transmitted
allele frequencies are negative, the comparability of
parent and case allele image profiles could be questioned.
To compare these distributions, we used the following
strategies.
(1) We calculated a chi-square distance Tk for each marker:
Tk ¼ 2NXk
a¼1
ðf1a � f2aÞ2
f1a þ f2a
where k is the total number of alleles for the marker and
f1a and f2b the frequencies of allele a in the two groups to
be compared and N is the total sample size (i.e., 400).
(2) We standardised Tk, to obtain TkV:
TkV ¼ Tk � Tk
rTk
:
The mean Tk and standard deviation rTkof Tk were
computed for each test on the 95% smallest Tk values for
each number of alleles k.

Fig. 1. Probability plot of T3 against a theoretical chi-square distribution
with 2 degrees of freedom. If T3 was chi-square, the plots should be lined
with the bisector (shown as a plain line).
Table 1
List of the 25 best-ranked markers after the genome-wide screen
Marker Screening Validation 1: homogeneity Validation 2
Rank Within 6
PCRs
With initial
PCRs
AFBAC
p-value
D19S429 1 yes no
D9S172 2 yes no
D11S4178 3 no no
D9S147E 4 yes no
D1S2882 5 yes no
D21S2049 6 yes yes 0.2011
DXS8019 7 yes no
D6S265 8 yes yes 0.0041
D10S572 9 yes yes 0.4283
D2S1776 10 yes yes 0.1276
D15S101 11 yes no
D1S2777 12 n.t. n.t.
D5S2115 13 yes no
D8S1142 14 yes no
D10S213 15 n.t. n.t.
DXS8054 16 n.t. n.t.
D2S2361 17 yes no
D11S1362 18 n.t. n.t.
D3S3557 19 n.t. n.t.
D12S1064 20 yes yes 0.0297
D1S2756 21 yes no
D13S1243 22 n.t. n.t.
GGAA30B06 23 yes yes Typing problem
D12S92 24 n.t. n.t.
D13S217 25 n.t. n.t.
The respective ranks of the different markers are in the second column. In
the next columns are the results of the first validation steps. The markers for
which the six PCRs were homogeneous are indicated in the column ‘‘within
6 PCRs’’ and the markers showing consistent patterns of differences
between affecteds and unaffecteds in this step as compared to the initial
screen are highlighted in column ‘‘with initial PCRs’’ (n.t. indicates not
tested). The last column shows the p-value obtained for the AFBAC test
after individual genotyping.
M. Alizadeh et al. / Journal of Neuroimmunology 143 (2003) 74–7876
This transformation was used because pooling introdu-
ces additional sources of variance leading to a deviation
of Tk from the theoretical chi-square distribution with
k� 1 degrees of freedom. This is illustrated in Fig. 1 for
the test C1. A probability plot (Chambers et al., 1983) is
presented for the case of markers with three alleles. The
deviation of the T3 from the chi-square distribution with
2 degrees of freedom is evident.
(3) We ranked the different markers based on the TkV values
for test C1 and tests C2 and C3 when available. Note
that TkV values can be ranked irrespective of the actual
number of allele k.
(4) For markers that were considered in all three tests, we
compared the ranks obtained for tests C1 and C2 and
excluded those that show a difference of ranks greater
than 200.
(5) We define a list of the best 25 markers based on the C3
ranks or C1 ranks.
3.4. Follow-up study
For a subset of markers selected after the genome-wide
screen, a follow-up study was performed in two steps.
3.4.1. Validation step 1
Since one important source of variance with pooling is
the variance introduced by the PCR on the pools, we
decided to test again the markers in the same four pools.
For each marker and for each pool, six additional PCRs
were performed. Homogeneity of the allele image profiles
obtained from these six PCRs was tested by chi-square tests
and markers showing significantly different profiles among
the six PCRs at the 5% significance level were excluded.
The average profiles of the two initial PCRs (performed in
Cambridge) and of the six new PCRs (performed in Rennes)
were compared. Only markers showing consistent differ-
ences between affected and unaffected profiles were
retained for the next step.
3.4.2. Validation step 2
The markers selected after the first validation step were
individually genotyped in cases and parents of the trios.
Direct estimates of allele frequencies among cases and
among non-transmitted alleles could thus be obtained. These
allele frequencies were compared to the ones obtained from
the pool. To test for association, an AFBAC analysis was
performed (Thomson, 1995), where allele frequencies trans-
mitted and non-transmitted to affected offspring were com-
pared by a chi-square test. Markers with a nominal p-value
lower than 0.05 were considered as having passed validation
step 2.
4. Results
The 25 markers with the highest ranking after the
genome-wide screen are shown in Table 1. These include
M. Alizadeh et al. / Journal of Neuroimmunology 143 (2003) 74–78 77
one marker from the HLA region, marker D6S265, which
has rank 8. The raw data from these 25 markers was re-
inspected and the 17 with the best quality AIPs were
retested in validation step 1. One marker (D11S4178) was
excluded because of heterogeneity among the six repeat
PCR profiles. A further 10 markers were excluded as they
no longer showed a difference between affecteds and
unaffecteds in the repeat PCR profiles. Therefore, 6/17
markers were considered to have passed validation step 1.
These six markers were individually genotyped in the
trio families and association was tested by comparing the
frequencies of alleles transmitted and non-transmitted to the
affected offspring. The results of this AFBAC analysis are
presented in the last column of Table 1. Two markers,
D6S265 in the HLA region, and D12S1064 gave a result
nominally significant at the 5% level. For three of the other
markers, allele frequencies were not significantly different
among transmitted and non-transmitted alleles. Finally, for
marker GGAA30B06, no individual genotyping was possi-
ble, as there was a problem of competition in the amplifi-
cation of the two alleles. Interestingly, for this marker, the
image allele profiles obtained on the pools were very clear
and apparently unambiguous.
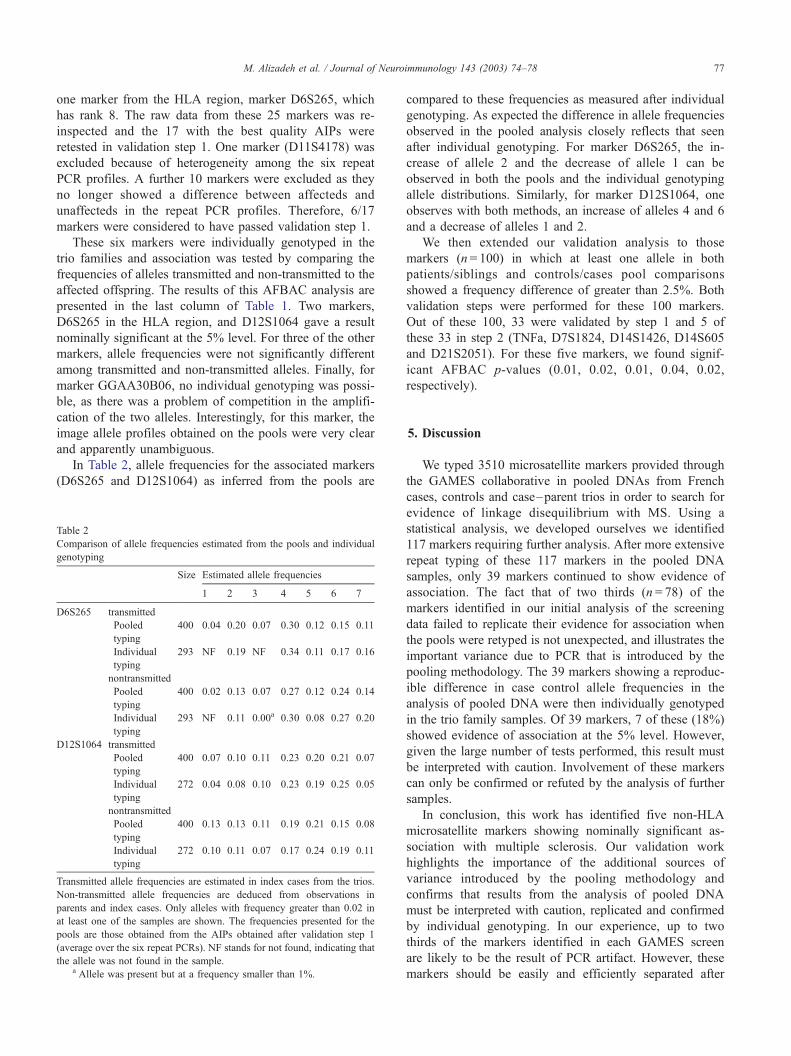
In Table 2, allele frequencies for the associated markers
(D6S265 and D12S1064) as inferred from the pools are
Table 2
Comparison of allele frequencies estimated from the pools and individual
genotyping
Size Estimated allele frequencies
1 2 3 4 5 6 7
D6S265 transmitted
Pooled
typing
400 0.04 0.20 0.07 0.30 0.12 0.15 0.11
Individual
typing
293 NF 0.19 NF 0.34 0.11 0.17 0.16
nontransmitted
Pooled
typing
400 0.02 0.13 0.07 0.27 0.12 0.24 0.14
Individual
typing
293 NF 0.11 0.00a 0.30 0.08 0.27 0.20
D12S1064 transmitted
Pooled
typing
400 0.07 0.10 0.11 0.23 0.20 0.21 0.07
Individual
typing
272 0.04 0.08 0.10 0.23 0.19 0.25 0.05
nontransmitted
Pooled
typing
400 0.13 0.13 0.11 0.19 0.21 0.15 0.08
Individual
typing
272 0.10 0.11 0.07 0.17 0.24 0.19 0.11
Transmitted allele frequencies are estimated in index cases from the trios.
Non-transmitted allele frequencies are deduced from observations in
parents and index cases. Only alleles with frequency greater than 0.02 in
at least one of the samples are shown. The frequencies presented for the
pools are those obtained from the AIPs obtained after validation step 1
(average over the six repeat PCRs). NF stands for not found, indicating that
the allele was not found in the sample.a Allele was present but at a frequency smaller than 1%.
compared to these frequencies as measured after individual
genotyping. As expected the difference in allele frequencies
observed in the pooled analysis closely reflects that seen
after individual genotyping. For marker D6S265, the in-
crease of allele 2 and the decrease of allele 1 can be
observed in both the pools and the individual genotyping
allele distributions. Similarly, for marker D12S1064, one
observes with both methods, an increase of alleles 4 and 6
and a decrease of alleles 1 and 2.
We then extended our validation analysis to those
markers (n = 100) in which at least one allele in both
patients/siblings and controls/cases pool comparisons
showed a frequency difference of greater than 2.5%. Both
validation steps were performed for these 100 markers.
Out of these 100, 33 were validated by step 1 and 5 of
these 33 in step 2 (TNFa, D7S1824, D14S1426, D14S605
and D21S2051). For these five markers, we found signif-
icant AFBAC p-values (0.01, 0.02, 0.01, 0.04, 0.02,
respectively).
5. Discussion
We typed 3510 microsatellite markers provided through
the GAMES collaborative in pooled DNAs from French
cases, controls and case–parent trios in order to search for
evidence of linkage disequilibrium with MS. Using a
statistical analysis, we developed ourselves we identified
117 markers requiring further analysis. After more extensive
repeat typing of these 117 markers in the pooled DNA
samples, only 39 markers continued to show evidence of
association. The fact that of two thirds (n = 78) of the
markers identified in our initial analysis of the screening
data failed to replicate their evidence for association when
the pools were retyped is not unexpected, and illustrates the
important variance due to PCR that is introduced by the
pooling methodology. The 39 markers showing a reproduc-
ible difference in case control allele frequencies in the
analysis of pooled DNA were then individually genotyped
in the trio family samples. Of 39 markers, 7 of these (18%)
showed evidence of association at the 5% level. However,
given the large number of tests performed, this result must
be interpreted with caution. Involvement of these markers
can only be confirmed or refuted by the analysis of further
samples.
In conclusion, this work has identified five non-HLA
microsatellite markers showing nominally significant as-
sociation with multiple sclerosis. Our validation work
highlights the importance of the additional sources of
variance introduced by the pooling methodology and
confirms that results from the analysis of pooled DNA
must be interpreted with caution, replicated and confirmed
by individual genotyping. In our experience, up to two
thirds of the markers identified in each GAMES screen
are likely to be the result of PCR artifact. However, these
markers should be easily and efficiently separated after

M. Alizadeh et al. / Journal of Neuroimmunology 143 (2003) 74–7878
repeat typing of the pooled DNA samples. Analysis of the
remaining markers by individual genotyping is expected
to reveal approximately one fifth as nominally associated.
Given the large number of markers tested, it is expected
that many of the markers identified in a GAMES screen
like ours will be the result of sampling variance. How-
ever, whether these nominal associations are the result of
genuine population frequency differences (real associa-
tion) or simply the result of sampling variation can only
be determined by the analysis of additional sample
cohorts.
Acknowledgements
This study was supported by grants from Fondation pour
la Recherche Medicale (FRM action 2000), by Association
pour la Recherche sur la Sclerose en Plaque (ARSEP). The
study represents one component of the GAMES project
designed and coordinated by Alastair Compston and
Stephen Sawcer (Cambridge, UK) with funding from the
Wellcome Trust (grant 057097) supplemented by the
Multiple Sclerosis Societies of the United Stated and Great
Britain, and MS International Federation.
References
Alizadeh, M., Bernard, M., Danic, B., Dauriac, C., Lapart, C., Lamy, T., Le
Prise, P.Y., Beauplet, A., Semana, G., Quelvennec, E., 2002. Quantita-
tive assessment of hematopoietic chimerism after bone marrow trans-
plantation by real time quantitative PCR. Blood 99, 4618–4625.
Barcellos, L.F., Klizt, W., Field, L.L., Tobias, R., Bowcock, A.M., Wilson,
R., Nelson, M.P., Nagatomi, J., Thomson, G., 1997. Association map-
ping of disease loci, by use of a pooled DNA genomic screen. Am. J.
Hum. Genet. 61, 734–747.
Chambers, J., Cleveland, W., Kleiner, B., Tukey, P., 1983. Graphical
Methods for Data Analysis. Wadsworth, Belmont, CA. 35 pp.
Poser, C.M., Paty, D.Q., Scheinberg, L., McDonald, W.I., Davis, F.A.,
Ebers, G.C., et al., 1983. New diagnostic criteria for multiple sclerosis:
guidelines for research protocol. Ann. Neurol. 52, 1336–1632.
Sawcer, S., Maranian, M., Setakis, E., Curwen, V., Akesson, E., Hensiek,
A., Coraddu, F., Roxburgh, R., Sawcer, D., Gray, J., Deans, J., Good-
fellow, P.N., Walker, N., Clayton, D., Compston, A., 2002. A whole
genome screen for linkage disequilibrium in multiple sclerosis confirms
disease associations with regions previously linked to susceptibility.
Brain 125, 1337–1347.
Thomson, G., 1995. Mapping disease genes: family-based association
studies. Am. J. Hum. Genet. 57, 487–498.
Yaouanq, J., Semana, G., Eichenbaum, S., Quelvennec, E., Clanet, M.,
Clerget-Darpoux, F., 1997. Evidence for linkage disequilibrium be-
tween HLA-DRB1 gene and multiple sclerosis. The French Research
Group on Genetic Susceptibility to MS. Science 276 (5313), 664–665.


