
Geohydrology and Water Quality of Stratified-Drift Aquifers in the Winnipesaukee River Basin, Central New Hampshire
By JOSEPH D. AYOTTE
U.S. Geological SurveyWater-Resources Investigations Report 94-4150
Prepared in cooperation with theNEW HAMPSHIRE DEPARTMENT OF ENVIRONMENTAL SERVICESWATER RESOURCES DIVISION
Pembroke, New Hampshire 1997
Estimation of Water Availability for Selected Aquifers.............................................................................................. 31Model Construction........................................................................................................................................... 31Model Input Parameters.................................................................................................................................... 32
Position of the Water Table..................................................................................................................... 32Saturated Thickness and Hydraulic Conductivity................................................................................... 32Specific Yield.......................................................................................................................................... 32Streambed Hydraulic Conductivity......................................................................................................... 32
Results of Ground-Water Availability Estimates .............................................................................................. 33Merrymeeting River Aquifer................................................................................................................... 33Pumping Station Brook Aquifer.............................................................................................................. 36
Ground-Water Quality........................................................................................................................................................... 39Specific Conductance.................................................................................................................................................. 39Dissolved Solids........................................................................^ 39pH......................................................_ 39Alkalinity..................................................................................................................................................................... 42Calcium, Magnesium, and Hardness........................................................................................................................... 42Sodium and Chloride................................................................................................................................................... 43Nittate...............................................................^ 44Sulfate.......................................................................................................................................................................... 44Iron and Manganese.................................................................................................................................................... 44Trace Elements............................................................................................................................................................ 44
Summary and Conclusions.................................................................................................................................................... 45Selected References...............................................................................~^ 46Glossary..................................................................................................................................................................^ 50Appendixes
A. Description of selected wells, borings, and springs in the Winnipesaukee River Basin,central New Hampshire................................................................................................................................. 55
B. Stratigraphic logs of selected wells and borings in the Winnipesaukee River Basin,central New Hampshire................................................................................................................................. 93
C. Geohydrologic sections interpreted from seismic-refraction data, central New Hampshire.................................. 159D. Low streamflow measurements at miscellaneous sites in central New Hampshire............................................... 183E. Monthly water levels at selected wells, central New Hampshire........................................................................... 189
PLATES
[Plates are in pocket]
1-4. Maps showing aquifer boundaries, data-collection locations, materials, and altitude of water table for stratified-drift aquifers in the Winnipesaukee River Basin, central New Hampshire:1. Southwestern part2. Southeastern part3. Northwestern part4. Northeastern part
5-8. Maps showing saturated thickness, transmissivity, and materials of stratified-drift aquifers in the Winnipesaukee River Basin, central New Hampshire:5. Southwestern part6. Southeastern part7. Northwestern part8. Northeastern part
IV Contents

FIGURES
1. Map showing location of study area and towns in the Winnipesaukee River Basin, centralNew Hampshire......................................................................................................^ 3
2. Sectional diagram of an ice-dammed glaciolacustrine deltaic aquifer....................................................................... 63. Block diagram of the formation of a glaciofluvial deltaic aquifer............................................................................. 74. Map showing maximum extent of glacial-lake environments in the Winnipesaukee River Basin,
central New Hampshire.............................................................................................................................................. 95. Hydrograph showing long-term water levels at observation well FKW-1 in stratified drift,
central New Hampshire.............................................................................................................................................. 146. Map showing locations of selected long-term streamflow-gaging stations in and near
the Winnipesaukee River Basin, central New Hampshire.......................................................................................... 167, 8. Diagrams showing:
7. Ground-water flow and water-level drawdowns at a withdrawal well near animpermeable boundary...................................................................................................................................... 17
8. Ground-water flow and water-level drawdowns at a withdrawal well near a rechargeboundaiy............................................................................................................................................^ 18
9. Graph showing relation between estimated hydraulic conductivity, median grain size,and degree of sorting of stratified drift in New Hampshire........................................................................................ 20
10. Map showing general locations of selected aquifers in the Winnipesaukee River Basin,central New Hampshire.............................................................................................................................................. 22
11-14. Geohydrologic sections through the:11. Pumping Station Brook aquifer, Belmont, New Hampshire ............................................................................. 2312. Gunstock River aquifer, Gilford, New Hampshire............................................................................................ 2613. Merrymeeting River aquifer, Alton, New Hampshire....................................................................................... 2714. Hawkins Brook aquifer, Meredith, New Hampshire......................................................................................... 29
15-18. Map showing model boundary, surface-water boundaries, hypothetical wells, and drawdown contours for the;15. Merrymeeting River aquifer, central New Hampshire with simulation of
induced infiltration............................................................................................................................................. 3416. Merrymeeting River aquifer, central New Hampshire with simulation of no
induced infiltration............................................................................................................................................. 3517. Pumping Station Brook aquifer, central New Hampshire with simulation of
induced infiltration............................................................................................................................................. 3718. Pumping Station Brook aquifer, central New Hampshire with simulation of no
induced infiltration............................................................................................................................................. 38
TABLES
1. Two-letter town codes used as prefixes in the numbering system for wells, borings, andsprings in the Winnipesaukee River Basin, central New Hampshire ..................................................................... 5
2. Percentage of flow duration on July 3, 1991, for selected U.S. Geological Survey streamflow- gaging stations in and near the Winnipesaukee River Basin, central New Hampshire.......................................... 17
3. Relation of mean bulk hydraulic conductivity to median grain size and degree of sorting ofstratified drift in New Hampshire ........................................................................................................................... 20
4. Water-availability estimates for two simulations of the Merrymeeting River aquifer,central New Hampshire........................................................................................................................................... 33
5. Water-availability estimates for two simulations of the Pumping Station Brook aquifer,central New Hampshire........................................................................................................................................... 36
6. Chemical analyses of ground-water samples from the Winnipesaukee River Basin,central New Hampshire........................................................................................................................................... 40
7. Classification of hardness of water......................................................................................................................... 44
Contents

CONVERSION FACTORS, VERTICAL DATUM, AND ABBREVIATED WATER-QUALITY UNITS
CONVERSION FACTORS
Multiply By To obtain
inch (in.)foot (ft)
mile (mi)
foot per mile (ft/mi)
square mile (mi2)
gallon (gal)million gallons (Mgal)
cubic foot (ft3)
foot per second (ft/s)cubic foot per second (ft3/s)
cubic foot per second per second persquare mile [(ft3/s)/mr)]
gallon per minute (gal/min)gallon per day (gal/d)
million gallons per day (Mgal/d)million gallons per day per square mile
(Mgal/d/mi2)
Length25.40.30481.609
Slope0.1894
Area2.590
Volume3.785
3,7850.02832
Velocity and Flow0.30480.028320.01093
0.063093.78540.04381
1,460
millimetermeterkilometer
meter per kilometer
square kilometer
litercubic metercubic meter
meter per secondcubic meter per secondcubic meter per per square kilometer
liter per secondliter per daycubic meter per secondcubic meter per second per squarekilometer
Hydraulic Conductivityfoot per day (ft/d) 0.3048 meter per day
foot squared per day (ft/d)Transmissivity
0.09290 meter squared per day
VERTICAL DATUM
Sea level: In this report, "sea level" refers to the National Geodetic Vertical Datum of 1929 (NGVD of 1929) a geodetic datum derived from a general adjustment of the first-order level nets of the United States and Canada, formerly called Sea Level Datum of 1929.
ABBREVIATED WATER-QUALITY UNITS
In this report, chemical concentration in water is expressed in milligrams per liter (mg/L) or micrograms per liter (|J.g/L). Milligrams per liter is a unit expressing the concentration of chemical constituents in solution as weight (milligrams) of solute per unit volume (liter) of water; 1,000 (ig/L (micrograms per liter) is equivalent to 1 mg/L (milligram per liter). Water temperature in degrees Celsius (°C) can be converted to degrees Fahrenheit (°F) by use of the following equation:
°F=1.8(°C)+32.
Specific conductance of water is express in microsiemens per centimeter at 25 degrees Celsius (|0,S/cm). This unit is equivalent to micromhos per centimeter at 25 degrees Celsius, formerly used by the U.S. Geological Survey.
VI Contents

Geohydrology and Water Quality of Stratified-Drift Aquifers in the Winnipesaukee River Basin, Central New HampshireBy Joseph D. Ayotte
Abstract
The Winnipesaukee River Basin drains 484 square miles; 66 square miles is underlain by stratified-drift aquifers. Saturated thickness of stratified drift in the study area is locally greater than 100 feet but generally is less. Transmissivity of stratified-drift aquifers locally exceeds 4,000 square feet per day but is generally less than 1,000 square feet per day. In 1993, in the Winnipesaukee River Basin, ground-water withdrawals from stratified drift totaled about 0.1 million gallons per day for public supply. Many of the stratified-drift aquifers in the study area are not fully developed.
The geohydrologic investigation of stratified-drift aquifers focused on basic aquifer properties including aquifer boundaries; recharge, discharge, and direction of ground-water flow; saturated thickness and storage; and transmissivity. Surficial geologic mapping was used in the determination of aquifer boundaries. Data from more than 860 wells and test borings were used to produce maps of water-table altitude, saturated thickness, and transmissivity of stratified drift. More than 7 miles of seismic-refraction
profiling and 10 miles of seismic-reflection profiling also were used to construct the water-table and saturated-thickness maps.
A stratified-drift aquifer in Alton and one in Belmont were analyzed by use of a two- dimensional, finite-difference ground-water-flow model to estimate ground-water availability. The available water for the Merrymeeting River aquifer (in Alton) was estimated to be 0.63 to 1.1 million gallons per day, and the available water for the Pumping Station Brook aquifer (in Belmont) was estimated to be 1.6 to 1.8 million gallons per day. Comparison of these estimates with those derived from analytical models for the same areas showed that the estimates are reasonable. Total available water estimates from the analytical models, however, were generally 20 percent greater than estimates from the numerical model.
Results of analysis of water samples from 17 test wells indicate that, with some exceptions, water in the stratified-drift aquifers meets U.S. Environmental Protection Agency primary and secondary drinking-water standards. Sites of known ground-water contamination were not sampled. Elevated concentrations of iron and manganese were the most common water-quality problems.
Abstract 1
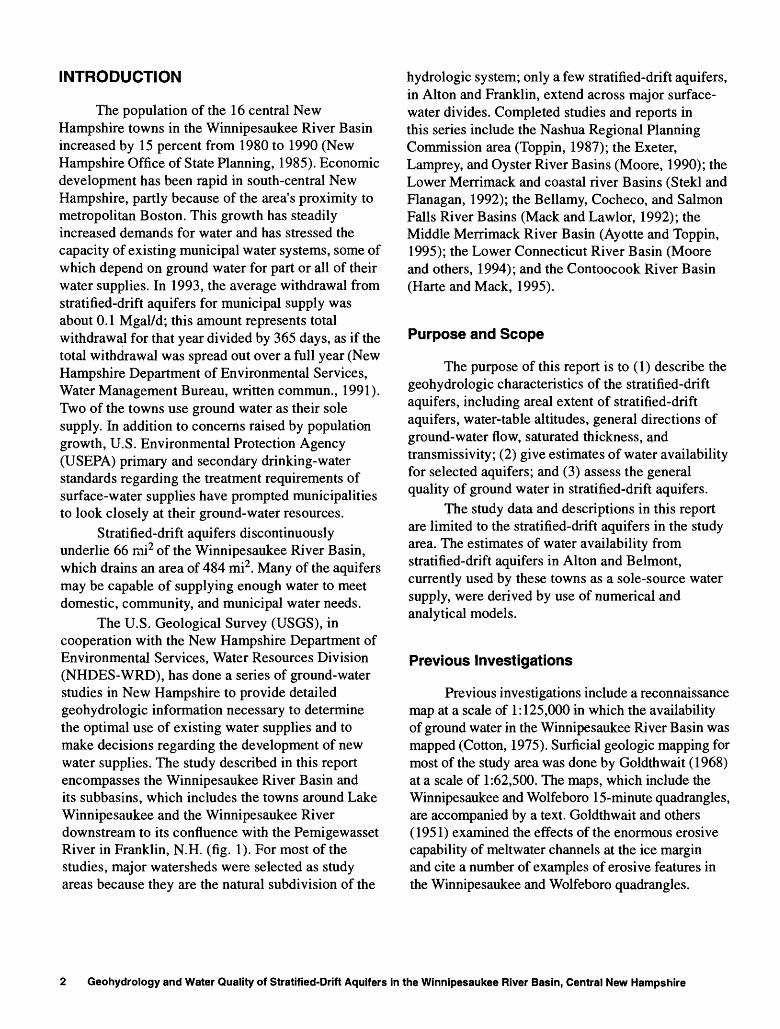
INTRODUCTION
The population of the 16 central New Hampshire towns in the Winnipesaukee River Basin increased by 15 percent from 1980 to 1990 (New Hampshire Office of State Planning, 1985). Economic development has been rapid in south-central New Hampshire, partly because of the area's proximity to metropolitan Boston. This growth has steadily increased demands for water and has stressed the capacity of existing municipal water systems, some of which depend on ground water for part or all of their water supplies. In 1993, the average withdrawal from stratified-drift aquifers for municipal supply was about 0.1 Mgal/d; this amount represents total withdrawal for that year divided by 365 days, as if the total withdrawal was spread out over a full year (New Hampshire Department of Environmental Services, Water Management Bureau, written commun., 1991). Two of the towns use ground water as their sole supply. In addition to concerns raised by population growth, U.S. Environmental Protection Agency (USEPA) primary and secondary drinking-water standards regarding the treatment requirements of surface-water supplies have prompted municipalities to look closely at their ground-water resources.
Stratified-drift aquifers discontinuously underlie 66 mi2 of the Winnipesaukee River Basin, which drains an area of 484 mi2 . Many of the aquifers may be capable of supplying enough water to meet domestic, community, and municipal water needs.
The U.S. Geological Survey (USGS), in cooperation with the New Hampshire Department of Environmental Services, Water Resources Division (NHDES-WRD), has done a series of ground-water studies in New Hampshire to provide detailed geohydrologic information necessary to determine the optimal use of existing water supplies and to make decisions regarding the development of new water supplies. The study described in this report encompasses the Winnipesaukee River Basin and its subbasins, which includes the towns around Lake Winnipesaukee and the Winnipesaukee River downstream to its confluence with the Pemigewasset River in Franklin, N.H. (fig. 1). For most of the studies, major watersheds were selected as study areas because they are the natural subdivision of the
hydrologic system; only a few stratified-drift aquifers, in Alton and Franklin, extend across major surface- water divides. Completed studies and reports in this series include the Nashua Regional Planning Commission area (Toppin, 1987); the Exeter, Lamprey, and Oyster River Basins (Moore, 1990); the Lower Merrimack and coastal river Basins (Stekl and Flanagan, 1992); the Bellamy, Cocheco, and Salmon Falls River Basins (Mack and Lawlor, 1992); the Middle Merrimack River Basin (Ayotte and Toppin, 1995); the Lower Connecticut River Basin (Moore and others, 1994); and the Contoocook River Basin (Harte and Mack, 1995).
Purpose and Scope
The purpose of this report is to (1) describe the geohydrologic characteristics of the stratified-drift aquifers, including areal extent of stratified-drift aquifers, water-table altitudes, general directions of ground-water flow, saturated thickness, and transmissivity; (2) give estimates of water availability for selected aquifers; and (3) assess the general quality of ground water in stratified-drift aquifers.
The study data and descriptions in this report are limited to the stratified-drift aquifers in the study area. The estimates of water availability from stratified-drift aquifers in Alton and Belmont, currently used by these towns as a sole-source water supply, were derived by use of numerical and analytical models.
Previous Investigations
Previous investigations include a reconnaissance map at a scale of 1:125,000 in which the availability of ground water in the Winnipesaukee River Basin was mapped (Cotton, 1975). Surficial geologic mapping for most of the study area was done by Goldthwait (1968) at a scale of 1:62,500. The maps, which include the Winnipesaukee and Wolfeboro 15-minute quadrangles, are accompanied by a text. Goldthwait and others (1951) examined the effects of the enormous erosive capability of meltwater channels at the ice margin and cite a number of examples of erosive features in the Winnipesaukee and Wolfeboro quadrangles.
2 Geohydrology and Water Quality of Stratified-Drift Aquifers in the Winnipesaukee River Basin, Central New Hampshire

INDEX MAP OF NEW HAMPSHIRE
10 KILOMETERS
EXPLANATION
PRESENT-DAY LAKES
- DRAINAGE-BASIN DIVIDE
- - COUNTY BOUNDARY
------ TOWN BOUNDARY
Base from U.S. Geological Survey digital data,24,000, 1991 and State of New Hampshire,
Dept. of Environmental Services digital data, 1:24,000, 1991 New Hampshire State Pk
MASSACHUSETTS
0 30 60 MILES
0 30 60 KILOMETERS
Figure 1. Location of study area and towns in the Winnipesaukee River Basin, central New Hampshire.
Introduction

Haselton mapped the surficial geology of the town of Gilford (1991, unpublished map on file at Rust Environment Infrastructure, Concord, N.H.). Morgan (1985) prepared a surficial-aquifer delineation and water-use investigation for the town of Moultonborough. Numerous other studies have been done by private consultants for local concerns.
Methods of Study
The following methods were used in this study:1. Areal extent of the stratified-drift aquifers was
delineated by use of soils maps from the U.S. Soil Conservation Service, surficial geologic maps, and field mapping done specifically for this project.
2. Published and unpublished data on ground- water levels and the saturated thickness and stratigraphy of the aquifers were compiled from the USGS, NHDES-WRD, NHDES- Water Supply and Pollution Control, and the New Hampshire Department of Transportation. Additional data were obtained from municipalities, local residents, well- drilling contractors, and geohydrologic consulting firms. The locations of wells, borings, springs, and seismic lines were plotted on base maps, and pertinent well and bore hole data were added to the Ground- Water Site Inventory (GWSI) data base maintained by the USGS. Each data point is cross-referenced to a site-identification number and to any other pertinent information about the site.
3. Seismic-refraction surveying, a surfacegeophysical technique, was used to determine depths to the water table and depths to the bedrock surface. Locations of these profiles are shown on plates 1-4. The seismic data were interpreted by use of a time-delay, ray- tracing computer program developed by Scott and others (1972). Data from nearby wells and test holes were used to verify the interpretations. Actual depths to the bedrock surface are within 10 percent of the estimates from seismic-refraction profiling. Till is not identified in these interpretations because it is generally thin and cannot be distinguished
from stratified drift by use of seismic- refraction methods. Where till is present but is not identified in the interpretation, the computed depth to bedrock is slightly less than the actual depth.
4. Seismic-reflection surveying, another surface geophysical method, was used to determine depths to bedrock and to infer the sediment type of the aquifers that lie beneath water bodies. Haeni (1986,1988b) outlines methods for collecting seismic-reflection data. Seismic-reflection results differ from seismic- refraction results in that information about the texture of the subsurface can sometimes be inferred from the reflection records.
5. Test borings were made at 56 locations to improve definition of the thicknesses and geohydrologic characteristics of the stratified- drift aquifers. Locations of these test borings and wells are shown on plates 1-4. Split- spoon samples of the subsurface sediments collected at 5- to 10-foot intervals were used to estimate the horizontal hydraulic conductivity at those depths and to determine the stratigraphic sequence of materials comprising the aquifers. Where test borings indicated that the aquifer would yield sufficient water for municipal supplies, a 2-inch inside-diameter well with a poly vinyl chloride (PVC) casing and a slotted well screen was installed. Water levels were measured periodically in these wells, and water samples were collected from selected wells.
6. Data collected as described in items 2, 3, 4, and 5 were used to construct maps showing the water-table altitude and saturated thickness of the stratified-drift aquifers.
7. Hydraulic conductivities of aquifer materials were estimated from grain-size-distribution data from 454 samples of aquifer material collected during the completion of test borings and wells in southern New Hampshire. Transmissivities were estimated from logs of test borings and wells by assigning horizontal hydraulic conductivities to each interval sampled, multiplying the hydraulic conductivities by the saturated
Geohydrology and Water Quality of Stratified-Drift Aquifers in the Winnipesaukee River Basin, Central New Hampshire

thickness of the interval, and summing these results. Additional transmissivity values were obtained from reports by geohydrologic consultants and from analysis of unpublished aquifer-test data. This information was used to prepare maps showing the transmissivity distribution of the stratified-drift aquifers (pis. 5-8).
8. Flow-duration data from eight long-termstreamflow-gaging stations within and near the Winnipesaukee River Basin were analyzed and used to correlate miscellaneous low-flow streamflow measurements on ungaged streams. Streamflows measured where the stream flowed into and out of major aquifers in the area during periods of low flow can be used to estimate potential aquifer yields.
9. An aquifer in Alton and one in Belmont were selected to demonstrate a technique for estimating water availability on the basis of a two-dimensional numerical model that simulates ground-water flow. The computer program, developed by McDonald and Harbaugh (1988), is a three-dimensional model that can be used to simulate flow in two dimensions. The model was used to estimate the potential yield and the sources of water to wells in the modeled areas.
10 Samples of ground water from 17 wellsconstructed during this study were collected and shipped to the USGS National Water Quality Laboratory in Arvada, Colo. for analysis. Selected physical properties (specific conductance, pH, temperature) were measured, and concentrations of inorganic constituents were determined. The data provided by these analyses were used to assess the general quality of water from the stratified-drift aquifers.
Numbering System for Wells, Borings, and Springs
Local numbers assigned to wells and borings entered into GWSI consist of a two-letter town designation (table 1), a supplemental letter designation ("A" for borings done for hydrologic
Table 1 . Two-letter town codes used as prefixes in the numbering system for wells, borings, and springs in the Winnipesaukee River Basin, central New Hampshire
Town
Alton......................Belmont..................Center Harbor .........Franklin...................Gilford ....................Laconia. ...... ...........Meredith .................Middleton ..............Moultonborough
Two-letter code
AHBLCHFKGFLAMHMLMM
Town
New Durham.....New Hampton...Northfield..........Sanbornton.. ......Sandwich... ...... ..Tilton...... ...........Tuftonboro ........Wolfeboro .........
Two-letter code
. NF
. NH
. NR
. SCSE
. TS
. TZ
. WR
investigations, "B" for borings done primarily for construction, "S" for springs, and "W" for all wells in which a casing was set), and a sequential number within each town. For example, the first well listed for the town of Alton is AHW-1.
Acknowledgments
The author thanks the many State and Federal agencies, municipalities, consulting firms, well-drilling companies, and private companies who provided data for this study. Thanks are also given to the many residents and land owners in the study area who graciously allowed access to their land for purposes of data collection.
GEOHYDROLOGIC SETTING
Three types of aquifers are present in the study area: (1) stratified drift, which can be a major source of ground water for municipalities; (2) till, which locally can supply minor amounts of water for domestic use; and (3) bedrock, which supplies water to some municipalities and small communities and to most households in the study area that are not connected to a municipal supply.
Stratified Drift and its Depositional Environment
Coarse-grained stratified drift, the focus of this study, consists of layered, sorted, mostly coarse grained sediments (sands and gravels) deposited by
Geohydrologic Setting 5

glacial meltwater at the time of deglaciation. Hydrologic characteristics of these sediments that affect ground-water storage and movement are related to the environment in which the sediments were deposited. Stratified-drift deposits are composed of distinct layers with different grain-size distributions, sorted according to the depositional environment. For example, fast-moving meltwater streams deposit coarse-grained sediments with large pore spaces between grains. If saturated, these sediments store and transmit water readily.
Fine-grained stratified drift (which consists of fine sand, very fine sand, silt, and clay) was deposited in lacustrine environments characterized by slow- moving and ponded glacial meltwater; these fine grained deposits do not transmit water as readily as the coarse-grained sediment does.
The depositional environments associated with deglaciation had a pronounced effect in determining the type of stratified-drift aquifer that was formed. Deglaciation of the study area appears to have been predominantly a systematic process of stagnation-zone retreat (Koteff and Pessl, 1981). Numerous examples of large deltas fed by eskers and by valley-fill deposits support this type of deglaciation. Aquifers deposited by this mechanism are the largest and potentially the most productive. Downwasting of ice (Goldthwait, 1968), although an important mechanism of stratified-drift deposition in the basin, was most likely responsible for thin (less than 20 ft), discontinuous deposits of sand and gravel. Examples of these are the deposits in and around Center Sandwich. Glacial lakes predominated in the basin during deglaciation, and the largest amounts of stratified drift were deposited in these lakes.
In most of the southern part of the basin where streams presently drain north to Lake Winnipesaukee, southward glacial drainage was obstructed by the
NORTHArea of debris accumulation
highlands to the south and the retreating ice margin to the north. This obstruction resulted in the formation of numerous ice-dammed glacial lakes into which glacial meltwater carried sediment deposited as subaqueous fans or deltas. These deposits are referred to as "ice- dammed-glacial-lake deposits" (fig. 2). As the ice margin retreated, successively lower drainageways were uncovered to the west and the east. As lake levels declined in response to lower drainageways, fans and deltas formed at the new, lower lake elevations.
In the northern part of the basin, where drainage of glacial meltwater was largely unobstructed by upland areas or glacial ice, the deposits that formed are typical of ice-contact heads of outwash and outwash deltas. These deposits are typically fluvial at the upstream end and grade into deltas where the meltwater streams emptied into a glacial lake; they are referred to as "fluviolacustrine deposits" (fig. 3). Deposits formed in this depositional environment include eskers, kames, kame terraces, and outwash usually in contact with deltaic deposits. These deposits compose stratified-drift aquifers and are referred to here as "fluviodeltaic aquifers."
Ice-Dammed Glacial-Lake Deposits
Deglaciation of the Winnipesaukee River Basin was complex and included deposition of sediment into glacial lakes that existed at various elevations and times relative to one another. In many places, the retreat of the ice, exposed a new, lower outlet that redirected glacial meltwater, formed new lakes or added to older glacial lakes.
The surfaces defining the previous levels of the glacial lakes in the Winnipesaukee River Basin were uplifted in response to the removal of the glacial ice (isostatic rebound), the uplift being greatest to the
SOUTH
Spillway
Figure 2. Sectional diagram of an ice-dammed glaciolacustrine deltaic aquifer.
6 Geohydrology and Water Quality of Stratified-Drift Aquifers in the Winnipesaukee River Basin, Central New Hampshire

Till or bedrock (valley wall)
Till or bedrockFluvial
deposits
Bedrock
Fluvio-deltaicsand and gravel
(topset beds)
Glacial lake
Deltaic sandand gravel
(foreset beds)
Fine-grainedlake bottom deposits
(bottomset beds)
Not to scale
Figure 3. Block diagram of the formation of a glaciofluvial deltaic aquifer.
north-northwest. Projections of these lake surfaces now dip to the south-southeast. No studies have been done in the Winnipesaukee River Basin to determine the exact slope of the projected lake surfaces; however an estimate can be made by examination of deltas in valleys near the study area to the west and south, as well as to the southeast near the coast.
West of the Winnipesaukee River basin, in the Connecticut River Valley, a stabilized level of glacial Lake Hitchcock is indicated by 23 ice-contact deltas and numerous other deltas that have not been modified by collapse and whose topset-foreset contacts fall along a single plane. This stable lake level indicates that the postglacial uplift of New England that resulted from the melting of the continental ice sheet, was delayed by about 5,000 years (Koteff and Larsen, 1989). This plane, after the postglacial uplift, now dips about 4.8 ft/mi
downward in the direction of S. 21° E. (Koteff and Larsen, 1989). Likewise, the projected lake-level surfaces of glacial lakes to the south, in the Merrimack River Valley (glacial Lakes Tyngsboro, Merrimack, and Hooksett) now slope 4.7 to 4.9 ft/mi downward to the south-southeast (Koteff and others, 1984). Moore (1995) found that this slope was reasonable for the deltas in the Contoocook River Basin given elevations derived from topographic maps. Similarly, to the southeast, the projected sea-level surface into which numerous glaciomarine deltas were deposited now slopes about 4.5 ft/mi downward in the direction of S. 28.5° E. (Koteff and others, 1993). From this information, the plane of previous lake levels of glacial lakes in the Winnipesaukee River Basin is assumed to have a slope of 4.5 to 4.8 ft/mi downward to the south-southeast.
Geohydrologic Setting 7

Projecting these ice-dammed-glacial-lake surfaces helped to determine the maximum extent of the glacial lakes in the basin and to determine which deposits are related to a given lake stage in the areas where the glacial lake history is complex. The maximum probable extent of glacial lake environments, including glacial Lake Winnipesaukee and numerous other local glacial lake, is shown in figure 4.
The initial drainage of glacial Lake Winnipesaukee during deglaciation was probably across the present-day drainage divide between the Merry meeting River and the Ela River (pi. 2), and water flowed into the Cocheco River Basin. Before the last glaciation, surface water may have drained in this direction; the elevation of the till and (or) bedrock controlled outlet on the Ela River, below the stratified-drift dam, is approximately 500 ft. The elevation of the bedrock controlled outlet at the present-day dam at Lakeport in Laconia is also approximately 500 ft. Because both outlets were approximately at the same elevation, the preglacial drainage of the lake was possibly but not necessarily out of the Cocheco Basin. The relative elevations of these outlets before glacial erosion and till deposition along the Ela River may have been significantly different.
White (1938) predicted that the depth of the Lake Winnipesaukee Basin due to glacial scour as opposed to stratified-drift damming could be assessed if appropriate data became available. Data collected during this study indicate that the Merrymeeting River valley is filled with more than 100 ft of stratified drift. The actual spillway for the glacial lake, however, was controlled by a till and (or) bedrock high on the Ela River. Bedrock is also the control on the Lakeport outlet. The depth of the Lake Winnipesaukee Basin, therefore, is likely due entirely to scour by glacial ice.
As the ice retreated to the north in the Merrymeeting River Valley from the drainage divide with the Ela River (pi. 2), a thick (at least 100 ft) sequence of stratified drift filled the
now-divided preglacial river valley. Subsequent retreat caused a series of narrow, small glacial lakes to form in the Merrymeeting River Valley, north toward Alton Bay. At successive ice-marginal positions, morphosequences of eskers feeding glaciolacustrine deltas formed. These morphosequences are discussed in detail in the section on "Description of Selected Aquifers."
Subsequent retreat of the ice margin to the north of present-day Lake Wentworth enlarged glacial Lake Winnipesaukee to the north, east, and west (coincident, in part, with present-day Lake Winnipesaukee and Lake Wentworth). Goldthwait (1968, p. 30) indicates that some water from the glacial Lake Wentworth area drained out the Merrymeeting River/Ela River outlet, but most drained out to the east of Lake Wentworth. The outlet elevation to the east of Lake Wentworth is approximately 670 ft above sea level; this level is approximately 70 ft higher than the elevation of the delta between Hersey Brook and Harvey Brook. Davis and others (1993, p. EE-9) suggest that water could not drain to the southwest when the Lake Wentworth Basin became ice-free. Nevertheless, deposits in the Lake Wentworth area, as interpreted on the basis of delayed uplift theory (Koteff and others, 1993), appear to be graded to the Merrymeeting River/Ela River outlet, 12 mi to the south. A delta that formed where Harvey Brook and Hersey Brook drain into Lake Wentworth (pi. 4) stands at an elevation of approximately 600 ft. The projected water-plane elevation at this area, based on the Merrymeeting River/Ela River outlet, is approximately 585 ft. Therefore, drainage appears to have been to the southwest when Lake Wentworth became ice free.
At about the same time that glacial Lake Winnipesaukee began to form, other ice-dammed glacial lakes, such as the glacial lake in Belmont, also were forming. Deglaciation of the south-western part of the Winnipesaukee River Basin formed a glacial lake that occupied much of Belmont.
8 Geohydrology and Water Quality of Stratified-Drift Aquifers in the Winnipesaukee River Basin, Central New Hampshire

"r\
>.^
43°30'
Base from U.S. Geological Survey digital data, 1 1:24.000, 1991 and State of New Hampshire, Dept. of Environmental Services digital data, 1:24,000, 1991 New Hampshire State Plane Projection
EXPLANATION
10 MILES
I II
D 5I
10 KILOMETERS
PRESENT-DAY LAKES
GLACIAL LAKES ~~
. _.. _ DRAINAGE-BASIN DIVIDE
MAXIMUM PROBABLE EXTENT OF GLACIAL LAKES
COUNTY BOUNDARY
TOWN BOUNDARY
Figure 4. Maximum extent of glacial-lake environments in the Winnipesaukee River Basin, central New Hampshire.
Geohydrologic Setting 9

The level of this glacial lake was controlled by a bedrock spillway 1,000 ft north of the Belmont- Gilmanton town line along NH Route 106 (pi. 1). The spillway elevation is approximately 640 ft above sea level, and the deposits in the area of Pumping Station Brook in Belmont are graded to this spillway. The most prominent deposit in this area is a delta that is exposed for 60 to 80 ft. Deposits below the land surface are greater than 60 ft thick and are composed of materials that are coarser than the exposed delta sediments. An eroded drainage channel originating on the south side of Bean Hill Road, 1,000 ft from the intersection with Union Road leads to an esker trending southeast toward the Belmont delta, this channel indicates that drainage to this area probably came from Winnisquam Lake over a narrow divide near Bean Hill Road. The Tioga River Valley and the Winnipesaukee River Valley below Silver Lake could have been blocked by ice at this point.
Stratified drift along Durkee Brook and Jewett Brook in Laconia (pi. 1) and along the Gunstock River in Gilford (pi. 1) was deposited into smaller, localized glacial lakes that formed against highlands to the south and the ice margin to the north.
Retreating ice from Gardners Grove to Lochmere to Winnisquam (pi. 1) enlarged the glacial lake between Winnisquam Lake and Silver Lake and resulted in the deposition of fine-grained sediment in the Silver Lake and Gardners Grove area. Subsequently, stratified drift from glacial meltwater flowing along Gulf Brook, which originates near the Tilton-Sanbornton town line (pi. 1), was deposited. The coarse-grained Gulf Brook deposits overlie and may interfinger with the fine-grained deposits south of Silver Lake. A lithologic log for well TSW-80 shows 15 ft of coarse gravel overlying 97 ft of silt and clay; here, coarse gravels from the Gulf Brook spillway must have been deposited after the fine-grained lake-bottom sediment. These deposits appear to be graded to a spillway elevation of 510 ft along Interstate 93, 2 mi south of Exit 19 (pi. 1). Much of the very fine grained and fine-grained sediment may have been transported downstream to Northfield and deposited into a glacial lake that existed there at a lower elevation. Test borings
NRW-59 and NRW-61 in Northfield show 75 and 47 ft of very fine sands, respectively, overlying till or bedrock in the Northfield delta.
When the ice retreating to the north-northwest cleared Saunders Bay in Gilford, a lower elevation outlet of glacial Lake Winnipesaukee was exposed through Lily Pond, Black Brook, and Lakeport (pis. 1 and 3). This exposure would have caused the outlet of glacial Lake Winnipesaukee to change from Alton Bay to this new, lower Lakeport outlet at 530 ft, dropping the lake level by approximately 65 ft. This spillway is controlled by till at Black Brook and by a deep channel cut through till immediately east of the dam at Lakeport. After the ice margin retreated back north of Paugus Bay, glacial Lake Winnipesaukee was lowered by another 30 ft to near its present-day level.
Glaciolacustrine Deposits
Along the northern shore of present-day Lake Winnipesaukee, stratified-drift deposition probably occurred by stagnation-zone retreat (morphosequence deposition) and by downwasting of stagnant ice. Many of the deposits are associated with ice-marginal drainage near Red Hill and the Ossipee Mountains. Deposits in this part of the basin typically begin as fluvial sequences and are graded to the Lakeport stage (the last stage) of glacial Lake Winnipesaukee. Some of these deposits, however, appear to be graded to the previous level of glacial Lake Winnipesaukee, when the lake drained through Alton Bay. This would be possible if the northeastern side of the ice margin had pulled away from the valley wall enough to allow the formation of a narrow arm of the larger lake to the south. This lake would have extended from the Merry meeting River spillway up Alton Bay and would have included all of Lake Wentworth. Stratified-drift deposits that may be associated with the possible arm of glacial Lake Winnipesaukee are found near Center Tuftonboro, along the Melvin River, and along Shannon Brook.
As the ice margin retreated north beyond Center Sandwich, Moultonborough, and Center Harbor, glacial Lake Winnipesaukee probably extended northward up narrow valleys that now drain southward into the present-day lake. Glacial Lake Winnipesaukee may have included Squam Lake. The lake-plane elevation at the divide between the two basins (near
10 Geohydrology and Water Quality of Stratified-Drift Aquifers in the Winnipesaukee River Basin, Central New Hampshire

Wakonda Pond), projected from the Lakeport outlet (pi. 4), is approximately 580 ft. The elevation of the divide itself, also approximately 580 ft, indicates that Squam Lake proper may have been connected to glacial Lake Winnipesaukee by a narrow arm. From similar analysis to the east of Red Hill, former glacial Lake Winnipesaukee would have extended up the Red Hill River for just more than a mile beyond the Moultonborough-Sandwich town line and would have included Berry Pond and the valleys of Halfway Brook. The deposits of the northern part of the basin include stratified-drift deposited in glacial Lake Winnipesaukee and other local glacial-lake environments, as well as stratified drift deposits not associated with glacial lakes. The Moultonborough Airport is probably built on a delta graded to the elevation of glacial Lake Winnipesaukee, as is the large cemetery in Meredith, north of the town park, along Route 25.
In Tuftonboro, to the east, the Melvin River aquifer consists partly of glacial-lake-bottom and deltaic deposits that appear to be graded to the Merrymeeting River outlet of glacial Lake Winnipesaukee. Thick sequences of lacustrine sands can be found in this area. Test boring TZW-3 was drilled to a depth of 103 ft below land surface without reaching the bedrock surface, and it penetrated mostly fine to medium sands. To the east of this area and immediately south of Route 171, an extensive kame field is present in the valley at the base of the Ossipee Mountains. These high deposits are not directly related to glacial Lake Winnipesaukee and are representative of ice-contact deposits.
Till
Till is an unsorted mixture of clay, silt, sand, gravel, and rock fragments deposited directly by glacial ice. Within the basin, till covers most of the bedrock surface and is overlain locally by stratified drift and Holocene stream deposits. The average thickness of till in the Winnipesaukee River Basin is 35 ft, but the thickness can be locally greater than 200 ft (Goldthwait, 1968, p. 19). Koteff (1970) describes two tills in south-central New Hampshire that are thought to represent two separate major glacial
advances over the region. Goldthwait (1968, p. 20) describes two tills ablation till and basal (lodgement) till but does not relate them to separate glacial advances.
Till is not considered to be a major source of ground water because of its low hydraulic conductivity. Large-diameter wells completed in till can provide modest amounts of water, commonly less than 3 gal/min, for household needs, but water-level fluctuations within till can be large enough to make these wells unreliable during dry seasons.
Bedrock
Bedrock in the Winnipesaukee River Basin consists of three main groups, as described by Goldthwait (1968, p. 5). The first group consists primarily of metamorphosed sedimentary rocks and includes schists and gneisses of Devonian age known as the Littleton Formation. The second group consists of intrusive igneous rocks known as the New Hampshire Plutonic Series and includes granites and diorites of Middle Devonian age. The third group consists generally of intrusive and extrusive rocks of the White Mountain plutonic-volcanic series of the Late Triassic. Well-known examples of rocks in the third group are Red Hill, the Ossipee Mountains, Copple Crown Mountain, and Belknap Mountain.
GEOHYDROLOGY OF STRATIFIED-DRIFT AQUIFERS
The geohydrology of stratified-drift aquifers was described by identifying (1) aquifer boundaries, (2) direction of ground-water flow from recharge to discharge areas, (3) aquifer thickness and storage, (4) aquifer transmissivity, and (5) amounts of water potentially available from selected aquifers. Data sources in this investigation included surficial geologic maps, lithologic logs of wells and test borings, and seismic-refraction and seismic-reflection data. Results of the geohydrologic investigation are presented on plates 1-8 and in the text that follows.
Geohydrology of Stratified-Drift Aquifers 11

Delineation of Aquifer Boundaries
Stratified-drift aquifers in the study area are composed of fine- to coarse-grained sands and gravels deposited by glacial meltwaters; these deposits, in part, are now sufficiently saturated to yield significant quantities of water to wells and springs. Locations of the lateral boundaries of the aquifers are defined as the contacts between the stratified drift and till and (or) bedrock. The position of the contact was determined by use of surficial geologic maps, soil maps, test-boring logs, and field mapping done specifically for this study. The bottom boundary is the contact of the stratified drift with the till and (or) bedrock surface and was determined by use of data from seismic refraction, seismic reflection, test borings, and domestic water wells. The upper boundary is the water table.
Areal Extent of Stratified-Drift Aquifers
The areal extent of the stratified-drift aquifers is shown on plates 1-8. Because of the regional scale of this investigation, aquifer boundaries are approximate. Coarse-grained stratified-drift aquifers may be present beneath fine-grained lacustrine deposits but may not have been identified because of the complexity of the stratigraphy and (or) the absence of data. Available data for coarse sediment underlying fine-grained sediment are discussed in the section "Descriptions of Selected Stratified-Drift Aquifers." Although the lacustrine clay, silts, and very fine sands are not capable of supplying adequate amounts of water for domestic and community use, the coarse-grained deposits that may lie below could be productive aquifers.
Aquifer boundaries are shown as solid, dashed, or dotted lines. In the explanation on the plates, solid lines represent "approximately located" boundaries, dashed lines represent "inferred" boundaries, and dotted lines represent "concealed" boundaries. The lateral boundaries of stratified-drift aquifers were delineated from the previously cited published and surficial geologic maps and by interpretation of soil maps of Belknap, Carroll, Merrimack, and Strafford Counties.
Stratigraphy of Geohydrologic Units
Data for the stratigraphy of geohydrologic units were obtained from available records of subsurface exploration within the study area. Additional test drilling and surface geophysical exploration were done to delineate texturally different geohydrologic units within the stratified drift.
Ground-Water Site Inventory
Subsurface data from wells and borings were inventoried, and data locations within the stratified- drift aquifers are plotted on plates 1-4. Geohydro logic data for approximately 2,500 sites were added to the GWSI data base and checked for accuracy. Data for approximately 2,100 of the 2,500 sites were transferred to GWSI from the NHDES-WRD well inventory data base. Approximately 500 of the 2,100 NHDES-WRD sites are within stratified- drift aquifer areas. Approximately 900 sites of the 2,500 total sites added to the GWSI data base are in the stratified-drift aquifer areas, appendix A contains selected data from the GWSI data base for wells, borings, and springs within the stratified- drift aquifer areas that were used to construct the accompanying map plates. These data include an identification number for the well, latitude and longitude, depth of the well, water level, and yield of the well, appendix B contains stratigraphic logs of selected wells and borings in stratified drift. These data were used primarily for estimating the transmissivity of the aquifers where no aquifer-test data or grain-size data were available.
Seismic Refraction
Seismic-refraction profiles, totaling more than 7 mi, were completed at 60 locations to determine depths to the water table (pis. 1-4) and depths to the bedrock surface (pis. 5-8). A 12-channel, signal- enhancing seismograph was used to record arrival times of compressional wave energy generated by a sound source. The data were collected and interpreted according to methods described by Haeni (1988a). The interpretations, made with the aid of a computer program developed by Scott and others (1972), are shown in appendix C.
12 Geohydrology and Water Quality of Stratified-Drift Aquifers in the Winnipesaukee River Basin, Central New Hampshire

Seismic velocities calculated for the materials under investigation and used in the seismic interpretations range from 500 to 1,500 ft/s for unsaturated stratified drift, approximately 5,000 ft/s for saturated stratified drift, and between 10,000 and 20,000 ft/s for bedrock. Interpreted seismic profiles in this report show (1) the top of the profile, which represents land surface in feet above sea level; (2) an estimate of the altitude of the water table within unconsolidated deposits at the time the seismic data were collected; and (3) an estimate of altitude of the bedrock surface. The relative altitudes of each geophone and shot were determined by leveling if altitude differences greater than 5 ft between geophones were observed. The actual altitudes, relative to sea level, were estimated from USGS topographic maps and are assumed to be accurate to half a contour interval or about 10 ft. Till is not accounted for in these interpretations because it is usually thin (less than 10 ft) and, therefore, cannot be detected with seismic-refraction methods. Where till is present in significant thickness and is not accounted for in the interpretation of seismic data, the computed depth to the bedrock is slightly less than the actual depth. Additional error results if the relief of the bedrock surface differs considerably over distances less than the 50- or 100-foot geophone spacing used in profiling.
Estimated depths to the water table and to the bedrock surface are generally compared with control data, such as nearby well or boring logs and water-table and bedrock-outcrop observations. The accuracy of the depths to water table and bedrock are within 10 percent of the true depth, as determined from test borings made along selected profiles.
Seismic Reflection
High-resolution, continuous seismic-reflection data were collected according to methods described by Haeni (1986, 1986b) along approximately 5 mi of the Merrymeeting River within the study area. Data were also collected on navigable reaches of the Winnipesaukee River from near exit 20 on Interstate 93 at Tilton upstream to Silver Lake in Belmont. Parts of Winnisquam Lake also were surveyed. These data were used to map depths to the bedrock surface beneath the
water bodies. During data collection, an array of receivers was towed behind a boat that traveled slowly up or down the river. Compressional waves, generated from a sound source, penetrated the river bottom and were reflected back to the surface in response to the physical differences in the geologic strata. The reflected sound waves were received at the water surface, converted to an electrical signal, and displayed on a graphic recorder. Data collection was often affected by the presence of strong reflectors at the water bottom. These strong reflectors cause multiple reflections of the water-bottom to appear on the record and obscure data below.
Altitude of the Water Table
The approximate altitude of the water table in the stratified drift is shown on plates 1-4. These maps were constructed from (1) altitudes of streams, ponds, and lakes as shown on 1:24,000-scale USGS topographic maps; (2) water-level data from wells stored in GWSI; and (3) analysis of seismic-refraction data. Ground- water altitudes in fine-grained lacustrine deposits represent the ground-water altitude in those deposits only. Saturated coarse-grained stratified drift may be present below fine-grained material in some areas, and a second, deeper potentiometric surface (in confined aquifers) may be present.
Water-level measurements were made monthly at selected wells in the study area during 1991 and 1992 and were stored in GWSI. A hydrograph showing water levels in well FKW-1 near the study area (near the confluence of the Winnipesaukee and Pemigewasset Rivers) is shown in figure 5. Well FKW-1 represents water-level fluctuations in a stratified-drift aquifer. The data from this well support the conclusion reached for other parts of New Hampshire. Natural water-level fluctuations in coarse grained stratified drift are usually less than 5 ft but can be as much as 10 ft (Cotton, 1987; Toppin, 1987; Moore, 1990; Mack and Lawlor, 1992; Moore and others, 1994, Harte and Johnson, 1995, Ayotte and Toppin, 1995); therefore, a 20-foot contour interval for water-table altitudes under natural conditions is reasonable for producing a generalized water-table map from water-level measurements made at different times.
Geohydrology of Stratified-Drift Aquifers 13

W 4 U
CO HI 12g_f 14
16
18
i i i i i i i i i i i i i i i i i i i i i i i i i i i i i i i i i i i i i i i
i i i i i i i i i i i i i i i i i i i i i i i i i i i i i i i i i i i i i i i i
1960 1970 1980 1990 2000
Figure 5. Long-term water levels at observation well FKW-1 in stratified drift, central New Hampshire.
Recharge, Discharge, and Direction of Ground-Water Flow
Ground-water recharge includes natural recharge from precipitation that falls directly on the aquifer and infiltrates the water table, lateral inflow from adjacent till and bedrock areas, and, in some places, leakage from streams that traverse the aquifer. Natural recharge is the difference between precipitation and the amount of water lost to evapotranspiration and to surface runoff.
Recharge to stratified-drift aquifers can be estimated from stream-discharge measurements made during periods in which there is no change in ground-water storage, as indicated by the position of the water table. Making such estimates requires the assumption that the ground-water discharge consists mostly of ground-water runoff. During periods of low flow and after an extended period without precipitation, this assumption is reasonable. This method probably gives conservative estimates of natural recharge to aquifers.
Estimated ground-water recharge falling directly onto stratified-drift aquifers is approximately half the annual precipitation in glaciated areas of eastern Massachusetts (Knott and Olimpio, 1986)
and in southern Maine (Morrissey, 1983). Most of the recharge in the study area occurs in late fall and early spring, when precipitation is greatest and evapotranspiration is lowest.
Recharge to the stratified-drift aquifers occurs in part from adjacent till and (or) bedrock uplands. Lateral inflow from upland areas not drained by perennial streams recharges the stratified-drift aquifer at the till and (or) bedrock contact. Recharge to stratified-drift aquifers from upland areas not drained by streams can be estimated by measuring ground-water discharge from till and (or) bedrock uplands that are drained by streams. Ayotte and Toppin (1995), who examined long-term (1963 to present) streamflow data from Stony Brook Tributary in south-central, New Hampshire, found that the average discharge from till uplands with small drainage areas (3.60 mi 2 for Stony Brook) can be as high as 1.95 [(ft 3/s)/mi2]. For a 23-square-mile till- covered drainage in Maine, the estimated average annual lateral inflow of ground water from upland
3 ^\
areas to a stratified-drift aquifer was 0.5 [(ft /s)/mi ]. (Morrissey, 1983). Upland areas not drained by streams are generally small but may contribute a significant amount of recharge to aquifers.
14 Geohydrology and Water Quality of Stratified-Drift Aquifers in the Winnipesaukee River Basin, Central New Hampshire

Recharge to stratified-drift aquifers from streams that lose water to the aquifer through permeable streambeds was documented by Randall (1978) and by Morrissey and others (1988). This type of recharge was not observed in any of the base- flow measurements made in this study, although it probably occurs on a small scale within the ±5-percent error associated with base-flow measurements. Such tributary-stream infiltration occurs where the tributary streams flow into aquifers that have a water table below the stream-bottom elevation at the stratified-drift and till and (or) bedrock contact (D.J. Morrissey, U.S. Geological Survey, written commun., 1989).
Ground-water discharge includes natural leakage into streams, lakes, and wetlands; ground-water evapotranspiration; and withdrawal from wells. During periods of low streamflow, usually in late summer and early fall and after extended periods without rainfall, streamflow consists almost entirely of ground-water discharge. Streamflow measurements were made during such a period on July 3, 1991 (appendix D).
Streamflow-gaging stations 01064500 on the Saco River near Conway, 01065500 on the Ossipee River at Cornish, Maine, 01075800 on Stevens Brook near Wentworth, 01076500 on the Pemigewasset River at Plymouth (northwest of the study area), 01078000 on the Smith River near Bristol, 01081000 on the Winnipesaukee River at Tilton, 01081500 on the Merrimack River at Franklin Junction, and 01089100 on the Soucook River at Pembroke Road near Concord were used to monitor flow conditions in and near the basin (fig. 6). Flow duration, in percent, for each of these eight streamflow-gaging stations is given in table 2. Flow duration indicates how often the average daily streamflow is equaled or exceeded. The average flow duration at the eight sites on July 3, 1991, was 93 percent. Under these conditions, flow within the basin was low, and ground-water discharge was assumed to be natural recharge from ground-water runoff. If this discharge is assumed to be composed entirely of ground-water runoff (a reasonable assumption for these measurements) it can be used as an estimate of recharge to aquifers in the study area. These measurements are discussed further in the section on "Description of Selected Stratified-Drift Aquifers."
Artificial sources of recharge to or discharge from an aquifer complicate the construction of water- table maps that are intended to represent natural conditions. Withdrawals of ground water affect the direction and slope of ground-water flow in an aquifer. Two stratified-drift aquifers in the basin (in Alton and Belmont) are affected by ground-water withdrawals. The amount of drawdown in a withdrawal well is determined in part by the location of the well in relation to the valley wall (stratified drift and till contact) and to potential recharge boundaries (streams, rivers, and surface-water bodies). Ground-water-flow lines and drawdowns due to withdrawal near an impermeable boundary are shown in figure 7. Drawdown is significantly greater on the impermeable boundary side than on the opposite side where the aquifer is of infinite areal extent. A withdrawal well located near a potential recharge boundary, such as a pond or river (fig. 8), will have significantly less drawdown than a withdrawal well at greater distance from the recharge boundary.
Direction of ground-water flow in an unconfined aquifer is determined by the water-table gradient. Water-table gradients differed throughout the study area because of differences in topography and hydraulic conductivity of the stratified-drift deposits. Water-table gradients in fine-grained stratified drift commonly exceeded 5 percent in areas of high topographic relief. Water-table gradients in coarse grained stratified drift in areas of low topographic relief were less than 0.1 percent. Potentiometric surfaces within confined aquifers (coarse-grained deposits beneath fine-grained deposits) were not contoured because of insufficient data.
Aquifer Characteristics
The geohydrology of stratified-drift aquifers shown on plates 5-8 is based partly on aquifer characteristics that include saturated thickness, storage, and hydraulic conductivity. Estimates of saturated thickness and hydraulic conductivity were used to calculate transmissivity (pis. 5-8). These properties can be used to assess the water-supply potential of stratified-drift aquifers. Values of aquifer storage can be used to provide an estimate of aquifer yield.
Geohydrology of Stratified-Drift Aquifers 15

43° 45'
43° 30'
i U S Geological Survey digital dat 1 24,000, 1991 and I'lOO.OOO, 1983 and N. Hampshire Dept of Environmental Services digital data, 1.24.000. 1991 New Hampshire State Plane Projection
10 KILOMETERS
EXPLANATION
A01089100
PRESENT-DAY LAKES
DRAINAGE-BASIN DIVIDE
COUNTY BOUNDARY
TOWN BOUNDARY
MAJOR RIVERS
LONG-TERM STREAMFLOW-GAGING STATION-Number is USGS gaging station identifier.
Figure 6. Locations of selected long-term streamflow-gaging stations in and near the Winnipesuakee River Basin, central New Hampshire.
16 Geohydrology and Water Quality of Stratified-Drift Aquifers in the Winnipesaukee River Basin, Central New Hampshire
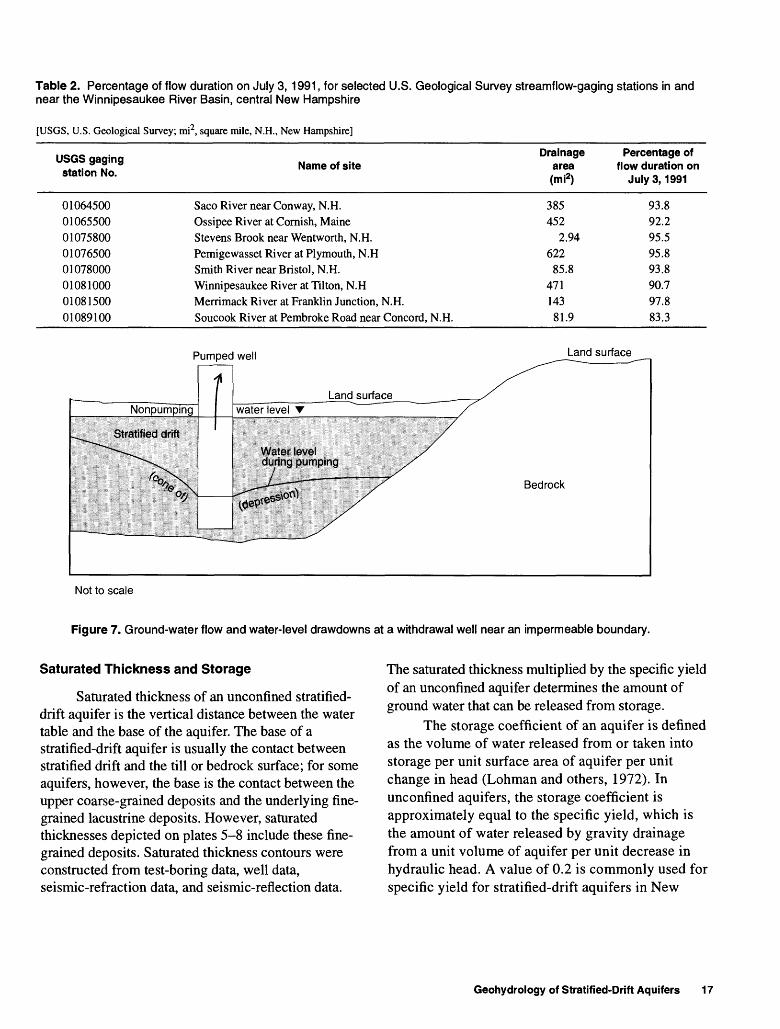
Table 2. Percentage of flow duration on July 3,1991, for selected U.S. Geological Survey streamflow-gaging stations in and near the Winnipesaukee River Basin, central New Hampshire
[USGS, U.S. Geological Survey; mi2, square mile, N.H., New Hampshire]
USGS gaging station No.
0106450001065500010758000107650001078000010810000108150001089100
Name of site
Saco River near Conway, N.H.Ossipee River at Cornish, MaineStevens Brook near Wentworth, N.H.Pemigewasset River at Plymouth, N.HSmith River near Bristol, N.H.Winnipesaukee River at Tilton, N.HMerrimack River at Franklin Junction, N.H.Soucook River at Pembroke Road near Concord, N.H.
Drainage area (mi2)
385452
2.94622
85.8471143
81.9
Percentage of flow duration on
July 3, 1991
93.892.295.595.893.890.797.883.3
Pumped well Land surface
Not to scale
Figure 7. Ground-water flow and water-level drawdowns at a withdrawal well near an impermeable boundary.
Saturated Thickness and Storage
Saturated thickness of an unconfined stratified- drift aquifer is the vertical distance between the water table and the base of the aquifer. The base of a stratified-drift aquifer is usually the contact between stratified drift and the till or bedrock surface; for some aquifers, however, the base is the contact between the upper coarse-grained deposits and the underlying fine grained lacustrine deposits. However, saturated thicknesses depicted on plates 5-8 include these fine grained deposits. Saturated thickness contours were constructed from test-boring data, well data, seismic-refraction data, and seismic-reflection data.
The saturated thickness multiplied by the specific yield of an unconfined aquifer determines the amount of ground water that can be released from storage.
The storage coefficient of an aquifer is defined as the volume of water released from or taken into storage per unit surface area of aquifer per unit change in head (Lohman and others, 1972). In unconfined aquifers, the storage coefficient is approximately equal to the specific yield, which is the amount of water released by gravity drainage from a unit volume of aquifer per unit decrease in hydraulic head. A value of 0.2 is commonly used for specific yield for stratified-drift aquifers in New
Geohydrology of Stratified-Drift Aquifers 17

Pumped well
Perennial stream
Not to scale
Figure 8. Ground-water flow and water-level drawdowns at a withdrawal well near a recharge boundary.
England (Moore, 1990) and for unconsolidated deposits in other areas (Freeze and Cherry, 1979). Specific yields of 13 samples of stratified drift from southern New Hampshire ranged from 0.14 to 0.34 and averaged 0.26 (Weigle and Kranes, 1966).
Water released from storage in confined aquifers results from expansion of water and compression of the aquifer as hydraulic head declines. Storage coefficients for confined aquifers, which are significantly smaller than specific yields for unconfined aquifers, range from 0.00005 to 0.005. Smaller storage coefficients associated with confined aquifers indicate that the amount of water derived from expansion and aquifer compression is much less than that from dewatering by gravity drainage.
Saturated-thickness maps can be used to estimate the amount of ground water stored in an aquifer. The saturated volume of an unconfined aquifer is approximately equal to the sum of the products of the areas between successive pairs of saturated-thickness contours multiplied by the average saturated thickness for each area. The actual volume of ground water stored in the aquifer is the product of the saturated volume multiplied by the porosity.
Transmissivity and Hydraulic Conductivity
Transmissivity is defined as the rate at which water at the prevailing kinematic viscosity can be transmitted through a unit width of an aquifer under a unit hydraulic gradient (Lohman and others, 1972). The transmissivity (T) of an aquifer is equal to the saturated thickness (/?), in feet, multiplied by the horizontal hydraulic conductivity (K, a directional measure of the permeability), in ft/d, and is expressed in feet squared per day (ft2/d); thus,
T=K(b). (1)
Transmissivity at a specific site was derived from estimates of hydraulic conductivity of lithologic units in the aquifers. Hydraulic conductivity, in turn, was estimated from grain-size distributions of samples of aquifer materials by use of the regression equation developed by Olney (1983). Hydraulic conductivity, however, which has a vertical and a horizontal vector component, is not accounted for by this equation. In this relation, an effective grain size (£> 10, in phi units) was used to estimate hydraulic conductivity (K, in feet per day) with the following equation:
K= 2,100 x 10-°-655(ZV (2)
18 Geohydrology and Water Quality of Stratified-Drift Aquifers in the Winnipesaukee River Basin, Central New Hampshire

The effective grain size (£>!()) is a controlling factor for the hydraulic conductivity of stratified drift in New Hampshire and is defined as that grain size where 10 percent of the sample consists of smaller grains and 90 percent of the sample consists of larger grains. Olney (1983) developed this relation from results of permeameter tests of stratified-drift samples from Massachusetts. Moore (1990) found that this relation yielded results that fall within the range of results from other relations that have been developed between grain-size distribution and hydraulic conductivity (Krumbein and Monk, 1942; Bedinger, 1961; and Masch and Denney, 1966). Comparisons with aquifer-test data, however, indicate that equation 2 may not give accurate results for very coarse grained sand and (or) gravel. Estimates of hydraulic conductivity for aquifers with coarse sands and gravels were, in part, based on comparisons to aquifer-test data for similar deposits. Hydraulic conductivity (and transmissivity) based on grain-size relations are only estimates and are vectortless and may differ from results of aquifer-test analyses. Additionally, transmissivities calculated from aquifer-test data may be affected by the presence of hydrologic boundaries such as rivers or valley walls.
Hydraulic conductivity was estimated for 454 samples of stratified drift from southern New Hampshire by means of equation 2. The samples were collected in the Exeter and Lamprey River Basins (Moore, 1990); in the seacoast area and the Lower Merrimack River Basin (Flanagan and Stekl, 1990); in the Bellamy, Cocheco, Salmon Falls River Basins (Mack and Lawlor, 1992); in the Lower Connecticut River Basin (Moore and others, 1994); in the Contoocook River Basin (Harte and Johnson, 1995), and for this study. The grain-size distribution and the effective grain size (I>io) were determined for these 454 samples.
Hydraulic conductivities calculated from equation 2 were plotted against median grain size in phi groups, and the resulting plot was divided into three categories of degree of sorting (fig. 9). These relative categories are used to describe the types of
stratified-drift-aquifer deposits found in New Hampshire. The degree of sorting was based on the standard deviation of each individual sample.
If standard deviations were greater than 1.75 phi, the samples were considered poorly sorted; if standard deviations were 1.25 to 1.75 phi, the samples were considered moderately sorted; and if standard deviations were less than 1.25 phi, the samples were considered well sorted. A regression equation was developed for each of the three categories to determine the relation between hydraulic conductivity and median grain size (fig. 9). The coefficient of determination (R2) was 0.93 for the well sorted samples, 0.72 for the moderately sorted samples, and 0.54 for the poorly sorted samples. The calculated hydraulic conductivity, grouped by ranges of median grain size and by ranges of standard deviation (degree of sorting), is shown in table 3.
Hydraulic conductivities were calculated for each median phi group and were averaged to determine a mean hydraulic conductivity per group. For example, the mean hydraulic conductivity of sediment samples whose median grain size was described as medium sand and well sorted was 38 ft/d (the average of 25 and 51ft/d;table3).
Very fine sand, silt, and clay deposits in the study area were not analyzed for grain-size distribution because their hydraulic conductivities are typically low (less than 4 ft/d) and, therefore, considered insignificant in terms of total transmissivity (Todd, 1980).
The values in table 3 were used to estimate hydraulic conductivities from lithologic descriptions given in logs from test borings and wells. For example, for a lithologic description of 10 ft of moderately sorted coarse sand overlying 20 ft of well sorted fine sand overlying bedrock, the hydraulic conductivities assigned would be 39 ft/d (the average of 30 and 48 ft/d) and 9 ft/d (the average of 12 and 6 ft/d), respectively. The estimate of transmissivity, based on the same description, would be (10 ft x 39 ft/d) + (20 ft x 9 ft/d), which equals 570 ft2/d.
Geohydrology of Stratified-Drift Aquifers 19

1,000
500
200
20
K=61.7(10)-0 -413* A WELL SORTED
MODERATELY SORTED
D POORLY SORTED
K=15.1(10)
D
D
-2.5 -2.0 -1.5 -1.0 -0.5 0 0.5 1.0 1.5 2.0 2.5
MEDIAN GRAIN SIZE, IN PHI (<|>) UNITS
3.0 3.5 4.0 4.5
Figure 9. Relation between estimated hydraulic conductivity, median grain size, and degree of sorting of stratified drift in New Hampshire.
Table 3. Relation of mean bulk hydraulic conductivity to median grain size and degree of sorting of stratified drift in New Hampshire
[Mean bulk hydraulic conductivity (K): vectorless and calculated by use of methods described by Olney (1983). <, actual value less than value shown; >, actual value is greater than actual value shown; --, no data. Data from Ayotte and Toppin, 1995]
Median grain size (phi units)
-1.75-1.25
-.75 -.25 .25.75
1.251.752.252.753.25 3.75
Mean bulk hydraulic conductivity (K), in feet per day
Median grain description
GranulesGranulesVery coarse sand Very coarse sand Coarse sandCoarse sandMedium sandMedium sandFine sandFine sandVery fine sand Very fine sand
Well sorted (standard deviation <1. 25 phi)
970 470 220110512512632
Moderately sorted (standard deviation 1.25 phi to 1.75 phi)
320200120 78 483019127432
Poorly sorted (standard deviation
>1.75phi)
493525 18 1397532
20 Geohydrology and Water Quality of Stratified-Drift Aquifers in the Winnipesaukee River Basin, Central New Hampshire

Description of Selected Stratified-Drift Aquifers
The most extensive and most productive aquifers in the study area are discussed in this section. Stratified-drift aquifers in the southern part of the basin are typically continuous and are present in the former drainageways of glacial Lake Winnipesaukee and the associated glacial lakes of adjacent upland areas. Aquifers are discussed by plate, starting with plate 5 at the southwestern part of the basin and ending with plate 8 in the northeastern part of the basin (fig. 10).
Gulf Brook Aquifer
The Gulf Brook aquifer is in the northern part of Tilton, east of Interstate 93. The head of outwash is near the Tilton-Sanbornton town line north of the The Gulf, which is a deeply incised glacial drainageway cut by fast-moving meltwater. The fast-moving water deposited coarse sand to cobble gravel to the south toward the Winnipesaukee River, and this coarse material partially covers the fine-grained sediment below. The saturated thickness of the coarse-grained aquifer is generally less than 20 ft in the northern half but is greater to the south. The log from well TSW-80 shows 15 ft of coarse-grained material below land surface and fine sand and silt from 15 to 112 ft. Much of the unsaturated coarse-grained material in this area has been excavated. The transmissivity of the aquifer is less than 1,000 ft2/d in the northern part but exceeds 1,000 ft2/d in the southern half, mostly because of the substantial increase in the saturated thickness. This aquifer is hydraulically connected to the Gardners Grove aquifer.
Gardners Grove Aquifer
The Gardners Grove aquifer is mostly south of Silver Lake in Belmont, although part of it extends to the east up the Tioga River toward the center of Belmont. Glacial meltwater draining from Winnisquam Lake to Silver Lake deposited the fine to medium sands into a glacial lake that once occupied this area. The deposits are graded to the elevation of the glacial-lake outlet, which was the till channel of the Winnipesaukee River near Interstate 93 in the northeastern part of
Tilton. The elevation of the channel is approximately 460 ft above sea level. Test borings BLW-80 and BLW- 83 (pi. 1) revealed that the saturated thickness of much of this aquifer exceeds 100 ft and is locally greater than 120 ft. Hydraulic conductivities estimated from grain- size analyses of aquifer material collected at observation well BLW-80 are 50 ft/d for the upper 20 ft and approximately 20 ft/d from 20 to 90 ft. The transmissivity of this area is about 1,500 ft2/d. At well BLW-83, the hydraulic conductivity calculated from grain-size analyses was generally less than 30 ft/d. Transmissivity for this part of the aquifer is about 600 ft2/d. Transmissivity for the rest of the aquifer is estimated to exceed 1,000 ft2/d mostly because of the saturated thickness of the deposit.
Pumping Station Brook Aquifer
The Pumping Station Brook aquifer in southern Belmont is used by the town for water supply. Two wells near Pout Pond supply approximately 0.08 Mgal/d to a population of 1,200 (Frank Clairmont, Town of Belmont, oral commun., 1992). These glaciolacustrine deposits are graded to the level of a glacial lake that occupied southern Belmont. The glacial lake drained south, through an outlet at an elevation of 640 ft, 1,000 ft north of the Belmont- Gilmanton town line at New Hampshire Route 106. Two coarse-grained eskers lead to the large, flat-topped delta east of Pout Pond, near Pumping Station Brook (pi. 5). Remnants of the eskers are identifiable to the north of Route 140 and trend southeast toward Pout Pond (pi. 5). BLW-28 and BLW-13 (pi. 2) are the municipal wells, and both are within or near an esker. A geologic section through the delta and esker deposits is shown in figure 11. Observation well BLW-84 is drilled through part of an esker that is partially covered by the large delta (fig. 11). In a 4-hour aquifer test at well BLW-13 in June 1967, ground water was withdrawn at a rate of 350 gal/min with 5 ft of drawdown (pi. 2).
The transmissivity of the aquifer was estimated to be as much as 5,000 ft2/d (Hydro Group, written commun., 1992). The proximity of this aquifer test to Pout Pond may have limited the total drawdown measured during the test.
Geohydrology of Stratified-Drift Aquifers 21

71 °37'20" 71 °22'30
43°45' -
43°37'30" -
43° 30' -
43°22'30" -___IBase from U.S Geological Survey digital data,1:24,000, 1991 and State of New Hampshire,Dept. of Environmental Services digital data,1 24.000. 1991 New Hampshire State Plane Projection
10 MILES
1 Gulf Brook2 Gardners Grove3 Pumping Station Brook4 Union Road5 Durkee Brook6 Laconia Airport7 Gunstock River8 Ellacoya9 Merrymeeting River
MAJOR AQUIFERS
10 Black Brook11 Hawkins Brook12 Halfway Brook13 Shannon Brook14 Mersey Brook15 Ninteen Mile Brook16 Copps Pond17 Melvin River
\10 KILOMETERS
EXPLANATION
PRESENT-DAY LAKES
3 SELECTED AQUIFERS
- DRAINAGE-BASIN DIVIDE
- PLATE BOUNDARY
- - COUNTY BOUNDARY
------- TOWN BOUNDARY
Figure 10. General locations of selected aquifers in the Winnipesaukee River Basin, central New Hampshire.
22 Geohydrology and Water Quality of Stratified-Drift Aquifers in the Winnipesaukee River Basin, Central New Hampshire

o (D
O 3"
Q.
0. & ! 9 a.
100
200
300 M
ET
ER
S
VE
RT
ICA
L E
XA
GG
ER
AT
ION
x 1
0
DA
TU
M I
S S
EA
LE
VE
L
EX
PLA
NA
TIO
N
GL
AC
IOL
AC
UST
RIN
E
DE
LT
AIC
SE
DIM
EN
TS
ESK
ER
TIL
L
BE
DR
OC
K
LA
ND
SU
RF
AC
E
WA
TE
R T
AB
LE
CO
NT
AC
T-D
ashe
d w
here
infe
rred
WE
LL
AN
D I
DE
NT
IFIC
AT
ION
N
UM
BE
R
Figu
re 1
1. G
eolo
gic
sect
ion
thro
ugh
the
Pum
ping
Sta
tion
Bro
ok a
quife
r, B
elm
ont,
New
Ham
pshi
re.

The estimated transmissivity of this aquifer at observation well BLW-86 (on the southeast side of Pout Pond near well BLW-28) is about 3,000 ft2/d. This estimate is based on the grain-size distribution of aquifer-material samples collected in the field at the time the well was installed. The estimated transmissivity of this part of the aquifer is between 2,000 to 4,000 ft2/d.
Wells BLW-30, BLW-31, and BLW-32 (pi. 1) all show the saturated thickness to be less than 20 ft. Additional wells, if installed near the esker, would likely be suitable for municipal supply. North of Belmont center, near Badger Pond, the aquifer becomes thin (less than 20 feet thick). A technique for evaluating water availability and the results of the application of this technique to the Pumping Station Brook aquifer are discussed in the section "Estimation of Water Availability for Selected Aquifers."
Union Road Aquifer
The Union Road Aquifer is at the southeastern end of Winnisquam Lake, near Lochmere (pi. 7). This aquifer is composed of coarse-grained ice-contact sands. Evidence of fast-moving glacial meltwater can be seen in the numerous channels cut in till uplands on the northeast side of Silver Lake in Belmont and in the deeply incised channel near Bean Hill Road, 1 mi to the west of Silver Lake. A seismic-refraction survey (Belmont h-h', pi. 1, appendix C6) showed the saturated thickness of the aquifer to be greater than 40 ft at Union Road and greater than 80 ft at the shore of Winnisquam Lake. This was confirmed during the installation of observation well BLW-81 (pi. 1). Additionally, wells BLW-160, BLW-161, and BLW-162, which are 0.5 mi to the west, are open-ended holes finished in gravel that yield approximately 10 gal/min. Transmissivity in this area as calculated from the gram-size-distribution analysis of aquifer material collected during test drilling, is greater than 1,700 ft2/d. This aquifer is hydraulically connected to Winnisquam Lake, and ground-water withdrawals could induce flow from the lake to the aquifer. This aquifer would be suitable for high-yielding wells
because of the highly transmissive aquifer material present and the potential to induce recharge from Winnisquam Lake.
Across Winnisquam Lake, on a peninsula approximately 1 mi to the northwest between East Tilton and Winnisquam, data for domestic wells indicate coarse-grained ice-contact aquifer materials buried beneath approximately 40 ft of glacial till. Well TSW-61 is an open-ended well finished in the buried gravel deposit. This well reportedly yields 15 gal/min. Logs from other wells in this area indicate that the buried stratified- drift aquifer may be as much as 50 ft thick. The lateral extent of the deposit and its hydraulic connection to Winnisquam Lake is not well understood; additional data collection would be necessary to define the aquifer spatially and hydraulically.
Durkee Brook Aquifer
The Durkee Brook aquifer extends from the Laconia-Gilford-Belmont town line northward to Lake Winnipesaukee (pi. 5). Northward drainage of meltwater against the retreating ice margin formed the glacial lake in which this aquifer was deposited. The saturated thickness exceeds 20 ft for most of the aquifer but is generally less than 40 ft. The transmissivity of most of the aquifer is less than 1,000 ft2/d but is slightly greater than 1,000 ft2/d where the saturated thickness is greatest. At observation well BLW-85 (pi. 1), transmissivity estimated from grain- size distribution data from aquifer samples, is 1,050 ft2/d. Development of this aquifer is limited not by the hydraulic properties of the aquifer but by the amount of water available to potential wells. Low streamflow at measurement site 26 (pi. 1, appendix D) was 0.80 ft3/s (0.5 Mgal/d) in Durkee Brook on July 3,1991. Only some of this water, plus ground water in storage, would potentially be available to wells.
Laconia Airport Aquifer
The Laconia Airport aquifer underlies all of the airport area and is hydraulically connected to the Gunstock River deposits to the east (pi. 5). Saturated stratified-drift deposits are generally greater than 40 ft thick and locally exceed 80 ft in thickness.
24 Geohydrology and Water Quality of Stratified-Drift Aquifers in the Winnipesaukee River Basin, Central New Hampshire

These deposits are glaciolacustrine fine to very fine sands; test boring GFA-2 penetrated 57 ft of saturated very fine sand and silt before reaching till. The northeastern part of this aquifer contains a zone of coarse-grained ice-contact material, which may be an esker or crevasse filling, and is partially covered by the fine-grained lacustrine deposits. Test borings GFB-6, GFB-7, and GFB-8 (pi. 1) penetrated these coarse deposits and mark the position of the feature. In general, the very fine and fine sands of this aquifer make it unsuitable for large-scale development.
Gunstock River Aquifer
The Gunstock River aquifer, in a valley to the west of Gunstock and Belknap Mountains (pi. 5), is an example of a multistage glacial-lake deposit resulting from northward drainage of meltwater. Ice retreating to the northwest formed a glacial lake between the ice margin and the uplands to the south. As the ice retreated, it uncovered successively lower meltwater drainageways to the west, toward Laconia. Deposits at the southern end of the aquifer were deposited in glacial lakes at higher elevation than deposits at the northern end. Deposits at the southern end locally exceed 60 feet thick, and their transmissivity exceeds 1,000 ft2/d; however, detailed information about the hydraulic properties of this area is not available.
To the north, the saturated thickness decreases to about 20 ft before increasing to greater than 60 ft near well GFW-11. The saturated thickness at observation well GFW-15 and GFW-11 is 22 ft and 61 ft, respectively. Test boring GFA-1, approximately 1 mi to the north, revealed a saturated thickness of less than 20 ft (pi. 5), indicating that the thick deposit near well GFW-11 is not extensive. The transmissivity, however, is estimated to be 2,000 to 4,000 ft2/d.
This aquifer is limited not by the hydraulic properties of the aquifer but by the amount of water available to potential wells. Low streamflow at measurement site 19 (pi. 1, appendix D) was 0.78 ft3/s (0.5 Mgal/d) in Gunstock Brook on July 3, 1991. Only some of this water, plus ground water in storage, would potentially be available to wells.
The saturated thickness near test boring GFA-3 is less than 10 ft and remains less than 20 ft thick until the valley widens again approximately 7,500 ft north of
Gilford Center. The saturated thickness at observation well GFW-13 (pi. 1) is 30 ft and increases rapidly to greater than 80 ft at well GFW-12 and 70 ft at well GFW-14. A geologic section through this portion of the aquifer is shown in figure 12. The transmissivity of this part of the aquifer is greater than 1,000 ft2/d and locally (near GFW-14) greater than 2,000 ft2/d. A geologic section through this part of the aquifer is shown in figure 12. This part of the aquifer is hydraulically connected to the Laconia Airport aquifer that was previously described.
Development of the Gunstock River aquifer is limited by the hydraulic properties of the aquifer, not by the amount of water available to potential wells. Low streamflow at measurement site 22 (pl.l, appendix D) was 1.13 ft3/s (0.73 Mgal/d) in Gunstock Brook on July 3, 1991. The sediments in this location are generally too fine to produce high yields.
Ellacoya Aquifer
Ellacoya State Park overlies a small but potentially productive aquifer along the shore of Lake Winnipesaukee (pis. 2 and 4). This aquifer consists of very coarse grained material in the upper few feet of the subsurface. A seismic-refraction survey (Gilford, line h-h', pi. 2, appendix C9) indicates that the saturated thickness of this aquifer may exceed 100 ft locally. Test boring GFB-2 was drilled to a depth of 24 ft in coarse gravel without reaching bedrock. Large cobbles near the surface prevented attempts during this study to confirm seismic-refraction results with test drilling. The transmissivity of this aquifer is greater than 1,000 ft2/d, but may be 2,000 to 4,000 ft2/d if the aquifer is as thick as seismic-refraction results indicate and the materials are coarse. This small deposit has a potential to be a high yield aquifer because it is hydraulically connected to Lake Winnipesaukee and because withdrawal wells could induce flow from the lake to the aquifer.
Merrymeeting River (Alton) Aquifer
The Merrymeeting River aquifer extends from the southern tip of Alton Bay south to the drainage divide between the Merrymeeting and Ela Rivers (pi. 2). The Ela River is in part of the Cocheco River Basin that was studied by Mack and Lawlor (1992).
Geohydrology of Stratified-Drift Aquifers 25
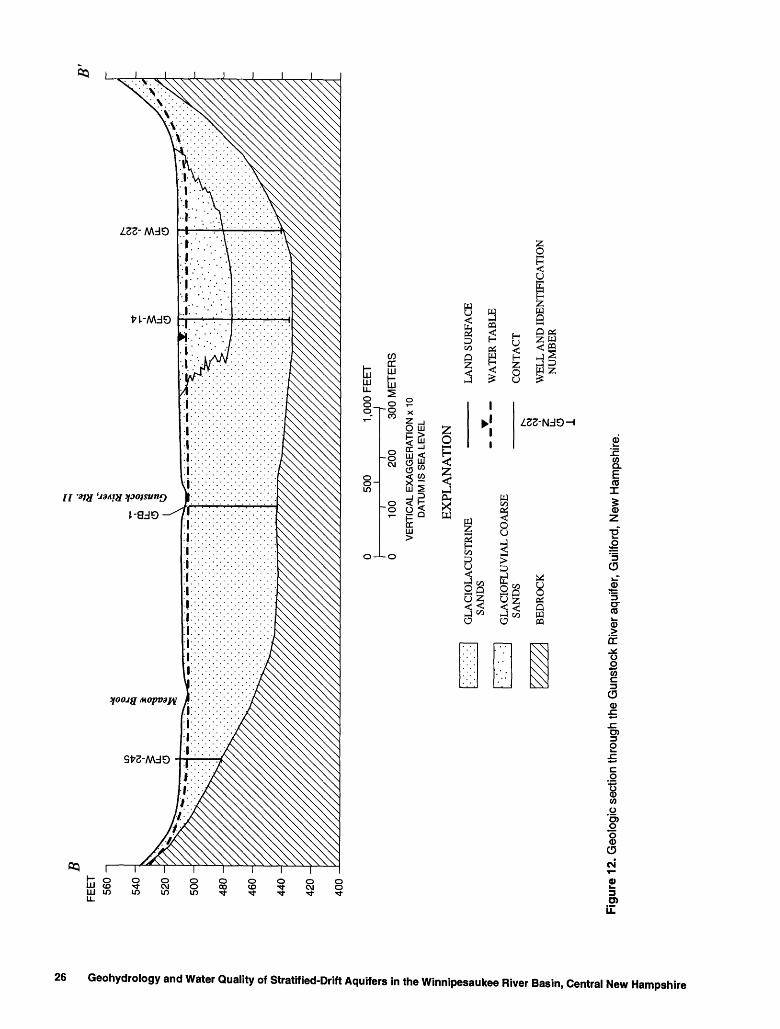
o (D
O
_ O 03 «< n>
a o c n> (D CD
n>
at O (D 3. S (D n>
500 I
1,0
00
FE
ET
100
200
300
ME
TE
RS
VE
RT
ICA
L E
XA
GG
ER
AT
ION
x 1
0 D
AT
UM
IS
SE
A L
EV
EL
EXPL
AN
ATI
ON
GL
AC
IOL
AC
UST
RIN
E
SAN
DS
GL
AC
IOFL
UV
IAL
CO
AR
SE
SAN
DS
BE
DR
OC
K
O 1
Figu
re 1
2. G
eolo
gic
sect
ion
thro
ugh
the
Gun
stoc
k R
iver
aqu
ifer,
Gui
lford
, N
ew H
amps
hire
.
LA
ND
SU
RFA
CE
WA
TE
R T
AB
LE
CO
NT
AC
T
WE
LL
AN
D ID
EN
TIF
ICA
TIO
N
NU
MB
ER

This aquifer was deposited in a glacial lake when meltwater drained south out of the Merrymeeting Valley and down the Ela River in the Cocheco River Basin. This spillway, near the basin divide, probably conveyed water for a long time and was the last easterly draining outlet for glacial Lake Winnipesaukee before the lake began to drain to the west, down the Winnipesaukee River.
From Alton Bay south to the Merrymeeting River Wildlife Management Area, the saturated thickness of the aquifer is typically 20 to 40 ft. Several test borings done for this study (AHW-64, AHW-369, AHA-81, and AHW-63, pi. 2) reached refusal or bedrock between 30 and 40 ft. Further to the south, near the Alton-New Durham town line, the aquifer becomes thicker and locally as much as 100 ft thick near the drainage divide with the Ela River. Wells
NFW-1 and NFW-54 were drilled to refusal at depths of 96 and 81 ft, respectively. The transmissivity of this aquifer is generally greater than 1,000 ft2/d and is locally 4,000 to 8,000 ft2/d.
The narrow valley segment of the aquifer, in the northern part, is typical of the morphosequence depositional model described by Koteff and Pessl (1981). At least three distinct sequences of deposits are identifiable in this section of the valley. A good example is the esker-delta sequence that begins about 1,000 ft south of Alton Bay, on the west side of the river. The esker is traceable south to New Hampshire Route 140, near where it crosses the Merrymeeting River. A geologic section through this deposit shows the position of the esker (mostly buried), Alton water- supply well AHW-3 (fig. 13), and the delta that formed in the early stages of glacial Lake Winnipesaukee.
500i
1,000 FEET
100 200 300 METERS
VERTICAL EXAGGERATION x 10
DATUM IS SEA LEVEL
EXPLANATION
FLUVIAL SAND AND GRAVEL LAND SURFACE
ESKER
GLACIOLACUSTRINE DELTAIC SEDIMENT
BEDROCK
__<<__ WATER TABLE
CONTACT-Dashed where inferred; queried where uncertain
WELL AND IDENTIFICATION NUMBER
Figure 13. Geohydrologic section through the Merrymeeting River aquifer, Alton, New Hampshire.
Geohydrology of Stratified-Drift Aquifers 27

The coarse-grained esker formed where fast- moving meltwater flowed in tunnels in the ice, whereas the finer grained delta formed where the fast-moving meltwater slowed as it emptied into the glacial lake. Identification of these sequences of deposits can help in predicting the presence of coarse- or fine-grained stratified-drift aquifers. At least two other similar morphosequences are identifiable in this valley.
The transmissivity of the Merrymeeting River aquifer is variable and is related to the morphology of a deposit in a given sequence of deposits. The transmissivity near well AHW-64 is about 1,800 ft2/d and near well AHW-3 is about 3,800 ft2/d. Both of these wells are finished in coarse-grained sediments characteristic of an esker. Test borings AHA-52, AHA-53, AHA-56, and AHA-57 (pi. 2) are finished in the associated glaciolacustrine delta. The estimated transmissivity near these wells is less than 1,200 ft2/d. The fairly high transmissivity near AHW-3 is typical of ice-contact coarse-grained stratified drift, whereas the fairly low transmissivity near AHA-53 is typical of fine grained deltaic deposits.
Additional wells, if installed near esker segments, would likely be suitable for municipal supply and would increase the amount of water available from the aquifer. A technique for evaluation of water availability and results of the application of this technique to the Merrymeeting River aquifer are discussed in the section, "Estimation of Water Availability for Selected Aquifers."
Black Brook Aquifer
The Black Brook aquifer is at the southeastern end of Paugus Bay, immediately west of Lily Pond (pi. 5). Logs from wells drilled into this deposit provide conflicting information regarding the thickness of the stratified-drift aquifer. The saturated thickness of the aquifer is estimated to be greater than 20 ft but may be as much as 100 ft. Aquifer transmissivity estimated from logs of domestic wells exceeds 1,000 ft2/d where the saturated thickness is the greatest.
Hawkins Brook Aquifer
The Hawkins Brook aquifer is north of the town of Meredith and extends upvalley from Meredith Bay (pi. 7). The aquifer occupies a narrow valley, and the saturated thickness is locally greater than 60 ft; for example, the saturated thickness at observation well MHW-1 (pi. 3) is 67 ft and at MHW-2 (pi. 3) is 44 ft. The transmissivity is generally less than 1,000 ft2/d but is 1,000 to 2,000 ft2/d in the center of the valley where the aquifer is composed of medium to coarse sand. Based on grain-size analysis of sediment samples collected during test drilling, the transmissivity at observation well MHW-1 is about 1,100 ft2/d and at observation well MHW-2 is about 1,200 ft2/d. This aquifer is hydraulically connected to Meredith Bay; ground-water withdrawals from the aquifer, near the bay, may induce water from the lake to the aquifer.
The upstream end of the aquifer, at the head of the large delta (near MHW-1), has potential for development of a medium-yield well. Coarse sands also were found at observation well MHW-2. A geohydrologic section through the delta and associated deposits is shown on figure 14.
Low streamflow at measurement site 23 (pi. 3, appendix D) was 0.14 ft3/s (0.09 Mgal/d) in Hawkins Brook on July 3,1991. Some of this water, plus ground water in storage, would potentially be available to withdrawal wells. The aquifer materials in this location are generally too fine to be developed as a high-yield supply, and only a small amount of streamflow is available for induced infiltration.
Halfway Brook Aquifer
The Halfway Brook aquifer extends along the Halfway Brook drainage from 3,000 ft southeast of Moultonborough (pi. 7). The saturated thickness of the aquifer is locally greater than 40 ft. Lithologic logs of holes drilled for domestic wells indicate that the transmissivity in this small zone is 1,000 to 2,000 ft2/d. To the south, toward State Landing, no information was available to determine the saturated thickness or transmissivity; based on data for the vicinity of the Halfway Brook aquifer and the data for the area near State Landing, transmissivity is probably less than 1,000 ft2/d but may exceed 1,000 ft2/d in some areas.
28 Geohydrology and Water Quality of Stratified-Drift Aquifers in the Winnipesaukee River Basin, Central New Hampshire
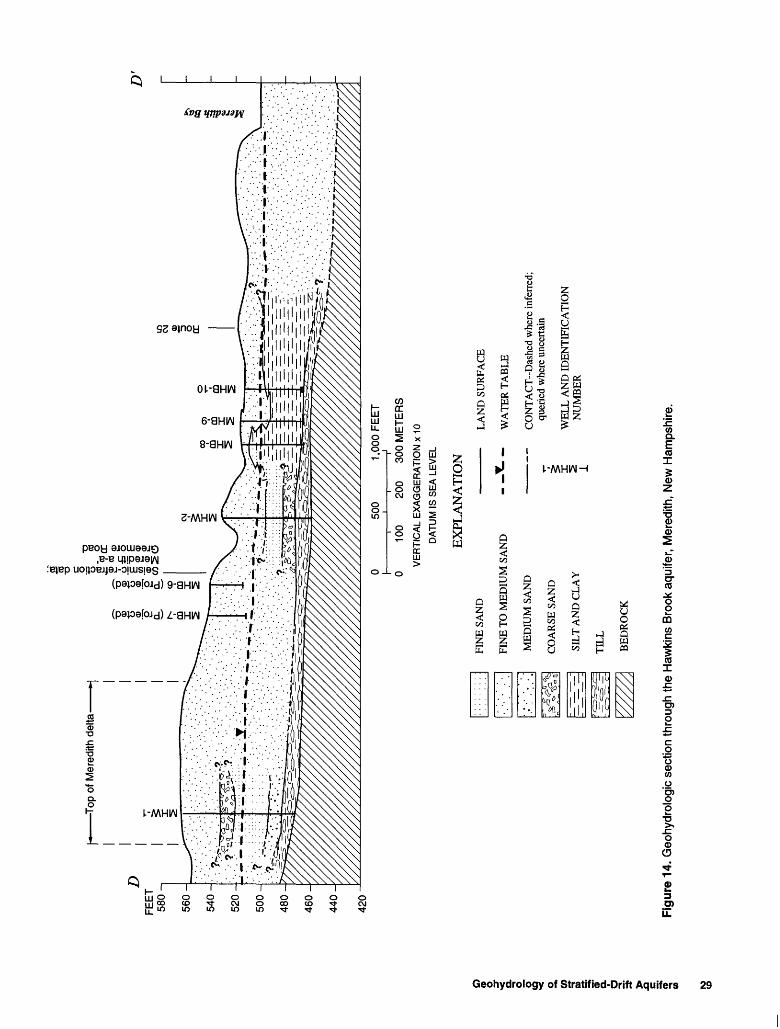
420
500
1,00
0 F
EE
T
0 10
0 20
0 30
0 M
ET
ER
S
VE
RTI
CA
L E
XA
GG
ER
ATI
ON
x 1
0
DA
TUM
IS
SE
A L
EV
EL
O (D
O o, o ca o -K w ffl 5'
a. 6 5
EX
PLA
NA
TIO
NFI
NE
SA
ND
FIN
E T
O M
ED
IUM
SA
ND
- -
^- -
ME
DIU
M S
AN
D
__
__
_
CO
AR
SE S
AN
D
^ X
SIL
T A
ND
CL
AY
^
TIL
L
BE
DR
OC
K
LA
ND
SU
RFA
CE
WA
TE
R T
AB
LE
CO
NT
AC
T-D
ashe
d w
here
infe
rred
; qu
erie
d w
here
unc
erta
in
WE
LL
AN
D I
DE
NT
IFIC
AT
ION
N
UM
BE
R
Figu
re 1
4. G
eohy
drol
ogic
sec
tion
thro
ugh
the
Haw
kins
Bro
ok a
quife
r, M
ered
ith,
New
Ham
pshi
re.

Test borings MWA-1 and MWA-2 (pi. 3) show the saturated thickness to be 0 and 10 ft, respectively. The transmissivity at test boring MWA-2 is estimated to be approximately 100 ft2/d. Logs from holes drilled for domestic wells indicated that some of the overburden material may be composed of till, so the depth to bedrock minus the depth to the water table may not be an accurate estimate of the saturated thickness of the stratified-drift aquifer in this area. Much of this aquifer may be underlain by a thick till unit.
Shannon Brook Aquifer
The Shannon Brook aquifer is 2,000 ft northeast of Clark Landing along Shannon Brook (pi. 8). Seismic-refraction profiles for Moultonborough lines b-b' and d-d' (pi. 4, appendix C) indicate that the saturated thickness of the aquifer in this area is as much as 60 ft. The saturated thickness at observation well MWW-20 is 41 ft. The transmissivity of this narrow valley aquifer is locally greater than 1,000 ft2/d. At wells MWW-20 and MWW-275 (pi. 4), the transmissivities are estimated to be 1,250 and 1,425 ft2/d, respectively. To the west of MWW-20, the aquifer thins and, in places, is covered by alluvial fan deposits and (or) till reworked by fluvial processes.
Mersey Brook Aquifer
The Hersey Brook aquifer is on the northwest shore of Lake Wentworth (pi. 8). The aquifer is generally thin, but saturated thickness exceeds 40 ft locally. The log of test boring WRA-1 indicates that the transmissivity of the aquifer is less than 500 ft2/d. Lithologic logs of holes drilled for domestic wells indicate that the aquifer is coarser to the northwest than near WRA-1; the estimated transmissivity in this area is 1,000 to 2,000 ft2/d.
Nineteen Mile Brook Aquifer
The Nineteen Mile Brook aquifer is along New Hampshire Route 109A, 3,000 ft from the Moultonborough-Tuftonboro town line (pi. 8). The saturated thickness of this aquifer is as much as 60 ft in the middle of the valley, though most of the adjacent
aquifer is less than 20 ft thick. The transmissivity at test boring TZA-9 is approximately 825 ft2/d, based on grain-size analysis of sediment samples collected during test drilling. The lithologic log of the hole drilled for domestic well TZW-158, however, indicates coarse-grained aquifer material, and the transmissivity near this site is estimated to be 1,000 to 2,000 ft2/d.
Copps Pond Aquifer
The Copps Pond aquifer is adjacent to and beneath Copps Pond, 5,000 ft east of Melvin Bay (pi. 8). The aquifer is composed of coarse-grained ice- contact stratified drift associated with retreating ice and stagnant ice blocks that formed the Copps Pond kettle. Seismic-refraction profiling (Tuftonboro line i-i', pi. 4, appendix C20) indicates that the saturated thickness is more than 20 ft. The saturated thickness is locally greater than 60 ft. The transmissivity is greater than 1,000 ft2/d for much of the aquifer but probably does not exceed 2,000 ft2/d. The estimated transmissivity at observation well TZW-167 is about 1,300 ft2/d.
Melvin River Aquifer
The Melvin River aquifer is northwest of Melvin Village, at the base of the Ossipee Mountains (pi. 8). This aquifer is areally extensive and the stratified-drift deposits are generally greater than 20 ft thick. The aquifer is a hummocky mix of ice-contact kames and deltaic deposits. In the western part, fine-grained lacustrine sediment was found during drilling of test borings TZA-7 and TZA-8 (pi. 4). The saturated thickness at both sites is less than 20 ft, and the transmissivity is less than 500 ft2/d. In the western part, however, the saturated thickness is locally more than 100 ft (TZW-3). The transmissivity at observation well TZW-3 is estimated to be approximately 2,500 ft2/d. The transmissivity decreases to less than 1,000 ft2/d eastward, toward the middle of the deposit. At test boring TZA-16, the aquifer is more than 90 ft thick, but the saturated thickness is less than 15 ft. At observation well TZW-8, the saturated thickness is only 6 ft. Continuing east, the saturated thickness is again locally greater than 20 ft and the transmissivity is 1,000 to 2,000 ft2/d. At observation well TZW-2, the
30 Geohydrology and Water Quality of Stratified-Drift Aquifers in the Winnipesaukee River Basin, Central New Hampshire

saturated thickness is 30 ft; transmissivity, based on grain-size analysis of sediment samples collected during test drilling, is approximately 1,500 ft2/d.
The aquifer is hydraulically connected to the Melvin River, but streamflows measured at sites 10,11, and 12 (pi. 4, appendix D) indicate that available water to wells would come primarily from ground-water storage.
Estimation of Water Availability for Selected Aquifers
Two aquifers were selected to estimate potential water availability by use of a numerical model that simulates ground-water flow. The aquifers are in Alton and Belmont, and both are ice-contact stratified-drift aquifers that include esker and deltaic deposits. The Merrymeeting River aquifer, in Alton, is fairly thin (less than 45 ft) and is hydraulically connected to the Merrymeeting River, which may provide recharge as induced infiltration. The Pumping Station Brook aquifer, in Belmont, is locally greater than 60 ft thick and is hydraulically connected to Pumping Station Brook.
Model Construction
A numerical finite-difference model, MODFLOW (McDonald and Harbaugh, 1988), was used to estimate water availability from the two aquifers. Lapham (1988) cites numerous examples of ground-water availability studies in which analytical models were used to determine rates of combined withdrawal from wells distributed throughout an aquifer. Each of the models used in this study was developed as an aid in estimating water availability and is founded on nearly as many simplifying assumptions as simple analytical models, which do not allow the aquifer system to be discretized. The numerical model enables the user to simulate (1) areal variations of the saturated thickness and hydraulic conductivity of an aquifer, (2) the location of streams overlying the aquifer and variations of the stream characteristics along selected reaches, and (3) drawdown on all sides of a stream boundary. Sources of water to wells was
from storage and induced infiltration from surface water bodies. The numerical model was chosen over analytical methods because a numerical model more closely represents the aquifer geometry and hydraulics as mapped on plates 5-8 of this report.
The models were designed to represent the geohydrologic characteristics of ground-water flow in stratified-drift aquifers. The following simplifying assumptions about the ground-water-flow system were made in developing the models:
1. Two-dimensional flow is adequate to represent the flow system. Ground-water flow is predominantly horizontal. Vertical gradients are downward in areas of ground-water recharge and upward in areas of ground-water discharge. Strong vertical gradients are also present near discharging wells, however, the magnitude of the vertical flow gradients diminishes rapidly with distance from the well (Harte and Mack, 1992). The error associated with simulation of water availability by considering only two-dimensional horizontal flow is negligible.
2. Water-supply wells are fully penetrating and 100 percent efficient. Wells used for supply are generally not fully penetrating and are commonly screened in the bottom 25 percent of the aquifer. In addition, these wells are not 100 percent efficient. Increased drawdown in the well results from energy loss between the aquifer and the well, which is a function of well design and construction. The effect of this simplifying assumption is that less drawdown is simulated than would occur in the real system.
3. There is no flow of ground water between till and (or) bedrock and the stratified-drift aquifer. The model areas are stratified-drift aquifers in till-covered bedrock valleys. In an aquifer where horizontal and vertical gradients are found between the stratified drift and the underlying till and (or) bedrock, ground-water flow may occur between the aquifer and the surrounding geologic units but this type of recharge was not simulated. Although lateral flow from uplands adjacent to the edge of the
Geohydrology of Stratified-Drift Aquifers 31

stratified drift does occur, it is generally less than 0.1 (ft3/s)/mi2 (0.05 (Mgal/d)/mi2) (Harte and Mack, 1992, Ayotte and Toppin, 1995) during the summer months and its contribution is considered negligible and was not simulated.
4. Finite-difference approximation of the nonlin ear, partial differential equations governing three-dimensional ground-water flow results in reasonable estimates of yield for an aquifer. Flow in the numerical model is described by linear differential equations that are solved by use of a finite-difference approxi mation. The aquifers are discretized into blocks (cells) in which hydraulic properties are assumed to be constant. For unconfined sys tems, the linear equations are not strictly appli cable because changes in the potentiometric surface (water table) affect the transmissivity, and changes in the transmissivity with time result in a nonlinear aquifer response. The model accounts for this, in part, by readjusting the values of transmissivity due to the declining water table for each of the 20 time steps (speci fied by the user) in the simulation. Because the changes in transmissivity are small throughout most of the aquifer, inaccuracies that result from this approximation are minimal. Exact solutions to the linear equations are impossible; therefore, the solutions are determined by solv ing a series of linear equations, through the pro cess of iteration, until the greatest change in the solution is less than some stated limit. A limit of 0.01 ft was used to end the iteration.
Model Input Parameters
Model input parameters consisted of: (1) the position of the water table, (2) saturated thickness, (3) hydraulic conductivity, (4) specific yield, and (5) the streambed hydraulic conductivity. The model simulated a period of 180 days with no areal recharge to account for extended periods without recharge.
Sources of water to hypothetical wells are from storage and induced infiltration from surface-water bodies such as rivers.
Position of the Water Table
In both models, the initial water table was assumed to be flat and at an elevation of zero. Result ing declines in the water table were thus negative values. Because the models were designed to estimate water availability not to be a calibrated representa tion of the actual ground-water-flow system a flat initial water table is reasonable.
Saturated Thickness and Hydraulic Conductivity
The saturated-thickness data for the aquifers were taken directly from plate 1 for the Pumping Station Brook aquifer and from plate 2 for the Merrymeeting River aquifer. The saturated-thickness contours were overlain on the model grid, and the appropriate saturated thickness was assigned to each cell. Hydraulic conductivity (K) is related to saturated thickness, b, and transmissivity, J, by T = K (b). These values were taken directly from the saturated thickness and transmissivity maps.
Specific Yield
The specific yield of the aquifers was not measured for the model areas. Johnson (1967) summarized the results of specific yield for sediments from many studies. He reported that the average specific yield for fine sands was 0.21; for coarse sands, 0.27; and for gravels, 0.22. Ayotte and Toppin (1995) found that a shallow, coarse-grained aquifer in south- central New Hampshire had specific yields ranging from 0.21 to 0.29. A value of 0.2 was used for both aquifers as a conservative estimate of specific yield.
Streambed Hydraulic Conductivity
The average vertical hydraulic conductivity of streambed materials in both aquifers was not measured for either aquifer in the model area.
32 Geohydrology and Water Quality of Stratified-Drift Aquifers in the Winnipesaukee River Basin, Central New Hampshire

Rather, a conservative value of 1 ft/d was used in all cases. This value is somewhat lower than hydraulic conductivities reported for similar areas in New England. Lapham (1988), in a similar water availability study in Massachusetts, used 5 ft/d. Harte and Mack (1992), however, used 3 ft/d for most reaches but used 1 ft/d where the channel contained fine-grained sands and organic material. Ayotte and Toppin (1995) used 3 ft/d on the basis of grain-size analysis of sediment cores collected from the river in the model area. In this study, streams appear to be flowing over a range of sediment types and, in some cases, over organic material.
Results of Ground-Water-Availability Estimates
For each aquifer, the model was run twice once in which the surface-water bodies (streams and rivers) contributed to the total available water and once in which only water from storage contributed to the total available water. This double simulation provides a range of estimated available water from an aquifer over a period of 180 days, both with and without recharge from nearby surface-water sources. Commonly, public-supply wells in stratified drift are near or adjacent to a surface-water body to take advantage of potential induced recharge when the wells are pumped.
Merrymeeting River Aquifer
For the Merrymeeting River aquifer, the model grid consisted of 84 rows and 45 columns; each cell was 100 by 100 ft. Ground-water withdrawals were simulated at five wells in the zones of highest transmissivity. Simulated withdrawals were adjusted so that the total drawdown at the well was no more than 70 percent of the saturated thickness of the aquifer. Calculated drawdown in the cell was the average drawdown for the cell and was less than drawdown at the hypothetical well.
In the simulation of water derived solely from storage, the total water available was 0.63 Mgal/d. In the simulation of water derived from storage and from induced infiltration, the total water available was 1.1 Mgal/d (table 4). In the latter simulation, 0.09 Mgal/d came from storage and 1.01 Mgal/d came from induced infiltration.
Induced infiltration calculated by simulation was compared to the amount of water flowing in the stream at a period of low flow (approximately 93-percent flow duration) to determine whether the simulated withdrawals would deplete the available streamflow. The nearest measurement of the Merrymeeting River upstream from or adjacent to the aquifer was near Main Street in New Durham (site 1, pi. 2). Low streamflow measured on July 3, 1991, was 8.6 ft3/s (5.5 Mgal/d). Induced infiltration calculated by the model (1.01 Mgal/d) represents only 18 percent of the streamflow (table 4).
The model boundary, surface-water boundaries, and locations of hypothetical wells are shown in figures 15 and 16. The drawdown, shown as negative values, as a result of simulated withdrawal with induced infiltration is shown in figure 15, and drawdown without induced infiltration is shown in figure 16.
Table 4. Water-availability estimates for two simulations of the Merrymeeting River aquifer, central New Hampshire
[Low streamflow measurement on July 3,1991: site 1, appendix D. Mgal/d, million gallons per day; ft3/s, cubic foot per second; , no data]
Water- availability
estimate from:
Ground-waterstorage only ......
Ground-waterstorage plusinducedinfiltration.........
Ground- . . . Inducedwater infiltration£25 « "«
0.63
.09 1.01
Totalavailable
water, numerical
model(Mgal/d)
0.63
1.1
Lowstreamflow measure
ment on July 3,
1991(tf/s)
-
8.6
Geohydrology of Stratified-Drift Aquifers 33

71°13'55"
43°27'56"
43°27'16"
Base from U.S. Geological Survey Alton, N.H., 1:24,000, 1987 , 0.2 0.4
i_____i0.6 0.8
-5
H .....0 0.2 0.4 0.6 0.8 1 KILOMETERS
CONTOUR INTERVAL 20 FEETNATIONAL GEODETIC VERTICAL
DATUM OF 1929
EXPLANATION
MODEL BOUNDARY
RIVER CELLS
HYPOTHETICAL WELLS
DRAWDOWN CONTOUR Shows drawdown from a flat water table after 180 days of pumping. Contour interval is 5 feet
1 MILES
Figure 15. Model boundary, surface-water boundaries, hypothetical wells, and drawdown contours for the Merrymeeting River aquifer, central New Hampshire with simulation of induced infiltration.
34 Geohydrology and Water Quality of Stratified-Drift Aquifers in the Wlnnipesaukee River Basin, Central New Hampshire

71°13'55"
43°27'56"
43>27'16"
Base from U.S. Geological Survey Alton, N.H., 1:24,000, 1987 0.2
i0.4
I0.6 0.8 1 MILES
0 0.2 0.4 0.6 0.8 1 KILOMETERS
-5
CONTOUR INTERVAL 20 FEETNATIONAL GEODETIC VERTICAL
DATUM OF 1929
EXPLANATION
MODEL BOUNDARY
RIVER CELLS
HYPOTHETICAL WELLS
DRAWDOWN CONTOUR Shows drawdown from a flat water table after 180 days of pumping. Contour interval is 5 feet
Figure 16. Model boundary, surface-water boundaries, hypothetical wells, and drawdown contours for the Merrymeeting River aquifer, central New Hampshire with simulation of no induced infiltration.
Geohydrology of Stratifled-Drlft Aquifers 35

The area of calculated drawdown is significantly greater for the simulation with no induced infiltration (fig. 16) than for the simulation with induced infiltration from the Merrymeeting River (fig. 15). This comparison indicates that drawdown at withdrawal wells can be reduced and simulated withdrawals can be maximized by locating the wells near the Merrymeeting River. Water availability in this aquifer is limited by available drawdown and not by available recharge. By placing additional wells along the Merrymeeting River, more water could be withdrawn than if wells were placed elsewhere in the aquifer.
Pumping Station Brook Aquifer
For the Pumping Station Brook aquifer the model grid consisted of 75 rows and 50 columns; each cell was 100 by 100 ft. Ground-water withdrawals were simulated at six hypothetical wells in the zones of highest transmissivity. Simulated withdrawals were adjusted so that the total drawdown at the well was not more than 70 percent of the saturated thickness of the aquifer. Calculated drawdown in the cell was the average drawdown for the cell and was less than the drawdown at the hypothetical well.
In the simulation of water derived solely from storage, the total water available was 1.6 Mgal/d. In the simulation of water derived from storage and from induced infiltration, the total water available was 1.8 Mgal/d (table 5). In the latter simulation, 1.5 Mgal/d came from storage and 0.3 Mgal/d from induced infiltration.
Induced infiltration calculated by simulation was compared to the amount of water flowing in the stream at a period of low flow (approximately 93-percent flow duration) to determine whether the
Table 5. Water-availability estimates from two simulations of the Pumping Station Brook aquifer, central New Hampshire
[Low streamflow measurement on July 3,1991: site 34, appendix D. Mgal/d, million gallons per day; ft /s, cubic foot per second]
Water-availability esti
mate from:
Ground-waterstorage only ......
Ground-waterstorage plusinducedinfiltration.........
Ground-water
storage (Mgal/d)
1.6
1.5
Inducedinfiltra
tion (Mgal/d)
-
0.3
Totalavailable
water numerical
model(Mgal/d)
1.6
1.8
Lowstreamflowmeasure ment on July 3,
1QQ11 5J5J 1
(ft3/s)
-
3.9
simulated withdrawals would deplete the available streamflow. The nearest measurement of the Tioga River upstream from or adjacent to the aquifer was near Route 140, at the northern end of the model area (site 34, pi. 1). Low streamflow measured on July 3, 1991, was 3.9 ft3/s (2.5 Mgal/d) (table 5). Induced infiltration calculated by the model (0.3 Mgal/d) represents 12 percent of the stream flow (table 5).
The model boundary, surface-water boundaries, and locations of hypothetical wells are shown in figures 17 and 18. The drawdown due to simulated withdrawal with induced infiltration is shown in figure 17, and drawdown without induced infiltration is shown in figure 18. The area of calculated drawdown for the simulation without induced infiltration (fig. 18) is similar to that for the simulation with induced infiltration from the Pumping Station Brook aquifer (fig. 17). This comparison indicates that drawdown at pumped wells cannot be significantly reduced by inducing infiltration and that available water is mainly limited by the amount of water available from storage.
36 Geohydrology and Water Quality of Stratified-Drift Aquifers in the Winnipesaukee River Basin, Central New Hampshire

71°29'18" 71°28'37'
4T26'26"
4T25'39'
Base from U.S. Geological Survey Belmont, N.H., 1:24,000.1987 rj 0.2
i0.4
I0.6 0.8
i1 MILES
0 0.2 0.4 0.6 0.8 1 KILOMETERS
CONTOUR INTERVAL 20 FEETNATIONAL GEODETIC VERTICAL
DATUM OF 1929
-5
EXPLANATION MODEL BOUNDARY
RIVER CELLS
HYPOTHETICAL WELLS
DRAWDOWN CONTOUR Shows drawdown from a flat water table after 180 days of pumping. Contour interval is 5 feet
Figure 17. Model boundary, surface-water boundaries, hypothetical wells, and drawdown contours for the Pumping Station Brook aquifer, central New Hampshire with simulation of induced infiltration.
Geohydrology of Stratified-Drift Aquifers 37

71°29'18' 71°28'37"
4T26'26"
43°25'39"
Base from U.S. Geological SurveyBelmont, N.H., 1:24,000, 1987 Q 0.2 0.4 0.6 0.8 1 MILES
i i i i i i
0 0.2 0.4 0.6 0.8 1 KILOMETERS
CONTOUR INTERVAL 20 FEETNATIONAL GEODETIC VERTICAL
DATUM OF 1929
4T1
-5
EXPLANATION MODEL BOUNDARY
RIVER CELLS
HYPOTHETICAL WELLS
DRAWDOWN CONTOUR Shows drawdown from a flat water table after 180 days of pumping. Contour interval is 5 feet
Figure 18. Model boundary, surface-water boundaries, hypothetical wells, and drawdown contours for the Pumping Station Brook aquifer, central New Hampshire with simulation of no induced infiltration.
38 Geohydrology and Water Quality of Stratified-Drift Aquifers in the Winnipesaukee River Basin, Central New Hampshire

GROUND-WATER QUALITY
Water samples from 17 wells were collected in January and August 1991 and were analyzed for inorganic compounds. The results were used to evaluate the background water quality of the stratified-drift aquifers in the Winnipesaukee River Basin. Results of the analyses indicate that water from the stratified-drift aquifers is generally suitable for drinking and other domestic or municipal uses. During the sampling phase of this study, known areas of ground-water contamination were avoided.
All of the sampled wells were developed either with compressed air or with a centrifugal pump to remove water introduced during drilling, foreign material, and sediment and to improve the hydraulic connection with the aquifer. Wells were allowed to stabilize for at least 1 month before sampling. Just before sampling, the wells were pumped until temperature and specific conductance stabilized and at least three times the volume of water in the well was evacuated. This procedure helped ensure that the sampled water represented water from within the aquifer.
All water samples were analyzed by the USGS National Water Quality Laboratory (NWQL) in Arvada, Colo. Samples were collected and analyzed according to procedures described by Fishman and Friedman (1989).
Results of the chemical analyses are presented and compared with the U.S. Environmental Protection Agency (1991a,b, 1992) primary and secondary drinking-water regulations and the New Hampshire Department of Environmental Services, Water Supply Engineering Bureau drinking-water recommendations (New Hampshire Department of Environmental Services, Water Supply Engineering Bureau, written commun., 1990) in table 6. Naturally occurring constituents that have no recommended limits, but whose concentrations are generally less than a few micrograms per liter, also are included in table 6. Many of the constituents listed in table 6 were not detectable in water samples from the stratified-drift aquifers in the study area. Individual constituents and properties are discussed in the following paragraphs.
Specific Conductance
Specific conductance a measure of the ability of water to conduct electrical current ranged from 49 |iS/cm in water from well NRW-59 to 440 |iS/cm
in water from well WRW-1. The median for all water samples in this study (112 |iS/cm) was less than the median for the entire State (132 (iS/cm) for public- supply wells completed in stratified-drift aquifers (Morrissey and Regan, 1987).
Dissolved Solids
Dissolved-solids (solids residue) concentrations in water include all ionized and un-ionized dissolved solids in solution. The concentrations of all water samples from stratified-drift aquifers ranged from 32 mg/L (well TZW-3) to 236 mg/L (well WRW-1) and were less than the maximum recommended limit for drinking water of 500 mg/L established by the New Hampshire Department of Environmental Services, Water Supply Engineering Bureau (1990). The low concentration of dissolved solids in these stratified-drift aquifers can be attributed to the low solubility of the aquifer matrix and the relatively short time that the water is in contact with the aquifer (Morrissey and Regan, 1987).
PH
The pH of water is a measure of the hydrogen ion activity. Water having a pH of 7.0 is neutral, less than 7.0 is acidic, and greater than 7.0 is alkaline. The pH of most ground water in the United States ranges from about 6.0 to 8.5 (Hem, 1985, p. 63-64). The pH of water sampled during this study ranged from 5.4 to 7.2; the median was 6.3. The range of pH in stratified-drift aquifers sampled in previous studies in this series (Moore, 1990; Flanagan and Stekl, 1990; Lawlor and Mack, 1992; Ayotte and Toppin, 1995) in this series was from 5.3 to 8.5, and the median was 6.4. The most basic or alkaline ground-water samples came from well BLW-83 (7.2). The most acidic water was from wells AHW-1 (6.4), AHW-63 (6.3), AHW-64 (6.4), BLW-28 (6.3), BLW-80 (5.8), BLW-84 (6.2), BLW-85 (5.5), GFW-11 (5.8), MHW-1 (5.4), MHW-2 (6.3), MWW-20 (5.9), NRW-59 (6.4), TZW-3 (5.9), and TZW-9 (6.3). Each of these samples had a pH less than the SMCL of 6.5 established by the USEPA (U.S. Environmental Protection Agency, 1992).
Ground-Water Quality 39

Table 6. Chemical analyses of ground-water samples from the Winnipesaukee River Basin, central New Hampshire
[ft, foot; nS/cm, microsiemens per centimeter at 25 degrees Celsius; °C, degree Celsius; mg/L, milligram per liter: ng/L, microgram per liter; <, actual value is less than value shown; , no data; SMCL, Secondary Maximum Contaminant Level: Contaminants that affect the esthetic quality of drinking water. At high concentrations or values, health implications as well as esthetic degradation may also exist. SMCL's are not Federally enforceable but are intened as guidelines for the States (U.S. Environmental Protection Agency, 1992); MCL, Maximum Contaminant Level: Enforceable, health-based regulation that is to be set as close as is feasible to the level at which no known or anticipated adverse effects on the health of a person occur. The definition of feasible means the use of the best technology, treatment techniques, and other means that the Administrator of the U.S. Environmental Protection Agency finds, after examination for efficacy under field conditions and not solely under laboratory conditions, are generally available (taking cost into consideration) (U.S. Environmental Protection Agency, 1992)]
L?,CM' Date of well No. . , . sample (plates :. « ^ collection 1-4)
AHW4AHW63AHW64BLW28BLW80
BLW83BLW84BLW85GFW11GFW12
MHW1MHW2MWW20NRW59TZW3
TZW9WRW1
SMCLMCL
8-02-918-08-918-08-918-02-911-29-91
8-07-918-07-918-07-911-28-911-28-91
8-09-911-28-911-18-918-06-918-09-91
8-09-918-08-91
U.S.
Water level
in depth below land
surface (ft)
7.918.15
4.21
7.9234.2535.07
5.334.54
17.587.987.887.75
17.20
8.4610.80
Depth of well, total
(ft)
38.020.539.052.082.5
80.060.050.053.080.0
35.055.030.080.051.0
27.020.0
Depth to top of sample interval
(ft)
17.036.5
80.0
77.557.747.551.577.5
32.552.527.557.548.5
24.017.5
Elevation of land surface
(ft above sea level)
520535515500470
500540665780515
565515600435577
615550
Specific conduct
ance, field
(|iS/cm)
14225718013856
1107871
299122
89210
674971
125440
pH, field
(stan dard units)
6.46.36.46.35.8
7.26.25.55.86.7
5.46.35.96.45.9
6.36.5
Temper- Dis- ature solved
of water oxygen (°C) (mg/L)
9.5 7.510.511.09.5 8.27.5 9.4
10.59.0
10.58.0 8.19.0 5.0
8.57.0 11.38.5 7.5
12.59.5
9.010.0
Hard ness
(mg/L as CaCO3)
-
48
12
33271631--
183730
17
417
Calcium, dissolved
(mg/L)
~
16--
3.1
7.96.94.49.8
.04
5.51110--
6.0
132.1
Environmental Protection Agency drinking-water regulations for listed property or chemical constituent
_.
6.5-8.0
40 Geohydrology and Water Quality of Stratified-Drifl Aquifers in the Winnipesaukee River Basin, Central New Hampshire

Table 6. Chemical analyses of ground-water samples from the Winnipesaukee River Basin, central New Hampshire Continued
Local well No.
1-4)
AHW4AHW63AHW64BLW28BLW80
BLW83BLW84BLW85GFW11GFW12
MHW1MHW2MWW20NRW59TZW3
TZW9WRW1
SMCLMCL
Date of
8-02-918-08-918-08-918-02-911-29-91
8-07-918-07-918-07-911-28-911-28-91
8-09-911-28-911-18-918-06-918-09-91
8-09-918-08-91
U.S.
..
Magne sium, dis
solved (mg/L)
~
2.0
1.0
3.22.41.11.6<.01
1.12.41.3
.48
2.0.33
Potas sium, dis
solved (mg/L)
~
1.4
1.8
2.01.0.60
4.91.5
.802.31.2
.90
1.21.1
Sodium, dis- Sodium
solved (percent) (mg/L)
12
3.0
5.52.64.2
44.30
5.7234.9
3.2
4.381
~
34
32
25173672~
395525
28
1896
Alkalinity _ ,. t * u ' Sulfate, wat wh tot ..fet field ,. (mg/L as ?olv*d CaC03) {mg/L)
35~
16
4527
81434
1320~
2915
4624
~
2.1
5.0
144.29.9
105.3
2.79.74.1~
5.9
3.57.3
Chloride, dissolved
(mg/L)
27
1.7
1.05.45.2
7510
144511
3.0
8.2100
Fluoride, dis
solved (mg/L)
0.10
<.10
.20
.20<.10<.10
.10
.10<.10
.20-
.10
.20
.10
Silica, dis
solved (mg/L)
12~
14
1911149.8<.01
167.5
14-
13
1912
Solids, residue at
180*C dissolved
(mg/L)
99
34
724950
15869
6710970-
32
69236
Environmental Protection Agency drinking-water regulations for listed property or chemical constituent
__
._
^0-250
^50
1 250
250^.04.0
^00500
Ground-Water Quality 41

Table 6. Chemical analyses of ground-water samples from the Winnipesaukee River Basin, central New Hampshire Continued
Local well No. (plates
1-4)
AHW4AHW63AHW64BLW28BLW80
BLW83BLW84BLW85GFW11GFW12
MHW1MHW2MWW20NRW59TZW3
TZW9WRW1
Date of sample
collection
8-02-918-08-918-08-918-02-911-29-91
8-07-918-07-918-07-911-28-911-28-91
8-09-911-28-911-18-918-06-918-09-91
8-09-918-08-91
Solids, sum of constit uents,
dissolved (mg/L)
99
39
845346
172-
5611463
44
85222
Nitrogen, ...^ .. .. Nitrogen, nitrite, .,_ ~. ' dis. N02+N03,. . dissolved solved . _
/ n (mg/L (mg/L ...asN) asN)
_.
<0.010
<.010
.010<.010<.010<.010<.010
<.010<.010<.010
<.010
<.010<.010
1.10
<.100
<.050.780.440
1.70<.100
<.050.200
1.00
.480
<.050.860
Nitrogen, ammo nium,
dissolved (mg/L asN)
<0.010
.020
.050
.020
.020<.010<.010
.460<.010
.010-
.020
.040<.010
Nitrogen, ammo nium +
organic, dissolved
(mg/L asN)
<0.20-
<.20
<.20<.20<.20<.20<.20
.70<.20
.30
<.20
<.20<.20
Phos phorus,
dis solved (mg/L asP)
0.010
<.010
.070<.010<.010
.030
.010
.010<.010<.010~
<.010
<.010.010
Phos phorous
ortho, dis
solved (mg/L asP)
._
<0.010
<.010
<.010<.010<.010<.010<.010
<.010.010
<.010
<.010
<.010<.010
_ . Bery- Cad- Barium, . * .. turn, mium, dis- .. .. . . dis- dis solved , . . . ( /L\ solved solved
._
19 <.5 <1.0..
<2 <.5 <1.0
27 .6 <1.015 .9 <1.021 .7 <1.017 <.5 <1.0<2 <.5 <1.0
21 <.5 <1.09 <.5 <1.0
<2 <.5 <1.0
12 <.5 <1.0
17 <.5 <1.016 <.5 <1.0
U.S. Environmental Protection Agency drinking-water regulations for listed property or chemical constituent
SMCLMCL
10
-
-
1 25Q
250
__
2,000 4 5
Alkalinity
The alkalinity of a solution is defined as the capacity for solutes in water to react with and neutralize acid (Hem, 1985, p. 106). It is commonly thought of as an indicator of buffering capacity the water's ability to resist changes in pH upon addition of an acid. Almost all of the alkalinity in most natural water can be attributed to carbonate and bicarbonate ions. Because stratified-drift aquifers in New Hampshire consist of sediment derived from bedrock having a low carbonate-mineral content, alkalinity in New Hampshire ground water is generally low. Alkalinity in water samples from this study was determined by incremental titration of unfiltered samples with aliquots of 0.01639N sulfuric acid to an endpoint of pH 4.5. For all the water samples,
alkalinity ranged from 8 mg/L as CaCO3 (at well BLW-85) to 46 mg/L as CaCO3 (at well TZW-9). The median alkalinity, 24 mg/L as CaCO3 , indicates that ground water from this area has low alkalinity and, therefore, has low buffering capacity
Calcium, Magnesium, and Hardness
Calcium and magnesium are common elements of the alkaline-earth minerals. Calcium and magnesium are also the predominant cations in most natural ground water (Hem, 1985). Concentrations of calcium in the samples ranged from 0.04 to 16 mg/L, and the median for the 13 samples was 7.9 mg/L. Concentrations of magnesium in the samples ranged from <0.01 to 3.2 mg/L, and the median for the 13 samples was 1.3 mg/L.
42 Geohydrology and Water Quality of Stratified-Drift Aquifers in the Winnipesaukee River Basin, Central New Hampshire

Table 6. Chemical analyses of ground-water samples from the Winnipesaukee River Basin, central New Hampshire Continued
L°cal Date of Cobalt, Copper, *on > L«ad'7' Na sample dissolved dissolved dis- dls- (plates .,.. / v / , solved solved 1-4) collection frig/l.) frig/l.) ^^ ^g/1.)
AHW4AHW63AHW64BLW28BLW80
BLW83BLW84BLW85GFW11GFW12
MHW 1MHW2MWW20NRW59TZW3
TZW9WRW1
8-02-918-08-918-08-918-02-911-29-91
8-07-918-07-918-07-911-28-911-28-91
8-09-911-28-911-18-918-06-918-09-91
8-09-918-08-91
<3
<3
<3<3<3<3<3
<3<3<3
<3
<3<3
<10 8 <10
<10 6 <10
<10 4,000 <10<10 6 <10<10 72 <10<10 6 <10<10 <3 <10
<10 1,900 <10<10 11 <10<10 5 <10
_.<10 6 <10
<10 4,400 <10<10 10 <10
Lithium, Man9a-
dissolved "es,e' . , _. dissolved
<4-
<4
5<4<4<418
<4<4<4-
<4
<4<4
-
330
76
3001235
390<1
371616
52
1,2002
Molyb- _, .. . ' Strontium,den"m' dissolved
dissolved (jig/L)
<10 140
<10 28
<10 60<10 64<10 41<10 200<10 <1
<10 55<10 100<10 75
<10 51
<10 85<10 79
.. .. Zinc, Vanadium,dissolved , ~ solved
<6
<6
<6<6<6<6<6
<6<6<6
<6
<6<6
4
3
4<3
6<3<3
56
<3~4
<33
U.S. Environmental Protection Agency drinking-water regulations for listed property or chemical constituent
SMCL
MCL
~
-
1,000 30050
-
50~
_...
--
5,0005,000
Secondary level set by the New Hampshire Department of Environmental Services, Water Supply Bureau (New Hampshire Department of Environmental Services, Water Supply Bureau, written commun., 1987)
Hardness of water, expressed in milligrams per liter as CaCC^, is caused by divalent metallic cations dissolved in the water. In freshwater, these cations are primarily calcium and magnesium, but iron, manganese, and strontium also may contribute to hardness. Hardness ranged from 7 mg/L at well WRW- 1 to 48 mg/L at well AHW-64. Hardness in all the 12 samples was less than 60 mg/L; thus, these waters are considered to be soft (table 7).
Sodium and Chloride
Sodium (Na) and chloride (Cl) can be introduced into ground water from nonindigenous sources (wet or dry deposition, such as sea salt and aerosols) and anthropogenic sources. The major anthropogenic source of sodium and chloride is road salt. On the basis
of limited data, it is estimated that New Hampshire towns and cities used about 33,000 tons per year of NaCl for deicing roads (Hall, 1975). The highest concentration of chloride was 100 mg/L from well WRW-1, less than one-half of the U.S. Environmental Protection Agency (1992) secondary maximum contaminant level (SMCL 1 ) for chloride, established as a taste threshold. Water samples from three wells had sodium concentrations that exceeded the 20-mg/L Health Advisory Level for sodium established by the
, Secondary Maximum Contaminant Level: Contami nants that affect the aesthetic quality of drinking water. At high concentrations or values, health implications as well as aesthetic degradation may also exist. SMCL's are not Federally enforceable but are intended as guidelines for the States.
Ground-Water Quality 43
Table 7. Cassification of hardness of water
fCaCO3 , calcium carbonate; modified from Durfor and Becker, 1964, p. 27]
Descriptive rating Range of hardness, as CaCO3 (milligrams per liter)
SoftModerately hard Hard Very hard
0-6061 - 120121 - 180
181 or greater
U.S. Environmental Protection Agency (1992) as a recommended limit for people with heart, hypertension, or kidney problems (23 mg/L at well MHW-2, 44 mg/L at well GFW-11, and 81 mg/L at well WRW-1). The ratio of Na to Cl in water from well WRW-1 was close to 1 to 1 milliequivalents per liter, indicating that NaCl (probably from road salt) is the source of both constituents.
Nitrate
The predominant form of inorganic nitrogen in natural water is nitrate, an oxidized, highly soluble compound. Excess nitrate in ground water can origi nate from fertilizer applications, leachate from sewage systems, or agricultural wastes. Nitrate (NC>3 as N) in ground water has been linked to methemoglobinemia, or blue-baby syndrome (Lukens, 1987). For all the samples, the concentration of NC>3 as N was at or below the detection limit of 0.010 mg/L. These concen trations are well below the 10-mg/L maximum contam inant level (MCL2) for NC>3 as N established by the USEPA (1992). Inorganic nitrogen also can be present in water as nitrite or ammonium. Among the water sample collected during this study, nitrogen concentra tions as ammonium ranged from less than 0.01 to 0.46 mg/L.
2MCL, Maximum Contaminant Level: Enforceable, health- based regulation that is to be set as close as is feasible to the level at which no known or anticipated adverse effects on the health of a person occur. The definition of feasible means the use of the best technology, treatment techniques, and other means that the Admin istrator of the U.S. Environmental Protection Agency finds, after examination for efficacy under field conditions and not solely under laboratory conditions, are generally available (taking cost into consideration).
Sulfate
The sulfate ion (SQ$~) is one of the major anions in natural water. Oxidation of sulfide ores, gypsum, and anhydrite and atmospheric deposition are sources of sulfate, but sulfate-producing minerals generally are not present in stratified-drift aquifers in New Hampshire. Sulfate is reduced by anaerobic bacteria to hydrogen sulfide gas (I^S), which can be detected by smell at concentrations of only a few tenths of a milligram per liter. The sulfate concentration among all the ground-water samples ranged from 2.1 to 14 mg/L, and the median was 5.3 mg/L. The SMCL for sulfate (SC>4 ~) in drinking water is 250 mg/L.
Iron and Manganese
Iron and manganese are common elements in minerals in stratified-drift deposits within this study area. Elevated concentrations of manganese, often accompanied by elevated concentrations of iron, were the most common water-quality problem found during this study. Manganese, an abundant metallic element, is an undesirable impurity in water because of its tendency to deposit black oxide stains (Hem, 1985, p. 85). Water from six wells had manganese concentrations that exceeded the SMCL of 50 (ig/L (U.S. Environmental Protection Agency, 199la): 330 ^ig/L at AHW-64,76 ^ig/L at BLW-80, 300 ^ig/L at BLW-83, 390 \ig/L at GFW-11,52 ^ig/L at TZW-3, and 1,200 jxg/L at TZW-9. Iron, if present in excessive amounts in residential water supplies, forms red oxyhydroxide precipitates that can stain clothes and plumbing fixtures. Concentrations of iron in water from three of the sampled wells 4,000 (lg/L at well BLW-83, 1,900 ^ig/L at well MHW-1, and 4,400 ^ig/L at well TZW-9 exceeded the SMCL of 300 ^ig/L (U.S. Environmental Protection Agency, 1992).
Trace Elements
Most trace metals are present in the soil as cat ions that are strongly adsorbed by oxides and hydrox ides (particularly aluminum, iron, and manganese) and complexed by organic ligands at near-neutral pH (Drever, 1982); the dissolved concentrations are, therefore, usually low. All of the ground-water samples
44 Geohydrology and Water Quality of Stratified-Drift Aquifers in the Winnipesaukee River Basin, Central New Hampshire

analyzed had trace metal concentrations that were below the detection limit for the following metals: cad mium, cobalt, copper, lead, molybdenum, and vana dium. In addition, the concentrations of the following metals were within the range of values commonly found in natural water (Hem, 1985): dissolved barium, lithium, strontium, and zinc. None of the samples exceeded the U.S. Environmental Protection Agency's SMCL for copper of 1,000 p,g/L (1991b).
SUMMARY AND CONCLUSIONS
The Winnipesaukee River Basin in central New Hampshire encompasses an area of 484 mi and contains approximately 66 mi2 of stratified drift. A 15- percent increase in population from 1980 to 1990 has increased the demand on the water resources of this area. In 1992, total ground-water withdrawals from stratified drift for public supply within the basin are approximately 0.1 Mgal/d. The towns of Alton and Belmont are the primary users of this ground water. Many of the shallow stratified-drift aquifers within the study area could be valuable sources of domestic and municipal water supplies, but they are not developed to their fullest potential.
Stratified-drift deposits in the basin largely reflect local and regional glacial-lake environments that existed at the time of deposition. Many are deltas deposited directly into glacial lakes or locally ponded meltwater and represent the downstream end of a morphosequence deposit (Koteff and Pessl, 1981). Some are deposits that begin as valley-fill deposits and grade into deltas as the meltwater streams emptied into a glacial lake.
Stratified-drift aquifers in the southern part of the study area are potentially the most productive. Trans- missivities are locally greater than 4,000 ft2/d but are generally less than 1,000 ft2/d. Saturated thicknesses exceed 100 ft locally but are generally less than 40 ft. Stratified drift in the southern part of the basin was deposited directly into glacial lakes that formed against the uplands to the south and the active ice margin to the north. Aquifers in this part of the study area are typi cally composed of kames, eskers, and deltas. Some of these deposits are capable of supplying enough potable water for domestic or small community supplies.
Stratified-drift aquifers in the northern part of the study area are more typical of ice-contact heads of outwash. Stratified drift in this part of the study area was deposited by meltwater streams flowing in valleys that fed into glacial Lake Winnipesaukee. Deposits include kames, kame terraces, eskers, outwash, and outwash deltas. Transmissivities of stratified-drift aquifers are locally greater than 2,000 ft2/d but are generally less than 1,000 ft2/d. Saturated thicknesses exceed 100 ft locally but are generally less than 40 ft.
Twenty-nine of the aquifers in the basin have areas where transmissivities exceed 2,000 ft2/d. Ten of these have areas where transmissivities exceed 4,000 ft2/d. Of the potentially productive aquifers in the Winnipesaukee River Basin, only the Merrymeeting River aquifer and the Pumping Station Brook aquifer are currently (1992) being used for a public water supply. These aquifers may not be developed to their fullest potential. Stratified-drift aquifers with the greatest potential for supply include the Gulf Brook - Gardners Grove aquifer, the Union Road aquifer, the Durkee Brook aquifer, the Gunstock River aquifer, the Ellacoya aquifer, the Hawkins Brook aquifer, the Shannon Brook aquifer, the Hersey Brook aquifer, and the Copps Pond aquifer.
Stratified-drift aquifers in Alton and Belmont were selected for an analysis of water availability. Both are among the most productive aquifers in the study area. The Merrymeeting River aquifer in Alton is hydraulically connected to a river system, and water is available for induced infiltration; the Pumping Station Brook aquifer in Belmont is hydraulically connected to a small brook, but little water is available for induced infiltration. A two-dimensional numerical flow model was used to simulate the aquifer systems. The results showed that the Merrymeeting River aquifer may be capable of supplying 0.63 to 1.1 Mgal/d and the Pumping Station Brook aquifer may be capable of supplying 1.6 to 1.8 Mgal/d, based on only one of many possible withdrawal scenarios. The analysis indicates that, for the Merrymeeting River aquifer, available drawdown is the limiting factor for water availability; however, installing wells close to the river may increase the amount of available water. For the Pumping Station Brook aquifer, the simulation showed that the available water estimate was limited by induced infiltration from the small stream to the aquifer.
Summary and Conclusions 45

Ground-water quality in water from 17 wells finished in stratified drift was generally shown to be suitable for drinking and other domestic uses. Sites of known ground-water contamination were not sampled. Water samples from wells MHW-2, GFW-11, and WRW-1 had elevated sodium concentration of 23,44, and 81 mg/L, respectively. These elevated concentrations may be a result of the proximity of the wells to highways where road salt is applied for deicing.
Water samples from 3 wells had elevated iron concentrations at 4,000 (Ag/L, 1,900 (j,g/L, and 4,400 (ig/L, respectively. Water samples from six wells had manganese concentrations that equaled or exceeded the SMCL of 50 (j,g/L (U.S. Environmental Protection Agency, 199la). The pH of water from wells in stratified drift was, in general, less than the SMCL of 6.5 established by USEPA in secondary drinking-water regulations (1992).
SELECTED REFERENCES
Ayotte J.D.,and Toppin, K.W., 1995, Geohydrology and water quality of stratified-drift aquifers in the middle Merrimack River basin, south-central New Hampshire: U.S. Geological Survey Water-Resources Investigations Report 92-4192, 52 p., 8 pis.
Bates, R.L., and Jackson, J.A., eds., 1980, Glossary of geology (2d ed.): Falls Church, Va., American Geological Institute, 751 p.
Bedinger, M.S., 1961, Relation between median grain size and permeability in the Arkansas River Valley, Arkansas, in Geological Survey Research, 1961, Short papers in the geologic and hydrologic sciences, articles 147-292: U.S. Geological Survey Professional Paper 424-C,p. C31-C32.
Billings, M.P., 1956, The geology of New Hampshire, part II bedrock geology: Concord, N.H., New Hampshire State Planning and Development Commission, 203 p.
Boudette, E.L., Canney, F.C., Cotton, I.E., Davis, R.I., and others, 1985, High levels of arsenic in the ground waters of southeastern New Hampshire a geochemical reconnaissance: U.S. Geological Survey Open-File Report 85-202, 25 p.
Bradley, Edward, 1964, Geology and ground-water resources of southeastern New Hampshire: U.S. Geological Survey Water-Supply Paper 1695, 80 p.
Chapman, D.H., 1974, New Hampshire's landscape how it was formed: New Hampshire Profiles, v. 23, no. 1, p. 41-56.
Cotton, I.E., 1975, Availability of ground water in thePemigewasset and Winnipesaukee River basins, central New Hampshire: U.S. Geological Survey Water- Resources Investigation 47-75, scale 1:125,000.
___1985, New Hampshire ground-water resources, in U.S. Geological Survey, National water summary 1984: U.S. Geological Survey Water-Supply Paper 2275, p. 303-308.
___1987, Ground-water resources of the Lamprey RiverBasin, southeastern New Hampshire: U.S. Geological Survey Water-Resources Investigations Report 84-4252, 53 p.
Davis, P.T., Thompson, W.B., Stone, B.D., Newton, R.M., Fowler, B.K., 1993, Multiple glaciations and deglaciation along a transect from Boston, Massachusetts, to the White Mountains, New Hampshire, in Cheney, J.T.,and Hepburn, J.P.,1993, Field trip guidebook for the Northeastern United States: 1993 Geological Society of America Annual Meeting and 85th Annual Intercollegiate Geological Conference, October 25-28, Boston, Mass, v. 2, p. EE-l-EE-27.
Drever, J.I., 1982, The geochemistry of natural waters: Englewood Cliffs, N.J., Prentice Hall, 388 p.
Durfor, C.N., and Becker, Edith, 1964, Public water supplies of the 100 largest cities in the United States, 1962: U.S. Geological Survey Water-Supply Paper 1812, 364 p.
Ferns, J.G., Knowles, D.B., Brown, R.H., and Stallman, R.W., 1962, Theory of aquifer tests: U.S. Geological Survey Water-Supply Paper 1536-E, p. 69-174.
Fishman, M.J., and Friedman, L.C., 1989, Methods of determination of inorganic substances in water and fluvial sediments (3rd ed.): U.S. Geological Survey Techniques of Water-Resources Investigations, book 5, chap. Al, 545 p.
Flanagan, S.M., and Stekl, P.J., 1990, Geohydrologic, ground-water-quality, and streamflow data for the stratified-drift aquifers in the lower Merrimack and coastal river basins, southeastern New Hampshire: U.S. Geological Survey Open-File Report 89-390, 130 p., 3 pis.
Folk, R.L., 1974, Petrology of sedimentary rocks: Austin, Tex., Hemphill Publishing Co., 182 p.
Franke, O.L., Reilly, T.E., and Bennett, G.D., 1987, Definition of boundary and initial conditions in the analysis of saturated ground-water flow systems an introduction: U.S. Geological Survey Techniques of Water-Resources Investigations, book 3, chap. B5,15 p.
46 Geohydrology and Water Quality of Stratified-Drift Aquifers in the Winnipesaukee River Basin, Central New Hampshire

Freeze, R.A., and Cherry, J.A., 1979, Groundwater: Englewood Cliffs, N.J., Prentice Hall, 604 p.
Goldthwait, J.W., 1925, The geology of New Hampshire: New Hampshire Academy of Science Handbook 1, 86 p.
Goldthwait, J.W., Goldthwait, Lawrence, and Goldthwait, R.P., 1951, The geology of New Hampshire, part I, surficial geology: New Hampshire State Planning and Development Commission, 83 p.
Goldthwait, R.P., 1968, Surficial geology of the Wolfeboro- Winnipesaukee area, New Hampshire: New Hampshire Department of Resources and Economic Development, 60 p.
Haeni, P.P., 1986, Application of continuous seismic- reflection methods to hydrologic studies: Ground Water, v. 24, no. 1, p. 23-31.
___1988a, Application of seismic-refraction techniques to hydrologic studies: U.S. Geological Survey Techniques of Water-Resources Investigations, book 2, chap. D2, 86 p.
___1988b, Evaluation of the continuous seismic-reflectionmethod for determining the thickness and lithology of stratified drift in the glaciated northeast in Randall, A.D., and Johnson, A.I., eds., Regional aquifer systems of the United States the northeast glacial aquifers: American Water Resources Association Monograph Series 11, p. 63-82.
Hall, F.R., 1975, Chloride in natural waters of New Hampshire: Durham, N.H., University of New Hampshire, Agricultural Experiment Station, Bulletin 504, 25 p.
Hansen, B.P., 1986, Exploration for areas suitable forground-water development, central Connecticut Valley lowlands, Massachusetts: U.S. Geological Survey Water-Resources Investigations Report 84-4106, 37 p., Ipl.
Harte, P.T., and Johnson, William, 1995, Geohydrology and water quality of stratified-drift aquifers in the Contoocook River Basin, south-central New Hampshire, with a section on Geohydrologic setting, by R.B. Moore: U.S. Geological Survey Water-Resources Investigations Report 92-4154, 72 p., 4 pis.
Harte, P.T., and Mack, T.J., 1992, Geohydrology of, and simulation of ground-water flow in, the Milford- Souhegan glacial-drift aquifer, Milford, New Hampshire: U.S. Geological Survey Water-Resources Investigations Report 91-4177, 75 p.
Heath, R.C., 1983, Basic ground-water hydrology: U.S. Geological Survey Water-Supply Paper 2220, 84 p.
Hem, J.D., 1985, Study and interpretation of the chemical characteristics of natural water (3d ed.): U.S. Geological Survey Water-Supply Paper 2254, 263 p.
Johnson, A.I., 1967, Specific yield compilation of specific yields for various materials: U.S. Geological Survey Water-Supply Paper 1662-D, 74 p.
Knott, J.F., and Olimpio, J.C., 1986, Estimation of recharge rates to the sand and gravel aquifer using environmental tritium, Nantucket Island, Massachusetts: U.S. Geological Survey Water-Supply Paper 2297, 26 p.
Koteff, Carl, 1970, Surficial geologic map of the Milford quadrangle, Hillsborough County, New Hampshire: U.S. Geological Survey Geologic Quadrangle Map GQ-881, scale 1:62,500.
Koteff, Carl, and Larsen, F.D., 1989, Postglacial uplift in western New England geologic evidence for delayed rebound, in Gregersen, S., and Basham P.W., eds., Earthquakes at north-Atlantic passive margins neotectonics and postglacial rebound: Dordrecht, The Netherlands, Kluwer Academic Publishers, p. 105-123.
Koteff, Carl, and Pessl, Fred, Jr., 1981, Systematic ice retreat in New England: U.S. Geological Survey Professional Paper 1179, 20 p.
Koteff, Carl; Robinson, G.R.; Goldsmith, Richard; and Thompson, W.B, 1993, Delayed postglacial uplift and synglacial sea levels in coastal central New England: Quaternery Research, v. 40, p. 46-54
Koteff, Carl, Stone, B.D., and Caldwell, D.W, 1984,Deglaciation of the Merrimack River Valley, southern New Hampshire, in Hanson, L.S., ed., Guidebook for the geology of the coastal lowlands, Boston to Kennebunk, Maine: New England Intercollegiate Geological Conference, 76th annual meeting, 1984, p. 381-393.
Krumbein, W.C., and Monk, G.D., 1942, Permeability as a function of the size parameters of unconsolidated sand: Transactions of the American Institute of Mineralogical and Metallurgical Engineers, v. 151, p. 153-163.
Langbein, W.B., and Iseri, K.T., 1960, Manual of hydrology, part 1, general surface-water techniques general introduction and hydrologic definitions: U.S. Geological Survey Water-Supply Paper 1541-A, 29 p.
Lapham, W.W, 1988, Yield and quality of ground water from stratified-drift aquifers, Taunton River Basin, Massachusetts: U.S. Geological Survey Water Resources Investigations Report 86-4053, 69 p., 2 pi.
Lawlor, Scan, and Mack, T.J., 1992, Geohydrologic, ground- water-quality, and streamflow data for the stratified- drift aquifers in the Bellamy, Cocheco, and Salmon Falls River Basins, southeastern New Hampshire: U.S. Geological Survey Open-File Report 89-583, 3 pi.
Selected References 47
Lohman, S.W., 1972, Ground-water hydraulics: U.S. Geological Survey Professional Paper 708,70 p.
Lohman, S.W., and others, 1972, Definitions of selected ground-water terms revisions and conceptual refinements: U.S. Geological Survey Water-Supply Paper 1988, 21 p.
Lougee, R.J., 1940, Deglaciation of New England: Journal of Geomorphology, v. 3, p. 188-217.
Lyons, J.B., Bothner, W.A., Moench, R.H., and Thompson, J.B., Jr., eds., 1986, Interim geologic map of New Hampshire: New Hampshire Department of Resources and Economic Development, Open-File Report 86-1, map, scale 1:250,000.
Lukens, J.N, 1987, The legacy of well watermethemoglobinemia: Journal of American Medical Association, v. 257, no. 20, p. 2793-2795.
Mack, T.J., and Lawlor, Sean, 1992, Geohydrology and water quality of stratified-drift aquifers in the Bellamy, Cocheco, and Salmon Falls River Basins, southeastern New Hampshire: U.S. Geological Survey Water- Resources Investigations Report 90-4161, 65 p., 6 pi.
MacNish, R.D., and Randall, A.D., 1982, Stratified-drift aquifers in the Susquehanna River Basin, New York: New York State Department of Environmental Conservation Bulletin 75, 68 p.
Masch P.O., and Denny, K.J., 1966, Grain size distribution and its effect on the permeability of unconsolidated sands: Water Resources Research, v. 2, no. 4, p. 665-677.
Mazzaferro, D.L., Handman, E.H., and Thomas, M.P., 1979, Water-resources inventory of Connecticut, part 8, Quinnipiac River Basin, Connecticut: Connecticut Water Resources Bulletin 27, 88 p., 5 pi.
McDonald, M.G., and Harbaugh, A.W, 1988, A modular three-dimensional finite-difference ground-water flow model: U.S. Geological Survey Techniques of Water- Resources Investigations, book 6, chap. Al, 586 p.
Moore, R.B., 1990, Geohydrology and water quality of stratified-drift aquifers in the Exeter, Lamprey, and Oyster River Basins, southeastern New Hampshire: U.S. Geological Survey Water-Resources Investigations Report 88-4128, 61 p., 8 pis.
Moore, R.B., 1995, Geohydrologic setting in Harte, P.T. and Johnson, William, Geohydrology and water quality of stratified-drift aquifers in the Contoocook River Basin, south-central New Hampshire: U.S. Geological Survey Water-Resources Investigations Report 92-4154, p 10-15.
Moore, R.B., Johnson, C.D., and Douglas, E. M., 1994, Geohydrology and water quality of stratified-drift aquifers in the lower Connecticut River Basin, southwestern New Hampshire: U.S. Geological Survey Water-Resources Investigations Report 92-4013, 68 p., 4 pis.
Morgan, Diana, 1985, A surficial aquifer delineation and water use survey for the town of Moultonborough, New Hampshire: Durham, N.H., University of New Hampshire, unpublished Master's thesis, 62 p.
Morrissey, D.J., 1983, Hydrology of the Little Androscoggin River Valley aquifer, Oxford County, Maine: U.S. Geological Survey Water-Resources Investigations Report 83-4018, 79 p., 8 pis.
___1988, New Hampshire ground-water quality, in U.S. Geological Survey, National water summary 1986: U.S. Geological Survey Water-Supply Paper 2325, p. 363-368.
Morrissey, D.J., Haeni, F.P., and Tepper, D.H., 1985,Continuous seismic-reflection profiling of a glacial-drift deposit on the Saco River, Maine and New Hampshire, in National Water Well Association, Proceedings of the Association of Ground Water Scientists and Engineers, Eastern Regional Ground Water Conference: Worthington, Ohio, Water Well Journal Publishing Co., p. 277-296.
Morrissey, D.J., Randall, A.D., and Williams, J.H., 1988, Upland runoff as a major source of recharge to stratified drift in the glaciated northeast, in Randall, A.D., and Johnson, A.I., eds., Regional aquifer systems in the United States the northeast glacial aquifers: American Water Resources Association Monograph series 11, p. 17-36.
Morrissey, D.J., and Regan, J.M., 1987, New Hampshire ground-water quality: U.S. Geological Survey Open- File Report 87-0739, 8 p.
New Hampshire Department of Environmental Services, Water Supply Engineering Bureau, 1990, Water-quality standards: Chap. Env-WS 310-319, 19 p.
New Hampshire Department of Environmental Services, Water Supply and Pollution Control Commission, 1973, Merrimack River Basin water quality management plan: Staff Report 61, 62 p.
___1982a, Inventory of ground water and surface water potential nonpoint pollution sources: 75 p.
___1982b, Public water supplies, facilities and policy summary 1981: 44 p.
___1984, Drinking water regulations: Chap. Ws 300,85 p.
48 Geohydrology and Water Quality of Stratified-Drift Aquifers in the Winnipesaukee River Basin, Central New Hampshire
New Hampshire Department of Environmental Services, Water Supply and Pollution Control Commission and U.S. Environmental Protection Agency, 1971, Water- quality standards summary (New Hampshire): Water Supply and Pollution Control Commission, 91 p.
New Hampshire Office of State Planning, 1985, NewHampshire population projections for cities and towns: 19 p.
Olimpio, J.C., and de Lima, Virginia, 1984, Ground-water resources of the Mattapoisett River Valley, Plymouth County, Massachusetts: U.S. Geological Survey Water- Resources Investigations Report 84-4043, 83 p.
Olney, S.L., 1983, An investigation of the relationship between the coefficient of permeability and effective grain size of unconsolidated sands: Boston, Mass., Boston University, unpublished Master's thesis, 61 p.
Pettyjohn, W.A., Studlick, J.R., Bain, R.C., and Lehr, J.H., 1979, A ground-water quality atlas of the United States: National Water Well Association for National Demonstration Water Project, 272 p.
Pluhowski, E.J., and Kantrowitz, I.H., 1964, Hydrology of the Babylon-Islip area, Suffolk County, Long Island, New York: U.S. Geological Survey Water-Supply Paper 1768, 119 p.
Randall, A.D., 1978, Infiltration from tributary streams in the Susquehanna River Basin, New York: U.S. Geological Survey Journal of Research, v. 6, no. 3, p. 285-297.
Randall, A.D., and Johnson, A.I., eds., 1988, Regional aquifer systems of the United States the northeast glacial aquifers: American Water Resources Association Monograph Series 11, 156 p.
Reynolds, R.J., and Williams, J.H., 1988, Continuous seismic-reflection profiling of glacial drift along the Susquehanna, Chemung, and Chenango Rivers, south- central New York and north-central Pennsylvania, in Randall, A.D., and Johnson, A.I., eds., Regional aquifer systems of the United States the northeast glacial aquifers: American Water Resources Association Monograph Series 11, p. 83-103.
Scott, J.H., Tibbetts, B.L., and Burdick, R.G., 1972, Computer analysis of seismic-refraction data: U.S. Bureau of Mines Report of Investigations RI7595, 95 p.
Stekl, P.J., and Flanagan, S.M., 1992, Geohydrology and water quality of stratified-drift aquifers in the lower Merrimack and coastal river basins, southeastern New Hampshire: U.S. Geological Survey Water-Resources Investigations Report 90-4025, 75 p., 7 pis.
Tepper, D.H., Morrissey, D.J., Johnson, C.J., and Maloney, T.J., 1990, Hydrogeology, water quality, and effects of increased municipal pumpage on the Saco River Valley glacial aquifer, Bartlett, New Hampshire to Fryeburg, Maine: U.S. Geological Survey Water-Resources Investigations Report 88-4179, 113 p.
Theis, C.V., 1935, Relation between the lowering of the piezometric surface and the rate and duration of discharge of a well using ground-water storage: American Geophysical Union Transcript, pt. 2, p. 519-524
___1938, The significance and nature of the cone ofdepression in ground-water bodies: Economic Geology, v. 33, no. 8, p. 889-902.
___1963, Estimating the transmissibility of a water-tableaquifer from the specific capacity of a well, in Bentall, Ray, compiler, Methods of determining permeability, transmissibility, and drawdown: U.S. Geological Survey Water-Supply Paper 1536-1, p. 332-336.
Todd, D.K., 1980, Groundwater hydrology (2d ed.): New York, John Wiley and Sons, 535 p.
Toppin, K.W., 1987, Hydrogeology of stratified-drift aquifers and water quality in the Nashua Regional Planning Commission area, south-central New Hampshire: U.S. Geological Survey Water-Resources Investigations Report 86-4358, 45 p., 6 pis.
Toppin, K.W, McKenna, K.E., Cotton, J.C., and Denner, J.C., 1992, Water resources data, New Hampshire and Vermont, water year 1991: U.S. Geological Survey Water-Data Report NH-VT-91-1, 158 p.
Trescott, PC., Pinder, G.F., and Larson, S.P, 1976, Finite- difference model for aquifer simulation in two- dimensions with results of numerical experiments: U.S. Geological Survey Techniques of Water-Resources Investigations, book 7, chap. Cl, 116 p.
Upham, Warren, 1897, Modified drift in New Hampshire, in Hitchcock, C.H., ed., Geology of New Hampshire: Concord, N.H., v. 3, part II, 740 p.
U.S. Army Corps of Engineers, 1980, Magnitude andfrequency of low streamflows in New Hampshire: U.S. Department of the Army, 70 p.
U.S. Bureau of the Census, 1990, 1990 census of population and housing, New Hampshire: U.S. Department of Commerce, CPH-1-31, 65 p.
U.S. Environmental Protection Agency, 199la, Final rule, National primary and secondary drinking water regulations Synthetic organic chemicals and inorganic chemicals (sections 141.11, 141.12, 141.32, 141.50, 141.51, 141.61, and 141.62 of part 141 and 143.3 of part 143): U.S. Federal Register, v. 56, no. 20, January 30, 1991, p. 3526-3597.
Selected References 49

U.S. Environmental Protection Agency, 1991b, Final rule, Maximum contaminant level goals and national primary drinking water regulations for lead and copper (sections 141.11, 141.32, and 141.51 of part 141): U.S. Federal Register, v. 56, no. 110, June 7, 1991, p. 26,460-26,564.
___1992, Final rule, National primary and secondary drinking-water regulations Synthetic organic chemicals and inorganic chemicals (sections 141.12, 141.32, 141.50, 141.51, 141.61, and 141.62 of part 141 and 143.3 of part 143): U.S. Federal Register, v. 57, no. 138, July 17, 1992, p. 31,776-31,849.
U.S. Geological Survey, 1989, Subsurface-water flow and solute transport Federal glossary of selected terms: Prepared by the Subsurface-Water Glossary Working Subcommittee, Interagency Advisory Committee on Water Data [38 p.].
U.S. Soil Conservation Service, 1968, Soil survey ofBelknap County, New Hampshire: U.S. Department of Agriculture, 68 p.
___1973, Soil survey of Strafford County, NewHampshire: U.S. Department of Agriculture, 96 p.
___1977, Soil survey of Carroll County, New Hampshire:U.S. Department of Agriculture, 161 p. _1985, Soil survey of Merrimack County, NewHampshire: U.S. Department of Agriculture, 141 p.
Weigle, J.M., 1968, Ground-water resources of the lower Merrimack River Valley, south-central New Hampshire: U.S. Geological Survey Hydrologic Investigations Atlas HA-277, scale 1:62,500.
Weigle, J.M., and Kranes, Richard, 1966, Records ofselected wells, springs, test holes, materials tests, and chemical analyses of water in the lower Merrimack River Valley, New Hampshire: U.S. Geological Survey Open-File Report, New Hampshire Basic-Data Report 2, 44 p.
White, G.W, 1938, Geology of the Merrimack Watershed, in Hoover, E.E., Biological survey of the Merrimack Watershed: New Hampshire Fish and Game Survey Report3, p. 136- 148.
Wiltshire, D.A., Lyford, P.P., and Cohen, A.J., 1986, Bibliography on ground water in glacial-aquifer systems in the northeastern United States: U.S. Geological Survey Circular 972, 26 p.
GLOSSARY
Ablation Till: Loosely consolidated rock debris, formerly carried by glacial ice, that accumulated in places as the surface ice was removed by melting, evaporation, or other processes.
Aquifer: A geologic formation, group of formations, or part of a formation that contains sufficient saturated permeable materials to yield significant quantities of water to wells and springs. Where water only partly fills an aquifer, the upper surface of the saturated zone is free to rise and decline.
Aquifer boundary: A geologic or hydrologic feature that limits the extent of an aquifer.
Bedrock: Solid rock, locally called "ledge," that forms the earth's crust. It may be exposed at the surface but more commonly is buried beneath a few inches to more than 100 feet of unconsolidated deposits.
Confined aquifer: An aquifer saturated with water and bounded above and below by material having a distinctly lower hydraulic conductivity than the aquifer itself.
Contact: A plane or irregular surface between two different types or ages of rocks or unconsolidated sediments.
Cubic feet per second (ft /s): A unit expressing rate of discharge. One cubic foot per second is equal to the discharge of a stream 1 foot wide and 1 foot deep flowing at an average velocity of 1 foot per second.
Cubic feet per second per square mile [(ft3/s)/mi2]: A unit expressing average number of cubic feet of water flowing per second from each square mile of area drained.
Darcy's Law: An equation relating the factors controlling ground-water flow. Darcy's law is Q = KA (dh/dl), where Q is the quantity of water per unit of time; K is the hydraulic conductivity, which depends on the size and arrangement of the water-transmitting openings (pores and fractures) and on the dynamic characteristics of the fluid (water) such as kinematic viscosity, density, and the strength of the gravitational field; A is the cross-sectional area, at a right angle to the flow direction, through which the flow occurs; and dh/dl is the hydraulic gradient.
Deposit: Earth material that has accumulated by natural processes.
50 Geohydrology and Water Quality of Stratified-Drift Aquifers in the Winnipesaukee River Basin, Central New Hampshire

Dissolved solids: The residue from a clear sample of waterafter evaporation and drying for 1 hour at 180°C;consists primarily of dissolved mineral constituents, butmay also contain organic matter and water ofcrystallization.
Drainage area: The area or tract of land, measured in ahorizontal plane, that gathers water and contributes itultimately to some point on a stream channel, lake,reservoir, or other water body.
Drawdown: The lowering of the water table orpotentiometric surface caused by the withdrawal ofwater from an aquifer by pumping; equal to thedifference between the static water level and thepumping water level.
Effective grain size: The grain size at which 10 percent ofthe sample consists of smaller grains and 90 percentconsists of larger grains.
Esker: A long ridge of sand and gravel that was depositedby water flowing in tunnels within or beneath glacialice.
Flow duration (of a stream): The percentage of time duringwhich specified daily discharges are equaled orexceeded within a given time period.
Fluvial: Pertaining to the flow of liquid water in the naturalenvironment.
Fluviolacustrine: Pertaining to sedimentation partly in lakesand partly in streams or to sediments deposited underalternating or overlapping lacustrine and fluvialconditions
Fracture: A break, crack, or opening in bedrock alongwhich water may move.
Glacial lake: A lake containing water largely from themelting of glaciers. In this study area, it refers to areaswhere such lake water was dammed by localtopographic or geomorphic features.
Glaciofluvial: Pertaining to the flow of meltwater streamsfrom glacial ice and to the deposits associated withstreams, including kames, kame terraces, and outwash.
Glaciolacustrine: Deposits in glacial lakes, especiallydeposits such as deltas and varved sediments,composed of material deposited by meltwater streamsflowing into lakes adjacent to and (or) near the glacier.
Gneiss: A coarse-grained metamorphic rock with alternatingbands of granular and micaceous minerals.
Granite: A coarse-grained, light colored, igneous rock.
Gravel: Unconsolidated rock debris composed principally of particles larger than 2 millimeters in diameter.
Ground water: Water in the saturated zone that is under pressure equal to or greater than atmospheric pressure.
Ground-water discharge: The discharge of water from the saturated zone by (1) natural processes such as ground- water seepage into stream channels and ground-water evapotranspiration and (2) discharge through wells and other manmade structures.
Ground-water divide: A hypothetical line on a water table on each side of which the water table slopes downward in a direction away from the line. In the vertical dimension, a plane across which ground water does not flow.
Ground-water recharge: Water that is added to the saturated zone of an aquifer.
Ground-Water Site Inventory (GWSI): A computerized file maintained by the U.S. Geological Survey that contains information about wells and springs collected throughout the United States.
Head, static: The height of the surface of a water column above a standard datum that can be supported by the static pressure of a given point.
Hydraulic conductivity (K): A measure of the ability of a porous medium to transmit a fluid that can be expressed in unit length per unit time. A material has a hydraulic conductivity of 1 foot per day if it will transmit in 1 day, 1 cubic foot of water at the prevailing kinematic viscosity through a 1 foot square cross section of aquifer, measured at right angles to the direction of flow, under a hydraulic gradient of 1 foot change in head over 1 foot length of flow path.
Hydraulic gradient: The change in static head per unit of distance in a given direction. If not specified, the direction is generally understood to be that of the maximum rate of decrease in head.
Hydrograph: A graph showing stage (height), flow velocity, or other property of water with respect to time.
Ice-contact deposits: Stratified drift deposited in contact with melting glacial ice. Landforms include eskers, kames, kame terraces, and grounding-line deltas.
Igneous: Descriptive term for rocks or minerals solidified from molten or partially molten material (that is, from a magma) such as basalt or granite.
Glossary 51

Induced infiltration: The process by which water infiltrates an aquifer from an adjacent surface-water body in response to ground-water withdrawal from that aquifer.
Kame: A ridge, mound, or hummock that may be irregular and is composed of stratified sand and gravel deposited by glacial meltwater; the precise mode of formation is uncertain.
Kame terrace: A ridge consisting of stratified sand and gravel deposited in a glaciofluvial environment between a melting glacier or stagnant ice lobe and a higher valley wall. The deposit has a terrace appearance after the ice has left the area.
Lacustrine: Pertaining to lake environments. In this report, it refers to areas associated with glacial lake environments.
Lodgement till: A firm, compact clay-rich till deposited beneath a moving glacier, containing abraded stones oriented, in general, with their long axes parallel to the direction of ice movement.
Mean (arithmetic): The sum of the individual values of a set, divided by their total number; also referred to as the "average."
Median: The middle value of a set of measurements that are ordered from lowest to highest; 50 percent of the measurements are lower than the median and 50 percent are higher.
Metamorphic: Descriptive term for rocks such as gneiss and schist that have formed, in the solid state, from other rocks.
Micrograms per liter (|ig/L): A unit expressing theconcentration of chemical constituents in solution as the mass (micrograms) of a constituent per unit volume (liter) of water. One thousand micrograms per liter is equivalent to one milligram per liter.
Milligrams per liter (mg/L): A unit for expressing theconcentration of chemical constituents in solution as the mass (milligrams) of a constituent per unit volume (liter) of water.
Morphosequence: A continuum of time-equivalentlandforms composed of meltwater deposits from more collapsed forms as a result of melting of ice blocks at the head or upstream parts of outwash to progressively less collapsed forms downstream. A sequence can thus be viewed as a body of stratified drift laid down, layer upon layer, by meltwater at and beyond the margin of a glacier.
Outwash: Stratified deposits chiefly of sand and gravel removed or "washed out" from a glacier by meltwater streams and deposited beyond the margin of a glacier, usually found in flat or gently sloping outwash plains.
Outwash deltas: Deltas formed beyond the margin of the glacier where glacial meltwater entered a water body.
pH: The negative logarithm of the hydrogen ionconcentration. A pH of 7.0 indicates neutrality; values below 7.0 denote acidity, and those above 7.0 denote alkalinity.
Phi grade scale: A logarithmic transformation of theWentworth grade scale based on the negative logarithm to the base 2 of the particle diameter, in millimeters.
Porosity: The property of a rock or unconsolidated deposit that is a measure of the size and number of internal voids or open spaces; it may be expressed quantitatively as the ratio of the volume of its open spaces to its total volume.
Precipitation: The discharge of water from the atmosphere, either as a liquid or a solid.
Quartzite: A metamorphic rock consisting mainly of quartz and formed by recrystallization of quartz.
52 Geohydrology and Water Quality of Stratified-Drift Aquifers in the Winnipesaukee River Basin, Central New Hampshire

Runoff: That part of the precipitation that appears in streams. It is the same as streamflow unaffected by artificial diversions, storage, or other human activities in or on the stream channels.
Saturated thickness (of stratified drift): Thickness of
stratified drift extending down from the water table to the till or bedrock surface.
Saturated zone: The subsurface zone in which all open (interconnected) spaces are filled with water. Water below the water table, the upper limit of the saturated zone, is under pressure greater than atmospheric.
Schist: A metamorphic rock with subparallel orientation of the visible micaceous minerals, which dominate its composition.
Sediment: Fragmental material that originates fromweathering of rocks. It can be transported by, suspended in, or deposited by water.
Slate: A compact, fine-grained platey metamorphic rock formed from shale.
Specific capacity (of a well): The rate of discharge of water divided by the corresponding drawdown of the water level in the well; stated in this report in gallons per
minute per foot [(gal/min)/ft].Specific yield: The ratio of the volume of water that a rock
or soil will yield, by gravity drainage, after being saturated to the total volume of the rock or soil.
Standard deviation: A measure of the amount of variability within a sample; it is the square root of the average of
the squares of the deviations about the arithmetic mean of a set of data.
Storage coefficient: The volume of water an aquifer releasesfrom or takes into storage per unit surface area of theaquifer per unit change in head. In an unconfinedaquifer, the storage coefficient is virtually equal to thespecific yield.
Stratified drift: Sorted and layered unconsolidated materialdeposited in meltwater streams flowing from glaciers orsettled from suspension in quiet-water bodies fed bymeltwater streams.
Surficial geology: The study of or distribution ofunconsolidated deposits at or near the land surface.
Till: A predominantly nonsorted, nonstratified sedimentdeposited directly by a glacier and composed ofboulders, gravel, sand, silt, and clay mixed in variousproportions.
Transmissivity: The rate at which water is transmittedthrough a unit width of aquifer under a unit hydraulicgradient. Equal to the average hydraulic conductivitytimes the saturated thickness.
Unconfined aquifer (water-table aquifer): An aquifer onlypartly filled with water. In such aquifers,the water tableor upper surface of the saturated zone is at atmosphericpressure and is free to rise and fall.
Unsaturated zone: The zone between the water table andthe land surface in which the open spaces are notcompletely filled with water.
Water availability: An amount of water potentiallyavailable for water supply; in this report, it refers towater wells.
Water table: The upper surface of the saturated zone. Waterat the water table is at atmospheric pressure.
Glossary 53
SS

APPENDIX A. Description of selected wells, borings,and springs in the Winnipesaukee River Basin,
central New Hampshire
S7
Table A-l. Description of selected wells, borings, and springs in the Winnipesaukee River Basin, central New Hampshire
Local Site number: First two characters are U.S. Geological Survey town code. Third-character codes are the
following: A, auger hole; B, highway bridge boring; S, spring; W, well. The numbers are sequential numbers for each town.
Latitude, longitude: Accurate within 5 seconds.
Owner: NHDOT, New Hampshire Department of Transportation; Indus, Industry; Assoc, Association; Const, Construction; Vill, village; Bldrs, Builders; Corp, corporation; Mtn View Ter, Mountain View Terrace; Co., company; Rte, route; Const Deve, construction developer; Aqu., Aqueduct; ENVDrilling, Environmental Drilling.
Elevation: Elevations are expressed in feet above National Geodetic Vertical Datum of 1929: Those in whole feet are interpolated from U.S. Geological Survey topographic maps and are accurate to plus or minus half the contour interval of the map (5 to 10 feet); those in tenths of feet are instrumentally determined.
Depth tO bottom Of casing: Depth to the bottom of casing, in feet below land-surface datum (for wells where "Primary aquifer code" is BEDROCK, the depth to the bottom of casing can be used to indicate the depth to the bedrock surface).
Casing-material COde: P, Polyvinyl choloride or plastic; S, steel; R, rock or stone.
Type Of finish: G, Gravel Pack; S, screen; W.'Walled; X, open hole; Z, other.Type of site: Bor, Boring; BrW, Bedrock well; Cbl, cable tool; Dug, dug; Dvn, Driven; TH, Test hole; Sp, spring
Water level: Water level, in feet below land-surface datum; mm-dd-yy is month-day-year.Use: Use-of-water codes are the following: C, commercial; H, domestic; P, public; N, industrial; T, institutional; U, unused; Z,other.
Yield: Discharge in gallons per minute (gal/min).Specific capacity: In gallons per minute.Pumping period: The length of time, in hours, that the well was pumped prior to the measurements of production.
Name of driller or New Hampshire Water Resources Division driller number: NH HWY DEPT,New Hampshire Highway Department; NHWRD, New Hampshire Water Resources Division; USGS, U.S. Geological Survey, Soil Expl., Soil Exploration.
Appendix A 57
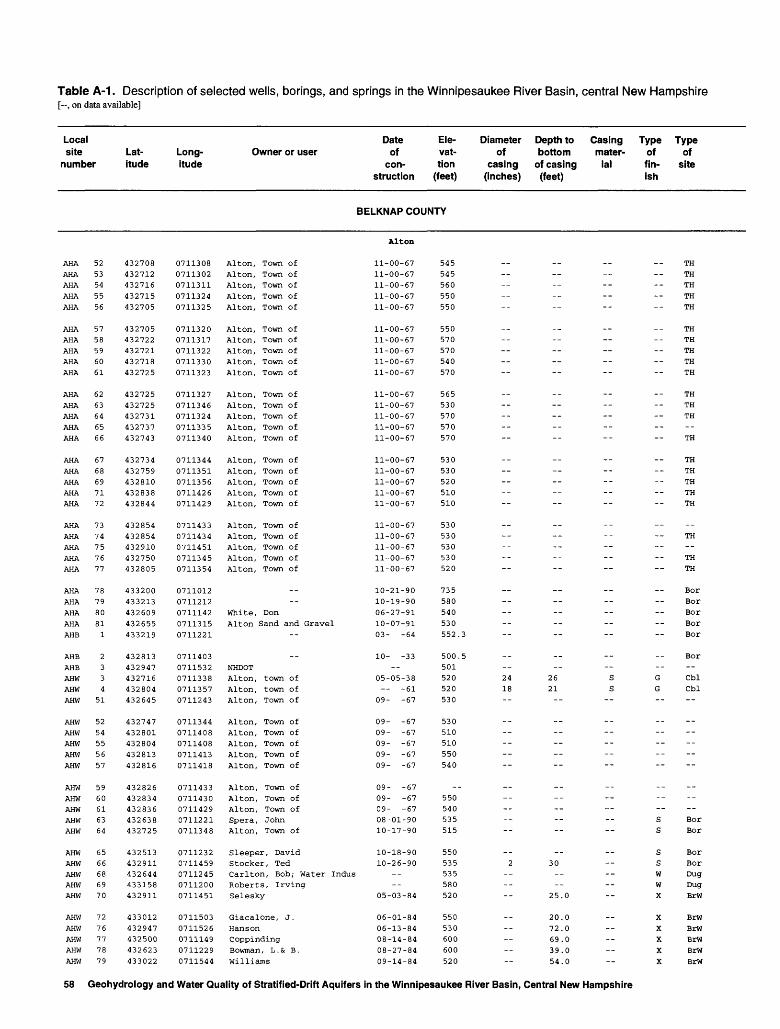
Table A-1. Description of selected wells, borings, and springs in the Winnipesaukee River Basin, central New Hampshire[--, on data available]
Localsitenumber
Latitude
Longitude
Owner or userDateofcon
struction
Ele- Diameter Depth tovat- of bottomtion casing of casing
(feet) (inches) (feet)
Casing Typemater- ofial fin
ish
Typeof
site
BELKNAP COUNTY
AHA
AHA
AHA
AHA
AHA
AHA
AHA
AHA
AHA
AHA
AHA
AHA
AHA
AHA
AHA
AHA
AHA
AHA
AHA
AHA
AHA
AHA
AHA
AHA
AHA
AHA
AHA
AHA
AHA
AHB
AHB
AHB
AHW
AHW
AHW
AHW
AHW
AHW
AHW
AHW
AHW
AHW
AHW
AHW
AHW
AHW
AHW
AHW
AHW
AHW
AHW
AHW
AHW
AHW
AHW
52
53
54
55
56
57
58
596061
6263646566
6768697172
7374757677
787980811
2334
51
5254555657
5960616364
6566686970
7276777879
432708432712432716432715432705
432705432722432721432718432725
432725432725432731432737432743
432734432759432810432838432844
432854432854432910432750432805
433200433213432609432655433219
432813432947432716432804432645
432747432801432804432813432816
432826432834432836432638432725
432513432911432644433158432911
433012432947432500432623433022
07113080711302071131107113240711325
07113200711317071132207113300711323
07113270711346071132407113350711340
07113440711351071135607114260711429
07114330711434071145107113450711354
07110120711212071114207113150711221
07114030711532071133807113570711243
07113440711408071140807114130711418
07114330711430071142907112210711348
07112320711459071124507112000711451
07115030711526071114907112290711544
Alton, Town ofAlton, Town ofAlton, Town ofAlton, Town ofAlton, Town of
Alton, Town ofAlton, Town ofAlton, Town ofAlton, Town ofAlton, Town of
Alton, Town ofAlton, Town ofAlton, Town ofAlton, Town ofAlton, Town of
Alton, Town ofAlton, Town ofAlton, Town ofAlton, Town ofAlton, Town of
Alton, Town ofAlton, Town ofAlton, Town ofAlton, Town ofAlton, Town of
__--
White, DonAlton Sand and Gravel
--
__
NHDOT
Alton, town ofAlton, town ofAlton, Town of
Alton, Town ofAlton, Town ofAlton, Town ofAlton, Town ofAlton, Town of
Alton, Town ofAlton, Town ofAlton, Town ofSpera , JohnAlton, Town of
Sleeper, DavidStocker, TedCarlton, Bob; Water IndusRoberts, IrvingSelesky
Giacalone, J.HansonCoppindingBowman, L.& B.Williams
Alton
11-00-6711-00-6711-00-6711-00-6711-00-67
11-00-6711-00-6711-00-6711-00-6711-00-67
11-00-6711-00-6711-00-6711-00-6711-00-67
11-00-6711-00-6711-00-6711-00-6711-00-67
11-00-6711-00-6711-00-6711-00-6711-00-67
10-21-9010-19-9006-27-9110-07-9103- -64
10- -33--
05-05-38-- -61
09- -67
09- -6709- -6709- -6709- -6709- -67
09- -6709- -6709- -6708-01-9010-17-90
10-18-9010-26-90
;
05-03-84
06-01-8406-13-8408-14-8408-27-8409-14-84
545545560550550
550570570540570
565530570570570
530530520510510
530530530530520
735580540530552.3
500.5501520 24 26520 18 21530
530510510550540
__
550540535515
550535 2 30535580520 -- 25.0
550 -- 20.0530 -- 72.0600 -- 69.0600 -- 39.0520 -- 54.0
____--
-- __
__------
__-- --
____----
------
--S G
S G
__
--
--
--
__
--
S
S
S
S
wwX
X
X
X
X
X
TH
TH
TH
TH
TH
TH
TH
TH
TH
TH
TH
TH
TH--
TH
TH
TH
TH
TH
TH
__
TH--
TH
TH
BorBorBorBorBor
Bor--CblCbl
__------
--
BorBor
BorBorDugDugBrW
BrwBrWBrwBrwBrw
58 Geohydrology and Water Quality of Stratified-Drift Aquifers in the Winnipesaukee River Basin, Central New Hampshire
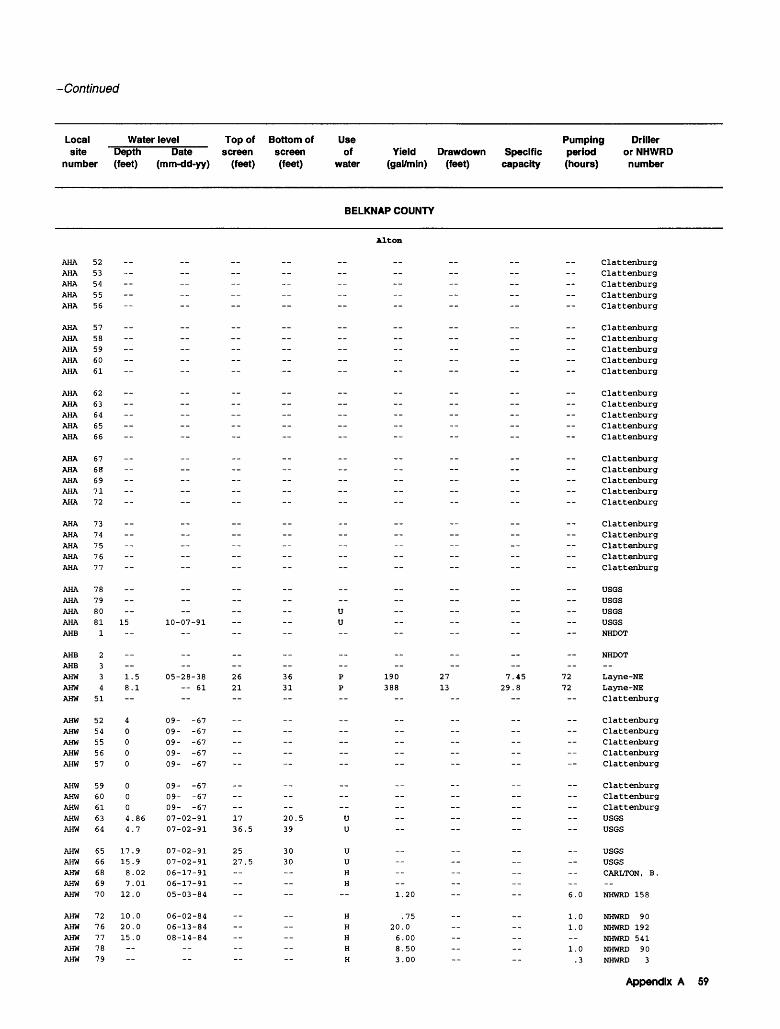
-Continued
Localsite
Water level Top of Bottom of
numberDepth(feet)
Date screen screen(mm-dd-yy) (feet) (feet)
Use Pumping Drillerof Yield Drawdown Specific period or NHWRD
water (gal/min) (feet) capacity (hours) number
BELKNAP COUNTY
AHA
AHA
AHA
AHA
AHA
AHA
AHA
AHA
AHA
AHA
AHA
AHA
AHA
AHA
AHA
AHA
AHA
AHA
AHA
AHA
AHA
AHA
AHA
AHA
AHA
AHA
AHA
AHA
AHA
AHB
AHB
AHB
AHW
AHW
AHW
AHW
AHW
AHW
AHW
AHW
AHW
AHW
AHW
AHW
AHW
AHW
AHW
AHW
AHW
AHW
AHW
AHW
AHW
AHW
AHW
52
53
54
55
56
57
58
59
60
61
62
63
64
65
66
67
68
69
71
72
73
74
75
76
77
78
79
80
81
1
2
3
3
4
51
52
54
55
56
57
59
60
61
63
64
65
66
68
69
70
72
76
77
78
79
-- --
-_------
-- --
-- --
----
__----
15--
--
1.5
8.1
4
0
0
0
0
0
0
0
4.86
4.7
17.9
15.9
8.02
7.01
12.0
10.0
20.0
15.0
--
-- __
--------
-- --
-- --
____
______
10-07-91
--
__
__
05-28-38 26 36
61 21 31
09- -67
09- -67
09- -67
09- -67
09- -67
09- -67
09- -67
09- -67
07-02-91 17 20.5
07-02-91 36.5 39
07-02-91 25 30
07-02-91 27.5 3006-17-91
06-17-91
05-03-84
06-02-84
06-13-84
08-14-84
__
Alton
ClattenburgClattenburgClattenburgClattenburgClattenburg
ClattenburgClattenburgClattenburgClattenburgClattenburg
ClattenburgClattenburgClattenburgClattenburgClattenburg
ClattenburgClattenburgClattenburgClattenburgClattenburg
ClattenburgClattenburgClattenburgClattenburgClattenburg
USGSUSGS
U -- -- -- USGSU -- -- -- -- USGS
NHDOT
NHDOT__
P 190 27 7.45 72 Layne-NE
P 388 13 29.8 72 Layne-NEClattenburg
ClattenburgClattenburgClattenburgClattenburgClattenburg
ClattenburgClattenburgClattenburg
U -- -- -- -- USGSU -- -- -- -- USGS
U -- -- -- USGSU -- -- -- -- USGS
H CARLTON, B.
H
1.20 -- -- 6.0 NHWRD 158
H .75 1.0 NHWRD 90
H 20.0 1.0 NHWRD 192
H 6.00 NHWRD 541
H 8.50 -- 1.0 NHWRD 90
H 3.00 -- -- .3 NHWRD 3
Appendix A 59

Table A-1. Description of selected wells, borings, and springs in the Winnipesaukee River Basin, central New Hampshire
Local site number
Lat itude
Long itude
Owner or userDate of con
struction
Ele- vat- tion
(feet)
Diameter Depth to Casing of bottom mater-
casing of casing ial (inches) (feet)
Type of fin ish
Type of
site
BELKNAP COUNTY
Alton-Continued
AHW
AHW
AHW
AHW
AHW
AHW
AHW
AHW
AHW
AHW
AHW
AHW
AHW
AHW
AHW
AHW
AHW
AHW
AHW
AHW
AHW
AHW
AHW
AHW
AHW
AHW
AHW
AHW
AHW
AHW
AHW
AHW
AHW
AHW
AHW
AHW
AHW
AHW
AHW
AHW
AHW
AHW
AHW
AHW
AHW
AHW
AHW
AHW
AHW
AHW
AHW
AHW
AHW
AHW
83
92
94
97
99
100
101
107
119
123
126
131
142
144175
189190196206211
213228243244245
254262264265266
111281282283284
291292293294295
297306309311313
321327334340350
357361362364
432549433205433018432536433038
432510432512432628432513432919
432537432951433009432558432522
432835432940432643432937432916
432509433257432922433007432952
432644433242432909432909432336
432537432942432939432937432940
433020433018433019432521433007
432916433147433021432530432520
432559432915432957432522433030
432835433028433026432452
07114580711121071150607112330711451
07112350711219071123107112390711455
07114490711531071144507112270711339
07114020711522071114307115200711453
07112240711818071150407114460711548
07112240711203071150807115100711259
07112190711517071151307115140711517
07114290711436071143107113450711440
07114590711141071143907114170711334
07112290711502071153507113510711553
0711429071143707114360711218
Alden Jr.True, G.Niconchuk, A.Barbarosa, S.Tanguay, R.
Tuck, J.Lamper , F .Carr, D.Morse, D.Sanborn, S.
Crampoli, A.BourgaultSaunders , R .Chapman , C .Bar ret t, A.
Roberts, E.Burke, M.Moore, K.Bill, K.Bristol, D.
Stevens , C .Benard, R.Young, W.Davis, R.Bates, B.
Huss, S.Tyler, M.Lomband, L.Nickerson, G.Miele, J.
Northern Land TradersLarsenTDF CorpGreerTDF Corp
Webb, W.Kidney, C.Gray, N.GussmanLundy, F.
Anctil, B.& L. Clifford, P.Harris, W.Portique, H.Zerro, J.
Cornelissen, M.Stark, R.Morse, F.Hunter, S.Royhall, J.
Newton , H .Jones , B .Boody, L.Dube , J .
10-29-8405-12-8402-18-8412-21-8406-19-84
08-07-8401-05-8505-08-8506-28-8507-26-85
09-11-8503-06-8604-20-8605-07-8606-20-87
11-06-8608-22-8608-14-8711-08-8710-19-87
05-21-8705-07-8706-19-8806-27-8807-01-88
06-17-8808-29-8809-02-8809-26-8811-29-88
12-07-8811-20-8702-01-8802-02-8801-31-88
04-12-8904-10-8904-06-8912-14-8805-22-89
06-16-8908-29-8907-24-8906-04-8910-12-89
12-07-8903-27-9006-07-9008-10-9006-03-90
10-07-9010-04-9010-08-9001-18-91
660710530540570
540560570540550
620520540570580
520560620550560
540515520520530
530640580590660
540540530520540
590580590580560
540660570580580
580530520590540
530580580600
41.74.20.30.11.
13457.
--
1.62.
13.51.84.39.45.
51.50.22.27.71.
69.59.34.39.40.
61.10059.23.73.
86.83.69.66.99.
39.39.
00000
-_
0
00
00000
00000
00000
0--
000
00000
00
39.042.066.0
69.039.039.025.034.0
59.080.049.019.043.0
203949
124
.0
.0
.0--
X
X
X
X
X
X--X--X
X
X
X
X
X
X
X
X
X
X
X
X
X
X
X
X
X
X
X
X
X
X
X
X
X
X
X
X
X
X
X
X
X
X
X
X
X
X
X
X
X
X
X
X
BrWBrWBrWBrWBrW
BrW--
BrWDugBrW
BrWBrWBrWBrWBrW
BrWBrWBrWBrWBrW
BrWBrWBrWBrWBrW
BrWBrWBrWBrWBrW
BrWBrWBrWBrWBrW
BrWBrWBrWBrWBrW
BrWBrWBrWBrWBrW
BrWBrWBrWBrWBrW
BrWBrWBrWBrW
60 Geohydrology and Water Quality of Stratified-Drift Aquifers in the Winnipesaukee River Basin, Central New Hampshire

-Continued
Localsite
number
Water level Top of Bottom ofDepth (feet)
Date screen screen (mm-dd-yy) (feet) (feet)
Use of
water
Pumping Driller Yield Drawdown Specific period or NHWRD
(gal/min) (feet) capacity (hours) number
BELKNAP COUNTY
Alton-Continued
AHWAHWAHWAHW
AHW
AHW
AHW
AHW
AHW
AHW
AHW
AHW
AHW
AHW
AHW
AHW
AHW
AHW
AHW
AHW
AHW
AHW
AHW
AHW
AHW
AHW
AHW
AHW
AHW
AHW
AHW
AHW
AHW
AHW
AHW
AHW
AHW
AHW
AHW
AHW
AHW
AHW
AHW
AHW
AHW
AHW
AHW
AHW
AHW
AHW
AHW
AHW
AHW
AHW
83
92
94
97
99
100
101
107
119
123
126131142144175
189190196206211
213228243244245
254262264265266
277281282283284
291292293294295
297306309311313
321327334340350
357361362364
__20.18.15.12.
17.
18.35.2 .
35.
6.
25.
15.
__
20.--
30.50.
__--
2.--
__
10.54.27.--
__ --
__------
45.
__
41.--
5.--
5.30.----
19.
21.----
20.
0000
00000
0
0
0
0
00
0
000
0
0
0
00
0
0
0
__05-12-8402-18-8412-21-8406-19-84
08-07-8401-07-8505-08-8506-30-8507-26-85
09-12-85
04-20-86__
06-20-87
__08-22-86
__11-08-8710-19-87
__ ____
06-19-88__
__08-31-8809-02-8809-26-88
--
_ __
______
05-22-89
__08-29-89
__06-04-89
--
12-08-8903-27-90
__
06-03-90
10-07-90 __
01-21-91
H
H
H
H
H
H
H
H
U
H
H
H
H
H
H
H
H
H
H
H
H
H
H
H
H
H
H
H
H
H
H
H
H
H
H
H
H
H
H
H
H
H
H
H
H
H
H
H
H
H
H
H
H
H
0.20.4.9.8.
10.12.40.
1727.
30.25.10.1.9.
40.25.3.4.
50.
4.100
8.10.5.
1.15.10.7.8,
5.15.10.40.20.
4010302
18
40165
133
10602056
108
1520
500500000
000
--
00
0000000
,0000000
,00--
000,00
,00,0,0,00.00
.00
.0,0.0.0
.0
.0
.0
.00
.0
.0
.0
.00
.0
.00
.0
.0
.0
.00
.00
.0
.00
.0
.0
1.1.
__1.
1.72.1.4.2.
1.------
2.
1. --
1.--
1.--
1.1.1.
1.--
1.1.1.
1.1.1.1.1.
1.1.1.1.1.
2.1.2.
--
1.1.
--
1.
1.1.1.1.
00
0
00000
05550
05505
03000
05000
00000
00000
8000
00550
0000
NHWRDNHWRD
NHWRD
NHWRD
NHWRD
NHWRD
NHWRD
NHWRD
NHWRD
NHWRD
NHWRD
NHWRD
NHWRD
NHWRD
NHWRD
NHWRD
NHWRD
NHWRD
NHWRD
NHWRD
NHWRD
NHWRD
NHWRD
NHWRD
NHWRD
NHWRD
NHWRD
NHWRD
NHWRD
NHWRD
NHWRD
NHWRD
NHWRD
NHWRD
NHWRD
NHWRD
NHWRD
NHWRD
NHWRD
NHWRD
NHWRD
NHWRD
NHWRD
NHWRD
NHWRD
NHWRD
NHWRD
NHWRD
NHWRD
NHWRD
NHWRD
NHWRD
NHWRD
NHWRD
406
277
277
158
277
277
158
3
585158
534319277319158
19238231927722
143247277277
3
45722
277277
3
3644644644644
143143143457277
204158143158327
534192319406277
277143143534
Appendix A 61

Table A-1. Description of selected wells, borings, and springs in the Winnipesaukee River Basin, central New Hampshire
Localsitenumber
Latitude
Longitude
Owner or userDateofcon
struction
Ele-vat-tion
(feet)
Diameter Depth to Casingof bottom mater-
casing of casing ial(inches) (feet)
Typeoffinish
Typeof
site
BELKNAP COUNTY
Alton Continued
AHW
AHW
BIA
BIA
BIA
BIA
BIA
BIA
BIA
BLB
BLB
BLB
BLW
BLW
BLW
BLW
BLW
BLW
BLW
BLW
BLW
BLW
BLW
BLW
BLW
BLW
BLW
BLW
BLW
BLW
BLW
BLW
BLW
BLW
BLW
BLW
BLW
BLW
BLW
BLW
BLW
BLW
BLW
BLW
BLW
BLW
BLW
BLW
BLW
BLW
369
370
26
27
282930
3132262728
1328293031
7677787980
8182838485
8687888990
9192939495
9699
100103104
105106107110112
113114116
432652432600
432603432601432557432608432710
432705432725432612432704433006
432611432611432540432549432549
432739432744432744432741432719
432836432638432647432556433007
432613432608432609432610432608
432553432655432733432933433013
432834433019432725432815432735
432933432933432754432933432742
432857432735432739
07112580711105
07129020712900071285507129090712837
07128290712724071310807128150713038
07129120712920071284707128470712835
07129490712953071294707129440713205
07131040712941071313407128510712654
07129210712910071290907129090712908
07128040712808071295707130230713029
07130390713015071280807125290712721
07130190713017071301307130210712836
071250207127560712753
Alton Sand and GravelDuncan, Rick (contact)
Parent , L .Parent , L .Parent , L .Parent , LBeapre , Richard
Beapre, RichardNew Hampshire, State of
--
Belmont, Town ofBelmont, Town ofNutterBelmont, Town ofBelmont, Town of
__Belmont LandfillBelmont LandfillBelmont LandfillBardwell, Ray
De jaeger. PeterWeeks, EverettUSGS -- NH Route 140Parent Bros .Mooney, Mark
Belmont, Town ofParent, L.Parent , L .Parent, L.Parent , L .
Wilson, LeoClairmont, LawrenceDuggan ConstructionDionne, R.Parkinson
Drouin BldrsGallantFullertonDrouin BldrsLauriel
LetourneauO'KeefeOilmanDrouin BldrsStewart, A.
Reynolds, T.Jezak, W.Jusczak, W.
10-07-9110-08-91
Balmont
03- -8803- -8803- -8811-08-8804-13-92
04-13-9204-13-92 --
08- -38-- -71
06-02-6701-07-6901-09-69
12-24-8612-24-8612-22-8609-11-90
08-02-9008-01-9009-12-9010-17-9009-13-90
05-06-9111-08-8811-08-8811-08-8811-08-88
__--
07-23-9107-18-8402-17-84
02-29-8405-24-8404-17-8406-12-8407-25-84
07-20-8407-12-8407-14-8411-21-8408-28-84
03-26-8504-15-8509-25-85
525530
532.1522.2551.2516645
610680512565482.0
520500550515510
610572573573470
500480500540665
510509516517517
555625590500490
500520600820660
500500660500680
820640670
2 35 P2 40 P
____
--
12 52.7 P8 63 S__
------
2 76.5 P
2 76.5 P2 24.5 P2 80 P2 57.5 P2 47.5 P
2 57.5 P2 18.9 P2 21.2 P2 25.6 P2 25.9 P
__
2 40 P79.0
154
73.010029.059.051.0
99.064.029.099.039.0
19.039.061.0
ss
----
-- --
sG
S
S
S
S
sss
sssss
sssss
W
W
s X
X
X
X
X
X
X
X
X
X
X
X
X
X
BorBor
TH
TH
TH
Bor
Bor
BorBorBorBorTH
------
------Bor
BorBorBorBorBor
BorBorBorBorBor
DugDugBor BrW
BrWBrWBrWBrWBrW
BrWBrWBrWBrWBrW
BrWBrWBrW
62 Geohydrology and Water Quality of Stratified-Drift Aquifers in the Winnipesaukee River Basin, Central New Hampshire

-Continued
Localsite
number
Water level Top of Bottom ofDepth (feet)
Date screen screen (mm-dd-yy) (feet) (feet)
Use Pumping Driller of Yield Drawdown Specific period or NHWRD
water (gal/min) (feet) capacity (hours) number
BELKNAP COUNTY
AHW
AHW
BLA
BLA
BLA
BLA
BLA
BLA
BLA
BLB
BLB
BLB
BLW
BLW
BLW
BLW
BLW
BLW
BLW
BLW
BLW
BLW
BLW
BLW
BLW
BLW
BLW
BLW
BLW
BLW
BLW
BLW
BLW
BLW
BLW
BLW
BLW
BLW
BLW
BLW
BLW
BLW
BLW
BLW
BLW
BLW
BLW
BLW
BLW
BLW
369
370
26
27
28
29
30
3132262728
1328293031
7677787980
8182838485
8687888990
9192939495
9699
100103104
105106107110112
113114116
36
2419--
13
36---
1488
156
51
13
1265
3031
1210161817
179
15-
10
_-
6--
_----
_--
.1
.2
.1--
---
.1
.1
.8
.4
.49
.42
.54
.8
.04
.25
.1
.2
.2
.9
.2
.8
.3
.8
-
.0
_-
.0--
_----
_--
10-07-91 32.5 35
10-17-91 37.5 40
03- -88
03- -88
__
--
04-13-92
04-13-92
04-13-92
__
__
10-23-49
-- -71 53 68
06-02-67 63 73
01-07-69 41 46
01-09-69 41 46
01-20-87
01-27-87
01-27-87
01-27-87
01-01-93 80 82.5
07-02-91 76.5 79.0
07-02-91 24.5 27
07-02-91 77.5 80
07-02-91 57.5 60
07-02-91 47.5 50
08-21-91 55.0 57.5
11-10-88 8.9 18.9
11-10-88 11.2 21.2
11-10-88 15.6 25.6
11-10-88 15.9 25.9
06-12-91
06-12-91
07-23-91 37 40
02-17-84
__
04-17-84
__
--
__
__
__
Alton-Continued
UU
B«lmont
_____.
U
U
U
U___-U
P 350 5
p
U 440 38
U 40 2.3
U 20 7
__
__
__
U
U
U
U
U
U
U
U
U
U
U
H
H
U
H 50.0
H 7.00
H 4.00
H 1.00
H 7.00
H
H 7.00
H 3.00
H 3.00
H 2.00
H 50.0
H 20.0
H 8.00
H 25.0
H 6.00
USGS
USGS
__
__
__
AriesUSGS
USGSUSGSNHDOTNHDOT
--
Engineer
4 Layne-BowlerLauman CO.
84 LAYNE
3 Layne1 Layne
MaineMaineMaineUSGS
USGSUSGSUSGSUSGS
USGS
USGS
Aries
Aries
AriesAries
N.E.N.E.
N.E.
TestTestTest
EngineerEngineerEngineerEngineer
Nutter
USGS
.5 NHWRD
2.0 NHWRD
1.0 NHWRD
1.0 NHWRD
.3 NHWRD
NHWRD
.5 NHWRD
.5 NHWRD
.5 NHWRD
.5 NHWRD
.5 NHWRD
.5 NHWRD
NHWRD
.5 NHWRD
.5 NHWRD
319192
3193
13319319
319319319319247
319319319
Appendix A 63

Table A-1. Description of selected wells, borings, and springs in the Winnipesaukee River Basin, central New Hampshire
Local site number
Lat itude
Long itude
Owner or userDate of
con struction
Ele- vat- tion
(feet)
Diameter Depth to of bottom
casing of casing (inches) (feet)
Casing Type mater- of ial fin
ish
Type of
site
BELKNAP COUNTY
Belmont-Continued
BLWBLW
BLW
BLW
BLW
BLW
BLW
BLW
BLW
BLW
BLW
BLW
BLW
BLW
BLW
BLW
BLW
BLW
BLW
BLW
BLW
BLW
BLW
BLW
BLW
BLW
BLW
BLW
BLW
BLW
BLW
BLW
BLW
BLW
BLW
BLW
BLW
BLW
BLW
BLW
BLW
BLW
BLW
BLW
BLW
BLW
BLW
BLW
BLW
BLW
BLW
BLW
BLW
BLW
BLW
120
122
123
124
125
126
127
130
131
132
135
138139140141
146147150151157
158159160161162
165167168170171
172173174176179
181183184185186
188189190191198
199200201202206
207209210211212
432938432735432932432653432922
432923432738432556432932432931
432904432734432731432732432730
432733432947432711432731432719
432630432744432835432836432835
432947432924432741432812432809
432821432821432823432911432731
432923432655432718432844432847
432855432947432722433003433052
432930432943432712433047432937
432939432715432855432650432916
0713001
0712734
0713023
0713050
0713021
0713021
0713216
0712919
0713017
0713019
0713037
0712753
0712705
0712708
0712658
0712701
0713048
0712843
0712815
0712829
0712837
0712747
0713136
0713132
0713134
0713015
0713033
0712743
0712534
0712525
0713102
0713100
0713101
0713036
0712701
0712612
0712623
0712830
0713051
0713055
0713105
0712752
0712839
0713034
0712854
0712754
0712858
0712906
0712903
0712910
0712903
0712906
0712506
0712600
0712606
Button, J.Fortin, J.Drouin BldrsWeeksMallards Landing Assoc
Mallards Landing AssocPoulin, R.Dalton, F.Drouin BldrsDrouin Bldrs
Northland DevelLakewood Devel CorpSalta, B.Brough, N.GN Const
Zielski, D.Parris, E.Woundy, B.Audet, P.Seigel, R.
Lewandoski , C .Jusczak, W.Morway, R.Norway, R .Morway, R.
Northland DevelReed, R.Ekberg, W.Plummer, C.Lurvey, C.
Drouin BldrsDrouin BldrsDrouin BldrsCorbishley, H.Peterson, W.
Eber, C.Gilbert, D.DutileCroes, B.Guyer, D.
Chao , F .Sewall, P.Lakeland ConstMcCormick, S.Sear Is, W.
Scott, R.Kitching, G.Gammon, G.LaddDrouin, W.
Farrar, K.Wood & Clay BldrsWi Iking, E.Lamothe, R.Davis, C.
10-22-8508-06-8508-15-8508-16-8507-18-85
07-16-8510-03-8509-19-8505-10-8505-14-85
06-27-8507-24-8507-15-8508-12-8501-03-86
04-10-8612-01-8512-01-8512-01-8511-26-85
01-01-8509-24-8504-03-8604-08-8604-08-86
06-25-8606-28-8607-10-8603-06-8612-28-86
09-18-8609-15-8609-12-8611-08-8605-11-87
03-12-8706-24-8707-02-8708-03-8708-05-87
09-09-8611-03-8603-26-8706-23-8609-11-86
07-03-8607-03-8606-19-8611-20-8704-11-86
07-28-8608-20-8709-11-8709-09-8709-29-87
540640500520500
500470580500500
520630720710750
740485640640620
600710490490490
490490660790820
560560560490740
860770630510500
500740620500640
740660610680630
660610810800840
20.39.79.67.
119
14019.29.94.99.
26.40.30.40.20.
29.11751.63.30.
20.
94.84.79.
39.13.64.59.25.
79.79.82.
10440,
0000
0000
00000
0
000
0
000
00000
,0.0.0
.0
20.020402932
842019
15481
37120208361
7419211939
.0
.0
.0
.0
.0
.0
.0
.0
.0
.0
.0
.0
.0
.0
.0
.0
.0
X
X
X
X
X
X
X
X
X
X
X
X
X
X
X
X
X
X
X
X
X
X --
X
S
X
X
X
X
X
X
X
X
X
X
X
X
X
X
X
X
X
X
X
X
X
X
X
X
X
X
X
X
BrWBrWBrW
BrW
BrW
BrW
BrW
BrW
BrW
BrW
BrW
BrW
BrW
BrWBrW
BrWBrWBrWBrWBrW
BrWBrW------
BrW BrWBrWBrW
BrWBrWBrWBrWBrW
BrWBrWBrWBrWBrW
BrWBrWBrWBrWBrW
BrWBrWBrWBrWBrW
BrWBrWBrWBrWBrW
64 Geohydrology and Water Quality of Stratified-Drift Aquifers in the Winnipesaukee River Basin, Central New Hampshire
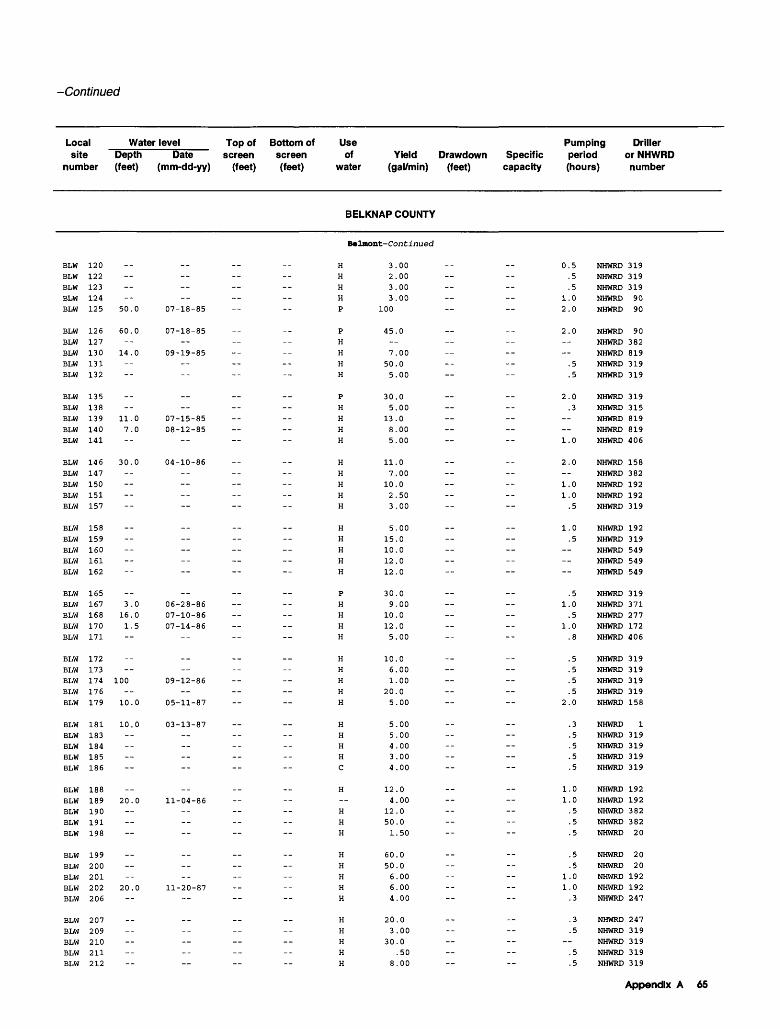
-Continued
Local Water level Top of Bottom ofsite Depth Date screen screen
number (feet) (mm-dd-yy) (feet) (feet)
Use of
water
Pumping Driller Yield Drawdown Specific period or NHWRD
(gal/min) (feet) capacity (hours) number
BELKNAP COUNTY
Raiment-Continued
BLW
BLW
BLW
BLW
BLW
BLW
BLW
BLW
BLW
BLW
BLW
BLW
BLW
BLW
BLW
BLW
BLW
BLW
BLW
BLW
BLW
BLW
BLW
BLW
BLW
BLW
BLW
BLW
BLW
BLW
BLW
BLW
BLW
BLW
BLW
BLW
BLW
BLW
BLW
BLW
BLW
BLW
BLW
BLW
BLW
BLW
BLW
BLW
BLW
BLW
BLW
BLW
BLW
BLW
BLW
120
122
123
124
125 50.0 07-18-85
126 60.0 07-18-85127130 14.0 09-19-85131132
135138139 11.0 07-15-85140 7.0 08-12-85141
146 30.0 04-10-86147150151157
158159160161162
165167 3.0 06-28-86168 16.0 07-10-86170 1.5 07-14-86171
172173174 100 09-12-86176179 10.0 05-11-87
181 10.0 03-13-87183184185186
188189 20.0 11-04-86190191198
199200201202 20.0 11-20-87206
207209210211212
H
H
H
H
P
P
H
H
H
H
P
H
H
H
H
H
H
H
H
H
H
H
H
H
H
P
H
H
H
H
H
H
H
H
H
H
H
H
H
C
H--
H
H
H
H
H
H
H
H
H
H
H
H
H
3.2.3.3.
100
45. 7.
50.
5.
30.5.
13.8.5.
11.7.
10.2.3.
5.15.10.12.12.
30.9.
10.12.5.
10.6.1.
20.5.
5.5.4.3.4.
12.4.
12.50.1.
60.50.6.6.4.
20.3.
30.
8.
00000000
--
0
00000
00000000
00005000
000000
0000000
00000000
0000000000
0000050
00000000
00005000
0----
12
2 __----
2-- _-
1
2__
11
1--__--
__1
--1
__----
2
__ -- --
11
--
--
11
--
-- --
.5
.5
.5
.0
.0
.0--.5.5
.0
.3--.0
.0-.0.0.5
.0
.5---
.5
.0
.5
.0
.8
.5
.5
.5
.5
.0
.3
.5
.5
.5
.5
.0
.0
.5
.5
.5
.5
.5
.0
.0
.3
.3
.5-.5.5
NHWRDNHWRDNHWRD
NHWRD
NHWRD
NHWRD
NHWRD
NHWRD
NHWRD
NHWRD
NHWRD
NHWRD
NHWRD
NHWRD
NHWRD
NHWRD
NHWRD
NHWRD
NHWRD
NHWRD
NHWRD
NHWRD
NHWRD
NHWRD
NHWRD
NHWRD
NHWRD
NHWRD
NHWRD
NHWRD
NHWRD
NHWRD
NHWRD
NHWRD
NHWRD
NHWRD
NHWRD
NHWRD
NHWRD
NHWRD
NHWRD
NHWRD
NHWRD
NHWRD
NHWRD
NHWRD
NHWRD
NHWRD
NHWRD
NHWRD
NHWRD
NHWRD
NHWRD
NHWRD
NHWRD
319
319
319
9090
90382819319319
319315819819406
158382192192319
192319549549549
319371277172406
319319319319158
1319319319319
19219238238220
2020
192192247
247319319319319
Appendix A 65

Table A-1. Description of selected wells, borings, and springs in the Winnipesaukee River Basin, central New Hampshire
Local site number
Lat itude
Long itude
Owner or userDate of
con struction
Ele- vat- tlon
(feet)
Diameter Depth to Casing of bottom mater-
casing of casing ial (inches) (feet)
Type of fin ish
Type of site
BELKNAP COUNTY
Belmont-Continued
BLW
BLW
BLW
BLW
BLW
BLW
BLW
BLW
BLW
BLW
BLW
BLW
BLW
BLW
BLW
BLW
BLW
BLW
BLW
BLW
BLW
BLW
BLW
BLW
BLW
BLW
BLW
BLW
BLW
BLW
BLW
BLW
BLW
BLW
BLW
BLW
BLW
BLW
BLW
BLW
BLW
BLW
BLW
BLW
BLW
BLW
BLW
BLW
BLW
BLW
BLW
BLW
BLW
BLW
BLW
213
215
216
217
219
220
221
222
224
226
227
230
231
234
235
238
240
243
244
248
253
255
257
258
262
263
264
271
275
276
277
278
286
287
288
290
291
292
293
294
296
297
303
306
308
309
315
316
318
321
322
323
325
327
329
432932433048433050432735432943
432553432917432843432716432834
432942432959432710432822432720
432715432819432905432720432717
432732432743432951432904432550
432554432739432718432911432658
432659432943432848432852432810
432817432817432933432934432825
432703432848432852432945432745
432741432904432849432906432836
432933432946432737432651432708
0712923
0712902
0712901
0712700
0712856
0712809
0712933
0713049
0712809
0713149
0712703
0712648
0712840
0713136
0712839
0712841
0713114
0713045
0712834
0712808
0712705
0712632
0713045
0712442
0712920
0712920
0712838
0712806
0712504
0712620
0712620
0712647
0713051
0713041
0713051
0713112
0713110
0713037
0713045
0713039
0712913
0713157
0713045
0713046
0713206
0712636
0712445
0713038
0713042
0713048
0713041
0713045
0712621
0713128
0712623
Laurent , C .Duggan , J .Duggan , R .PowelGouveau , M .
Dindo, J.CollinsMcMenaman, J.Drouin, M.Rogers , A .
Rotonnelli, J.Macintosh, E.AE MitchellMarock, T.deJagger , P .
Aubut , R .
Bjelt, R.pickering, G.deJagger , P .Drouin, M.
Carignon, R.Bossey, T.Smart , R .Grant , S .Booth, P.
Booth, P.SmockDrouin BldrsCaldwell, J.Kierman, D.
Donavan, L.Reilly, D.Clement, R.Piper, R.Kathcort, R.
RogackiDugganScott, R.Doyon , A .Creteau, R.
Wincox, D.Walton, R.Treh Bldrs IncBohlin PropertyJackson, S.
Senechal , N .Jausqak, W.ShulzeRobinson, J.Clive, T.
Conant, R.Fletcher, R.Jusczak, W.Yellow Freight TerminalWilder, D.
10-19-87
09-22-86
09-24-86
12-22-87
10-19-87
01-25-88
11-02-87
11-12-87
01-15-88
05-30-87
02-02-88
03-30-88
05-02-88
03-29-88
02-01-88
05-07-87
12-07-87
11-03-87
04-05-88
04-04-88
03-24-88
07-15-88
09-18-88
07-09-88
06-17-88
06-17-88
06-17-88
09-19-88
10-20-88
06-09-88
05-19-88
05-27-88
12-06-88
03-10-89
12-20-88
10-24-88
10-25-88
02-27-89
04-15-89
10-07-88
06-17-89
06-11-89
09-13-89
11-01-89
11-27-89
09-29-89
03-08-89
04-26-89
07-17-90
06-15-90
06-20-90
07-12-90
09-14-89
10-16-90
08-15-90
640580580740660
560540520600500
960750640530630
640560510630610
720730485860510
500660610860765
765900510580660
580570490490510
580500580490470
740860600490500
490490750520770
72.80.
10032.69.
72.19.29.20.
130
39.28.37.63.19.
59.59.89.19.19.
39.41.
14737.29.
19.49.19.26.39.
40,19.19,79,40.
60,60
11913999
2415462
125110
4940617989
130131405919
00
--
00
0000
00000
00000
00
00
000.0.0
.0
.0
.0
.0
.0
.0
.0 --
.0
.0--
.0
.0
.0
.0
.0
.0
--
.0
.4
.0
X
X
X
X
X
X
X
X
X
X
X
X
X
X
X
X
X
X
X
X
X
X
X
X
X
X
X
X
X
X
X
X
X
X
X
X
X
X
X
X
X
X
X
X
X
X
X
X
X
X
X
X
X
X
BrW
BrW
BrW
BrW
BrWBrWBrWBrWBrW
BrWBrWBrWBrWBrW
BrWBrWBrWBrWBrW
BrWBrWBrWBrWBrW
BrWBrWBrWBrWBrW
BrWBrWBrWBrWBrW
BrWBrWBrWBrWBrW
BrWBrWBrWBrWBrW
BrWBrWBrWBrWBrW
BrWBrWBrWBrWBrW
66 Geohydrology and Water Quality of Stratified-Drift Aquifers in the Winnipesaukee River Basin, Central New Hampshire

-Continued
Localsite
number
Water level Top of Bottom ofDepth (feet)
Date screen screen (mm-dd-yy) (feet) (feet)
Use of
water
Pumping Driller Yield Drawdown Specific period orNHWRD
(gal/min) (feet) capacity (hours) number
BELKNAP COUNTY
B« latent-Continued
BLWBLW
BLW
BLW
BLW
BLW
BLW
BLW
BLW
BLW
BLW
BLW
BLW
BLW
BLW
BLW
BLW
BLW
BLW
BLW
BLW
BLW
BLW
BLW
BLW
BLW
BLW
BLW
BLW
BLW
BLW
BLW
BLW
BLW
BLW
BLW
BLW
BLW
BLW
BLW
BLW
BLW
BLW
BLW
BLW
BLW
BLW
BLW
BLW
BLW
BLW
BLW
BLW
BLW
BLW
213
215
216217219
220221222224226
227230231234235
238240243244248
253255257258262
263264271275276
277278286287288
290291292293294
296297303306308
309315316318321
322323325327329
__25.20.----
__ ------
30. ----
20.
__--
15.--
15.----
3.20.
20.--
11.--
__ --
5.
10.20. ----
_.------
10.
__10.20.--
3.--
15.----
00
0
0
0
0
00
0
0
0
00
0
00
0
0
__09-23-8609-24-86
__--
____--
02-02-88 ____
02-06-88
____
04-05-88--
03-25-88____
07-09-8806-17-88
06-18-88__
10-20-88--
____ __
12-21-88
10-25-8810-26-88 __--
______._
11-27-89
__03-09-8904-27-89
__--
06-20-90__
09-14-89__
H
H
H
H
H
H
H
H
H
H
H
H
H
H
H
H
H
H
H
H
H
H
H
H
H
H
H
H
H
H
H
H
H
H
H
H
H
H
H
H
H
H
H
H
H
H
H
H
H
H
H
H
H
H
H
25.3.
20.10.20.
12.1.3.
20.1.
8.6.6.3.
15.
20.5.3.
50.3.
7.6.
12.15.--
5.11.10.10.
3.
15.9.1.
3.10.25.7.
20.
5.1.8.
30.5.
7.2.
25.6.
000000
00000000
000000000
00000000
500000
--
5000000
005000050
0000000
005000000
0000000
10.0
0.5.5.5
__
.8
.5
.5
.5
.5
.5
1.01.0.5
.3
.3
.3
.5
.5
.51.01.02.0
--
.5
.3
.5_.
.5
1.01.0.5.3.5
.5
.5
.5
.51.0
.3
.8
.21.01.0
1.0.5.5.5
1.0
4.003.007.00
1.010.0
10.06.00 .3
NHWRDNHWRDNHWRDNHWRD
NHWRD
NHWRD
NHWRD
NHWRD
NHWRD
NHWRD
NHWRD
NHWRD
NHWRD
NHWRD
NHWRD
NHWRD
NHWRD
NHWRD
NHWRD
NHWRD
NHWRD
NHWRD
NHWRD
NHWRD
NHWRD
NHWRD
NHWRD
NHWRD
NHWRD
NHWRD
NHWRD
NHWRD
NHWRD
NHWRD
NHWRD
NHWRD
NHWRD
NHWRD
NHWRD
NHWRD
NHWRD
NHWRD
NHWRD
NHWRD
NHWRD
NHWRD
NHWRD
NHWRD
NHWRD
NHWRD
NHWRD
NHWRD
NHWRD
NHWRD
NHWRD
319
302
302
126
204
319319319319225
819819192192382
247247247382319
142192192158382
382247319819225
225143319247142
142142319319192
9090
238192192
143142142319123
819192302192247
Appendix A 67

Table A-1. Description of selected wells, borings, and springs in the Winnipesaukee River Basin, central New Hampshire
Localsitenumber
Latitude
Longitude
Owner or userDateof
construction
Ele- Diametervat- oftion casing(feet) (inches)
Depth to Casingbottom mater-of casing ial(feet)
Typeoffinish
Typeof
site
BELKNAP COUNTY
Belmont-Con tinned
BLW
BLW
BLW
BLW
BLW
BLW
BLW
BLW
BLW
BLW
BLW
BLW
BLWBLW
331
332
334
335
336
341342346347349
350353354355
432708432646432858432857432905
432945432818432817432906432845
432741432816432650432625
07126170713051071305107130570713051
07126490712558071310307124580713156
0712615071315907132070713122
PeaseJusczak, W.Lenardis, J.Gobeille, L.Dawkins , E .
Small, R.Gilbert, A.R & A Assoc
Durocher, M.Nordel , L .
Jusczah, W.Lochmere Vill. DistrictTilton-Northf ield Aqua.Tilton-Northf ield Aqua.
11-15-8907-10-9009-08-9008-29-9007-27-90
10-01-9011-01-9007-31-8905-25-9107-02-91
06-17-9104- -9212-06-9412-08-94
780515500500500
900740560840
--
__
470 1.25485 2.5520
19.083.054.074.089.0
17.028.051.022.0
139
36.011 P20 S__
X
X
X
X
X
X
X
X
X
X
X
S
S--
BrWBrWBrWBrWBrW
BrWBrWBrWBrWBrW
BrWDugBORBOR
Canter Harbor
CHW
CHW
CHW
CHW
CHW
CHW
CHW
CHW
CHW
CHW
CHW
GFA
GFA
GFA
GFB
GFB
GFB
GFB
GFB
GFB
GFB
GFB
GFB
GFB
GFB
GFB
GFB
GFW
GFW
GFW
GFW
GFW
GFW
GFW
GFW
GFW
12356
7
11
142325
29
12312
34567
89
101112
137
91112
1314151617
434225434229434230434231434242
434223434053434230434041434103
434232
433212433416433242433443433422
433614433158433201433447433434
433435433442433443433446433159
433157433445433349433145433423
433358433445433125433110433021
07127480712759071280407127440712753
07127490713042071280107130350713315
0712753
07124210712507071241907124160712121
07125470712624071262107125310712508
07125180712524071251507125230712619
07126240712539071262507124140712404
07123590712359071240307123400712349
FinnAllard, M.Kneeland, W.Parker , G .Heath
Dole, J.Skawinski, W.Poff, H.LaBraney, J.Fisher, D.
--
Gilford, Town ofLaconia Airport Authority Gilford, Town of
--
NHDOT
Lemays GarageLemays GarageGilford LandfillGilford Landfill
Gilford LandfillGilford LandfillGilford LandfillGilford LandfillLemays Garage
Lemays GarageGilford LandfillGetty PetroleumGilford, Town ofRoberts, Steven
Howe, P. D.Gilford, Town ofLyman , JohnPicheLiptak
05-29-8408-13-8408-05-8410-10-8408-26-85
08-10-8511-27-8407-20-8403-31-8606-06-86
--
Oilford
10-16-9006-25-9106-26-91
----
__03-08-8803-18-8809-12-8609-08-86
09-10-8609-04-8609-10-8609-10-8607-06-88
03-08-88 --
10-15-9011-01-90
09-14-9006-25-9106-26-91
--05-14-84
540600640540560
540620600620780
570
760518750509517
506610610550520
510530570550610
610548.22530780 2515 2
540 2510 2800 2980
1080
47.024.019.0--
19.0
69.020.055.020.020.0
-
-- --
__-- --
------
_.__--
51.5 P77.5 P
32.5 P68 P42 P--
170
X
X
X
X
X
X
X
X
X
X
--
--
_---
------
------SS
SSSWX
BrWBrWBrWBrWBrW
BrWBrWBrWBrWBrW
BrW
BorBorBorBorBor
BorBorBorBorBor
BorBorBorBorTH
Bor----
BorBor
BorBorBorDugBrW
68 Geohydrology and Water Quality of Stratified-Drift Aquifers in the Winnipesaukee River Basin, Central New Hampshire

-Continued
Localsite
number
Water level Top of Bottom ofDepth (feet)
Date screen screen (mm-dd-yy) (feet) (feet)
Use Pumping Driller of Yield Drawdown Specific period or NHWRD
water (gal/min) (feet) capacity (hours) number
BELKNAP COUNTY
BLWBLWBLWBLWBLW
BLWBLWBLWBLWBLW
BLWBLWBLWBLW
CHWCHWCHWCHWCHW
CHWCHWCHWCHWCHW
CHW
GFAGFAGFAGFBGFB
GFBGFBGFBGFBGFB
GFBGFBGFBGFBGFB
GFBGFWGFWGFWGFW
GFWGFWGFWGFWGFW
331332334335336
341342
346347
349
350353354355
12
356
711142325
29
12312
34567
89
101112
137
91112
1314151617
20.0----
60.03.0
20.01.0--
7.063.2
18.2
---- --
---- --
60
--
4--
__
4.527.7331.3
1.31.6
1221--
8.95
6.565.79
13.65.24
21.08.65--
__07-10-90
____
10-01-9011-01-9008-01-8905-26-91
--
06-17-91
04- -92 11 1312-06-94 20 2612-08-94
__
__ --
____ --
08-10-89
____
- -70--
__07-12-8807-12-8809-12-8609-09-86
09-10-8609-04-8609-10-8609-10-86
--
07-18-88
07-02-91 51.5 5307-02-91 77.5 80
07-02-91 32.5 3507-02-91 68 70.507-02-91 39.5 4206-17-91
__
Bel moot-Continued
H 8.00H 5.00H 6.00H 4.00H 4.00
H 6.50H 10.0H 4.00H 7.00H 4.00
H 18.0UUU
Canter Harbor
H 6.00H 10.0H 4.50H 3.00H 20.0
H .75H 4.00H 4.50H 2.00H 1.50
H
Oilford
UUU-_--
__
UUUU
UUUUU
UUUUU
UUUH
H .50
0.3 NHWRD 247.5 NHWRD 302.5 NHWRD 319.5 NHWRD 319.5 NHWRD 319
.8 NHWRD 110
.8 NHWRD 110
.5 NHWRD 1422.0 NHWRD 240
.5 NHWRD 319
NHWRD 819D . L . MaherD.L. MaherD.L. Maher
1.5 902.0 901.0 90
.5 2471.0 90
1.0 90.5 NHWRD 20.5 NHWRD 20.5 NHWRD 20.5 NHWRD 20
--
usesusesusesNHDOTNHDOT
NHDOTKennedyKennedyCon-Tec, IncCon-Tec, Inc
Con-Tec, IncCon-Tec, IncCon-Tec, IncCon-Tec, IncKennedy
Kennedy
usesuses
usesusesuses
.5 NHWRD 319
Appendix A 69
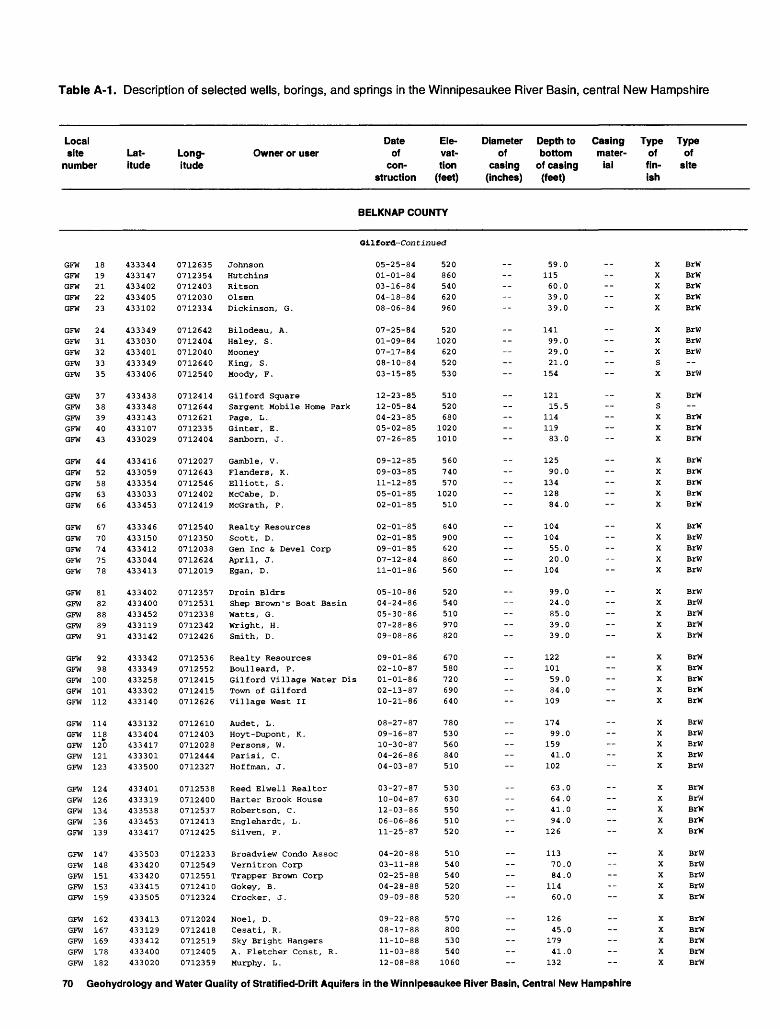
Table A-1. Description of selected wells, borings, and springs in the Winnipesaukee River Basin, central New Hampshire
Local site number
Lat itude
Long itude
Owner or userDate of con
struction
Ele- vat- tion
(feet)
Diameter Depth to Casing of bottom mater-
casing of casing ial (inches) (feet)
Type of fin ish
Type of
site
BELKNAP COUNTY
Qllford-Continued
GFWGFWGFW
GFW
GFW
GFW
GFW
GFW
GFW
GFW
GFW
GFW
GFW
GFW
GFW
GFW
GFW
GFW
GFW
GFW
GFW
GFW
GFW
GFW
GFW
GFW
GFW
GFW
GFW
GFW
GFW
GFW
GFW
GFW
GFW
GFW
GFW
GFW
GFW
GFW
GFW
GFW
GFW
GFW
GFW
GFW
GFW
GFW
GFW
GFW
GFW
GFW
GFW
GFW
GFW
1819212223
2431323335
3738394043
4452586366
6770747578
8182888991
9298
100101112
114118120121123
124126134136139
147148151153159
162167169178182
433344433147433402433405433102
433349433030433401433349433406
433438433348433143433107433029
433416433059433354433033433453
433346433150433412433044433413
433402433400433452433119433142
433342433349433258433302433140
433132433404433417433301433500
433401433319433538433453433417
433503433420433420433415433505
433413433129433412433400433020
07126350712354071240307120300712334
07126420712404071204007126400712540
07124140712644071262107123350712404
07120270712643071254607124020712419
07125400712350071203807126240712019
07123570712531071233807123420712426
07125360712552071241507124150712626
07126100712403071202807124440712327
07125380712400071253707124130712425
07122330712549071255107124100712324
07120240712418071251907124050712359
JohnsonHutchinsRitsonOlsenDickinson, G.
Bilodeau, A.Haley, S.MooneyKing, S.Moody, F.
Gil ford SquareSargent Mobile Home ParkPage, L.Ginter, E.Sanborn , J .
Gamble, V.Flanders, K.Elliott, S.McCabe, D.McGrath, P.
Realty ResourcesScott, D.Gen Inc & Devel CorpApril, J.Egan, D.
Droin BldrsShep Brown's Boat BasinWatts, G.Wright, H.Smith, D.
Realty ResourcesBoulleard, P.Gilford Village Water DisTown of GilfordVillage West II
Audet , L .Hoyt-Dupont, K.Persons, W.Parisi, C.Hoffman, J.
Reed Elwell RealtorBarter Brook HouseRobertson, C.Englehardt, L.Silven, P.
Broadview Condo AssocVernitron CorpTrapper Brown CorpGokey, B.Crocker, J.
Noel, D.Cesati, R.Sky Bright HangersA. Fletcher Const, R.Murphy, L.
05-25-8401-01-8403-16-8404-18-8408-06-84
07-25-8401-09-8407-17-8408-10-8403-15-85
12-23-8512-05-8404-23-8505-02-8507-26-85
09-12-8509-03-8511-12-8505-01-8502-01-85
02-01-8502-01-8509-01-8507-12-8411-01-86
05-10-8604-24-8605-30-8607-28-8609-08-86
09-01-8602-10-8701-01-8602-13-8710-21-86
08-27-8709-16-8710-30-8704-26-8604-03-87
03-27-8710-04-8712-03-8606-06-8611-25-87
04-20-8803-11-8802-25-8804-28-8809-09-88
09-22-8808-17-8811-10-8811-03-8812-08-88
520860540620960
5201020620520530
510520680
10201010
560740570
1020510
640900620860560
520540510970820
670580720690640
780530560840510
530630550510520
510540540520520
570800530540
1060
59.11560.39.39.
14199.29.21.
154
12115.
11411983.
12590.
13412884.
10410455.20.
104
99.24.85.39.39.
12210159.84.
109
17499
15941
102
63644194
126
1137084
11460
12645
17941
132
0
000
000
--
5
--
0
--0
0
----
00
--
00000
--
.0
.0
.0
.0
--
.0
.0
.0
.0--
.0.0
--.0
.0
--.0
--
X
X
X
X
X
X
X
X
S
X
X
S
X
X
X
X
X
X
X
X
X
X
X
X
X
X
X
X
X
X
X
X
X
X
X
X
X
X
X
X
X
X
X
X
X
X
X
X
X
X
X
X
X
X
X
BrWBrWBrWBrWBrW
BrWBrWBrW--
BrW
BrW--
BrWBrWBrW
BrWBrWBrWBrWBrW
BrWBrWBrWBrWBrW
BrWBrWBrWBrWBrW
BrWBrWBrWBrWBrW
BrWBrWBrWBrWBrW
BrWBrWBrWBrWBrW
BrWBrWBrWBrWBrW
BrWBrWBrWBrWBrW
70 Geohydrology and Water Quality of Stratif ied-Drift Aquifers in the Winnipesaukee River Basin, Central New Hampshire

-Continued
Local Water level Top of Bottom ofsite Depth Date screen screen
number (feet) (mm-dd-yy) (feet) (feet)
Use of
water
Pumping Driller Yield Drawdown Specific period or NHWRD
(gal/min) (feet) capacity (hours) number
BELKNAP COUNTY
Oilford-Continued
GFWGFWGFW
GFW
GFW
GFW
GFW
GFW
GFW
GFW
GFW
GFW
GFW
GFW
GFW
GFW
GFW
GFW
GFW
GFW
GFW
GFW
GFW
GFW
GFW
GFW
GFW
GFW
GFW
GFW
GFW
GFW
GFW
GFW
GFW
GFW
GFW
GFW
GFW
GFW
GFW
GFW
GFW
GFW
GFW
GFW
GFW
GFW
GFW
GFW
GFW
GFW
GFW
GFW
GFW
18 30.0 05-25-8419 20.0 01-01-8421 10.0 03-19-842223
24 10.0 07-25-84313233 12.0 08-10-8435
37 11.0 05-23-8538 12.5 12-05-84394043 40.0 07-26-85
4452586366
67 20.0 02-14-8570747578
818288 12.0 06-01-8689 8.0 07-28-8691
9298
100101 20.0 02-13-87112
114118120121 20.0 04-26-86123
124 2.0 03-27-87126134136139
147 20.0 04-20-88148151 20.0 02-25-8815315 g
162167169178182
H
H
H
H
H
H
H
H
C
H
__
P
H
H
H
H
H
H
H
H
C
H
H
H
H
H
C
H
H
H
H
P
P
P
C
H
H
H
H
H
C
H
P
H
H
P
C
H
H
H
H
H
H
H
H
6.50
100
50.0
10.0
12.0
8.00
2.00
5.00
30.0
5.00
50.0
25.0
6.00
4.00
5.00
50.0
10.0
6.00
5.00
12.0
30.0
6.00
60.0
10.0
15.0
30.0
10.0
14.0
5.50
20.0
25.0
50.0
65.0
5.00
10.0
10.0
5.00
20.0
8.00
3.00
10.0
50.0
25.0
50.0
60.0
35.0
15.0
10.0
50.0
50.0
10.0
200
50.0
4.00
1.5
2.0
.5
1.0
.5
2.0
.5
.5
2.0
.5
1.0
2.0
.5__
1.0
.8
.5
.5
1.0
2.0
48.0
2.0
1.0
.5
1.0
.5__
1.0
.5
.5
.5
1.0
1.0
.3
.5
.5
.5
1.0
1.0
1.0
1.0
1.0
1.0
1.0
1.0
1.0
1.0
.5
1.0
1.0
.5
.3
1.0
.5
NHWRD 90
NHWRD 192
NHWRD 319
NHWRD 237
NHWRD 319
NHWRD 192
NHWRD 247
NHWRD 247
NHWRD 371
NHWRD 319
NHWRD 3
NHWRD 371
NHWRD 319
NHWRD 319
NHWRD 158
NHWRD 406
NHWRD 319
NHWRD 319
NHWRD 192
NHWRD 192
NHWRD 192
NHWRD 192
NHWRD 192
NHWRD 20
NHWRD 192
NHWRD 319
NHWRD 319
NHWRD 208
NHWRD 819
NHWRD 319
NHWRD 319
NHWRD 319
NHWRD 192
NHWRD 192
NHWRD 247
NHWRD 319
NHWRD 319
NHWRD 319
NHWRD 192
NHWRD 192
NHWRD 192
NHWRD 192
NHWRD 192
NHWRD 192
NHWRD 192
NHWRD 192
NHWRD 192
NHWRD 192
NHWRD 319
NHWRD 192
NHWRD 192
NHWRD 319
NHWRD 247
NHWRD 192
NHWRD 20
Appendix A 71
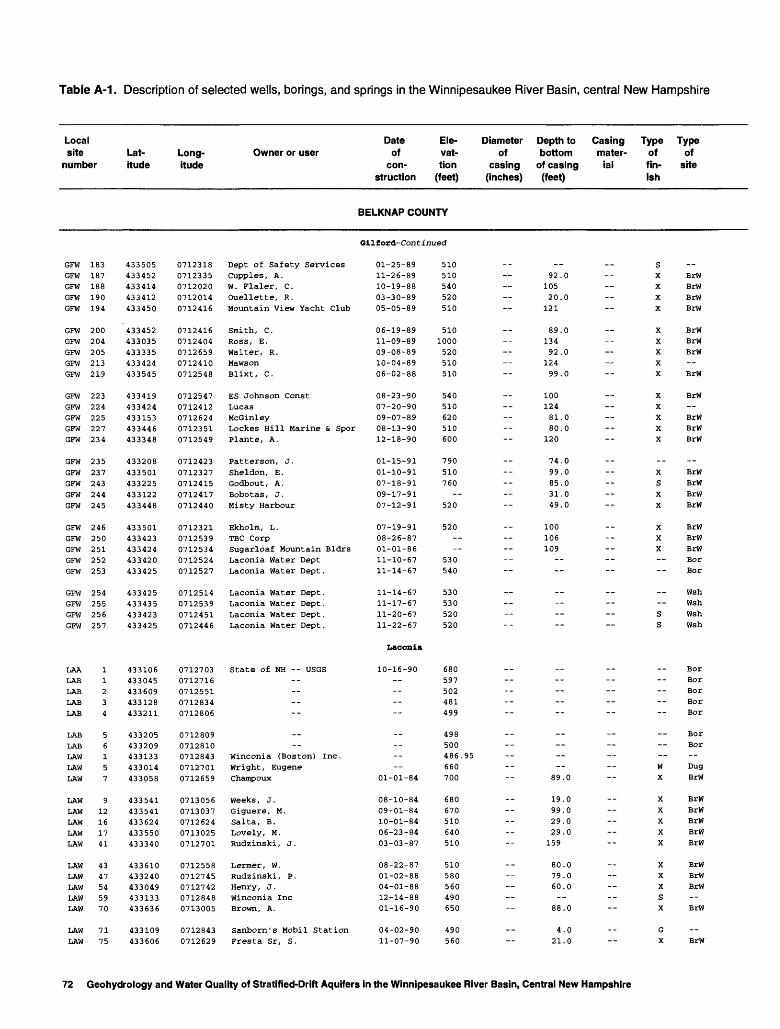
Table A-1. Description of selected wells, borings, and springs in the Winnipesaukee River Basin, central New Hampshire
Localsitenumber
Latitude
Longitude
Owner or userDateofcon
struction
Ele- Diametervat- oftion casing
(feet) (inches)
Depth to Casingbottom mater-of casing ial(feet)
Typeoffinish
Typeof
site
BELKNAP COUNTY
Oilford-Continued
GFWGFWGFWGFW
GFW
GFW
GFW
GFW
GFW
GFW
GFW
GFW
GFW
GFW
GFW
GFW
GFW
GFW
GFW
GFW
GFW
GFW
GFW
GFW
GFW
GFW
GFW
GFW
GFW
LAA
LAB
LAB
LAB
LAB
LAB
LAB
LAW
LAW
LAW
LAW
LAW
LAW
LAW
LAW
LAW
LAW
LAW
LAW
LAW
LAW
LAW
183
187
188
190
194
200
204
205
213
219
223
224
225
227
234
235
237
243
244
245
246
250
251252253
254255256257
11234
56157
912161741
4347545970
7175
433505433452433414433412433450
433452433035433335433424433545
433419433424433153433446433348
433208433501433225433122433448
433501433423433424433420433425
433425433435433423433425
433106433045433609433128433211
433205433209433133433014433058
433541433541433624433550433340
433610433240433049433133433636
433109433606
07123180712335071202007120140712416
07124160712404071265907124100712548
07125470712412071262407123510712549
07124230712327071241507124170712440
07123210712539071253407125240712527
0712514071253907124510712446
07127030712716071255107128340712806
07128090712810071284307127010712659
07130560713037071262407130250712701
07125580712745071274207128480713005
07128430712629
Dept of Safety ServicesCupples, A.W. Flaler, C.Ouellette, R.Mountain View Yacht Club
Smith, C.ROSS, E.
Walter, R.Maws onBlixt, C.
ES Johnson ConstLucasMcGinleyLockes Hill Marine & SporPlante, A.
Patterson, J.Sheldon, E.Godbout , A .Bobotas, J.Misty Harbour
Ekholm, L.TBC CorpSugarloaf Mountain BldrsLaconia Water DeptLaconia Water Dept.
Laconia Water Dept.Laconia Water Dept.Laconia Water Dept.Laconia Water Dept .
State of NH -- USGS ------
Winconia (Boston) Inc.Wright , EugeneChampoux
Weeks, J.Giguere, M.Salta, B.Lovely, M.Rudzinski, J.
Lermer, W.Rudzinski, P.Henry, J.Winconia IncBrown, A.
Sanborn's Mobil StationFresta Sr, S.
01-25-8911-26-8910-19-8803-30-8905-05-89
06-19-8911-09-8909-08-8910-04-8906-02-88
08-23-9007-20-9009-07-8908-13-9012-18-90
01-15-9101-10-9107-18-9109-17-9107-12-91
07-19-9108-26-8701-01-8611-10-6711-14-67
11-14-6711-17-6711-20-6711-22-67
Laconia
10-16-90 ----
----
01-01-84
08-10-8409-01-8410-01-8406-23-8403-03-87
08-22-8701-02-8804-01-8812-14-8801-16-90
04-02-9011-07-90
510510540520510
5101000520510510
540510620510600
790510760
__
520
520--
530540
530530520520
680597502481499
498500486.95660700
680670510640510
510580560490650
490560
92.0
10520.0
121
89.013492.0
12499.0
10012481.080.0
120
74.099.085.031.049.0
100106109
----
----
----
__ ----
89.0
19.099.029.029.0
159
80.079.060.0
88.0
4.021.0
sXX
X
X
X
X
XX
X
X
X
X
X
X
X
sX
X
X
XX----
--ss
----
-- --W
X
X
X
X
X
X
X
X
X
sX
GX
BrWBrWBrWBrW
BrWBrWBrW--BrW
BrW--BrWBrWBrW
BrWBrWBrWBrW
BrWBrWBrWBorBor
WshWshWshWsh
BorBorBorBorBor
BorBor--DugBrW
BrWBrWBrWBrWBrW
BrWBrWBrW BrW
BrW
72 Geohydrology and Water Quality of Stratified-Drift Aquifers in the Winnipesaukee River Basin, Central New Hampshire
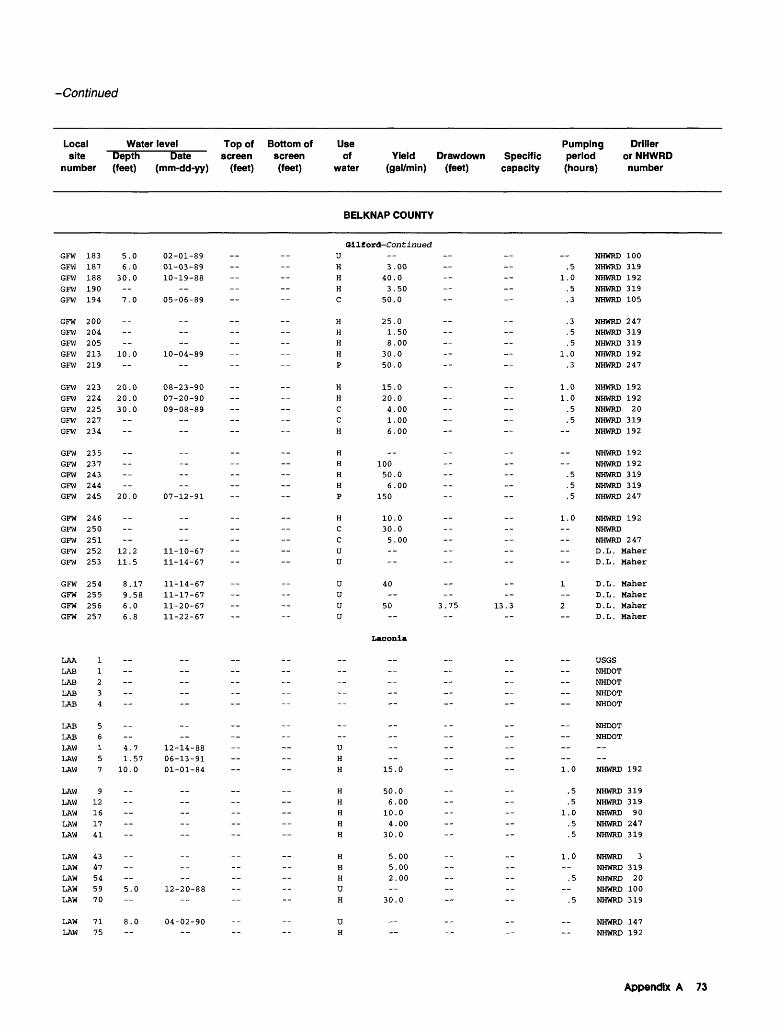
-Continued
Localsite
number
Water level Top of Bottom ofDepth (feet)
Date screen screen (mm-dd-yy) (feet) (feet)
Use Pumping Driller of Yield Drawdown Specific period or NHWRD
water (gal/min) (feet) capacity (hours) number
BELKNAP COUNTY
Qilford-ContinuedGFW
GFW
GFW
GFW
GFW
GFW
GFW
GFW
GFW
GFW
GFW
GFW
GFW
GFW
GFW
GFW
GFW
GFW
GFW
GFW
GFW
GFW
GFW
GFW
GFW
GFW
GFW
GFW
GFW
LAA
LAB
LAB
LAB
LAB
LAB
LAB
LAW
LAW
LAW
LAW
LAW
LAW
LAW
LAW
LAW
LAW
LAW
LAW
LAW
LAW
LAW
183
187
188
190
194
200
204
205
213
219
223
224
225
227
234
235
237
243
244
245
246
250
251
252
253
254
255
256
257
1
1
2
3
4
5
6
1
5
7
9
12
16
17
41
43
47
54
59
70
71
75
5.06.0
30.0--
7.0
__----
10.0--
20.020.030.0----
__----
20.0
__--
12.211.5
8.179.586.06.8
__--------
--
4.71.57
10.0
__--------
__--
5.0--
8.0
02-01-8901-03-8910-19-88
__05-06-89
______
10-04-89--
08-23-9007-20-9009-08-89
__--
______
07-12-91
__
11-10-6711-14-67
11-14-6711-17-6711-20-6711-22-67
________--
__
12-14-8806-13-9101-01-84
________--
___
12-20-88__
04-02-90__
uH
H
H
C
H
H
H
H
P
H
H
C
C
H
H
H
H
H
P
H
C
C
U
U
U
U
U
u
__-- ----
--uH
H
H
H
H
H
H
H
H
H
U
H
U
H
__
3.0040.03.50
50.0
25.01.508.00
30.050.0
15.020.04.001.006.00
__10050.06.00
150
10.030.05.00__--
40__
50 3.75 13.3--
Laconia
________
__
15.0
50.06.00
10.04.00
30.0
5.005.002.00__
30.0
___
--.5
1.0.5.3
.3
.5
.51.0.3
1.01.0.5.5
--
__--.5.5.5
1.0-- ----
1--
2
__--------
-- 1.0
.5
.51.0.5.5
1.0--.5
--.5
__--
NHWRD 100NHWRD 319NHWRD 192NHWRD 319NHWRD 105
NHWRD 247
NHWRD 319
NHWRD 319
NHWRD 192
NHWRD 247
NHWRD 192
NHWRD 192
NHWRD 20
NHWRD 319
NHWRD 192
NHWRD 192
NHWRD 192
NHWRD 319
NHWRD 319
NHWRD 247
NHWRD 192
NHWRD
NHWRD 247
D.L. MaherD.L. Maher
D.L. MaherD.L. MaherD.L. MaherD.L. Maher
USGSNHDOTNHDOT
NHDOT
NHDOT
NHDOT
NHDOT
NHWRD 192
NHWRD 319
NHWRD 319
NHWRD 90
NHWRD 247
NHWRD 319
NHWRD 3
NHWRD 319
NHWRD 20
NHWRD 100
NHWRD 319
NHWRD 147
NHWRD 192
Appendix A 73

Table A-1. Description of selected wells, borings, and springs in the Winnipesaukee River Basin, central New Hampshire
Local site number
Lat itude
Long itude
Owner or userDate Ele- of vat- con- tion
struction (feet)
Diameter Depth to Casing of bottom mater-
casing of casing ial (inches) (feet)
Type of fin ish
Type of site
BELKNAP COUNTY
MHB
MHB
MHB
MHB
MHB
MHB
MHB
MHB
MHB
MHB
MHB
MHB
MHB
MHW
MHW
MHW
MHW
MHW
MHW
MHW
MHW
MHW
MHW
MHW
MHW
MHW
MHW
MHW
MHW
MHW
MHW
MHW
MHW
MHW
MHW
MHW
MHW
MHW
MHW
MHW
MHW
MHW
MHW
MHW
MHW
MHW
NHS
NHW
NHW
SCB
sew
1 2 3 4 6
7 8 9
10 11
12131412
132428293358
6185909195
101
111125136143147162
164167185203212
216223228236237242
258262
13334
345
433902 433908 434026 434029 434001
434003 433951 433949 433947 433950
434014 434021434024434017433956
433610433926433924434046434011433801
434043433537433621433753433758433539
433522434-43433946433635433957433534
433624433807433923433510433618
433758434009434105433657433639433507
433711433753
434123434047434120
433008433007
0712954 0713001 0712953 0712955 0712951
0712952 0712945 0712945 0712942 0712958
0712951 0712953071295407130060712951
071305907128560712854071271507129530712737
071271507132120713047071284807128490713215
071321907127310713113071315907130210713214
07131060712727071285407132190713045
071274907129520712722071321807131590713217
07132350712852
071345707134210713542
0713045 .0713129
Meredith, Town of Meredith, Town of Meredith, Town of
Meredith, Town of Meredith, Town of Meredith, Town of Meredith, Town of Meredith, Town of
Meredith, Town of Meredith, Town ofMeredith, Town ofMeredith, Town ofMeredith, Town of
Trombetta, L.Zis, S.McGrathTiege, P.Crosby PeckGrimes, P.
Lee, J.Hoyler, R.CookStevens , R .Boyer , N .Rist, R.
Kessler, G.Crognale, G.Rousseau, J.& R. Dawson, D.Brady, D.Sheridan, J.
RussellEstano, B.The TimbersGallagar, T.Lerner, J.
Dwyer, T.Interlakes Mobile ParkMilette, A.Plunkett, M.Forton, S.Tamposi, S.
Golden, W.Settele, J.
_-
Dawber, WilliamSaunders, John and Kriste
-_
Oilman, M.
Meredith
11-12-70 11-12-70 11-12-70
11-12-70 11-18-70 11-16-70 11-17-70 11-17-70
11-18-70 11-10-7011-12-7011-01-9010-31-90
12-11-8409-25-8506-20-8506-02-8502-05-8509-28-85
12-14-8505-14-8606-19-8706-24-8706-17-8712-08-86
12-22-875-17-88
09-12-8807-15-8804-20-8805-13-87
03-06-8701-26-8710-26-8806-28-8807-06-89
03-20-8903-03-8912-11-8904-25-8904-27-8905-11-89
09-22-9007-23-91
Haw Hampton
_- --
Sanbornton
_-04- -56
555 506 570 570 540
540 530 530 520 510
560 575570565515
650530540510540520
510510660520520600
490540550535560500
660550540490640
510560510510520490
530530
590555700
482505
__
227939597929
601920423340
343910405827
2060606618
317969514029
3960
--
--
-
_
-
.0
.0
.0
.0
.0
.0
.0
.0
.0
.0
.0
.0
.0
.0
.0
.0
.0
.0
.0
.0
.0
.0
.0
.0
.0
.0
.0
.0
.0
.0
.0
__-
_-
-
SS
X
X
X
X
X
X
X
X
X
X
X
X
X
X
X
X
X
X
X
X
X
X
X
X
X
X
X
X
X
X
--
----
Bor Bor TH TH Bor
TH
TH
TH
TH
TH
TH
TH
TH
BorBor
BrWBrWBrWBrWBrWBrW
BrWBrWBrWBrWBrW
BrWBrWBrWBrWBrWBrW
BrWBrWBrWBrWBrW
BrWBrWBrWBrWBrWBrW
BrW
SpBrWBrW
THBrW
74 Geohydrology and Water Quality of Stratified-Drift Aquifers in the Winnipesaukee River Basin, Central New Hampshire

-Continued
Localsite
number
Water level Top of Bottom ofDepth (feet)
Date screen screen (mm-dd-yy) (feet) (feet)
Use Pumping Driller of Yield Drawdown Specific period orNHWRD
water (gal/min) (feet) capacity (hours) number
BELKNAP COUNTY
MHB MHB MHB MHB MHB
MHB MHB MHB MHBMHB
MHBMHBMHBMHWMHW
MHWMHWMHWMHWMHWMHW
MHWMHWMHWMHWMHWMHW
MHWMHWMHWMHWMHWMHW
MHWMHWMHWMHWMHW
MHWMHWMHWMHWMHWMHW
MHWMHW
1 2 3 4 6
7 8 9
1011
12131412
132428293358
6185909195
101
111125136143147162
164167185203212
216223228236237242
258262
--
3.
17.9.
20. --
5.24.20.
60------
15.--
8.20.--
50.50.15.
25.20.
15.--
__
38.6.
10.15.8.
__
20.
2
201
0
000
.0
0
00
000
00
0
00000
0
-
11-18-70----
07-25-91 32.5 3507-02-91 52.5 55
12-11-84 __
06-02-8502-18-8509-29-85
06-02-85______
06-17-87--
12-22-875-17-88
__07-16-8804-21-8805-14-87
03-07-8701-27-87
_-06-29-88
--
__03-03-8912-14-8904-26-8904-28-8905-12-89
__07-23-91
u u u
u u u uu
uuuuu
HHHHPH
HHHHHH
HHHHHH
HHPHH
HP-
HHH
HH
M«r«dith
NHDOT NHDOT R.E. Chapman R.E. Chapman R.E. Chapman
R.E. Chapman R.E. Chapman R.E. Chapman R.E. ChapmanR.E. Chapman
R.E. ChapmanR.E. ChapmanR.E. Chapman
--
6704
302
503010
1008
10
130602
15
501510
735
107
100
3030
_-
.00
.0
.00
.0
.75
.0
.0
.0--
.00
.0
.00
.0
.0
.50
.50
.00
.0
.0
.0
.00
.0
.0
.50--
.0
.0
__
1.01.01.0
48.0.5
.31.01.01.0.5
.3
.5
.5
.5
.5
.5
.5
.5
.5
.348.0
.5
.5
.5
.51.0
USGSUSGS
NHWRDNHWRDNHWRDNHWRDNHWRDNHWRD
NHWRDNHWRDNHWRDNHWRDNHWRDNHWRD
NHWRDNHWRDNHWRDNHWRDNHWRDNHWRD
NHWRDNHWRDNHWRDNHWRDNHWRD
NHWRDNHWRDNHWRDNHWRDNHWRDNHWRD
NHWRDNHWRD
909090909020
612471921925920
819382247202020
202020
14290
909090
14214220
319192
N«w Hampton
NHSNHWNHW
13334
_.--
20
___
11-08-84
_
HH
_--
__-
__--
__----
Sanbornton
SCBsew
345
__ __ U _ _ __ __
Daniels
Appendix A 75
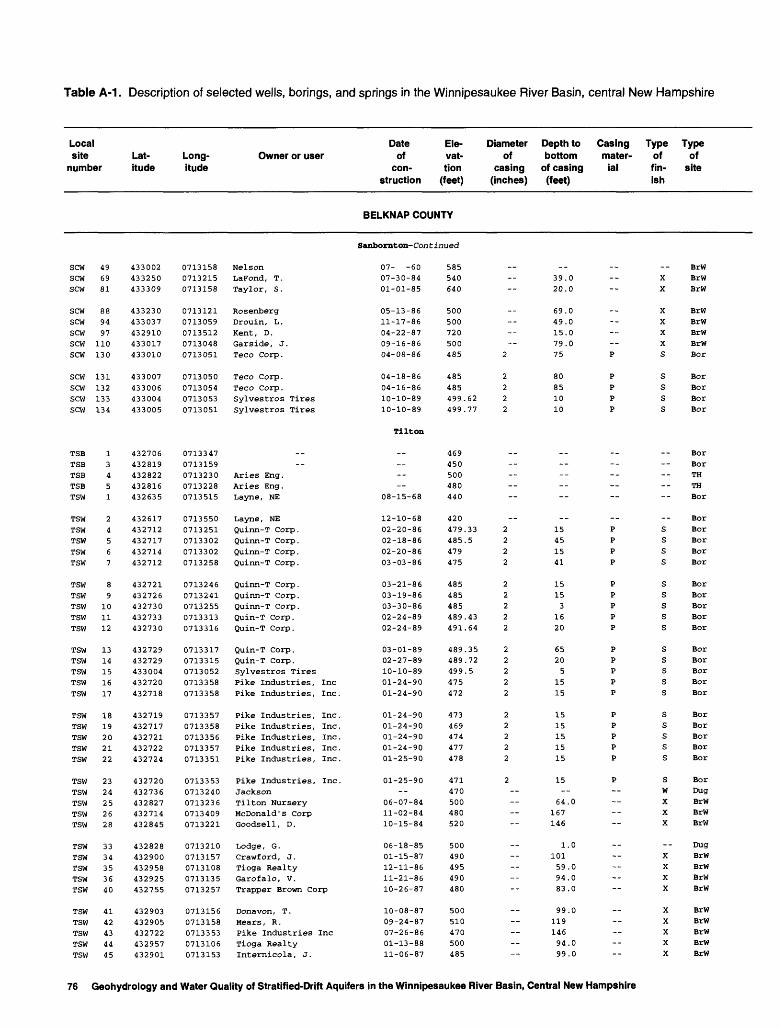
Table A-1. Description of selected wells, borings, and springs in the Winnipesaukee River Basin, central New Hampshire
Localsitenumber
Latitude
Longitude
Owner or userDateof
construction
Ele-vat-tion
(feet)
Diameterof
casing(inches)
Depth tobottomof casing(feet)
Casingmaterial
Typeoffinish
Typeof
site
BELKNAP COUNTY
Sanbornton-Continued
sewsewsew
sewsewsewsewsew
sewsewsewsew
TSB
TSB
TSB
TSB
TSW
TSW
TSW
TSW
TSW
TSW
TSW
TSW
TSW
TSW
TSW
TSW
TSW
TSW
TSW
TSW
TSW
TSW
TSW
TSW
TSW
TSW
TSW
TSW
TSW
TSW
TSW
TSW
TSW
TSW
TSW
TSW
TSW
TSW
TSW
TSW
49
69
81
88
94
97
110
130
131
132
133
134
1
3
4
5
1
2
4
5
6
7
8
9
10
11
12
13
14
15
16
17
18
19
20
21
22
23
24
25
26
28
33
34
35
36
40
41
42
43
44
45
433002
433250
433309
433230
433037
432910
433017
433010
433007
433006
433004
433005
432706
432819
432822
432816
432635
432617
432712
432717
432714
432712
432721
432726
432730
432733
432730
432729
432729
433004
432720
432718
432719
432717
432721
432722
432724
432720
432736
432827
432714
432845
432828
432900
432958
432925
432755
432903
432905
432722
432957
432901
0713158
0713215
0713158
0713121
0713059
0713512
0713048
0713051
0713050
0713054
0713053
0713051
0713347
0713159
0713230
0713228
0713515
0713550
0713251
0713302
0713302
0713258
0713246
0713241
0713255
0713313
0713316
0713317
0713315
0713052
0713358
0713358
0713357
0713358
0713356
0713357
0713351
0713353
0713240
0713236
0713409
0713221
0713210
0713157
0713108
0713135
0713257
0713156
0713158
0713353
0713106
0713153
NelsonLaFond, T.Taylor, S.
RosenbergDrouin, L.Kent, D.Garside, J.Teco Corp.
Teco Corp.Teco Corp.Sylvestros TiresSylvestros Tires
__--
Aries Eng.Aries Eng.Layne, NE
Layne , NEQuinn-T Corp.Quinn-T Corp.Quinn-T Corp.Quinn-T Corp.
Quinn-T Corp.Quinn-T Corp.Quinn-T Corp.Quin-T Corp.Quin-T Corp.
Quin-T Corp.Quin-T Corp.Sylvestros TiresPike Industries, IncPike Industries, Inc.
Pike Industries, Inc.Pike Industries, Inc.Pike Industries, Inc.Pike Industries, Inc.Pike Industries, Inc.
Pike Industries, Inc.JacksonTil ton NurseryMcDonald's CorpGoodsell, D.
Lodge , G .Crawford, J.Tioga RealtyGarofalo, V.Trapper Brown Corp
Donavon, T.Hears , R .Pike Industries IncTioga RealtyInternicola, J.
07- -60
07-30-84
01-01-85
05-13-86
11-17-86
04-22-87
09-16-86
04-08-86
04-18-86
04-16-86
10-10-89
10-10-89
Tilton
------
08-15-68
12-10-6802-20-8602-18-8602-20-8603-03-86
03-21-8603-19-8603-30-8602-24-8902-24-89
03-01-8902-27-8910-10-8901-24-9001-24-90
01-24-9001-24-9001-24-9001-24-9001-25-90
01-25-90--
06-07-8411-02-8410-15-84
06-18-8501-15-8712-11-8611-21-8610-26-87
10-08-8709-24-8707-26-8601-13-8811-06-87
585
540
640
500
500
720
500
485
485
485
499.62
499.77
469
450
500
480
440
420
479.33
485.5
479
475
485
485
485
489.43
491.64
489.35
489.72
499.5
475
472
473
469
474
477
478
471
470
500
480
520
500
490
495
490
480
500
510
470
500
485
----
__------
2
2
2
2
2
__
--
--
2
2
2
2
2
2
2
2
2
2
2
2
2
2
2
2
2
2
2
2--
--
--
--
--
--
--
--
--
__39.0
20.0
69.0
49.0
15.0
79.0
75
80
85
10
10
--
--
--
--
15
45
15
41
15
15
3
16
20
65
20
5
15
15
15
15
15
15
15
15--
64.0
167
146
1.0
101
59.0
94.0
83.0
99.0
119
146
94.0
99.0
__--
__------p
pppp
------
--pppp
ppppp
ppppp
ppppp
p--------
-- --
--------
X
X
X
X
X
X
S
S
S
S
S
--------
--S
S
S
S
S
S
S
S
S
S
S
S
S
S
S
S
S
S
S
S
wX
X
X
X
X
X
X
X
X
X
X
X
BrWBrwBrW
BrWBrWBrWBrWBor
BorBorBorBor
BorBorTHTH
Bor
BorBorBorBorBor
BorBorBorBorBor
BorBorBorBorBor
BorBorBorBorBor
BorDugBrWBrWBrW
DugBrWBrWBrWBrW
BrWBrWBrWBrWBrW
76 Geohydrology and Water Quality of Stratified-Drift Aquifers in the Winnipesaukee River Basin, Central New Hampshire

-Continued
Localsite
number
Water levelDepth (feet)
Date (mm-dd-yy)
Top ofscreen
(feet)
Bottom ofscreen (feet)
Use Pumping Drillerof Yield Drawdown Specific period or NHWRD
water (gal/min) (feet) capacity (hours) number
BELKNAP COUNTY
sew sewsew
sewsewsewsewsew
sewsewsewsew
TSB
TSB
TSB
TSB
TSW
TSW
TSW
TSW
TSW
TSW
TSW
TSW
TSW
TSW
TSW
TSW
TSW
TSW
TSW
TSW
TSW
TSW
TSW
TSW
TSW
TSW
TSW
TSW
TSW
TSW
TSW
TSW
TSW
TSW
TSW
TSW
TSW
TSW
TSW
TSW
49
69
81
88
94
97
110130
131132133134
13451
24567
89
101112
1314151617
1819202122
2324252628
3334353640
4142434445
-
-
10-
20-
6
69
1313
_-
12
91419141
14146
1722
_
211264
51589
47
2020-
5---
10
_----
-
-
.0-.0-.8
.3
.5
.9
.3
_-
.3
.6
.1
.7
.1
.02
.5
.4
.5
-
.1
.9
.76
.52
.23
.84
.63
.92
.23
.28
.41
.0
.0-
.0---
.0
-----
-
--
05-01-86--
04-23-87
04-08-86
04-18-8604-16-8610-26-8910-10-89
05-18-8805-19-8808-15-68
12-10-6802-20-8602-18-8602-20-8603-03-86
03-21-8603-19-8603-30-8602-28-8902-28-89
02-28-8910-26-8901-29-9001-29-90
01-29-9001-29-9001-29-9001-29-9001-29-90
01-29-9006-13-9106-07-8411-02-84
--
06-20-85-- --
10-26-87
------
-
--
----
75
80851010
----
15451541
15153
1620
6520555
55555
5 ------
__-- ----
------
-
--
----
80
83912020
----
25502546
3030132630
7530151515
1515151515
15 ------
__-- ----
----
Sanbornton-Con tinued
H 6.00H 100
H 14.0
H 25.0
H 7.00
H 4.00
u
uuuu
Tilton
uu
uuuu
uuuuu
uuuuu
uuuuu
uH
Z 20.0
C 10.0
H 10.0
H
H 2.00
H 6.00
H 5.00
H 4.00
H 6.00
H 15.0
H 30.0
C 1.00
H 2.00
Daniels
.5 NHWRD 247
1.0 NHWRD 192
NHWRD 819
.5 NHWRD 319
1.0 NHWRD 534
.3 NHWRD 247
Aries Engineer
GraniteGraniteDunn GeoDunn Geo
NHDOTNHDOT
____
Layne
LayneCon-Tec, IncCon-Tec, IncCon-Tec, IncCon-Tec, Inc
Con-Tec, IncCon-Tec, IncCon-Tec, IncSoil Expl.Soil Expl.
Soil Expl.
Soil Expl.
KennedyAries EngineerAries Engineer.
Aries EngineerAries Engineer.Aries EngineerAries EngineerAries Engineer.
Aries EngineerGilbert, L.
1.0 NHWRD 280
2.0 NHWRD 427
.5 NHWRD 1
NHWRD 536
.5 NHWRD 319
.5 NHWRD 319
.5 NHWRD 319
1.0 NHWRD 192
.5 NHWRD 319
.5 NHWRD 319
1.0 NHWRD 192
NHWRD 319
.5 NHWRD 319
Appendix A 77

Table A-1. Description of selected wells, borings, and springs in the Winnipesaukee River Basin, central New Hampshire
Local site number
Lat itude
Long itude
Owner or userDate Ele- of vat- con- tion
struction (feet)
Diameter Depth to Casing of bottom mater-
casing of casing ial (inches) (feet)
Type of fin ish
Type of
site
BELKNAP COUNTY
Tilton-Continued
TSWTSWTSWTSWTSW
TSWTSWTSWTSWTSW
TSWTSWTSW
4950525557
5859606165
676980
432920432902432736433004432901
432901432905432900432909432735
432713432846432730
07131450713202071322907130500713155
07131560713154071315407131550713236
071341007132280713343
Lyons , S .Dion, R.Champagne , W .Bayside LandingBlakeslee
Nielson, C.Lynch, B.Nielson, P.Thompson, M.Ritarick, J.
Super 8 HotelDES-Lochmere Xtra MartFisher Management Co.
02-26-8807-11-8808-22-8811-07-8811-10-88
11-07-8811-03-8811-02-8811-01-8811-23-88
01-18-8903-20-8910-29-92
520500480485500
495500490520480
480540490
99.149139119114
10911110456.
154
14476.
8 133
0 ----
--
0
0S
XXXXX
XXX--X
XG0
BrWBrWBrWBrWBrW
BrWBrWBrW--
BrW
BrW "
CARROLL COUNTY
MWA
MWA
MWW
MWW
MWW
MWW
MWW
MWW
MWW
MWW
MWW
MWW
MWW
MWW
MWW
MWW
MWW
MWW
MWW
MWW
MWW
MWW
MWW
MWW
MWW
MWW
MWW
MWW
MWW
MWW
MWW
MWW
MWW
MWW
MWW
12123
45679
1011121516
1819202123
3031333536
5253545564
6668707172
434403434402434420434423434423
434501434421434613434407434508
434456434531434409434522434518
434422434521434253434540434329
434359434321434323434203434233
434233434206434132434205434442
434402434311434325434211434233
07121520712155071241607124220712420
07123160712900071220607128370712321
07122570712326071283807123380712346
07128300712257071200907122480712635
07128160712624071262807121410712102
07121490712115071241307121390712307
07128060712617071255307122030712222
unknownunknownFowlerBuonielloBuoniello
Harkins, G.Schultz, W.Werien, R.Alien, D.Kelly, W.
MacPhail, L.Richardson, V.Mills, L.Covell, E.Holden, S.
Mardis, S.White, JeffVappi, FrankRush, EverettRamage
Frustino, G.Sullivan, D.Bonnell, H.MitraWoodworth, R.
CurtisCobham, W.Richards, R.AnagnosKeyser, D.
Passamonti , J .Wheeler, R.Abbott, H.CaplisSnuffer, C.
Moultonbo rough
04-21-9204-21-9204-19-8403-23-8403-26-84
08-10-8411-06-8410-18-8407-20-8507-01-85
08-06-8409-19-8508-15-8504-03-8707-16-87
05-08-8610-30-9010-29-90
04-24-84
08-14-8408-24-8411-09-8410-25-8411-25-84
12-14-8412-18-8411-15-8511-15-8503-23-84
06-07-8409-08-8410-25-8411-27-8403-21-84
550550580520520
560600580580570
580580580600600
560575600620530
540560540510530
540515520610540
540520560600530
___
19.20.19.
11319.19.20.64.
80.57.20.
14049.
20.2 29.2 27.
39.
24.59.
10964.43.
39.39.40.80.50.
20.21.22.20.
131
--
000
0000
000
0
05 P5 P
.
0
00
--00
00000
0,0,0.0
--XXX
XXXXX
XXXXX
XSS X
XXXXX
XXXXX
XXXXX
BorBorBrWBrWBrW
BrWBrWBrWBrWBrW
BrWBrWBrWBrWBrW
BrWBorBorDugBrW
BrWBrWBrWBrWBrW
BrWBrWBrWBrWBrW
BrWBrWBrWBrWBrW
78 Geohydrology and Water Quality of Stratified-Drift Aquifers in the Winnipesaukee River Basin, Central New Hampshire

-Continued
Localsite
number
Water level Top of Bottom ofDepth (feet)
Date screen screen (mm-dd-yy) (feet) (feet)
Use Pumping Driller of Yield Drawdown Specific period or NHWRD
water (gal/min) (feet) capacity (hours) number
BELKNAP COUNTY
TSW
TSW
TSW
TSW
TSW
TSW
TSW
TSW
TSW
TSW
TSW
TSW
TSW
49
50
52
55
57
5859606165
676980
-- --
15.0
40.030.030.025.020.0
__
19.0"
____ __
11-11-88
11-08-8811-05-8811-04-8811-01-8811-25-88
__03-02-89
..
pH
H
H
H
H
H
H
H
H
C
U
C
Tilton-Con t inued
8.007.00
20.010.02.00
2.0012.04.00
15.06.00
50.0__
0.3.3.3.8.5
.5
.5
.51.0.5
.3_...
NHWRD 247
NHWRD 247
NHWRD 247
NHWRD 406
NHWRD 126
NHWRD 126
NHWRD 123
NHWRD 126
NHWRD 126
NHWRD 142
NHWRD 247
NHWRD 141
L . Gushing
CARROLL COUNTY
MWA
MWA
MWW
MWW
MWW
MWW
MWW
MWW
MWW
MWW
MWW
MWW
MWW
MWW
MWW
MWW
MWW
MWW
MWW
MWW
MWW
MWW
MWW
MWW
MWW
MWW
MWW
MWW
MWW
MWW
MWW
MWW
MWW
MWW
MWW
12123
45679
1011121516
1819202123
3031333536
5253545564
6668707172
__8.2--
--
--
23.0
33.0
20.0--
--
--
5.0
15.0
8.23
10.6
2.68
7.0
__
--
25.0
15.0
25.0
3.0--
--
__
--
--
04-21-9204-21-92
____--
08-10-8411-07-8410-30-84
__--
____
08-20-85
07-16-87
__
07-02-91 29.5 3207-02-91 27.5 3006-18-9104-26-84
___
11-13-8410-29-8411-26-84
__._
11-15-85__--
____ ____
_.
-
H
H
H
H
H
H
H
H
H
H
H
H
H
H
U
U
U
H
H
H
H
H
H
H
H
H
H
H
H
H
H
H
H
Houltonborough
_.
11.02.003.00
__
1.507.001.50
20.0
20.020.06.00.25
2.00
2.00 __
2.50
2.003.001.501.502.00
2.254.006.001.00
13.0
1.754.001.00
30.06.00
.5
.5
.5
__
1.01.0.5
1.0
.5
.5
.5
.5
.5
.5 __
1.0
1.01.0.5
1.01.0
1.01.0
__.5
.5
.5
.5
.5
.5
.5
usesusesNHWRD 319
NHWRD 319
NHWRD 319
NHWRD 22
NHWRD 3
NHWRD 90
NHWRD 315
NHWRD 192
NHWRD 175
NHWRD 175
NHWRD 175
NHWRD 22
NHWRD 22
NHWRD 175
usesuses
NHWRD 3
NHWRD 90
NHWRD 90
NHWRD 22
NHWRD 90
NHWRD 397
NHWRD 90
NHWRD 90
NHWRD 819
NHWRD 319
NHWRD 20
NHWRD 20
NHWRD 20
NHWRD 20
NHWRD 20
NHWRD 20
Appendix A 79

Table A-1. Description of selected wells, borings, and springs in the Winnipesaukee River Basin, central New Hampshire
Local site number
Lat itude
Long itude
Owner or userDate of
con struction
Ele- vat- tion
(feet)
Diameter Depth to Casing of bottom mater-
casing of casing ial (inches) (feet)
Type of fin ish
Type of
site
CARROLL COUNTY
Moultonborough-Continued
MWW
MWW
MWW
MWW
MWW
MWW
MWW
MWW
MWW
MWW
MWW
MWW
MWW
MWW
MWW
MWW
MWW
MWW
MWW
MWW
MWW
MWW
MWW
MWW
MWW
MWW
MWW
MWW
MWW
MWW
MWW
MWW
MWW
MWW
MWW
MWW
MWW
MWW
MWW
MWW
MWW
MWW
MWW
MWW
MWW
MWW
MWW
MWW
MWW
MWW
MWW
MWW
MWW
MWW
MWW
81
84
88
96
101
103
106
111
114
116
120
132
153
155
165
171
177
179
180
181
183
187
194
197
198
199
201
203
206
207
210
214
217
218
219
220
221
222
225
227
228
232
234
238
257
258
265
275
287
295
301
303
304
307
309
434226
434316
434340
434233
434342
434349
434254
434353
434236
434230
434230
434320
434347
434402
434344
434543
434550
434155
434146
434241
434455
434524
434521
434522
434400
434359
434252
434541
434338
434147
434551
434421
434242
434242
434242
434500
434323
434544
434607
434313
434232
434242
434521
434234
434401
434219
434213
434251
434129
434230
434537
434128
434200
434213
434225
0712342
0712229
0712213
0712338
0712215
0712239
0712242
0712215
0712724
0712524
0712521
0712552
0712219
0712811
0712231
0712147
0712257
0712025
0712134
0712228
0712308
0712256
0712348
0712346
0712808
0712806
0712238
0712313
0712221
0712135
0712540
0712822
0712253
0712249
0712252
0712311
0712557
0712203
0712212
0712620
0712225
0712323
0712246
0712230
0712802
0712342
0712353
0712104
0712422
0712236
0712303
0712425
0712111
0712136
0712309
Merryfield NelsonDifazio, R.& E. McGuigan, D.Smalley, R.Hesseltine
Lundari , J .T & C BldrsDuclos, R.Straf fordshire CondoLevesque, F.
& C. Rix, C.Blackadar, W.MacDonald, A.t J. McKinnon, J.Chen, M.
Rice, M.Poole, D.BroadbentJannson, B.Sampson, J.
Gravel le, K.& L. White, W.Town of MoultonboroughTown of MoultonboroughRose, J.
WelchRichard Murphy ConstPeaslee, E.Nelson, J.Zimmer, V.
Knu, D.Lessard, R.Richard Murphy ConstRichard Murphy ConstRichard Murphy Const
MoreauAutenzio, R.Allan, D.Wheely, P.& M. Vitas, T.
Puntonio, J.Chapman , D .Shaw, D.Cordello, J.Casella, R.
Salvati, I.Ahne, J.Anderson, A.Middlebrook, B.Mover, L.
Hoyt , F .Hazel, R.Young, R.Smith, B.Morril, S.
08-27-8510-24-8506-04-8605-05-8706-13-87
06-29-8708-08-8710-20-8607-23-8607-25-86
09-19-8606-23-8603-31-8809-05-8504-15-88
07-01-8807-08-8707-14-8706-02-8706-01-87
02-11-8711-19-8708-13-8707-08-8707-01-88
02-24-8805-26-8805-20-8809-14-8809-28-88
10-20-8810-28-8801-13-8901-10-8901-07-89
12-05-8801-31-8801-13-8910-05-8812-17-88
11-17-8806-09-8907-15-8905-24-8909-27-88
10-06-8807-01-8812-18-8906-27-9003-02-89
07-13-8911-01-8905-15-9010-05-9001-23-90
540520550540560
510520540520515
510570540535520
860640600520520
560590620580540
540510580520520
670560540530540
560570800810520
540525600540540
540540560510560
600510510540520
20.040.80.20.79.
0000
36.020.059.030.020.0
40.020.072.019.0
110
4040,
1404029
10040406020
4040405429
6120404040
163199987
377
6019671926
1919803840
2540
--3440
--
.0
.0
. 0
.0
.0.0.0.0
.0
.0
.0
.0
.0
.0
.0
.0
.0
.0
.0.0.0
.0
.0
.0
.0
.0
.0
.0
.0
.0
.0
.0
.0-.0.0
X
X
X
X
X
X
X
X
X
X
X
X
X
X
X
X
X
X
X
X
X
X
X
X
X
X
X
X
X
X
X
X
X
X
X
X
X
X
X
X
X
X
X
X
X
X
X
X
X
X
X
X--X
X
BrWBrWBrWBrWBrW
BrWBrWBrWBrWBrW
BrWBrWBrWBrWBrW
BrWBrWBrWBrWBrW
BrWBrWBrWBrWBrW
BrWBrWBrWBrWBrW
BrWBrWBrWBrWBrW
BrWBrWBrWBrWBrW
BrWBrWBrWBrWBrW
BrWBrWBrWBrWBrW
BrWBrWDugBrWBrW
80 Geohydrology and Water Quality of Stratified-Drift Aquifers in the Winnipesaukee River Basin, Central New Hampshire

-Continued
Loc; sit<
num
al9
ber
Water level Top of Bottom ofDepth (feet)
Date screen screen (mm-dd-yy) (feet) (feet)
Use of
water
Pumping Driller Yield Drawdown Specific period or NHWRD
(gal/min) (feet) capacity (hours) number
CARROLL COUNTY
Moultonborouah-Con tinued
MWW
MWW
MWW
MWW
MWW
MWW
MWW
MWW
MWW
MWW
MWW
MWW
MWW
MWW
MWW
MWW
MWW
MWW
MWW
MWW
MWW
MWW
MWW
MWW
MWW
MWW
MWW
MWW
MWW
MWW
MWW
MWW
MWW
MWW
MWW
MWW
MWW
MWW
MWW
MWW
MWW
MWW
MWW
MWW
MWW
MWW
MWW
MWW
MWW
MWW
MWW
MWW
MWW
MWW
MWW
81848896
101
103106111114116
120132153155165
171177179180181
183187194197198
199201203206207
210214217218219
220221222225227
228232234238257
258265275287295
301303304307309
15.0----
30.0
__20.020.0 --
__
25.0 7.0
60.030.0----
3.0
30.0--
10.0
40.0------
--
30.020.0
__ --
10.010.0
15.06.0
40.0
__--
65.0 --
--6.0
20.08.0
10-24-85
____
06-14-87
__08-11-8710-23-86 --
04-02-88
04-15-88
07-05-8807-09-87
____
06-02-87
08-30-87__
07-02-88
02-25-88______--
__
01-11-8901-08-89
_ __
10-07-8812-19-88
11-18-8806-12-8907-16-89 --
____
12-22-89 --
--
05-15-9010-06-9001-24-90
H
H
H
H
H
H
H
H
P
H
H
H
H
H
H
H
H
H
H
H
H
H
P
P
H
H
H
C
H
H
H
H
P
P
P
H
C
H
H
H
H
H
H
H
H
H
H
H
H
H
H
H
H
H
H
5015213
8121
10020
44162
12301047
1011
4
14
2021
110
245
_22
4
21153
30
1010
6015
204
102
25
.0
.0
.00
.50
.00
.00
.0
.50
.0
.00
.00
.00
.00
.50
.0
.0
.0
.00
.00
.0
.00
.50
.00
.00
.00
.00
.0
.50
.00
.00
.0
.00
.0
.00
_.00.00.50.00
.50
.0
.00
.50
.0
.0
.0
.50
.0
.0
.0
.00
.0
.25
.0
0.5.5.5.5.3
.5
.31.0.5.5
.5
.51.01.01.0
.5
.5
.5
.5
.5
.5
.5
.5
.5
.5
.5
.5
.5
.5
.5
.5
.5
.5
.5
.5
_.5
__.5.5
.51.01.0.5
1.0
1.01.01.01.0.5
.5
.53.0.5.5
NHWRDNHWRDNHWRDNHWRDNHWRD
NHWRDNHWRDNHWRDNHWRD
NHWRD
NHWRD
NHWRD
NHWRD
NHWRD
NHWRD
NHWRD
NHWRD
NHWRD
NHWRD
NHWRD
NHWRD
NHWRD
NHWRD
NHWRD
NHWRD
NHWRD
NHWRD
NHWRD
NHWRD
NHWRD
NHWRD
NHWRD
NHWRD
NHWRD
NHWRD
NHWRD
NHWRD
NHWRD
NHWRD
NHWRD
NHWRD
NHWRD
NHWRD
NHWRD
NHWRD
NHWRD
NHWRD
NHWRD
NHWRD
NHWRD
NHWRD
NHWRD
NHWRD
NHWRD
NHWRD
20
20
1
319126
3151261922020
202022903
2220202020
2020202020
202020
319319
31920202020
909090
142142
142534
39090
9090229020
2020
1252020
Appendix A 81

Table A-1. Description of selected wells, borings, and springs in the Winnipesaukee River Basin, central New Hampshire
Local site number
Lat itude
Long itude
Owner or userDate Ele- of vat-
con- tion struction (feet)
Diameter Depth to Casing of bottom mater-
casing of casing ial (inches) (feet)
Type of fin ish
Type of
site
CARROLL COUNTY
Moultonborough-Continued
MWW
MWW
MWW
MWW
MWW
MWW
MWW
MWW
MWW
MWW
MWW
MWW
MWW
MWW
MWW
SEW
SEW
SEW
SEW
SEW
SEW
SEW
SEW
SEW
SEW
SEW
SEW
SEW
TZA
TZA
TZA
TZA
TZA
TZA
TZA
TZA
TZA
TZA
TZA
TZA
TZA
TZA
TZA
TZA
TZA
TZW
TZW
TZW
TZW
TZW
TZW
310
316
321
323324
326330331332334
335339340343355
1015213149
50536061
105
108150151
12345
if
6789
10
1213141516
1718123
456
434150434221434534434407434408
434335434535434306434624434341
434359434359434331434243434522
434821434842434925434900434905
434734434829434822434826434825
434738434847434824
434208434159434155434158434205
434211434213434159433814433854
434051434052434053433931434158
433811434006434210434211434203
434002434043434221
07120250712315071231607121560712158
07126430712153071255607124190712229
07128340712207071283307122310712311
07126340712610071252007124530712446
07126520712629071261507126300712624
071265507125570712630
07115070711506071151007115140711514
07115110711807071180707115170711640
07117210711723071172707115580711557
07114380711547071150907114370711727
071152307116000711507
Terry, J.McTwigan, G.Murphy, K.Mason, T.Mason, T.
Wood & ClayCameron, D.Viccara, N.Hume , D .Roach, E.
SoltisEconomo, L.McAntire, F.Landrine, J.Carson, C.
Pohl, P.Gabriel Jr, R.Quimby, L.Paterno, B.Seeley, M.
Toby Eaton BldrsHadley, T.Sandwich Home IndKimball, G.Houston, A.
Raws on, J.NolanPiper, D.
Tuftonboro LandfillTuftonboro LandfillTuftonboro LandfillTuftonboro LandfillTuftonboro Landfill
Tuftonboro LandfillBerry, TBerry, THunter, S.Tuftonboro, Town of
Nash Comp.Nash Comp.Nash Comp .McWhirter, GeorgeSargent, Fred
State Rte. 190ABill StockmanHunter, StevenState Rte. 171Detwiler
UnknownWilliams, BarbaraSmith, Doris
01-26-9009-27-9009-03-9010-20-9010-25-90
12-15-9012-26-8912-19-8911-09-8910-04-89
10-11-8908-31-9003-22-9006-12-9005-14-91
Sandwich
03-26-8707-03-8606-07-8508-20-8603-21-88
03-09-8805-13-8807-06-8805-23-8803-01-89
08-06-9009-18-8506-11-85
Tuftonboro
08- -7408- -7408- -7408- -7408- -74
08- -7407-31-9007-31-9010-25-9006-27-91
09-09-8709-10-8709-11-8707-23-9107-26-91
10-23-9010-13-92
--10-29-9006-28-91
__----
560540580550550
520840590580510
550540580520580
650660760640670
620680650680660
630660660
700700680680700
700585575535510
520520515535640
560595690690577
640585760
10030.029.0
50.0
33.031.040.040.0
105
45.088.060.040.029.0
40.043.039.01.0
40.0
94.040.040.040.040.0
39.034.0
139
____ __
----
____----
____
2 51 P
____--
X
X
X
X
X
X
X
X
X
X
X
X
X
X
X
X
X
X X
X
X
X
X
X
X
X
X
-- --
--
--------
--SS
www
BrWBrWBrWBrWBrW
BrWBrWBrWBrWBrW
BrWBrWBrWBrWBrW
BrWBrWBrWDugBrW
BrWBrWBrWBrWBrW
BrWBrWBrW
BorBorBorBorBor
BorBorBorBorBor
BorBorBorBorBor
BorBor--
BorBor
DugDugDug
82 Geohydrology and Water Quality of Stratified-Drift Aquifers in the Winnipesaukee River Basin, Central New Hampshire

-Continued
Localsite
number
Water level Top of Bottom ofDepth(feet)
Date screen screen(mm-dd-yy) (feet) (feet)
Useof
water
Pumping DrillerYield Drawdown
(gal/min) (feet)Specific period or NHWRDcapacity (hours) number
CARROLL COUNTY
Moultonborouffh-Con tinued
MWW 310MWW 316MWW 321MWW 323MWW 324
MWW 326MWW 330MWW 331MWW 332MWW 334
MWW 335MWW 339MWW 340MWW 343MWW 355
SEW 10SEW 15SEW 21SEW 31SEW 49
SEW 50SEW 53SEW 60SEW 61SEW 105
SEW 108SEW 150SEW 151
TZA 1TZA 2TZA 3TZA 4TZA 5
TZA 6TZA 7TZA 8TZA 9TZA 10
TZA 12TZA 13TZA 14TZA 15TZA 16
TZA 17TZA 18TZW 1TZW 2TZW 3
TZW 4TZW 5TZW 6
35.0-- ----
20.0--
30.010.0
20.010.020.020.0--
-- --
20.0
15.0--
15.0
__----
3840 --
------
15.211.23.7
1077
----4.74
14.7
4.867.08.35
01-27-90__ __--
__12-26-89
__11-11-8910-05-89
10-12-8909-01-9003-23-9006-13-90
--
____ __
03-21-88
____
07-07-88__
03-02-89
____--
08- -7408- -74 __--
________--
09-09-8709-10-8709-11-8707-23-9107-26-91
__
07-02-91 21.5 2307-02-91 48.5 51
06-17-9106-18-9106-18-91
HHHPP
HHHHH
HHHHH
HHHHH
HHCHH
HHH
UUUUU
U--
U--
U
PUUUU
UUUU
HHH
30.03.001.50
30.040.0
2.0040.01.25.75
1.00
75.02.003.501.00
50.0
Sandwich
.505.002.50__7.00
8.004.00
15.05.006.00
10.04.00
12.0
Tuftonboro
__ __--
______--
16.0______
-_ __--
______
0.51.0.5
1.01.0
.5
.5
.5
.5
.5
.5
.5
.5
.5
.5
1.01.02.0
__.5
.51.0.5.5.5
.5
.51.0
__ __--
______--
48.0______
__ __--
______
NHWRD 20NHWRD 90NHWRD 319NHWRD 3NHWRD 3
NHWRD 319NHWRD 142NHWRD 142NHWRD 142NHWRD 142
NHWRD 142NHWRD 142NHWRD 142NHWRD 142NHWRD 319
NHWRD 22NHWRD 192NHWRD 3NHWRD 125NHWRD 22
NHWRD 319NHWRD 3NHWRD 20NHWRD 20NHWRD 20
NHWRD 22NHWRD 1NHWRD 90
ClattenburgClattenburgClattenburgClattenburgClattenburg
Clattenburgusesusesusesuses
D.L. Maher COD.L. Maher COD.L. Maher COusesuses
usesuses
usesuses
__OwnerSmith
Appendix A 83

Table A-1. Description of selected wells, borings, and springs in the Winnipesaukee River Basin, central New Hampshire
Local site number
Lat itude
Long itude
Owner or userDate of con
struction
Ele- vat- tion
(feet)
Diameter Depth to Casing of bottom mater-
casing of casing ial (inches) (feet)
Type of fin ish
Type of
site
CARROLL COUNTY
Tuf tonboro-Con tinued
TZW
TZW
TZW
TZW
TZW
TZW
TZW
TZW
TZW
TZW
TZW
TZW
TZW
TZW
TZW
TZW
TZW
TZW
TZW
TZW
TZW
TZW
TZW
TZW
TZW
TZW
TZW
TZW
TZW
TZW
TZW
TZW
TZW
TZW
TZW
TZW
TZW
TZW
TZW
TZW
TZW
WRA
WRA
WRS
WRW
WRW
WRW
WRW
WRW
WRW
WRW
8
9
11161826
2729353943
4447486371
889599
102104
107108109111114
116128130132133
137139142144145
148158163167168
13112
346
1112
434201434221
434110434213434123'433816
434117434110433941433957433919
433745434110434118433915434017
434217433821433958433839434044
433918433924433924434208434018
433910434204434236434153434137
433951433923434055434050434119
433939433759433904434015434015
433627433826433748433657433444
433718433726433646433642433635
07116340711658
0711753071144507118440711438
07118320711748071173507117120711706
07115550711332071184307116510711526
07117230711444071170907114550711604
07116470711523071152107118030711524
0711701071135307117190711802
' 0711831
07117030711518071173107116340711907
07117180711430071163807115500711551
07111190710924071135607109570710824
07109030711047071103207109040711129
Bean, EdwardThompson, Lester
MasonBolton, J.Ladd ConstMorgan , E .
Hanson, N.Swift, C.Johnson, B.Sawyer , N .Red Gate Cottage Colony
McGrath, J.Leroux, A.Hodges , B .Edge-0-Lakes TrailersHealy, B.
Hunter, P.Roseen, E.Triolo, A.Haeger, M.Rudolph, G.
Berry, S.North Country VilNorth Country VilBerry , C .& K. DuBrino, F.
Cravotta, T.Stockman, G.Gribbell, J.Hersey, H.Beldings
Feeley, J.North County VillageBob Baker Ent0. T. Patrol Shed, D.Mazerka, E.
Onufrak, M.Meehan , M .Hughes , S .Bill StockmanBill Stockman
Albee Constr.State Rte. 28
--
Fernald Sta.DeVylder, Denis
Jewel 1Diprizio, T.Wolfeboro Full GospelBickfordHersey, R.
07-24-9107-25-91
04-19-8412-20-8411-27-8412-20-85
08-27-8511-01-8502-14-8405-08-8604-30-86
04-24-8608-11-8606-11-8612-18-8607-15-87
10-22-8709-16-8704-07-8803-25-8807-13-88
07-25-8806-02-8805-26-8809-10-8811-17-87
09-14-8805-30-8904-04-8906-14-8904-29-89
09-09-8905-04-8805-25-8805-01-8910-31-89
11-30-8907-09-9010-26-9010-13-92
--
Wolfeboro
10-26-90----
10-21-90
02-22-8404-02-8407-24-8408-11-8411-27-84
600615
510700540570
515530510530530
5201080510550650
660580520600580
580590590580650
510800670560570
510600510580520
510580520585583
600630650550590
580680570540600
2 202 27
PP
52.0169 --
56.041.0
84.049.0
112249
----
41.0
20201003079
2980
2023993
2041463580
4080
12360
123
1414570
120137
598979
2 17
----
2 17
3737444099
.0
.0
.0
.0
.0
.0--
.0
.0
.0
.0
.0
.0
.0
.0
.0--
.0
.0.0
--
.0
.0
.0
.5 P-
_--.5 P-
.0
.0
.0
.0
.0
sS
X
X
X
X
X
X
X
X
X
X
X
X
X
X
X
X
X
X
X
X
X
X
sX
X
X
X
X
X
X
X
X
X
X
X
X
X
sC
----sw
X
X
X
X
X
BorBor
BrWBrWBrWBrW
BrWBrWBrWBrWBrW
BrWBrWBrWBrWBrW
BrWBrWBrWBrWBrW
BrWBrWBrW--
BrW
BrWBrWBrWBrWBrW
BrWBrWBrWBrWBrW
BrWBrWBrWBorDug
BorTHSpBorDug
BrWBrWBrWBrWBrW
84 Geohydrology and Water Quality of Stratlfied-Drift Aquifers in the Winnipesaukee River Basin, Central New Hampshire

-Continued
Localsite
number
Water level Top of Bottom ofDepth (feet)
Date screen screen (mm-dd-yy) (feet) (feet)
Use Pumping Driller of Yield Drawdown Specific period or NHWRD
water (gal/min) (feet) capacity (hours) number
CARROLL COUNTY
TZW
TZW
TZW
TZW
TZW
TZW
TZW
TZW
TZW
TZW
TZW
TZW
TZW
TZW
TZW
TZW
TZW
TZW
TZW
TZW
TZW
TZW
TZW
TZW
TZW
TZW
TZW
TZW
TZW
TZW
TZW
TZW
TZW
TZW
TZW
TZW
8
9
11
16
18
26
27
29
35
39
43
44
47
48
63
71
88
95
99
102
104
107
108
109
111
114
116
128
130
132
133
137
139
142
144
145
17
3
20
50
20-
_.
15-
50
10
_.
-
18
20-
9
25
30-
25
9-
-
16
20
4
40-
-
-
_
-
-
-
-
.0
.0
.0
.0-.0
.0
--.0
.0-
.0
.0
.0-.0
.0--.0
.0
.0
.0---
_----
07-24-91 17 20
07-25-91 24 27
04-20-84
12-20-84
11-27-84
11-02-85
__
05-10-86
04-30-86
06-12-86
12-18-86
--
12-07-87
09-16-87
04-11-88
__
07-14-88
07-26-88
__
__
09-10-88
11-18-87
09-16-88
06-02-89
__
__
--
__
__
__
--
Tuf tonboro-Con tinued
uu
H
H
H
H
H
H
H
H
P
H
H
H
f
H
H
H
H
H
H
H
H
H
H
H
H
H
H
H
H
H
H
H
P
H
-
2
20
3
40
10
6
3
10
3
3
4
10
2
2
8
1
20
8
4
25
30
15
4
4
4
5
15
50
1
1
5
5
12
-
.00
.0
.00
.50
.0
.0
.50
.00
.0
.50
.00
.00
.0
.00
.00
.00
.50
.0
.00
.50
.0
.0
.0
.00
.50
.00
.00
.0
.0
.00
.00
.00
.00
.0
--
__--
11
1--.----
1
12
--
1
1
1--
1
1
1__
__
1--
__
1
1--
1
1--
1
-
.5
.5
.0
.8
.0
.5
.5
.5
.0
.0
.0
.5
.0
.0
.0
.5
.0
.0
.5
.0-
-
.0
.5
.5
.5
.0
.0
.8
_
.0
.0
.5
.5
usesuses
NHWRD
NHWRD
NHWRD
NHWRD
NHWRD
NHWRD
NHWRD
NHWRD
NHWRD
NHWRD
NHWRD
NHWRD
NHWRD
NHWRD
NHWRD
NHWRD
NHWRD
NHWRD
NHWRD
NHWRD
NHWRD
NHWRD
NHWRD
NHWRD
NHWRD
NHWRD
NHWRD
NHWRD
NHWRD
NHWRD
NHWRD
NHWRD
NHWRD
NHWRD
22
22
397
406
3
22
20
22
3
3
406
22
3
406
123
22
22
3
22
534
177
177
371
20
22
22
3
3
406
457
90
90
140
90
Tuf tonboro-Con tinued
TZW
TZW
TZW
TZW
TZW
148
158
163
167
168
10-
-
12-
.0--
-
12-01-89
__
10-13-92 17.5 20.0--
H
H
H
U
I
5
6
4-
.00
.00
.00_
1--
__
.0
.3
.5-
NHWRD
NHWRD
NHWRD
USGS
3
247
247
B. Stockman
Wolfaboro
WRA
WRA
WRS
WRW
WRW
WRW
WRW
WRW
WRW
WRW
1
3
1
1
2
3
4
6
11
12
_
-
-
6
8
8-
25-
-
_--.28
.78
.0-
.0--
07-02-91 17.5 2006-17-91
02-22-84
__
07-24-84
__
__
U
uu
H
H
H
H
H
-----
20
12
2
10
____-
.0
.0
.00
.0
.25
__
--
48--
__
_
-
-
-
-
.0
.5
.5-
-
USGS
USGS--
NHWRD
NHWRD
NHWRD
NHWRD
NHWRD
2
3
22
3
319
Appendix A 85

Table A-1. Description of selected wells, borings, and springs in the Winnipesaukee River Basin, central New Hampshire
Local site number
Lat itude
Long itude
Owner or userDate of
con struction
Ele- vat- tion
(feet)
Diameter Depth to Casing of bottom mater-
casing of casing ial (inches) (feet)
Type of fin ish
Type of
site
CARROLL COUNTY
Mol f boro-Con tinued
WRW
WRW
WRW
WRW
WRW
WRW
WRW
WRW
WRW
WRW
WRW
WRW
WRW
WRW
WRW
WRW
WRW
WRW
WRW
WRW
WRW
WRW
WRW
WRW
WRW
WRW
WRW
WRW
WRW
WRW
WRW
WRW
WRW
WRW
WRW
WRW
WRW
WRW
WRW
WRW
WRW
WRW
WRW
WRW
1920293233
3437434445
5971727374
7576788081
8287899294
102104108110111
115116123125129
130132138143145
146149152154
433630433615433618433720433700
433626433650433641433640433619
433736433623433624433624433624
433623433623433816433734433735
433656433645433516433430433637
433446433821433431433618433510
433642433634433624433435433631
433759433643433634433732433444
433813433647433512433618
07111370711100071103807109070710942
07111370711011071082807108270710753
07112080710753071075207107520710751
07107500710749071090907111020711106
07110300711019071144107108270710635
07108360710901071082907107510711433
07110250711222071080407108340711141
07109250710918071131607110590710825
0710927071100807114350710747
Runnals, C.GameroMcKechnie, W.Moran, L.Ort, F.
Matte, T.Pfeifer, W.Griffin, B.Clark, D.Giroux, E.
Sullivan, R.Mtn View Ter PartnershipMtn View Ter PartnershipMtn View Ter PartnershipMtn View Ter Partnership
Mtn View Ter PartnershipMtn View Ter PartnershipFoss, D.Papps , P .Quimby, K.
Your Xtra Room IncWichroskiBunting, D.Buckingham, E.Bean, B.
Baehrend, J.Crowther , B .Calligandes ConstHer t ling, M.Hess, G.
Fernald, C.Streeter, E.Baldwin, H.Garnsey, F.Warren Devel Corp
Bartlett, K.Hill, C.
07-22-8506-27-8502-25-8604-19-8605-14-86
02-27-8606-21-8605-06-8708-21-8608-19-86
05-18-8709-19-8708-20-8709-21-8709-22-87
09-23-8709-25-8710-12-8706-29-8706-20-87
01-06-8610-01-8705-06-8805-26-8802-01-88
08-05-8801-06-8711-07-8801-11-8911-01-88
05-19-8906-26-8908-21-8910-19-8911-19-90
05-09-9004-17-90
Spencer Hughes Const Deve 11-01-89Lin-HoDevylder, D.
Armour, C.Baldwin, P.&. M. Fischer, W.Stocton, R.
06-27-9006-18-90
07-24-9011-17-9012-03-9003-18-91
600540540590540
600540540540580
730580580590590
590590700700700
580540540620660
590750620580530
540620570620600
620540620680590
620540520600
10060393121
80104624186
4110210810294
102102394141
4042393942
9360597940
4029795986
4231494080
493237
104
__.0.0.0.0
.0--
.0
.0
.0
.0------
.0
--
.0
.0
.0
.0
.0
.0
.0
.0
.0
.0
.0
.0
.0
.0
.0
.0
.0
.0
.0
.0
.0
.0
.0
.0
.0
.0 "
X
X
X
X
X
X
X
X
X
X
X
X
X
X
X
X
X
X
X
X
X
X
X
X
X
X
X
X
X
X
X
X
X
X
X
X
X
X
X
X
X
X
X
X
BrwBrW
BrW
BrW
BrW
BrW
BrW
BrW
BrW
BrW
BrW
BrW
BrW
BrW
BrW
BrW
BrW
BrW
BrW
BrW
BrW
BrW
BrW
BrW
BrW
BrW
BrW
BrW
BrW
BrW
BrW
BrW
BrW
BrW
BrW
BrW
BrW
BrW
BrW
BrW
BrW
BrW
BrW
BrW
MERRiMACK COUNTY
FKW
FKW
FKW
FKW
FKW
778798081
432648432638432637432637432635
07137420713722071385607138560713856
Dillon, B.
Cumberland Farms No. 20Cumberland Farms No. 20Cumberland Farms No. 20
Franklin
04- -62--
02-06-9002-06-9002-06-90
460408300301299
85
222 1
___.9 P
P.9 P
__ sss
BrW
Bor
Bor
Bor
Bor
86 Geohydrology and Water Quality of Stratified-Drift Aquifers in the Winnipesaukee River Basin, Central New Hampshire

-Continued
Local site
number
Water level Top of Bottom ofDepth (feet)
Date screen screen (mm-dd-yy) (feet) (feet)
Use Pumping Driller of Yield Drawdown Specific period orNHWRD
water (gal/min) (feet) capacity (hours) number
CARROLL COUNTY
Wolf «boro-Con tinned
WRW 19WRW 20WRW 29WRW 32WRW 33
WRW 34WRW 37WRW 43WRW 44WRW 45
WRW 59WRW 71WRW 72WRW 73WRW 74
WRW 75WRW 76WRW 78WRW 80WRW 81
WRW 82WRW 87WRW 89WRW 92WRW 94
WRW 102WRW 104WRW 108WRW 110WRW 111
WRW 115WRW 116WRW 123WRW 125WRW 129
WRW 130WRW 132WRW 138WRW 143WRW 145
WRW 146WRW 149WRW 152WRW 154
15.06.03.0--
45.0------
15.0
5.021.020.0----
22.030.0--
60.0--
10.0
40.020.0 ----
2.0--
18.025.0--
8.0-- --
__14.010.060.0
06-27-8502-26-8604-20-86
--
02-28-86______
08-19-86
05-19-8709-19-8709-22-87
__--
09-25-8710-13-87
__
10-01-87
__05-31-88
--
08-05-8801-07-87 __--
06-01-89__
08-22-8910-19-89
--
04-19-90
__ --
__11-17-9012-03-9003-25-91
HHHHH
HHHHH
HHHHH
HHHHH
CHHHH
HHHHH
HHHHH
HHHHH
HH--
H
12.05.002.00
12.03.00
3.50.25.75
9.002.00
4.501.001.00.75.50
.75
.7515.01.002.50
4.502.0
12.01.50
18.0
4.502.00.50.50
15.0
2.752.001.00
12.01.50
3.001.505.005.00
100
17.02.0015.0.33
1.0.5
1.01.01.5
.51.51.0.8
1.0
.51.01.01.01.0
1.01.01.01.01.0
.51.01.0.5
36.0
1.0.5
2.01.01.0
.5
.31.01.0.8
1.01.0.3
1.0.5
.31.0
36.01.0
NHWRD 3NHWRD 22NHWRD 3NHWRD 3NHWRD 406
NHWRD 22NHWRD 406NHWRD 406NHWRD 406NHWRD 3
NHWRD 22NHWRD 123NHWRD 123NHWRD 123NHWRD 123
NHWRD 123NHWRD 123NHWRD 3NHWRD 644NHWRD 644
NHWRD 20NHWRD 22NHWRD 3NHWRD 138NHWRD 158
NHWRD 3NHWRD 20NHWRD 644NHWRD 143NHWRD 457
NHWRD 22NHWRD 247NHWRD 123NHWRD 277NHWRD 406
NHWRD 534NHWRD 534NHWRD 247NHWRD 3NHWRD 22
NHWRD 406NHWRD 277NHWRD 158NHWRD 22
MERRiMACK COUNTY
FKW 7
FKW 78
FKW 79
FKW 80
FKW 81
__--5.155.745.34
____
02-06-90 .9 10.902-06-90 4 1402-06-90 1.9 11.9
__--
UUU
Franklin
____--____
______ __
Thomas , B .NHDOTCapital EnvCAPITAL ENVCapital Env
Appendix A 87
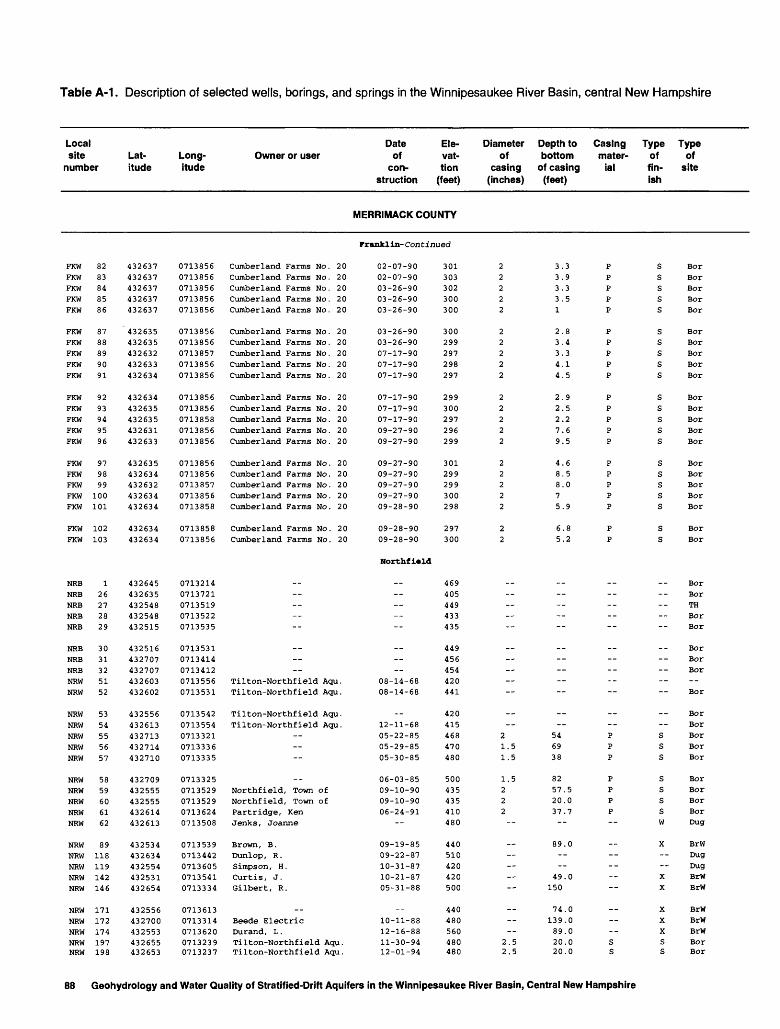
Table A-1. Description of selected wells, borings, and springs in the Winnipesaukee River Basin, central New Hampshire
Localsitenumber
Latitude
Longitude
Owner or userDateofcon
struction
Ele-vat-tlon(feet)
Diameterof
casing(inches)
Depth tobottomof casing(feet)
Casingmaterial
Typeoffinish
Typeof
site
MERRIMACK COUNTY
Franklin-Continued
FKWFKW
FKW
FKW
FKW
FKW
FKW
FKW
FKW
FKW
FKW
FKW
FKW
FKW
FKW
FKW
FKW
FKW
FKW
FKW
FKW
FKW
NRB
NRB
NRB
NRB
NRB
NRB
NRB
NRB
NRW
NRW
NRW
NRW
NRW
NRW
NRW
NRW
NRW
NRW
NRW
NRW
NRW
NRW
NRW
NRW
NRW
NRW
NRW
NRW
NRWNRW
82
83
84
85
86
8788899091
9293949596
979899
100101
102103
126272829
3031325152
5354555657
5859606162
89118119142146
171172174197198
432637432637432637432637432637
432635432635432632432633432634
432634432635432635432631432633
432635432634432632432634432634
432634432634
432645432635432548432548432515
432516432707432707432603432602
432556432613432713432714432710
432709432555432555432614432613
432534432634432554432531432654
432556432700432553432655432653
07138560713856071385607138560713856
07138560713856071385707138560713856
07138560713856071385807138560713856
07138560713856071385707138560713858
07138580713856
07132140713721071351907135220713535
07135310713414071341207135560713531
07135420713554071332107133360713335
07133250713529071352907136240713508
07135390713442071360507135410713334
07136130713314071362007132390713237
Cumberland Farms No. 20Cumberland Farms No. 20Cumberland Farms No. 20Cumberland Farms No. 20Cumberland Farms No. 20
Cumberland Farms No. 20Cumberland Farms No. 20Cumberland Farms No. 20Cumberland Farms No. 20Cumberland Farms No. 20
Cumberland Farms No. 20Cumberland Farms No. 20Cumberland Farms No. 20Cumberland Farms No. 20Cumberland Farms No. 20
Cumberland Farms No. 20Cumberland Farms No. 20Cumberland Farms No. 20Cumberland Farms No. 20Cumberland Farms No. 20
Cumberland Farms No. 20Cumberland Farms No. 20
__-- ----
__----
Tilton-Northfield Agu.Tilton-Northfield Agu.
Tilton-Northfield Agu.Tilton-Northfield Agu.
----
_.Northfield, Town ofNorthfield, Town ofPartridge, KenJenks , Joanne
Brown, B.Dunlop, R.Simpson, H.Curtis, J.Gilbert, R.
Beede ElectricDurand, L .Tilton-Northfield Agu.Tilton-Northfield Aqu.
02-07-9002-07-9003-26-9003-26-9003-26-90
03-26-9003-26-9007-17-9007-17-9007-17-90
07-17-9007-17-9007-17-9009-27-9009-27-90
09-27-9009-27-9009-27-9009-27-9009-28-90
09-28-9009-28-90
Northfield
-- ----
__----
08-14-6808-14-68
12-11-6805-22-8505-29-8505-30-85
06-03-8509-10-9009-10-9006-24-91
09-19-8509-22-8710-31-8710-21-8705-31-88
10-11-8812-16-8811-30-9412-01-94
301303302300300
300299297298297
299300297296299
301299299300298
297300
469405449433435
449456454420441
420415468470480
500435435410480
440510420420500
440480560480480
22222
22222
22222
22222
22
-- ----
__------
--
21.51.5
1.5222
----
--
2.52.5
3.33.93.33 .51
2.83.43.34.14.5
2.92.52.27.69.5
4.68.58.075.9
6.85.2
-- --
__------
--
546938
8257.520.037.7
89.0----
49.0150
74.0139.089.020.020.0
ppppp
ppppp
ppppp
ppppp
pp
-- --
------
--ppp
pppp
----
--ss
sssss
sssss
sssss
sssss
ss
-- --
__------
sss
ssssw
X----X
X
X
X
X
ss
BorBorBorBorBor
BorBorBorBorBor
BorBorBorBorBor
BorBorBorBorBor
BorBor
BorBorTHBorBor
BorBorBor--Bor
BorBorBorBorBor
BorBorBorBorDug
BrWDugDugBrWBrW
BrWBrWBrWBorBor
88 Geohydrology and Water Quality of Stratified-Drift Aquifers in the Winnipesaukee River Basin, Central New Hampshire

-Continued
Localsite
number
Water levelDepth (feet)
Date (mm-dd-yy)
Top ofscreen
(feet)
Bottom ofscreen (feet)
Use Pumping Drillerof Yield Drawdown Specific period or NHWRD
water (gal/min) (feet) capacity (hours) number
CARROLL COUNTY
FKW
FKW
FKW
FKW
FKW
FKW
FKW
FKW
FKW
FKW
FKW
FKW
FKW
FKW
FKW
FKW
FKW
FKW
FKW
FKW
FKW
FKW
NRB
NRB
NRB
NRB
NRB
NRB
NRB
NRB
NRW
NRW
NRW
NRW
NRW
NRW
NRW
NRW
NRW
NRW
NRW
NRW
NRW
NRW
NRW
NRW
NRW
NRW
NRW
NRW
NRW
NRW
82
83
84
85
86
87
88899091
9293949596
979899
100101
102103
126272829
3031325152
5354555657
5859606162
89118119142146
171172174197198
5.7.6.5.5.
6.7.7.8.8.
8.7.3.8.7.
7.8.99.9.
11.10.
-- --
----
14
12.11.10.10.19.
28.
5.5.
20.
__
8.6.--
25.
__----
16
5257805308
3803037108
095808709
3543
8579
51
14258
8392478
00
0
7.3
02-07-9002-07-9003-28-9003-28-9003-28-90
03-28-9003-28-9008-14-9007-17-9007-17-90
07-17-9007-17-9007-17-9010-01-9010-01-90
10-01-9010-01-9010-01-9010-01-9010-01-90
10-01-9010-01-90
----
__--
08-14-68
08-15-6812-11-6805-22-8505-29-8505-30-85
06-03-8507-02-9107-02-9107-02-9106-13-91
__09-24-8711-02-87
06-01-88
__----
11-30-9412-01-94
33331
23344
22279
48875
65
_----
_----
--
546938
82572037-
_----
_--
3820
.3
.9
.3
.5
.8
.4
.3
.1
.5
.9
.5
.2
.6
.5
.6
.5
.9
.8
.2
_----
_----
--
.5
.5-
_----
_--
1313131311
12138
1414
12127
1719
1418181715
1615
_----
_----
--
597343
85803040-
_----
_--
4426
.3
.9
.3
.5
.8
.4
.3
.1
.5
.9
.5
.2
.6
.5
.6
.5
.0
.9
.8
.2
_----
_----
--
-
_----
_--
Franklin-Continued
uuuuu
uuuuu
uuuuu
uuuuu
uu
Northfi«ld
__
__
uuu
uu__uu
H
H
H
H 15.0
H 2.00
H
H 20.0
H 25.0Uu
Capital EnvCapital EnvEnv DrillingEnv DrillingEnv Drilling
Env DrillingEnv DrillingEnv DrillingEnv DrillingEnv Drilling
Env DrillingEnv DrillingEnv DrillingEnv DrillingEnv Drilling
Env DrillingEnv DrillingEnv DrillingEnv DrillingEnv Drilling
Env DrillingEnv Drilling
NHDOTNHDOT
NHDOTNHDOT
NHDOTNHDOTNHDOTLayneLayne
LayneLayneCon-Tec, IncCon-Tec, IncCon-Tec, Inc
Con-Tec, IncUSGSUSGSUSGS
--
NHWRD 382NHWRD 536NHWRD 536
.3 NHWRD 247
.5 NHWRD 382
NHWRD 2391.0 NHWRD 192.3 NHWRD 274
D.L. MaherD.L.Maher
Appendix A 89

Table A-1. Description of selected wells, borings, and springs in the Winnipesaukee River Basin, central New Hampshire
Localsitenumber
Latitude
Longitude
Owner or userDateof
construction
Ele-vat-tion
(feet)
Diameterof
casing(inches)
Depth to Casingbottom mater-of casing ial(feet)
Type Typeof offin- siteish
MERRIMACK COUNTY
Sorthfiald-Continued
NRWNRWNRWNRWNRW
NRWNRW
199
200
201
202
203
204
205
432641432637432641432637432637
432641432637
07132180713212071321907132120713214
07132180713212
Tilton-Northfield Aqu.Tilton-Northfield Aqu.Tilton-Northfield Aqu.
Tilton-Northfield Aqu.
Tilton-Northfield Aqu.
12-02-9412-05-9412-09-9412-16-9412-15-94
01-23-9602-23-96
500480500480480
500480
2.52.52.5
2.5
1.5
61.0 S68.0 S62.0 S
61.0 S
__
54.0 S
S BorS Bor
BorS BorS Bor
S BorS Bor
STRAFFORD COUNTY
MLW
NFA
NFA
NFB
NFB
NFB
NFW
NFW
NFW
NFW
NFW
NFW
NFW
NFW
NFW
NFW
NFW
NFW
NFW
NFW
NFW
NFW
NFW
NFW
NFW
NFW
NFW
NFW
NFW
NFW
NFW
NFW
NFW
NFW
NFW
NFW
NFW
NFW
NFW
NFW
11
1
23
2627
12345
678
1619
2121272829
3053545556
5961626367
6971727677
80818687
432955
432556432601431001432601432732
432557432552432542432540432539
432544432534432530432559432527
432531432531432556432559432601
432602432536432604432551432546
432941432943432724432453432854
432458432746433023432956432626
432612432616432615432603
0710636
07110060711015071101407110140711039
07109580710952071095607109570710953
07109540710955071095407109410710958
07108550710855071094107109460710945
07109490710955071095007109590710951
07107400710740071100707109530710935
07109540711023071070607109100711025
0710952071094707110100710953
Libby, G.
New Hampshire, State of ----
Larrabee, Erwin H.Parsons , FrankSwett, FredSwett, FredHersam, Richard
Rollins, DorisHockady, FrankBarnes , LeonardHunter, VirginiaClarke, Robert
Coleman, Sandynew well inside 36-inchGault, JohnSchool, New DurhamLapointe, Richard
Dadura , Edward--
StuartNew Hampshire, State ofNew Durham, Town of ,
PetersonMorine, R.Arsenault, B.Ellison, S.Silva, W.
Crothers, M.Parsons , F .Crosby, C.DeOrio, W.Mohr, D.
Cornellisen, R.Heoer , S .Bickford, David
Middl«ton
08-12-85
iMw Durham
08-15-86 ----
00-00-7300-00-80
-- --
--
00-00-74--
00-00-78
00-00-78
well
00-00-66--
08-13-8608-14-8608-15-8609-25-86
08-08-8412-10-8409-19-8404-11-8409-25-85
09-17-8511-05-8511-08-8511-19-8504-21-86
03-28-8603-28-86 -90
US Post Office, New Durham
900
510520521.5521
--
530524522525522
535528517546540
535
545547546
547545542537538
650650640660700
660660860640540
540540545545
__
----
3636
30
36--
3648
362 --
24
36--
222
----
---- --
__----
20.0
__ __
14.0 R6.5 T
11.4 T
12.2 T--
7.7 T11.9 R--
5.0 T15.0 S __
13.9 T
13.2 R--
18.0 P41.0 P18.0 P
11.019.0
10047.082.0
49.025.062.025.020.0
39.032.0----
X BrW
BorTHTHBorBor
Cbl
Dug
Dug
DugT Dvn
DugDugDvn
T Dug T DvnXX Dug
X DugP BorP BorPP Bor
BrWBrWBrW
X BrWBrW
BrWBrWBrWBrWBrW
BrWBrW
W DugW Dug
90 Geohydrology and Water Quality of Stratified-Drift Aquifers in the Winnipesaukee River Basin, Central New Hampshire
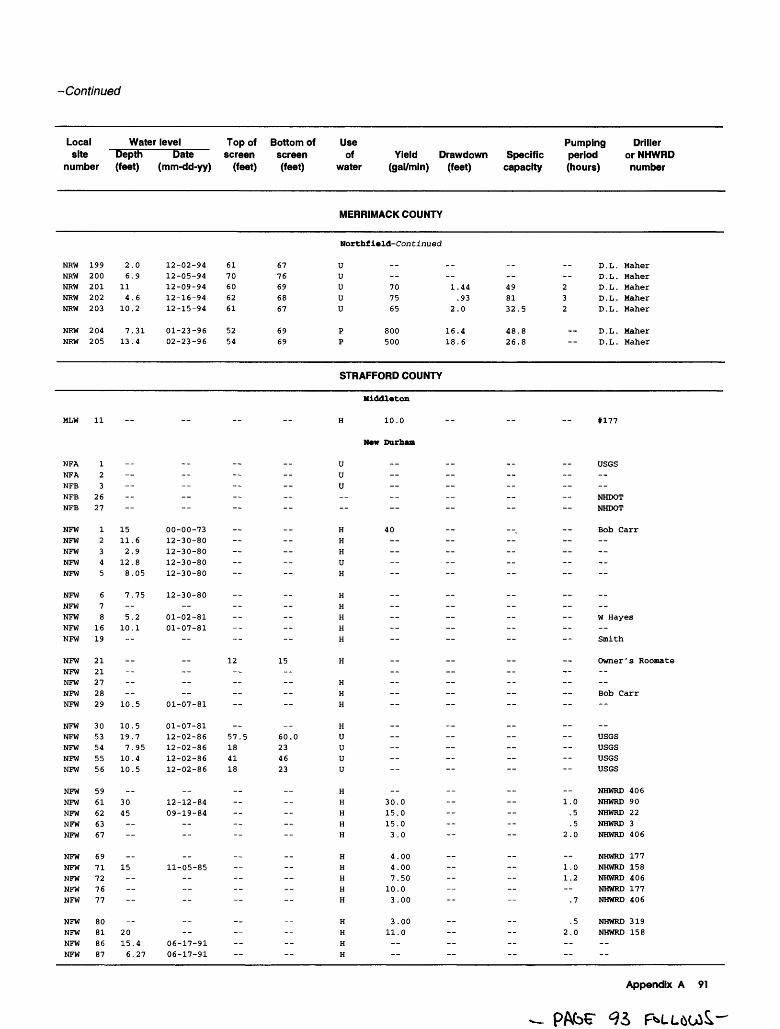
-Continued
Local site
number
Water level Top of Bottom ofDepth (feet)
Date screen screen (mm-dd-yy) (feet) (feet)
Use of Yield Drawdown Specific
water (gal/min) (feet) capacity
Pumping Driller period or NHWRD (hours) number
MERRIMACK COUNTY
Morthfiald-Continued
NRW 199NRW 200NRW 201NRW 202NRW 203
NRW 204NRW 205
2.06.9
114.6
10.2
7.3113.4
12-02-94 61 6712-05-94 70 7612-09-94 60 6912-16-94 62 6812-15-94 61 67
01-23-96 52 6902-23-96 54 69
uuuuu
pp
____
70 1.44 4975 .93 8165 2.0 32.5
800 16.4 48.8500 18.6 26.8
D.L. MaherD.L. Maher
2 D.L. Maher3 D.L. Maher2 D.L. Maher
D.L. MaherD.L. Maher
STRAFFORD COUNTY
MLW 11
NFA 1NFA 2NFB 3NFB 26NFB 27
NFW 1NFW 2NFW 3NFW 4NFW 5
NFW 6NFW 7NFW 8NFW 16NFW 19
NFW 21NFW 21NFW 27NFW 28NFW 29
NFW 30NFW 53NFW 54NFW 55NFW 56
NFW 59NFW 61NFW 62NFW 63NFW 67
NFW 69NFW 71NFW 72NFW 76NFW 77
NFW 80NFW 81NFW 86NFW 87
-
--
--
1511.62.9
12.88.05
7.75
5.210.1--
__ --
10.5
10.519.77.95
10.410.5
__
3045----
__
15------
_
2015.46.27
-
____
__
00-00-7312-30-8012-30-8012-30-8012-30-80
12-30-80__
01-02-8101-07-81
--
12 15 __
01-07-81
01-07-81
12-02-86 57.5 60.012-02-86 18 2312-02-86 41 4612-02-86 18 23
__12-12-8409-19-84
__--
__11-05-85
____--
____
06-17-9106-17-91
H
Uuu----
HHHUH
HHHHH
H
HHH
HUUUU
HHHHH
HHHHH
HHHH
Middleton
10.0
N*w Durban
______--
40____ --
____--__--
__
__ --
__
30.015.015.03.0
4.004.007.50
10.03.00
3.0011.0
__
#177
USGS __
NHDOTNHDOT
Bob Carr____ --
__
W Hayes
Smith
Owner's Roomate
Bob Carr
USGSUSGSUSGSUSGS
NHWRD 4061.0 NHWRD 90
.5 NHWRD 22
.5 NHWRD 32.0 NHWRD 406
NHWRD 1771.0 NHWRD 1581.2 NHWRD 406
NHWRD 177.7 NHWRD 406
.5 NHWRD 3192.0 NHWRD 158_-
Appendix A 91

APPENDIX B. Stratigraphic logs of selected wellsand borings in the Winnipesaukee River Basin,
central New Hampshire
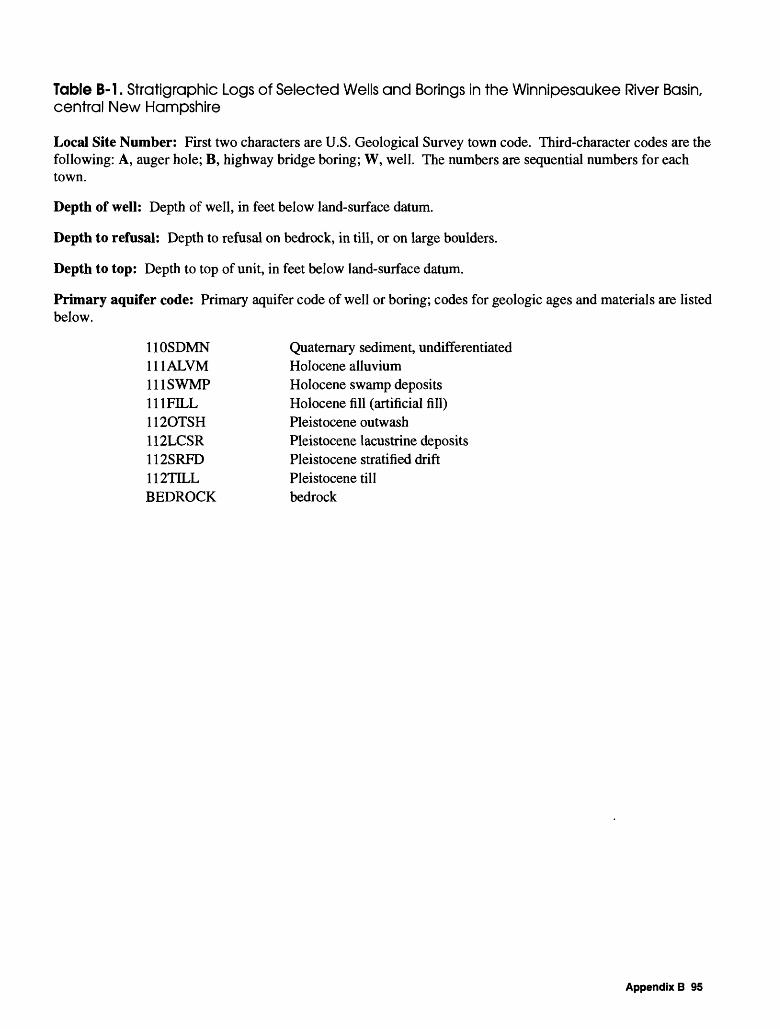
Table B-l. Stratigraphic Logs of Selected Wells and Borings in the Winnipesaukee River Basin, central New Hampshire
Local Site Number: First two characters are U.S. Geological Survey town code. Third-character codes are the following: A, auger hole; B, highway bridge boring; W, well. The numbers are sequential numbers for each town.
Depth of well: Depth of well, in feet below land-surface datum.
Depth to refusal: Depth to refusal on bedrock, in till, or on large boulders.
Depth to top: Depth to top of unit, in feet below land-surface datum.
Primary aquifer code: Primary aquifer code of well or boring; codes for geologic ages and materials are listed below.
11OSDMN Quaternary sediment, undifferentiated111 ALVM Holocene alluvium111 SWMP Holocene swamp deposits111FILL Holocene fill (artificial fill)112OTSH Pleistocene outwash112LCSR Pleistocene lacustrine deposits112SRFD Pleistocene stratified drift112TILL Pleistocene tillBEDROCK bedrock
Appendix B 95

Table B-1. Stratigraphic logs of selected wells and borings in the Winnipesaukee River Basin, central New Hampshire
Local Depth site drilled
number (feet)
Depth Depth Depth of to to well refusal top (feet) (feet) (feet)
Aquifer code
Lithologic description of
material
BELKNAP COUNTY
Alton
AHA 52 10.0
AHA 53 25.0
AHA 54 14.0
AHA 55 10.0
AHA 56 10.0
AHA 57 10.0
AHA 58 14.0
AHA 59 10.0
AHA 60 10.0
AHA 61 10.0
AHA 62 10.0
AHA 63 20.0
AHA 64 7.0
AHA 65 6.0
AHA 66 4.0
o10.
025.
02.
14.
02.
10.
05.
10.
010.
05.
14.
04.
10.
04.8,
10
04
10
05
10
04
1020
07
06
0 4
0
0
00
00
00
0
,0.0
.0
.0
.0
.0
.0
.0
.0
.0
.0
.0
.0
.0
.0
.0
.0
112SRFD112SRFD
112SRFD112SRFD
112SRFD112SRFD112SRFD
112SRFD112SRFD112SRFD
112SRFD112SRFD112SRFD
112SRFD112SRFD
112SRFD112SRFD112SRFD
112SRFD112SRFD112SRFD
112SRFD112SRFD112SRFD112SRFD
112SRFD112SRFD112SRFD
112SRFD112SRFD112SRFD
112SRFD112SRFD112SRFD112SRFD
112TILLBEDROCK
112TILLBEDROCK
112TILL BEDROCK
SANDSAND
SANDSAND
GRVLSANDSAND
GRVLSANDSAND
GRVLSANDSAND
SANDSAND
GRVLSANDSAND
SDGLSANDSAND
SDGLGRVLSANDSAND
SDGLSANDSAND
GRVLSANDSAND
SANDSDGLSANDSAND
TILLROCK
TILLROCK
TILL ROCK
Sand, fineEnd of hole
Sand, fineEnd of hole
GravelSand, fineEnd of hole
GravelSand, medium to coarseEnd of hole
GravelSand, fineEnd of hole
Sand, mediumEnd of hole
GravelSand, fineEnd of hole
GravelSand, fineEnd of hole
Sand and gravelGravelSand, medium, wetEnd of hole
Sand and gravelSand, fineEnd of hole
GravelSand, fineEnd of hole
Sand, coarseGravelSand, fineEnd of hole
Till, gravellyBedrock
TillBedrock
Till, gravelly Bedrock
96 Geohydrology and Water Quality of Stratified-Drift Aquifers in the Winnipesaukee River Basin, Central New Hampshire

Table B-1. Stratigraphic logs of selected wells and borings in the Winnipesaukee River Basin, central New Hampshire Continued
Local Depth site drilled
number (feet)
Depth Depth Depth of to to
well refusal top (feet) (feet) (feet)
Aquifer code
Lithologic description of
material
BELKNAP COUNTY
Alton-Continued
AHA 67 10.0
AHA 68 10.0
AHA 69 10.0
AHA 71 8.0
AHA 72 15.0
AHA 73 20.0
AHA 74 11.0
AHA 75 10.0
AHA 76 5.0
AHA 77 30.0
AHA 78 24.0
AHA 79 52.0
AHA 80 15.0
AHA 81 45.0
o10.
010.
010.
02.8.
03,
12.15.
020,
03,7,
11.
06,
10.
05,
030
24.0 01024
52.0 0455052
15.0 015
45.0 0
.0
,0
,0
.0
.0
.0
.0,0
.0
.0
.0
.0
.0
.0
.0
.0
.0
.0
.0
.0
.0
.0
112SRFD112SRFD
112SRFD112SRFD
112SRFD112SRFD
112SRFD112SRFDBEDROCK
112SRFD112SRFD112TILLBEDROCK
112SRFD112SRFD
112SRFD112SRFD112TILLBEDROCK
111FILL112SRFD112SRFD
112TILLBEDROCK
112SRFD112SRFD
110SDMN110SDMNBEDROCK
110SDMN110SDMN112TILL112TILL
110SDMN110SDMN
110SDMN
SDGLSDGL
SANDSAND
SDGLSDGL
GRVLSANDROCK
GRVLSANDTILLROCK
SANDSAND
GRVLSANDTILLROCK
GRVLSANDSAND
TILLROCK
SANDSAND
SANDSANDROCK
SDSTCLSDTILLTILL
SDGLROCK
SAND
Sand, gravellyEnd of hole
Sand, fineEnd of hole
Sand, gravellyEnd of hole
GravelSand, fineBedrock
GravelSand, fineTill, sandyBedrock
Sand, fineEnd of hole
GravelSand, fineTillBedrock
Fill, gravelSand, fineEnd of hole
Till, gravellyBedrock
Sand, fineEnd of hole
Sand, mediumSand, medium to fineRefusal (3 times, probably rock)
Sand, very fine, some siltClay, varved; thin medium sand layerTillRefusal; till or rock
Sand, very coarse, with pebbles and cobblesEnd of hole; refusal; boulders
Sand, medium to coarse, well sorted; some finewith coarse layers
19 .0 110SDMN SDGL Sand, coarse to very coarse and gravel, fine tocoarse; well sorted
24 .0 110SDMN SAND Sand, medium, with coarse and finesand layers; iron stained
3445
.0
.0112TILL112TILL
TILLTILL
Till with rockRefusal; rock/till
Appendix B 97

Table B-1. Stratigraphic logs of selected wells and borings in the Winnipesaukee River Basin, central New Hampshire Continued
Local Depthsite drilled
number (feet)
Depth Depthof to
well refusal(feet) (feet)
Depthtotop Aquifer
(feet) code
Lithologic descriptionof
material
BELKNAP COUNTY
Alton-Continued
AHB 1 18.0
AHB 2 55.0
0 110SOIL SOIL Topsoil1.0 110SDMN SAND Sand, fine4.0 110SDMN SDGL Gravel, sandy
14.0 112TILL TILL Till, silty18.0 112TILL TILL End of hole
0 110SDMN SAND Sand, coarse15.0 110SDMN SAND Sand, coarse27.0 110SDMN SDGL Gravel and sand, coarse38.0 110SDMN SAND Sand, coarse52.0 110SDMN SDGL Gravel and sand, coarse55.0 110SDMN SAND End of hole at 55 feet
AHB 3 26.0 26.0 0 111SWMP MUCK Muck7.5 112SRFD SAND
17.5 112TILL TILL Till, sandy; refusal at 26 feet
AHW 3 36.0 36.0 0 110SDMN GRVL Gravel18.0 110SDMN SDCL Sand, fine, and clay27.0 110SDMN GRVL Gravel36.0 400CRSL ROCK Refusal, ledge; End of hole
AHW 4 31.0 0 110SDMN SDCL Sand, brown, fine; and clay6.0 110SDMN SDGL Sand, fine; some gravel
20.0 110SDMN SDGL Sand, fine to medium; and gravel
26.0 110SDMN BLSD Sand, brown; tight, boulders32.0 110SDMN End of hole
AHW 51 8.0 8.0 0 112TILL TILL Till, boulders8.0 112TILL TILL End of hole
10.0 112SRFD SAND End of hole
AHW 52 8.0 8.0 0 8.0
112SRFD SAND Sand, gravelly 112SRFD SAND End of hole
AHW 54 8.0 8.0 0 112SRFD SDGL Sand and gravel3.0 112SRFD SDST Sand and silt8.0 112SRFD SDST End of hole
AHW 55 8.0 8.0 0 112SRFD SDGL Sand and gravel4.0 112SRFD SDST Sand and silt8.0 112SRFD SDST End of hole
AHW 56 8.0 8.0 0 8.0
112SRFD 112SRFD
SDGL Sand and gravel SDGL End of hole
AHW 57 7.0 7.0 0 7.0
112SRFD BEDROCK
SAND Sand and boulders ROCK Bedrock
AHW 59 8.0 8.0 0 8.0
112SRFD 112SRFD
SDGL Sand and gravel SDGL End of hole
AHW 60 6.0 6.0 0 6.0
112TILL TILL Till, silty BEDROCK ROCK Bedrock
AHW 61 4.0 4.0 0 4.0
112TILL TILL Till, sandy BEDROCK ROCK Bedrock
98 Geohydrology and Water Quality of Stratified-Drift Aquifers in the Winnipesaukee River Basin, Central New Hampshire

Table B-1 . Stratigraphic logs of selected wells and borings in the Winnipesaukee River Basin, central New Hampshire Continued
Local Depth site drilled
number (feet)
Depth Depth Depth of to to
well refusal top (feet) (feet) (feet)
Aquifer code
Lithologic description of
material
BELKNAP COUNTY
Alton -Continued
AHW 63 41.5
AHW 64 45.0
AHW 65 69.0
AHW 66 41.0
AHW 68
AHW 69
AHW 70
AHW 72
AHW 76
AHW 77
AHW 78
AHW 79
AHW 83
AHW 92
AHW 94
AHW 97
AHW 99
20.5 41.5 010.0 35.041.5
39.0 45.0 0 43.045.0
30.0 69.0 0 25.0 48.0 69.0
30.0 41.0 0 30.0 37.041.0
12.5 0
9.9 0
86.0 011.0
705.0 -- 0
250.0 -- 063.0
135.0 010.035.0
205.0 -- 030.0
421.0 0 45.0
300.0 -- 033.0
150.0 -- 060.0
175.0 0 10.0
156.0 -- 015.0
145.0 -- 09.0
112SRFD112SRFD 112TILLBEDROCK
112SRFD 112TILLBEDROCK
112SRFD 112SRFD 112TILL BEDROCK
112SRFD 112SRFD 112TILLBEDROCK
110SDMNBEDROCK
112TILLBEDROCK
110SDMNBEDROCK
110SDMN110SDMNBEDROCK
110SDMNBEDROCK
112TILL BEDROCK
110SDMNBEDROCK
112TILLBEDROCK
112TILL BEDROCK
112TILLBEDROCK
110SDMNBEDROCK
SAND Sand, fine to mediumSDGL Sand, very coarse to fine gravel TILL TillROCK Bedrock
SDGL Sand, coarse, variable coarse and finer layers TILL TillROCK Refusal; bedrock
SDGL Sand, very coarse; and medium sand to pebbles SAND Sand, very fine; range very fine to fine TILL Till, sandy ROCK Refusal; bedrock
SDGL Sand, fine; some coarser grains SDGL Sand, fine to coarse, dirty TILL TillROCK Refusal; bedrock
-
SANDROCK
TILLROCK
SDGLROCK
SANDSDGLROCK
SDGLROCK
TILL Sand, hardpan ROCK
SANDROCK
TILLROCK
TILL Gravel, hardpan ROCK
TILLROCK
CLAYROCK
Appendix B 99

Table B-1. Stratigraphic logs of selected wells and borings in the Winnipesaukee River Basin, central New Hampshire Continued
Local site
number
Depth Depth Depth Depth of to to drilled well refusal top (feet) (feet) (feet) (feet)
Aquifer code
Lithologic description of
material
BELKNAP COUNTY
Alton-Continued
AHW
AHW
AHW
AHW
AHW
AHW
AHW
AHW
AHW
AHW
AHW
AHW
AHW
AHW
AHW
AHW
AHW
AHW
AHW
AHW
100
101
107
119
123
126
131
142
144
175
189
190
196
206
211
213
228
243
244
245
160.0 -- 0
125.
63.0 -- 0
244.0 -- 0
10.0 -- 0
130.0 -- 053.
138.0 -- 1.
210.0 -- 040.
145.0 010.78.
400.0 -- 020.
174.0 024.
275.0 -- 035.
105.0 -- 030.
310.0 09.
200.0 -- 019.
222.0 -- 060.
460.0 058.
205.0 -- 0
100.0 -- 025
130.0 -- 029
304.0 -- 012
0
0
0
0
00
0
0
0
0
0
,0
.0
.0
.0
.0
.0
110SDMN110SDMN
BEDROCK
110SDMN
110SDMN
110SDMNBEDROCK
BEDROCK
112TILLBEDROCK
112TILL110SDMN
BEDROCK
112TILLBEDROCK
112TILLBEDROCK
110SDMNBEDROCK
110SDMNBEDROCK
112TILLBEDROCK
110SDMNBEDROCK
110SDMNBEDROCK
112TILLBEDROCK
112TILLBEDROCK
110SDMNBEDROCK
112TILLBEDROCK
SANDCLAY
ROCK
OTHR
SDCL
SANDROCK
ROCK
TILLROCK
TILLSAND
ROCK
TILLROCK
TILLROCK
SDGLROCK
SDGLROCK
TILLROCK
SDGLROCK
SDCLROCK
TILLROCK
TILLROCK
SANDROCK
TILLROCK
100 Geohydrology and Water Quality of Stratified-Drift Aquifers in the Winnipesaukee River Basin, Central New Hampshire

Table B-1. Stratigraphic logs of selected wells and borings in the Winnipesaukee River Basin, central New Hampshire Continued
Local site
number
Depth Depth Depth of to drilled well refusal (feet) (feet) (feet)
Depth to top
(feet)Aquifer code
Lithologic description of
material
BELKNAP COUNTY
Alton-Continued
AHW
AHW
AHW
AHW
AHW
AHW
AHW
AHW
AHW
AHW
AHW
AHW
AHW
AHW
AHW
AHW
AHW
254
262
264
265
266
277
281
282
283
284
291
292
293
294
295
297
306
600.
162.
82.
125.
421.
664.
220.
200.
100,
200,
180,
240
200
400
130
160
133
,0
,0
,0
.0
.0
,0
.0
.0
.0
.0
.0
.0
.0
.0
.0
.0
.0
047.
080.
042.
50.
016.
055.
010.
076.
020.55.
035.55.
081.
025.
029.
017,
028
0325160
060
020
0
0
0,0
,0
0
,0
.0
,0,0
,0,0
,0
.0
.0
.0
.0
.0
.0
.0
.0
.0
110SDMNBEDROCK
110SDMNBEDROCK
110SDMN110SDMNBEDROCK
112TILLBEDROCK
112TILLBEDROCK
110SDMNBEDROCK
110SDMNBEDROCK
110SDMN110SDMNBEDROCK
110SDMN110SDMNBEDROCK
110SDMNBEDROCK
110SDMNBEDROCK
110SDMNBEDROCK
110SDMNBEDROCK
110SDMNBEDROCK
110SDMN110SDMN110SDMNBEDROCK
110SDMNBEDROCK
110SDMNBEDROCK
SGVCROCK
CLAYROCK
SANDSDGLROCK
TILLROCK
TILLROCK
SANDROCK
SDGLROCK
SAND SandSDGL Sand and gravelROCK
SANDSDGLROCK
SDGLROCK
SANDROCK
SANDROCK
SANDROCK
SDCLROCK
SANDSDGLCLAYROCK
SANDROCK
SANDROCK
Appendix B 101

Table B-1. Stratigraphic logs of selected wells and borings in the Winnipesaukee River Basin, central New Hampshire Continued
Local Depthsite drilled
number (feet)
Depth Depth Depthof to to
well refusal top(feet) (feet) (feet)
Aquifercode
Lithologic descriptionof
material
BELKNAP COUNTY
Alton-Continued
AHW 309
AHW 311
AHW 313
AHW 321
AHW 327
AHW 334
AHW 340
AHW 350
AHW 357
AHW 361
AHW 362
AHW 364
AHW 369 38.0
AHW 370 83.0
260.0 -- 026.0
136.0 -- 010.0
400.0 024.0
87.0 -- 038.0
250.0 -- 069.0
250.0 -- 035.0
310.0 -- 08.0
185.0 012.038.0
160.0 08.0
780.0 012.026.0
220.0 015.035.0
166.0 -- 0124.0
35.0 38.0 0
12.024.0
29.034.038.0
40.0 83.0 0
110SDMNBEDROCK
112TILLBEDROCK
110SDMNBEDROCK
112TILLBEDROCK
110SDMNBEDROCK
112TILLBEDROCK
112TILLBEDROCK
110SDMN112TILLBEDROCK
112TILLBEDROCK
110SDMN110SDMNBEDROCK
110SDMN110SDMNBEDROCK
112TILLBEDROCK
110SDMN
110SDMN110SDMN
110SDMN112TILLBEDROCK
110SDMN
SANDROCK
TILL GravelROCK
SDGLROCK
TILLROCK
SDGLROCK
TILLROCK
TILLROCK
SDGLTILLROCK
TILLROCK
SANDCLAYROCK
SANDCLAYROCK
TILL Sand,ROCK
SAND Sand,brown
SAND Sand,SAND Sand,
coarse;SAND Sand,TILL Till,
, hardpan
hardpan
coarse to very coarse and pebbles,- light
very coarse to coarse; some siltcoarse, ranges from medium to verysome pebbles and cobbles,- cleanvery coarse, well sorted, cleanwith silt, pebbles and cobbles
ROCK Refusal; bedrock
SAND Sand, medium, tan; inter layered withfine, coarse, and very coarse sand
34.0 110SDMN SAND Sand, coarse, tan,- some fine gravel,well sorted
43.0 110SDMN SAND Sand, fine; some medium, with zonesof coarse to very coarse
49.0 110SDMN SAND Sand,stained,
medium to coarse, ironpoorly sorted; some medium to fine
102 Geohydrology and Water Quality of Stratified-Drift Aquifers in the Winnipesaukee River Basin, Central New Hampshire

Table B-1. Stratigraphic logs of selected wells and borings in the Winnipesaukee River Basin, central New Hampshire Continued
Local Depth site drilled
number (feet)
Depth Depth Depth of to to
well refusal top (feet) (feet) (feet)
Aquifer code
Lithologic description of
material
BELKNAP COUNTY
AHW 370-Continued54. 0
Alton -Continued
110SDMN SAND Sand, fine grading to very fine; some silt; thinlybedded, gray
80.83.
00
112TILLBEDROCK
TILLROCK
TillRefusal ,- bedrock
Belmont
BLA 26 31.0
BLA 27 21.0
BLA 28 36.0
BLA 29 14.0
BLA 30 16.0
BLA 31 9.0
BLA 32 22.0
BLB 26 16.0
BLB 27 8.0
BLB 28 100.0
BLW 13
BLW 28 68.0
31.0 -- 031.
21.0 07.
21.
36.0 -- 036.
014.
16.0 05.
16.
9.0 09.
22.0 017.22.
02.
16.
08.
100.0 034.90
100
67.5 -- 0
52.7 -- 07
105065
0
0.0
0
,0
.0,0
.0
.0
.0
.0
.0
.0
,0.0.0
.0
.0
.0
.0
112SRFD112SRFD
112SRFD112SRFD112SRFD
112SRFD112SRFD
111FILL111FILL
110SDMN110SDMNBEDROCK
112SRFD112TILL
110SDMN112TILLBEDROCK
110SDMN112TILL112TILL
110SDMNBEDROCK
112LCSR112SRFD112SRFDBEDROCK
110SDMN
111FILL110SDMN110SDMN110SDMN110SDMN
SANDSAND
SANDSANDSAND
SANDSAND
OTHRROCK
GRVLSANDROCK
GRVLTILL
SDGLTILLROCK
SANDTILLTILL
SDGLROCK
SANDSANDGRVLROCK
OTHRPEATSDGLSDGLSDGL
Sand, fine to medium, trace coarseEnd of hole
Sand and siltSand, fine to mediumEnd of hole
Sand, fine to medium, little coarseEnd of hole
FillEnd of hole,- refusal; boulder
Gravel, very silty (till?)Sand, fine to medium, tan,- with roundedRefusal, very weathered schist
Gravel, poorly sorted, dirtyRefusal; till
Sand, very coarse, and gravel; tanTill, very sandyRefusal ; bedrock
Sand, medium to coarseTill, siltyEnd of hole at 16 feet
Sand, coarse and gravelBedrock
Sand, fineSand, medium-coarseGravelRefusal; on boulders or bedrock
FillPeat
cobbles
Sand, fine to coarse; gravel; stones; gritsSand, medium to coarse; gravel; stones; gritsSand, very fine to coarse; gravel; stones,
boulders
BLW 29 75.068
63.0 -- 0104575
.0
.0
.0
.0
110SDMN110SDMN110SDMN110SDMN110SDMN
SDGLSANDSDGLSDGLSDGL
End of holeSand, fine, mediumSand, medium; and gravel; with bouldersSand, medium, coarse; and gravel; withEnd of hole
boulders
Appendix B 103

Table B-1. Stratigraphic logs of selected wells and borings in the Winnipesaukee River Basin, central New Hampshire Continued
Local Depth site drilled
number (feet)
Depth Depth Depth of to to
well refusal top (feet) (feet) (feet)
Aquifer code
Lithologic description of
material
BELKNAP COUNTY
Belmont -Continued
BLW 30 46.0
BLW 31 50.0
BLW 76 73.5
BLW 77 40.0
BLW 78 35.0
BLW 79 52.5
BLW 80 90.0
BLW 81 93.0
BLW 82 68.0
BLW 83 114.0
42.0 08.
35.46.
05.
37.
50.
73.5 028.32.60.67.
40.0 015.25.27.
29.35.
35.0 -- 09.
11.16.30,
52.5 -- 015,1637,4248
82.5 90.0 020608990
79.0 93.0 0308993
27.0 68.0 0103068
80.0 114.0 05
5580
000
00
0
0052
00000
,0
,0,0.0
.5
.4
.0
.5
.0
.0
.0
.0
.0
.0
.0
.0
.0
.0
.0
.0
.0
.0
110SDMN110SDMN110SDMN110SDMN
110SDMN110SDMN110SDMN
110SDMN
112SRFD112SRFD112SRFD110SDMNBEDROCK
110SDMN112SRFD110SDMN112SRFD112SRFDBEDROCK
110SDMN112SRFD112SRFD112SRFDBEDROCK
110SDMN112SRFD112SRFD112SRFD112SRFDBEDROCK
110SDMN110SDMN110SDMN112TILLBEDROCK
110SDMN110SDMN112TILL112TILL
112SRFD112SRFD112SRFDBEDROCK
112SRFD112SRFD112SRFD112SRFD
SOILSANDSANDSAND
SOILSANDSDGLwithSDGL
SANDGRVLSANDSDSTROCK
PEATSILTSANDSANDSDGLROCK
PEATSANDSANDGRVLROCK
PEATSILTSANDSANDSILTROCK
SANDSTCLSANDTILLROCK
SANDSANDTILLTILL
SANDSANDSANDROCK
SDGLSANDSANDSAND
TopsoilSand, light brown, fineSand, brown, fine to medium, with fine gravelEnd of hole
TopsoilSand, light brown, fine, silty, with claySand and gravel, reddish brown, fine to medium,siltEnd of hole
Sand, medium to coarse, brownGravel, fine, with medium to coarse sandSand, fine, brown, trace siltSand, silty with bouldersEnd of hole at 73 feet in bedrock
PeatSilt, brownSand, medium to fine, siltySand, medium to coarseSand and gravelEnd of hole at 40 feet
PeatSand, fine to coarseSand, fine to medium, grayGravel, fine to coarse, trace siltEnd of hole at 35 feet
PeatSilt, brownSand, medium to coarse, trace fine gravelSand, fine to coarse with gravel, graySilt, sandy with gravel, grayEnd of hole at 52.5 feet in bedrock
Sand, medium, tanSilt and claySand, mediumTillBedrock
Sand, fine, tanSand, coarse, intervals of medium to fine sandTillRefusal; till
Sand, fineSand, coarseSand, fineRefusal; bedrock
Sand, coarse and gravel, fine; tanSand, very fine, variable; graySand, medium; graySand, very fine, uniform
104 Geohydrology and Water Quality of Stratified-Drift Aquifers in the Winnipesaukee River Basin, Central New Hampshire

Table B-1. Stratigraphic logs of selected wells and borings in the Winnipesaukee River Basin, central New Hampshire Continued
Depth Depth Local Depth of to site drilled well refusal
number (feet) (feet) (feet)
Depth to top
(feet)Aquifer code
Lithologic description of
material
BELKNAP COUNTY
BLW 83 -Continued
BLW 84 78.0 60.0 78.0
BLW 85 58.0 50.0 58.0
BLW 86 82.0 57.5 82.0
BLW 87 19.5 18.9
BLW 88 22.0 21.2
BLW 89 26.5 25.6
BLW 90 26.5 25.9
110.0114.0
025.040.050.065.078.0
038.052.058.0
017.0
19.049.069.078.082.0
010.010.5
19.5
015.015.3
22.0
0
18.0
26.5
010.018.0
Belmont-Continucd
112TILL TILL TillBEDROCK
112SRFD112SRFD112SRFD112SRFD112TILLBEDROCK
112SRFD112SRFD112TILL112TILL
110SDMN110SDMN
110SDMN110SDMN110SDMN112TILLBEDROCK
111FILL110SDMN110SDMN
110SDMN
111FILL110SDMN110SDMN
110SDMN
110SDMN
110SDMN
110SDMN
111FILL110SDMN110SDMN
ROCK Bedrock
SAND Sand, coarse to fine gravelSDGL Sand, coarse to fine gravelSAND Sand, mediumSAND Sand, coarseTILL TillROCK Refusal; bedrock
SAND Sand, very fine to mediumSAND Sand, coarseTILL TillTILL Refusal in till at 58 feet
SAND Sand, coarse; and gravelSDST Sand, coarse; and silt/clay; alternating 2-inch
layersSAND Sand, coarseSAND Sand, fine with some medium and coarseSAND Sand, fine to coarse alternating layersTILL TillROCK Refusal; bedrock
OTHR FillPEAT PeatSAND Sand, medium to fine, poorly graded; tracesilt, orange-brown, some oxidationSAND End of hole
OTHR FillPEAT PeatSAND Sand, medium to fine, poorly graded; trace
silt, brownSAND End of hole
SAND Sand, medium to fine, poorly graded; tracesilt, brown
SAND Sand, fine to coarse, well graded; trace silt,brown
SAND End of hole
OTHR FillSAND Sand, medium to fine, poorly graded; some siltSAND Sand, fine to coarse, mod. graded; some silt,
BLW 91
BLW 92
BLW 93 49.0 40.0 49.0
brown, oxidation 110SDMN SAND End of hole
112SRFD
112SRFD
110SDMN SAND Sand, fine, tan110SDMN SAND Sand, medium coarse, orange-brown110SDMN SAND Sand, fine, orange-brown
Appendix B 105
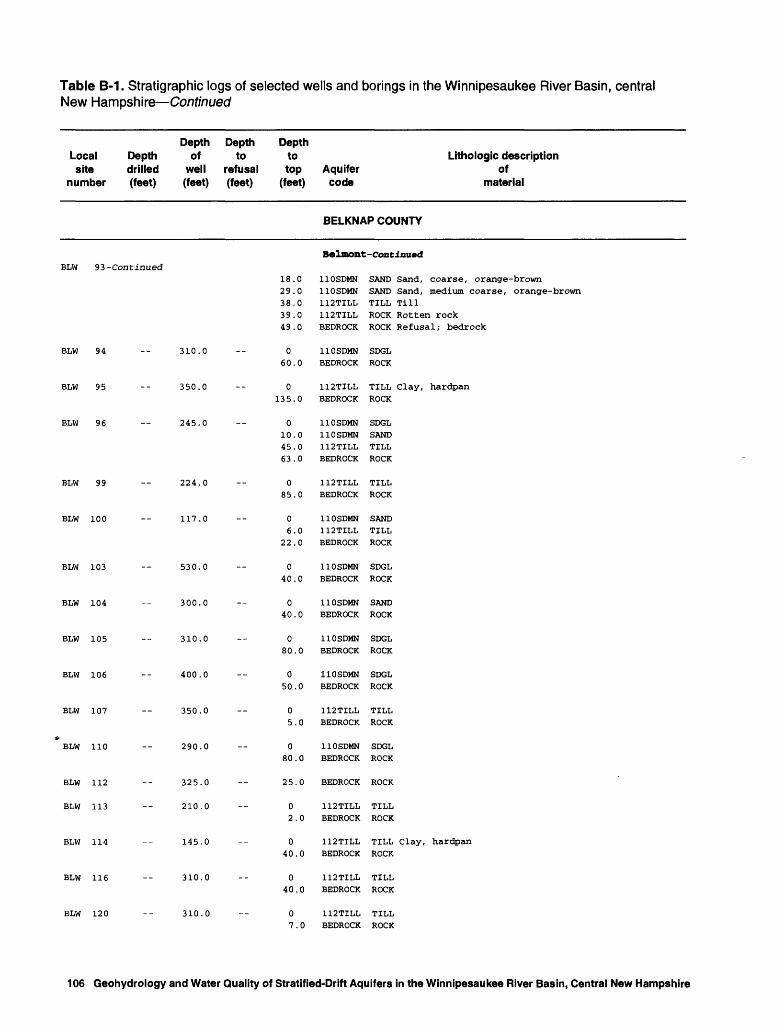
Table B-1. Stratigraphic logs of selected wells and borings in the Winnipesaukee River Basin, central New Hampshire Continued
Local site
number
Depth Depth Depth Depth of to to drilled well refusal top (feet) (feet) (feet) (feet)
Aquifer code
Lithologic description of
material
BELKNAP COUNTY
Be Intent-ContinuedBLW
BLW
BLW
BLW
BLW
BLW
BLW
BLW
BLW
BLW
BLW
BLW
BLW
BLW
BLW
BLW
BLW
93 -Continued
94
95
96
99
100
103
104
105
106
107
110
112
113
114
116
120
18.29.38.39.49.
310.0 -- 060.
350.0 -- 0135.
245.0 010.45.63.
224.0 -- 085.
117.0 -- 06.
22.
530.0 -- 040.
300.0 040.
310.0 -- 080.
400.0 -- 050
350.0 -- 05,
290.0 -- 080
325.0 -- 25
210.0 -- 02
145.0 -- 040
310.0 -- 040
310.0 -- 07
00000
0
0
000
0
00
0
.0
.0
.0
.0
.0
.0
.0
.0
.0
.0
110SDMN110SDMN112TILL112TILLBEDROCK
110SDMNBEDROCK
112TILLBEDROCK
110SDMN110SDMN112TILLBEDROCK
112TILLBEDROCK
110SDMN112TILLBEDROCK
110SDMNBEDROCK
110SDMNBEDROCK
110SDMNBEDROCK
110SDMNBEDROCK
112TILLBEDROCK
110SDMNBEDROCK
BEDROCK
112TILLBEDROCK
112TILLBEDROCK
112TILLBEDROCK
112TILLBEDROCK
SAND Sand, coarse, orange-brownSAND Sand, medium coarse, orange-brownTILL TillROCK Rotten rockROCK Refusal; bedrock
SDGLROCK
TILL Clay, hardpanROCK
SDGLSANDTILLROCK
TILLROCK
SANDTILLROCK
SDGLROCK
SANDROCK
SDGLROCK
SDGLROCK
TILLROCK
SDGLROCK
ROCK
TILLROCK
TILL Clay, hardpanROCK
TILLROCK
TILLROCK
106 Geohydrology and Water Quality of Stratified-Drift Aquifers in the Winnipesaukee River Basin, Central New Hampshire

Table B-1. Stratigraphic logs of selected wells and borings in the Winnipesaukee River Basin, central New Hampshire Continued
Local site
number
Depth Depth of drilled well (feet) (feet)
Depth Depth to to
refusal top (feet) (feet)
Aquifer code
Lithologic description of
material
BELKNAP COUNTY
Belmont-Coatlauad
BLW
BLW
BLW
BLW
BLW
BLW
BLW
BLW
BLW
BLW
BLW
BLW
BLW
BLW
BLW
BLW
BLW
BLW
122
123
124
125
126
130
131
132
135
138
139
140
141
146
147
150
151
157
515.
310.
305.
280.
605.
180.
220.
310.
450.
178.
90,
112
142
120
135
300
300
350
0
0
0
0
0
.0
,0
.0
.0
.0
.0
.0
.0
.0
.0
.0
.0
.0
020.
060.
052.
0109.
0128.
017.
070.
080.
03,
04.
21,
07
05
24
011
014
03
112
040
050
015
0
.0
,0
0
,0
.0
.0
.0
.0
.0
.0
.0
.0
.0
.0
.0
.0
.0
.0
.0
.0
110SDMNBEDROCK
110SDMNBEDROCK
110SDMNBEDROCK
110SDMNBEDROCK
110SDMNBEDROCK
110SDMNBEDROCK
110SDMNBEDROCK
110SDMNBEDROCK
112TILLBEDROCK
110SDMN112TILLBEDROCK
112TILLBEDROCK
110SDMN112TILLBEDROCK
110SDMNBEDROCK
110SDMNBEDROCK
110SDMN112TILLBEDROCK
110SDMNBEDROCK
110SDMNBEDROCK
112TILLBEDROCK
SDGLROCK
SDGLROCK
SDGLROCK
CLAYROCK
CLAYROCK
SDGLROCK
SDGLROCK
SDGLROCK
TILLROCK
SDGLTILLROCK
TILLROCK
OTHRTILLROCK
SDGLROCK
SGVCROCK
SANDTILL Clay, hardpanROCK
SDGLROCK
SDGLROCK
TILLROCK
Appendix B 107

Table B-1. Stratigraphic logs of selected wells and borings in the Winnipesaukee River Basin, central New Hampshire Continued
Local site
number
Depth Depth Depth of to drilled well refusal (feet) (feet) (feet)
Depth to top
(feet)Aquifer code
Lithologic description of
material
BELKNAP COUNTY
Belmont-Continued
BLW
BLW
BLW
BLW
BLW
BLW
BLW
BLW
BLW
BLW
BLW
BLW
BLW
BLW
BLW
BLW
BLW
BLW
BLW
158
159
160
161
162
165
167
168
170
171
172
173
174
176
179
181
183
184
185
250.
450.
105.
95.
90.
550.
16.
140.
260.
202.
550.
230,
550
310
107
310
145
310
390
0
0
0
0
0
0
0
0
0
,0
.0
.0
.0
.0
.0
.0
.0
.0
.0
012.
090.
0
0
0
028.
018.
025.42.55.58.
033.
017.
070.
070,
070
090
018
015
04
030
016
0
0
0
0
0000
0
0
.0
.0
.0
.0
.0
.0
.0
.0
.0
110SDMNBEDROCK
112TILLBEDROCK
110SDMN
110SDMN
110SDMN
112TILLBEDROCK
110SDMN110SDMN
110SDMN112TILL110SDMN110SDMNBEDROCK
110SDMNBEDROCK
110SDMNBEDROCK
110SDMNBEDROCK
110SDMNBEDROCK
110SDMNBEDROCK
110SDMNBEDROCK
110SDMNBEDROCK
112TILLBEDROCK
112TILLBEDROCK
112TILLBEDROCK
112TILLBEDROCK
SDGLROCK
TILLROCK
SDGL
SDGL
SDGL
TILLROCK
SANDCLAY
SDGLTILLCLAYSANDROCK
SDGLROCK
SANDROCK
SANDROCK
SANDROCK
SANDROCK
SANDROCK
OTHRROCK
TILLROCK
TILLROCK
TILL Gravel, hardpanROCK
TILLROCK
108 Geohydrology and Water Quality of Stratified-Drift Aquifers in the Winnipesaukee River Basin, Central New Hampshire

Table B-1. Stratigraphic logs of selected wells and borings in the Winnipesaukee River Basin, central New Hampshire Continued
Local site
number
Depth Depth of drilled well (feet) (feet)
Depth Depth to to
refusal top (feet) (feet)
Aquifer code
Lithologic description of
material
BELKNAP COUNTY
Bolmont-Continuad
BLW
BLW
BLW
BLW
BLW
BLW
BLW
BLW
BLW
BLW
BLW
BLW
BLW
BLW
BLW
BLW
BLW
BLW
BLW
186
188
189
190
191
198
199
200
201
202
206
207
209
210
211
212
213
215
216
370.
300.
300.
280.
160.
433.
230.
272.
300.
200.
325.
265.
430.
145.
590,
125
270,
220
280
0
0
0
0
0
0
0
,0
0
,0
.0
.0
.0
.0
.0
.0
.0
.0
.0
022.
070.
015.
010.
0
062.
020.
0103.
8.
069.
050,
065,
08,
012
08
030
040
070
085
0
0
,0
,0
,0
,0
.0
.0
.0
.0
.0
.0
.0
.0
.0
.0
.0
.0
110SDMNBEDROCK
110SDMNBEDROCK
110SDMN
BEDROCK
110SDMNBEDROCK
110SDMN
112TILLBEDROCK
112TTLLBEDROCK
112TILLBEDROCK
BEDROCK
110SDMNBEDROCK
110SDMNBEDROCK
110SDMNBEDROCK
112TILLBEDROCK
112TILLBEDROCK
112TILLBEDROCK
110SDMNBEDROCK
112TILLBEDROCK
112TILLBEDROCK
112TILLBEDROCK
SDGLROCK
SDGLROCK
SDGLROCK
SDGLROCK
SDGL
TILLROCK
TILL Sand, gravel, hardpanROCK
TILLROCK
ROCK
SDGLROCK
OTHRROCK
OTHRROCK
TILLROCK
TILLROCK
TILLROCK
SDGLROCK
TILLROCK
TILLROCK
TILLROCK
Appendix B 109

Table B-1. Stratigraphic logs of selected wells and borings in the Winnipesaukee River Basin, central New Hampshire Continued
Local site
number
Depth Depth Depth of to drilled well refusal (feet) (feet) (feet)
Depth to top
(feet)Aquifer
code
Lithologic description of
material
BELKNAP COUNTY
Belmont-coneinu«d
BLW 217
BLW 219
BLW 220
BLW 221
BLW 222
BLW 224
BLW 226
BLW 227
BLW 230
BLW 231
250.0
70.0
290.0
310.0
560.0
125.0
510.0
140.0
75.0
300.0
021.0
070.0
050.0
06.0
010.0
08.0
0
60.0
112.0
015.024.0
010.0
026.0
110SDMNBEDROCK
110SDMNBEDROCK
110SDMN
BEDROCK
112TILLBEDROCK
110SDMNBEDROCK
112TILLBEDROCK
110SDMN
112TILLBEDROCK
112TILL110SDMNBEDROCK
110SDMNBEDROCK
110SDMN
BEDROCK
SDGLROCK
SDGLROCK
SANDROCK
TILLROCK
SDGLROCK
TILLROCK
SAND
TILL
ROCK
TILL
CLAYROCK
SANDROCK
SDGLROCK
BLW 234
BLW 235
BLW 238
BLW 240
BLW 243
BLW 244
BLW 248
BLW 253
BLW 255
300.0
305.0
305.0
305.0
385.0
230.0
310.0
226.0
325.0
0 110SDMN SDGL 56.0 BEDROCK ROCK
112TILL TILL Gravel, hardpan0 14.0 BEDROCK ROCK
0
0
0
0 112TILL TILL 14.0 BEDROCK ROCK
0 110SDMN SAND 5.0 BEDROCK ROCK
0 112TILL TILL 10.0 BEDROCK ROCK
0 110SDMN SDGL 30.0 BEDROCK ROCK
110 Geohydrology and Water Quality of Stratified-Drift Aquifers in the Winnipesaukee River Basin, Central New Hampshire

Table B-1. Stratigraphic logs of selected wells and borings in the Winnipesaukee River Basin, central New Hampshire Continued
Local site
number
Depth Depth of drilled well (feet) (feet)
Depth Depth to to
refusal top (feet) (feet)
Aquifer code
Lithologic description of
material
BELKNAP COUNTY
Belmont-Continuad
BLW
BLW
BLW
BLW
BLW
BLW
BLW
BLW
BLW
BLW
BLW
BLW
BLW
BLW
BLW
BLW
BLW
BLW
BLW
257
258
262
263
264
271
275
276
277
278
286
287
288
290
291
292
293
294
296
300.
119.
255.
255.
325.
210.
120.
300.
340.
640.
170.
365.
428,
405.
452
270
270
450
405
0
0
0
0
0
0
,0
0
,0
.0
,0
.0
.0
.0
.0
.0
.0
.0
.0
0131.
010.
024.
011.
40.
08.
010.
04.
04.
06.
07.
065.
09.
030.
030.
080
090
082
010
0
0
0
0
0
0
0
0
0
0
0
.0
.0
.0
.0
.0
.0
.0
.0
110SDMNBEDROCK
110SDMNBEDROCK
110SDMNBEDROCK
112TILLBEDROCK
BEDROCK
112TILLBEDROCK
110SDMNBEDROCK
110SDMNBEDROCK
110SDMNBEDROCK
110SDMNBEDROCK
112TILLBEDROCK
112TILLBEDROCK
110SDMNBEDROCK
112TILLBEDROCK
112TILLBEDROCK
110SDMNBEDROCK
110SDMNBEDROCK
110SDMNBEDROCK
112TILLBEDROCK
OTHRROCK
SDGLROCK
SDCLROCK
TILLROCK
ROCK
TILLROCK
CLAYROCK
SANDROCK
SANDROCK
CLAYROCK
TILLROCK
TILLROCK
SDGLROCK
TILLROCK
TILLROCK
SANDROCK
SANDROCK
SGVCROCK
TILLROCK
Gravel , hardpan
Gravel , hardpan
Gravel , hardpan
Sand, gravel, hardpan
Appendix B 111

Table B-1. Stratigraphic logs of selected wells and borings in the Winnipesaukee River Basin, central New Hampshire Continued
Local site
number
Depth Depth of drilled well (feet) (feet)
Depth Depth to to
refusal top (feet) (feet)
Aquifer code
Lithologic description of
material
BELKNAP COUNTY
Belmont-Contlnuad
BLW
BLW
BLW
BLW
BLW
BLW
BLW
BLW
BLW
BLW
BLW
BLW
BLW
BLW
BLW
BLW
BLW
BLW
297
303
306
308
309
315
316
318
321
322
323
325
327
329
331
332
334
335
430.0
220.0
300.0
400.0
220.0
430.0
230.0
210.0
165.0
155.0
475.0
175.0
300.0
325.0
245.0
220.0
290.0
250.0
0140.
040.
0112.
097.
035.
014.
033.
060.
020.80.
080.
117.
0119.
030,
047
05
010
065
040
050
0
0
0
0
0
0
0
0
0,0
.0
.0
.0
.0
.0
.0
.0
.0
.0
.0
110SDMNBEDROCK
110SDMNBEDROCK
110SDMNBEDROCK
110SDMNBEDROCK
112TILLBEDROCK
110SDMNBEDROCK
112TILL
BEDROCK
110SDMNBEDROCK
110SDMN110SDMNBEDROCK
110SDMN110SDMNBEDROCK
110SDMNBEDROCK
112 TILLBEDROCK
110SDMNBEDROCK
112TILLBEDROCK
110SDMNBEDROCK
110SDMNBEDROCK
112TILLBEDROCK
110SDMNBEDROCK
SGVCROCK
CLAYROCK
CLAYROCK
SGVCROCK
TILL Clay, hardpanROCK
SDGLROCK
TILL Sand, hardpan
ROCK
SANDROCK
SANDCLAYROCK
SANDCLAYROCK
SDCLROCK
TILLROCK
SANDROCK
TILLROCK
SDGLROCK
SANDROCK
TILL Clay, hardpanROCK
SANDROCK
112 Geohydrology and Water Quality of Stratified-Drift Aquifers in the Winnipesaukee River Basin, Central New Hampshire

Table B-1. Stratigraphic logs of selected wells and borings in the Winnipesaukee River Basin, central New Hampshire Continued
Depth Local Depth of site drilled well
number (feet) (feet)
Depth Depth to to
refusal top (feet) (feet)
Aquifer code
Lithologic description of
material
BELKNAP COUNTY
Belmont-ContinuAd
BLW 336 -- 360.0
BLW 341 -- 190.0
BLW 342 -- 100.0
BLW 346 -- 305.0
BLW 347 -- 160.0
BLW 349 -- 310.0
BLW 350 -- 100.0
BLW 353 13.0 13.0
BLW 354 121 26
BLW 355 90
078.0
012.0
010.0
025.0
010.0
0128.0
03.010.019.5
0 10.0 11.0 12.0 13.0
0.0 10.0 45.0 52.0
121.0
0 5.0
30.0 48.0 52.0 65.0
110SDMNBEDROCK
110SDMNBEDROCK
110SDMNBEDROCK
110SDMNBEDROCK
112TILLBEDROCK
110SDMNBEDROCK
110SDMN112TILL110SDMNBEDROCK
112SRFD 112TILL 112TILL 112TILL 112TILL
112SRFD 112SRFD 112SRFD 112SRFD 112SRFD
112SRFD 112SRFD 112SRFD 112SRFD 112SRFD 112SRFD
SANDROCK
SANDROCK
SDGLROCK
SANDROCK
TILLROCK
SANDROCK
SDGLTILLCLAYROCK
SDGL Sand, fine to coarse; gravel TILL Till, loose; sandy TILL Till; medium-dense; sandy; yellow TILL Till, loose; sandy; orange TILL End of hole at 13 feet
SDGL Sand, fine to coarse,- some gravel, silt STCL Clay, gray SDCL Sand, fine, gray; clay SAND Sand, fine, gray SAND Refusal at 121 feet
SDGL Sand, fine to coarse; gravel; some silt SAND Sand, fine; trace silt SDCL Sand and clay SDCL Sand, fine with clay CLAY Clay, gray SAND Sand, fine; trace silt
Center Harbor
CHW 1 -- 380.0
CHW 2 -- 130.0
CHW 3 -- 305.0
020.0--
37.0
015.0
07.0
110SDMN112TILL112TILLBEDROCK
110SDMNBEDROCK
112TILLBEDROCK
SDGLTILLTILLROCK
SDGLROCK
TILLROCK
CHW 5 605.0 90.0 BEDROCK ROCK
Appendix B 113

Table B-1. Stratigraphic logs of selected wells and borings in the Winnipesaukee River Basin, central New Hampshire Continued
Depth Local Depth of site drilled well
number (feet) (feet)
Depth Depth to to
refusal top (feet) (feet)
Aquifer code
Lithologic description of
material
BELKNAP COUNTY
CHW 6 -- 280.0
CHW 7 -- 705.0
CHW 11 -- 212.0
CHW 14 -- 355.0
CHW 23 -- 1220.0
CHW 25 -- 412.0
CHW 29 155.0 155.0
0 12.
0 64.
0 8.
0 39.
0 3.
05.
038.
155.
Center Harbor-Contlnu«d
112TILL TILL 0 BEDROCK ROCK
110SDMN SDGL 0 BEDROCK ROCK
110SDMN CLAY 0 BEDROCK ROCK
110SDMN SAND 0 BEDROCK ROCK
112TILL TILL 0 BEDROCK ROCK
112TILL TILL0
00
BEDROCK
112SRFDBEDROCKBEDROCK
ROCK
GRVLROCKROCK
Gravel with silt and clay (may be till)
End of hole at 155 feet
Gilford
GFA 1 30.0
GFA 2 65.5
GFA 3 12.5
GFB 1 60.0
GFB 2 24.0
GFB 3 26.0
30.0 025.30.
62.5 057.
12.5 05.
10.12.
011.13.26,40.60
024
0141618212226
00
0
,0,0.5
,0.0.0.0.0
.0
.0
.0
.0
.0
.0
.0
112SRFD112TILLBEDROCK
110SDMNBEDROCK
111FILL110SDMN112TILL112TILL
110SDMN110SDMN110SDMN110SDMN110SDMN110SDMN
110SDMN110SDMN
110SDMN110SDMN110SDMN110SDMN110SDMN112TILL112TILL
SANDTILLROCK
SDSTROCK
OTHRSANDTILLTILL
SANDSANDSANDSANDSANDSAND
GRVLGRVL
MUCKMUCKSANDSTCLSDSTTILLTILL
Medium sand, with some coarser layers, thinTillRefusal; bedrock
Sand, very fine, tan; and siltRefusal; probably bedrock
FillSand, medium, tan; many coarse layersTillEnd of hole, till and rock
FillSand, fine, siltySand, fine to coarse, trace gravelSand, fine to coarse, siltySand, silty, fine to coarseEnd of hole
Gravel, sandy, trace silt, bouldersEnd of hole
MuckMuckSand, fine to mediumSilt and clay, varvedSand and siltTill, dense, grayEnd of hole
114 Geohydrology and Water Quality of Stratified-Drift Aquifers in the Winnipesaukee River Basin, Central New Hampshire
Table B-1. Stratigraphic logs of selected wells and borings in the Winnipesaukee River Basin, central New Hampshire Continued
Local Depthsite drilled
number (feet)
Depth Depth Depthof to to
well refusal top(feet) (feet) (feet)
Aquifercode
Lithologic descriptionof
material
BELKNAP COUNTY
Gil£ord-Contiau«d
GFB 4 11.0
GFB 5 12 . 0
GFB 6 60.5
GFB 7 61.5
GFB 8 57.0
10.0 11.0 00.1
0.5
3.0
11.0
10.0 0
7.012.0
48.4 -- 0
4.09.0
25.0
34.540.0
48.055.060.5
53.5 -- 01.0
6.09.0
19.0
25.0
29.0
31.0
34.0
51.861.5
41.7 -- 0
3.5
6.0
9.0
111FILL110SDMN
110SDMN
110SDMN
110SDMN
110SDMN
110SDMN110SDMN
110SDMN
110SDMN110SDMN
110SDMN
110SDMN110SDMN
400CRSL400CRSL400CRSL
110SDMN110SDMN
110SDMN110SDMN
110SDMN
110SDMN
110SDMN
110SDMN
110SDMN
400CRSL400CRSL
110SDMN
110SDMN
110SDMN
110SDMN
OTHR AsphaltSAND Sand, red brown, fine to medium, few fine to
coarse gravelSAND Sand, gray brown, fine to medium, few fine to
coarse gravelSAND Sand, light brown, fine to medium, few fine
gravelSAND Refusal
SAND Sand, brown, fine to medium, few fine graveland cobbles
SAND Sand, light gray-black, fine to mediumSAND End of hole
SILT Silt, light brown, little fine sand, trace offine to medium gravel, trace rubble fill
SAND Sand, light brown, fine, trace of siltSDGL Sand and gravel, light brown-gray, fine to
coarse, trace of siltSDGL Sand and gravel, gray, fine to coarse, trace of
siltSILT Silt, light gray, little fine sandSAND Sand, light brown-gray, fine to medium, little
embedded fine to coarse gravel, trace of siltROCK Weathered rockSCST Schist, gray biotite micaSCST End of hole
SAND Sand, gray, fine to medium, trace of fine gravelSAND Sand, light gray, fine to coarse, some fine to
medium gravelSDGL Sand and gravel, fine to medium, trace of siltSDGL Sand, light orange-brown, fine to medium, and
gravel, fine to coarse, trace of siltSDGL Sand, light brown, fine to medium, and embedded
fine to coarse gravel, little siltSAND Sand, orange-brown, fine to medium, little fine
to medium gravel, trace siltSAND Sand, light brown, fine to coarse, some fine
to coarse gravelSAND Sand, orange-brown, fine to medium, trace of
siltSDGL Sand, light brown, fine to medium, and embedded
fine or coarse gravel, little to some siltGNSS Gneiss, quartrz biotiteGNSS End of hole
SAND Sand, brown, fine to medium, some fine tocoarse gravel trace of silt, trace of wood
SAND Sand, light brown, fine to medium, some silt,trace of fine gravel, trace of roots
SAND Sand, gray, fine to coarse, little fine tocoarse gravel, trace of silt
SAND Sand, light brown-gray, fine to medium, traceof fine to medium gravel
Appendix B 115
Table B-1. Stratigraphic logs of selected wells and borings in the Winnipesaukee River Basin, central New Hampshire Continued
Depth DepthLocal Depth of tosite drilled well refusal
number (feet) (feet) (feet)
Depthtotop
(feet)
Lithologic descriptionAquifer ofcode material
BELKNAP COUNTY
GFB ^--Continued
GFB 9 42.0 37.0
GFB 10 39.0 37.0 39.0
GFB 11 30.0 30.0 30.0
GFB 12 12.0
13.524.0
28.0
44.0
47.057.0
019.0
28.0
33.042.0
03.09.0
20.023.028.0
31.5
33.0
39.0
0
8.018.0
21.0
30.0
0
10.012.0
Oi 1 ford-Continued
110SDMN SAND Sand, light brown, fine, trace of silt110SDMN SAND Sand, light brown, fine to medium, little fine
to medium gravel, trace of silt110SDMN SDGL Sand, light brown-gray and orange, fine to
coarse, and fine to coarse gravel, trace to littlesilt
110SDMN SDGL Gravel, gray-brown, fine to coarse and fine tomedium sand
400CRSL GRGN Granite gneiss, fine grained, light gray400CRSL GRGN End of hole
110SDMN SAND Sand, gray, fine, little silt110SDMN SAND Sand, gray, fine, little silt, trace of fine
gravel110SDMN SDST Sand and silt, light brown-gray, fine to
medium, some embedded fine to coarse gravel400CRSL GNSS Gneiss, gray, quartz biotite400CRSL GNSS End of hole
110SDMN SDST Sand and silt, light brown, fine, trace of roots110SDMN SAND Sand, gray-brown, fine, trace of silt110SDMN SAND Sand, light brown, fine to medium, trace of
fine gravel110SDMN SAND Sand, light gray-brown, fine, little silt110SDMN SILT Silt, light gray-brown, little fine sand110SDMN SAND Sand, light brown, fine, little silt, trace of
fine gravel110SDMN SILT Silt, light brown, some fine to medium sand,
some embedded fine to coarse gravel110SDMN SILT Silt, light brown, trace of embedded fine to
coarse gravel110SDMN SILT Auger refusal
110SDMN SAND Sand, light brown, fine to medium, little totrace of silt
110SDMN SAND Sand, light brown, fine to medium110SDMN SAND Sand, light brown, fine to medium, trace of
fine gravel110SDMN SAND Sand, light brown, fine to coarse, some fine to
coarse gravel, trace to little silt110SDMN SAND Auger refusal
110SDMN SAND Sand, dark brown, fine to medium, few fine tocoarse gravel and cobbles
110SDMN SAND Sand, light gray, fine to medium110SDMN SAND End of hole
GFB 13 20.0 20.0 -- 0 111FILL OTHR Asphalt0.2 110SDMN SAND Sand, light brown, fine to medium, little fine
to medium gravel 2.5 110SDMN SAND Sand, grayish-brown, fine to medium, some fine
to medium gravel 3.5 110SDMN SAND Sand, light brown, fine to medium, little
coarse, few fine gravel 5.0 110SDMN SAND Sand, fine, red and gray mottling, varved at
bottom with medium to coarse sand 7.0 110SDMN SAND Sand, light brown, fine, few coarse, few fine
gravel
116 Geohydrology and Water Quality of Stratified-Drift Aquifers in the Winnipesaukee River Basin, Central New Hampshire
Table B-1. Stratigraphic logs of selected wells and borings in the Winnipesaukee River Basin, central New Hampshire Continued
Depth Depth DepthLocal Depth of to tosite drilled well refusal top Aquifer
number (feet) (feet) (feet) (feet) code
Lithologic descriptionof
material
BELKNAP COUNTY
GFB 13--ContiuedOi 1 ford-Con t inuad
13.0 110SDMN COBB Auger grinding on cobbles15.0 110SDMN SAND Sand, light gray-brown, fine17.0 110SDMN SAND End of hole
GFW 7 30.0 15.0 0 110SDMN SILT Silt, black organic, with peat, trace medium tofine sand, trace of gravel
2.5 110SDMN SDGL Gravel, brown, fine to coarse to medium, andmedium to coarse sand, occasional cobbles
6.5 110SDMN SDGL Sand, tan, medium to coarse, and fine to mediumgravel
10.0 110SDMN SAND Sand, tan, medium to coarse, some fine tomedium gravel
12.0 110SDMN SAND Sand, tan, fine, trace of orange medium sand inoccasoinal layers
30.0 110SDMN SAND End of hole
GFW 9 16.5 14.5 0 110SDMN SAND Sand, brown, medium to coarse, some gravel,little fine sand
3.0 110SDMN SAND Sand, gray, medium to coarse, some gravel,little fine sand
5.0 110SDMN SAND Sand, gray, fine to medium, little coarse,little gravel (fill, petroleum odor)
10.0 110SDMN SAND Sand, gray, graded very coarse to medium,little gravel
11.0 110SDMN SDST Sand and silt, gray, fine, laminated 12.5 110SDMN SAND Sand, brown, medium to coarse, little fine,
trace of gravel 16.5 110SDMN SAND End of hole
GFW 11 67.0 53.0 67.0 0 112SRFD SAND Sand, coarse15.0 112SRFD SAND Sand, medium55.0 112SRFD SAND Sand, coarse66.0 112TILL TILL Refusal; till
GFW 12 90.0 80.0 90.0 0 112SRFD SAND Sand,75.0 112SRFD SDGL Sand,85.0 112TILL TILL Till90.0 112TILL TILL Refusal in till at 90 feet
fine; some coarser thin layers very coarse
GFW 13 49.0 35.0 49.0 0 112SRFD SAND Sand, coarse; some thin finer layers38.0 112SRFD SAND Sand, very fine; silt41.0 112TILL TILL Till49.0 112TILL TILL Refusal in till at 49 feet
GFW 14 75.0 70.5 75.0
GFW 15 44.0 42.0 44.0
0 110SDMN SAND Sand, coarse, gray; some pebbles37.0 110SDMN SDST Sand, fine,- some silt layers57.0 110SDMN SAND Sand, fine to medium67.0 110SDMN SDST Sand, medium; some very fine, and silt75.0 BEDROCK ROCK Refusal; probably bedrock
0 110SDMN SAND Sand, very fine, tan,- some silt and medium sand37.0 110SDMN SAND Sand, medium43.0 112TILL TILL Till44.0 BEDROCK ROCK Refusal; probably bedrock
Appendix B 117

Table B-1 . Stratigraphic logs of selected wells and borings in the Winnipesaukee River Basin, central New Hampshire Continued
Local site
number
Depth Depth Depth of to drilled well refusal (feet) (feet) (feet)
Depth to top
(feet)Aquifer code
Lithologlc description of
material
BELKNAP COUNTY
Gilford-Continucd
GFW
GFW
GFW
GFW
GFW
GFW
GFW
GFW
GFW
GFW
GFW
GFW
GFW
GFW
GFW
GFW
GFW
GFW
GFW
16
17
18
19
21
22
23
24
31
32
33
35
37
38
39
40
43
44
52
14.
450.
305.
265.
185.
165.
145.
550.
385.
205.
24.
300.
444.
19,
535
250
182
139
310
4
0
0
0
0
0
0
0
0
0
5
,0
.0
.5
.0
.0
.0
.0
.0
0
0125.150.
031.
0101.
050.
010.
028.
0132.
80.
15.
030.
0130.
063,85
020
090
0100
075
0116
075
00
0
0
0
0
0
,0
,0
,0
.0
.0
.0
.0
.0
.0
.0
.0
.0
.0
112SRFD
110SDMN110SDMNBEDROCK
112TILLBEDROCK
112TILLBEDROCK
110SDMNBEDROCK
110SDMNBEDROCK
112TILLBEDROCK
110SDMNBEDROCK
BEDROCK
BEDROCK
110SDMN112TILL
110SDMNBEDROCK
110SDMN110SDMNBEDROCK
110SDMN110SDMN
112TILLBEDROCK
112TILLBEDROCK
112TILLBEDROCK
110SDMNBEDROCK
110SDMNBEDROCK
SDGLCLAYROCK
TILL Sand, hardpanROCK
TILL Gravel, hardpanROCK
SANDROCK
SGVCROCK
TILL Gravel, hardpanROCK
SDGLROCK
ROCK
ROCK
SDGLTILL
SANDROCK
SDCLSDGLROCK
SDGLSAND
TILLROCK
TILLROCK
TILLROCK
SDGLROCK
SANDROCK
118 Geohydrology and Water Quality of Stratified-Drift Aquifers in the Winnipesaukee River Basin, Central New Hampshire
Table B-1. Stratigraphic logs of selected wells and borings in the Winnipesaukee River Basin, central New Hampshire Continued
Local site
number
Depth Depth of drilled well (feet) (feet)
Depth Depth to to
refusal top (feet) (feet)
Aquifer code
Lithologic description of
material
BELKNAP COUNTY
Gilford-Coatlauad
GFW
GFW
GFW
GFW
GFW
GFW
GFW
GFW
GFW
GFW
GFW
GFW
GFW
GFW
GFW
GFW
GFW
GFW
GFW
58
63
66
67
70
74
75
78
81
82
88
89
91
92
98
100
101
112
114
290.
300.
375.
400.
325.
310.
195.
225.
180.
430.
305.
75.
390.
560,
310
650
277
265
310
0
0
0
0
0
0
0
0
0
0
,0
.0
.0
.0
.0
.0
.0
.0
.0
0105.
0105.
070.
095.
090.
045.
03.
090.
080.
012.
060.
016.
030.
0100
080
050
075
0100
0150
0
0
0
0
0
0
0
0
0
0
,0
.0
.0
.0
.0
.0
.0
.0
.0
110SDMNBEDROCK
110SDMNBEDROCK
110SDMNBEDROCK
110SDMNBEDROCK
110SDMNBEDROCK
110SDMNBEDROCK
112TILLBEDROCK
112TILLBEDROCK
110SDMNBEDROCK
112TILLBEDROCK
110SDMNBEDROCK
112TILLBEDROCK
112TILLBEDROCK
112TILLBEDROCK
110SDMNBEDROCK
112TILLBEDROCK
112TILLBEDROCK
110SDMNBEDROCK110SDMNBEDROCK
SANDROCK
SDGLROCK
SANDROCK
OTHRROCK
SDGLROCK
SDGLROCK
TILLROCK
TILLROCK
SANDROCK
TILLROCK
CLAYROCK
TILLROCK
TILL Gravel, hardpanROCK
TILLROCK
SANDROCK
TILLROCK
TILL Clay, hardpanROCK
OTHRROCKCLAYROCK
Appendix B 119

Table B-1. Stratigraphic logs of selected wells and borings in the Winnipesaukee River Basin, central New Hampshire Continued
Local site
number
Depth Depth of drilled well (feet) (feet)
Depth Depth to to
refusal top (feet) (feet)
Aquifer code
Lithologic description of
material
BELKNAP COUNTY
Gilford-Continued
GFW
GFW
GFW
GFW
GFW
GFW
GFW
GFW
GFW
GFW
GFW
GFW
GFW
GFW
GFW
GFW
GFW
GFW
118
120
121
123
124
126
134
136
139
147
148
151
159
162
167
169
178
182
200.
230.
300.
300.
325.
225.
295.
375.
300,
475
700
900
325
230
510
325
150
460
0
0
0
0
0
,0
.0
.0
.0
.0
.0
.0
.0
.0
.0
.0
.0
.0
080.
0120.
030.
087.
050.
063.
027.
83.
0100.120.
091.
010,58
070
047
0102
033
170
029
095
0
0
0
0
0
0
0
,0
.0
.0
.0
.0
.0
.0
.0
.0
.0
.0
.0
.0
112TILLBEDROCK
110SDMNBEDROCK
110SDMNBEDROCK
110SDMNBEDROCK
110SDMNBEDROCK
110SDMNBEDROCK
112TILLBEDROCK
BEDROCK
110SDMN110SDMNBEDROCK
110SDMNBEDROCK
110SDMN110SDMNBEDROCK
110SDMNBEDROCK
112TILLBEDROCK
112TILLBEDROCK
112TILLBEDROCK
BEDROCK
110SDMNBEDROCK
110SDMNBEDROCK
TILLROCK
CLAYROCK
SDGLROCK
SDGLROCK
SANDROCK
SANDROCK
TILL Gravel, hardpanROCK
ROCK
SANDSDGLROCK
SGVCROCK
SDGLCLAYROCK
SDGLROCK
TILL Sand, gravel, hardpanROCK
TILL Gravel, clay, hardpanROCK
TILLROCK
ROCK
SDGLROCK
SDGLROCK
GFW 183 15.0 110SDMN SAND
120 Geohydrology and Water Quality of Stratified-Drift Aquifers in the Winnipesaukee River Basin, Central New Hampshire
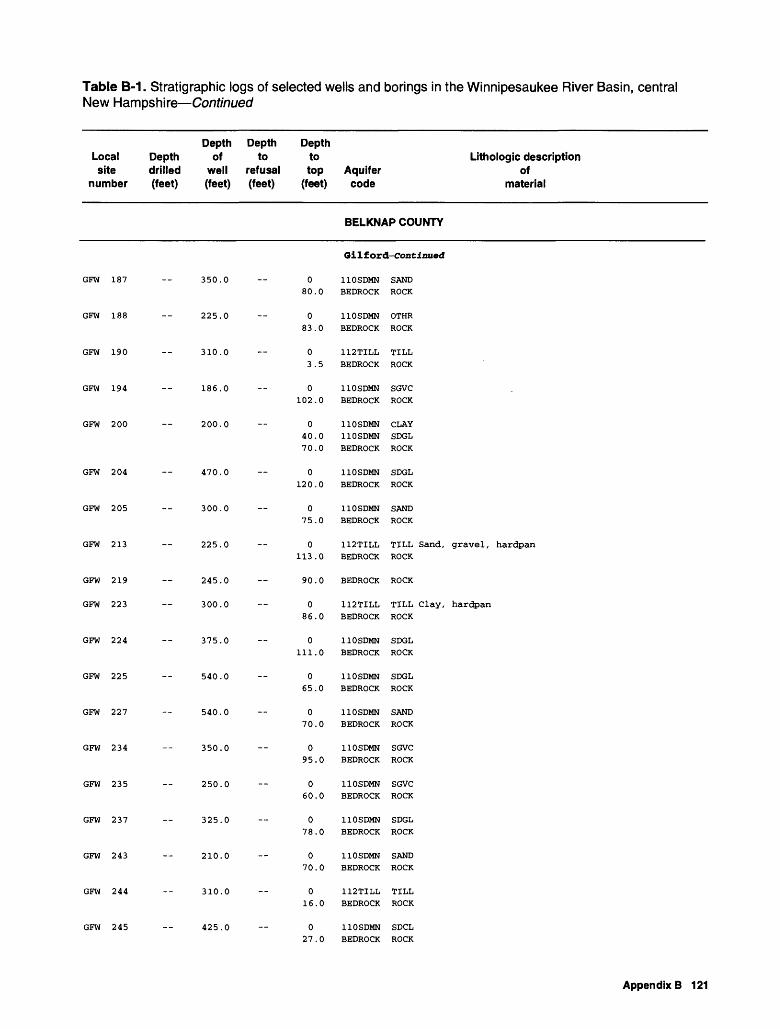
Table B-1. Stratigraphic logs of selected wells and borings in the Winnipesaukee River Basin, central New Hampshire Continued
Local site
number
Depth Depth of drilled well (feet) (feet)
Depth Depth to to
refusal top (feet) (feet)
Aquifer code
Lithologic description of
material
BELKNAP COUNTY
Oil ford-Coat Inued
GFW
GFW
GFW
GFW
GFW
GFW
GFW
GFW
GFW
GFW
GFW
GFW
GFW
GFW
GFW
GFW
GFW
GFW
GFW
187
188
190
194
200
204
205
213
219
223
224
225
227
234
235
237
243
244
245
350.
225.
310.
186.
200.
470.
300.
225.
245.
300.
375.
540.
540.
350.
250.
325,
210,
310,
425
0
0
0
0
0
0
0
0
0
,0
,0
,0
0
.0
.0
.0
.0
.0
.0
080.
083.
03.
0102.
040.70.
0120.
075.
0113.
90.
086.
0111.
065.
070.
095,
060,
078,
070,
016,
027
0
0
5
0
,0,0
,0
,0
0
0
,0
,0
,0
,0
.0
.0
.0
.0
.0
.0
110SDMNBEDROCK
110SDMNBEDROCK
112TILLBEDROCK
110SDMNBEDROCK
110SDMN110SDMNBEDROCK
110SDMNBEDROCK
110SDMNBEDROCK
112TILLBEDROCK
BEDROCK
112TILLBEDROCK
110SDMNBEDROCK
110SDMNBEDROCK
110SDMNBEDROCK
110SDMNBEDROCK
110SDMNBEDROCK
110SDMNBEDROCK
110SDMNBEDROCK
112TILLBEDROCK
110SDMNBEDROCK
SANDROCK
OTHRROCK
TILLROCK
SGVCROCK
CLAYSDGLROCK
SDGLROCK
SANDROCK
TILL Sand, gravel, hardpanROCK
ROCK
TILL Clay, hardpanROCK
SDGLROCK
SDGLROCK
SANDROCK
SGVCROCK
SGVCROCK
SDGLROCK
SANDROCK
TILLROCK
SDCLROCK
Appendix B 121

Table B-1. Stratigraphic logs of selected wells and borings in the Winnipesaukee River Basin, central New Hampshire Continued
Depth Depth DepthLocal Depth of to tosite drilled well refusal top Aquifer
number (feet) (feet) (feet) (feet) code
Lithologic descriptionof
material
BELKNAP COUNTY
Gilford-Continusd
GFW 246 300.0 088.0
110SDMN SGVC BEDROCK ROCK
GFW 252 55.3 55.3
GFW 253 53.9 53.9
GFW 254 52.2
GFW 255 42.5
52.2
42.5
0 112LCSR SAND Sand, fine, tan; small gravel; and clay 43.0 112LCSR SAND Sand, fine, gray; gravel, large, sharp; and
clay; End of hole at 55.33 feet
0 112LCSR SAND Sand, fine, gray; and clay 41.0 112LCSR SAND Sand, fine to medium, gray; gravel, large,
broken; specks of clay; refusal at 53.91 feet
0 112SRFD SDGL Sand, fine to medium, large broken gravel21.0 112SRFD SAND Fine brown sand and some gravel36.0 112SRFD SAND Sand, fine to medium, brown, trace of clay
0 112LCSR SAND Sand, fine to medium, specks of clay, tight 23.0 112LCSR SAND Sand, fine, gray, tight, some clay; refusal at
42.5 feet
GFW 256 58.7 49.0 58.7
GFW 257 61.6 61.6 61.6
LAA 1 5.0
0 112LCSR SAND Sand and gravel, fine to medium 33.0 112LCSR SAND Sand, fine to medium, brown38.0 112LCSR SAND Sand, fine to medium, brown-gray, some gravel 49.0 112LCSR SAND Sand, fine to medium, gray; some gravel; specks
of clay
0 112LCSR SAND Sand and gravel, fine to medium; specks of clay27.0 112LCSR SAND Sand and gravel, fine,- specks of clay33.0 112LCSR SDCL Sand, fine and clay; tight53.0 112LCSR SAND Sand, fine; brown and gray
Laconia
0 112SRFD SAND Sand, medium, brown 5.0 110SDMN SAND Refusal
LAB 1 37.5 37.5 0 110SDMN SDGL Sand and gravel5.0 110SDMN SAND Sand, coarse
10.0 110SDMN SILT Silt15.0 110SDMN CLAY Clay28.0 110SDMN SAND Sand, silty31.0 110SDMN SAND Sand, silty with stones37.5 BEDROCK ROCK Refusal; bedrock or boulders
LAB 2 60.0 0 110SDMN SAND Sand, fine to coarse9.0 110SDMN MUCK Muck, fibrous
15.0 110SDMN SAND Sand, fine, silty22.0 110SDMN SILT Silt, varved, little fine sand30.0 110SDMN SAND Sand, silty50.0 112TILL TILL Till, dense, silty60.0 112TILL TILL End of hole
LAB 3 75.0 0 110SDMN SAND Sand and muck6.0 110SDMN SAND Sand, fine, trace of silt
62.0 112TILL TILL Till, sandy with boulders75.0 112TILL TILL End of hole
122 Geohydrology and Water Quality of Stratified-Drift Aquifers in the Winnipesaukee River Basin, Central New Hampshire

Table B-1. Stratigraphic logs of selected wells and borings in the Winnipesaukee River Basin, central New Hampshire Continued
Local site
number
Depth Depth Depth of to drilled well refusal (feet) (feet) (feet)
Depth to top
(feet)Aquifer code
Lithologic description of
material
BELKNAP COUNTY
Laconia-coaclaucd
LAB 4
LAB 5
LAB 6
LAW 1
57.0 57.0
30.0
20.0
15.6 15.0
015.40.45.57.
06.
11.24.30.
08.
10.12.18.20.
0
0000
0000
00000
110SDMN110SDMN110SDMN112TILL112TILL
110SDMN110SDMN110SDMN112TILL112TILL
111FILL110SDMN110SDMN110SDMN112TILL112TILL
110SDMN
SANDSANDGRVLTILLTILL
SANDSDSTSANDTILLTILL
SANDSDSTSANDGRVLTILLTILL
SAND
Sand, coarse, some fillSand, fineGravelTillRefusal; till
Sand fillSand and siltSand, fineTill, siltyEnd of hole
FillSand and siltSand, coarseGravelTill, siltyEnd of hole
Sand, fine to medium, trace of coarse sand.trace of silt
LAW 5
LAW 7
LAW 9
LAW 12
LAW 16
LAW 17
LAW 41
LAW 43
LAW 47
LAW 54
LAW 59
6.7
250.0
200.0
370.0
305.0
265.0
370.0
502.0
190.0
433.0
15.0
3.9.
15.
0
080.
05.
060.85.
018.
15,
0150.
045
060
032
0
.0,06
.0
.0
,0,0
.0
.0
.0
.0
.0
.0
110SDMN110SDMN110SDMN
112SRFD
112TILLBEDROCK
112TILLBEDROCK
112TILL110SDMNBEDROCK
110SDMNBEDROCK
BEDROCK
110SDMNBEDROCK
112TILLBEDROCK
110SDMNBEDROCK
110SDMNBEDROCK
110SDMN
SANDSANDSAND
TILLROCK
TILLROCK
TILLCLAYROCK
SDGLROCK
ROCK
SANDROCK
TILLROCK
CLAYROCK
CLAYROCK
SAND
Sand, coarseSand, medium, siltyEnd of hole
Gravel , hardpan
Appendix B 123

Table B-1. Stratigraphic logs of selected wells and borings in the Winnipesaukee River Basin, central New Hampshire Continued
Local Depth site drilled
number (feet)
Depth Depth Depth of to to
well refusal top (feet) (feet) (feet)
Lithologic description Aquifer of code material
BELKNAP COUNTY
LAW 70
LAW 71
LAW 75
MHB 1 9.0
MHB 2 35.0
MHB 3 28.0
MHB 4 27.0
MHB 6 25.0
MHB 7 29.0
MHB 8 51.0
145.0 070.0
20.0 -- 08.0
400.0 -- 06.0
9.0 04.0
9.0
014.022.027.035.0
28.0 010.020.025.028.0
27.0 010.020.024.027.0
25.0 05.0
10.020.024.025.0
29.0 05.0
10.015.020.025.029.0
51.0 05.0
35.045.051.0
Laconia-Contlnued
112TILL TILLBEDROCK ROCK
110SDMN SAND110SDMN SDCL
110SDMN SDGLBEDROCK ROCK
Maredith
110SDMN CLAY Clay112TILL TILL TillBEDROCK ROCK Bedrock
110SDMN SDST Sand, fine and silty110SDMN SILT Silt, varved, gray110SDMN SAND Sand, fine112TILL TILL Till, dense and sandy112TILL TILL End of hole
110SDMN SAND Sand, medium; brown, fine110SDMN SAND Sand, fine, clay boulders110SDMN SDCL Sand, silty, fine, and clay110SDMN OTHR Silt and hardpan110SDMN OTHR Refusal
110SDMN SAND Sand, medium; brown, fine110SDMN SAND Sand, fine, silty, boulders110SDMN SAND Sand, fine, silty110SDMN HRDP Hardpan110SDMN HRDP Refusal
110SDMN SAND Sand, brown, fine110SDMN SAND Sand, brown, medium, trace of clay110SDMN SAND Sand, dark brown110SDMN SAND Sand, brown, fine, trace of clay110SDMN HRDP Hardpan110SDMN HRDP Refusal
110SDMN SAND Sand, brown, fine110SDMN SAND Sand, brown, medium110SDMN SAND Sand, brown, medium, trace of clay110SDMN SAND Sand, brown, medium, clay110SDMN SAND Sand, brown, fine, clay110SDMN HRDP Hardpan110SDMN HRDP Refusal
110SDMN SAND Sand, brown, medium110SDMN CLAY Clay, sandy110SDMN SDCL Sand, fine, and clay110SDMN SDST Silt, fine, and sand110SDMN SDST Refusal
124 Geohydrology and Water Quality of Stratified-Drift Aquifers in the Winnipesaukee River Basin, Central New Hampshire

Table B-1. Stratigraphic logs of selected wells and borings in the Winnipesaukee River Basin, central New Hampshire Continued
Local Depthsite drilled
number (feet)
Depth Depth Depthof to to
well refusal top(feet) (feet) (feet)
Aquifercode
Lithologic descriptionof
material
BELKNAP COUNTY
Meredith-continued
MHB 9 48.0
MHB 10 40.0
MHB 11 47.0
MHB 12 45.4
MHB 13 55.0
MHB 14 25.0
MHW 1 91.0
48.0 010.015.020.025.040.048.0
40.0 05.0
10.015.025.030.040.0
47.0 010.020.025.040.047.0
45.0 45.5 05.0
20.025.035.040.045.4
55.0 05.0
10.020.045.055.0
25.0 05.0
10.020.023.025.0
35.0 91.0 025.030.040.075.080.091.0
110SDMN110SDMN110SDMN110SDMN110SDMN110SDMN110SDMN
110SDMN110SDMN110SDMN110SDMN-110SDMN110SDMN110SDMN
110SDMN110SDMN110SDMN110SDMN110SDMN110SDMN
110SDMN110SDMN110SDMN110SDMN110SDMN110SDMN110SDMN
110SDMN110SDMN110SDMN110SDMN110SDMN110SDMN
110SDMN110SDMN110SDMN110SDMN110SDMN110SDMN
112SRFD112SRFD112SRFD112SRFD112SRFD112TILL112TILL
SAND Sand, brown, fineSAND Sand, fine to medium, trace ofSDCL Sand, fine to medium, and claySDCL Sand, medium, and clayCLAY Clay, sandy, mediumSDST Silt and sand, fineSDST Refusal
SAND Sand, fineSAND Sand, mediumSDCL Sand, brown, medium and clayCLAY Clay, graySDCL Sand, fine and gray claySDST Silt, and sand, fineSDST Refusal
SAND Sand, brown, medium to coarseSAND Sand, fine, silty
clay
SAND Sand, fine, silty, trace of claySDCL Sand, fine silty, and claySDCL Sand, silty, and claySDCL Refusal
SAND Sand, brown, fineSAND Sand, brown, medium to coarseSAND Sand, brown, medium, trace ofSAND Sand, medium to coarseSAND Sand, medium, little siltSAND Sand, brown, medium to coarseSAND Refusal
SAND Sand, brown, fineSAND Sand, brown, fine to mediumSAND Sand, brown, medium, trace ofSTCL Silt and claySDCL Sand, fine, silty, and claySDCL Refusal
SAND Sand, medium; brown, fineSAND Sand, fine, trace of claySDCL Sand, fine, and claySDCL Sand, silty and clayHRDP HardpanHRDP Refusal
SAND Sand, fineSAND Sand, mediumSAND Sand, coarseSAND Sand, very fine to fineSAND Sand, mediumTILL Clay tillTILL Till, close to refusal
clay
silt
Appendix B 125

Table B-1. Stratigraphic logs of selected wells and borings in the Winnipesaukee River Basin, central New Hampshire Continued
Depth Depth Local Depth of to site drilled well refusal
number (feet) (feet) (feet)
Depth to top
(feet)Aquifer
code
Lithologic description of
material
BELKNAP COUNTY
Meredith-Continued
MHW 2 69.0 55.0 69.0
MHW 13 -- 280.0
MHW 24 -- 180.0
MHW 28 -- 205.0
MHW 33 730.0
MHW 58 -- 673.0
MHW 85 -- 425.0
MHW 90 225.0
MHW 91 300.0
MHW 95 -- 520.0
MHW 101 -- 408.0
MHW 111 -- 125.0
MHW 136 -- 465.0
MHW 143 -- 233.0
MHW 147 -- 835.0
MHW 162 -- 310.0
MHW 164 -- 533.0
MHW 167 -- 270.0
030.035.050.057.069.0
012.0
070.0
026.0
048.065.0
012.0
10.0
019.0
041.0
025.0
020.0
2.0
1.0
010.0
044.0
012.0
05.0
042.0
112SRFD112SRFD112SRFD112SRFD112TILL112TILL
110SDMNBEDROCK
110SDMNBEDROCK
110SDMNBEDROCK
110SDMN112TILLBEDROCK
112TILLBEDROCK
BEDROCK
110SDMNBEDROCK
110SDMNBEDROCK
110SDMNBEDROCK
112TILLBEDROCK
BEDROCK
BEDROCK
112TILLBEDROCK
110SDMNBEDROCK
112TILLBEDROCK
112TILLBEDROCK
112TILLBEDROCK
SAND Sand, fine to mediumSAND Sand, mediumSAND Sand, very fineSAND Sand, very coarseTILL TillTILL End of hole, till
SDGLROCK
SDGLROCK
SDGLROCK
SDGLTILL Clay, hardpanROCK
TILLROCK
ROCK
SDGLROCK
SDGLROCK
SDGLROCK
TILLROCK
ROCK
ROCK
TILLROCK
SANDROCK
TILLROCK
TILLROCK
TILLROCK
126 Geohydrology and Water Quality of Stratified-Drift Aquifers in the Winnipesaukee River Basin, Central New Hampshire

Table B-1. Stratigraphic logs of selected wells and borings in the Winnipesaukee River Basin, central New Hampshire Continued
Local site
number
Depth Depth Depth Depth of to to drilled well refusal top (feet) (feet) (feet) (feet)
Aquifer code
Lithologic description of
material
BELKNAP COUNTY
MHW 185
MHW 203
MHW 212
MHW 216
MHW 223
MHW 236
MHW 237
MHW 242
MHW 258
MHW 262
NHW 33
NHW 34
SCB 3
SCW 45
SCW 49
SCW 69
SCW 81
SCW 88
300.0 -- 043.0
277.0 -- 044.0
205.0 -- 09.0
305.0 -- 010.0
805.0 -- 067.0
255.0 010.0
280.0 010.0
400.0 -- 012.0
210.0 -- 030.0
250.0 -- 047.0
275.0 275.0 -- 040.0
252.0 252.0 -- 015.0
119.0 -- 119.0 086.0
119.0
140.0 -- 60.0
200.0 -- 30.0
225.0 -- 25.0
250.0 -- 010.0
135.0 -- 017.056.0
Meredith-CoatiauAd
110SDMN CLAYBEDROCK ROCK
110SDMN SDCLBEDROCK ROCK
112TILL TILL GravelBEDROCK ROCK
110SDMN CLAYBEDROCK ROCK
110SDMN OTHRBEDROCK ROCK
110SDMN CLAYBEDROCK ROCK
110SDMN CLAYBEDROCK ROCK
110SDMN SANDBEDROCK ROCK
112TILL TILLBEDROCK ROCK
110SDMN SDGLBEDROCK ROCK
New Hampton
112SRFD SANDBEDROCK ROCK End of
112SRFD SAND SandBEDROCK ROCK End of
Sanbornton
112LCSR SAND Sand,112SRFD GRVL Gravel
, hardpan
hole at 275 feet
hole at 252 feet
fine
BEDROCK ROCK Refusal; boulders or bedrock
BEDROCK
BEDROCK
BEDROCK ROCK
112TILL TILLBEDROCK ROCK
112TILL TILL110SDMN CLAYBEDROCK ROCK
Appendix B 127
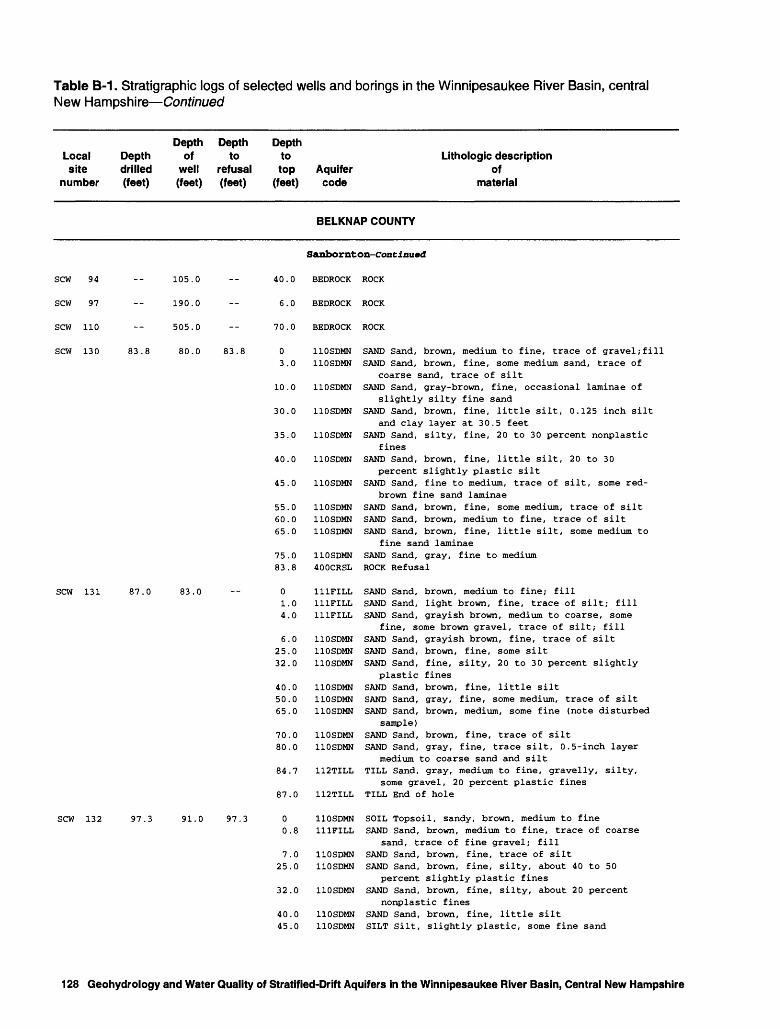
Table B-1. Stratigraphic logs of selected wells and borings in the Winnipesaukee River Basin, central New Hampshire Continued
Local Depthsite drilled
number (feet)
Depth Depth Depthof to to
well refusal top(feet) (feet) (feet)
Lithologic descriptionAquifer ofcode material
BELKNAP COUNTY
SCW 94
SCW 97
SCW 110
SCW 130 83.8
SCW 131 87.0
SCW 132 97.3
105.0 -- 40.0
190.0 6.0
505.0 -- 70.0
80.0 83.8 03.0
10.0
30.0
35.0
40.0
45.0
55.060.065.0
75.083.8
83.0 -- 01.04.0
6.025.032.0
40.050.065.0
70.080.0
84.7
87.0
91.0 97.3 00.8
7.025.0
32.0
40.045.0
Sanbornton-Continuad
BEDROCK ROCK
BEDROCK ROCK
BEDROCK ROCK
110SDMN SAND Sand, brown, medium to fine, trace of gravel; fill110SDMN SAND Sand, brown, fine, some medium sand, trace of
coarse sand, trace of silt110SDMN SAND Sand, gray-brown, fine, occasional laminae of
slightly silty fine sand110SDMN SAND Sand, brown, fine, little silt, 0.125 inch silt
and clay layer at 30.5 feet110SDMN SAND Sand, silty, fine, 20 to 30 percent nonplastic
fines110SDMN SAND Sand, brown, fine, little silt, 20 to 30
percent slightly plastic silt110SDMN SAND Sand, fine to medium, trace of silt, some red-
brown fine sand laminae110SDMN SAND Sand, brown, fine, some medium, trace of silt110SDMN SAND Sand, brown, medium to fine, trace of silt110SDMN SAND Sand, brown, fine, little silt, some medium to
fine sand laminae110SDMN SAND Sand, gray, fine to medium400CRSL ROCK Refusal
111FILL SAND Sand, brown, medium to fine; fill111FILL SAND Sand, light brown, fine, trace of silt; fill111FILL SAND Sand, grayish brown, medium to coarse, some
fine, some brown gravel, trace of silt; fill110SDMN SAND Sand, grayish brown, fine, trace of silt110SDMN SAND Sand, brown, fine, some silt110SDMN SAND Sand, fine, silty, 20 to 30 percent slightly
plastic fines110SDMN SAND Sand, brown, fine, little silt110SDMN SAND Sand, gray, fine, some medium, trace of silt110SDMN SAND Sand, brown, medium, some fine (note disturbed
sample)110SDMN SAND Sand, brown, fine, trace of silt110SDMN SAND Sand, gray, fine, trace silt, 0.5-inch layer
medium to coarse sand and silt112TILL TILL Sand, gray, medium to fine, gravelly, silty,
some gravel, 20 percent plastic fines112TILL TILL End of hole
110SDMN SOIL Topsoil, sandy, brown, medium to fine111FILL SAND Sand, brown, medium to fine, trace of coarse
sand, trace of fine gravel; fill110SDMN SAND Sand, brown, fine, trace of silt110SDMN SAND Sand, brown, fine, silty, about 40 to 50
percent slightly plastic fines110SDMN SAND Sand, brown, fine, silty, about 20 percent
nonplastic fines110SDMN SAND Sand, brown, fine, little silt110SDMN SILT Silt, slightly plastic, some fine sand
128 Geohydrology and Water Quality of Stratified-Drift Aquifers in the Winnipesaukee River Basin, Central New Hampshire

Table B-1. Stratigraphic logs of selected wells and borings in the Winnipesaukee River Basin, central New Hampshire Continued
Depth DepthLocal Depth of tosite drilled well refusal
number (feet) (feet) (feet)
Depthtotop
(feet)
Lithologic descriptionAquifer ofcode material
BELKNAP COUNTY
SCW 132 --Continued
SCW 133 20.5 19.8
SCW 134 21.5 20.0
TSB 1 30.0
TSB 3 41.0
TSB 4 21.0 20.0 21.0
TSB 5 27.0 -- 27.0
50.0
55.0
60.085.0
93.7
019.820.0
0
5.0
9-515.516.521.5
012.019.030.0
012.028.041.0
04.0
13.0
14.0
20.0
21.0
03.0
13.0
15.0
20.0
22.0
27.0
Sanbornton-Coatiaued
110SDMN SAND Sand, brown to grayish brown, fine, trace tolittle sil
110SDMN SAND Sand, gray, fine, trace of medium, little silt.occasional laminae of silty fine sand
110SDMN SAND Sand, gray, fine, trace of silt110SDMN SAND Sand, gray, fine to medium, small lenses of
medium to coarse sand, trace of gravel400CRSL ROCK Refusal
110SDMN SAND Sand, brown-red, fine, to medium, little gravel110SDMN SAND Sand, gray, fine, with lenses of silt and clay110SDMN SAND End of hole
110SDMN SAND Sand, brown, fine, trace medium to coarse,trace of silt
110SDMN SAND Sand, brown, fine to medium, little coarsesand, trace of gravel
110SDMN SAND Sand, gray, fine, little silt110SDMN SAND Sand, red-mottled, fine to medium110SDMN SAND Sand, gray, fine, with lenses of silt and clay110SDMN SAND End of hole
Tilton
110SDMN GRVL Gravel112TILL TILL Till, sandy112TILL TILL Till, silty112TILL TILL End of hole
110SDMN GRVL Gravel, little silt, brown112TILL TILL Till, dense and sandy112TILL TILL Till, dense and silty112TILL TILL End of hole
110SDMN MUCK Muck110SDMN SAND Sand, brown, fine to medium, little fine gravel110SDMN SAND Sand, brown to gray, fine to medium, silty,
little dark brown silt, trace of fine gravel110SDMN SAND Sand, brown to gray, fine to medium, little
fine gravel110SDMN SAND Sand, fine to medium, trace of coarse gravel,
trace of light gray silt110SDMN SAND Refusal
110SDMN MUCK Muck110SDMN SAND Sand, reddish-brown, fine to medium, little
fine gravel110SDMN SAND Sand, fine to medium, trace of fine gravel,
trace of reddish-brown to gray silt110SDMN SAND Sand, reddish-brown to brown, gravelly, fine to
medium, trace of fine to coarse gravel110SDMN SAND Sand, fine, little fine to coarse gravel, trace
of gray silt112TILL TILL Till, gravelly sand, fine to medium, some fine
to coarse gravel, chunks of gray silt112TILL TILL Refusal
Appendix B 129

Table B-1. Stratigraphic logs of selected wells and borings in the Winnipesaukee River Basin, central New Hampshire Continued
Local Depthsite drilled
number (feet)
Depth Depthof to
well refusal(feet) (feet)
Depthtotop Aquifer
(feet) code
Lithologic descriptionof
material
BELKNAP COUNTY
Ti 1 ton-Continued
TSW 1 55.5 55.5 0 112SRFD SDGL Sand and gravel, silty22.0 112SRFD STCL Silt and clay55.5 112SRFD STCL End of hole
TSW 2 32.0 32.0 0 110SDMN SDCL Sand and clay, alternating10.0 112SRFD SDST Sand, very fine, silt and clay32.0 112SRFD SDST End of hole
TSW 4 52.0 24.5 0.8 110SDMN SAND Sand, light brown, fine5.2 110SDMN SDGL Sand, fine to coarse, and gravel, fine to medium5.7 110SDMN SAND Sand, light brown, fine
14.0 110SDMN SAND Sand, light brown, 24.0 110SDMN SAND Sand, light brown, 33.0 110SDMN SAND Sand, light brown, 40.0 110SDMN SAND Sand, light brown,
foot oxidized layers48.0 110SDMN SAND Sand, light gray, fine to medium52.0 110SDMN SAND End of hole
fine to mediumfine to medium, trace of siltfinefine, occasional 0.1-0.2
TSW 5 52.0 50.0
TSW 6 52.0 26.0
0 110SDMN SDGL Sand, light brown, fine to medium, and gravel,fine to coarse, trace of cobbles
9.0 110SDMN SAND Sand, light brown, fine to medium to coarse,trace of fine gravel
16.0 110SDMN SAND sand, light brown, fine to medium 24.0 110SDMN SAND Sand, light gray, fine to medium 30.0 110SDMN SAND Sand, light gray, fine to medium to coarse,
trace of grave 40.0 110SDMN SAND Sand, light brown and gray, fine to medium,
trace of thin silt layers 52.0 110SDMN SAND End of hole
0 110SDMN SDGL Sand, light brown, fine to medium to coarse,and gravel fine to medium
6.5 110SDMN OTHR Sludge, light gray-dark brown, intermixed withfine to medium sand
10.5 110SDMN SDST Sand and silt, light brown, fine to medium 12.0 110SDMN GRVL Gravel, orange, fine to medium to coarse 12.5 110SDMN SAND Sand, light brown, fine to medium to coarse,
trace of fine gravel, oxidized layer at 15.3-15.4feet
26.0 110SDMN SAND Sand, light brown to gray, fine 40.5 110SDMN SAND Sand, light brown, fine to medium to coarse,
trace of fine gravel, occasional 0.1-feet oxidizedlayers
52.0 110SDMN SAND End of hole
TSW 7 52.0 47.0 0 110SDMN SOIL Topsoil1.5 110SDMN SAND Sand, orange-brown fine to medium2.5 110SDMN SAND Sand, tan, fine3.0 110SDMN SAND Sand, tan, fine to medium to coarse
13.0 110SDMN SDST Sand and silt, tan, fine, occasional gray clay- silt layers
19.0 110SDMN SAND Sand, brown, fine to medium 29.0 110SDMN SAND Sand, brown, fine to medium to coarse 37.0 110SDMN SDST Sand and silt, brown, fine, embedded gravel,
fine to coarse, trace of clay
130 Geohydrology and Water Quality of Stratified-Drift Aquifers in the Winnipesaukee River Basin, Central New Hampshire

Table B-1. Stratigraphic logs of selected wells and borings in the Winnipesaukee River Basin, central New Hampshire Continued
Local Depthsite drilled
number (feet)
Depth Depthof to
well refusal(feet) (feet)
Depthtotop Aquifer
(feet) code
Lithologic descriptionof
material
BELKNAP COUNTY
TSW
TSW
7--Continued
52.0 30.0
TSW 52.0 31.0
TSW 10 49.0 13.0
Ti 1 ton-Continued
41.
52.
00.5.
15,
20.
25.34.42.52.
00.
10.11,15,20,25,
30
32
3545
5052
00
0
0
,8,0
,0
,0
.0,0,0.0
.8
.0
.0
.0
.0
.0
.0
.0
.0
.0
.0
.0
.8
110SDMN
110SDMN
110SDMN110SDMN110SDMN
110SDMN
110SDMN
110SDMN110SDMN110SDMN110SDMN
110SDMN110SDMN
110SDMN110SDMN110SDMN110SDMN110SDMN
110SDMN
110SDMN
110SDMN110SDMN
110SDMN110SDMN
110SDMN110SDMN
GRVL Gravel, fine to coarse, poorly sorted, trace offine sand
GRVL End of hole
SOIL TopsoilSAND Sand, brown, medium to coarseSAND Sand, light brown, fine to medium,
mottlingwith brown
SAND Sand, light brown, fine, occasional micaceouslaminae
SAND Sand, brown, fine, trace of silt,pockets 0.125-inch thick
SAND Sand, brown-tan, fine, occasionalSILT Silt, gray, clayey, trace of fineCLAY Clay, grayCLAY End of hole
SOIL Topsoil
some clay
orange mottlessand
SAND Sand, brown, medium to coarse, trace of finegravel
SAND Sand, tan, fine to coarseSAND Sand, tan, fineSAND Sand, brown, fine to mediumSAND Sand, tan, fineSAND Sand, tan, fine, frequent micaceous laminae
interbeddedSAND Sand, brown, fine, little silt, frequent
micaceous laminae interbeddedSAND Sand, brown, fine, trace of silt,
0.125-inch clay lensesCLAY Clay, gray, silty, layered
occasional
SILT Silt, gray, clayey, frequent pockets of siltyclay
SILT Silt, gray, trace of fine sandSILT End of hole
SOIL TopsoilSDGL Sand, light brown, fine to medium to coarse,
and gravel, fine to medium 3.0 110SDMN SAND Sand, light brown, medium to coarse, trace of
fine gravel8.5 110SDMN SAND Sand, orange-brown, fine to medium
14.0 110SDMN SDST Sand, light brown, fine, and silt, withoccasional 0.0625-inch oxidized layers
19.0 110SDMN SILT Silt, light brown, little fine sand, occasional0.25-inch clay layers
26.0 110SDMN SDST Sand, gray, fine, and silt 28.5 110SDMN SAND Sand, gray-purple, fine to medium, trace of
fine to medium gravel, with little to some silt 38.0 110SDMN SAND Sand, light gray, fine to medium, little
embedded fine to coarse gravel, trace of silt 45.0 110SDMN SILT Silt, gray, little fine sand, little embedded
gravel, fine to medium, trace of clay 49.0 110SDMN SILT End of hole
Appendix B 131
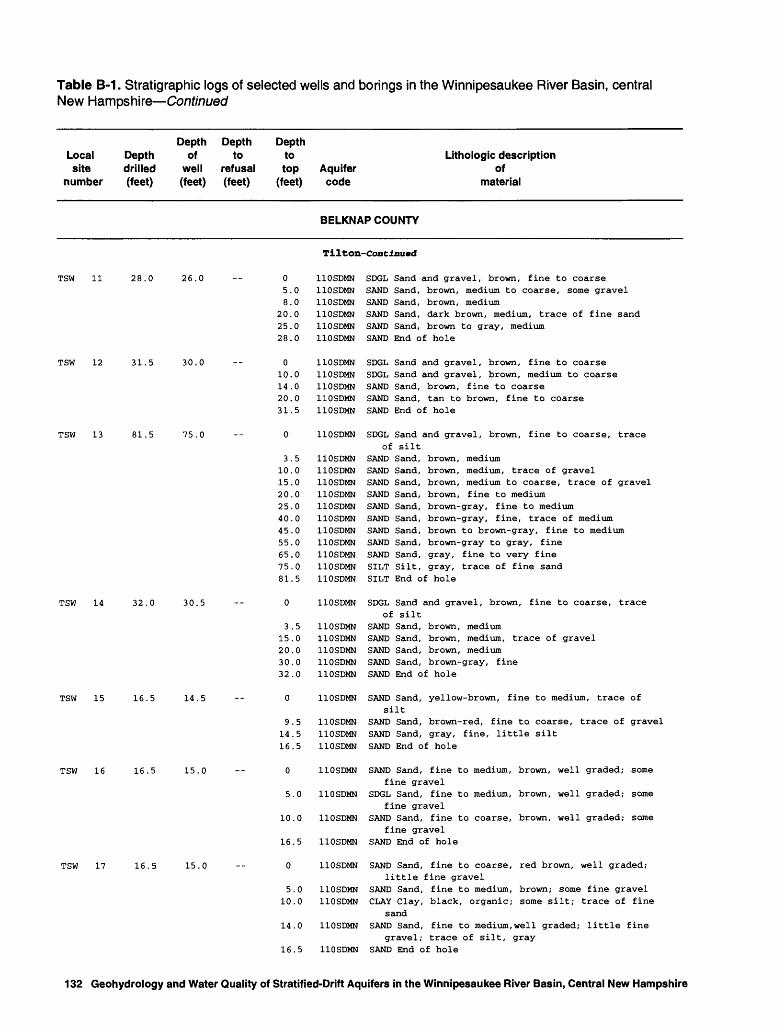
Table B-1. Stratigraphic logs of selected wells and borings in the Winnipesaukee River Basin, central New Hampshire Continued
Depth Depth Local Depth of to site drilled well refusal
number (feet) (feet) (feet)
Depth to top
(feet)Aquifer code
Lithologic description of
material
BELKNAP COUNTY
Ti 1 1 on-Con t inued
TSW 11 28.0 26.0
TSW 12 31.5 30.0
TSW 13 81.5 75.0
TSW 14 32.0 30.5
TSW 15 16.5 14.5
TSW 16 16.5 15.0
TSW 17 16.5 15.0
05.08.0
20.025.028.0
010.014.020.031.5
0
3.510.015.020.025.040.045.055.065.075.081.5
0
3.515.020.030.032.0
0
9.514.516.5
0
5.0
10.0
16.5
0
5.010.0
14.0
16.5
110SDMN110SDMN110SDMN110SDMN110SDMN110SDMN
110SDMN110SDMN110SDMN110SDMN110SDMN
110SDMN
110SDMN110SDMN110SDMN110SDMN110SDMN110SDMN110SDMN110SDMN110SDMN110SDMN110SDMN
110SDMN
110SDMN110SDMN110SDMN110SDMN110SDMN
110SDMN
110SDMN110SDMN110SDMN
110SDMN
110SDMN
110SDMN
110SDMN
110SDMN
110SDMN110SDMN
110SDMN
110SDMN
SDGL Sand and gravel, brown, fine to coarseSAND Sand, brown, medium to coarse, some gravelSAND Sand, brown, mediumSAND Sand, dark brown, medium, trace of fine sandSAND Sand, brown to gray, mediumSAND End of hole
SDGL Sand and gravel, brown, fine to coarseSDGL Sand and gravel, brown, medium to coarseSAND Sand, brown, fine to coarseSAND Sand, tan to brown, fine to coarseSAND End of hole
SDGL Sand and gravel, brown, fine to coarse, traceof silt
SAND Sand, brown, mediumSAND Sand, brown, medium, trace of gravelSAND Sand, brown, medium to coarse, trace of gravelSAND Sand, brown, fine to mediumSAND Sand, brown-gray, fine to mediumSAND Sand, brown-gray, fine, trace of mediumSAND Sand, brown to brown-gray, fine to mediumSAND Sand, brown-gray to gray, fineSAND Sand, gray, fine to very fineSILT Silt, gray, trace of fine sandSILT End of hole
SDGL Sand and gravel, brown, fine to coarse, traceof silt
SAND Sand, brown, mediumSAND Sand, brown, medium, trace of gravelSAND Sand, brown, mediumSAND Sand, brown-gray, fineSAND End of hole
SAND Sand, yellow-brown, fine to medium, trace ofsilt
SAND Sand, brown-red, fine to coarse, trace of gravelSAND Sand, gray, fine, little siltSAND End of hole
SAND Sand, fine to medium, brown, well graded; somefine gravel
SDGL Sand, fine to medium, brown, well graded; somefine gravel
SAND Sand, fine to coarse, brown, well graded; somefine gravel
SAND End of hole
SAND Sand, fine to coarse, red brown, well graded;little fine gravel
SAND Sand, fine to medium, brown; some fine gravelCLAY Clay, black, organic; some silt; trace of fine
sandSAND Sand, fine to medium, well graded; little fine
gravel; trace of silt, graySAND End of hole
132 Geohydrology and Water Quality of Stratified-Drift Aquifers in the Winnipesaukee River Basin, Central New Hampshire

Table B-1 . Stratigraphic logs of selected wells and borings in the Winnipesaukee River Basin, central New Hampshire Continued
Local Depthsite drilled
number (feet)
Depth Depth Depthof to to
well refusal top(feet) (feet) (feet)
Lithologic descriptionAquifer ofcode material
BELKNAP COUNTY
TSW 18 16.5
TSW 19 16.5
TSW 20 16.5
TSW 21 16.5
TSW 22 16.5
TSW 23 16.5
TSW 24
TSW 25
TSW 26
15.0 -- 05.0
13.016.5
15.0 -- 05.0
10.0
16.5
15.0 -- 0
10.014.0
16.5
15.0 -- 0
5.0
10.0
14.016.5
15.0 0
5.0
10.015.016.5
15.0 -- 0
5.0
10.0
15.0
16.5
10.9 -- 0
600.0 -- 050.0
400.0 -- 010.015.0
140.0
Ti 1 ton-Continued
110SDMN SAND Sand, fine to coarse, red brown, well graded110SDMN SAND Sand, fine to coarse, red brown; some fine to
coarse gravel110SDMN SAND Sand, fine, poorly graded; trace of silt110SDMN SAND End of hole
110SDMN SAND Sand, fine; some dark brown silt110SDMN SILT Silt, dark brown; some fine sand110SDMN CLAY Clay, black, organic; little silt; trace of
fine sand110SDMN CLAY End of hole
-110SDMN SAND Sand, fine to coarse, brown, well graded; somefine to medium gravel
110SDMN GRVL Gravel, fine to coarse,- little coarse brown sand110SDMN SAND Sand, medium to coarse, red brown; little fine
to medium gravel110SDMN SAND End of hole
110SDMN SAND Sand, fine to coarse, brown, well graded;little fine gravel
110SDMN SAND Sand, fine to coarse, brown, well graded; somefine to coarse gravel
110SDMN SAND Sand, fine to coarse, well graded; some silt;some fine to medium gravel
110SDMN SAND Sand, fine, poorly graded; little silt110SDMN SAND End of hole
110SDMN SAND Sand, fine to coarse, brown, well graded; somefine to medium gravel
110SDMN SDGL Sand, medium to coarse; and fine to coarsegravel
110SDMN SAND Sand, fine, brown, poorly graded; some silt110SDMN SAND Sand, fine, red brown, poorly graded; some silt110SDMN SAND End of hole
110SDMN SAND Sand, fine to medium, brown, poorly graded;little silt trace fine gravel
110SDMN SAND Sand, fine to coarse, brown, well graded; traceof silt; trace of fine gravel
110SDMN SAND Sand, fine to medium; some silt; little fine tomedium gravel
110SDMN SAND Sand, fine to medium, well graded; some silt,black organic; little fine to coarse gravel
110SDMN SAND End of hole
112SRFD
112TILL TILL Sand, gravel, hardpanBEDROCK ROCK
110SDMN SDGL110SDMN SDGL112TILL TILL Clay, hardpanBEDROCK ROCK
Appendix B 133

Table B-1. Stratigraphic logs of selected wells and borings in the Winnipesaukee River Basin, central New Hampshire Continued
Local site
number
Depth Depth Depth of to drilled well refusal (feet) (feet) (feet)
Depth to top
(feet)Aquifer code
Lithologic description of
material
BELKNAP COUNTY
Ti 1 ton-Continued
TSW
TSW
TSW
TSW
TSW
TSW
TSW
TSW
TSW
TSW
TSW
TSW
TSW
TSW
TSW
TSW
TSW
TSW
28
33
34
35
36
40
41
42
43
44
45
49
50
52
55
57
58
59
280.
16.
310.
280.
310.
300.
230.
430.
400.
410.
310,
725,
365
305
202
555
605
355
0
0
0
0
0
,0
,0
.0
.0
.0
.0
.0
.0
.0
.0
.0
.0
.0
0136.
05.
10.
085.
040.
072.
067.
080.
090.
132.
080.
080.
90.
140,
130
0111
0378893
104
03991
100
037
8490
0
00
0
0
0
0
0
,0
,0
.0
.0
.0
.0
.0
.0
.0
.0
.0
.0
.0
.0
.0
.0
.0
.0
112TILLBEDROCK
110SDMN110SDMN110SDMN
110SDMNBEDROCK
110SDMNBEDROCK
110SDMNBEDROCK
112TILLBEDROCK
110SDMNBEDROCK
110SDMNBEDROCK
BEDROCK
110SDMNBEDROCK
110SDMNBEDROCK
BEDROCK
BEDROCK
BEDROCK
110SDMNBEDROCK110SDMN110SDMN110SDMN110SDMNBEDROCK
110SDMN110SDMN110SDMNBEDROCK
110SDMN110SDMN110SDMNBEDROCK
TILLROCK
SANDSDGLCLAY
SANDROCK
SANDROCK
SANDROCK
TILL Gravel, clay, hardpanROCK
SANDROCK
SANDROCK
ROCK
SANDROCK
SANDROCK
ROCK
ROCK
ROCK
SDGLROCKSGVCSGVCSGVCSGVCROCK
SGVCSDGLCLAYROCK
SGVCSGVCCLAYROCK
134 Geohydrology and Water Quality of Stratified-Drift Aquifers in the Winnipesaukee River Basin, Central New Hampshire

Table B-1. Stratigraphic logs of selected wells and borings in the Winnipesaukee River Basin, central New Hampshire Continued
Localsite
number
DepthDepth of drilled well (feet) (feet)
Depthto
refusal (feet)
Depthtotop Aquifer
(feet) code
Lithologic descriptionof
material
BELKNAP COUNTY
Tilton-Continu«d
TSW 60 405.0 0 110SDMN SGVC39.0 110SDMN SGVC81.0 110SDMN CLAY93.0 BEDROCK ROCK
TSW 61 57.0 049.0
110SDMN SGVC 110SDMN SDGL
TSW 65 303.0 0135.0
110SDMN BEDROCK
SDCL ROCK
TSW 67 280.0 0135.0
112TILL TILL Clay, hardpan BEDROCK ROCK
TSW 69 77.0 060.2
112TILL TILL BEDROCK ROCK
TSW 80 340.0 340.0 0 112SRFD GRVL Gravel15.0 112LCSR SDCL Sand, very fine, silt and clay
112.0 BEDROCK ROCK Bedrock
CARROLL COUNTY
Mou1tonborough
MWA 1
MWA 2
5.0
35.0
5.0 0 110SDMN SAND Sand, fine, tan, dry; very fine to medium; afew pebbles and fine gravel
5.0 110SDMN ROCK Refusal; boulder or bedrock
35.0 0 110SDMN SAND Sand, fine to medium2.0 110SDMN SAND Sand, very coarse, to fine gravel, tan, clean;
a few pebbles, some medium sand. 17.0 110SDMN STCL Silt and clay, gray/tan, some very fine sand
layers22.0 112TILL TILL Till, very sandy, tan, dry 35.0 112TILL TILL Refusal; till
MWW 1 210.0 010.0
112TILL TILL BEDROCK ROCK
MWW 2 290.0 0 112TILL TILL 11.0 BEDROCK ROCK
MWW 3 200.0 0 112TILL TILL 8.0 BEDROCK ROCK
MWW 4
MWW 5
202.0
515.0
90.0 BEDROCK ROCK
0 112TILL TILL 6.0 BEDROCK ROCK
280.0 0 110SDMN SAND 3.0 BEDROCK ROCK
Appendix B 135

Table B-1. Stratigraphic logs of selected wells and borings in the Winnipesaukee River Basin, central New Hampshire Continued
Local Depth site drilled
number (feet)
Depth Depth Depth of to to
well refusal top (feet) (feet) (feet)
Lithologic description Aquifer of code material
CARROLL COUNTY
Houltonborouffh-CoaClaued
MWW 7
MWW 9
MWW 10
MWW 11
MWW 12
MWW 15
MWW 16
MWW 18
MWW 19 36.0
MWW 20 48.5
MWW 21
MWW 23
MWW 30
MWW 31
MWW 33
MWW 35
MWW 36
383.0 -- 06.0
400.0 -- 55.0
312.0 -- 060.0
212.0 -- 020.044.0
252.0 -- 05.0
653.0 -- 035.0125.0
752.0 -- 020.0
440.0 -- 08.0
32.0 36.0 030.036.0
30.0 48.5 025.030.047.048.5
20.0 -- 0
320.0 -- 033.0
305.0 -- 015.0
305.0 -- 048.0
427.0 -- 098.0
705.0 -- 055.0
560.0 -- 010.039.0
110SDMN SDGLBEDROCK ROCK
BEDROCK ROCK
112TILL TILLBEDROCK ROCK
110SDMN SDGL110SDMN CLAYBEDROCK ROCK
112TILL TILLBEDROCK ROCK
110SDMN SDGL112TILL TILL Clay, hardpanBEDROCK ROCK
112TILL TILLBEDROCK ROCK
110SDMN CLAYBEDROCK ROCK
112SRFD SAND Sand, fine, some thin coarser layers112SRFD SAND Sand, coarseBEDROCK ROCK Refusal; bedrock
112SRFD SAND Medium sand112SRFD SAND Coarse sand112SRFD SAND Medium sand112TILL TILL TillBEDROCK ROCK Refusal; bedrock
112SRFD
112TILL TILLBEDROCK ROCK
110SDMN SANDBEDROCK ROCK
110SDMN SDGLBEDROCK ROCK
112TILL TILLBEDROCK ROCK
110SDMN SDGLBEDROCK ROCK
110SDMN SAND110SDMN CLAYBEDROCK ROCK
136 Geohydrology and Water Quality of Stratified-Drift Aquifers in the Winnipesaukee River Basin, Central New Hampshire
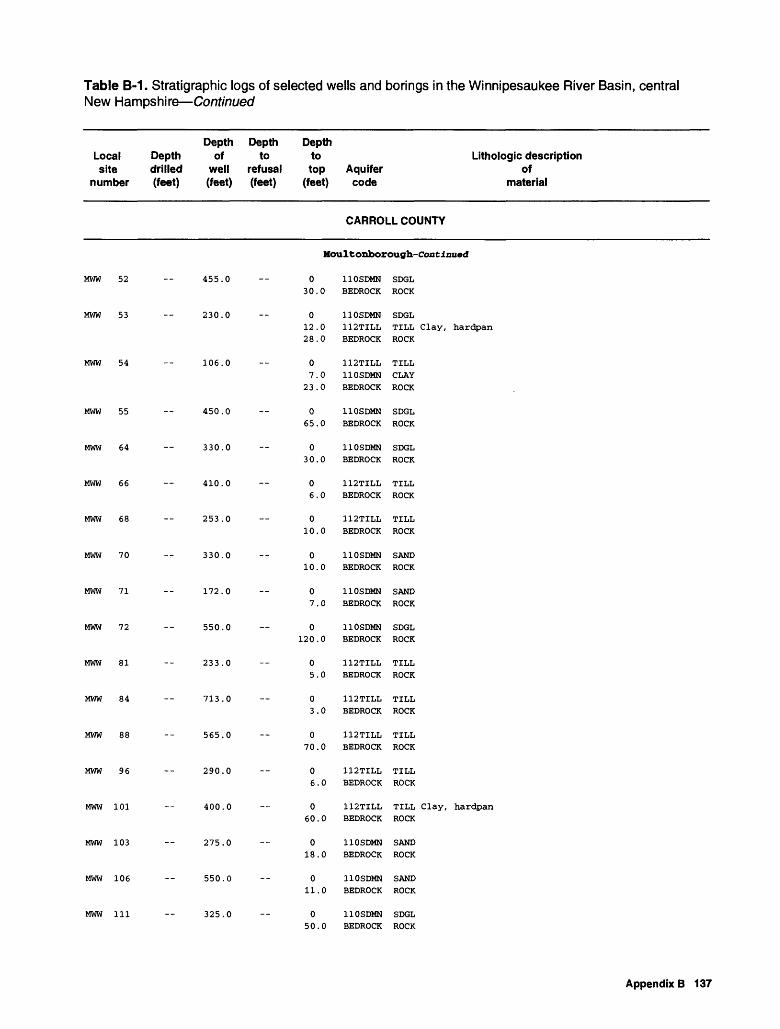
Table B-1. Stratigraphic logs of selected wells and borings in the Winnipesaukee River Basin, central New Hampshire Continued
Localsite
number
Depthdrilled(feet)
Depthof
well(feet)
Depthto
refusal(feet)
Depthtotop
(feet)Aquifer
code
Lithologic descriptionof
material
CARROLL COUNTY
Moultonborough-Continuad
MWW 52 455.0 0 110SDMN SDGL 30.0 BEDROCK ROCK
MWW 53 230.0 0 110SDMN SDGL12.0 112TILL TILL Clay, hardpan28.0 BEDROCK ROCK
MWW 54 106.0 07.0
23.0
112TILL TILL110SDMN CLAYBEDROCK ROCK
MWW 55 450.0 0 110SDMN SDGL 65.0 BEDROCK ROCK
MWW 64 330.0 030.0
110SDMN SDGL BEDROCK ROCK
MWW 66 410.0 0 112TILL TILL 6.0 BEDROCK ROCK
MWW 68 253.0 0 112TILL TILL 10.0 BEDROCK ROCK
MWW 70 330.0 0 110SDMN SAND 10.0 BEDROCK ROCK
MWW 71 172.0 0 110SDMN SAND 7.0 BEDROCK ROCK
MWW 72 550.0 0 110SDMN SDGL 120.0 BEDROCK ROCK
MWW 81 233.0 0 112TILL TILL 5.0 BEDROCK ROCK
MWW 84 713.0 0 3.0
112TILL TILL BEDROCK ROCK
MWW 88 565.0 070.0
112TILL TILL BEDROCK ROCK
MWW 96 290.0 0 112TILL TILL 6.0 BEDROCK ROCK
MWW 101 400.0 060.0
112TILL TILL Clay, hardpan BEDROCK ROCK
MWW 103 275.0 0 110SDMN SAND 18.0 BEDROCK ROCK
MWW 106 550.0 0 110SDMN SAND 11.0 BEDROCK ROCK
MWW 111 325.0 0 110SDMN SDGL 50.0 BEDROCK ROCK
Appendix B 137

Table B-1. Stratigraphic logs of selected wells and borings in the Winnipesaukee River Basin, central New Hampshire Continued
Local site
number
Depth Depth Depth of to drilled well refusal (feet) (feet) (feet)
Depth to top
(feet)Aquifer code
Lithologic description of
material
CARROLL COUNTY
Moultonborough-coatiauad
MWW
MWW
MWW
MWW
MWW
MWW
MWW
MWW
MWW
MWW
MWW
MWW
MWW
MWW
MWW
MWW
MWW
MWW
MWW
114
116
120
132
153
155
165
171
177
179
180
181
183
187
194
197
198
199
201
140.
210.
270.
272.
522.
330.
623.
462.
273.
353.
277.
333,
272
550
874
1600
613
1110
350
0
0
0
0
0
0
,0
0
,0
.0
.0
.0
.0
.0
.0
.0
.0
.0
.0
011.
04.
018.
05.
060.
06.
050.90.
028.
015.
082.
020.
015.
079,
025
022
040
06
015
012
0
0
0
0
0
0
00
0
,0
,0
,0
,0
.0
.0
.0
.0
.0
.0
.0
112TILLBEDROCK
110SDMNBEDROCK
112TILLBEDROCK
112TILLBEDROCK
112TILLBEDROCK
112TILLBEDROCK
112TILL110SDMN
BEDROCK
110SDMNBEDROCK
112TILLBEDROCK
112TILLBEDROCK
110SDMNBEDROCK
110SDMNBEDROCK
110SDMNBEDROCK
110SDMNBEDROCK
112TILLBEDROCK
112TILLBEDROCK
112TILLBEDROCK
112TILLBEDROCK
110SDMNBEDROCK
TILLROCK
SANDROCK
TILLROCK
TILLROCK
TILLROCK
TILLROCK
TILLCLAYROCK
CLAYROCK
TILLROCK
TILLROCK
SDCLROCK
SANDROCK
SDGLROCK
SDCLROCK
TILLROCK
TILLROCK
TILLROCK
TILLROCK
SANDROCK
Clay, hardpan
Clay, hardpan
Gravel , hardpan
Gravel, hardpan
138 Geohydrology and Water Quality of Stratified-Drift Aquifers in the Winnipesaukee River Basin, Central New Hampshire

Table B-1. Stratigraphic logs of selected wells and borings in the Winnipesaukee River Basin, central New Hampshire Continued
Localsite
number
Depthdrilled(feet)
Depthof
well(feet)
Depthto
refusal(feet)
Depthtotop
(feet)Aquifer
code
Lithologic descriptionof
material
CARROLL COUNTY
Moultoaborough-Contiaucd
MWW 203 453.0 0 112TILL TILL 12.0 BEDROCK ROCK
MWW 206 600.0 0 110SDMN SAND 42.0 BEDROCK ROCK
MWW 207 250.0 0 112TILL TILL 20.0 BEDROCK ROCK
MWW 210 350.0 0 112TILL TILL 50.0 BEDROCK ROCK
MWW 214 360.0 0 112TILL TILL 6.0 BEDROCK ROCK
MWW 217 980.0 0 110SDMN SAND 9.0 BEDROCK ROCK
MWW 218 760.0 0 110SDMN SAND 9.0 BEDROCK ROCK
MWW 219 980.0 0 110SDMN SAND 6.0 BEDROCK ROCK
MWW 220 855.0 0 110SDMN OTHR 150.0 BEDROCK ROCK
MWW 221 305.0 0 110SDMN SAND 14.0 BEDROCK ROCK
MWW 222 305.0 0 112TILL TILL Sand, hardpan 85.0 BEDROCK ROCK
MWW 225 730.0 0 110SDMN SDGL20.0 112TILL TILL Clay, hardpan70.0 BEDROCK ROCK
MWW 227 428.0 0 110SDMN CLAY 16.0 BEDROCK ROCK
MWW 228 578.0 0 110SDMN SAND 43.0 BEDROCK ROCK
MWW 232 118.0 0 110SDMN SAND 5.0 BEDROCK ROCK
MWW 234 464.0 0 112TILL TILL 25.0 BEDROCK ROCK
MWW 238 305.0 0 110SDMN SDCL 10.0 BEDROCK ROCK
MWW 257 680.0 0 112TILL TILL Sand, gravel, hardpan 20.0 BEDROCK ROCK
MWW 258 155.0 0 110SDMN SDCL 6.0 BEDROCK ROCK
Appendix B 139

Table B-1. Stratigraphic logs of selected wells and borings in the Winnipesaukee River Basin, central New Hampshire Continued
Local site
number
Depth Depth Depth of to drilled well refusal (feet) (feet) (feet)
Depth to top
(feet)Aquifer code
Lithologic description of
material
CARROLL COUNTY
Moultonborough-Contlnued
MWW
MWW
MWW
MWW
MWW
MWW
MWW
MWW
MWW
MWW
MWW
MWW
MWW
MWW
MWW
MWW
MWW
MWW
MWW
265
275
287
295
301
303
304
307
309
310
316
321
324
326
330
331
332
334
335
130.
782.
815.
680.
200.
540.
18.
420.
640.
420.
205.
310,
661.
230
255
430
655
530
405
0
0
0
0
0
0
0
0
0
0
,0
.0
.0
.0
.0
.0
.0
.0
.0
010.
067.
027.
022.
08.
015.
06.8.
15.17.
013.
060.
010.
012,
025
022
4
020
04
086
020
0
0
0
0
0
0
00
00
0
.0
.0
.0
.0
.0
.0
.0
.0
.0
.0
110SDMNBEDROCK
110SDMNBEDROCK
110SDMNBEDROCK
110SDMNBEDROCK
112TILLBEDROCK
110SDMNBEDROCK
110SDMN110SDMN110SDMN
112TILLBEDROCK
110SDMNBEDROCK
110SDMNBEDROCK
112TILLBEDROCK
112TILLBEDROCK
110SDMNBEDROCK
112TILLBEDROCK
BEDROCK
110SDMNBEDROCK
110SDMNBEDROCK
112TILLBEDROCK
112TILLBEDROCK
SDGLROCK
SANDROCK
SDGLROCK
SANDROCK
TILLROCK
SDCLROCK
SDGLCLAYSDGL
TILLROCK
SDCLROCK
SGVCROCK
TILL Sand, gravel, hardpanROCK
TILLROCK
SDGLROCK
TILLROCK
ROCK
CLAYROCK
CLAYROCK
TILL Sand, hardpanROCK
TILLROCK
140 Geohydrology and Water Quality of Stratified-Drift Aquifers in the Winnipesaukee River Basin, Central New Hampshire

Table B-1. Stratigraphic logs of selected wells and borings in the Winnipesaukee River Basin, central New Hampshire Continued
Localsite
number
Depthdrilled(feet)
Depthof
well(feet)
Depthto
refusal(feet)
Depthtotop
(feet)Aquifer
code
Lithologic descriptionof
material
CARROLL COUNTY
Moultonborough-Confcinuvd
MWW 339 405.0 0 112TILL TILL Clay, hardpan 60.0 BEDROCK ROCK
MWW 340 355.0 0 110SDMN SDGL 38.0 BEDROCK ROCK
MWW 343 805.0 016.0
110SDMN SAND BEDROCK ROCK
MWW 355 750.0 0 112TILL TILL 20.0 BEDROCK ROCK
Sandwich
SEW 10
SEW 15
SEW 21
SEW 31
SEW 49
SEW 50
SEW 53
475.0
300.0
225.0
18.0
242.0
230.0
363.0
011.0
025.0
02.05.0
110SDMN SDGL BEDROCK ROCK
31.0 BEDROCK ROCK
112TILL TILL BEDROCK ROCK
0 110SDMN SDGL3.0 112TILL TILL Gravel, hardpan
0 112TILL TILL8.0 BEDROCK ROCK
0 112TILL TILL60.0 BEDROCK ROCK
110SDMN SDGL112TILL TILLBEDROCK ROCK
SEW 60
SEW 61
SEW 105
SEW 108
SEW 150
SEW 151
593.0
333.0
320.0
977.0
100.0
205.0
0 112TILL TILL 21.0 BEDROCK ROCK
0 112TILL TILL 20.0 BEDROCK ROCK
023.0
015.0
112TILL TILL BEDROCK ROCK
112TILL TILL BEDROCK ROCK
0 110SDMN SAND5.0 112TILL TILL
23.0 BEDROCK ROCK
0 110SDMN CLAY130.0 BEDROCK ROCK
Appendix B 141

Table B-1. Stratigraphic logs of selected wells and borings in the Winnipesaukee River Basin, central New Hampshire Continued
Local Depth site drilled
number (feet)
Depth Depth Depth of to to
well refusal top (feet) (feet) (feet)
Aquifer code
Lithologlc description of
material
CARROLL COUNTY
Sandwich-Continued
TZA 1 50.0
TZA 2 50.0
TZA 3 40.0
TZA 4 40.0
TZA 5 40.0
TZA 6 50.0
TZA 7 28.5
TZA 8 31.0
TZA 9 74.0
TZA 10 67.0
TZA 12 42 . 0
o20.25.33.40.50.
09.
16.37.50.
012.40.
025.34.40.
06.
31.40.
041.50.
28.5 025,28,
31.0 02531
74.0 015556074
0175767
42.0 01
1834
00000
0000
00
000
,0,00
,0,0
.0
.5
.0
.0
.0
.0
.0
.0
.0
.0
.0
.0
.0
.5
110SDMN110SDMN110SDMN110SDMN110SDMN110SDMN
110SDMN110SDMN110SDMN110SDMN110SDMN
110SDMN110SDMN110SDMN
110SDMN110SDMN112TILL112TILL
110SDMN110SDMN110SDMN110SDMN
110SDMN110SDMN110SDMN
112SRFD112TILL112TILL
112SRFD112TILLBEDROCK
112SRFD112SRFD112SRFD112TILL112TILL
110SDMN110SDMN110SDMN112TILL
111SOIL110SDMN110SDMN110SDMN
SANDSANDSANDSTCLSANDSAND
SANDSDSTSANDSANDSAND
SANDSANDSAND
SANDSANDTILLTILL
GRVLSANDGRVLGRVL
SANDSDSTSDST
SANDTILLTILL
SANDTILLROCK
SANDSANDSANDTILLTILL
SANDSDSTSANDTILL
SOILSANDSDCLSAND
Sand, fine to mediumSand, fine, siltySand, fineSilt and claySand, fineEnd of hole
Sand, coarseSand, fine, and siltSand, fineSand, coarseEnd of hole
Sand, siltySand, fineEnd of hole
Sand, fineSand, gravelyTill, sandyEnd of hole
Gravel , sandySand, fineGravel , sandyEnd of hole
Sand, fineSand and silt, fineEnd of hole
Sand, medium to fineTillRefusal, close to till
Sand, fineTillRefusal; bedrock
Sand, medium, tanSand, very fine; siltSand, coarseTillRefusal in till at 74 feet
Sand, coarse to medium, tanSand, very fine, gray; and siltSand, coarse, gray; with pebbles and cobblesEnd of hole, till
TopsoilSand, fine to coarse, brown; gravel, fineSand, silty, brown; and clay; some gravelSand, fine to coarse, brown; gravel; trace of
42.0 110SDMNsilt
SAND End of hole, refusal
142 Geohydrology and Water Quality of Stratified-Drift Aquifers in the Winnipesaukee River Basin, Central New Hampshire

Table B-1. Stratigraphic logs of selected wells and borings in the Winnipesaukee River Basin, central New Hampshire Continued
Local Depthsite drilled
number (feet)
Depth Depth Depthof to to
well refusal top(feet) (feet) (feet)
Lithologic descriptionAquifer ofcode material
CARROLL COUNTY
TZA 13 23.0
TZA 14 54.0
TZA 15 39.0
TZA 16 89.0
TZA 17 37.0
TZA 18 19.0
TZW 1 101.0
23.0 016.023.0
54.0 01.0
11.023.035.0
50.054.0
39.0 017.0
19.029.039.0
017.029.0
39.0
49.059.0
69.089.0
37.0 020.037.0
19.0 016.019.0
100.0 -- 0
8.0
20.0
40.070.0
101.0
Sandwich-Continued
110SDMN SDGL Sand, fine to coarse, brown; gravel, fine110SDMN SAND Sand, brown; and clay, gray; some gravel110SDMN SAND End of hole, refusal
Tuftonboro
111SOIL SOIL Topsoil110SDMN SAND Sand, fine to medium, red-brown; some coarse
sand; some gravel110SDMN SAND Sand, fine, gray; some coarse sand110SDMN SDCL Sand, silty, brown; and clay110SDMN SAND Sand, fine, brown; some medium to coarse sand;
silt110SDMN SAND Sand, fine to coarse; gravel; silt110SDMN SAND End of hole, refusal
110SDMN SAND Sand, fine, light tan110SDMN SAND Sand, fine; with 3-inch coarse layer and 5-inch
medium layer112TILL TILL Till, clay/silt, blue-gray to tan112TILL TILL Till coarse, sandy, with pebbles112TILL TILL Refusal; till
110SDMN SAND Sand, medium to coarse, light brown110SDMN SAND Sand, fine to coarse, gray-tan110SDMN SDST Sand, fine; some 0.25-inch silt layers
throughout110SDMN SAND Sand, fine to med; some 0.125-inch lenses
biotite and very fine sand110SDMN SAND Sand, very fine to fine, light gray-tan, compact110SDMN SDST Sand, very fine to med; some 0.25-inch silt
layers110SDMN SAND Sand, medium110SDMN SAND End of hole, drill rig broken
110SDMN SAND Sand, medium, finer with depth112TILL TILL Till, very sandyBEDROCK ROCK Bedrock
112SRFD SAND Sand, medium to fine, some silt112TILL TILL Till, refusal at 19 feetBEDROCK ROCK
110SDMN SDGL Sand, brown, and gravel, fine to medium, traceof cobbles
110SDMN SAND Sand, light brown-white, medium coarse, traceof fine gravel
110SDMN SAND Sand, light brown-white, fine to medium, traceof fine to medium gravel
110SDMN SAND Sand, light brown-white, fine to medium110SDMN SAND Sand, light brown-white, fine to medium, trace
of fine gravel110SDMN SAND End of hole
TZW 2 35.0 23.0 35.0 110SDMN SAND Sand, coarse to very coarse, fine sand layer at 30 feet
Appendix B 143
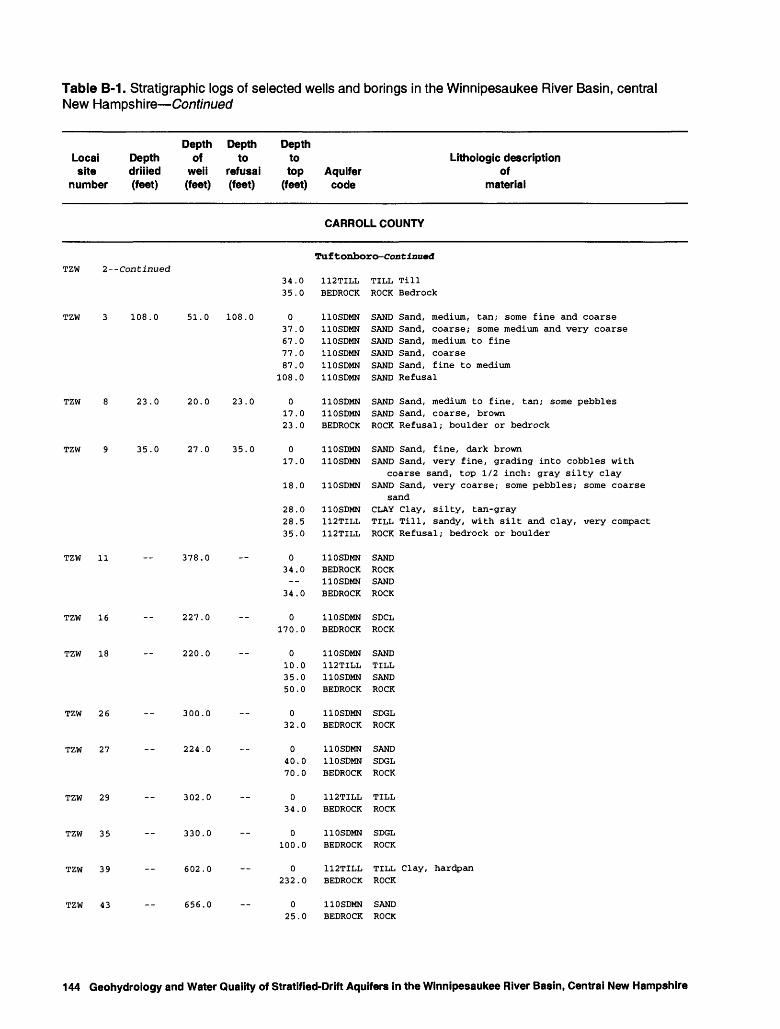
Table B-1. Stratigraphic logs of selected wells and borings in the Winnipesaukee River Basin, central New Hampshire Continued
Depth Depth DepthLocal Depth of to tosite drilled well refusal top Aquifer
number (feet) (feet) (feet) (feet) code
Lithologic descriptionof
material
CARROLL COUNTY
TZW 2--Continued
TZW 3 108.0 51.0 108.0
Tuftonboro-Continuad
34.0 112TILL TILL Till35.0 BEDROCK ROCK Bedrock
0 110SDMN SAND Sand, medium, tan; some fine and coarse37.0 110SDMN SAND Sand, coarse; some medium and very coarse67.0 110SDMN SAND Sand, medium to fine77.0 110SDMN SAND Sand, coarse87.0 110SDMN SAND Sand, fine to medium
108.0 110SDMN SAND Refusal
TZW 8 23.0 20.0 23.0
TZW 9 35.0 27.0 35.0
017.023.0
017.0
110SDMN SAND Sand, medium to fine, tan; some pebbles110SDMN SAND Sand, coarse, brownBEDROCK ROCK Refusal; boulder or bedrock
110SDMN SAND Sand, fine, dark brown110SDMN SAND Sand, very fine, grading into cobbles with
coarse sand, top 1/2 inch: gray silty clay 18.0 110SDMN SAND Sand, very coarse; some pebbles; some coarse
sand28.0 110SDMN CLAY Clay, silty, tan-gray28.5 112TILL TILL Till, sandy, with silt and clay, very compact 35.0 112TILL ROCK Refusal; bedrock or boulder
TZW 11 378.0 034.0
34.0
110SDMN SANDBEDROCK ROCK110SDMN SANDBEDROCK ROCK
TZW 16 227.0 0170.0
110SDMN SDCL BEDROCK ROCK
TZW 18 220.0 010.035.050.0
110SDMN SAND112TILL TILL110SDMN SANDBEDROCK ROCK
TZW 26 300.0 032.0
110SDMN SDGL BEDROCK ROCK
TZW 27 224.0 040.070.0
110SDMN SAND110SDMN SDGLBEDROCK ROCK
TZW 29 302.0 034.0
112TILL TILL BEDROCK ROCK
TZW 35
TZW 39
330.0
602.0
0 110SDMN SDGL100.0 BEDROCK ROCK
0 112TILL TILL Clay, hardpan232.0 BEDROCK ROCK
TZW 43 656.0 025.0
110SDMN SAND BEDROCK ROCK
144 Geohydrology and Water Quality of Stratified-Drift Aquifers in the Winnipesaukee River Basin, Central New Hampshire

Table B-1 . Stratigraphic logs of selected wells and borings in the Winnipesaukee River Basin, central New Hampshire Continued
Local site
number
Depth Depth of drilled well (feet) (feet)
Depth Depth to to
refusal top (feet) (feet)
Aquifer code
Lithologic description of
material
CARROLL COUNTY
Tuftonboro-Continued
TZW
TZW
TZW
TZW
TZW
TZW
TZW
TZW
TZW
TZW
TZW
TZW
TZW
TZW
TZW
TZW
TZW
TZW
44
47
48
63
71
88
95
99
102
104
107
108
109
111
114
116
128
130
517.
282.
302.
561.
482.
305.
202.
552.
242.
162.
206.
650.
600.
39,
293
482
302
423
0
0
0
0
.0
,0
.0
.0
.0
.0
.0
.0
.0
.0
.0
.0
.0
.0
05.
016.
085.
015.
065.
018.
060.
0180.
020.
077.
018.
020.
020.
012.
060.
08,
035,63,
050
0
0
0
0
0
0
0
0
0
0
0
,0
.0
.0
.0
.0
.0
.0
.0
112TILL
BEDROCK
112TILL
BEDROCK
110SDMN
BEDROCK
110SDMN
BEDROCK
112TILL
BEDROCK
110SDMN
BEDROCK
110SDMN
BEDROCK
110SDMN
BEDROCK
112TILL
BEDROCK
110SDMN
BEDROCK
112TILL
BEDROCK
110SDMN
BEDROCK
110SDMN
BEDROCK
110SDMN
110SDMN
112TILL
BEDROCK
110SDMN
BEDROCK
112TILL
110SDMN
BEDROCK
112TILL
BEDROCK
TILL
ROCK
TILL
ROCK
SDCL
ROCK
SAND
ROCK
TILL
ROCK
SDGL
ROCK
SDCL
ROCK
CLAY
ROCK
TILL
ROCK
CLAY
ROCK
TILL
ROCK
SDGL
ROCK
SAND
ROCK
SDGL
SAND
TILL Sand, hardpanROCK
CLAY
ROCK
TILL Clay, hardpanCLAY
ROCK
TILL
ROCK
Appendix B 145

Table B-1. Stratigraphic logs of selected wells and borings in the Winnipesaukee River Basin, central New Hampshire Continued
Local site
number
Depth Depth Depth Depth of to to drilled well refusal top (feet) (feet) (feet) (feet)
Lithologic description Aquifer of code material
CARROLL COUNTY
TZW 132
TZW 133
TZW 137
TZW 139
TZW 142
TZW 144
TZW 145
TZW 148
TZW 158
TZW 163
TZW 167
TZW 168
WRA 1
WRA 3
WRW 1
502.0 040.0
142.0 -- 0113.0
550.0 -- 0130.0
1230.0 -- 025.026.0
255.0 063.0
450.0 0100.0
205.0 -- 0128.0
525.0 -- 40.0
365.0 -- 075.0
325.0 -- 065.0
46.0 20.0 46.0 015.0
28.0
45.0
10.0 10.0 -- 0
41.0 -- 41.0 015.020.025.030.035.041.0
24.0 -- 015.0
27.5 20.0 27.5 020.026.027.0
Tuftonboro-coatljiucd
110SDMN CLAYBEDROCK ROCK
110SDMN SDGLBEDROCK ROCK
110SDMN OTHRBEDROCK ROCK
110SDMN SAND110SDMN CLAYBEDROCK ROCK
112TILL TILL Sand, clay, hardpanBEDROCK ROCK
110SDMN SANDBEDROCK ROCK
112TILL TILL Gravel, hardpanBEDROCK ROCK
BEDROCK ROCK
110SDMN SDGLBEDROCK ROCK
110SDMN SANDBEDROCK ROCK
112SRFD SAND Sand, fine to medium112SRFD SDGL Sand, very coarse to gravel, fine; moderately
sorted112SRFD SAND Sand, very fine with silt; some thin coarse
layers112TILL TILL Till, End of hole at 46 feet
112SRFD SAND Sand, coarse, clean
Wolfeboro
110SDMN SAND Sand, fine to medium110SDMN SAND Sand, coarse110SDMN SAND Sand, very fine110SDMN SAND Sand, medium110SDMN SAND Sand, very fine112TILL TILL Till, and rotten rockBEDROCK ROCK Refusal; till or rotten rock
110SDMN SAND Sand, fine to medium112TILL TILL Till, End of hole at 24 feet
110SDMN SAND Sand, medium to coarse110SDMN SAND Sand, fine to very fine112TILL TILL Till and rotten rock
BEDROCK ROCK Bedrock
146 Geohydrology and Water Quality of Stratified-Drift Aquifers in the Winnipesaukee River Basin, Central New Hampshire

Table B-1. Stratigraphic logs of selected wells and borings in the Winnipesaukee River Basin, central New Hampshire Continued
Local site
number
Depth Depth Depth of to drilled well refusal (feet) (feet) (feet)
Depth to top
(feet)Aquifer code
Lithologic description of
material
CARROLL COUNTY
Wol f«boro-Coatinu»d
WRW
WRW
WRW
WRW
WRW
WRW
WRW
WRW
WRW
WRW
WRW
WRW
WRW
WRW
WRW
WRW
WRW
WRW
3
4
6
11
12
19
20
29
32
33
34
37
43
44
45
59
71
72
115.
125.
503.
421.
500.
363.
203.
547.
283.
260.
302.
402.
482.
162
363
1000
400
500
0
0
0
0
0
0
0
0
,0
.0
.0
.0
.0
.0
.0
.0
.0
.0
015.
05.
035.
020.
080.
090.
031.
020.
020.
012,
060.
095,
015,
037
075
10
06
90
06
95
0
0
0
0
,0
,0
,0
,0
.0
.0
.0
.0
.0
.0
.0
.0
.0
.0
.0
.0
112TILLBEDROCK
112TILLBEDROCK
110SDMNBEDROCK
110SDMNBEDROCK
110SDMNBEDROCK
110SDMNBEDROCK
110SDMNBEDROCK
112TILLBEDROCK
112TILLBEDROCK
110SDMNBEDROCK
110SDMNBEDROCK
110SDMNBEDROCK
112TILLBEDROCK
110SDMNBEDROCK
112TILLBEDROCK
BEDROCK
110SDMN112TILLBEDROCK
110SDMN112TILLBEDROCK
TILLROCK
TILLROCK
SGVCROCK
SDCLROCK
SANDROCK
SANDROCK
SDCLROCK
TILLROCK
TILLROCK
SDGLROCK
SDCLROCK
SDGLROCK
TILL Sand, gravel, hardpanROCK
SDGLROCK
TILLROCK
ROCK
SANDTILL Clay, hardpanROCK
SANDTILL Clay, hardpanROCK
Appendix B 147

Table B-1. Stratigraphic logs of selected wells and borings in the Winnipesaukee River Basin, central New Hampshire Continued
Local site
number
Depth Depth Depth Depth of to to drilled well refusal top (feet) (feet) (feet) (feet)
Aquifer code
Lithologic description of
material
CARROLL COUNTY
Wolfeboro-Coatlaued
WRW
WRW
WRW
WRW
WRW
WRW
WRW
WRW
WRW
WRW
WRW
WRW
WRW
WRW
WRW
WRW
WRW
73
74
75
76
78
80
81
82
87
89
92
94
102
104
108
110
111
425.0 -- 06.
90.
500.0 -- 06.
85.
400.0 -- 06.
90.
600.0 -- 06.
92.
423.0 -- 020.
610.0 -- 08.
300.0 -- 015.
350.0 -- 024.
1500.0 -- 023.
343.0 015.
500.0 -- 025,
151.0 013
625.0 070
413.0 -- 042
645.0 -- 040
740.0 -- 068
300.0 -- 026
00
0
0
00
00
0
0
0
,0
,0
.0
.0
.0
.0
.0
.0
.0
.0
110SDMN112TILL
BEDROCK
110SDMN
112TILL
BEDROCK
110SDMN112TILLBEDROCK
110SDMN112TILLBEDROCK
112TILLBEDROCK
110SDMN
BEDROCK
110SDMNBEDROCK
112TILLBEDROCK
110SDMNBEDROCK
110SDMN
BEDROCK
110SDMN
BEDROCK
112TILL
BEDROCK
112TILLBEDROCK
110SDMNBEDROCK
110SDMNBEDROCK
110SDMNBEDROCK
110SDMNBEDROCK
SANDTILL Gravel, clay, hardpanROCK
SAND
TILL Clay, hardpanROCK
SANDTILL Clay, hardpanROCK
SANDTILL Clay, hardpanROCK
TILLROCK
SAND
ROCK
SANDROCK
TILL Sand, hardpanROCK
SDGLROCK
SANDROCK
SANDROCK
TILLROCK
TILL Clay, hardpanROCK
SDCLROCK
CLAYROCK
SDCLROCK
SGVCROCK
148 Geohydrology and Water Quality of Stratified-Drift Aquifers in the Winnipesaukee River Basin, Central New Hampshire

Table B-1. Stratigraphic logs of selected wells and borings in the Winnipesaukee River Basin, central New Hampshire Continued
Local site
number
Depth Depth Depth Depth of to to drilled well refusal top (feet) (feet) (feet) (feet)
Aquifer code
Lithologic description of
material
CARROLL COUNTY
Wolfeboro-Continued
WRW
WRW
WRW
WRW
WRW
WRW
WRW
WRW
WRW
WRW
WRW
WRW
WRW
WRW
115
116
123
125
129
130
132
138
143
145
146
149
152
154
462.0 -- 025.
650.0 -- 020.
505.0 -- 012.70.
160.0 -- 048.
502.0 -- 060.
242.0 -- 032.
324.0 -- 018.
345.0 040.
522.0 012,
886.0 -- 061,
142.0 0
35.
400.0 -- 013.
138.0 013.
1000.0 -- 0 85,
.0
.0
.0
.0
,0
.0
.0
.0
.0
.0
.0
.0
.0
.0
.0
110SDMNBEDROCK
110SDMN
BEDROCK
110SDMN110SDMNBEDROCK
110SDMNBEDROCK
110SDMNBEDROCK
110SDMNBEDROCK
110SDMNBEDROCK
110SDMNBEDROCK
112TILLBEDROCK
110SDMNBEDROCK
110SDMNBEDROCK
112TILLBEDROCK
112TILLBEDROCK
112TILL BEDROCK
CLAY
ROCK
SDGLROCK
SANDCLAYROCK
SANDROCK
SANDROCK
SDGLROCK
SDGLROCK
CLAYROCK
TILLROCK
CLAYROCK
CLAY
ROCK
TILLROCK
TILLROCK
TILL Gravel, clay, harpan ROCK
MERRIMACK COUNTY
Franklin
FKW
FKW
7
78
131.0 -- 75
38.0 -- 38.0 025
38
.0
.0
.0
.0
BEDROCK
110SDMN110SDMN 112TILLBEDROCK
SDMN MuckSDST Sand, fine, silty TILL TillROCK Bedrock
Appendix B 149

Table B-1. Stratigraphic logs of selected wells and borings in the Winnipesaukee River Basin, central New Hampshire Continued
Localsite
number
Depthdrilled(feet)
Depthof
well(feet)
Depthto
refusal(feet)
Depthtotop
(feet)Aquifer
code
Lithologic descriptionof
material
FKW 86 13
MERRIMACK COUNTY
Franfcl in-Continued
FKW 79 15.0 10.9 -- 0
5.0
10.0
FKW 80 17.0 13.9 -- 0
4.0
10.0
FKW 82 17 13.3 -- 0
5.0
10.0
15.0
FKW 83 17 13.9 05.0
10.0
15.0
FKW 84 13.5 13.3 -- 00
112SRFD
112SRFD
112SRFD
112SRFD
112SRFD
112SRFD
112SRFD
112SRFD
112SRFD
112SRFD
112SRFD112SRFD112SRFD
112SRFD
111FILL112SRFD
SAND Sand, fine to coarse, brown, and gravel; traceof silt
SAND Sand, fine to coarse, brown; some gravel; traceof silt
SAND Sand, fine to medium; little silt; trace ofgravel; End. of hole at 15 feet
SAND Sand, fine to coarse, brown; little gravel;trace of silt
SAND Sand, fine, brown; trace of gravel; trace ofsilt
SAND Sand, fine, brown
Sand, more coarse than fine, brown , little gravel;trace silt
Sand, more coarse than fine, brown; some gravel, morefine than medium; trace silt
Sand, more coarse than medium, brown; some gravel;trace silt
Sand, fine to medium, brown; little silt; trace gravelEnd of hole at 17 feet
Sand, fine to medium, brown; little gravel; trace siltSand, more fine than coarse, brown; some gravel; trace siltSand, more fine than coarse, dark brown; little gravel;
little siltSand, fine, brown,- some silt; trace gravel; End of hole
at 17 feet
Sand fillSand, fine, brown; little silt; End of hole at 13.5 feet
FKW 85 13.5 13.3
11
FKW 87 12.8 12,
FKW 88 13.4 13.4
FKW 89 8.50 8.34
0 111FILL Fill made up of sand, fine to course, brown; littlesilt; gravel
4.5 112SRFD Sand, fine, brown; trace silt; some gravel at 7 feet 9.5 112SRFD Sand, fine, brown; little silt; End of hole at 13.5 feet
0 112SRFD Sand, fine to coarse, brown; and gravel; no split spoon samples taken; End of hole at 13 feet
0 111FILL Sand, fine to coarse, brown; and gravel; trace silt 4.5 112SRFD Sand, fine to coarse, brown; and gravel; little cobbles;
trace silt9.5 112SRFD Sand, fine, brown; trace cobbles; trace silt
12.8 BEDROCK Refusal on bedrock
0 112SRFD Sand, fine to coarse, black; little gravel; trace silt4.5 112SRFD Sand, fine to coarse, brown; little gravel; trace silt9.5 112SRFD Sand, fine, brown; little silt; End of hole at 13.4 feet
0 112SRFD Sand, fine to medium, brown; and gravel; trace silt 4.5 112SRFD SAND, fine to medium, brown; trace gravel; trace silt;
End of hole at 8.5 feet
150 Geohydrology and Water Quality of Stratified-Drift Aquifers in the Winnipesaukee River Basin, Central New Hampshire

Table B-1. Stratigraphic logs of selected wells and borings in the Winnipesaukee River Basin, central New Hampshire Continued
Local Depthsite drilled
number (feet)
Depth Depth Depthof to to
well refusal top(feet) (feet) (feet)
Lithologic descriptionAquifer ofcode material
MERRIMACK COUNTY
FKW 90 15.5
FKW 91 16.5
FKW 97 16.5
FKW 98 18.5
FKW 99 18
FKW 100 17
FKW 101 17
FKW 102 18.8
FKW 103 16
NRB 1 50
NRB 26 36
14.1 -- 03.59.5
14.5
14.5 -- 0
9.516
14.6 -- 04.59.5
18.5 -- 09.5
14.5
18 -- 0
17 -- 09.5
14.5
15.8 -- 09.5
14.5
16.7 0__
9.514.515.5
15.1
04.0
28.041.050.0
09.0
36.0
Franklin-Continued
111FILL Sand, fine to coarse, brown; trace gravel; trace silt112SRFD Sand, fine to coarse, brown; and gravel; trace silt112SRFD Sand, more fine than medium, brown; little silt; trace
gravel112SRFD Sand, fine to coarse, brown; little silty clay; trace
gravel; refusal at 15.5 feet
111FILL Fill made up of sand, fine to coarse, brown; gravel,fine to coarse; little pebbles to cobbles; trace
112SRFD Sand, fine;, gray; trace gravel; trace siltSilt
112SRFD Sand, more fine than medium, brown; little gravel; tracesilt; End of hole at 16.5 feet
111FILL Sand fill112SRFD Sand, fine, brown; trace gravel; trace silt112TILL Sandy till, compactness increases with depth; End of
hole at 16.5 feet111FILL Sandy fill112SRFD Sand, fine to coarse, gray; some gravel; little silt112SRFD Sand, fine, orange brown; trace silt; End of hole at
18.5 feet
110SDMN No samples taken; End of hole at 18 feet
111FILL Sandy fill112SRFD Sand, fine, gray; trace silt112SRFD Sand, fine to coarse, orange; and gravel; trace silt;
End of hole at 17 feet
111FILL Sandy fill; including ash slag112SRFD Sand, fine to coarse, brown; some gravel; trace silt112TILL Sand, fine to gravel, trace silt; End of hole at 17 feet
111FILL Sandy fill110SDMN No sample taken between 2 feet and 9 . 5 feet112SRFD Sand, fine to coarse, brown; some gravel; trace silt112SRFD Sand, medium, brown; little gravel; trace silt112SRFD Sand, fine, brown; End of hole at 18.8 feet
Northfield
110SDMN Sand and silt110SDMN Sand, coarse110SDMN Sand, fine and silt110SDMN Sand, fine110SDMN End of hole
110SDMN Sand, fine to coarse112TILL Till, silty112TILL End of hole
NRB 27 49 0 110SDMN Sand, gravelly11.0 110SDMN Sand, silty20.0 110SDMN Silt and clay
Appendix B 151

Table B-1. Stratigraphic logs of selected wells and borings in the Winnipesaukee River Basin, central New Hampshire Continued
Localsite
number
Depthdrilled(feet)
Depthof
well(feet)
Depthto
refusal(feet)
Depthtotop
(feet)Aquifer
code
Lithologic descriptionof
material
MERRIMACK COUNTY
NRB 27 Continued37.049.0
Northfield
110SDMN 110SDMN
Sand and gravel End of hole
NRB 28 62 0 110SDMN Sand, fine to coarse, gravel6.0 110SDMN Silt, sandy
14.0 110SDMN Silt, clayey32.0 110SDMN Silt, sandy35.0 110SDMN Sand, silty, gravelly62.0 110SDMN End of hole
NRB 29 12 0 110SDMN8.0 110SDMN12.0 110SDMN
Sand, fine and silt Silt and clay End of hole
NRB 30 38 38 0 110SDMN4.0 110SDMN
14.0 110SDMN32.0 112TILL38.0 BEDROCK
Sand, fineSand and siltSand, medium to coarseTill, sandyBedrock
NRB 31 37 6.0 112TILL Hardpan, silty gravelly sand32.0 112TILL Hardpan, very silty gravelly sand37.0 112TILL End of hole
NRB 32 29 8.0 112TILL Hardpan21.0 112TILL Hardpan29.0 112TILL End of hole
NRW 51 44.8 44.8 112SRFD Sand, fine to medium, some gravel16.0 112SRFD Silt and clay44.8 112SRFD End of hole
NRW 52 39 39 0 112SRFD Sand, brown and silt22.0 112SRFD Sand, silt and some clay27.0 112SRFD Sand, silt, some clay, trace gravel39.0 112SRFD End of hole
NRW 53 75 75 110SDMN Sand, fine to medium
22.075.0
112SRFD 112SRFD
Silt, fine and clay End of hole
NRW 54 82 82 0 110SDMN Sand, fine to medium, some gravel21.0 112SRFD Sand, very fine and silt82.0 112SRFD End of hole
NRW 55 60 54
5.0 60.0
110SDMN Sand, light brown, fine to medium, some fine to mediumtravel, occasional cobbles
110SDMN Sand, light brown, fine, trace of silt 110SDMN End of hole
NRW 56 73.8 73.1 0 110SDMN No samples taken28.0 110SDMN Sand, light brown, fine, trace of silt 32.0 110SDMN Sand and silt, gray, fine 37.0 110SDMN Sand, light brown, fine, trace of silt 57.0 110SDMN Sand, light brown, fine, little silt, trace medium to
fine gravel
152 Geohydrology and Water Quality of Stratif ied-Drift Aquifers in the Winnipesaukee River Basin, Central New Hampshire

Table B-1. Stratigraphic logs of selected wells and borings in the Winnipesaukee River Basin, central New Hampshire Continued
Local Depthsite drilled
number (feet)
Depth Depthof to
well refusal(feet) (feet)
Depthtotop Aquifer
(feet) code
Lithologic descriptionof
material
MERRIMACK COUNTY
NRW 56 Continued
NRW 57 43
NRW 58 85
NRW 59 87
NRW 60 30
NRW 61 51
NRW 62
NRW 89
NRW 118
Northfield-Continuad
61.0 110SDMN Sand, light brown, fine to medium, some fine to mediumgravel
66.0 110SDMN Sand, gray, fine, some silt, some fine to medium gravel 73.8 110SDMN Refusal with roller bit, end of hole
43 0 110SDMN No samples taken
85 0 110SDMN No samples taken
80 87 0 112SRFD Sand, very fine30.0 112SRFD Sand, fine to medium50.0 112SRFD Sand, fine; with medium sand lenses75.0 112TILL Very fine sandy till87.0 -112TILL End of hole, till
30
40
280
20.0
51 0 110SDMN Sand, medium to fine; some very fine,withsilt
20.0 110SDMN Sand, fine, some medium37.0 110SDMN Sand, very fine to coarse with pebbles in the coarse sand 47.0 110SDMN Sand, coarse with till 51.0 BEDROCK Refusal, bedrock probably
90.0 BEDROCK
NRW 119 NRW 142
20.0225
110SDMN
NRW 146
NRW 171
405 -- 143.0 BEDROCK
0 112TILL25.0 110SDMN45.0 112TILL
NRW 172
NRW 174
NRW 197
NRW 198
50
28
400
185
44
26
60.0 BEDROCK
131.0 BEDROCK
80.0112TILL BEDROCK
0 112SRFD SDGL Sand, fine to coarse, some gravel, trace silt26.0 112SRFD SAND Sand, fine, trace silt38.0 112SRFD SAND Sand, fine to coarse, broken gravel, silt46.0 112TILL TILL gray, silty till50.0 112TILL TILL Till, End of hole at 50 feet
0 112SRFD SDGL Sand, fine to coarse, some gravel11.0 112SRFD SAND Sand, fine, brown19.0 112SRFD SAND Sand, fine to coarse, broken gravel, trace silt26.0 112SRFD SILT gray silt
Appendix B 153

Table B-1. Stratigraphic logs of selected wells and borings in the Winnipesaukee River Basin, central New Hampshire Continued
Local Depth site drilled
number (feet)
Depth Depth Depth of to to
well refusal top (feet) (feet) (feet)
Aquifer code
Lithologic description of
material
MERRIMACK COUNTY
Northfi«ld-Continu«d
NRW 199 70
NRW 200 76
NRW 201 77
NRW 202 77
NRW 203 67
NRW 204 69
NRW 205 69
67 -- 020.40.44.67.
76 -- 024.31.40.51.58.60.76.
69 -- 016.27.36.38.43.69.
68 020.46.75,
63 -- 030.38.44.54,
69 -- 02030505560
69 -- 03044
55606667
0000
00000.0,0
.0,0,0.0.0.0
.0
.0
.0
.0
.0
.0
.0
.0
.0
.0
.0
.0
.0
.0
.0
.0
.0
.0
112SRFD112SRFD112SRFD112SRFD112SRFD
112SRFD112SRFD112SRFD112SRFD112SRFD112SRFD112SRFD112SRFD
112SRFD112SRFD112SRFD112SRFD112SRFD112SRFD112SRFD
112SRFD112SRFD112SRFD112SRFD
112SRFD112SRFD112SRFD112SRFD112SRFD
112SRFD112SRFD112SRFD112SRFD112SRFD112SRFD
112SRFD112SRFD112SRFD
112SRFD112SRFD112SRFD112SRFD
SANDSANDSANDSDGLSILT
SANDSANDSANDSANDSDGL--
SDGLSDGL
SANDSANDSDSTCLAYSANDSDGLSAND
SDGLSANDSDGLSAND
SDGLSANDSDGLSANDSDGL
SANDSDGLSANDSANDSANDSDGL
SANDSANDSDGL
SDGLSANDSANDSDGL
Sand,Sand,Sand,Sand,Silt
Sand,Sand,Sand,Sand,Sand,
Sand,Sand,
Sand,Sand,Sand,Clay,Sand,Sand,Sand,
Sand,Sand,Sand,Sand,
Sand,Sand,Sand,Sand,Sand,
Sand,Sand,Sand,Sand,Sand,Sand,
Sand,Sand,Sand,
SandSand,Sand,Sand,
medium to coarsefinefinefine
fine,finefinefinefine
tototo
mediummedium,coarse,
some coarsesome gravel
some medium, trace silttotototo
mediumcoarse;coarsecoarse;
some gravel
some gravel
medium to coarse; some broken gravelfine
finefinefine.grayfine,finefine
finefinef ine;fine;
finefinefinefinefine
finefinefinefinefinefine
finefine;
to
toto
coarse.
medium,medium,
some gravel; silt
some coarsetrace silt
silt
some mediumtoto
toto
coarse;coarse;
coarse;medium;
gravelsome gravel, silt
gravelsome coarse
some medium to coarse; broken gravelsome medium to coarse; gravel silt
tototototo
totototototo
to
coarse;medium.coarse;coarsecoarse,
medium
gravelsome coarsegravel
gravel, silt
indium; gravel, medium to coarsemedium,Coarsemediummedium ;
coarse
with mica
gravel , cobbles
trace silt and claygravel , cobbles
and gravel, finefinefinefine
tototo
coarsecoarse.coarse;
to coarse
with micagravel, cobbles
STRAFFORD COUNTY
MLW 11 100
Middleton
110SDMN --
9.0 BEDROCK BEDROCK
154 Geohydrology and Water Quality of Stratif ied-Drift Aquifers in the Winnipesaukee River Basin, Central New Hampshire

Table B-1. Stratigraphic logs of selected wells and borings in the Winnipesaukee River Basin, central New Hampshire Continued
Local Depthsite drilled
number (feet)
Depth Depth Depthof to to
well refusal top(feet) (feet) (feet)
Lithologic descriptionAquifer ofcode material
STRAFFORD COUNTY
NFA 1 20
NFA 2 16.5
NFB 3 15.9
NFB 26 17
NFB 27 13
NFW 1 158
NFW 2 14
NFW 3 6.5
NFW 4 17.1
NFW 5 11.4
NFW 6 12.2
NFW 7 30
NFW 8 7.7
NFW 16 11.9
NFW 19 23.5
NFW 21 15
NFW 27 22
NFW 28
NFW 29 13.9
NFW 30 13.2
NFW 53 68
20 0
16.5 07.0
15.0
15.9 08.0
14.9
07.0
15.017.0
13 07.013.0
158 -- 096.0
14
6.5
17.1
11.4 -- 1.0
12.2
30
7.7
11.9
23.5
15 -- 03.0
22
13.9
13.2
60 68 012.032.042.047.057.0
N«w Durham
112SRFD Sand, medium to coarse, refusal at 20 feet
111ALVM Muck112SRFD Sand, trace silt, some gravel112TILL Till
120SDMS --112ICCC Sand, Medium to coarse; Gravel112TILL Refusal at 15.9 feet
110SDMN Muck110SDMN Sand, medium to coarse112TILL Hardpan, sandy112TILL End of hole
110SDMN Sand, fine to medium110SDMN Sand and gravelBEDROCK Bedrock
112SRFD --BEDROCK Drilled into rock
1120TSH
11220CL --
1120TSH --
1120TSH --
1120TSH --
1120TSH --
1120TSH --
1120TSH --
1120TSH --
1120TSH --1120TSH
1120TSH
1120TSH --
1120TSH
112SRFD Sand, coarse to gravel, cobbles112SRFD Sand, coarse, little gravel112SRFD Sand, coarse112SRFD Sand, fine to medium, mostly medium112SRFD Sand, fine to fine gravel, mostly coarse112SRFD Sand, fine to coarse, refusal at 68.0 feet
Appendix B 155

Table B-1. Stratigraphic logs of selected wells and borings in the Winnipesaukee River Basin, central New Hampshire Continued
Localsite
number
Depthdrilled(feet)
Depthof
well(feet)
Depthto
refusal(feet)
Depthtotop
(feet)Aquifer
code
Lithologic descriptionof
material
STRAFFORD COUNTY
New Durham-Continued
NFW 54 81 23 81 0 112SRFD Sand, medium, some coarse Sand27.0 112SRFD Sand, medium33.0 112SRFD Sand, fine, some coarse Sand44.0 112SRFD Sand, very fine, some silt81.0 BEDROCK Schist and other rock, refusal at 81.0 feet
NFW 55 49 46 017.0
112SRFD Sand, very fine to medium, mostly medium 112MRIN Sand, very fine to fine, end of hole at 49 feet
NFW 56 66 23 0 112SRFD Sand, very fine to fine, mostly fine21.0 112SRFD Sand, very fine to medium, mostly fine36.0 112SRFD Sand, very fine to fine,mostly very fine58.0 112SRFD Sand, very fine, some silt, end of hole at 66.0 feet
NFW 59
NFW 61
50
10510.0
110SDMN BEDROCK
Sand and gravel Bedrock
NFW 62 35387.0
110SDMN Sand, gravel, and Clay BEDROCK Bedrock
NFW 63 26535.0
112TILL Till BEDROCK Bedrock
NFW 67 16273.0
110SDMN BEDROCK
Sand and gravel Bedrock
NFW 69 20042.0
110SDMN BEDROCK
Sand and gravel Bedrock
NFW 71 9912.0
112TILL Till BEDROCK Bedrock
NFW 72 15053.0
110SDMN Sand and gravel BEDROCK Bedrock
NFW 76 14015.0
110SDMN Sand and gravel BEDROCK Bedrock
NFW 77 26211.0
110SDMN Sand and gravel BEDROCK Bedrock
NFW 80 23022.0
110SDMN Sand BEDROCK Bedrock
NFW 81 18618.0
112TILL Till BEDROCK Bedrock
NFW 86
NFW 87
15.5
10.2
156 Geohydrology and Water Quality of Stratified-Drift Aquifers in the Winnipesaukee River Basin, Central New Hampshire

APPENDIX C. Geohydrologic sections interpretedfrom seismic-refraction data, central
New Hampshire

400
25 50 75VERTICAL EXAGGERATION: 1.3
DATUM IS SEA LEVEL
Alton line b
400
25 50 75
VERTICAL EXAGGERATION: 1.3DATUM IS SEA LEVEL
Alton line c
400
25 50 75VERTICAL EXAGGERATION: 1.3
DATUM IS SEA LEVEL
METERS
r-162
-152
-142
-132
-122
METERS
-162
-152
-142
-132
-122
METERS
-162
-152
-142
-132
-122
Figure Cl . Geohydrologic sections interpreted from seismic-refraction data for
Alton lines a-a', b-b', and c-c' (locations shown on plate 2).
Appendix C 159

Alton line d
450
25 50 75
VERTICAL EXAGGERATION: 2.1DATUM B SEA LEVEL
Alton line e
METERS
450
25 50 75
VERTICAL EXAGGERATION: 1.3DATUM IS SEA LEVEL
METERS
600
25 50 75
VERTICAL EXAGGERATION: 1.3DATUM IS SEA LEVEL
METERS
METERS r-167
-157
-147
L 137
METERS
-177
-167
-157
-147
-137
METERS
r-223
-213
-203
-193
-183
Figure C2. Geohydrologic sections interpreted from seismic-refraction data for
Alton lines d-d', e-e', and f-f (locations shown on plate 2).
160 Geohydrology and Water Quality of Stratified-Drift Aquifers in the Winnepesaukee River Basins, Central New Hampshire

FEET 700-,680-
660640-
620-
600-
580-
560-
540-
520-
500-
Alton line g
Land surface
Water table-"""
100 200i I
25 50 75VERTICAL EXAGGERATION: 1.1
DATUM IS SEA LEVEL
300 FEET
METERS
r 50 75
VERTICAL EXAGGERATION: 1.2DATUM IS SEA LEVEL
FEET
METERS
25 50 75
VERTICAL EXAGGERATION: 1.3DATUM IS SEA LEVEL
METERS
METERSr-212
-202
-192
-182
-172
-162
-152
METERS
-162
-152
-142
-132
-122
METERS
-177
-167
-157
-147
-137
Figure C3. Geohydrologic sections interpreted from seismic-refraction data for
Alton lines g-g', h-IY, and i-i' (locations shown on plate 2).
Appendix C 161

400
25 50 75
VERTICAL EXAGGERATION: 1.3DATUM IS SEA LEVEL
METERS
25 50 75
VERTICAL EXAGGERATION: 1.1DATUM IS SEA LEVEL
METERS
250
25 50 75
VERTICAL EXAGGERATION: 0.7DATUM IS SEA LEVEL
METERS
r162
-152
-142
-132
-122
METERS r 151
-141
-131
-121
-111
-101
-91
METERS-166
-156
-146
-136
-126
-116
-106
-96
-86
-76
Figure C4. Geohydrologic sections interpreted from seismic-refraction data for
Alton lines j-j', (location shown on plate 2) and Belmont lines a-a' and b-b'
(locations shown on plate 1).
162 Geohydrology and Water Quality of Stratified-Drift Aquifers in the Winnepesaukee River Basins, Central New Hampshire

Belmont line c
25 50 75
VERTICAL EXAGGERATION: 1.1DATUM IS SEA LEVEL
Belmont line d
METERS
25 50 75
VERTICAL EXAGGERATION: 1.1DATUM IS SEA LEVEL
Belmont line e
METERS
25 50 75 METERS
VERTICAL EXAGGERATION: 1.1DATUM IS SEA LEVEL
METERS r166
-156
-146
-136
-126
-116
-106
METERS-182
-172
-162
-152
-142
-132
-122
METERS-212
-202
-192
-182
-172
-162
-152
Figure C5. Geohydrologic sections interpreted from seismic-refraction data for
Belmont lines c-c', d-d', and e-e' (locations shown on plate 1).
Appendix C 163
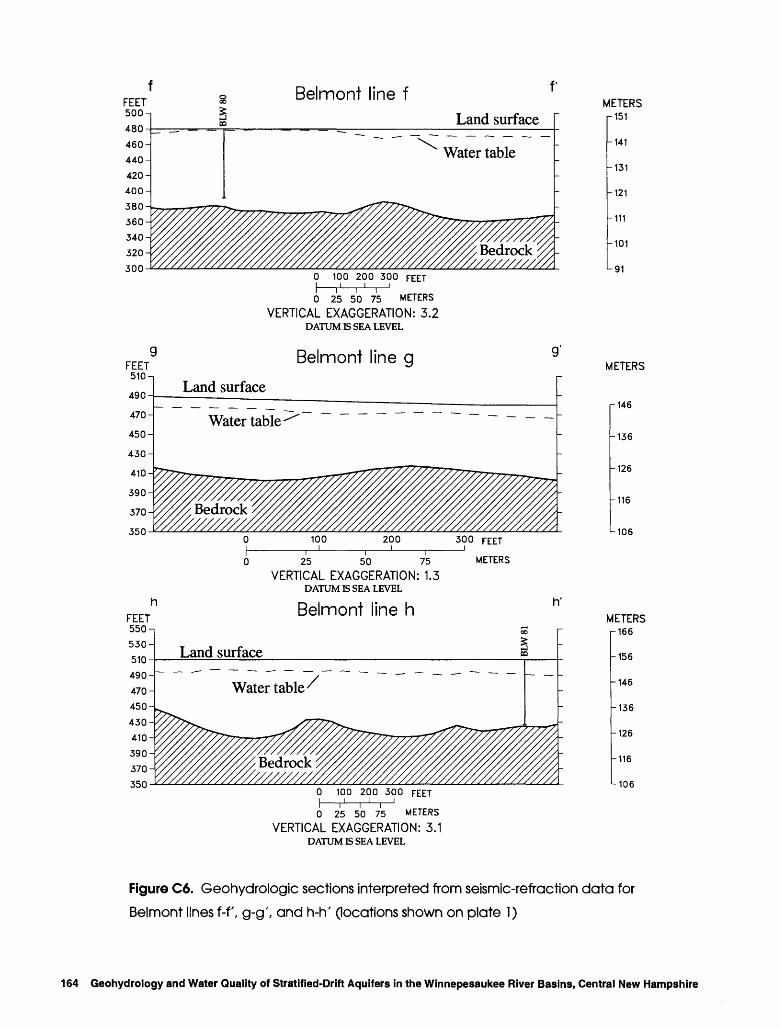
FEET 500-,
480460-440-420-400-380-
360-
340-
320-
300
Belmont line fLand surface
Water table
0 100 200 300 FEET
gFEET 510-,
0 25 50 75 METERS
VERTICAL EXAGGERATION: 3.2DATUM IS SEA LEVEL
Belmont line g
490-
470-
450-
430-
410-
390-
370-
350
Land surface
Water table
100 200 300 FEET
25 50 75
VERTICAL EXAGGERATION: 1.3DATUM IS SEA LEVEL
Belmont line h
METERS
0 25 50 75 METERS
VERTICAL EXAGGERATION: 3.1DATUM IS SEA LEVEL
METERSr151
-141
-131
-121
-111
-101
-91
METERS
-146
-136
-126
-116
-106
METERS-166
-156
-146
-136
-126
-116
-106
Figure C6. Geohydrologic sections interpreted from seismic-refraction data for
Belmont lines f-f, g-g', and h-h' (locations shown on plate 1)
164 Geohydrology and Water Quality of Stratified-Drift Aquifers in the Winnepesaukee River Basins, Central New Hampshire
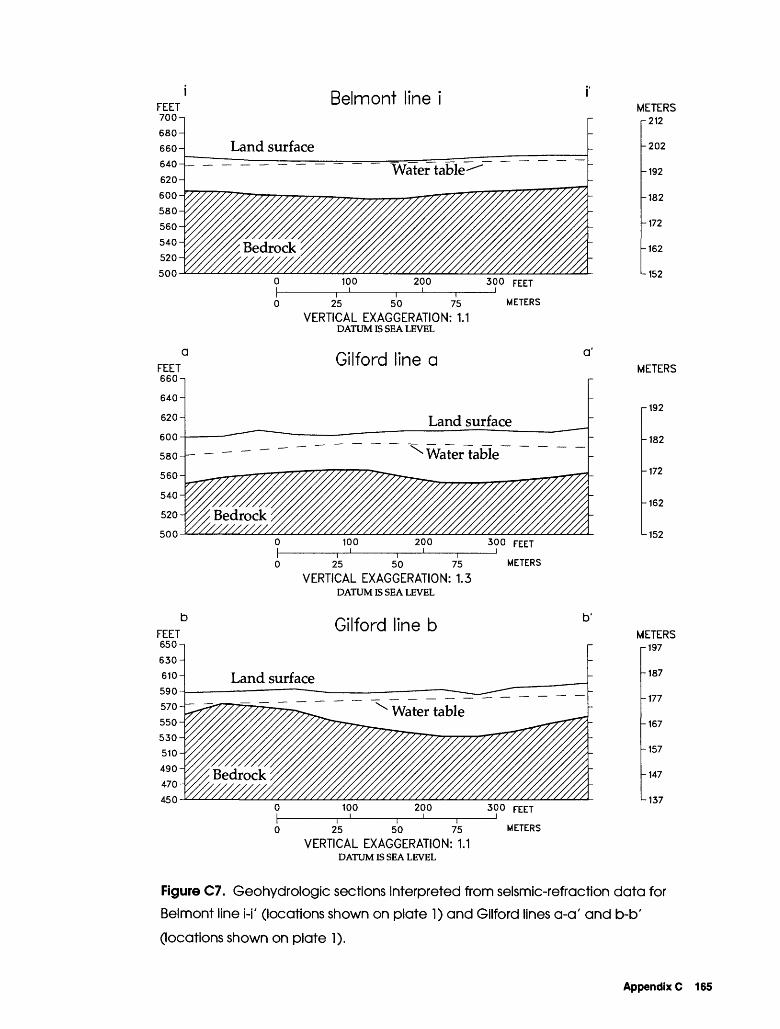
y///. Bedrock W//////////,
FEET 660-i
640-
620-
600
25 50 75
VERTICAL EXAGGERATION: 1.1DATUM IS SEA LEVEL
Gilford line a
METERS
580-
560-
540-
520-
500
Land surface
Water table
^Bedrock Y///////////,
100 200 300 FEET
25 50 75
VERTICAL EXAGGERATION: 1.3DATUM IS SEA LEVEL
METERS
Gilford line b
450
25 50 75VERTICAL EXAGGERATION: 1.1
DATUM IS SEA LEVEL
METERS
METERS r212
-202
-192
-182
-172
-162
-152
METERS
-192
-182
-172
-162
-152
METERS r!97
-187
-177
-167
-157
-147
-137
Figure C7. Geohydrologic sections interpreted from seismic-refraction data for
Belmont line i-i' (locations shown on plate 1) and Gilford lines a-a' and b-b'
(locations shown on plate 1).
Appendix C 165

Gilford line c
25 50 75
VERTICAL EXAGGERATION: 1.1DATUM IS SEA LEVEL
Gilford line d
Land surface
25 50 75
VERTICAL EXAGGERATION: 1.1DATUM IS SEA LEVEL
METERS
25 50 75VERTICAL EXAGGERATION: 1.3
DATUM IS SEA LEVEL
METERS
METERS r258
-248
-238
-228
-218
-208
-198
METERS-243
-233
-223
-213
-203
-193
-183
METERS
-238
-228
-218
-208
-198
Figure C8. Geohydrologic sections interpeted from seismic-refraction data for
Gilford lines c-c', d-d', and e-e' (locations shown on plate 1).
166 Geohydrology and Water Quality of Stratified-Drift Aquifers in the Winnepesaukee River Basins, Central New Hampshire

400
i ' r 25 50 75
VERTICAL EXAGGERATION: 1.1DATUM IS SEA LEVEL
Gilford line g
METERS
FEET BIO-
790-
770-
750-
730-
710-
690-
670-
650
0 25 50 75 METERS
VERTICAL EXAGGERATION: 2.6DATUM IS SEA LEVEL
Gilford line h
Land surface
Water
100 200 300 FEET
25 50 75
VERTICAL EXAGGERATION: 1.3DATUM IS SEA LEVEL
METERS
METERSr182
-172
-162
-152
-142
-132
-122
METERS
(-162
-152
-142
-132
-122
METERS
r-238
-228
-218
-208
-198
Figure C9. Geohydrologic sections interpreted from seismic-refraction data for
Gilford lines f-f (plate 3), g-g', h-h' (locations shown on plate 1).
Appendix C 167

FEET 570-i540-
510-
480-
450-
420-
390-
360-
330-
300
25 50 75
VERTICAL EXAGGERATION: 1.1DATUM IS SEA LEVEL
Gilford line j
METERS
Land surface
Water table'
100 200 300 FEET
25 50 75
VERTICAL EXAGGERATION: 0.8DATUM IS SEA LEVEL
METERS
25 50 75
VERTICAL EXAGGERATION: 0.8DATUM IS SEA LEVEL
METERS
METERS-166
-156
-146
-136
-126
-116
-106
METERSr-171
-161
-151
-141
-131
-121
-111
-101
-91
METERS-171
-161
-151
-141
-131
-121
-111
-101
-91
Figure CIO. Geohydrologic sections interpreted from seismic-refraction data for
Gilford lines i-i'(plate 2), j-j', and k-k' (locations on plate 1).
168 Geohydrology and Water Quality of Stratified-Drift Aquifers in the Winnepesaukee River Basins, Central New Hampshire

300
25 50 75VERTICAL EXAGGERATION: 0.8
DATUM IS SEA LEVEL
METERS
350
25 50
VERTICAL EXAGGERATION:DATUM IS SEA LEVEL
75
1.0
FEET 610-1
590-
570-
550
Moultonborough a
530-
510-
490-
470-
450
Land surface
100 200 300 FEET
25 50 75VERTICAL EXAGGERATION: 1.3
DATUM IS SEA LEVEL
METERS
METERSr171
-161
-151
-141
-131
-121
-111
-101
METERS i-166
-156
-146
-136
-126
-116
-106
METERS
-177
-167
-157
-147
-137
Figure Cl 1 . Geohydrologic sections interpreted from seismic-refraction for Gilford
line l-l' (location shown on plate 1); Meredith line a-a' (location shown on plate 3),
and Moultonborough line a-a' (location shown on plate 3).
Appendix C 169

Moultonborough b
25 50 75
VERTICAL EXAGGERATION: 1.1DATUM IS SEA LEVEL
Moultonborough c
METERS
25 50 75
VERTICAL EXAGGERATION: 1.3DATUM IS SEA LEVEL
Moultonborough d
METERS
25 50 75
VERTICAL EXAGGERATION: 1.1DATUM IS SEA LEVEL
METERS
METERSr197
-187
-177
-167
-157
-147
-137
METERS
-192
-182
-172
-162
-152
METERS-197
-187
-177
-167
-157
-147
-137
Figure C12. Geohydrologic sections interpreted from seismic-refraction data for
Moultonborough lines b-b', c-c', and d-d' (locations shown on plate 4).
170 Geohydrology and Water Quality of Stratified-Drift Aquifers in the Winnepesaukee River Basins, Central New Hampshire

Moultonborough e
'/////, Bedrock W/////M
gFEET570 -,
0 25 50 75 METERS
VERTICAL EXAGGERATION: 2.0DATUM IS SEA LEVEL
Moultonborough f
25 50 75
VERTICAL EXAGGERATION: 1.2DATUM IS SEA LEVEL
Moultonborough g
METERS
n r 50 75
VERTICAL EXAGGERATION: 1.9DATUM IS SEA LEVEL
METERS
METERSr197
-187
-177
-167
-157
-147
-137
METERS
-192
-182
-172
-162
-152
METERS r173
-163
-153
L 143
Figure C13. Geohydrologic sections interpreted from seismic-refraction data for
Moultonborough lines e-e', f-f, and g-g' (locations shown on plate 3).
Appendix C 171

FEET 610-.
New Durham line a
590
570-
550-
530-
510-
490-
470-
450
Water table
uu
VV
100 200 300
25 50 75
VERTICAL EXAGGERATION: 1.3DATUM IS SEA LEVEL
New Durham line uu
FEET
METERS
UU
25 50 75
VERTICAL EXAGGERATION: 1.3DATUM IS SEA LEVEL
New Durham line vv
METERS
25 50 75VERTICAL EXAGGERATION: 1.3
DATUM IS SEA LEVEL
METERS
METERS
r177
-167
-157
-147
-137
METERS
1-162
-152
-142
-132
-122
METERS
r 162
-152
-142
-132
-122
Figure C14. Geohydrologic sections interpreted from seismic-refraction data for New
Durham lines a-a', uu-uu', and w-w' (modified from Mack and Lawlor, 1992;
locations shown on plate 2).
172 Geohydrology and Water Quality of Stratified-Drift Aquifers in the Winnepesaukee River Basins, Central New Hampshire

wwFEET 550-i530-
510-
490-
470-
450-
430-
410-
390
370-1
350
New Durham line ww
Land surface
WW'
100 200 300 FEET
25 50 75 METERS
XX
VERTICAL EXAGGERATION: 1.1DATUM IS SEA LEVEL
New Durham line xx
yyFEET560-,
0 25 50 75 METERS
VERTICAL EXAGGERATION: 2.8DATUM IS SEA LEVEL
New Durham line yyyy'
25 50 75VERTICAL EXAGGERATION: 1.2
DATUM IS SEA LEVEL
METERS-166
-156
-146
-136
-126
p116
-106
METERS r166
-156
-U6
-136
-126
-116
-106
METERS
r162
-152
-U2
-132
-122
Figure CIS. Geohydrologic sections interpreted from seismic-refraction data for
New Durham lines ww-ww', xx-xx', and yy-yy' (modified from Mack and Lawlor,
1992; locations shown on plate 2).
Appendix C 173

zzFEET 560-,
540-
520-
500-
480-
460-
440-
420-
New Durham line zzzz'
400-
Land surface
Water table
100 200 300 FEET
Odd
25 50 75
VERTICAL EXAGGERATION: 1.3DATUM IS SEA LEVEL
New Durham line aaa
METERS
aaa
400
25 50 75
VERTICAL EXAGGERATION: 1.1DATUM IS SEA LEVEL
Northfield line a
METERS
a'
0 25 METERS
VERTICAL EXAGGERATION: 0.5DATUM IS SEA LEVEL
METERS
r-162
-152
-142
-132
-122
METERSr182
-172
-162
-152
-142
-132
-122
METERS-136
-126
-116
-106
-96
-86
-76
Figure C16. Geohydrologic sections interpreted from seismic-refraction data for
New Durham lines zz-zz' and aaa-aaa' (modified from Mack and Lawlor, 1992;
locations shown on plate 2), and Northfield line a-a' (location shown on plate 1).
174 Geohydrology and Water Quality of Stratified-Drift Aquifers in the Winnepesaukee River Basins, Central New Hampshire

FEET 450-i430-
410-
390-
370-
350-
330-
310-
290-
270-
250
Northfield line b
FEET 510-
490-
470-
450-
430-
410-
390-
370-
350
Land surface
Water table /
0 25 50 75
VERTICAL EXAGGERATION: 1.1
DATUM IS SEA LEVEL
METERS
Tilton line a
Land surface
100 200 300 FEET
25 50 75 METERS
VERTICAL EXAGGERATION: 1.3DATUM IS SEA LEVEL
Tilton line b
25 50 75
VERTICAL EXAGGERATION: 1.3DATUM IS SEA LEVEL
METERS
METERS-136
-126
-116
-106
-96
-86
-76
METERS
r-146
-136
-126
-116
-106
METERS
p162
-152
-142
-132
-122
Figure Cl 7. Geohydrologic sections interpreted from seismic-refraction data for
Northfield line b-b', and Tilton lines a-a' and b-b' (locations shown on
plate 1).
Appendix C 175

Tuftonboro line a
FEET 600-i580-
560-
540-
520-
500480-
460-
440-
420-
400
25 50 75VERTICAL EXAGGERATION: 1.1
DATUM IS SEA LEVEL
Tuftonboro line b
METERS
25 50 75VERTICAL EXAGGERATION: 1.3
DATUM IS SEA LEVEL
Tuftonboro line c
METERS
b'
Land surface
Water table/
100 200 300 FEET
25 50 75
VERTICAL EXAGGERATION: 1.0DATUM IS SEA LEVEL
METERS
METERSr-166
-156
-146
-136
-126
-116
-106
METERS
-192
-182
-172
-162
-152
METERS-182
-172
-162
-152
-142
-132
-122
Figure CIS. Geohydrologic sections interpreted from seismic-refraction data for
Tuftonboro lines a-a', b-b', and c-c' (locations shown on plate 4).
176 Geohydrology and Water Quality of Stratified-Drift Aquifers in the Winnepesaukee River Basins, Central New Hampshire

Tuftonboro line d
Land surface
d'
550
25 50 75VERTICAL EXAGGERATION: 1.2
DATUM IS SEA LEVEL
Tuftonboro line e
METERS
FEET 560-1
25 50 75
VERTICAL EXAGGERATION: 1.2DATUM IS SEA LEVEL
Tuftonboro line f
300 FEET
METERS
540
520-
500-
480-
460-
440-
420-
400
Land surface
Water table/
100 200
25 50 75
VERTICAL EXAGGERATION: 1.2DATUM IS SEA LEVEL
300 FEET i
METERS
METERS
-207
-197
-187
-177
-167
METERS
-207
-197
-187
-177
-167
METERS
-162
-152
-142
-132
H22
Figure C19. Geohydrologic sections interpreted from seismic-refraction data for
Tuftonboro lines d-d', e-e', and f-f (locations shown on plate 4).
Appendix C 177

FEET 610^
590-
570-
550-
530-
510-
490-
470-
450
Tuftonboro line g
Land surface .
Water table/
100 200
25 50 75VERTICAL EXAGGERATION: 1.2
DATUM IS SEA LEVEL
300 FEET_l
METERS
FEET 610-i
Tuftonboro line h
590
570-
550-
530-
510-
490-
470-
450
Land surface
Water table/
100 200 300
25 50 75 METERS
VERTICAL EXAGGERATION: 1.2DATUM IS SEA LEVEL
Tuftonboro line i
25 50 75
VERTICAL EXAGGERATION: 1.3DATUM IS SEA LEVEL
METERS
METERS
-177
-167
-157
-147
-137
METERS
-177
-167
-157
-147
M37
METERS
-177
-167
-157
-147
-137
Figure C20. Geohydrologic sections interpreted from seismic-refraction data for
Tuftonboro lines g-g', h-IY, and i-i' (locations shown on plate 4).
178 Geohydrology and Water Quality of Stratified-Drift Aquifers in the Winnepesaukee River Basins, Central New Hampshire

Tuftonboro line j
25 50 75 METERS
VERTICAL EXAGGERATION: 1.1DATUM IS SEA LEVEL
Tuftonboro line k
25 50 75
VERTICAL EXAGGERATION: 1.1DATUM IS SEA LEVEL
METERS
0 25 METERS
VERTICAL EXAGGERATION: 0.7DATUM IS SEA LEVEL
METERSr182
-172
-162
-152
-142
-132
-122
METERSr197
-187
-177
-167
-157
-147
-137
METERS
-177
r-167
-157
-147
-137
Figure C21. Geohydrologic sections interpreted from seismic-refraction data for
Tuftonboro lines j-j', k-k', and l-l' (locations shown on plate 4).
Appendix C 179

Wolfboro line a
FEET 560-n
540-
520-
500-
480-
460-
440-
420-
400
25 50 75
VERTICAL EXAGGERATION: 2.1DATUM IS SEA LEVEL
Wolfboro line b
METERS
Land surface
100 200 300 FEET
25 50 75
VERTICAL EXAGGERATION: 1.3DATUM IS SEA LEVEL
Wolfboro line c
METERS
25 50 75
VERTICAL EXAGGERATION: 2.1DATUM IS SEA LEVEL
METERS
METERS -182
-172
-162
-152
METERS
r162
-152
-142
-132
-122
METERS r167
-157
M47
L 137
Figure C22. Geohydrologic sections interpreted from seismic-refraction data for Wolfeboro lines a-a', b-b', and c-c' (locations shown on plate 4).
180 Geohydrology and Water Quality of Stratified-Drift Aquifers in the Winnepesaukee River Basins, Central New Hampshire

APPENDIX D. Low streamflow measurements at miscellaneous sites in central New Hampshire
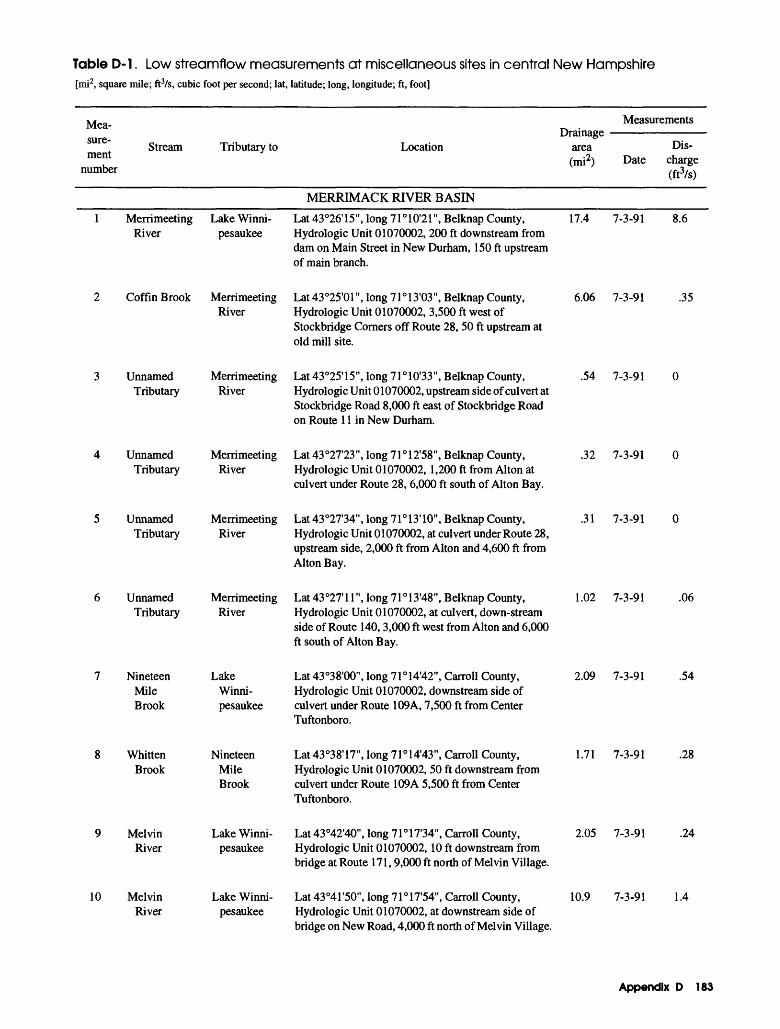
Table D-l . Low streamflow measurements at miscellaneous sites in central New Hampshire[mi2, square mile; ft3/s, cubic foot per second; lat, latitude; long, longitude; ft, foot]
Mea sure ment
number
Stream Tributary to Location
MeasurementsDrainage
area Dis- (mi2) Date charge
(ft3/s)
MERRIMACK RIVER BASIN
1
2
3
4
5
6
7
8
9
10
Merrimeeting River
Coffin Brook
Unnamed Tributary
Unnamed Tributary
Unnamed Tributary
Unnamed Tributary
Nineteen Mile Brook
Whitten Brook
Melvin River
Melvin River
Lake Winni- pesaukee
Merrimeeting River
Merrimeeting River
Merrimeeting River
Merrimeeting River
Merrimeeting River
Lake Winni- pesaukee
Nineteen Mile Brook
Lake Winni- pesaukee
Lake Winni- pesaukee
Lat 43°26'15", long 71°10'21", Belknap County, Hydrologic Unit 01070002, 200 ft downstream from dam on Main Street in New Durham, 150 ft upstream of main branch.
Lat 43°25'01 ", long 71° 13'03", Belknap County, Hydrologic Unit 01070002, 3,500 ft west of Stockbridge Corners off Route 28, 50 ft upstream at old mill site.
Lat 43°25'15", long 71°10'33", Belknap County, Hydrologic Unit 01070002, upstream side of culvert at Stockbridge Road 8,000 ft east of Stockbridge Road on Route 1 1 in New Durham.
Lat 43°27'23", long 71°12'58", Belknap County, Hydrologic Unit 01070002, 1,200 ft from Alton at culvert under Route 28, 6,000 ft south of Alton Bay.
Lat 43°27'34", long 71°13'10", Belknap County, Hydrologic Unit 01070002, at culvert under Route 28, upstream side, 2,000 ft from Alton and 4,600 ft from Alton Bay.
Lat 43°27'ir, long 71°13'48", Belknap County, Hydrologic Unit 01070002, at culvert, down-stream side of Route 140, 3,000 ft west from Alton and 6,000ft south of Alton Bay.
Lat 43°38'00", long 71°14'42", Carroll County, Hydrologic Unit 01070002, downstream side of culvert under Route 109A, 7,500 ft from Center Tuftonboro.
Lat 43°38'17", long 7P14'43", Carroll County, Hydrologic Unit 01070002, 50 ft downstream from culvert under Route 109A 5,500 ft from CenterTuftonboro.
Lat43°42'40", long 7F17'34", Carroll County, Hydrologic Unit 01070002, 10 ft downstream from bridge at Route 171, 9,000 ft north of Melvin Village.
Lat 43°41'50", long 71°17'54", Carroll County, Hydrologic Unit 01070002, at downstream side of
17.4 7-3-91 8.6
6.06 7-3-91 .35
.54 7-3-91 0
.32 7-3-91 0
.31 7-3-91 0
1.02 7-3-91 .06
2.09 7-3-91 .54
1.71 7-3-91 .28
2.05 7-3-91 .24
10.9 7-3-91 1.4
bridge on New Road, 4,000 ft north of Melvin Village.
Appendix D 183
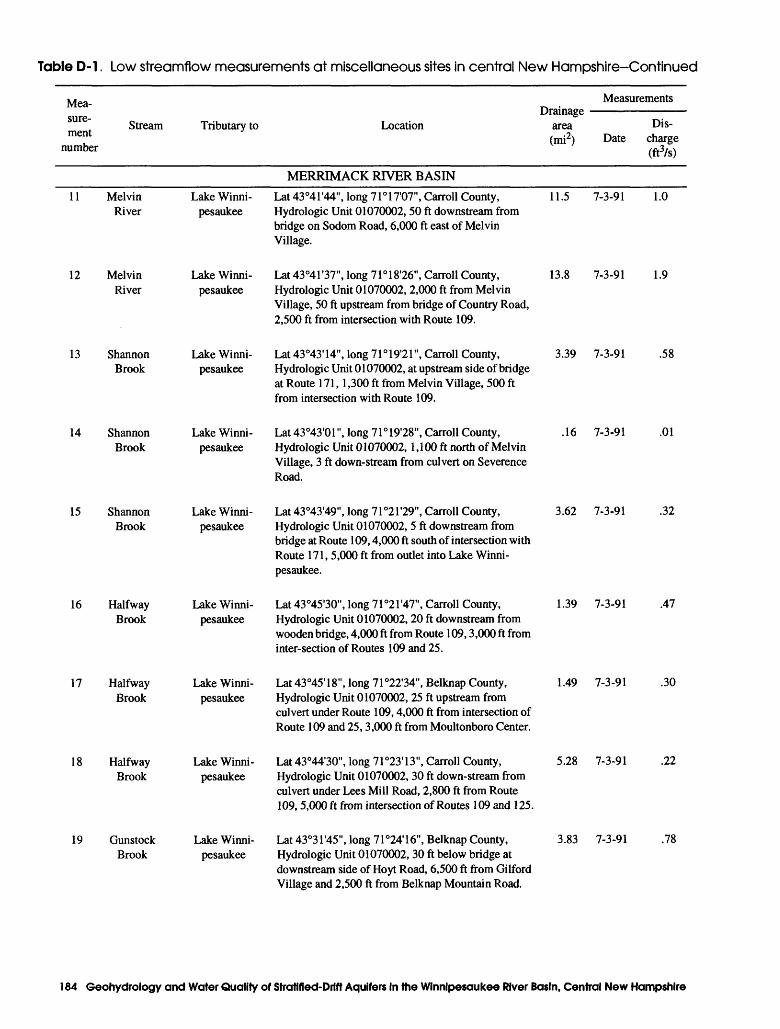
Table D-l . Low streamflow measurements at miscellaneous sites in central New Hampshire-Continued
Mea sure ment
number
Measurements
Stream Tributary to Location area (mi2) Date
Dis charge (ft3/s)
MERRIMACK RIVER BASIN
11
12
13
14
15
16
17
18
19
Melvin River
Melvin River
Shannon Brook
Shannon Brook
Shannon Brook
Halfway Brook
Halfway Brook
Halfway Brook
Gunstock Brook
Lake Winni- pesaukee
Lake Winni- pesaukee
Lake Winni- pesaukee
Lake Winni- pesaukee
Lake Winni- pesaukee
Lake Winni- pesaukee
Lake Winni- pesaukee
Lake Winni- pesaukee
Lake Winni- pesaukee
Lat43°41'44", long 71°17'07",Carroll County, 11.5 7-3-91 Hydrologic Unit 01070002, 50 ft downstream from bridge on Sodom Road, 6,000 ft east of Melvin Village.
Lat 43°41'37", long 71°18'26", Carroll County, 13.8 7-3-91 Hydrologic Unit 01070002, 2,000 ft from Melvin Village, 50 ft upstream from bridge of Country Road, 2,500 ft from intersection with Route 109.
Lat 43°43'14", long 71°19'21", Carroll County, 3.39 7-3-91 Hydrologic Unit 01070002, at upstream side of bridge at Route 171, 1,300 ft from Melvin Village, 500 ft from intersection with Route 109.
Lat 43°43'01 ", long 71°19'28", Carroll County, .16 7-3-91 Hydrologic Unit 01070002, 1,100 ft north of Melvin Village, 3 ft down-stream from culvert on Severence Road.
Lat 43°43'49", long 71°21'29", Carroll County, 3.62 7-3-91 Hydrologic Unit 01070002, 5 ft downstream from bridge at Route 109, 4,000 ft south of intersection with Route 171, 5,000 ft from outlet into Lake Winni-pesaukee.
Lat 43°45'30", long 71°21'47", Carroll County, 1.39 7-3-91 Hydrologic Unit 01070002, 20 ft downstream from wooden bridge, 4,000 ft from Route 109, 3,000 ft from inter-section of Routes 109 and 25.
Lat 43°45'18", long 71°22'34", Belknap County, 1.49 7-3-91 Hydrologic Unit 01070002, 25 ft upstream from culvert under Route 109, 4,000 ft from intersection ofRoute 109 and 25, 3,000 ft from Moultonboro Center.
Lat 43°44'30", long 71°23'13", Carroll County, 5.28 7-3-91 Hydrologic Unit 01070002, 30 ft down-stream from culvert under Lees Mill Road, 2,800 ft from Route109, 5,000 ft from intersection of Routes 109 and 125.
Lat 43°31'45", long 71°24'16", Belknap County, 3.83 7-3-91 Hydrologic Unit 01070002, 30 ft below bridge at
1.0
1.9
.58
.01
.32
.47
.30
.22
.78
downstream side of Hoyt Road, 6,500 ft from Gilford Village and 2,500 ft from Belknap Mountain Road.
184 Geohydrology and Water Quality of Stratified-Drift Aquifers In the Winnlpesaukee River Basin, Central New Hampshire

Table D-l . Low streamflow measurements at miscellaneous sites in central New Hampshire-Continued
Mea sure ment
number
Stream Tributary to LocationDrainage
area (mi2)
Measurements
Dis-Date charge
(ft3/s)
MERRIMACK RIVER BASIN
20 Gunstock LakeWinni- Lat 43°33'00", long 71°24' 15", Belknap County,Brook pesaukee Hydrologic Unit 01070002,1,200 ft from intersection
of Belknap Mountain Road and Route 1 IB.
5.84 7-3-91 0.94
21 Gunstock LakeWinni- Lat 43°33'58", long 71°23'58", Belknap County, Brook pesaukee Hydrologic Unit 01070002,60 ft upstream from
bridge at Henderson Road, 500 ft west of Route 1 IB.
8.26 7-3-91 1.26
22 Gunstock LakeWinni- Lat 43°34'28", long 71 °24' 10", Belknap County,Brook pesaukee Hydrologic Unit 01070002,40 ft down-stream from
bridge at Old Lake-shore Road, 300 ft from inter section of Route 1 IB, 1,000 ft from Gilford Village.
8.74 7-3-91 1.13
23 Hawkins LakeWinni- Lat 43°40'09", long 71°30'16", Belknap County, Brook pesaukee Hydrologic Unit 01070002, downstream side of
culvert, on Transfer Station Road, 4,500 ft north of Meredith.
2.20 7-3-91 .14
24 Hawkins LakeWinni- Lat 43°39'56", long 71°29'54", Belknap County, Brook pesaukee Hydrologic Unit 01070002,40 ft upstream from
culvert under road to Town Highway Department, through Town Park, 1,000 ft east of Route 3, 3,000 ft north of Meredith.
2.54 7-3-91 .51
25 Jewett Lake Lat 43°31'54", long 71°27'37", Belknap County,Brook Winnisquam Hydrologic Unit 01070002,25 ft downstream from
bridge at High St., 5,000 ft from intersection with Route 11 A, 4,500 ft from intersection with Route 11 bypass.
5.26 7-3-91 .49
26 Durkee Lake Lat43°30'56", long 71°27'34", Belknap County, Brook Winnisquam Hydrologic Unit 01070002, 20 ft upstream from
bridge on connector between Routes 106 and 107, 1,300 ft from Route 11 bypass, 4,500 ft from Laconia.
1.96 7-3-91 .80
27 Wickwas LakeWinni- Lat 43°36'50", long 7 r32'01", Belknap County, Outlet pesaukee Hydrologic Unit 01070002,40 ft upstream from
bridge on Meredith Center Road, 6,000 ft from intersection of Route 104,1,000 ft west of Meredith Center.
12.0 7-3-91 .29
28 Durgin Lake Lat 43°29'29", long 71°30'09", Belknap County, Brook Winnisquam Hydrologic Unit 01070002, 300 ft upstream from
bridge at Bean Hill Road, 500 ft from intersection with Route 3, 2,000 ft north of bridge over Winnisquam Lake.
3.84 7-2-91
Appendix D 185

Table D-l . Low streamflow measurements at miscellaneous sites in central New Hampshire-Continued
Mea sure ment
number
Measurements
Stream Tributary to Location area (mi2) Date
Dis charge (ft3/s)
MERRIMACK RIVER BASIN
29
30
31
32
33
34
35
36
37
Unnamed Tributary
Windy Hill Brook
Tioga River
Pumping Station
Unnamed Tributary
Tioga River
Tioga River
Gulf Brook
Williams Brook
Lake Lat43°28'25", long 71°30'48",Belknap County, .39 7-2-91 Winnisquam Hydrologic Unit 01070002, downstream side of
culvert at Union Road, 6,500 ft east of Lochmere.
Silver Lat 43°28'26", long 7 1 °32'38", Belknap County, 1.87 7-3-91 Lake Hydrologic Unit 0 1 070002, at upstream side of culvert
at Route 1 1 in Lochmere, 2,500 ft from East Tilton, 1,000 ft from intersection of Route 1 1 and 1-93.
Winnipesaukee Lat 43°2704", long 71°28'13", Belknap County, 14.7 7-3-91 River Hydrologic Unit 0 1 070002, 4,500 ft from Belmont,
300 ft downstream from Badger Pond, 100 ft upstream from Route 106.
Tioga Lat 43°25'47", long 71°28'43", Belknap County, 2.35 7-3-91 River Hydrologic Unit 0 1 070002, 300 ft downstream from
culverts at Wareing Road, 5,000 ft south of Belmont.
Tioga Lat 43°26'36", long 7 1°29'43", Belknap County, 1.03 7-3-91 River Hydrologic Unit 01070002, 3,500 ft west of Belmont
at confluence with Tioga River.
Winnipesaukee Lat 43°26'40", long 7 1°29'46", Belknap County, 18.7 7-3-91 River Hydrologic Unit 0 1 070002, 3,500 ft from Belmont
downstream from confluence with UnnamedTributary.
Winnipesaukee Lat 43°26'33", long 71°31' 06", Belknap County, 26.85 7-3-91 River Hydrologic Unit 01070002, at downstream edge of
bridge abutment on South Road, 9,000 ft from Belmont, 1,200 ft from intersection with Route 140.
Winnipesaukee Lat 43°27'19", long 71°33'51", Belknap County, 5.52 7-2-91 River Hydrologic Unit 0 1 070002, 1 0 ft upstream from old
railroad trestle bridge on Pike Industries property, 500 ft downstream from Route 11,1 ,500 ft from intersection with 1-93.
Winnipesaukee Lat 43°25'58", long 71 °36'05", Belknap County, 7.62 7-3-91 River Hydrologic Unit 0 1 070002, 1 0 ft downstream from
bridge at Sargent Road, 4,000 ft from Northfield, 2,500 ft from intersection with Route 132.
0.04
0
1.1
.80
0
3.9
5.58
.28
.66
186 Geohydrology and Water Quality of Stratified-Drift Aquifers in the Winnipesaukee River Basin, Central New Hampshire

APPENDIX E. Monthly water levels at selected wells, central New Hampshire
1*7

AH
W 6
3 A
LT
TnJ
DE
535
FT
JFMAMJJASON
u
J OH I3I
I T
I
AH
W 6
4 A
LT
ITU
DE
515
FT
i i
i i
i i
i i
i i
i i
N D
1990
JF
MA
MJJA
SO
N
1991
Fig
ure
E1. M
onth
ly w
ater
leve
ls a
t wel
ls A
HW
63
and
AH
W 6
4,
cent
ral N
ew H
amps
hire
, (lo
cate
d on
pla
te 2
).
16.5
17.0
17.5
18.0
18.5
I I
I1
I T
AH
W 6
5 A
LT
ITU
DE
550
FT
N D
1990
i I
I I
I i
I I
I I
JF
MA
MJ
JA
SO
N
1991
14 16 17 18
AH
W 6
6 A
LT
ITU
DE
535
FT
N D
1990
JF
MA
MJ
JA
SO
N
1991
Fig
ure
E2.
Mon
thly
wat
er le
vels
at w
ells
AH
W 6
5 an
d A
HW
66,
cent
ral N
ew H
amps
hire
, (lo
cate
d on
pla
te 2
).

! Q
Q. I t I i o 3.
| I Q I
O
X) 9 I Q o
BLW
80
AL
TIT
UD
E 4
70 F
T
i i
i i
i i
i i
i i
JFMAMJJASON
BLW
81
AL
TIT
UD
E 5
00 F
T
JFMAMJJASON
BLW
82
AL
TIT
UD
E 4
80 F
T
13.0
JF
MA
MJ
JA
SO
N
1991 B
LW 8
3 A
LT
ITU
DE
500
FT
i i
i i
i i
i i
i i
5.5
JF
MA
MJJA
SO
N
1991
Fig
ure
E3.
Mon
thly
wat
er le
vels
at w
ells
BLW
80
and
BLW
81,
ce
ntra
l New
Ham
pshi
re, (
loca
ted
on p
late
1).
Fig
ure
E4.
Mon
thly
wat
er le
vels
at w
ells
BLW
82
and
BL
W 8
3,
cent
ral N
ew H
amps
hire
, (lo
cate
d on
pla
te 1
).

28.5
29.0
29.5
30.0
30.5
31.0
i i
i i
i i
i r
BL
W 8
4 A
LT
ITU
DE
540
FT
N D
1990
i i
i i
i i
i i
i i
JF
MA
MJJA
SO
N
1991
30 31 32 33
BLW
85
AL
TIT
UD
E 6
65 F
T
N D
1990
i i
i i
i i
i i
i i
JF
MA
MJJA
SO
N
1991
Fig
ure
E5.
Mon
thly
wat
er le
vels
at w
ells
BLW
84
and
BLW
85,
cent
ral N
ew H
amps
hire
, (lo
cate
d on
pla
te 1
).
I I
I 1
I 1
I I
I I
I T
GFW
11
AL
TIT
UD
E 7
80 F
T
N D
1990
JF
MA
MJJA
SO
N
1991
i i
i i
i
GFW
12
AL
TIT
UD
E 5
15 F
T
JFMAMJJASON
Fig
ure
E6.
Mon
thly
wat
er le
vels
at w
ells
GFW
11
and
GFW
12,
cent
ral N
ew H
amps
hire
, loc
ated
on
plat
es 1
and
3).

a i s a a f i e
11.5
i i
r
6 3 a> 70 I O a> 3 I Q f
GFW
13
AL
TIT
UD
E 5
40 F
T
JF
MA
MJ
J
AS
ON
MH
W1
AL
TIT
UD
E 5
65 F
T
JF
MA
MJJA
SO
N15
Fig
ure
E7.
Mon
thly
wat
er le
vels
at w
ells
GFW
13
and
MH
W 1
,
cent
ral N
ew H
amps
hire
, (lo
cate
d on
pla
tes
1 an
d 3)
.
MH
W 2
A
LT
ITU
DE
515
FT
11JF
MA
MJJA
SO
N
1991
i i
i i
i
MW
W 1
9 A
LTIT
UD
E 57
5 FT
JF
MA
MJJA
SO
N
1991
Figu
re E
8. M
onth
ly w
ater
leve
ls a
t wel
ls M
HW
2 a
nd M
WW
19,
cent
ral N
ew H
amps
hire
, (lo
cate
d on
pla
te 3
).


