Download - Glass transitions in bituminous binders

ORIGINAL ARTICLE
Glass transitions in bituminous binders
Panos Apostolidis . Michael Elwardany . Laurent Porot . Stefan Vansteenkiste .
Emmanuel Chailleux
Received: 19 November 2020 / Accepted: 20 May 2021 / Published online: 3 June 2021
� The Author(s) 2021
Abstract The RILEM TC 272 PIM (Phase and
Interphase behavior of innovative bituminous Materi-
als)—TG1 Binder has initiated an inter-laboratory
program investigating the phase and interphase
behaviour of bituminous binders. Within the scope,
four laboratories evaluated the low temperature prop-
erties of seven binders with differential scanning
calorimetry (DSC). DSC has been accepted as a
powerful tool to evaluate, among others, the glass
transitions, Tg, monitoring the endothermic or
exothermic heat flow of a material under controlled
temperature conditions. There are different ways to
run the test, conventional temperature linear-DSC
(TL-DSC), and temperature modulation-DSC (TM-
DSC). The latter has been proven as an efficient
method differentiating the structural relaxation phe-
nomena from the heat capacity. In this study, emphasis
was placed on comparing the Tg measured by TL- and
TM-DSC to improve the interpretation of binder glass
transitions. In this study, the scope was restrained to
This article was prepared by a task group within RILEM TC
272-PIM: Phase and Interphase behaviour of bituminous
Materials. The article has been reviewed and approved by all
members of the TG.
TC Membership:
Chair: Emmanuel Chailleux (IFSTTAR),
Deputy Chair: Christiane Raab (EMPA),
TC Members: Adrian Andriescu (FHWA),
[email protected], Alexandros Margaritis
(UAntwerp), [email protected], Bernard
Hofko (TUWien), [email protected], David
Mensching (FHWA), [email protected], Davide
Dalmazzo (Polito), [email protected], Di Wang
(TUBraunschweig), [email protected], Emmanuel
Chailleux (IFSTTAR), [email protected],
Hamzeh Haghshenas (Huskers),
[email protected], Hilde Soenen (Nynas),
[email protected], Ingrid Gabrielle Do Nascimento
Camargo (TUWien), [email protected], Jiqing Zhu
(VTI), [email protected], Kees Plug (Strukton),
[email protected], Laurent Porot (Kraton),
[email protected], Lucia Tsantilis (Polito),
[email protected], Michael Elwardany (FHWA),
[email protected], Michalina Makowska (Aalto),
[email protected], Panos Apostolidis (TUDelft),
[email protected], Sayeda Nahar (TNO),
[email protected], Stefan Vansteenkiste (BRRC),
[email protected], Virginie Mouillet (CEREMA),
[email protected], Xavier Carbonneau (COLAS),
P. Apostolidis (&)
Delft University of Technology, Delft, The Netherlands
e-mail: [email protected]
M. Elwardany
Western Research Institute, Laramie, USA
e-mail: [email protected]
Present Address:M. Elwardany
Engineering and Software Consultants, Inc. at FHWA-
TFHRC, Washington D.C., USA
Materials and Structures (2021) 54:132
https://doi.org/10.1617/s11527-021-01726-6(0123456789().,-volV)( 0123456789().,-volV)

two Polymer modified Binders (PmBs): a commer-
cially available modified binder named PmB1 and a
highly modified binder (7.5 wt% high vinyl SBS)
named PmB2, were evaluated and compared with two
neat bituminous binders. Based on the thermographs
of the PmB2 obtained through this inter-laboratory
program, it was observed that the modification by
7.5% SBS resulted in a decrease of the Tg. This
reduction of Tg reflects the positive influence of SBS at
low temperatures.
Keywords Differential scanning calorimetry � Glass
transition � Bitumen � Binder � Styrene–butadiene–
styrene copolymer
1 Introduction
Differential scanning calorimetry (DSC) has been
accepted as a robust device to investigate the glass
transition and the amount of crystallisable and
dissolvable fractions in bitumen [1–4]. Through the
conventional temperature linear-DSC measurements
(TL-DSC), the heat flow into and out of a sample is
monitored under a controlled temperature program.
Bituminous binders being complex material, the
temperature modulation-DSC (TM-DSC) technique
has been proven as more efficient and sensitive than
the TL-DSC measurements when the structural anal-
ysis of bitumen is needed to be assessed [5]. Partic-
ularly, both the reversing and non-reversing
phenomena of materials can be assessed by using the
TM-DSC. A modulated temperature signal superim-
posed on a linear heating or cooling program can be
applied to elucidate the thermo-kinetic phenomena
occurring through thermal scanning [6–9]. The total
MT-DSC signals can be split into reversible and non-
reversible signals. The latter two can be used to
decompose the time-dependent thermal non-equilib-
rium transitions from the equilibrium-in-nature trans-
formations [10, 11]. Thus, high sensitivity and
resolution analyses can be performed using a modu-
lated signal in TM-DSC, and the heat capacity (Cp)
can be measured, providing accurate glass transition
analyses. As it is less uncertain and ambiguous the
definition and selection of baselines and endpoint in
TM-DSC than in TL-DSC, the detection of different
thermal events and enthalpy changes is more precise
[5, 12–14].
Over the years, various theories have been intro-
duced to explain the nature of bitumen, from being a
natural polymer consisted of repeating units [15], to a
binder of oligomeric structure [16], and a colloidal
biphasic system of asphaltenes and maltenes [17].
However, according to [18], no hypothetical
microstructure of bitumen exists. The physical and
mechanical properties of bitumen originate from the
intermolecular interactions among its constituents that
are difficult to be identified due to their high
complexity. Indeed, predictions of the thermal behav-
ior of bitumen are not straightforward, unlike other
systems. The calorimetric behavior of bitumen resem-
bles that of other hydrocarbons [19, 20]. Hence,
special attention should be paid to interpreting the
nature of bitumen by the intermolecular interactions
between maltenes and asphaltenes [21].
Recent studies on the thermal behavior of bitumen
via TM-DSC have shown that the polymer-like
rheology of bitumen is due to the gel-like microstruc-
tures formed by waxes without repeated groups in
bitumen [10]. The presence of waxes in bitumen
attributes the melting peaks [22] and the crystallisation
upon heating due to limited mobility, associated with
non-crystallisable compounds during cooling [20]. In
addition to enthalpic events, the glass transition region
of bituminous binders extends over a wide tempera-
ture range, similarly to polymer-like materials [23],
ranging between - 60 and 0 �C [2], or between - 50
and - 10 �C [24]. The Tg is related to the overall
chemical composition of bitumen and has been
considered to determine the source, the process, and
aging level of bitumen [1–4]. The width of the glass
transition region increases with higher asphaltenes
content and higher oxidation levels [3, 4].
L. Porot
Kraton Polymers B.V., Almere, The Netherlands
e-mail: [email protected]
S. Vansteenkiste
Belgian Road Research Centre, Brussels, Belgium
e-mail: [email protected]
E. Chailleux
Universite Gustave Eiffel, Bougenais, France
e-mail: [email protected]
132 Page 2 of 15 Materials and Structures (2021) 54:132

In general, polymers behave as amorphous mate-
rials at temperatures above the Tg, while below the Tg,
they behave like glass. In the transition region from an
amorphous to a glassy state, a stepwise increase of
modulus, specific volume, and thermal expansion
coefficient happen. The glass transition region is the
range of temperatures that correspond to this transi-
tion. Binder rheological behavior is defined by three
regions: the near glass region below the Tg, terminal
region above the crossover temperature, and an
intermediate ‘‘transition’’ region between them [25].
Rheological measurements can be used to determine
the Tg of binder, which is defined as the temperature
that corresponds to the maximum loss moduli at a
given reference frequency [17, 25]. From the mechan-
ics point of view, the Tg can help understand the
thermal cracking and the performance of various
binders at low temperatures [26, 27]. Recent studies
based on asphalt bending beam testing, acoustic
emissions, and finite element analysis provide evi-
dence that asphalt can be damaged on cooling even
when no external restraint is imposed on the speci-
mens. It has been theorised that the differential
contraction between mastics and the surrounding
aggregate develops localised tensile stresses that are
defined in what is called the Internal Restraint Damage
Mechanism [28]. This internal restraint damage
mechanism is dependent on the binder coefficient of
thermal contraction (CTC), binder rheological prop-
erties and ability to relax stresses, and binder strength
[29]. All the aforementioned three key properties are
highly dependent on the binder glass transition. For
instance, the Tg affects the accumulation of thermal
stresses build-up in the pavement over a certain
thermal history. Below the Tg, asphalt binders exhibit
brittle behavior while they are ductile at temperatures
above Tg.
For bituminous binders with various inclusions,
such as polymers or liquid additives, the use of DSC
has been proved as a robust characterisation tool to
evaluate the compatibility of individual components
of produced blends. The compatibility, or lack of it,
determines the durability and the performance prop-
erties of bituminous blends. In polymer modifications,
a single Tg, otherwise a single blend-average Tg,
indicates a single-phase system. On the other hand,
blends of two Tg values manifest a system of two
phases. In bituminous binders, alterations of glass
transitions in blends manifest to changes of an always
single Tg. Many studies have been performed to
evaluate the miscibility of various polymers in binders
with the ultimate goal to link with other performance
properties [12, 30–35].
An inter-laboratory experimental program was
initiated within the RILEM TC 272 PIM (Phase and
Interphase behaviour of innovative bituminous Mate-
rials)—TG1 Binder. It had a broad experimental plan
evaluating seven binders in two groups, one for
polymer modification and one for liquid additives
[36]. Over the 17 participating laboratories, four of
them performed thermal analyses on bituminous
binders in DSC. Special emphasis was given on
comparing the values of Tg measured by TL- and TM-
DSC techniques implementing different protocols to
highlight the numerous different output signals to
improve the interpretation of glass transitions in
bituminous binders. The advantages of various calori-
metric methodologies are not universally acknowl-
edged, with slightly different temperature profiles
generated by different scanning protocols lacking
comprehensive understanding. The four laboratories,
having performed DSC, were the Belgian Road
Research Centre (Belgium), Delft University of
Technology (The Netherlands), Kraton Polymers
(The Netherlands), and Western Research Institute
(USA). Two of them performed temperature linear
DSC, and the two others temperature modulated DSC
(Table 1). The name of each lab was according to the
labelling of whole TG1 experimental program for
which only Lab1, Lab2, Lab5 and Lab12 performed
DSC.
2 Materials
The scope of the study was restrained to two polymer
modified binders and compared with two neat bitumi-
nous binders. Two paving grade bitumen of classes
Table 1 List of participating laboratories
Laboratory Equipment
Lab1 Q2000, TA
Lab2 Q2000, TA
Lab5 DSC, PerkinElmer
Lab12 DSC2 STARe with TOPEM, Mettler Toledo
Materials and Structures (2021) 54:132 Page 3 of 15 132
35/50 and 70/100 according to EN 12,591, named as
Bit1 and Bit2 respectively, were used in this study as
control binders. A commercial standard polymer
modified bitumen, PmB1, and a highly polymer
modified bitumen, PmB2, were included. The PmB1
was plant produced, and the PmB2 was lab-produced
using the Bit2 and 7.5% of a high vinyl linear block
styrene–butadiene–styrene (SBS) copolymer. Table 2
provides the basic properties of the four binders.
2.1 Calorimetric methods
As mentioned earlier, the heat capacity at the glass
transition changes significantly, reflecting a material
transition from a glassy to an amorphous viscoelastic
state. Thus, the glass transition in bituminous binders
is crucial when materials are designed and developed
to withstand thermal stresses and subsequently miti-
gate cracking susceptibility at low temperatures.
Through the calorimetric measurements with DSC,
the heat flow signal [mW or mJ/s] typically plotted
versus temperature or time, consists of two parts: (i)
the heat flow needed to raise the sample temperature at
the programmed rate, which is directly linked to the
intrinsic heat capacity of the sample, and (ii) the heat
flow arising from kinetic processes that may occur.
Phase change transitions, such as melting and crys-
tallisation, and second-order transitions, such as glass
transition and its associated enthalpy relaxation, are
exemplary kinetic phenomena. Therefore, the heat
flow is often expressed as
dQ
dt¼ mCPbþ f t; Tð Þ ð1Þ
where m is the mass of sample, Cp is the (temperature-
dependent) specific heat capacity of sample, b is the
heating rate, and f(T,t) is the heat flow due to the
kinetic phenomena. The Cp represents the heat capac-
ity of sample of constant microstructure (equilibrium).
In this study, the heat flow curves of bituminous
binders have been obtained via performing TL-DSC
and TM-DSC scans. The measured heat flow is a
function of the heating or cooling rates, sample heat
capacity, and endothermic or exothermic events
occurring in the sample. Attention was paid on the
sample preparation by extracting a representative
amount from the bulk material to avoid the undesired
hardening due to oxidation.
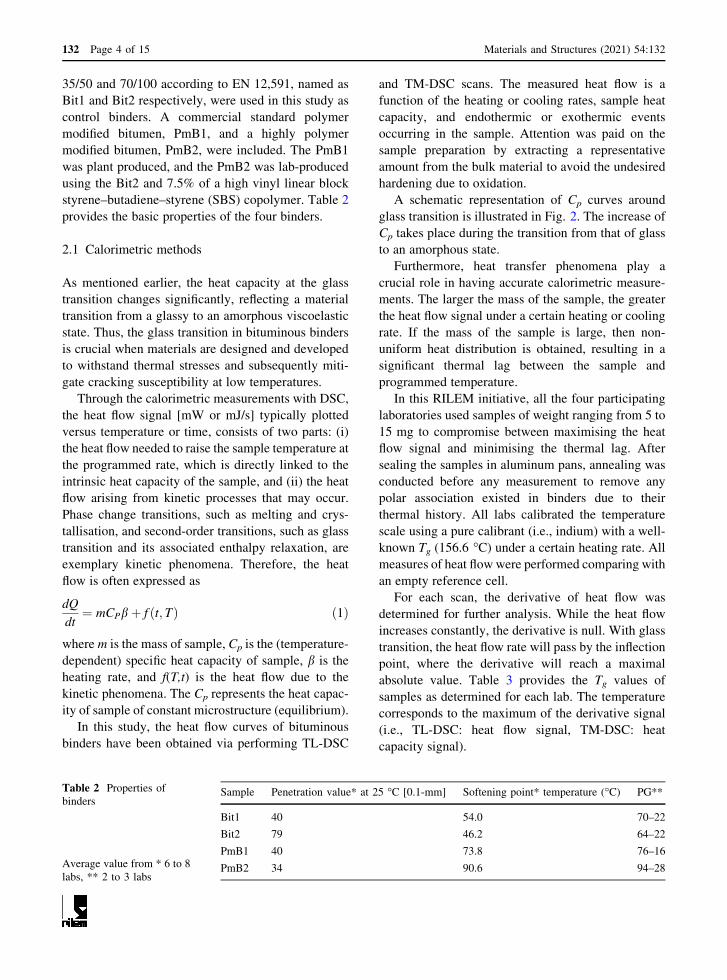
A schematic representation of Cp curves around
glass transition is illustrated in Fig. 2. The increase of
Cp takes place during the transition from that of glass
to an amorphous state.
Furthermore, heat transfer phenomena play a
crucial role in having accurate calorimetric measure-
ments. The larger the mass of the sample, the greater
the heat flow signal under a certain heating or cooling
rate. If the mass of the sample is large, then non-
uniform heat distribution is obtained, resulting in a
significant thermal lag between the sample and
programmed temperature.
In this RILEM initiative, all the four participating
laboratories used samples of weight ranging from 5 to
15 mg to compromise between maximising the heat
flow signal and minimising the thermal lag. After
sealing the samples in aluminum pans, annealing was
conducted before any measurement to remove any
polar association existed in binders due to their
thermal history. All labs calibrated the temperature
scale using a pure calibrant (i.e., indium) with a well-
known Tg (156.6 �C) under a certain heating rate. All
measures of heat flow were performed comparing with
an empty reference cell.
For each scan, the derivative of heat flow was
determined for further analysis. While the heat flow
increases constantly, the derivative is null. With glass
transition, the heat flow rate will pass by the inflection
point, where the derivative will reach a maximal
absolute value. Table 3 provides the Tg values of
samples as determined for each lab. The temperature
corresponds to the maximum of the derivative signal
(i.e., TL-DSC: heat flow signal, TM-DSC: heat
capacity signal).
Table 2 Properties of
binders
Average value from * 6 to 8
labs, ** 2 to 3 labs
Sample Penetration value* at 25 �C [0.1-mm] Softening point* temperature (�C) PG**
Bit1 40 54.0 70–22
Bit2 79 46.2 64–22
PmB1 40 73.8 76–16
PmB2 34 90.6 94–28
132 Page 4 of 15 Materials and Structures (2021) 54:132

2.2 Linear temperature protocols
For the standard linear calorimetric scans (TL-DSC),
two laboratories provided results of binder samples.
Based on the calorimetric measurements of these two
laboratories, i.e., Lab1 and Lab4, the Tg values of
samples were determined by calculating the maximum
of the 1st derivative of the heating heat flow curve.
Nevertheless, different DSC tools were used, and
different scanning protocols were implemented below.
In TL-DSC applied by Lab1 (DSC Q2000, TA), the
samples were annealed in DSC by preheating to
165 �C for 5 min. The samples were immediately
subjected to controlled cooling to - 60 �C with a rate
of 2 �C/min, without modulation. They kept for 5 min
at - 60 �C and then heated to 165 �C with the same
rate of 2 �C/min (average measuring rate: 1 data point
per 0.7 s, & plotting rate: 1 data point per 14.8 s).
In TL-DSC applied by Lab12 (DSC2 STARe
system equipped with M-DSC TOPEM, Mettler
Toledo), the samples were heated from 25 to 130 �Cwith 20 �C/min rate to establish sufficient contact with
the bottom of the pan. Samples were kept at 130 �C for
1 min and then cooled down to - 80 �C with a rate of
10 �C/min. After 1 min at - 80 �C, samples were
heated to 160 �C with 10 �C/min rate and kept at this
temperature for 1 min to erase their thermal history.
Afterward, a cooling rate of 10 �C/min was applied to
samples to reach - 80 �C, and the sample was kept at
this temperature for 1 min. Then samples were heated
to a range where cold crystallisation occurred, partic-
ularly to 0 �C with 10 �C/min rate, and kept there for
5 min to facilitate the relaxation of possible occurring
stresses. Samples were cooled to - 80 �C with a rate
of 10 �C/min and, after 1 min at this temperature. In
the last step, samples were heated up to 160 �C with
20 �C/min. The Tgs of samples were determined while
using the heating curve in this last step (average
measuring rate: 1 data point per 1 s).
Comparing the protocols implemented by Lab1 and
Lab12, the most significant difference was only the
number of steps before applying the Tg detection
measurement. Lab12 selected a faster heating rate
(20 �C/min) in the last step than Lab1 to improve the
sensitivity of calorimetric measurements, minimising
the appearance of thermodynamically
metastable phases as cold crystallisation. The glass
transition is highly dependent on the heating rate, as
the frequency dependency of rheological properties of
binders. A lower heating rate as implemented by Lab1
(2 �C/min) could reduce thermal lag and non-uniform
temperature distribution, offering a set of data that can
be compared with TM-DSC protocols of the same
heating rate.
2.3 Modulated temperature protocol
The glass transition in studied binders was evaluated
using the TM-DSC techniques as well. Temperature
modulation was only necessary when analysing
binders to provide high accuracy in detecting the
glass transition region. In TM-DSC scans, the most
commonly implemented program is the sinusoidal
temperature modulation, with specified frequency and
amplitude, along with a certain heating and/or cooling
rate. To be more specific, a periodic temperature
change is superimposed on the linear temperature
ramp yielding a heating (or cooling) profile with
continuously non-linearly alterations of the average
temperature of a sample with time. In Fig. 1, the blue
and red lines demonstrate the underlying temperature
and heat flow, respectively. This method permits the
simultaneous calculation of the heat capacity of the
sample. Based on a Discrete Fourier Transformation,
the measured amplitudes of modulation of tempera-
ture and heat flow are compared to a reference signal
of the same frequency, calculating the heat capacity. A
schematic representation of Cp curves around glass
transition is illustrated in Fig. 2. The increase of Cp
occurs during the transition from that of glass to
amorphous in a sigmoidal way. Hence, an equivalent
endothermic heat flow increase corresponds to the first
term of Eq. 1.
TL-DSC scans annealing first at 165 �C for 5 min
to remove the thermal history. Modulated cooling and
Table 3 Interlaboratory results on studied binders through
heating calorimetric scans
Sample Glass transition temperature, Tg (�C)
Lab1 Lab2 Lab5 Lab12
Bit1 - 13.3 - 10.5 - 16.6 - 14.5
Bit2 - 22.5 - 14.4 - 23.3 - 18.3
PmB1 - 23.2 - 16.9 - 25.1 - 16.8
PmB2 - 25.7 - 19.2 - 25.0 - 22.0
Materials and Structures (2021) 54:132 Page 5 of 15 132

heating rates were then imposed on the samples using
a superimposed periodic sine wave temperature per-
turbation. Lab2 and Lab5 applied two modulation
methodologies.
In TM-DSC applied by Lab2 (DSC Q2000, TA),
samples were equilibrated at 165 �C for 5 min and
then cooled to - 90 �C at 5 �C/min with ± 0.5 �Cmodulation every 80 s. The samples were then
equilibrated for 5 min and then heated to 165 �C at
2 �C/min with the same modulation (average measur-
ing rate: 1 data point per 1.2 s). The DSC tool used by
Lab2 provided the total and the two individual heat
flow components of scanned samples. Moreover, in
TM-DSC applied by Lab5 (DSC, PerkinElmer),
samples cooled rate of 2 �C/min to - 60 �C, equili-
brated at - 60 �C for 5 min and then heated to 165 �Cat 2 �C/min, with 0.5 �C modulation every 60 s
(average measuring rate: 1 data point per 1 s). All
the provided Tg values from both TM-DSC protocols
were determined as the temperature at the half-height
between the heat capacity of onset and endpoint of the
glass transition region, as shown in Fig. 2.
Fig. 1 Typical TM-DSC profile and heat flow generated versus time in calorimetric scans (top) and a detailed graph of TM-DSC profile
with the blue dotted line and orange line to demonstrate the underlying temperature and heat flow respectively (bottom)
132 Page 6 of 15 Materials and Structures (2021) 54:132
3 Results and discussion
3.1 TL-DSC
In Fig. 3, the TL-DSC thermographs, from Lab1, of
heat flow and its 1st derivative of Bit1 and Bit2 binders
are shown during heating (left) and cooling (right)
scans, with their Tg values to be almost the same
between the labs. Similarly, the thermographs of
PmB1 and PmB2 binders generated by Lab1, with the
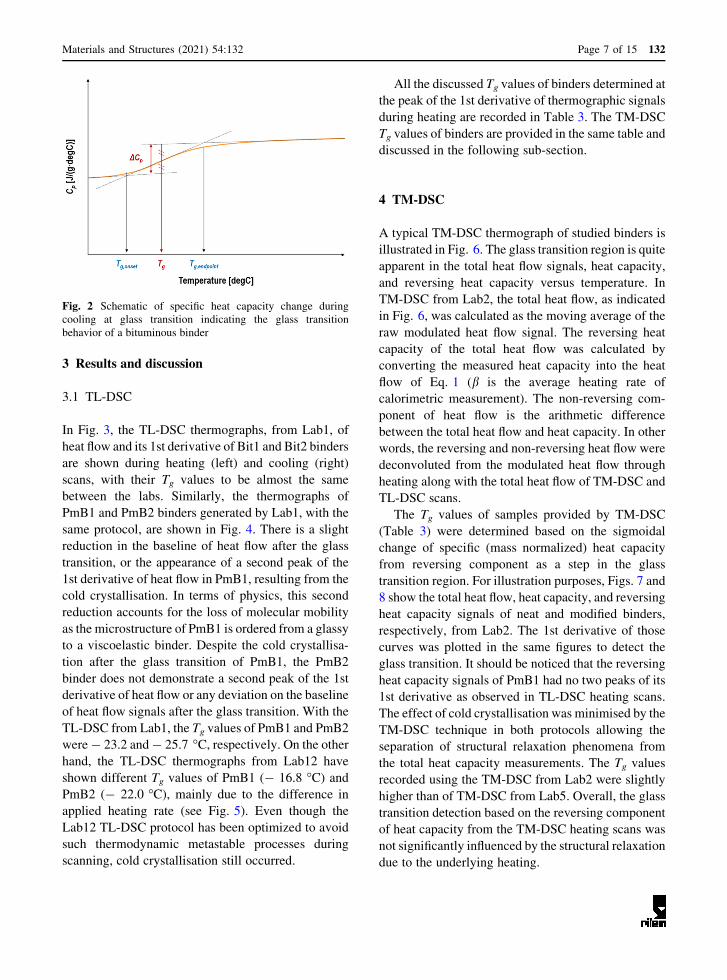
same protocol, are shown in Fig. 4. There is a slight
reduction in the baseline of heat flow after the glass
transition, or the appearance of a second peak of the
1st derivative of heat flow in PmB1, resulting from the
cold crystallisation. In terms of physics, this second
reduction accounts for the loss of molecular mobility
as the microstructure of PmB1 is ordered from a glassy
to a viscoelastic binder. Despite the cold crystallisa-
tion after the glass transition of PmB1, the PmB2
binder does not demonstrate a second peak of the 1st
derivative of heat flow or any deviation on the baseline
of heat flow signals after the glass transition. With the
TL-DSC from Lab1, the Tg values of PmB1 and PmB2
were - 23.2 and - 25.7 �C, respectively. On the other
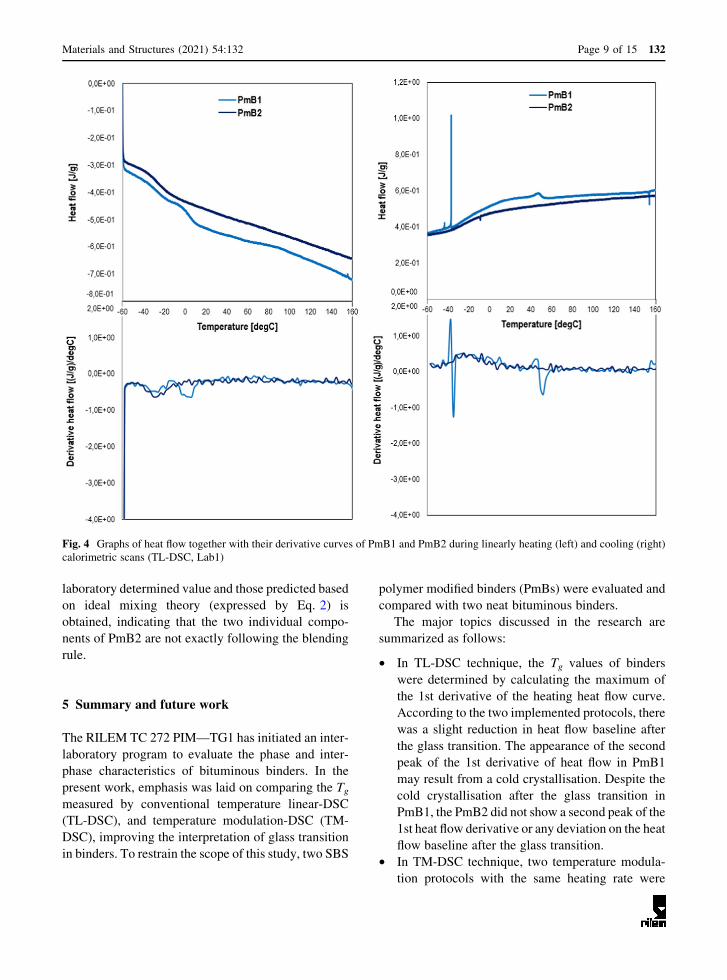
hand, the TL-DSC thermographs from Lab12 have
shown different Tg values of PmB1 (- 16.8 �C) and
PmB2 (- 22.0 �C), mainly due to the difference in
applied heating rate (see Fig. 5). Even though the
Lab12 TL-DSC protocol has been optimized to avoid
such thermodynamic metastable processes during
scanning, cold crystallisation still occurred.
All the discussed Tg values of binders determined at
the peak of the 1st derivative of thermographic signals
during heating are recorded in Table 3. The TM-DSC
Tg values of binders are provided in the same table and
discussed in the following sub-section.
4 TM-DSC
A typical TM-DSC thermograph of studied binders is
illustrated in Fig. 6. The glass transition region is quite
apparent in the total heat flow signals, heat capacity,
and reversing heat capacity versus temperature. In
TM-DSC from Lab2, the total heat flow, as indicated
in Fig. 6, was calculated as the moving average of the
raw modulated heat flow signal. The reversing heat
capacity of the total heat flow was calculated by
converting the measured heat capacity into the heat
flow of Eq. 1 (b is the average heating rate of
calorimetric measurement). The non-reversing com-
ponent of heat flow is the arithmetic difference
between the total heat flow and heat capacity. In other
words, the reversing and non-reversing heat flow were
deconvoluted from the modulated heat flow through
heating along with the total heat flow of TM-DSC and
TL-DSC scans.
The Tg values of samples provided by TM-DSC
(Table 3) were determined based on the sigmoidal
change of specific (mass normalized) heat capacity
from reversing component as a step in the glass
transition region. For illustration purposes, Figs. 7 and
8 show the total heat flow, heat capacity, and reversing
heat capacity signals of neat and modified binders,
respectively, from Lab2. The 1st derivative of those
curves was plotted in the same figures to detect the
glass transition. It should be noticed that the reversing
heat capacity signals of PmB1 had no two peaks of its
1st derivative as observed in TL-DSC heating scans.
The effect of cold crystallisation was minimised by the
TM-DSC technique in both protocols allowing the
separation of structural relaxation phenomena from
the total heat capacity measurements. The Tg values
recorded using the TM-DSC from Lab2 were slightly
higher than of TM-DSC from Lab5. Overall, the glass
transition detection based on the reversing component
of heat capacity from the TM-DSC heating scans was
not significantly influenced by the structural relaxation
due to the underlying heating.
Fig. 2 Schematic of specific heat capacity change during
cooling at glass transition indicating the glass transition
behavior of a bituminous binder
Materials and Structures (2021) 54:132 Page 7 of 15 132

4.1 Effect of SBS polymer on glass transition
of binders
The high vinyl SBS copolymer, consisting of polybu-
tadiene and polystyrene blocks, was blended with Bit2
to produce PmB2. The Tg values of Bit2 and PmB2
generated by the different protocols were discussed
above. The inclusion of 7.5% of the vinyl SBS
copolymer led to the reduction of Tg. As mentioned,
the Tg change can be used as an indicator of
compatibility among the components of a system.
Hence, DSC measurements were performed on the
pure polymer, and its glass transition was compared
with Bit2 and PmB2.
Figure 9 shows the thermographs of SBS polymer,
Bit2, and PmB2 generated by applying the TL-DSC:
(Lab1) through 2 �C/min of cooling and heating rate.
The polybutadiene part of the SBS copolymer exhib-
ited a sharp glass transition at - 47 �C. A glass
transition near 85 �C can be seen in the orange curves
of Fig. 9, which may be attributed to the polystyrene
part of the copolymer. With 7.5% of SBS polymer in
Bit2, the Tg values were shifted from - 22.5 to -
25.7 �C. The Tg reduction directly reflects the actual
influence of polybutadiene of SBS on bitumen,
manifesting the generation of a more resistant binder
against low temperature fracture.
Considering the fact that the PmB2 binder consists
7.5% of linear high vinyl SBS copolymer (Tg,SBS: -
47 �C) and 92.5% of Bit2 (Tg,Bit2: - 22.5 �C), then
according to Fox equation [37] expressed as
1
Tg;PmB¼ wSBS
Tg;SBSþ wBit
TgBitð2Þ
uthe predicted Tg value of PmB2 (Tg,PmB2) is -
23.4 �C, which is slightly higher than the actual Tgvalue (25.7 �C) determined based on the TL-DSC
(Lab1). Thus, a slight positive deviation between the
Fig. 3 Graphs of heat flow together with their derivative curves of Bit1 and Bit2 during linearly heating (left) and cooling (right)
calorimetric scans (TL-DSC, Lab1)
132 Page 8 of 15 Materials and Structures (2021) 54:132
laboratory determined value and those predicted based
on ideal mixing theory (expressed by Eq. 2) is
obtained, indicating that the two individual compo-
nents of PmB2 are not exactly following the blending
rule.
5 Summary and future work
The RILEM TC 272 PIM—TG1 has initiated an inter-
laboratory program to evaluate the phase and inter-
phase characteristics of bituminous binders. In the
present work, emphasis was laid on comparing the Tgmeasured by conventional temperature linear-DSC
(TL-DSC), and temperature modulation-DSC (TM-
DSC), improving the interpretation of glass transition
in binders. To restrain the scope of this study, two SBS
polymer modified binders (PmBs) were evaluated and
compared with two neat bituminous binders.
The major topics discussed in the research are
summarized as follows:
• In TL-DSC technique, the Tg values of binders
were determined by calculating the maximum of
the 1st derivative of the heating heat flow curve.
According to the two implemented protocols, there
was a slight reduction in heat flow baseline after
the glass transition. The appearance of the second
peak of the 1st derivative of heat flow in PmB1
may result from a cold crystallisation. Despite the
cold crystallisation after the glass transition in
PmB1, the PmB2 did not show a second peak of the
1st heat flow derivative or any deviation on the heat
flow baseline after the glass transition.
• In TM-DSC technique, two temperature modula-
tion protocols with the same heating rate were
Fig. 4 Graphs of heat flow together with their derivative curves of PmB1 and PmB2 during linearly heating (left) and cooling (right)
calorimetric scans (TL-DSC, Lab1)
Materials and Structures (2021) 54:132 Page 9 of 15 132
implemented. It was noticed that the reversing heat
capacity signals of PmB1 did not show a second
peak of the 1st derivative as observed in TL-DSC
heating scans. The TM-DSC technique minimized
cold crystallisation by separating structural relax-
ation phenomena from the total heat capacity
measurements. The structural relaxation did not
significantly influence the glass transition detec-
tion based on the reversing component of heat
capacity from the TM-DSC heating scans due to
the underlying heating. This study confirmed that
the TM-DSC is a more robust and precise
technique than the TL-DSC.
• The bitumen modification by 7.5 wt% vinyl SBS
led to the Tg reduction reflecting the positive
influence of SBS at low temperatures.
Further research is needed to obtain an in-depth
understanding of the effect of chemical composi-
tion on the thermal behavior of bituminous binders
using DSC. Some recommendations for future
Fig. 5 Graphs of heat flow together with their derivative curves of Bit1 and Bit2 (left), and PmB1 and PmB2 (right) during linearly
heating calorimetric scans (TL-DSC, Lab12)
-6.0E-01
-5.0E-01
-4.0E-01
-3.0E-01
-2.0E-01
-1.0E-01
0.0E+00
1.0E-01
2.0E-01
-60 -40 -20 0 20 40 60 80 100 120 140 160
Heat
flow
[mW
]
Temperature [degC]
Heat Flow [mW]Rev Heat Flow [mW]Nonrev Heat Flow [mW]
Fig. 6 Total, reversing and non-reversing heat flow of Bit1
during heating (TM-DSC, Lab2)
132 Page 10 of 15 Materials and Structures (2021) 54:132

Fig. 7 Graphs of Bit1 and
Bit2; a heat flow together
with their derivative curves
during linear temperature
cooling (TL-DSC), and
b total heat capacity and
c reversible heat capacity
with their derivative curves
during temperature
modulation heating (TM-
DSC, Lab2)
Materials and Structures (2021) 54:132 Page 11 of 15 132

Fig. 8 Graphs of PmB1 and
PmB2; a heat flow together
with their derivative curves
during linear temperature
cooling (TL-DSC), and
b total heat capacity and
c reversible heat capacity
with their derivative curves
during temperature
modulation heating (TM-
DSC, Lab2)
132 Page 12 of 15 Materials and Structures (2021) 54:132

studies to characterise such multiphase systems are
as follows:
• Binders from different origins may show different
DSC thermal responses mainly due to variations in
their chemical composition. As the fractions of
saturates, aromatics, resins, and asphaltenes and
their functional groups determine the chemistry of
bitumen, it would be beneficial to conduct both TL-
DSC and TM-DSC analyses in the individual
bituminous fractions to reveal their thermo-kinet-
ics characteristics.
• The current research presented the influence of
SBS on the glass transition in bituminous binders.
Since various additives and modifiers are available
to enhance the properties of binders, the investi-
gation of their effect on the thermal behavior of
bituminous binders is critical as well.
• The Fox equation was used in this study to predict
the ideal mixing glass transition of a PmB.
However, different additives and modifiers demon-
strate significantly different affinities with binders.
Therefore, the applicability of other prediction
schemes of the composition dependence of the Tgof modified binders should be assessed in a future
research.
• The correlation of glass transition temperature with
rheological properties could be established to
obtain a comprehensive picture of the thermo-
rheology of bituminous binders.
Declarations
Conflict of interest The authors declare that they have no
conflict of interest.
Fig. 9 Graphs of heat flow together with their derivative curves of Bit2, SBS polymer, and PmB2 (i.e., Bit2 together with 7.5% of SBS
polymer) during linearly heating (left) and cooling (right) calorimetric scans (TL-DSC, Lab1)
Materials and Structures (2021) 54:132 Page 13 of 15 132

Open Access This article is licensed under a Creative
Commons Attribution 4.0 International License, which
permits use, sharing, adaptation, distribution and reproduction
in any medium or format, as long as you give appropriate credit
to the original author(s) and the source, provide a link to the
Creative Commons licence, and indicate if changes were made.
The images or other third party material in this article are
included in the article’s Creative Commons licence, unless
indicated otherwise in a credit line to the material. If material is
not included in the article’s Creative Commons licence and your
intended use is not permitted by statutory regulation or exceeds
the permitted use, you will need to obtain permission directly
from the copyright holder. To view a copy of this licence, visit
http://creativecommons.org/licenses/by/4.0/.
References
1. Claudy P, Letoffe JM, King GN, Planche JP (1992) Char-
acterization of asphalts cements by thermomicroscopy and
differential scanning calorimetry: correlation to classic
physical properties. Fuel Sci Technol Int 10(4–6):735–765
2. Harrison IR, Wang G, Hsu TC (1992) A differential scan-
ning calorimetry study of asphalt binders. Strategic High-
way Research Program (SHRP). National Academy of
Sciences: Washington, D.C. SHRP-A/UFR-92-612
3. Turner TF, Branthaver JF (1997) DSC studies of asphalt and
asphalt components. Asphalt Science and Technology,
Marcel Dekker Inc., pp 59–101
4. Robertson RE, Branthaver JF, Harnsberger PM, Petersen
PC, Dorrence SM, McKay JF, Turner TF, Pauli AT, Huang
SC, Huh JD, Tauer JE (2001) Fundamental properties of
asphalts and modified asphalts, volume I: interpretive
report. Report No. FHWA-RD-99-212. Western Research
Institute
5. Masson JF, Polomark GM (2001) Bitumen microstructure
by modulated differential scanning calorimetry. Ther-
mochim Acta 374:105–114
6. Gill PS, Sauerbrunn SR, Reading M (1993) Modulate dif-
ferential scanning calorimetry. J Therm Anal 40:931–939
7. Schawe JEK (1995) A comparison of different evaluation
methods in modulated temperature DSC. Thermochim Acta
260:1–16
8. Reading M (2001) The use of modulated temperature pro-
grams in thermal methods. J Therm Anal Calorim 64:7–14
9. Simon SL (2001) Temperature-modulated differential
scanning calorimetry: theory and application. Thermochim
Acta 374:55–71
10. Frolov IN, Yusupova TN, Ziganshin MA, Okhotnikova ES,
Firsin AA (2017) Dynamics of formation of asphalt
microstructure according to modulated differential scanning
calorimetry data. Pet Chem 57(12):1002–1006
11. Qiu Y, Ding H, Zheng P (2020) Toward a better under-
standing of the low-temperature reversible aging phe-
nomenon in asphalt binder. Int J Pavem Eng. https://doi.org/
10.1080/10298436.2020.1740926
12. Masson JF, Bundalo-Perc S, Delgado A (2005) Glass
Transitions and mixed phases in block SBS. J Polym Sci
Part B Polym Phys 43:276–279
13. Khan AN, Hesp SAM (2019) Comparison between thermal,
rheological and failure properties for the performance
grading of asphalt cements. Constr Build Mater
220:196–205
14. Chailleux E, Queffelec C, Borghol I, Farcas F, Marceau S,
Bujoli B (2021) Bitumen fractionation: contribution of the
individual fractions to the mechanical behavior of road
binders. Constr Build Mater 271:121528
15. Cheung CY, Cebon D (1997) Deformation mechanisms of
pure bitumen. J Mater Civ Eng 9(3):117–129
16. Masson JF, Polomark GM, Collins P (2002) Time-depen-
dent microstructure of bitumen and its fractions by modu-
lated differential scanning calorimetry. Energy Fuels
16:470–476
17. Lesueur D (2009) The colloidal structure of bitumen: con-
sequences on rheology and on the mechanism of bitumen
modification. Advances in Colloidal and Interface Science
145:42–82
18. Redelius P, Soenen H (2015) Relation between bitumen
chemistry and performance. Fuel 140:34–43
19. Letoffe JM, Claudy P, Kok MV, Garcin M, Volle JL (1995)
Crude oils: characterization of waxes precipitated on cool-
ing by DSC and thermomicroscopy. Fuel 74:810–817
20. Claudy PM, Letoffe PM, Martin D, Planche JP (1998)
Thermal behavior of asphalt cements. Thermochim Acta
324:203–213
21. Chambrion P, Bertau R, Ehrburger P (1996) Characteriza-
tion of bitumen by differential scanning calorimetry. Fuels
75(2):144–148
22. Lu X, Redelius P (2007) Effect of bitumen wax on asphalt
mixture performance. Constr Build Mater 21:1961–1970
23. Kriz P, Stastna J, Zanzotto L (2007) Glass transition and
phase stability in asphalt binders. Road Mater Pavem
Design 9:37–65
24. Planche JP, Claudy PM, Letoffe JM, Martin D (1998) Using
thermal analysis methods to better understand asphalt rhe-
ology. Thermochim Acta 324(1):223–227
25. Elwardany MD, Planche JP, Adams JJ (2019) Determina-
tion of binder glass transition and crossover temperatures
using 4-mm plates on a dynamic shear rheometer. Transp
Res Rec 2673(10):247–260
26. Bahia H (1992) Low-temperature isothermal physical
hardening of asphalt cements. PhD dissertation. The Penn-
sylvania State University
27. Anderson DA, Marasteanu MO (1999) Physical hardening
of asphalt binders relative to their glass transition temper-
atures. Transp Res Rec 1661:27–34
28. Elwardany M, King G, Planche J-P, Rodezno C, Christensen
D, Fertig RS III, Kuhn KT, Bhuiyan FH (2019) Internal
restraint damage mechanism for age-induced pavement
surface distresses: block cracking and raveling. J Assoc
Asphalt Paving Technol 88:1–47
29. Elwardany M, Planche JP, King G (2020) Universal and
practical approach to evaluate asphalt binder resistance to
thermally-induced surface damage. Constr Build Mater
255:119331
30. Ho RM, Adedeji A, Giles DW, Hajduk DA, Macosko CW,
Bates FS (1997) Microstructure of triblock copolymers in
asphalt oligomers. J Polym Sci Part B Polym Phys
35:2857–2877
132 Page 14 of 15 Materials and Structures (2021) 54:132
31. Fawcett AH, McNally T (2001) Blends of bitumen with
polymers having a styrene component. Polym Eng Sci
41(7):1251–1264
32. Kamiya S, Tasaka S, Zhang X, Dong D, Inagaki N (2001)
Compatibilizer role of styrene-butadiene-styrene triblock
copolymer in asphalt. Polym J 33(3):209–213
33. Varma R, Takeichi H, Hall JE, Ozawa YF, Kyu T (2002)
Miscibility studies on blends of kraton block copolymer and
asphalt. Polymer 43:4667–4671
34. Masson JF, Polomark G, Collins P (2005) Glass transitions
and amorphous phases in sbs-bitumen blends. Thermochim
Acta 436:96–100
35. Adams JJ, Elwardany MD, Planche J-P, Boysen RB, Rovani
JF (2019) Diagnostic techniques for various asphalt refining
and modification methods. Energy Fuels 33:2680–2698
36. Porot L, Chailleux E, Apostolidis P, Zhu J, Margaritis A,
Tsantilis L (2020) Complex bituminous binders, are current
test methods suitable for?. RILEM International Sympo-
sium on Bituminous Materials, Lyon, France
37. Fox TG (1956) Influence of diluent and copolymer com-
position on the glass temperature of a polymer system. Bull
Am Phys Soc 1:123
Publisher’s Note Springer Nature remains neutral with
regard to jurisdictional claims in published maps and
institutional affiliations.
Materials and Structures (2021) 54:132 Page 15 of 15 132


