Global Boxboard Market ReviewSailing in a World of Volatility and Uncertainty
Alejandro MataSenior Economist, European Forest Products
RISI Asian Conference
May 2018
© Copyright 2018 RISI, Inc. | Proprietary Information
2
• Bachelor’s degree in Engineering, MBA degree earned in 2007
• Worked in business and market intelligence functions for one of Europe’s leading paper producers
• Has been analyzing and forecasting the industry since 2009
• Author of the Paper Trader Europe, Paper Packaging Monitor Europe, the European Graphic 5-Year and 15-Year Forecasts and the European Paper Packaging 5-Year and 15-Year Forecasts
Senior Economist, European Forest Products
Alejandro Mata
© Copyright 2018 RISI, Inc. | Proprietary Information
3© Copyright 2018 RISI, Inc. | Proprietary Information
Economic Tailwind Boosting Demand
4
…But What If the Wind Changes?© Copyright 2018 RISI, Inc. | Proprietary Information

27.8
12.2
9.5
4.5
3.0
1.3 1.20.3
-
5.0
10.0
15.0
20.0
25.0
30.0
Asia NorthAmerica
WesternEurope
EasternEurope
Latin America Middle East Africa Oceania
Bo
xbo
ard
De
man
d 2
01
7(M
illio
n T
on
ne
s)Large markets, fast growing
Large, mature markets
Lower consumption levels, high growth
Bo
xbo
ard
De
man
d in
Key
Re
gio
ns
5© Copyright 2018 RISI, Inc. | Proprietary Information
6© Copyright 2018 RISI, Inc. | Proprietary Information
-4%
-2%
0%
2%
4%
6%
8%
10%
-2.0
-1.0
0.0
1.0
2.0
3.0
4.0
5.0
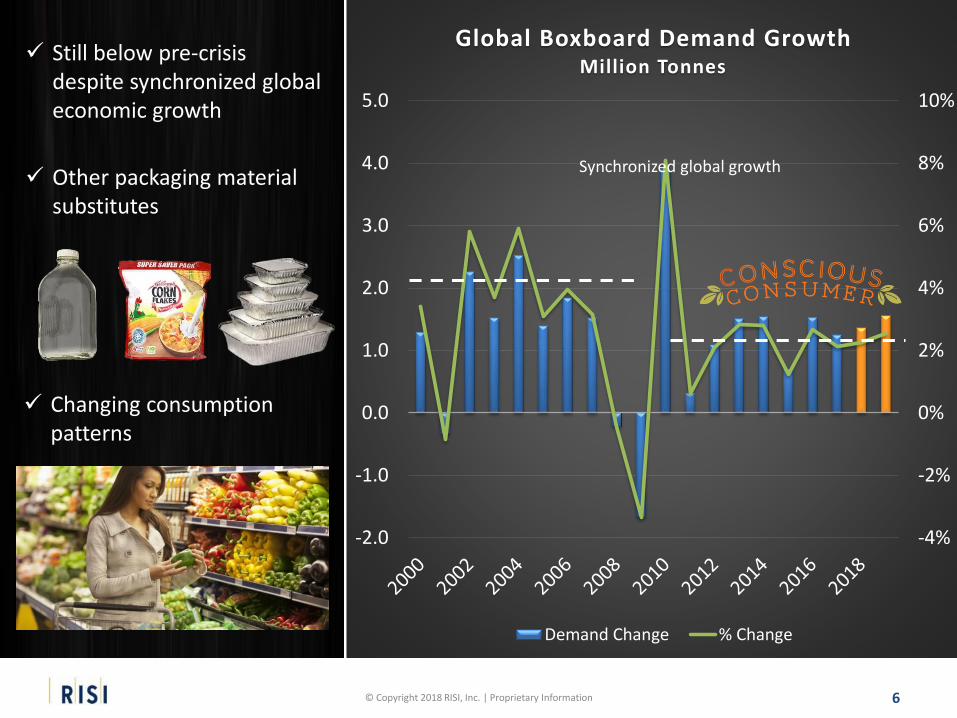
Global Boxboard Demand GrowthMillion Tonnes
Demand Change % Change
Synchronized global growth
Still below pre-crisis despite synchronized global economic growth
Other packaging material substitutes
Changing consumption patterns

7© Copyright 2018 RISI, Inc. | Proprietary Information

8© Copyright 2018 RISI, Inc. | Proprietary Information
9© Copyright 2018 RISI, Inc. | Proprietary Information
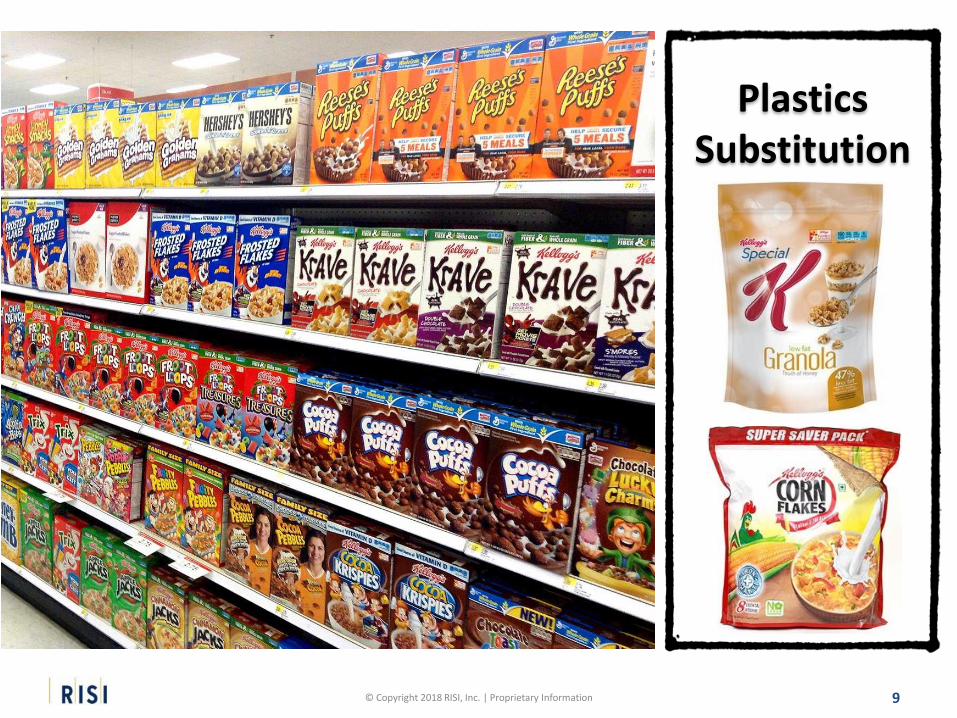
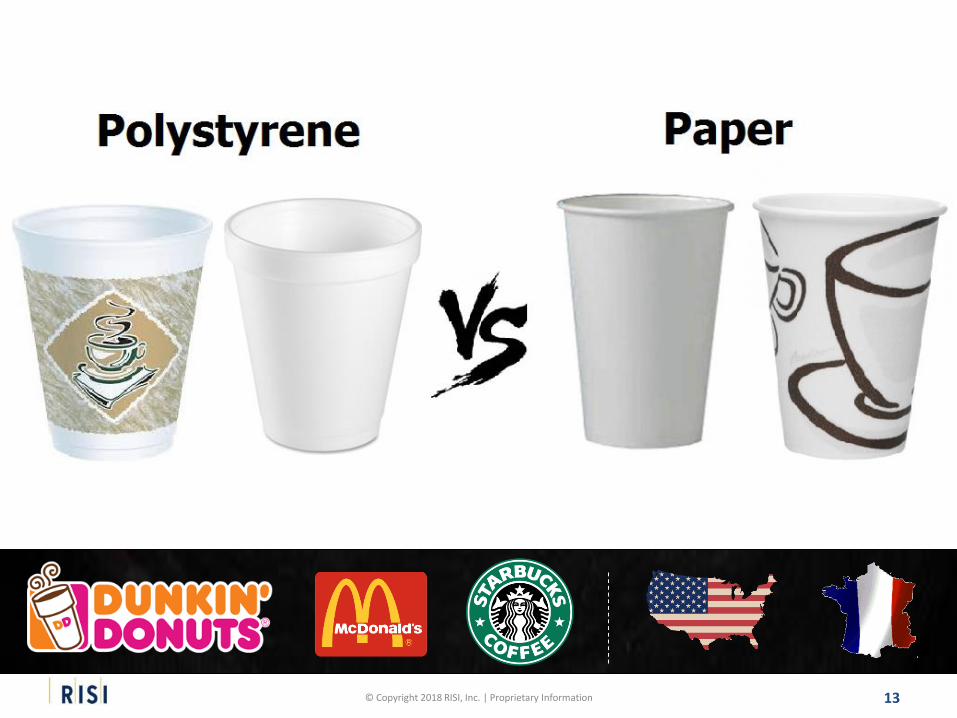
Plastics Substitution
10© Copyright 2018 RISI, Inc. | Proprietary Information
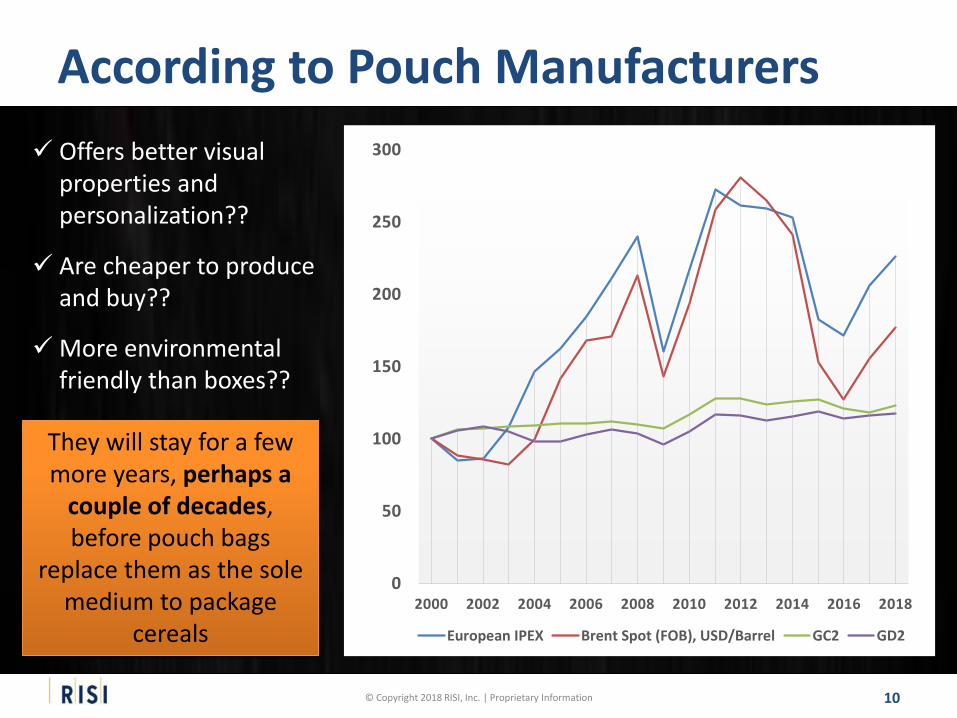
Offers better visual properties and personalization??
Are cheaper to produce and buy??
More environmental friendly than boxes??
They will stay for a few more years, perhaps a
couple of decades, before pouch bags
replace them as the sole medium to package
cereals
According to Pouch Manufacturers
0
50
100
150
200
250
300
2000 2002 2004 2006 2008 2010 2012 2014 2016 2018
European IPEX Brent Spot (FOB), USD/Barrel GC2 GD2
11© Copyright 2018 RISI, Inc. | Proprietary Information
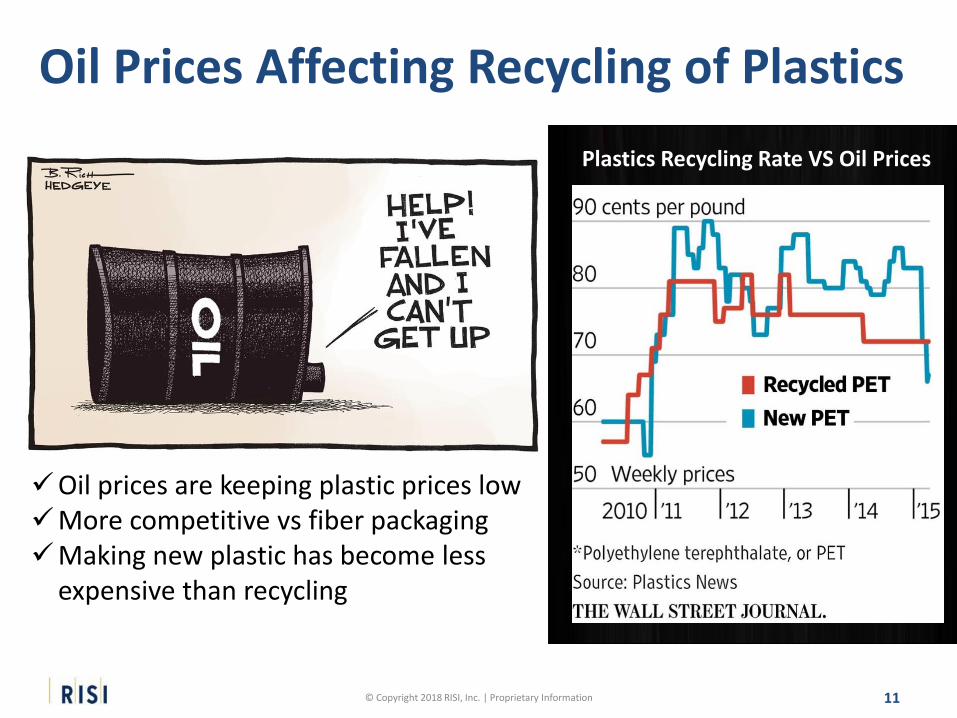
Oil prices are keeping plastic prices lowMore competitive vs fiber packagingMaking new plastic has become less
expensive than recycling
Oil Prices Affecting Recycling of Plastics
Plastics Recycling Rate VS Oil Prices
12© Copyright 2018 RISI, Inc. | Proprietary Information
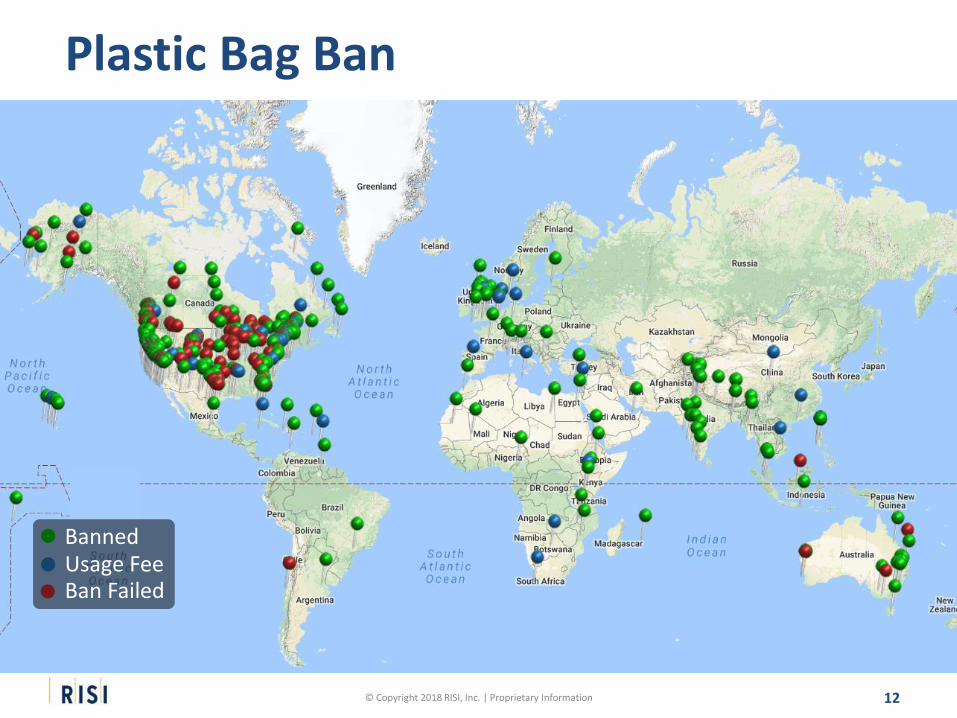
Map of countries banning plastics
Plastic Bag Ban
BannedUsage FeeBan Failed
13© Copyright 2018 RISI, Inc. | Proprietary Information
14© Copyright 2018 RISI, Inc. | Proprietary Information
78%
80%
82%
84%
86%
88%
90%
-2.0
-1.0
0.0
1.0
2.0
3.0
4.0
5.0
Op
era
tin
g R
ate
Gro
wth
in
Mil
lio
n T
on
ne
s
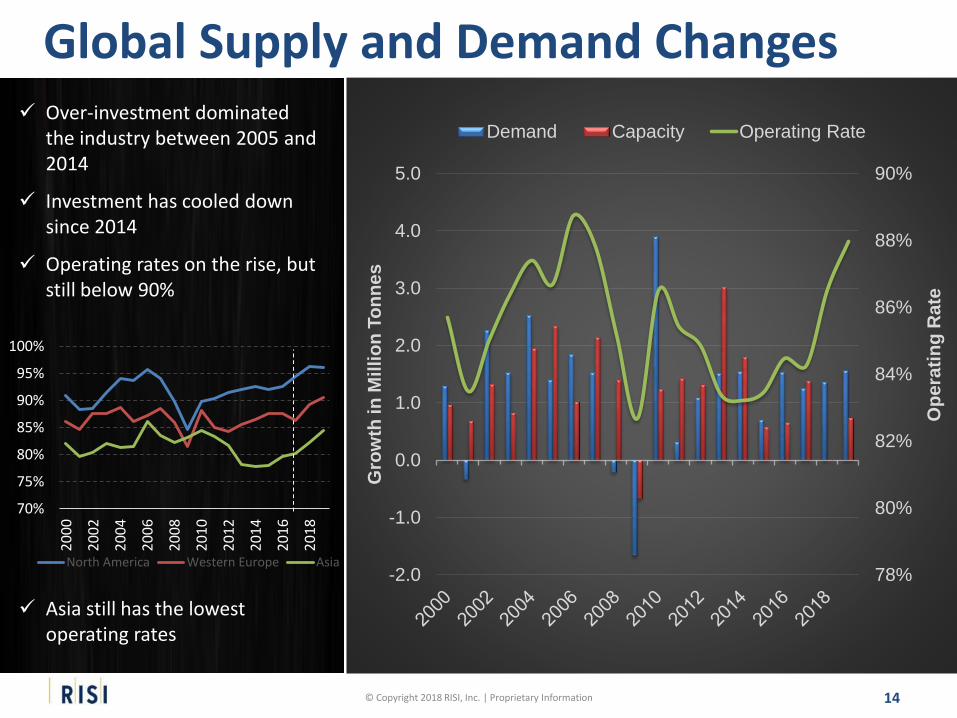
Demand Capacity Operating Rate Over-investment dominated
the industry between 2005 and 2014
Investment has cooled down since 2014
Operating rates on the rise, but still below 90%
70%
75%
80%
85%
90%
95%
100%
20
00
20
02
20
04
20
06
20
08
20
10
20
12
20
14
20
16
20
18
North America Western Europe Asia
Asia still has the lowest operating rates
Global Supply and Demand Changes
15© Copyright 2018 RISI, Inc. | Proprietary Information
0.0
0.1
0.2
0.3
0.4
0.5
0.6C
HA
NG
E (M
ILLI
ON
TO
NN
ES)
-0.3
-0.2
-0.1
0.0
0.1
0.2
0.3
0.4
CH
AN
GE
(MIL
LIO
N T
ON
NES
)
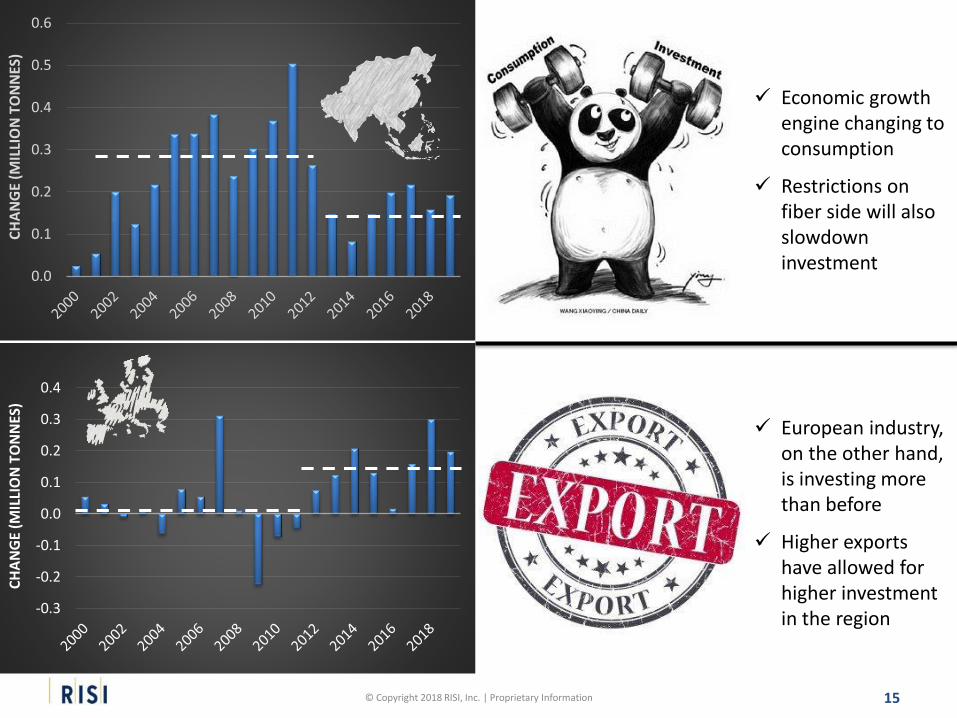
Economic growth engine changing to consumption
Restrictions on fiber side will also slowdown investment
European industry, on the other hand, is investing more than before
Higher exports have allowed for higher investment in the region
16© Copyright 2018 RISI, Inc. | Proprietary Information
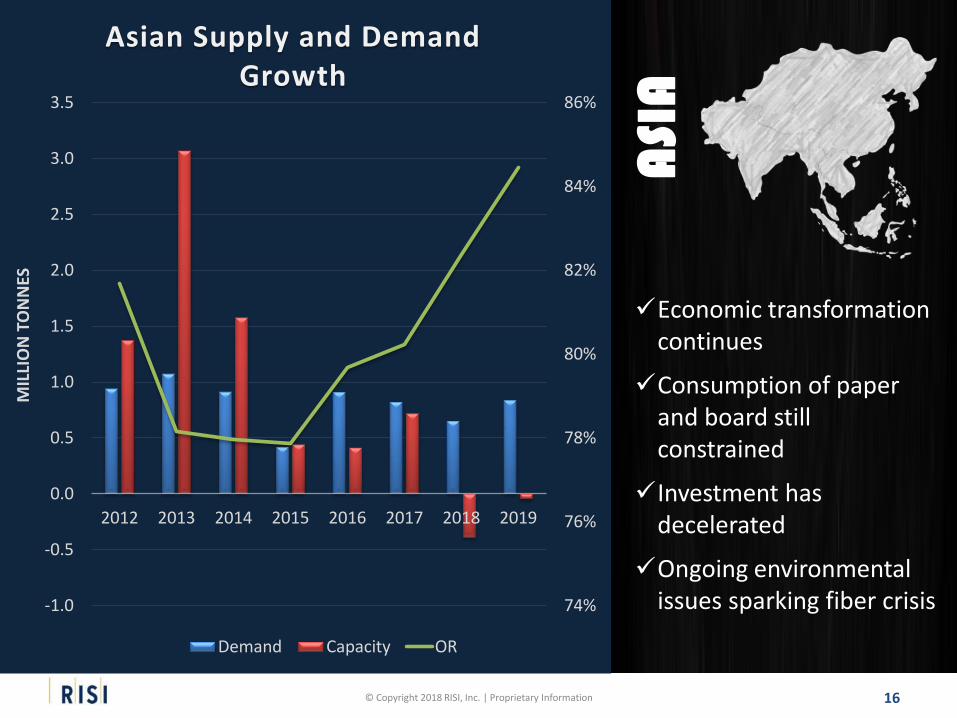
74%
76%
78%
80%
82%
84%
86%
-1.0
-0.5
0.0
0.5
1.0
1.5
2.0
2.5
3.0
3.5
2012 2013 2014 2015 2016 2017 2018 2019
MIL
LIO
N T
ON
NES
Asian Supply and Demand Growth
Demand Capacity OR
Economic transformation continues
Consumption of paper and board still constrained
Investment has decelerated
Ongoing environmental issues sparking fiber crisis
ASI
A
17© Copyright 2018 RISI, Inc. | Proprietary Information
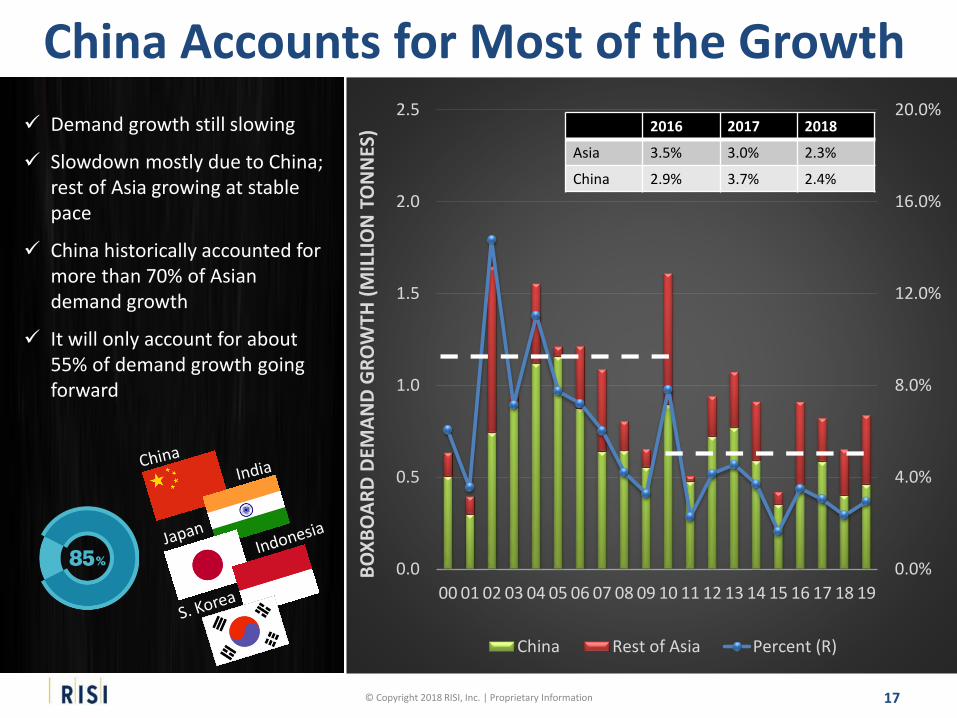
0.0%
4.0%
8.0%
12.0%
16.0%
20.0%
0.0
0.5
1.0
1.5
2.0
2.5
00 01 02 03 04 05 06 07 08 09 10 11 12 13 14 15 16 17 18 19
BO
XB
OA
RD
DEM
AN
D G
RO
WTH
(M
ILLI
ON
TO
NN
ES)
China Rest of Asia Percent (R)
Demand growth still slowing
Slowdown mostly due to China; rest of Asia growing at stable pace
China historically accounted for more than 70% of Asian demand growth
It will only account for about 55% of demand growth going forward
2016 2017 2018
Asia 3.5% 3.0% 2.3%
China 2.9% 3.7% 2.4%
China Accounts for Most of the Growth
18© Copyright 2018 RISI, Inc. | Proprietary Information
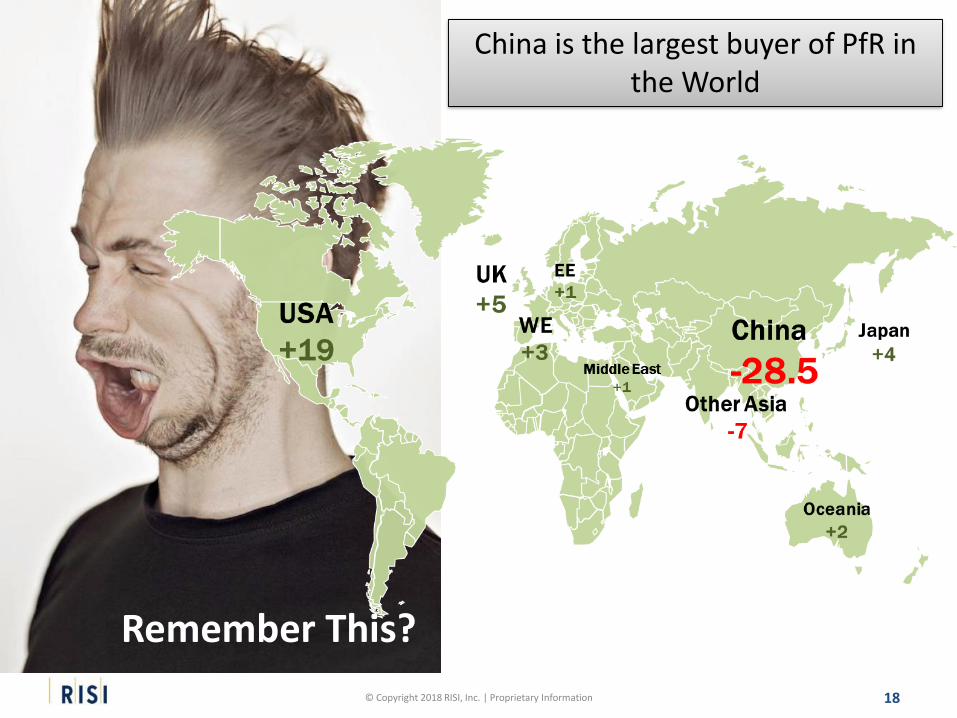
Remember This?
China is the largest buyer of PfR in the World
19© Copyright 2018 RISI, Inc. | Proprietary Information
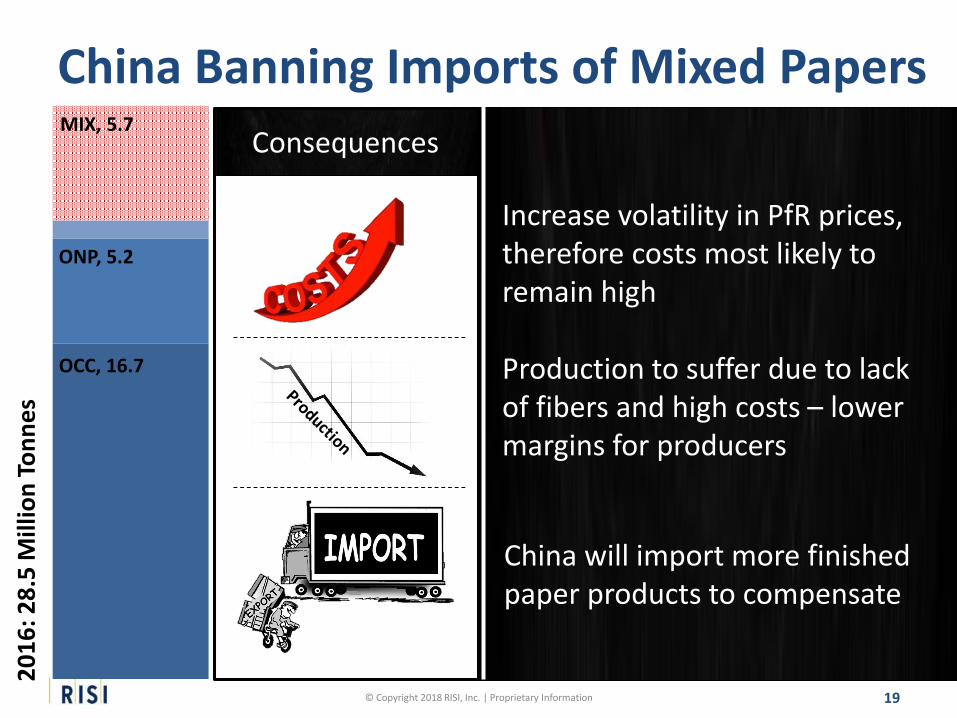
China Banning Imports of Mixed Papers2
01
6: 2
8.5
Mill
ion
To
nn
es
MIX, 5.7
ONP, 5.2
OCC, 16.7
Increase volatility in PfR prices, therefore costs most likely to remain high
Consequences
Production to suffer due to lack of fibers and high costs – lower margins for producers
China will import more finished paper products to compensate
20© Copyright 2018 RISI, Inc. | Proprietary Information
China Banning Imports of Mixed Papers
How to compensate for the missing fiber?
Increase domestic collection?
More market pulp?
Imports of finished paper products?
Diverting fiber away from low margin paper & board grades (graphics) ?
21© Copyright 2018 RISI, Inc. | Proprietary Information
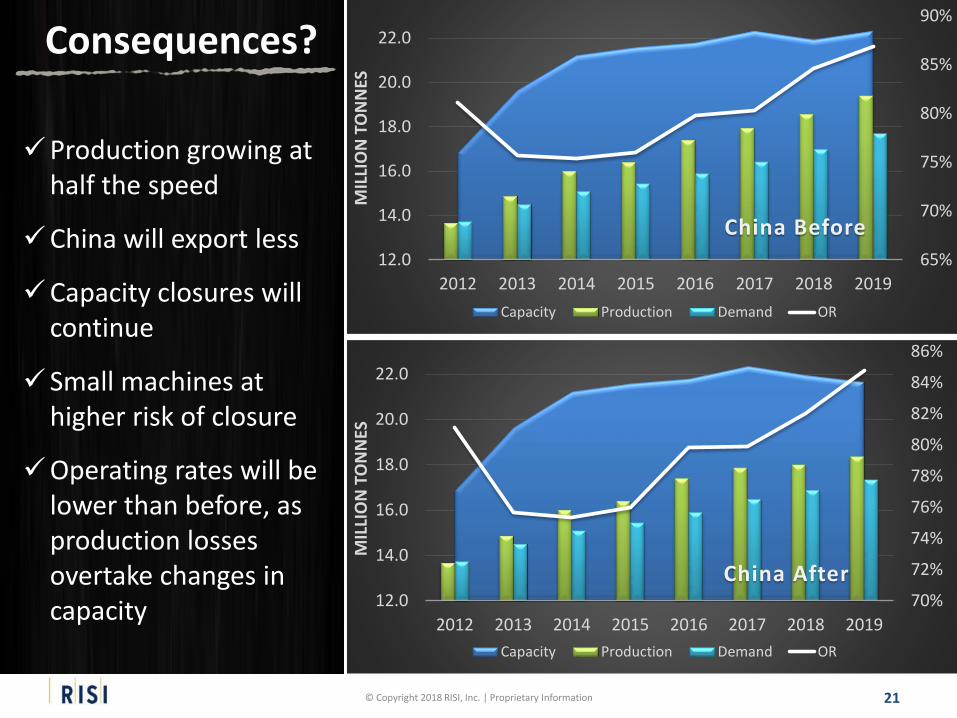
Consequences?
65%
70%
75%
80%
85%
90%
12.0
14.0
16.0
18.0
20.0
22.0
2012 2013 2014 2015 2016 2017 2018 2019
MIL
LIO
N T
ON
NES
China Before
Capacity Production Demand OR
70%
72%
74%
76%
78%
80%
82%
84%
86%
12.0
14.0
16.0
18.0
20.0
22.0
2012 2013 2014 2015 2016 2017 2018 2019
MIL
LIO
N T
ON
NES
China After
Capacity Production Demand OR
Production growing at half the speed
China will export less
Capacity closures will continue
Small machines at higher risk of closure
Operating rates will be lower than before, as production losses overtake changes in capacity
22© Copyright 2018 RISI, Inc. | Proprietary Information
0
200
400
600
800
1,000
1,200
1,400
1,600
1,800
2,000
-2.0
-1.5
-1.0
-0.5
0.0
0.5
1.0
1.5
2.0
2.5
00 02 04 06 08 10 12 14 16 18
BO
XB
OA
RD
NET
IMP
OR
TS (
MIL
LIO
N T
ON
NES
)
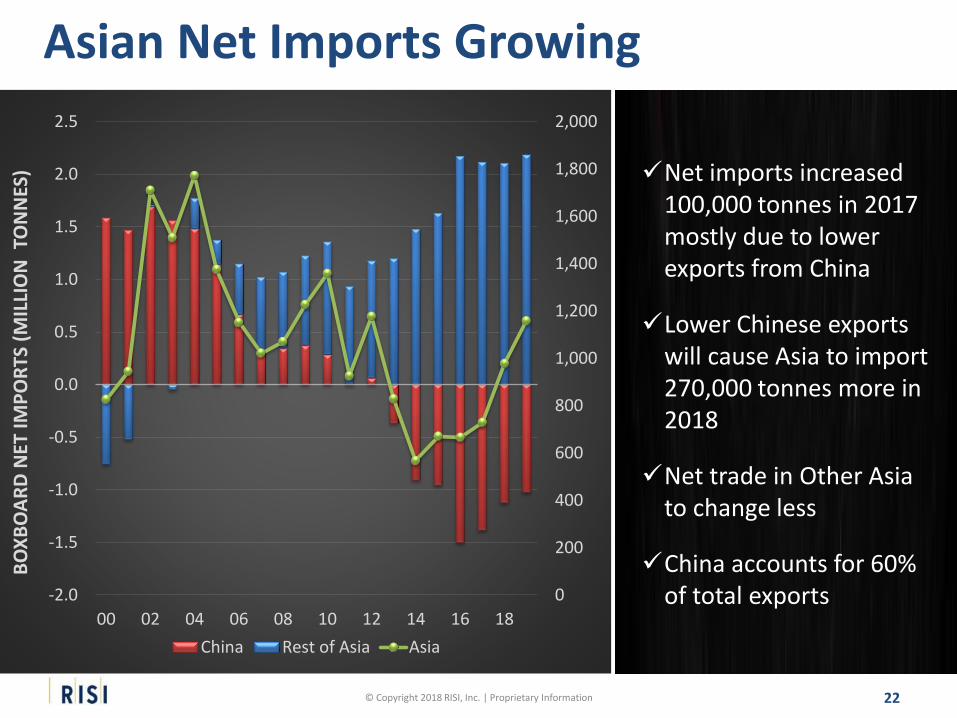
China Rest of Asia Asia
Net imports increased 100,000 tonnes in 2017 mostly due to lower exports from China
Lower Chinese exports will cause Asia to import 270,000 tonnes more in 2018
Net trade in Other Asia to change less
China accounts for 60% of total exports
Asian Net Imports Growing
23© Copyright 2018 RISI, Inc. | Proprietary Information
-1.0%
0.0%
1.0%
2.0%
3.0%
4.0%
5.0%
6.0%
7.0%
8.0%
0.0
2.0
4.0
6.0
8.0
10.0
12.0
2012 2013 2014 2015 2016 2017 2018 2019
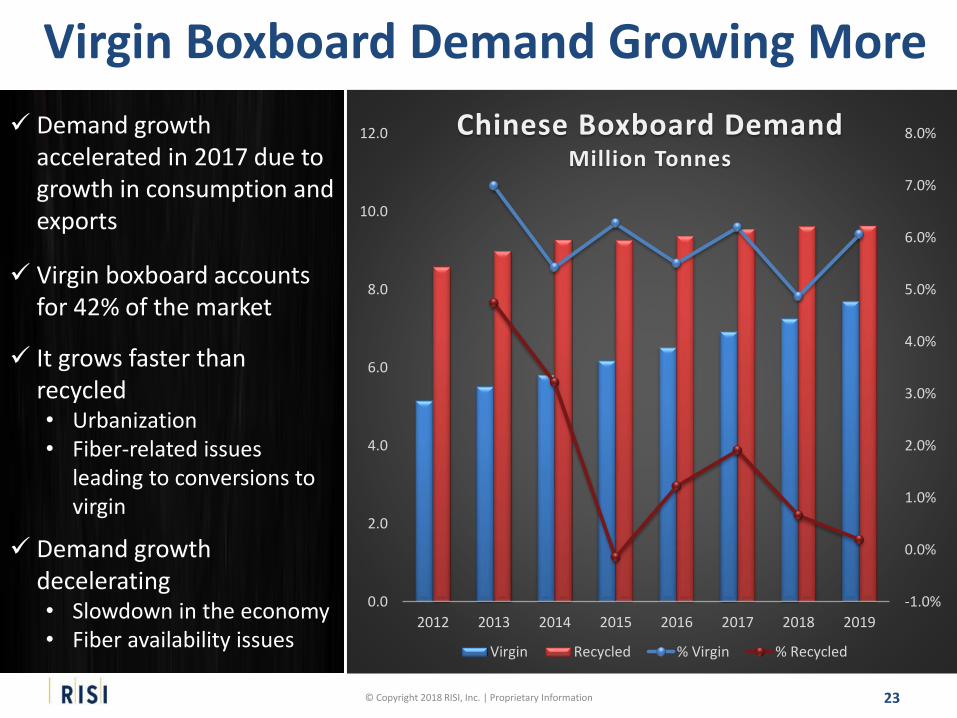
Chinese Boxboard Demand Million Tonnes
Virgin Recycled % Virgin % Recycled
Demand growth accelerated in 2017 due to growth in consumption and exports
Virgin boxboard accounts for 42% of the market
It grows faster than recycled • Urbanization • Fiber-related issues
leading to conversions to virgin
Demand growth decelerating• Slowdown in the economy• Fiber availability issues
Virgin Boxboard Demand Growing More
24© Copyright 2018 RISI, Inc. | Proprietary Information
0.0
2.0
4.0
6.0
8.0
10.0
12.0
14.0
16.0
2012 2013 2014 2015 2016 2017 2018 2019
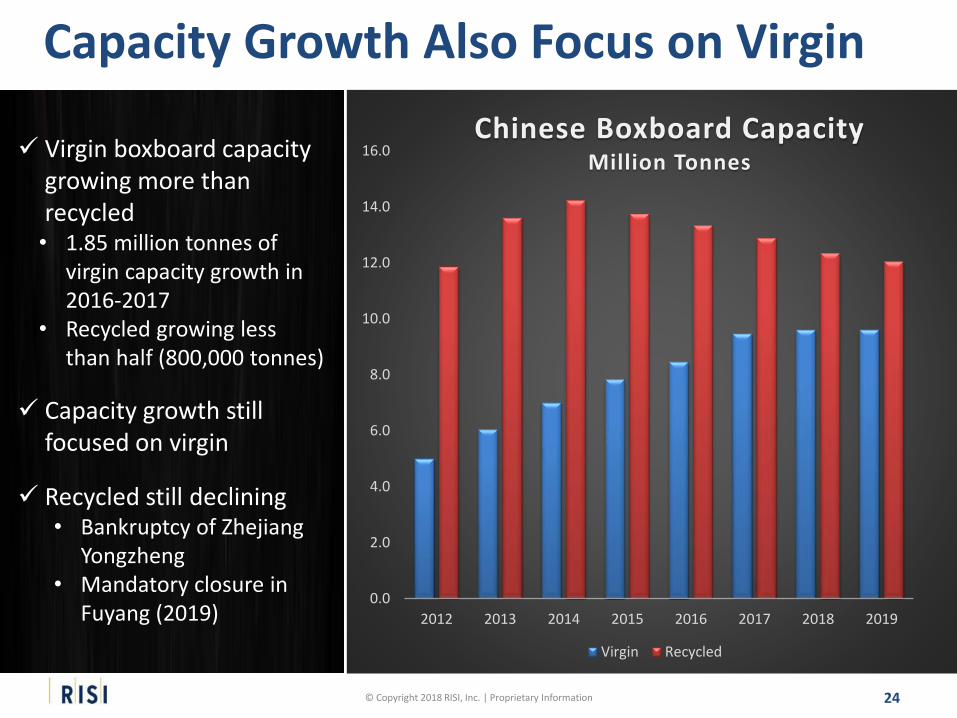
Chinese Boxboard CapacityMillion Tonnes
Virgin Recycled
Virgin boxboard capacity growing more than recycled• 1.85 million tonnes of
virgin capacity growth in 2016-2017
• Recycled growing less than half (800,000 tonnes)
Capacity growth still focused on virgin
Recycled still declining• Bankruptcy of Zhejiang
Yongzheng• Mandatory closure in
Fuyang (2019)
Capacity Growth Also Focus on Virgin
25© Copyright 2018 RISI, Inc. | Proprietary Information
60%
65%
70%
75%
80%
85%
90%
95%
100%
0.0
2.0
4.0
6.0
8.0
10.0
12.0
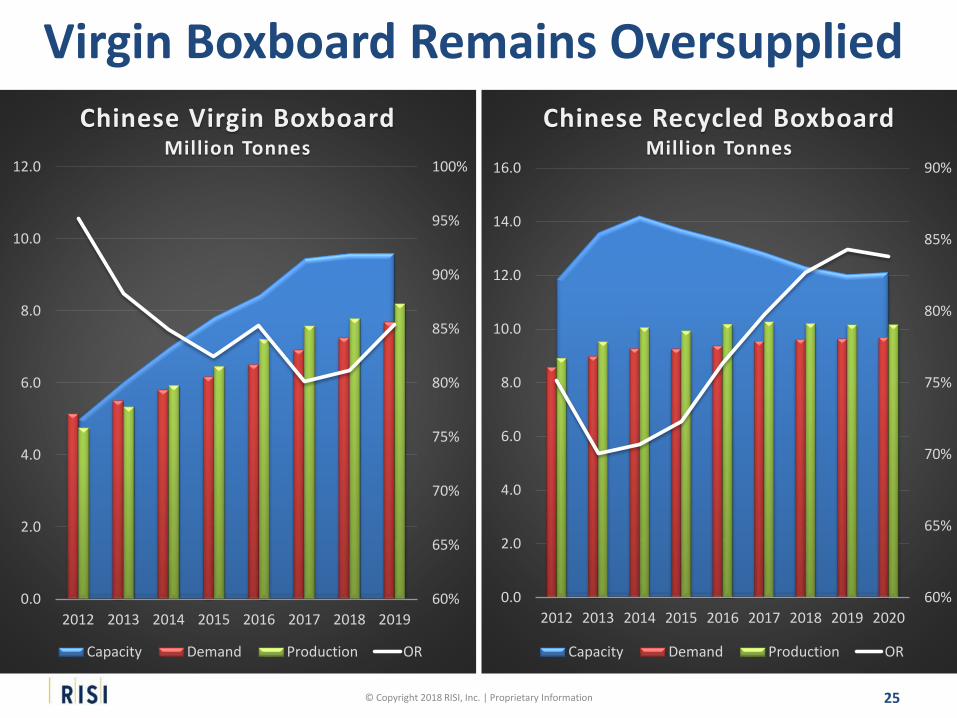
2012 2013 2014 2015 2016 2017 2018 2019
Chinese Virgin BoxboardMillion Tonnes
Capacity Demand Production OR
60%
65%
70%
75%
80%
85%
90%
0.0
2.0
4.0
6.0
8.0
10.0
12.0
14.0
16.0
2012 2013 2014 2015 2016 2017 2018 2019 2020
Chinese Recycled BoxboardMillion Tonnes
Capacity Demand Production OR
Virgin Boxboard Remains Oversupplied
26© Copyright 2018 RISI, Inc. | Proprietary Information
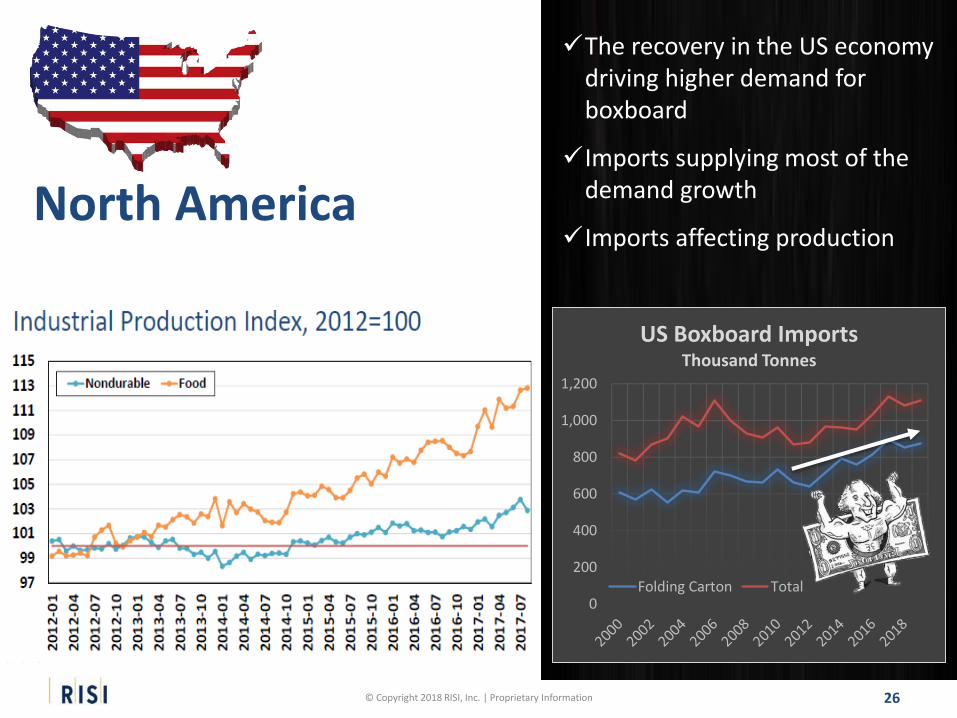
North America
The recovery in the US economy driving higher demand for boxboard
Imports supplying most of the demand growth
Imports affecting production
0
200
400
600
800
1,000
1,200
US Boxboard Imports Thousand Tonnes
Folding Carton Total
27© Copyright 2018 RISI, Inc. | Proprietary Information
300
400
500
600
700
800
900
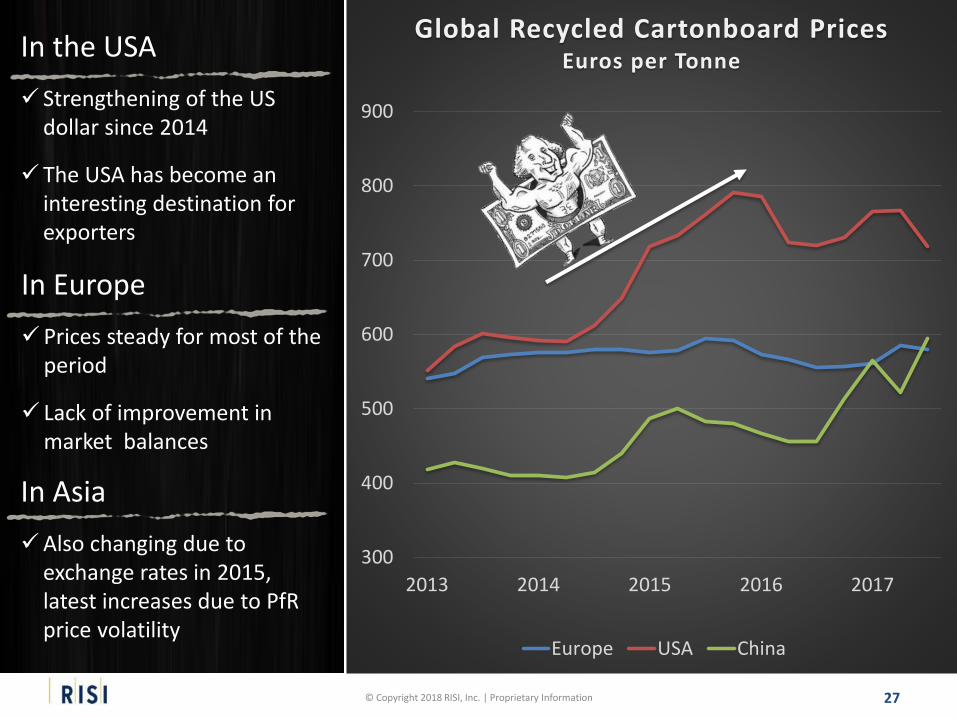
2013 2014 2015 2016 2017
Global Recycled Cartonboard PricesEuros per Tonne
Europe USA China
In the USA
Strengthening of the US dollar since 2014
The USA has become an interesting destination for exporters
In Europe
Prices steady for most of the period
Lack of improvement in market balances
In Asia
Also changing due to exchange rates in 2015, latest increases due to PfRprice volatility
28© Copyright 2018 RISI, Inc. | Proprietary Information
Vir
gin
Mar
kets
Do
ing
Bet
ter
Ch
alle
ngi
ng
Co
nd
itio
ns
in t
he
CR
B M
arke
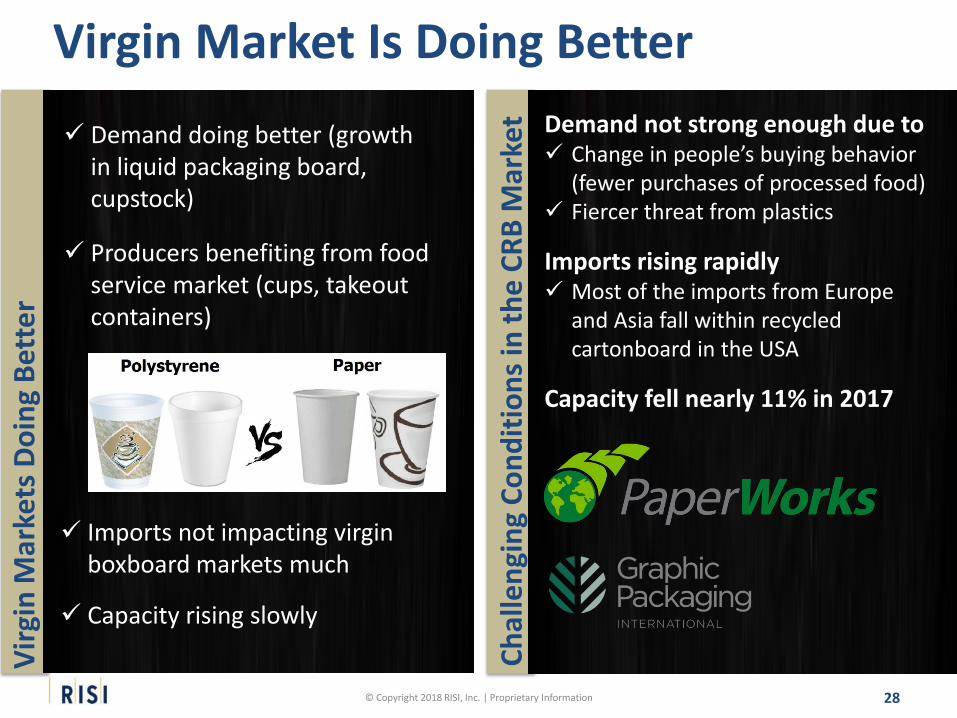
t Demand not strong enough due to Change in people’s buying behavior
(fewer purchases of processed food) Fiercer threat from plastics
Imports rising rapidly Most of the imports from Europe
and Asia fall within recycled cartonboard in the USA
Capacity fell nearly 11% in 2017
Demand doing better (growth in liquid packaging board, cupstock)
Producers benefiting from food service market (cups, takeout containers)
Imports not impacting virgin boxboard markets much
Capacity rising slowly
Virgin Market Is Doing Better
29© Copyright 2018 RISI, Inc. | Proprietary Information
86.0%
87.0%
88.0%
89.0%
90.0%
91.0%
92.0%
93.0%
-300
-200
-100
0
100
200
300
400
500
600
2012 2013 2014 2015 2016 2017 2018 2019
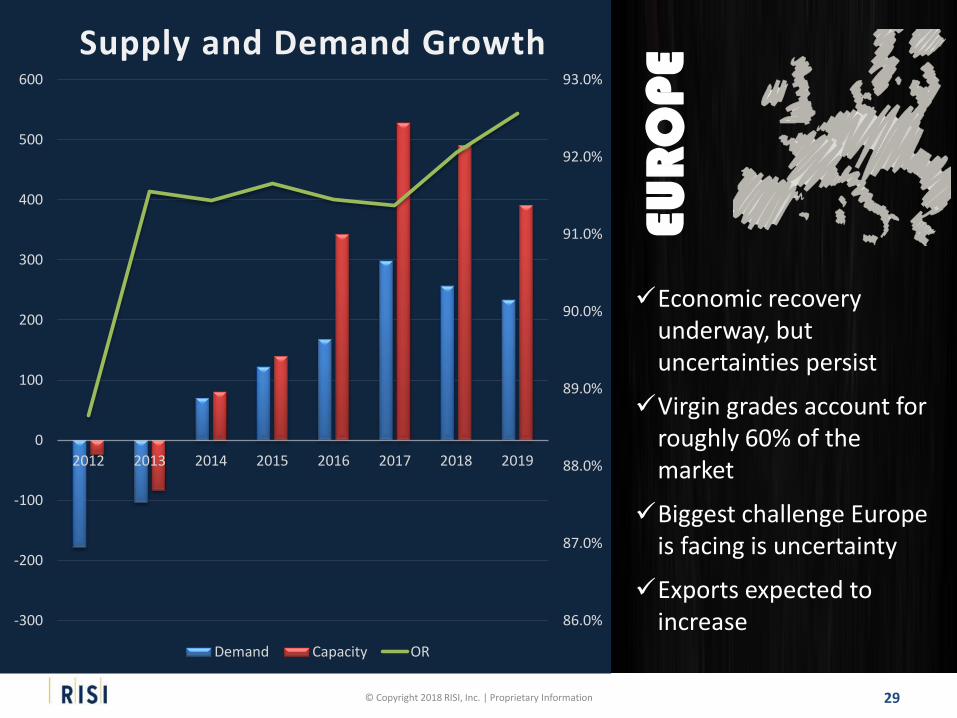
Supply and Demand Growth
Demand Capacity OR
Economic recovery underway, but uncertainties persist
Virgin grades account for roughly 60% of the market
Biggest challenge Europe is facing is uncertainty
Exports expected to increase
EUR
OPE
30© Copyright 2018 RISI, Inc. | Proprietary Information
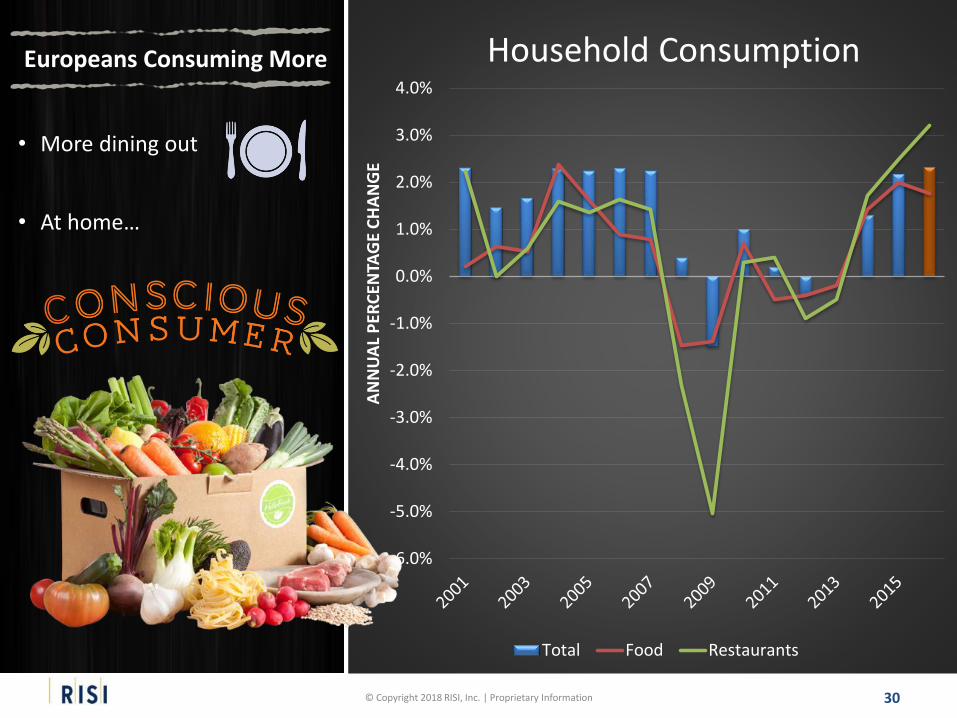
• More dining out
Europeans Consuming More
• At home…
-6.0%
-5.0%
-4.0%
-3.0%
-2.0%
-1.0%
0.0%
1.0%
2.0%
3.0%
4.0%
AN
NU
AL
PER
CEN
TAG
E C
HA
NG
E
Total Food Restaurants
Household Consumption
31© Copyright 2018 RISI, Inc. | Proprietary Information
-50
-40
-30
-20
-10
0
10
20
30
40
50
Mar
-08
No
v-0
8
Jul-
09
Mar
-10
No
v-1
0
Jul-
11
Mar
-12
No
v-1
2
Jul-
13
Mar
-14
No
v-1
4
Jul-
15
Mar
-16
No
v-1
6
Jul-
17
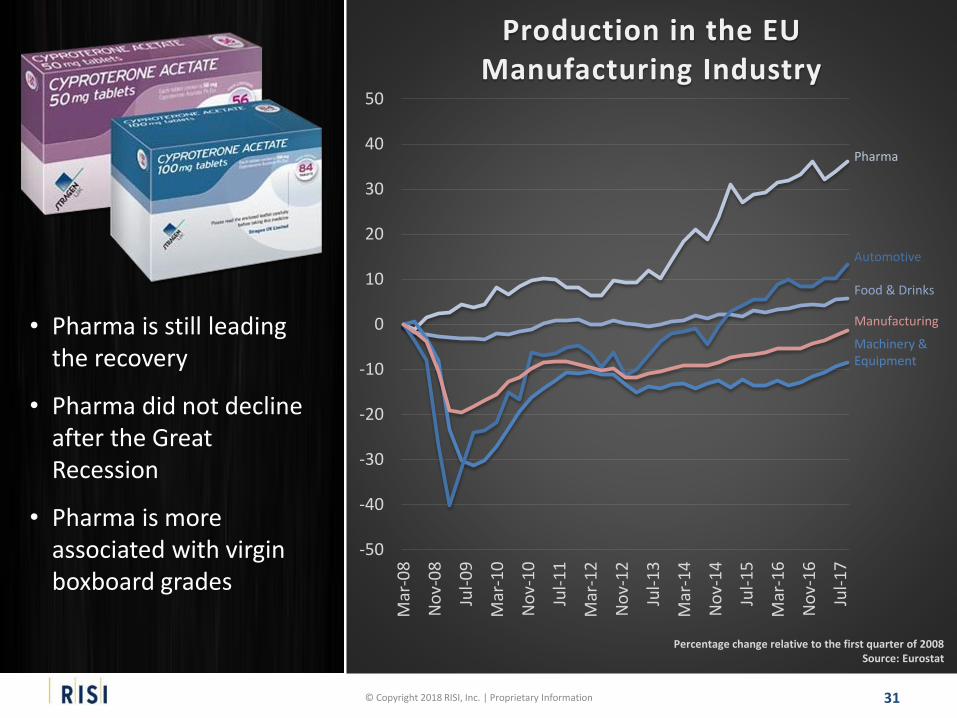
Production in the EU Manufacturing Industry
• Pharma is still leading the recovery
• Pharma did not decline after the Great Recession
• Pharma is more associated with virgin boxboard grades
Pharma
Automotive
Food & Drinks
Manufacturing
Machinery & Equipment
Percentage change relative to the first quarter of 2008Source: Eurostat
32© Copyright 2018 RISI, Inc. | Proprietary Information
86%
87%
88%
89%
90%
91%
92%
93%
2012 2013 2014 2015 2016 2017 2018 2019
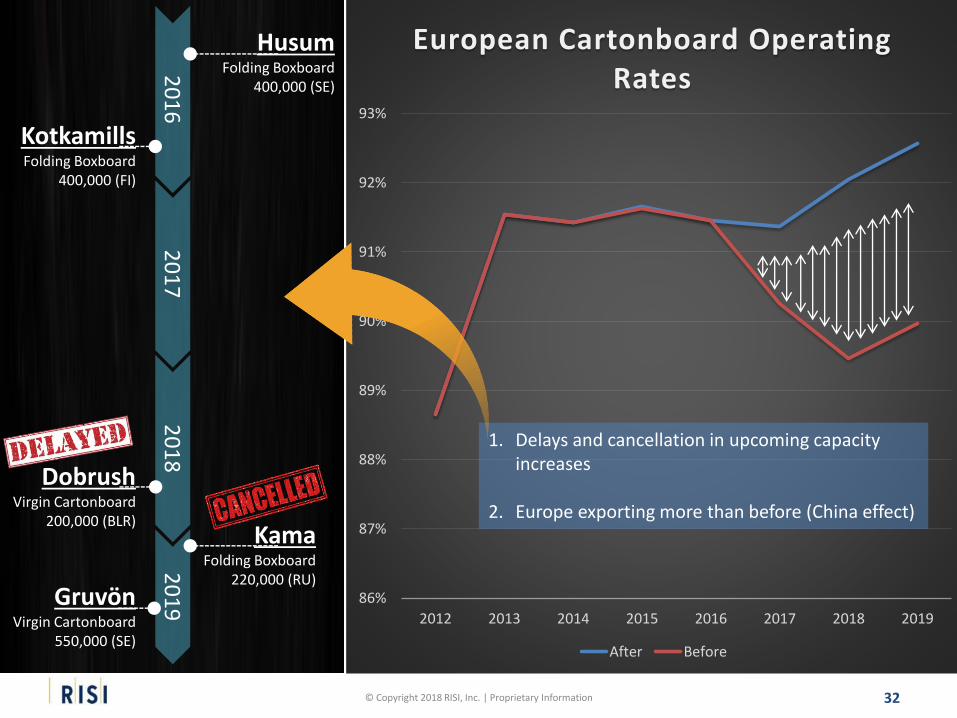
European Cartonboard Operating Rates
After Before
1. Delays and cancellation in upcoming capacity increases
2. Europe exporting more than before (China effect)
20
16
20
17
20
18
20
19
KotkamillsFolding Boxboard
400,000 (FI)
HusumFolding Boxboard
400,000 (SE)
DobrushVirgin Cartonboard
200,000 (BLR)Kama
Folding Boxboard220,000 (RU)
GruvönVirgin Cartonboard
550,000 (SE)
33© Copyright 2018 RISI, Inc. | Proprietary Information
600
650
700
750
800
850
900
950
1,000
1,050
1,100
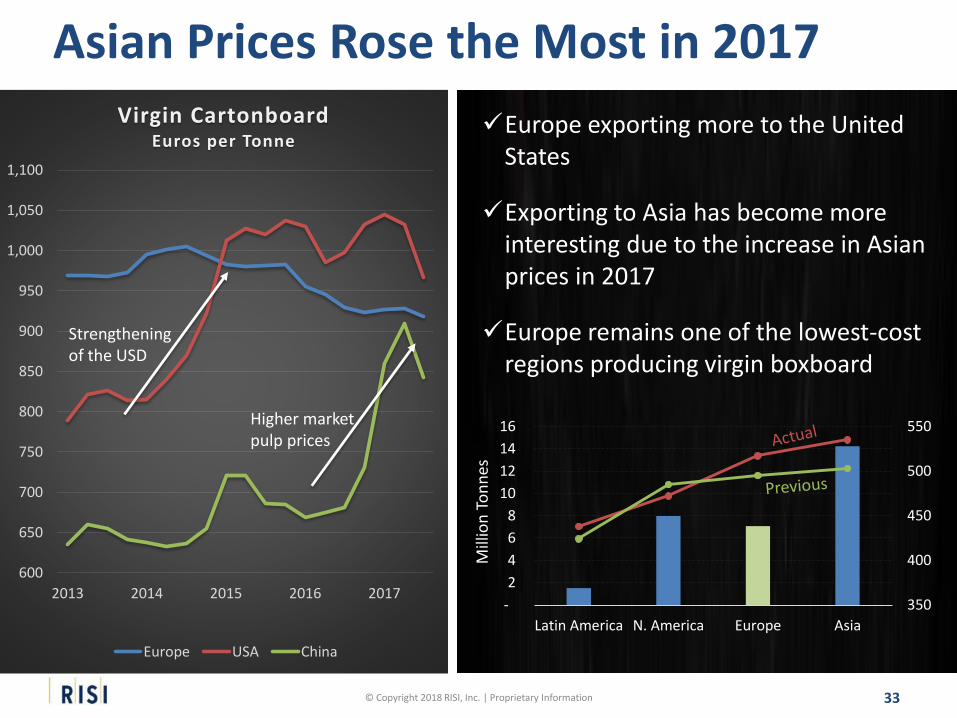
2013 2014 2015 2016 2017
Virgin CartonboardEuros per Tonne
Europe USA China
Strengthening of the USD
Higher market pulp prices
350
400
450
500
550
-
2
4
6
8
10
12
14
16
Latin America N. America Europe Asia
Mill
ion
To
nn
es
Europe exporting more to the United States
Exporting to Asia has become more interesting due to the increase in Asian prices in 2017
Europe remains one of the lowest-cost regions producing virgin boxboard
Asian Prices Rose the Most in 2017

34© Copyright 2018 RISI, Inc. | Proprietary Information
Questions?
35
European Paper Packaging 5-Year and 15-Year Forecasts
www.risi.com/forecasts
Paper Packaging Monitor Europe
www.risi.com/ppme
Thank you!For more information:
© Copyright 2018 RISI, Inc. | Proprietary Information


