
© 2015 IHS. ALL RIGHTS RESERVED.
GLOBAL CHEMICAL
INDUSTRY UPDATE
Chris Wheeler, Principal Analyst- Olefins
IHS Chemical
Presented at the Houston Business Roundtable
January 20, 2016

© 2015 IHS. ALL RIGHTS RESERVED.
IHS – Who we are and what we do
2
Agriculture
Electronics &
Telecom
Government
Metals &
Mining Healthcare
Financial
Military &
Security
Chemicals
Automotive
Energy
Coal
Transportation
Shipping
Aerospace &
Defense
Construction
Power &
Utilities
Energy
Oil & Gas
Consumer
& Retail

© 2015 IHS. ALL RIGHTS RESERVED.
IHS Chemical – Our portfolio
3
Chemical Insights
Aromatics & Fibers
Olefins & Derivatives
Chlor-Alkali & Vinyls
Plastics & Polymers
Syngas Chemicals
Specialty Chemicals
Special Studies
Technology & Analytics
Process Economics
Cost Curve Analytics
Capital Cost Services
Scenarios
Special Studies
Business Information &
Same-Day Analysis
Chemical Week
Chemical Company Analysis
Regional or Country Analysis
Directory of Chemicals Producers
Member Events
Consulting & Advisory Services
Strategy
Commercial Analysis
Transaction
Legal Services
Technology
Renewables
Specialties
Training

© 2015 IHS. ALL RIGHTS RESERVED.
The petrochemical value chain is extensive
4
Presentation Name / Month 2015
Oil, Gas
Production
Hydrocarbon
Feed
Monomer/Base
Chemicals
Resins Derivatives &
Intermediates
Converters: Pellets to bags,
film, bottles or fiber Manufactured
Goods
Retail Consumers

© 2015 IHS. ALL RIGHTS RESERVED.
Key Issues Being
Discussed in the
Global Chemical
Industry
Crude Oil Price Outlook
• V-shape / U-shape / L-shape recovery
Demand Growth & The Economy
• Low Crude as a demand stimulus
US NGL Supply
• Ethane & Propane availability
Need for infrastructure investment
to support expanding regional trade
5
CEO Roundtable Discussions at
AFPM, APIC, CPCIC, EPCA

© 2015 IHS. ALL RIGHTS RESERVED.
Key Issues Being
Discussed in the
Global Chemical
Industry
Non-conventional & On-Purpose
Production Technologies
China, China, China
• Shifting demand growth / slowing
economy / currency / stock market
• Coal-to-Chems / On-purpose / and
Conventional Investments
• Private Company Market Share
• Adoption of Responsible Care Charter
Lifting of Iran Sanctions Impact
“Sustainability”, GHG Emissions,
Carbon Tax, Bio-Based Chemicals
6
CEO Roundtable Discussions at
AFPM, APIC, CPCIC, EPCA
© 2015 IHS. ALL RIGHTS RESERVED.
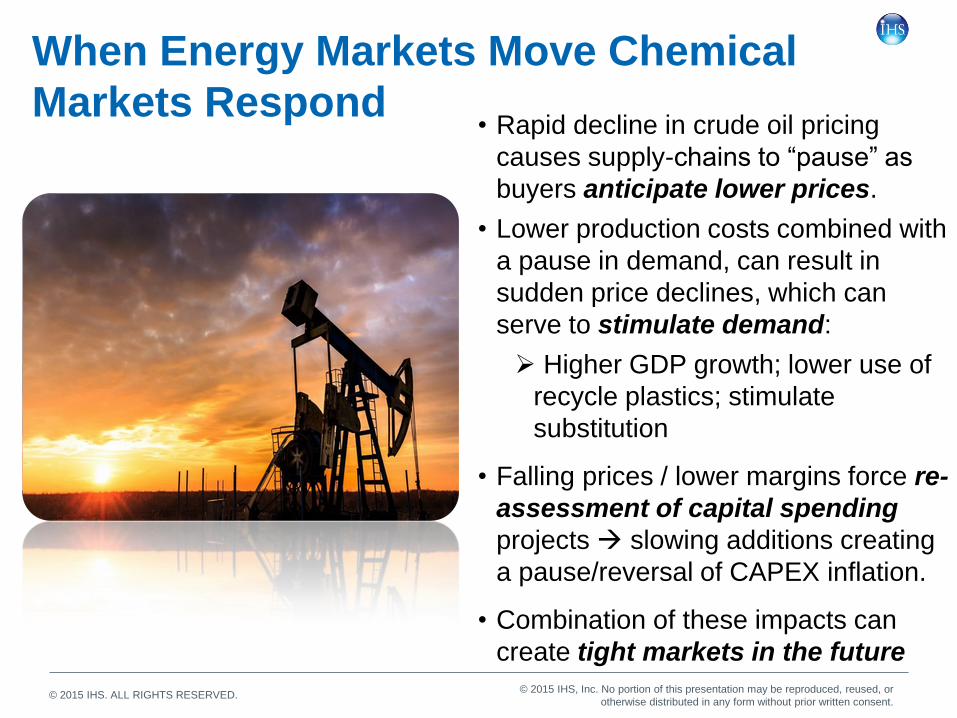
When Energy Markets Move Chemical
Markets Respond • Rapid decline in crude oil pricing
causes supply-chains to “pause” as
buyers anticipate lower prices.
• Lower production costs combined with
a pause in demand, can result in
sudden price declines, which can
serve to stimulate demand:
Higher GDP growth; lower use of
recycle plastics; stimulate
substitution
• Falling prices / lower margins force re-
assessment of capital spending
projects slowing additions creating
a pause/reversal of CAPEX inflation.
• Combination of these impacts can
create tight markets in the future
© 2015 IHS, Inc. No portion of this presentation may be reproduced, reused, or
otherwise distributed in any form without prior written consent.

© 2015 IHS. ALL RIGHTS RESERVED.
After Falling From the Cliff, Crude Prices Continue
Search of Bottom
Crude Oil Price Outlook to 2017
0
20
40
60
80
100
120
140
Brent - WTI
Brent FOB
Dubai FOB
WTI Cushing
Assumptions
Weak pricing will continue given
little decrease in US and OPEC
production levels
Demand growth is not sufficient
to absorb crude supply on offer
before 2H 2016
Strong US crude and product
inventories, lift of export ban
exacerbate downward pressure
Price forecast risks
Downside: Strong US production
continues amid prospects of price war
with return of Iranian production to
unsanctioned trading.
Upside: Complicated geopolitical
situation initiates price rally.
Unexpected increase in demand.
January 2016

© 2015 IHS. ALL RIGHTS RESERVED.
Global Crude Oil Inventories Are High,
and Are Creeping Higher
January 2016
Crude Oil Inventory
250
300
350
400
450
500
550
Jan Apr Jul Oct Jan Apr Jul Oct Jan
Mil
lio
n B
arr
els
Five-Year Range Five-Year Average Last 2 Years
Recent US Gasoline and Diesel stocks
are Close to 5 year High Levels
2014 2015
Seasonal drop
in US refinery
operating rates
Global crude inventory exceeded 60 days
of global supply (>5500 Million Barrels)
Source: Energy Information Administration (EIA)
China has been adding storage capacity
and increasing stored crude volume

© 2015 IHS. ALL RIGHTS RESERVED.
Demand Can Be Stimulated By Macro-economic
And Substitution Effects • Basic chemicals and
derivatives are the
fundamental building blocks
for many durable and non-
durable consumer goods.
• Global economic growth
drives the demand growth for
basic chemicals
• Low energy prices stimulate
economic growth; this will
translate into accelerated
growth for basic chemicals
• Lower relative prices spur
growth where chemicals can
substitute against other
materials

© 2015 IHS. ALL RIGHTS RESERVED.
Accelerated Demand Growth Can Drive Global
Utilization Rates Higher For Most Segments
0
2
4
6
8
10
12
0
2
4
6
8
10
12
Olefins Aromatics ECU Methanol Plastics BaseChemicals &
Plastics
Capacity IHS Base
Low Elasticity, Low GDP
High Elasticity, High GDP
Demand or Capacity Growth, %
• With the exception of methanol,
expected improvement in global
GDP drives demand growth
higher than forecast capacity
expansions
• IHS base forecast for most
segments sit at or below
historical average; plastics is
higher driven by substitution
assumptions
• Downside case would be
problematic for all value chains
except chlor-alkali (vinyls)
• Assuming GDP strengthens,
implication is that for most value
chains utilization rates will be
rising
Demand Growth Range vs. Capacity: 2016-2020

© 2015 IHS. ALL RIGHTS RESERVED.
0
50
100
150
200
250
2010 2011 2012 2013 2014 2015 2016 2017 2018 2019 2020
Ethylene Methanol Propylene Chlorine Paraxylene Benzene
Million Metric Tons
Global Base Chemicals Cumulative Demand Growth 2010 - 2020 = 224 Million Metric Tons
© 2015 IHS, Inc. No portion of this presentation may be reproduced, reused, or
otherwise distributed in any form without prior written consent.
Total
Growth
MM Tons
AAGR:
2010/20 MM
Tons/Yr
AAGR:
2010/20, %
Ethylene 61.6 5.6 3.5
Methanol 52.4 4.8 6.9
Propylene 47.8 4.3 4.2
Chlorine 28.1 2.6 3.6
Paraxylene 19.4 1.8 4.5
Benzene 14.7 1.3 2.3

© 2015 IHS. ALL RIGHTS RESERVED.
Capital Investment Peaks 2013-2015; Asia Slows
Dramatically, N. America Accelerates, Middle
East Is Steady
0
25
50
75
100
125
150
2010 2011 2012 2013 2014 2015 2016 2017 2018 2019
ROW Europe S. America N. America Asia Pacific Middle East
Global Chemical CAPEX, 2014 US $ Billions

© 2015 IHS. ALL RIGHTS RESERVED.
• Lower crude price in the US
depress gas-based margins in
the near-term, but recovery
improves with energy and tighter
markets; ethane price rise
threatens ethylene/PE margins
• An assumption to a return of
normal operations and pressure
from trade, eases Europe off of
current supply-constrained highs
• Asia shows improvement going
forward as improving profits in
methanol and C/A margins offset
weakness in propylene
14
0
50
100
150
200
250
300
350
400
450
00 02 04 06 08 10 12 14 16 18 20
Global N. America W. Europe Asia
Global: Basic Chemicals & Plastics EBIT Comparison*
Source: IHS © 2015 IHS
Do
lla
rs P
er
Me
tric
To
ns
*Weighted Average Earnings Before Interest & Taxes
Global EBIT Will Pull Back Slightly In The Near-term
Before Accelerating As Demand Growth Exceeds Supply

© 2015 IHS. ALL RIGHTS RESERVED.
• North America (USA)
Leverage low cost natural gas based
chemicals into investments in ethylene,
propylene and methanol based derivatives.
Invest to establish export channels to
market that exceed historical norms
• Middle East (Saudi Arabia)
Moderated investment pace, diversified
feedslate to support downstream market
development and continued industrial
expansion well beyond ethylene chemistry
• North East Asia (China)
Strong domestic investment focused on
reducing import dependencies.
Leverage coal to chemicals technology
near term © 2015 IHS, Inc. No portion of this presentation may be reproduced, reused, or
otherwise distributed in any form without prior written consent.
Raw Material & Energy Costs
Demand Growth & Access to Markets
Technology &
Economies of Scale
Chemical Industry
Investments Seek A
Sustainable Advantage
Key Drivers For Investments In New Capacity
Will Vary By Region

© 2015 IHS. ALL RIGHTS RESERVED.
Top 5 Countries Adding Base Chemical Capacity 231 Million Tons from 2010 to 2020
0
20
40
60
80
100
120
China UnitedStates
SaudiArabia
S. Korea India
Chlorine Paraxylene Benzene
Methanol Propylene Ethylene
Million Metric Tons
Top five will add nearly 75%
of base chemical capacity.
China will dominate new
capacity, adding 45% of total
Investment capital has shifted to
North America, however, the vast
majority of new investment continues
to accelerate in Asia/Pacific,
dominated by China

© 2015 IHS. ALL RIGHTS RESERVED.
CHINA CHEMICAL
INDUSTRY
• Become “global leader”, beyond size, have core
proprietary technologies, competitive advantage,
global brand, international scope & breadth
• Global leadership role responding to energy
changes, changes in regional markets (Japan &
Korea), cutting edge of innovative solutions
• Understand chemical value-chain, from well-head to
consumers; understand China’s position at each
stage of the value-chain and developments needed
to be a leader
• Address over-capacity issues
• Shut down inefficient capacity with significant
environmental impact
• Restructure portfolio to replace imports related to
domestic product quality and performance
• Focus on supply-chain optimization
• Focus on strategic emerging industries – build
integrated clusters of innovative leading technology
chemicals; including specialty chemical clusters.

© 2015 IHS. ALL RIGHTS RESERVED.
Regional Trade Is Critical To Success In
The Global Chemical Industry
• Trade is an essential element of basic
chemical supply chains
• Low cost regions such as North
America and the Middle East will
export increasing volumes
• On-purpose technology will change
propylene trade patterns
• Significant investment in ships, ports,
and infrastructure is needed to
support increasing trade volumes
© 2015 IHS, Inc. No portion of this presentation may be reproduced, reused, or
otherwise distributed in any form without prior written consent.
5 Countries Adding 75% of Base Chemical
Capacity: 2010 to 2020 (231 MM Metric Tons)

© 2015 IHS. ALL RIGHTS RESERVED.
But Chemical Trade Continues To Globalize, Connecting
Advantaged Feeds With Markets, Labor And Capital
• Trade will continue to grow,
connecting resource-rich
geographies with high growth
markets.
• By 2020 global trade will have
more than doubled from 2000
levels, representing about 50%
of global production.
• Pressure on high-cost
producers servicing markets
targeted by advantaged
capacity will intensify.
• Global supply-chain expertise
and well crafted go-to-market
strategies increase in
importance.
19
0
100
200
300
400
500
0%
10%
20%
30%
40%
50%
Global: Total Trade & 2020 Exports, Base Chemicals & Plastics
Source: IHS © 2015 IHS
% o
f 2
02
0 P
rod
uc
tio
n E
xp
ort
ed
To
tal E
xp
ort
s, M
illio
n M
etr
ic T
on
s

© 2015 IHS. ALL RIGHTS RESERVED.
China Remains Central To Basic Chemical Trade
© 2015 IHS, Inc. No portion of this presentation may be reproduced, reused, or
otherwise distributed in any form without prior written consent.
0%
25%
50%
75%
0
20
40
60
05 10 15 20
Net Equi. Imports Domestic Demand
Self-Sufficiency
MM Metric Tons %, Self-Sufficiency
0%
25%
50%
75%
0
20
40
60
05 10 15 20
Net Equiv Exports Domestic Demand
Net Exports, % of Cap.
MM Metric Tons % of Capacity
US Ethylene Demand & Equivalent Trade China Ethylene Demand & Equivalent Trade

© 2015 IHS. ALL RIGHTS RESERVED.
The Impact of Energy
At The Extremes…
Summary of key
trends
• Basic chemicals and derivatives markets
adjust to “new energy” dynamics
• …lower energy and lower prices for
plastics can represent a demand stimulus
• Pause in capital project approval
combined with stronger demand growth
can result in tight markets for certain
value chains; higher margins
• Emerging changes in China market will
continue to have a global impact in most
value chains
• Lifting of sanctions on Iran likely to
impact PE and methanol near term
• Expanding (or contracting) regional trade
requires detailed understanding of
logistics developments and solid go-to-
market strategies

© 2015 IHS. ALL RIGHTS RESERVED.
The Impact of Energy
At The Extremes…
Beyond 2020…
• Crude oil price trend in relation to
NAM natural gas and China coal:
impact on rate of demand growth and
investment location decisions
• Availability of low-cost ethane and
propane in North America to support
continued investments; both domestic
and international
• Developments in on-purpose
technology for olefins versus
traditional routes, including the use of
methanol as a route to olefins.
• Impact of coal-to-chemicals and on-
purpose propylene in China:
private/provincial investment versus
state-owned; self-sufficiency and surplus
capacity impacting trade with China.

© 2015 IHS. ALL RIGHTS RESERVED.
The ethylene value chain
23
Presentation Name / Month 2015
Polyethylene
(LDPE, HDPE,
LLDPE)
Monoethylene
Glycol (MEG) Ethylene Oxide
Ethylene
Ethylbenzene/
Styrene
Others
Ethylene
Dichloride
(EDC)
Vinyl Chloride
Monomer (VCM) Pipes & Fittings, Profiles &
Tubes, Films & Sheets, Wires &
Cables, Bottles
Appliance and Electrical/Electronics, Food Packaging/Food, Service
Ware, Medical Products, Furniture Components, Foam Board and
Sheathing, Building Insulation, Rigid Packaging, Automotive
Components, Refrigerator Components, Electrical Components,
Electronics/Electrical Appliances, Paper Coating, Nonwoven Binders
LLDPE
LDPE
HDPE
Film – garbage bags, food packaging
Injection Molding – housewares, lids, caps
Sheet – geo membranes
Blow Molding – bottles, containers for household chemicals,
antifreeze, Injection Molding – smaller containers for
pharmaceuticals, shampoo, cosmetics , Film and Sheet –
packaging, liners ,Pipe and Tubing
Film and Sheet – packaging (high clarity film markets), films
Extrusion Coating – coating paper, paperboard for packaging
Injection Molding – housewares, toys, molded furniture
Antifreeze, Polyester (fiber and PET),
Household cleaning, Paint &
coatings, Industrial &Institutional
Cleaning, Personal Care, Lubricants,
Construction, Cosmetics, Paper,
Automotive, Consumer Electronics,
Textiles

© 2015 IHS. ALL RIGHTS RESERVED.
The propylene value chain
24
Presentation Name / Month 2015
Propylene Oxide
Acrylonitrile
Acrylic Acid
Propylene
Cumene
Polypropylene Random Copolymer
Oxo Chemicals
Isopropyl Alcohol
Ethylene/Propylen
e Elastomers
Homopolymer
Hereophasic (impact)
Copolymer
flexible & rigid packaging, fibers, film, large
molded parts, thermoformed containers
Cast film, thermoforming, blow molding,
sheet extrusion, blown film
Corrugated pipe, thin wall injection molding,
bumpers, blow molding bottle
Phenol Phenolics, epoxys, polycarbonate
ABS Resins, SAN Resins, Acrylic
Fiber, Nitrile Rubber, Acrylamide
Propylene Glycol, Glycol
Ethers, Isopropanol Amines
Solvents
Butanol, 2-
Ethylhexanol
EPDM/EPM
Others Polygas Chemicals, Nonene,
Dodecene, Heptene
Urethane flexible foams, flexible foams
Construction, foods, drugs, cosmetics,
environmentally friendly antifreeze
Commodity acrylate esters, superabsorbent polymers,
surface coatings, water treatment/petroleum
Automotive, houseware, pipe,
conduit and fittings, packaging,
apparel
Surface coatings, plasticizers,
Automotive, construction/roofing, polymer
modification, oil and cable insulation, oil
additives, appliance parts, hoses
Propane/
Butane/
Gas Oil/
Naphtha
Methanol
Allyl chloride/
Epichlorohydrin Epoxy resins, synthetic glycerin, ECH elastomers, specialty water treatment
chemicals, wet-strength resins for paper production and surfactants
FCCU
Off-
Gas
from
Refin
eries
Refinery
Alkylat-
ion
Units
© 2015 IHS. ALL RIGHTS RESERVED.
North America
NGL Feedstock
25
• North America natural gas remains well
supplied but “methane demand constrained”
including LNG exports in the forecast.
• North America NGL balance shows there is
sufficient ethane supply to handle current
wave of new US ethylene crackers (10 million
metric tons).
• Ethane supply for an additional 15 million
metric tons of ethylene beyond 2020 is
available at the “right price”.
• Propane supply will be long in the near
term, making propane the likely competitive
feedstock compared to ethane.
• Ethane prices will rise to reflect higher
demand and support extraction of higher cost
supply; propane parity / competitive ethylene
derivative exports, provide a price ceiling.
© 2015 IHS. ALL RIGHTS RESERVED.
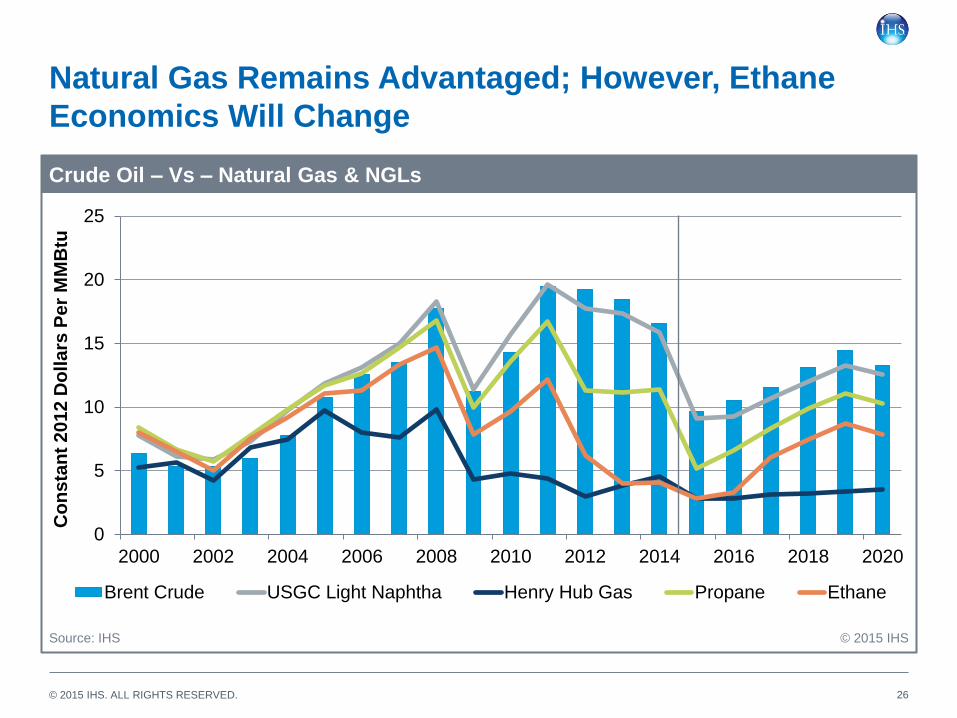
Natural Gas Remains Advantaged; However, Ethane
Economics Will Change
0
5
10
15
20
25
2000 2002 2004 2006 2008 2010 2012 2014 2016 2018 2020
Brent Crude USGC Light Naphtha Henry Hub Gas Propane Ethane
Crude Oil – Vs – Natural Gas & NGLs
© 2015 IHS
Co
ns
tan
t 2
01
2 D
oll
ars
Pe
r M
MB
tu
Source: IHS
26

© 2015 IHS. ALL RIGHTS RESERVED.
US Ethane Demand To Increase faster than Supply Exports (waterborne and pipe) and capacity additions (creep and greenfield)
27
50
60
70
80
90
100
0
500
1000
1500
2000
2500
3000
3500
2005 2010 2015 2020 2025 2030 2035
Total Ethane, bpd US ethane recoved, bpd US ethane recovery, %
Th
ou
sa
nd
Ba
rre
ls P
er
Da
y,
Eth
an
e
Pe
rce
nt
Eth
an
e R
ec
ove
ry
US Supply
© 2015 IHS Source: IHS

© 2015 IHS. ALL RIGHTS RESERVED.
North America Ethylene Capacity Growth: 2014–2020 Completed or Firm Projects (Thousand Metric Tons)
28
January 2016
Ethylene Capacity Additions Total Additions
Projected North American Ethylene (2014 - 2020) (Thousand Metric Tons per Year) 2014-2021
Company Location
BASF/Total Port Arthur. TX 128
ChevronPhillips Cedar Bayou, TX 1500
Dow Freeport, TX 1500
Dow Plaquemine, LA 250
Eastman Longview, TX 17
Equistar Channelview I, TX 182
Equistar Channelview II, TX 182
Equistar Corpus Christi, TX 363
Equistar La Porte, TX 385
ExxonMobil Baytown, TX 1500
Flint Hills Port Arthur, TX 100
Formosa Point Comfort, TX 1150
Indorama Lake Charles, LA 370
LACC LLC Lake Charles, LA 1000
Oxy/Mexichem Ingleside, TX 550
Shin-Etsu Plaquemine, LA 500
Sasol Lake Charles, LA 1550
Westlake Calvert City, KY 82
Westlake Lake Charles I, LA 110
Westlake Lake Charles II, LA 24
Williams Geismar, LA 258
Braskem Idesa Mexico 1000
Nova Sarnia 168
Firm: 12869

© 2015 IHS. ALL RIGHTS RESERVED.
Propylene Market View North America PDH Propylene Capacity Additions Latest Update
29
Propylene Capacity Additions
Projected North American Propylene (2014 - 2020) (Thousand Metric Tons per Year)
Company Location
Total Additions
2014-2021+ Technology
BASF Freeport, TX 475 MTP
Dow Freeport, TX 750 PDH
Enterprise Mont Belvieu, TX 750 PDH
Ascend Alvin, TX 1173 PDH
Formosa Point Comfort, TX 600 PDH
Williams Redwater, Alberta 525 PDH
Firm: 4273
Possible Propylene Capacity Additions
Other Announcements
Company Location
Total Additions
2014-2021+
Flint Hills Resources Houston, TX 750
Williams Western Canada 525
Dow Freeport, TX 750
Sunoco Marcus Hook, PA 600
Announced: 2625
January 2016

© 2015 IHS. ALL RIGHTS RESERVED.
Propylene Supply Diversification From By-Product/Co-Product of Refining/Steam Crackers to On-Purpose
30
0
50
100
150
10 11 12 13 14 15 16 17 18 19 20
Stm. Crackers FCC Splitters Dehydro
Metathesis Methanol to Olefins Coal to Olefins
Coal to Propylene HS FCC Others On-Purpose
Total Capacity
World: PG/CG Propylene Prod. by Feedstock
Source: IHS © 2015 IHS
Millio
n M
etr
ic T
on
s

© 2015 IHS. ALL RIGHTS RESERVED.
Propylene Capacity Additions Overwhelm Demand Growth
Five years of excess capacity through end 2019
31
-2.0
0.0
2.0
4.0
6.0
8.0
10.0
10 11 12 13 14 15 16 17 18 19 20
Mil
lio
n M
etr
ic T
on
s
North America Middle East China
West Europe Others Annual Demand Increase
Global Propylene Capacity Additions vs. Demand Growth
Source: IHS © 2015 IHS

© 2015 IHS. ALL RIGHTS RESERVED.
Polyethylene
Key Issues
32
• Global demand growth healthy:
~1.3xGDP (2015-2020)
• Excess capacity growth concentrated
in low cost / high demand regions of
North America, Middles East, and
China
• Low crude brings improved margins
for naphtha-based producers; WEP
capacity closures postponed; Asia
capacity runs at higher rates
• South America projects postponed
until conditions improve.
• North Americas joins Middle East as
major global exporter: look for
increasing competitive environment
for domestic market

© 2015 IHS. ALL RIGHTS RESERVED.
• North America experiencing
unprecedented margin acceleration
due to tight supply/demand.
• Imports of resins and finished goods
expected to continue to increase into
North America with no new capacity
on the horizon until 2019
• New capacity in China and Middle
East likely to continue downward
pressure on prices in those regions.
• Chinese self sufficiency likely to
redirect trade flows away from China
and to other regions that are short
resin like the Americas
33
Polypropylene
Key Issues

© 2015 IHS. ALL RIGHTS RESERVED.
Questions?
34


