
1
Global Innovation Networks and University-Firm Interactions: an Exploratory Survey Analysis
Ulisses Pereira dos Santos Centro de Desenvolvimento e Planejamento Regional (Cedeplar), Universidade Federal de Minas Gerais, Belo Horizonte, Brazil. [email protected] [CORRESPONDING AUTHOR] Cedeplar-UFMG Av. Antônio Carlos, 6627 Belo Horizonte - MG CEP 31270-901 - BRAZIL [email protected] Fone: +55-31-34097193 FAX: +55-31-34097203 Gustavo Britto Centro de Desenvolvimento e Planejamento Regional (Cedeplar), Universidade Federal de Minas Gerais, Belo Horizonte, Brazil. [email protected] Glenda Kruss Human Sciences Research Council (HSRC), Cape Town, South Africa. [email protected] Eduardo Albuquerque
Centro de Desenvolvimento e Planejamento Regional (Cedeplar), Universidade Federal de Minas Gerais, Belo Horizonte, Brazil. [email protected] Abstract The literature on Global Innovation Networks has contributed to identify changes in the activities of multinational corporations. However it does not fully explore the role played by university-firm interactions in these changes. Renewed efforts to understand the nature of such interactions in a global context have stressed the importance of national systems of innovation and firm strategies to innovation networks. Empirical evidence to substantiate these notions based on cross-country data is still scant. The paper fills this gap using survey data to explore the nature of university-firm interactions, and the relevance of factors such as type of enterprise, internationalisation of R&D, degree of innovative effort and sources of knowledge, in driving GINs. The results show distinctive patterns of innovation associated with different types of enterprise and university-firm interactions, as well as a country-independent profile, that can be interpreted as evidence of different types of global networks. Keywords: global innovation networks, multiple correspondence analysis, national systems of innovation, university-firm interaction, INGINEUS survey.
Jel Classification: O30; O57
2
1. Introduction
The emergence of Global Innovation Networks (GINs) holds out the promise of
technological upgrading, competence building and economic catch up for developing
countries. Potential interaction with universities and public research institutes in a
region or country is a key factor influencing the strategies of multi-national corporations
(MNCs), both in relation to the education and training of a pool of highly skilled
knowledge workers, scientists and engineers, or in relation to meeting their R&D needs
in the form of university-industry linkages. Global networks based on offshoring and
outsourcing of research, development and innovation activities of MNCs from
developed countries to firms in developing countries, universities and public research
institutes offer the opportunity for technological spillovers, access to knowledge assets
and learning that can strengthen Southern institutions and national systems of
innovation.
A related phenomenon is firms from developing countries investing in advanced
economies. These firms build external knowledge networks in order to overcome the
constraints of immature innovation systems, using the resulting global knowledge flows
to strengthen local capabilities. The emergence of GINs, of a new geography of
knowledge, thus holds out the promise of subverting traditional global knowledge
hierarchies. As Ernst and Hart (2007) note, the global changes ‘evoke optimism, even
utopian visions’ for sharing in economic growth.
The research literature suggests that this promise may be realised in emerging
economies like China and India – at least, in specific sectors such as ICT and
electronics, and in specific regions of these countries. These countries have two major
attractions for Northern MNCs – very large markets, and large pools of qualified
engineers and scientists, the result of targeted government policy and investment in
3
education and training. MNCs have offshored knowledge activities by establishing local
innovation centres in countries such as China and India, contributing to form the hub of
global innovation networks, including outsourcing to local universities in the host
country. These GINs are characterised by knowledge intensive forms of interaction
between firms and universities, such as collaborative and contract research and
customised training. Chinese universities, for instance, are increasingly found in the top
ranks of the higher education league tables, one indication that global knowledge
hierarchies are beginning to shift.
The research literature thus points to the possibility of a subversion of global
hierarchies (Ernst 2009; Ernst and Naughton 2008). At the same time, there is evidence
that such global changes are unevenly distributed (Ernst and Hart 2007) and questions
are raised whether the possibilities of technological catching up may have been
overestimated in the current literature on GINs. A focus on interactions between firms
and universities can usefully highlight the ways in which global knowledge flows are of
benefit to learning and capability building in local innovation systems.
Previous studies of the interactions between universities and firms - whether in the
developed world (Klevorick et al. 1995) or in developing countries (Lee 2009; Kruss
2009; Dutrénit 2010) - have been able to capture part of the broad picture, but do not
consider the international dimension in any depth. In turn, the emerging literature on
GINs does not investigate the firm-university interaction dimension adequately. This
perceived gap prompted an attempt to develop a taxonomy of interaction between firms
and universities in a global context (Britto et al. 2013), as part of a larger project
studying the emergence and nature of GINs1. The taxonomy highlights the role played
1 The INGINEUS (Impact of Networks, Globalisation, and their Interaction with EU Strategies) was a research project sponsored by the 7th Framework Programme (FP7) of the European Commission and

4
by the level of maturity of national innovation systems (NSI) as well as by MNC
strategies in the emergence and development of GINs.
However, despite the increasing recognition of the importance of GINs and the
key role played by universities and research institutes within networks, empirical
evidence is still elusive. The empirical evidence for GINs has tended to take the form of
case studies in a limited range of sectors and countries. This paper in contrast, draws on
an original survey of firms in three sectors with varying degrees of technological
intensity, located in nine distinct developed and developing countries, intended to shed
light on various aspects of GIN’s emergence and development (INGINEUS 2011b).
The objective of the paper is to use the survey data to explore the nature of
interaction between universities and firms in the emergence of GINs. How is the role of
universities in global innovation networks related to the maturity of the national system
of innovation and to the strategies of firms? The paper analyses the role of factors such
as the type of enterprise, the degree of internationalisation or innovative effort of firms
and their typical sources of knowledge, particularly universities and public research
institutes.
To accomplish this task, the paper undertakes a two-step approach using the
survey data. First, it applies a Multiple Correspondence Analysis (MCA) method, a
technique that transforms data available in a table into an instrumental chart, in order to
enable the geometrical analysis of a large amount of data simultaneously. In doing so, it
will be possible to evaluate how firm characteristics which a are key to GIN formation,
such as innovative effort, external interactions and internationalisation, relate to the
existence of university-industry collaboration, both local and global. The existence of a
relationship between the degree of maturity of NIS and GIN formation would, therefore,
carried out by a consortia of universities and research institutes between 2009 and 2011. More information see INGINEUS (2011).

5
imply different patterns of interaction amongst these characteristics across countries and
sectors.
Having established the relationship between the survey variables which have
connection to GINs, the second step of the analysis uses the MCA results to select
variables to be fitted in a probit model. In this case the objective is to formally measure
if the relevant variables actually increase the probability of a firm having connections
with universities abroad.
The paper is divided into five sections, apart from this introduction. Section two
presents a review of the distinct literatures on GINs and on firm-university interactions.
The objective is twofold. First, to demonstrate the theoretical gap represented by the
lack of attention to university-firm interactions in a global context. Second, by
presenting recent research contributions, the section aims to highlight the importance of
the nature of university-firm interactions as both cause and consequence of the level of
maturity of NSI, which together with MNCs types and their strategies is at the core of
GIN formation. Section three provides a description of the original dataset built from
the survey of firms. It also describes the set of variables to be used and presents the
MCA method. Section brings the results of the MCA. Section five, in turn, presents the
results of probit model used to formally test for the connection between the relevant
variables identified in the previous exercise. Concluding remarks are presented in
section 6
2. Interactions with Universities and GINs
There is a gap between two strands of the innovation literature, each of which
takes into account the significance of universities and MNCs, but fails to investigate the
two together sufficiently. The first investigative line, led amongst others by Klevorick et

6
al. (1995), Nelson (1993) and Cohen et al (2002), focuses on the interactions between
universities and firms. Within this strand, knowledge flows of MNCs have been
investigated (Narin et al. 1997), but in general this literature tends to investigate
interactions within the boundaries of a single country.
In the second strand, universities are seen as an important factor for the
emergence of GINs (Ernst 2006; UNCTAD 2005; Dunning and Lundan 2009) but the
precise nature of their role has received very limited attention. A taxonomy of types of
GIN proposed by Ernst (2009) attributes relatively minor role to links with universities,
which are largely implicit, drawing from previous formulations by Dunning (1995) and
Kummerle (1997).
This section evaluates how each strand of the literature on innovation deals with
the issue that is not at its core – how the literature on firm interaction with universities
deals with the globalization of R&D, and how the literature on GINs deals with the role
of universities – in order to develop a framework of global interaction.
2.1 The Role of Universities in the Literature on GINs
There is a largely implicit relationship assumed between GINs and universities
and research institutes in the literature on GINs. A central study carried out by The
Economist Intelligence Unit (2007) found that the majority of firms surveyed identified
universities and educational establishments as the most important collaborative partners,
ahead of customers, suppliers, alliance partners and even joint ventures. Further
evidence of the importance of the globalization of industry-science relationships can be
found in an OECD report (2008b) aimed at evaluating the use of external sources of
technology. It shows the various ways in which firms search for and identify new
7
external sources of innovation, particularly from universities and research institutes.
Kummerle (1997) identified foreign universities as frequent targets for “home base
augmenting” foreign R&D. Gompers and Lerner (2001) showed that this trend is
accompanied by novel financial arrangements. Corporate venture capital is often used to
foster joint ventures and collaboration with universities in order to access new ideas for
innovation in the face of declining internal R&D.
UNCTAD (2005) focused on strategic alliances as an indication of the increasing
internationalization of R&D. Collaboration between MNC subsidiaries and local
universities were reported in China (Microsoft Asia), Thailand (Seagate Technology),
Morocco (STMicroeletronics) and Brazil (Motorola, HP, Compaq, Novartis, Roche). In
the case of China, the report noted that R&D offshoring is explained by the abundant
supply of high-level skills, universities which are motivated to pursue funding from
firms, and IPR agreements with universities. Asian-based GINs are also found to search
for foreign contacts, inter alia, with leading universities and research institutes based in
the USA and Europe, such as China’s Huawei (Ernst and Naughton 2008) and Taiwan’s
TSCM (Ernst 2009).
What is evident in this literature is an emphasis on the significance of universities
and public research institutes in the formation of different types of GIN, but from a very
limited perspective. The focus lies on firm strategy, rather than an in-depth investigation
of the nature of interaction or the role of universities in national systems of innovation.
2.2 The Role of International Networks in the Literature on Interaction
Ernst (2002) highlighted the shift towards decentralization of R&D in the last few
decades, criticizing the literature on the national system of innovation for neglect of the

8
international dimension. This is a very strong criticism. Nevertheless, an international
perspective is part of the elaboration of the national systems of innovation literature.
Early studies emphasized the relative slower trend towards the globalization of
technology, vis-à-vis finance and production (Cantwell 1995; Patel 1995). Further
investigation of the evolutionary literature also reveals, at least implicitly, the relevance
of the international dimension. A key subject of evolutionary studies – catch up
processes – stresses the importance of international links and access to foreign
knowledge. After all, science is international by definition (Zitt et al. 2004). Every
successful catch up process involves flows of foreign technology and scientific
knowledge. In these processes, students were sent abroad, engineers hired to run new
firms or start new faculties - some of the key strategies used to absorb knowledge from
abroad (Nelson 1993).
Other important studies have shown that changes in the international scenario
impact the fate of NSIs (Nelson and Wright 1992). Studies of international alliances and
cooperation have shown how connections between different NSIs are established
(Hagedoorn 2002; Ostry and Nelson 1995). Pavitt (1991) demonstrated the importance
of scientific infrastructure to attract foreign firms. Patel (1995) argued that firms with
higher R&D intensity were internationalizing technological activity to a lesser extent,
because production and R&D were required to be in close proximity to one another - a
useful identification of changes over time. Since 1995, as Ernst has argued, there has
been a sharp rise of internationalization of high-technology sectors.
2.3 A Framework of Global Interaction
The existing literature thus suggests that GINs have two main drivers that need to
be investigated simultaneously. First, are the multi-national corporations (MNCs) and
9
their growing capabilities, technological and locational diversity, as they move across
the world selecting locations and distributing productive and innovative labour. Second,
the formation and growing complexity of national systems of innovation, especially in
the developing world, is a process that goes far beyond the push of production and R&D
towards new regions and sectors. The internationalisation of science is an important
driver. The formation of national systems of innovation (NSIs) involves political forces
that shape states and their autonomy, capabilities and public resources to generate and
support their public knowledge institutions.
Therefore, there are two dynamics reshaping and reorganizing the international
division of labour – related to both MNCs and national systems of innovation. The
reshaping of the international division of labour affects the internal decisions of MNCs
and the actions of their subsidiaries, pushing further changes in the international
division of innovative labour. The combination of these two drivers leads to a complex
picture, where the nature of NSIs matters for the formation of global innovation
networks, their main characteristics and the nature and scope of the international
hierarchies established.
Albuquerque et al. (2011) thus proposed a tentative framework of global
interactions between firms and universities that provides a synthesis between the
insights of the literature on GINs and the insights of the literature on interactions
between firms and universities. The framework yields four main types of interaction,
with variations depending on the home-base location. More complex types are bound to
emerge over time, as NSIs become more mature and MNC strategies become more
complex, and multiple types co-exist in any one period in a specific country.
The first type is characterised by local firms interacting with local and/or foreign
universities. This type of interaction does not involve cross-border transfer of

10
knowledge, but could represent the first step for a firm to become transnational. That is,
it allows for an initial accumulation of knowledge and capabilities that supports a
transition, since there is a deep correlation between transnationality and R&D-intensity
(Caves 1996).
The second type of interaction involves MNC’s subsidiaries interacting with home
country universities. MNCs have connections with their home country universities, but
the host countries either do not have R&D activities or the R&D activities are
completely centralized at the MNC headquarters.
The third type of interactions involves MNCs interacting both with home country
and host country universities and research institutes. This would be the more recent
pattern of interaction, which the literature identifies as a typical global innovation
network. It suggests a broader division of innovative labour within the MNC, with the
possibility of a subsidiary assuming contacts and creating new contracts with
universities in the host country. The nature of this relationship will depend on the nature
of the subsidiary’s role within the MNC. Hence, links may be established to enable
limited adaptive activities or more advanced projects, which would involve joint R&D
with local universities, sometimes in connection with foreign universities as well. The
hierarchy and the decision-making about the specific roles of home-country and host
countries R&D departments may vary deeply.
The fourth type of interaction characterises international consortia between firms
and universities. These involve the same actors, but they might be created and
coordinated by the academic side of the interaction, or intergovernmental cooperation
and international institutions, such as the World Health Organization. They could be
“mission-oriented” and necessarily non-hierarchical. They also could be a characteristic
of a global innovation system.
11
The elaboration of these four main types aims to identify the full range of
interactions, but they certainly do not cover all possibilities. Many real world cases
would be mixed cases. Taken independently, each type signals varying degrees of
maturity of NSIs, as well as different levels of complexity of MNCs innovative
strategies. Hence, this framework provides a means of analysing existing interaction, to
evaluate the extent to which they involve global knowledge transfer and strengthening
of national systems of innovation, and hence, contribute to reproduce or subvert global
hierarchies.
2.4 A Multitude of Country and Case Studies
The importance of firm-university interaction at the national and international
levels has been extensively registered in the literature going as far back as Prager and
Omenn (1980). Evidence of universities supporting R&D of various types in the USA
can be found in the multi-sectoral analysis of Mansfield and Lee (1996). More recently,
a new wave of country studies can be found, particularly in developing economies.
Interaction within national boundaries that may involve MNC subsidiaries can be found
in Suzigan et al. (2011), Lee et al. (2009) and Kruss (2009).
OECD (2008b) research on Japanese MNCs and their networks with universities
in China, India, Japan, and the US illustrated a different set of possible connections
between MNC’s headquarters, MNC’s subsidiaries and universities. In contrast,
Azevedo (2009) and Dantas and Bell (2009; 2011) analysed Petrobrás, a large Brazilian
state owned company which collaborates with 70 universities and research centers from
advanced countries abroad. The role of universities as search mechanisms for local
economies was emphasised by Evenson and Golling (2003). The diversity of forms of
interactions between universities and firms may be further illustrated by the Chinese

12
experience: as Eun and Lee (2010) have shown, academic-run enterprises and
university-run enterprises are specific forms of relationship. Eun et al. (2006) suggest
that these modes of interaction are specific to a context of universities with stronger
capabilities than firms. Further localised evidence of how a firm is spun-off from a local
university is evident in the case of Lenovo, one of the Asian GINs studied by Ernst
(2009). The variety of cases between countries shows that over time, the roles of
universities become more diverse (teaching in new areas, research in various directions,
following diverse motivations, demands for advice for public policy and public health)
as universities’ capabilities develop (Eun et al. 2006).
Although there is a multitude of case and country studies in the literature, cross-
country evidence of university-industry interaction is scant, particularly in relation to
international networks. The next sections present an exercise aimed at filling this gap
using a multi-country dataset.
3. Data and Methodology
3.1 The Survey
The INGINEUS research project sought to evaluate the extent to which
innovation takes place in global networks that spread through both developed and
developing countries. A new dataset was created, based on a customised survey
questionnaire, aimed at creating indicators that allowed the comparison of sectors across
regions. Analysis of the dataset enables a better understanding of how different levels of
development of national systems provide support for distinct levels of firm
internationalisation, which includes the role played by university industry interactions. 2
2 Complete information of the INGINEUS survey design and full set of results, see (2011c; 2011d).

13
The survey was conducted by research groups from nine countries, including
Norway, Sweden, Germany, Estonia and Denmark in the developed world, and Brazil,
India, China, South Africa in the developing world.3 The selection of three focus sectors
was based on the notion that the process of outsourcing knowledge-intensive activities
as well as the emergence of knowledge creating activities could be spreading from more
advanced to more traditional sectors of developing economies. By design, each country
was assigned a single sector (ICT, automotive or agroprocessing), based on its
importance in both their national and regional contexts. The sectors were assigned based
on their relatively large importance in each country, as well as to broadly represent
decreasing levels of technological intensity.
Finally, in order to enable the identification of distinct realities, each sector was
covered by at least a developed and a developing country. Agroprocessing was included
in South Africa and Denmark, automotive in Brazil, Germany and a small sample from
Sweden, and ICT was the subject in India, China, Sweden, Norway and Estonia.
Whereas in developed countries the surveys were national, in developing countries the
surveys were regional, due to both geographical size and population spread.4
Following a lengthy process to ensure sectoral compatibility (ISIC/NACE codes)
and coverage across datasets, 1 215 responses were obtained, most of which were firms
in the ICT sector, as can be seen in Table I below. The table provides information on the
response rates obtained, which ranged from 2.7% in China to 29% in Brazil5. Given the
relatively high number of responses obtained in China, which place it as the second
3 Given its concern with the outsourcing of R&D from Europe to other regions, participating countries selected to take part in the project included eastern and western European countries as well as major emerging economies, the latter seen as potential hosts of the new investments. 4 In Brazil, the survey was restricted to the state of Minas Gerais, in which a representative share of the automotive sector is located. In China two regions were targeted, Beijing and Shenzen. In India, dense IT clusters were targeted in the cities of Bangalore, Delhi, Mumbai, Pune, Trivandrum, Hyderabad and Kochi. 5 The overall response rate is 8%. In the developed countries the response rate is 10% while in the developing countries it is 6.5%.

14
country in number of observations, response rates can be considered reasonable for this
type of survey.
Table I: INGINEUS survey results breakdown and response rates (%)
Countries ICT Auto Agro Brazil 69 (28.6%) China 243 (2.7%) Estonia 17 (14%) Denmark 49 (23.3%) Germany 53 (5.5%) India 324 (20.0%) Norway 181 (11.9%) South Africa 84 (16.9) Sweden 171 24 (10.3) (14.3) Total sector 936 146 133 Source: INGINEUS (2011)
The survey instrument consisted of 14 items, many with multiple sub-questions.
The selection of items for the MCA is summarised in Table II below. Apart from the
country in which the firm is based, the choice of variables was informed by
characteristics that are associated with GIN, which can be grouped in three groups. The
first is internationalisation, or “globalness” (G) proxied by firm ownership (local, MNC
subsidiary of MNC headquarter) and by offshoring of production of R&D. The second
is innovativeness (I), measured by R&D. Third, “networkedness” (N), proxied by
sources of technology (whether in-house, in group, from other firms, non/MNC or from
universities and public research institutes) and also, by different types of interaction
(whether formal or informal, whether with local and/or with foreign universities). As
expected, some of the variables are important to more than one of the three “pillars” of a
GIN.

15
Table II below describes all variables and their respective codes used to identify
the categories of the variables used in the Multiple Correspondence Analysis launched
in following section.
Table II: Survey questions, variables and categories used for GINs analysis
Variable Options and Codes
Country Germany (GER), China (CHN), South Africa (ZAF), Sweden (SWE), Denmark (DNK), Brazil (BRA), Norway (NOR), Estonia (EST), India (IND).
R&D Yes (R&D), No (N-R&D)
Internationalization Yes (INTL), No (N-INTL).
Informal Interaction with Foreign Universities and Research Centers Yes (UNI-INF), No (N-UNI-INF)
Formal Interaction with Foreign Universities and Research Centers Yes (UNI-FOR), No (N-UNI-FOR)
Interaction with Local Universities and Research Centers Yes (LUNI-INV), No (N-LUNI-INV)
Type of Enterprise 1. A standalone company (STD)
2. A subsidiary of a MNC (MNC-S)
3. The headquarters of a MNC (MNC-HQ)
Main source of Technology. 1. Produce most tech inputs in-house (INHOUSE).
2. Buy most of our inputs from other branches of our own MNC (BRANCH). 3. Buy most of our tech inputs from non-MNC firms (LOCAL).
4. Buy most tech inputs from MNCs with which we are not formally connected (MNC).
5. Buy most tech inputs from research institutes, universities (UNI).
Source: INGINEUS (2011)
3.2 Multiple Correspondence Analysis Method
The objective of the first exercise is to evaluate the association between different
types of interaction between universities and various firm characteristics which are
closely related to GINs. The underlying idea is to circumvent the common challenge of
survey analysis that is the search of distinctive patterns for high number of firms for
which many variables are available. Furthermore, in this case the inclusion of
interaction variables, including university-industry linkages, and firm characteristics is
crucial, given that the latter are indicative the participation in GIN of different shapes.

16
Given this objectives, the MCA method was used both as a tool for exploratory
data analysis (search for patterns of interaction), and as a criteria for selection of
variables for the second exercise. The number of observations enables the search for
patterns of association between the selected variables, which can define distinct profiles.
Despite its relative novelty in economics, there are examples of this type of application
to innovation studies. Tether and Tajar (2008), for instance, use the technique to analyse
survey data, to identify different patterns of innovation in Europe.
MCA is a multivariate statistical method that enables testing for association
between two or more categorical variables. It is an alternative method to Principal
Component Analysis for dealing with categorical data, as PCA is more suitable for the
analysis of continuous data (Le Roux and Rouanet 2010; Ezzrary and Verme 2012)6.
One of the key features of the MCA method is its geometrical approach, which leads to
the construction of bi-dimensional charts in which all the analytical categories created
by the selected variables can be analysed. Hence, the technique transforms categorical
information available in a table into an instrumental chart, in order to make the analysis
of data simpler. The display of categories related to observed variables on a
correspondence graph allows us to evaluate their association, in order to group the
sample’s observations into distinct profiles (Greenacre 2005).
The analysis of these observations, described by a set of variables and their
categories, will occur by reducing the dimensionality of the system so that information
can be systematized in a plane (Greenacre 1994). The graphic analysis of the association
between variables is done through representation in the space of dimensions that reflect
their behaviour. The number of dimensions evaluated increases with the number of
6 These methods are very much similar in terms of use of geometric analysis and their interpretation, even though using different types of data. They are both data exploration techniques that are used to search for correlation patterns across sets of variables. While this information is summarized in principal components by the PCA, for continuous data, it is summarized in dimensions by the MCA method, for categorical data (Ezzrary and Verme 2012).

17
variables considered in the analysis. This usually makes it unfeasible to observe the
association of a large set of variables. MCA allows for the reduction of the dimensions
required for graphic display of a set of variables, eliminating the limitations. Thus, the
method generates a smaller number of dimensions (usually two) that summarize the
information in a set of variables.
The method starts from an indicator matrix based on the dataset that has the same
number of rows as observations and the same number of columns as the categories of all
variables observed. Based on this data, the main coordinates related to the rows and
columns of the matrix are calculated for each category of the variables. The coordinates
will be obtained from linear combinations of original variables. These combinations
synthesise all information from the variable set into a smaller set of dimensions that can
be displayed in a chart. The main formulas and the MCA calculation process are
reflected in the Appendix in the end of this paper.
The criterion for comparison between any two categories, j and k, for the set of
variables observed, is given by the chi-square distance between the points that represent
the rows and columns of the indicative matrix, defined by d2j,k = n[(nj - nj,k / nj,k) + (nk -
nj,k / njnk)], being nj,k a gross frequency of those individuals that have both categories j
and k. The term nj represents the gross frequency of individuals that have only category
j and nk represents the gross frequency of individuals that have only category k. The
outcomes are coordinate points of each category are displayed in a correspondence chart
that shows the new dimensions created for the analysis. The proximity between the
categories of the variables analysed in the correspondence chart, defined by the chi-
square distance, and their association with the dimensions obtained, will determine the
association between them, establishing clouds of variable categories on the chart. This

18
association is used for the identification of profiles in which sample elements fit
(Greenacre 2005).
Besides the active variables used in the computation of the new dimensions,
supplementary variables can be used. These variables do not influence the calculation of
the new dimensions, but are useful to add additional information for analysis of the
profile. Their coordinates are obtained as weighted averages of the standard coordinates
of the active variables’ categories. Thus, even though they do not enter the computation
process of the new dimensions, the supplementary variables are related to the categories
used in the analysis and consequently with the profiles obtained. In the exercise carried
out in this paper, the variable ‘country’ was used as a supplementary variable. It was not
used as an active variable, those related to technological and internationalization efforts,
and the type of enterprise.
4. Results and Discussion
The results the MCA is divided into two sets. The first set presents the results for
the full sample, where the objective is to test for the existence of patterns amongst the
selected variables. In addition, it is possible to identify countries associated with each
pattern, bearing in mind that the variable country does not interfere with the
identification of patterns (profiles)7. Hence, even if a country performs well for a single
variable but not for the others, this country will probably belong to another profile. In
other words, the placement of a country in of the profile does not mean that mean that
all firms do not possess the variables grouped therein, only that the pattern is not
prevalent for said country.
7 Putting the countries in the analysis is possible to check which of them present best conditions to support interactions inside and outside the country, based in the performance of its surveyed companies.

19
Finally, the results for the full sample have one caveat. The large number of
observations for the ICT sector, which may bias the identification of each profile. To
circumvent this problem, as well as to provide a clear comparison between the countries
associated with a specific sector, the second set of results is decomposed by sector.
4.1 Patterns in the Full Sample
Before analysing MCA results, Table III shows the percentage of surveyed firms
that keep interactions with local and foreign universities. India and Germany show the
highest percentages of interactive firms, in terms of local interactions. Regarding to
interactions with foreign institutions, India is the country with the highest percentage of
firms again. On the other side Brazil, Denmark and Estonia show smaller shares of
interactive firms. Note that 20% of the firms in the overall sample indicate to have links
with foreign universities. Since the share of interactive firms is substantial, the next task
is to identify the patterns related to the interactions.
Table IV shows the quality of the categories of the variables for the MCA
analysis, and the contribution of each one to the two main dimensions obtained. The
quality index is a number between 0 (very low) and 1 (perfect) and indicates the fit
between the chi-squared distance and the categories of the variables represented by the
extracted number of dimensions8. Only the variable ‘source of technology’ shows
categories with a quality lower than 0.5. Thus, these categories are poorly represented
on the chart, even though they still may be used in the interpretation of the results with
this proviso.
8 The quality of the representation index formula is presented in the Appendix section.

20
Using the contributions index, it is possible to identify the categories of the
variables that are more important in explaining the variability of the dimensions, and
interpret them. If opposing categories of the same variable both have a great
contribution to one dimension, they will be located in opposite quadrants of the axis
representing that dimension. Le Roux and Rouanet (2010) established that all the
categories with a contribution larger than the average (here 100/18 = 5.55%) can be
considered important to define a dimension.
Table IV: MCA for the full sample: main outputs
Variable Categories Description Quality Contribution Dimension 1 Dimension 2
Type of Enterprise 1 Standalone 0,78 0,057 0,041 2 MNC Subsidiary 0,69 0,048 0,254 3 MNC HQ 0,893 0,055 0,046
R&D 1 No 0,76 0,099 0,033 3 Yes 0,76 0,074 0,025
Source of Technology
1 In House 0,224 0 0,063
2 Branches of the own MNC 0,455 0,003 0,229
3 Non MNCs 0,616 0,017 0,021
4 Non connected MNCs 0,338 0,005 0,002
5 Universities 0,282 0,002 0,034
Internationalization 1 No 0,836 0,081 0,003 3 Yes 0,836 0,186 0,006
Formal Int. Foreign Univ.
1 No 0,792 0,036 0,008 3 Yes 0,792 0,166 0,035
Informal Int. Foreign Univ.
1 No 0,603 0,002 0,009 3 Yes 0,603 0,022 0,125
Interaction Local Univ. 1 No 0,765 0,055 0,025 3 Yes 0,765 0,093 0,041
Source: Ingineus Project
Based on the data in Table IV, Dimension 1 is defined by the categories R&D,
internationalization, formal interactions with foreign universities and interactions with
local universities. The type of enterprise also contributes. In other words, it is possible

21
to interpret that Dimension 1(x-axis) defines degrees of association of a firm to a in the
countries under consideration.
Dimension 2 (y-axis) is defined by the categories MNC subsidiary, Informal
interactions with foreign universities, and the Source of technology as other branches of
own MNC, which has the largest contribution to the second dimension. Developing
technology in house also contributes. Thus it is possible to interpret Dimension 2 in
terms of the features of the MNC subsidiary, since it has characteristics of large scale
companies that develop technology, or has access to the technology developed by other
branches of the corporation, but does not establish formal links with universities, even
though they can be seen as source of technology.
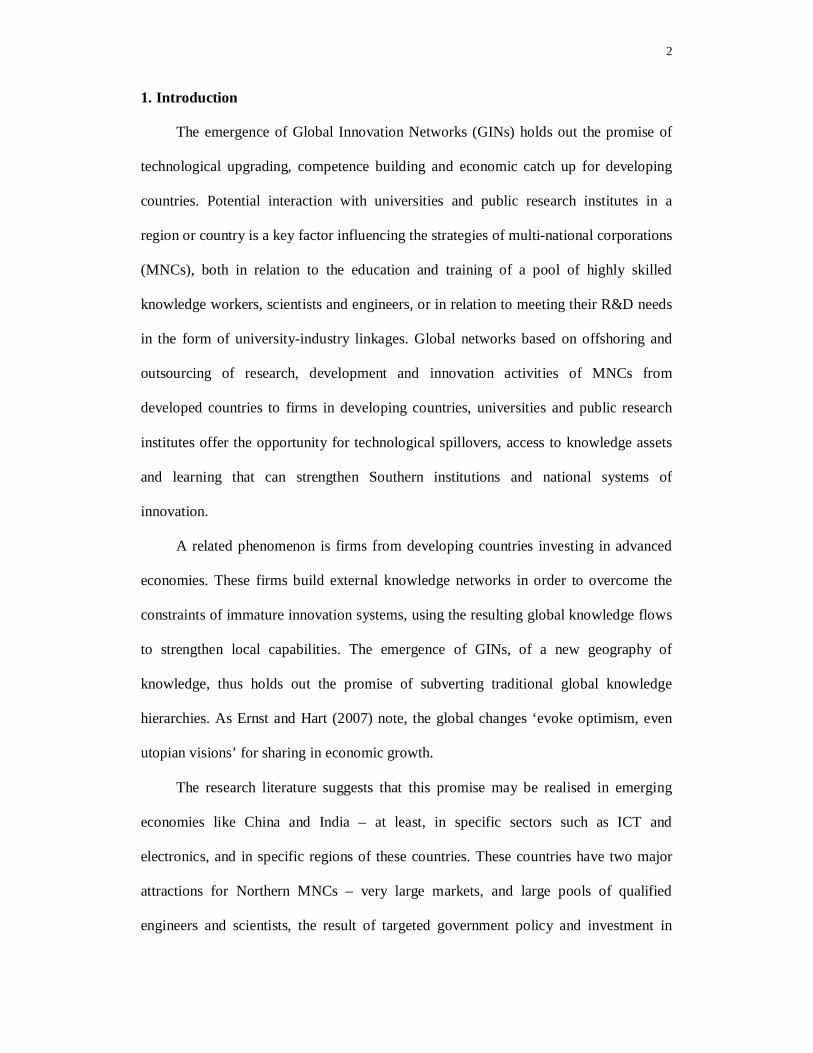
Figure 1 below depicts the correspondence chart obtained from the MCA for all
nine countries and sectors. Each axis represents one of the dimensions described above..
Together they account for almost three quarters of the overall variance, indicating a very
a good fit for the analysis. Each point on the chart receives a code representing the
category of the variable that it represents. The codes and their respective descriptions
are presented in Table II above.

22
Figure 1: “Multiple Correspondence Analysis Chart for the full sample”
A profile is defined by a set of variables clustered together in one of the
quadrants of the graph. The quadrants formed by the intersection of the two dimensions
generate profiles based on the categories displayed in each one of them. Dimension 1
for instance, separates dynamic innovative effort on its left-hand side (negative
segment) and absence of such efforts on its right-hand side (positive segment). In most
cases, the profiles can be identified and interpreted quite easily, given that a group of
active variables is clustered near one of the supplementary country variables. The
distribution of the categories of the variables allows us to define four distinct profiles,
one in each quadrant. These are analysed in turn, moving clockwise from the upper right
hand quadrant.

23
The profiles located in the positive segment of the horizontal axis, in the first
and second quadrants, reflect predominantly low innovative characteristics. These
profiles are located in the section of Dimension 1 related to the absence of interactivity.
The first discernible profile is in first quadrant, and includes South Africa, Sweden and
Norway. This profile is marked by the presence of local companies, with low degrees of
internationalization, and lack of formal interactions with foreign universities. The
development of technological outputs at home is the most important source of
technology for the firms. The characteristics indicate primarily smaller scale enterprises
focused on local markets, without a formal R&D structure, that manage to meet their
technological demands on their own. The close position of Sweden and Norway on the
chart may reflect their similarities in terms of both NSI and industrial sector, ICT.
Furthermore, although the data for Sweden shows a reasonable number of interactive
firms, they do not share the other characteristics that are represented by this profile, as
R&D and internationalization efforts for instance.. South Africa’s position, in its turn,
reflects a weaker relationship with the variables in the profile. What is important to
note, however, is that the results show commonalities amongst patterns of interaction
for firms in these countries irrespective sector.
Profile 2 in the second quadrant is also characterised by a pattern of low
innovative effort. Its features are a relative lack of local R&D, and a lack of interactions
with local and foreign universities. Another feature of this profile is the source of
technology: these firms tend to buy technological inputs produced by non-MNCs
companies. The countries in this quadrant - Denmark, Estonia and Brazil - are relatively
distant from the categories of variables that characterize the profile, but fit best with
Profile 2. Unlike Profile 1, there is no tendency toward innovative effort. This trend
may be associated particularly with the immature NISs in Brazil and Estonia, and with

24
the specificities of the economic activity surveyed in the case of Denmark, the agro-
processing sector.
In contrast, the more dynamic profiles in terms of innovative effort are displayed
in the negative segment of Dimension 1. Profile 3 in the bottom left-hand quadrant is
characterized by the existence of subsidiaries of MNCs and by the acquisition of
technology from other branches of the same MNC as well as other MNCs. These
companies reported that they offshore production and R&D activities. It is possible to
conclude that all of these variables refer to large-scale firms. The most closely
associated country is India, consistent with the fact that the country has been the
recipient of large sums of investment in the ICT sector in the last couple of decades.
This profile also reflects the presence of formal interactions between firms and
foreign universities. Given the presence of MNC subsidiaries, it is possible to argue that
these interactions are directed to the firms’ home country institutions in most of the
cases. However, even though most of the firms are MNCs subsidiaries, working in large
and emergent markets such as the Indian one, they still rely on the acquisition of
technological inputs primarily from other branches of the MNC or other MNCs.
Finally, in the fourth quadrant of Figure 1, Profile 4 can be clearly distinguished,
clustering features that are usually associated with more advanced NSIs. The categories
that indicate the existence of significant R&D activities are close to those that indicate
informal interaction with foreign universities, and interactions with local universities.
There are two countries associated with this pattern of responses, Germany and China.
Three other aspects of this profile are worth noting. The first is that the firms
tend to acquire most of their technological inputs from research institutes and
universities, a characteristic that reinforces its interactive status. The second aspect is
the predominance of MNC headquarters, which indicates that MNCs tend to concentrate

25
their interactions more strongly at their headquarters. Finally, China is fitted in this
profile, even though it is far from the other variables. This indicates that the dynamics
of innovation in China are closer to that of Germany than to other developing countries,
at least, in relation to the specific sectors selected for the study. This pattern highlights
the significance of analysis of the dynamics of firms in specific sectors.
The combined analysis of all profiles provides key empirical evidence for the
association between significant firm R&D activities, procurement of technology from
universities and research institutions, and interaction with local and foreign universities.
In other words, the characteristics observed specifically in the profile 4 give rise to
complex forms of GINs. What is more, the level of complexity increases as linkages
with universities, local and foreign, become more frequent.
Given the relatively high number of responses obtained for each country, the
broad patterns described may hide sector specific trends and differences. Hence, the
next sections proceed to apply the MCA to each of the three sectors covered in the
survey.
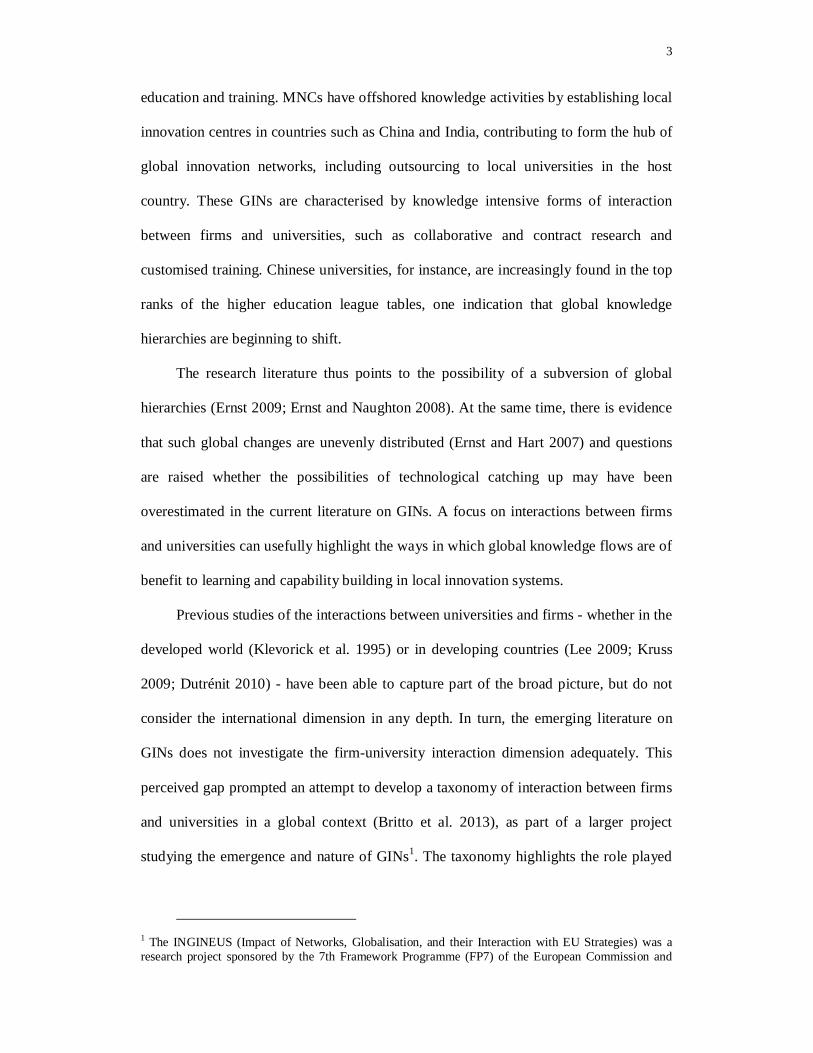
4.2 Automotive Sector
The sample for the automotive sector included 146 firms from Germany, Brazil, and
Sweden. The correspondence Figure 2 below shows a clear distribution of the countries
across the plane, generating a profile marked by the presence of Sweden in the first
quadrant, a profile marked by the presence of Brazil in the second, and a profile for
Germany in the fourth quadrant. The third quadrant reflects the association of a set of
variables regardless of the supplementary variable 'country', that is, they are frequently

26
found together in different countries, but are not predominant in the country in which
they are located.
Figure 2: Multiple Correspondence Analysis for the Automotive Sector
For the profile in the first quadrant identified by Sweden, all the variables are
located close to the positive part of the vertical axis. The specific variables suggest a
pattern of smaller scale automotive companies with a small international reach, the lack
of interactions with foreign universities and the procurement of new technology inputs
from MNCs with which the firms is not associated.
The second profile, identified by the presence of Brazil, is marked by the
absence of interactions between firms and universities. Automotive firms acquire
technological inputs from other branches of the MNC and from local companies. The
27
absence of R&D activities is also a characteristic, leading to the conclusion that the
profile is marked by the low innovative effort.
In contrast, the third profile, associated with Germany, clusters the categories of
variables that indicate a more mature NSI: regular R&D activities, interactions between
firms and local universities, informal interactions with foreign universities, universities
and research institutes as the main sources of knowledge, together with the nature of the
firm itself. Firms in this profile also indicate. These variables suggest that the
automotive firms in Germany are capable of producing their own technological inputs
as well as procure them from universities and research institutes. Companies are able to
produce new knowledge but still maintain links with universities inside the country and
abroad, suggesting a dynamic interactive-innovative profile.
Quadrant 3 reflects a profile that is not associated with any specific country,
associated with firms that are headquarters and subsidiaries of MNCs. This profile is
characterised by the presence of global automotive companies that have formal
relationships with foreign universities, and processes of internationalization of R&D
activities and production.
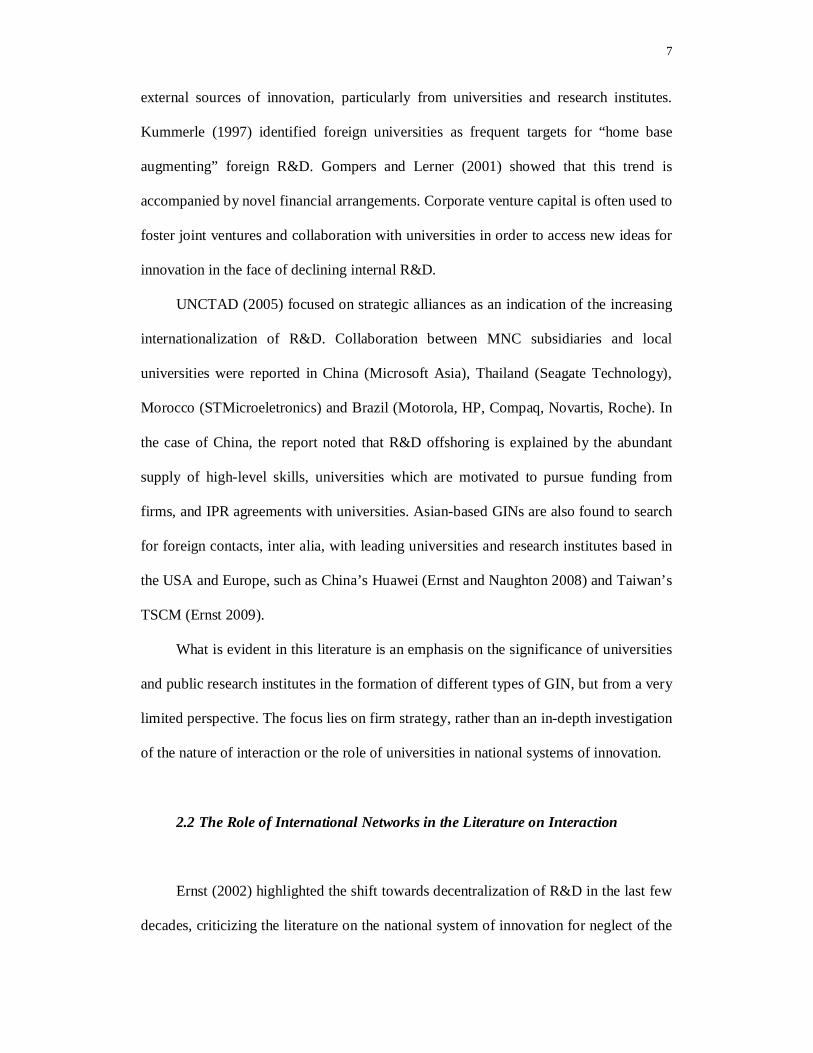
4.3 Agroprocessing Sector
The MCA exercise for the agro-processing sector displays distinct patterns for
133 observations from South Africa and Denmark, as well as two other profiles that are
not country specific (Figure 3).
In the fourth quadrant, South African firms are associated with a profile
characterised by positive responses to variables that capture interactions. Companies
have their main sources of technology in other MNCs with which they are not formally
connected, and have significant R&D. This profile reflects a strong innovative tendency

28
in the agro processing firms surveyed in South Africa, indicating important sectoral
technological efforts. Such a profile was not clearly visible in the analysis of the full
sample, demonstrating how sectoral analysis allows the observation of important
differences in innovative potential and dynamics.
Danish companies in contrast, form a profile characterised by the lack of
informal interaction with foreign universities, or any kind of interaction with local
universities. Companies are more likely to purchase technology from other local
companies. The in-house development of technology but the absence of formal R&D
activities is also a feature.
Figure 3: Multiple Correspondence Analysis for the Agro-processing Sector
29
Figure 3 also depicts two clusters of variables that are related to types of
enterprise rather than a specific country, indicating minority trends. The first ‘quasi-
profile’, in quadrant one, aggregates local agro-processing companies, and is associated
with the lack of internationalization. This quasi-profile is very close to the horizontal
axis, and to the Danish profile. Thus is possible to say that, even though they are in
different quadrants, the firms in both profiles have very similar features, according to
the Dimension 1 specially. The second ‘quasi-profile’, in the third quadrant, is
characterised by MNC subsidiaries. This type of firm is more likely to have outsourced
R&D and production activities, and the main source of technological inputs is other
branches of the MNC with which they are associated.
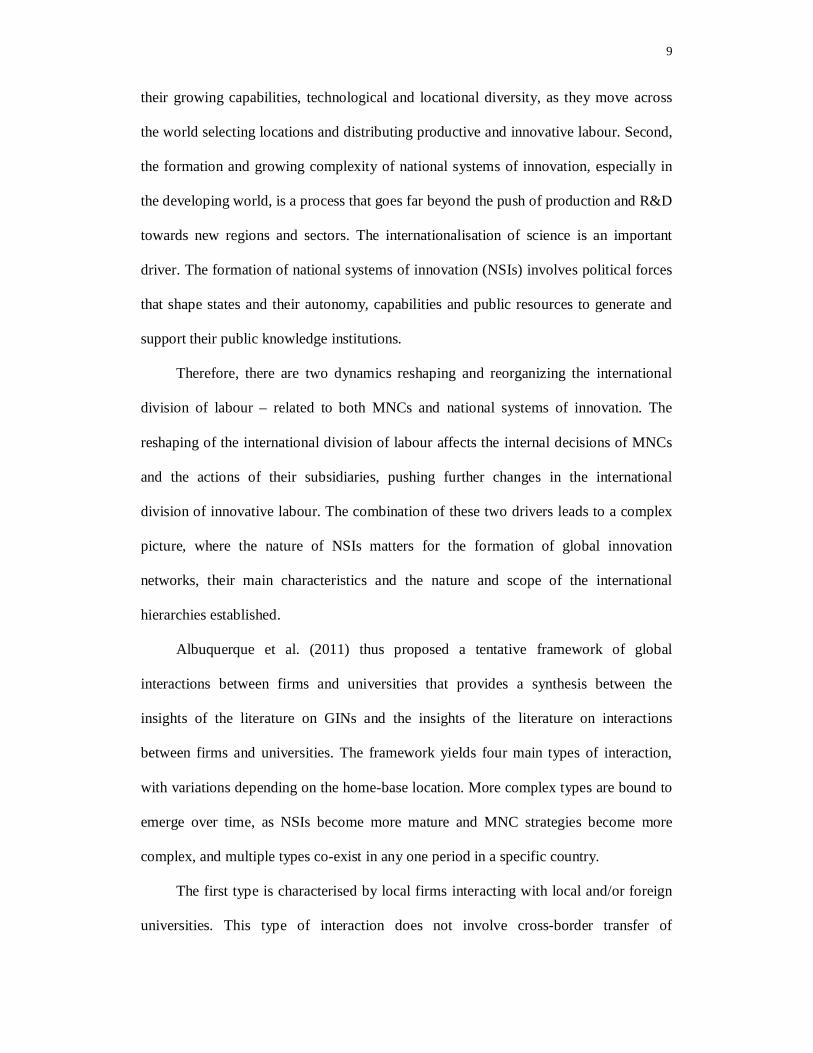
4.4 Information and Communication Technology Sector
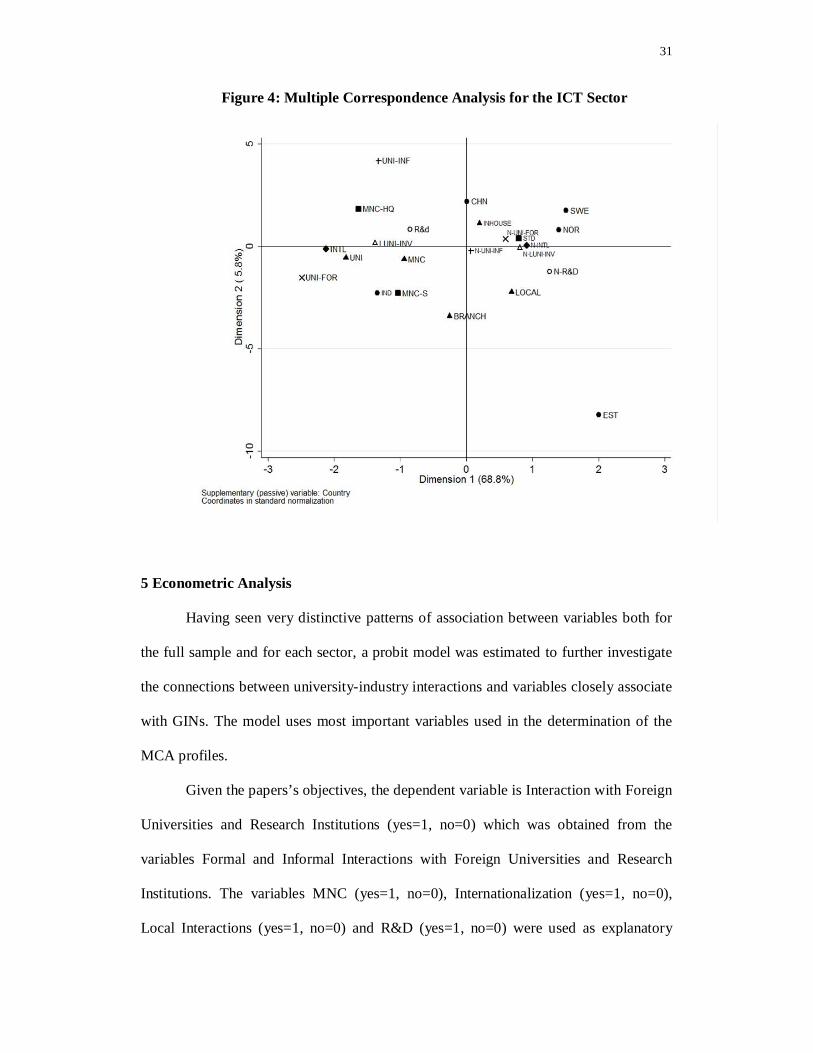
The analysis for the ICT sector yields three country specific profiles (Figure 4).
It is clear that Dimension 1 separates positive and negative innovative characteristics,
while Dimension 2 separates the type of enterprise and the sources of technology,
generating two distinct profiles. In the first quadrant the Nordic countries, Sweden and
Norway, form a profile characterized by the presence of local companies, and the
absence of internationalization and formal interactions with foreign universities. There
is a tendency to develop technology in house as the main source of new knowledge. The
predominance of local firms in the sample for each of these countries may indicate a
situation similar to that reported by Narula and Guimón (2010), when studying MNCs
from peripheral eastern European countries. They found that local firms experienced
significant difficulties in building networks with MNCs in high value added activities.

30
A country independent quasi-profile associated with MNC headquarters is found
in the fourth quadrant, associated with the existence of R&D activities, interactions with
local universities and informal interactions with foreign universities. Thus, the most
dynamic companies form a specific, country independent profile, that has characteristics
of large, highly networked MNCs.
It is important to note the position of the Chinese indicator on the chart, which
is not defined by Dimension 1 at all, but only by Dimension 2, at an intermediary point
between the two previous profiles. So it has features of both but, cannot be associated
with either one specifically. However, China has contrasting features to the other two
profiles located in the negative segment of Dimension 2, characterized by the
prevalence of purchase of technology from other MNCs, and interactions between firms
and local and foreign universities.
In the second quadrant there is another low innovative profile, marked by the
presence of Estonia, even it is located at a distance from the other variables. The
features relate to the absence of formal R&D activities, and interactions with foreign
and local universities, as well as the procurement of new technological inputs from local
companies.
Finally a profile associated with companies located in India is observed in the
third quadrant. The main characteristic of this profile is the predominance of
subsidiaries of MNCs, formal interactions with foreign universities and the existence of
processes of offshoring of R&D and production activities. Three sources of knowledge
are associated with this profile: other branches of the MNC, other MNCs and
universities and research institutions. The sectorial analysis reinforces the interactive
tendency of MNCs in India observed in the full sample analysis.
31
Figure 4: Multiple Correspondence Analysis for the ICT Sector
5 Econometric Analysis
Having seen very distinctive patterns of association between variables both for
the full sample and for each sector, a probit model was estimated to further investigate
the connections between university-industry interactions and variables closely associate
with GINs. The model uses most important variables used in the determination of the
MCA profiles.
Given the papers’s objectives, the dependent variable is Interaction with Foreign
Universities and Research Institutions (yes=1, no=0) which was obtained from the
variables Formal and Informal Interactions with Foreign Universities and Research
Institutions. The variables MNC (yes=1, no=0), Internationalization (yes=1, no=0),
Local Interactions (yes=1, no=0) and R&D (yes=1, no=0) were used as explanatory

32
variables. These independent variables were the ones that presented contribution index
average for their categories above 5% regarding to Dimension 1 according to Table IV9.
The estimated Probit model is given by:
Pr(푓표푟푒푖푔푛_푖푛푡푒푟푎푐푡푖표푛푠 = 1⃓푥 ) = Φ(푥 훽)
Where Φ is the cumulative normal distribution, X the set of explanatory variables, and
the coefficients β are estimated by the Maximum Likelihood method.
The estimated results for 990 observations are presented in Table V. All the
coefficients were significant at 10%, and only the coefficient for the variable R&D was
not significant at 1% or 5%. Furthermore all coefficients have the expected signs,
indicating that the dependent variables increase the probability of the existence of
interactions between the firms and foreign universities.
Table V: Econometric Probit Model for Interactions with Foreign Universities
Variable Coefficient P-Value MNC 0,325 0,001 Internationalization 0,756 0,000 R&D 0,184 0,076 Local Interactions 0,802 0,000 Constant -1,587 0,000 Pseudo R2 0,189
Number of obs 990 Log likelihood -442,007 LR chi2(4) 205,740
Source: Ingineus Project
The results reinforce the evidences obtained with the MCA analysis.. A closer
view of the coefficients also suggest that the Internationalization processes and the
existence of Local Interactions have the biggest marginal effects on average in the
improvement of the probability of interactions outside the country. This suggest that for
9 According to this criterion, which is a more flexible version of the one presented by Le Roux and Rouanet (2010), the variable Source of Technology could not be used as an independent variable.

33
the interactive profiles the companies that offshored activities are more willing to be in
touch with foreign research institutions as well the ones that keep relationships with
local institutions.
6. Conclusions
The use of a Multiple Correspondence Analysis method allowed us to identify
distinctive profiles for both the full dataset and the sector-specific samples. The profiles
are constructed mainly according to the surveyed firms’ characteristics, but reflect
country specific patterns of association.
The analysis of the full sample reflected distinctive patterns for countries with
different levels of development. The profile associated with Germany, and to a lesser
degree with China, reflected a pattern of significant R&D activities with interactions
with local and foreign universities. Firms in these regions acquire most of their
technological inputs from research institutes and universities and are primarily MNC
headquarters. The contrasting profile associated with Brazil, Estonia and Denmark was
marked by weak innovative activity, lack of interactions with local and foreign
universities, absence of R&D activities and procurement of technological inputs from
other companies. Taken together, these profiles demonstrate a close association between
levels of development and university-industry interactions and firms’ innovative effort.
Norway, Sweden and South Africa formed a profile that also suggests a non
interactive pattern. This profile was marked by the significant presence of local
companies, the lack of internationalization process, no significant R&D, and in house
development of new knowledge as the main source of technology. It reflects firms with
less sophisticated technologies, which exercise internal technological effort, even
though they do not interact with universities or research institutions. Finally, India is

34
located in the interactive quadrant, an intermediary profile that shows the presence of
MNC subsidiaries and formal interactions with foreign universities. Dependence on the
procurement of technological inputs from other branches of the MNC or other MNCs is
a significant feature of this profile.
Is important to point that this is an indicative analysis which does not intend to
classify the countries in a definitely way as interactive or non-interactive, but only
indicates which ones are closer to the set of characteristics that drive to interactivity
with internal and foreign institution, according to the data in the sample. Hence, it is
important to keep in mind that MCA is a descriptive statistical method used here with
the objective to identify patterns according to the database at hand.
This exercise helped to identify countries in which firms are more likely to enter
GINs.. Germany, India and China are the best examples. The presence of countries with
firms from the same sector in opposite profiles, in terms of innovative and interactive
characteristics, shows that the national specificities can overlap the sectoral
characteristics in the establishment of the profiles. The locations of Germany and Brazil,
both with surveyed firms in automotive sector, or of India and Sweden and Norway, for
ICT, is indicative of this trend.
The sectoral analyses broadly confirmed the trends identified for the full sample,
particularly in the automotive sector. More importantly, however, the exploratory
method allowed the identification of a peculiar pattern of responses for key variables
yielding a kind of quasi-profiles. These quasi-profiles could not be linked with any
specific country, particularly in the Automotive and ICT sectors.
Taken individually, they indicated that for a minority of companies in each
sector, firms with a higher degree of internationalisation tended to have links with
universities or other foreign partners more frequently. Taken together, these

35
‘autonomous’ interactive profiles form a group of ‘black sheep’ companies, in terms of
internationalisation, innovation and networking. Significantly, the quasi profiles are
formed by specific firms that are either subsidiaries or headquarters of MNCs, which
present distinct patterns of responses in comparison with all the other respondent firms
in each country and sector. This finding may be interpreted as original empirical
evidence for the emergence of global innovation networks, which have different
configurations depending on their sector and country location. In all cases, the presence
of a MNC and of interactions with universities are fundamental ingredients.
Hence, the results of the MCA analysis begin to shed light on at least two
relevant issues in the literature. First, the pattern of autonomous profiles represents
emergent global innovation networks in which university-industry interactions are
always present. It provides initial empirical evidence that helps to bridge the two strands
of the literature regarding the nature of university-firm interactions in the context of
global innovation networks.
Second, the exercise raises the question why some forms of interactions with
local and foreign universities are indicated in some countries and not in others. The
MCA analysis suggests that there is a case to be made for the influence of the level of
development of NSIs. Only three countries, Germany, China and India, were located in
profiles that are at the same time innovative, connected with other partners, and show a
degree of internationalisation. Germany, it is widely accepted, has a very well-
developed NSI, China is a country undergoing a rapid process of economic restructuring
and strong growth, and India has a very large pool of qualified talent for the ICT sector
specifically. While Germany is recognized as one of the world’s economic and
technological leaders, India and China are potential leaders in next few decades, as is
Brazil. Nevertheless the MCA analysis for this sample shows that the automotive sector
36
in Brazil is still in an inferior position, confirming traditional results in the literature that
indicate its NSI as immature (Albuquerque 1999).
The probit model shows that the most important variables for the construction of
the MCA profiles contribute positively to increase the probability of links with foreign
universities. existence of interactions outside the country where the firms are located.
These results confirm the applicability of MCA for this kind of analysis even it still
being a relatively unpopular methodology compared to other multivariate statistic
methods.
The overall results obtained here add voice to the suggestion that the promise of
global innovation networks to subvert traditional knowledge hierarchies may be
unevenly distributed (Ernst and Hart 2007), and the development possibilities may be
overestimated.
Of course, the results and interpretations apply only to this specific sample of
companies in their respective sectors and countries. Even with the relatively high
number of respondents, the survey is not representative of each sector in the country,
with the exception of Sweden. The broad strokes of the picture painted by these profiles
can be further refined through case studies and larger surveys, both in terms of sample
size and in terms of the number of countries and sectors. Another fruitful avenue of
research is the combined analysis of the survey, Community Innovation Surveys and
patent data. Regardless of these limitations, the exercise indicates the importance of the
characteristics of the firms and countries for the university-industry interactions and
MNCs strategies in the context of the emergence of global innovation networks.

37
Acknowledgements
Research for this paper was partially funded by the European Community's Seventh Framework Programme (Project INGINEUS, Grant Agreement No.225368, www.ingineus.eu). The authors alone are responsible for its contents which do not necessarily reflect the views or opinions of the European Commission, nor is the European Commission responsible for any use that might be made of the information appearing herein. Additionally, financial support from CNPq, Fapemig and Fapesp is acknowledged. The authors acknowledge the research assistance from Mogau Aphane, Vanessa Oliveira, Fabio C. S. Neto, Leandro Silva, Andre Veloso, Matheus Oliveira, Lucas Araújo and Patricia Vargas. Comments and discussions with Raoni Bagno, Ana Valeria Dias, and with colleagues from the INGINEUS project at the Copenhagen workshop helped to shape our understanding on innovation networks. The authors are also indebted to comments made by discussants present at the 9th GLOBELICS International Conference, where an earlier version of the paper was presented, as well as to helpful comments provided by Helena Barnard and two anonymous referees. The usual disclaimer holds.
References
Albuquerque, E. 1999. National Systems of Innovation and Non-OECD Countries: Notes about a rudimentary and tentative typology. Brazilian Journal of Political Economy, 19(4), 35-54.
Albuquerque, E., Britto, G., Camargo, O., & Kruss, G. 2011. Global interactions between firms and universities: global innovation networks as first steps towards a global innovation system. Textos para Discussão, (419), Cedeplar, UFMG.
Azevedo, J. G. 2009. Petrobrás - From Lobato to Tupi: 70 years of results and challenges for people and technology. Paper presented at the 11th International Congress of the Brazilian Geophysical Society, Salvador.
Cantwell, J. 1995. The globalisation of technology: what remains of the product cycle model? Cambridge Journal of Economics, 19, 155-155.
Caves, R. E. 1996. Multinational enterprise and economic analysis. Cambridge University Press, Cambridge.
Cohen, W. M., Nelson, R. R., & Walsh, J. P. 2002. Links and impacts: the influence of public research on industrial R&D. Management science, 48(2), 1-23.
Dantas, E., & Bell, M. 2009. Latecomer firms and the emergence and development of knowledge networks: The case of Petrobrás in Brazil. Research Policy, 38(5), 829-844.
38
Dantas, E., & Bell, M. 2011. The Co-Evolution of Firm-Centered Knowledge Networks and Capabilities in Late Industrializing Countries: The Case of Petrobras in the Offshore Oil Innovation System in Brazil. World Development, 39(9), 1570-1591.
Dunning, J. H. 1995. Multinational enterprises and the global economy. Addison-Wesley, Workingham.
Dunning, J. H., & Lundan, S. M. 2008. Multinational enterprises and the global economy. Edward Elgar Publishing.
Dutrénit, G. 2010. Introduction to special issue: Interactions between public research organisations and industry in Latin America: a study on channels and benefits from the perspective of firms and researchers. Science and Public Policy, 37(7), 471-472.
Ernst, D. 2002. Global production networks and the changing geography of innovation systems. Implications for developing countries. Economics of Innovation and New Technology, 11(6), 497-523.
Ernst, D. 2006. Innovation offshoring: Asia's emerging role in global innovation networks. East-West Center, Honolulu.
Ernst, D. 2009. A new geography of knowledge in the eletronics industry? Asia’s role in global innovation networks. Policy Studies (54).
Ernst, D., & Hart, D. M. 2008. Governing the Global Knowledge Economy: Mind the Gap! Vol. 93. Economics Study Area Working Paper. East-West Center, Honolulu.
Ernst, D., & Naughton, B. 2008. China’s emerging industrial economy: insights from the IT industry, in McNally, C.A., (Ed), China's emergent political economy: capitalism in the dragons' liar (pp. 39-59). Routledge, London/New York.
Eun, J. H., Lee, K., & Wu, G. 2006. Explaining the. Research Policy, 35(9), 1329-1346.
Eun, J. H., & Lee, K. 2010. An empirical inquiry into "Academy-Run Enterprises in China: Unique characteristics and evolutionary Changes. International Journal of Innovation Management, 14(01), 123-150.
Evenson, R. E., & Gollin, D. 2003. Assessing the impact of the Green Revolution, 1960 to 2000. Science, 300(5620), 758.
Ezzrari, A., Verme, P. 2012. A Multiple Correspondence Analysis Approach to the Measurement of Multidimensional Poverty in Morocco, 2001-2007. WPS6087. Working Paper Series. Washington DC: The World Bank.
Figueiredo, P. N. 2011. The role of dual embeddedness in the innovative performance of MNE subsidiaries: evidence from Brazil. Journal of Management Studies, 48, 417-440.
Gompers, P. A., & Lerner, J. 2001. The money of invention: How venture capital creates new wealth. Harvard Business Press, Boston.
39
Greenacre, M., & Blasius, J. (Eds). 1994. Correspondence Analysis in the Social Sciences. Academic Press, San Diego.
Greenacre, M. 2005. Correspondence Analysis. Encyclopedia of Statistics in Behavioral Science. John Wiley & Sons, Ltd, London.
Greenacre, M. J. 2010. Correspondence analysis. Wiley Interdisciplinary Reviews: Computational Statistics, 2(5), 613-619.
Greene, W. 2003. Econometric Analysis. Upper Sadlle River: Prentice Hall.1026p.
Hagedoorn, J. 2002. Inter-firm R&D partnerships: an overview of major trends and patterns since 1960. Research Policy, 31(4), 477-492.
INGINEUS. 2011a. Comprehensive research paper on Global Innovation Networks: challenges and opportunities for policy (downloaded on 20/12/2011 from http://www.ingineus.eu/UserFiles/INGINEUS_D10.1_part1.pdf)
INGINEUS. 2011b. Patterns of knowledge accumulation, institutional frameworks and insertion in GINS in successful sub-national regions (downloaded on 20/12/2011 from http://www.ingineus.eu/UserFiles/INGINEUS_D4.1.pdf)
INGINEUS. 2011c. Methodology Report: Complete standardised data set containing all the information collected in all countries. (downloaded on 20/12/2011 from http://ingineus.eu/UserFiles/INGINEUS_D2.2_MethodologyReport(1).pdf)
INGINEUS. 2011d. Complete standardised data set. (downloaded on 20/12/2011 from http://www.ingineus.eu/UserFiles/INGINEUS_D2.2_Fulldatasetandcodes_VER2.zip)
Kazuyuki, M. 2005. University-industry collaborations in Japan: The role of new technology-based firms in transforming the National Innovation System. Research Policy, 34(5), 583-594.
Klevorick, A. K., Levin, R. C., Nelson, R. R., & Winter, S. G. 1995. On the sources and significance of interindustry differences in technological opportunities. Research Policy, 24(2), 185-205.
Kuemmerle, W. 1997. Building effective R&D capabilities abroad. Harvard Business Review, 75, 61-72.
Le Roux, B., Rouanet, H. 2010. Multiple Correspondence Analysis. Los Angeles: Sage.
Lee, K., Joseph, K., Abraham, V., Eun, J. H., Wu, G., Wang, Y. 2009. Promoting effective modes of university-industry interactions and their evolution for economic catch up in Asia. A Research Report for IDRC. Seoul: East Asia Institute.
Mansfield, E., & Lee, J.-Y. 1996. The modern university: contributor to industrial innovation and recipient of industrial R&D support. Research Policy, 25(7), 1047-1058.

40
Narin, F., Hamilton, K. S., & Olivastro, D. 1997. The increasing linkage between US technology and public science. Research Policy, 26(3), 317-330.
Narula, R., & Guimón, J. 2010. The R&D activity of multinational enterprises in peripheral economies: evidence from the EU new member states. Maastricht: UNU-MERIT.
Nelson, R. R. 1993. National innovation systems: a comparative analysis: Oxford University Press, USA.
Nelson, R. R., & Wright, G. 1992. The rise and fall of American technological leadership: the postwar era in historical perspective. Journal of Economic Literature, 30(4), 1931-1964.
OECD. 2008a. The Internationalization of business R&D: evidence, impacts and implications. Paris: OECD.
OECD. 2008b. Open innovation in global networks. Paris: OECD.
Ostry, S., & Nelson, R. R. 1995. Techno-nationalism and Techno-globalism: Conflict and Cooperation. The Brookings Institution, Washington.
Patel, P. 1995. Localised production of technology for global markets. Cambridge Journal of Economics, 19(1), 141-153.
Pavitt, K. 1991. What makes basic research economically useful? Research Policy, 20(2), 109-119.
Prager, D. J., & Omenn, G. S. 1980. Research, innovation, and university-industry linkages. Science, 207(4429), 379.
Stata. 2009. Stata Multivariate Statistics Reference Manual: release 11. College Station (US): Stata Press.
Suzingan, W., Rapini, M., & Albuquerque, E. 2011. A changing role for universities in the periphery. Vol. 420. Textos para Discussão. Belo Horizonte: Cedeplar-UFMG.
The Economist Intelligence Unit. 2004. Scattering the seeds of innovation: the globalization of Research and Development. White paper prepared for Scottish Development International. London: The Economist.
The Economist Intelligence Unit. 2007. Sharing the idea: the emergence of Global Innovation Networks. London: The Economist.
Theter, B., & Tajar, A. The organisational-cooperation mode of innovation and its prominence amongst European service firms. Research Policy, 37(4), 720-739.
UNCTAD. 2005. World Investment Report 2005 – Transnational corporations and the internationalization of R&D. Geneva: United Nation Conference on Trade and Development.

41
Zitt, M., & Bassecoulard, E. 2005. Internationalisation in science in the prism of bibliometric indicators, in Moed, H., Glänzel, W., Schmoch, U. (Eds), Handbook of quantitative science and technology research: the use of publication and patent statistics in studies of S&T systems (pp. 407-436). Kluwer Academic Publishers, Dordrecht.

42
Appendix: MCA's main formulas
The Multiple Correspondence Analysis calculation method is presented here, based on
Stata (2009), pages 414-418. More information about the MCA methodology can be
found in this manual, Le Roux and Rouanet (2010) or in Grenacre (1994).
Let x1, ….., xq be categorical variables on N observations resulting in the responses
matrix Nxq . The xj is coded with consecutive integers 1, …., nj. The resulting indicator
matrix will be a NxJ binary matrix Z(j) formed by each category of each variable of the
previous Nxq matrix in its columns, where J = n1 +…+nq. Thus 푍( ) = 1 if, and only if
xij=h.
We will let i index observations 1, …. , N; j index variables 1, … , q and h index
categories 1,…, nj or 1, … , J.
The JxJ Burt Matrix is defined as B = Z’Z or B = Z’ D(w)Z, where w is the weight and
D(w) is a JxJ matrix with the weights on its diagonal and 0 off diagonal. The diagonal
block of matrix B associated with the variable xj is a diagonal matrix with the
frequencies of xj on the diagonal.
In The MCA method we have:
퐵 = 퐵
푃 = 퐵 퐵
푐 = 푃 ∗ = 푃 ∗ = 푃′1
* represents all possible values

43
푆 = 푃 − 푐푐′
c is the column mass and B and S are symmetric. The singular value decomposition is
equivalent to the eigen decomposition of S.
푆 = 푉Φ푉 , 휙 ≥ 휙 ≥ ⋯
For h, Vkh > 0 for the first k for witch Vkh ≠ 0.
The standard column coordinates are defined as:
퐴 = 퐷(푐) 푉
D(c) is the diagonal matrix with diagonal c.
The tth principal inertia is defined as λt = φt and the total inertia as ∑t λt. The inertia of
the variable j, In(j) is elementwise computed as:
퐼푛( ) = 푤(푍( ) − 푞푐( ))
푞 푐( )푤
푍( ) is the i, hth element of the indicator matrix for variable j, wi is the weight for
observation i and w+ is the sum of the weights over the observations, q is the number of
active variables and 푐( ) is the column mass of variable j for category h.
The adjust principal inertia and the total inertia are defined as:
휆 = 푞
푞 − 1휙 −
1푞
, 푝푟표푣푖푑푒푑푞휙 > 1
푡표푡푎푙푖푛푒푟푡푖푎 = 푞
푞 − 1 휙 −
(퐽 − 푞)푞
Let’s call F the principal coordinates, defined as:
퐹 = 퐴퐷(Λ) /
Where Λ is the vector of adjusted or unadjusted principal inertias and D(Λ)1/2 is the
diagonal matrix with elements 휆 / on the diagonals.

44
Supplementary Variables:
The principal coordinates of the supplementary variables are computed as weighted
averages of the standard active column coordinates. And supplementary standard
coordinates are obtained by the division by the principal inertias.
The supplementary variables are added to the Burt matrix B as more rows. Let gkt be the
principal coordinate for category k and dimension s, P and P* are defined as above, and
A is the standard coordinates of the active variables, as computed before. So gkt is
computed by the following formula:
푔 = 푃∗
푃∗퐴


