
“Charleston Flooded” BATIK by Mary Edna Fraser, Charleston, SC, USA
Global Ocean Challenges
Stephen Macko
Professor
Department of Environmental Sciences
University of Virginia
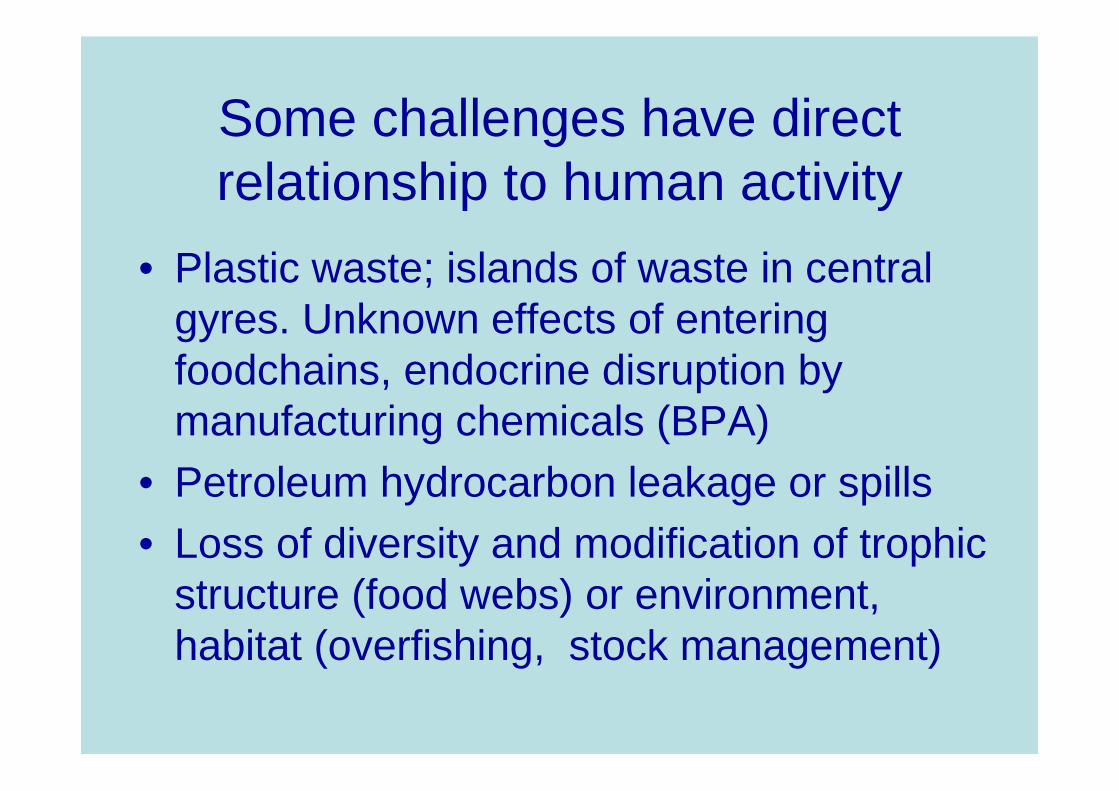
Some challenges have direct relationship to human activity
• Plastic waste; islands of waste in central gyres. Unknown effects of entering foodchains, endocrine disruption by manufacturing chemicals (BPA)
• Petroleum hydrocarbon leakage or spills• Loss of diversity and modification of trophic
structure (food webs) or environment, habitat (overfishing, stock management)

Some challenges likely have some direct relationship to human activity:
some effects are identified, others less so
• Warming of the ocean (thermal expansion, melting of sea ice, glaciers)
• The other carbon dioxide problem: lowering of the pH though carbonic acid acidification

Some challenges have effects or “collateral” impacts are not so obvious
and desperately need more data• Release of methane from either gas
hydrates on the seabed, or stored in the coastal permafrost peats (coastal modification, GHG amplification)
• Rising sea levels, modification of currents, changes in storm intensities

Graphics courtesy Michael Mann/ IPCC

How much and how fast?

Projected Future Warming
Graphics courtesy Michael Mann, IPCC

This is a time of unprecedented change in the Arctic. Conditions are changing faster than at any time in the past 10,000 years. The Arctic is warming twice as fast as the rest of the planet; pH is declining more.
Photo: Stephen Macko
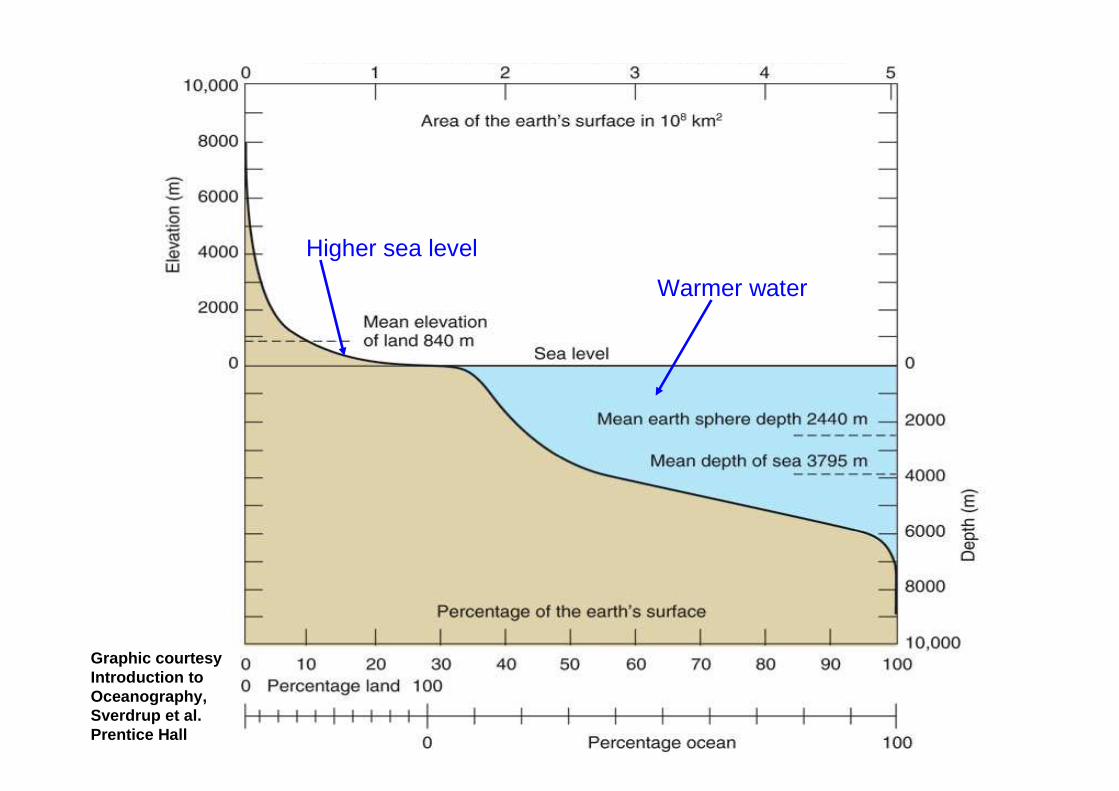
Warmer water
Higher sea level
Graphic courtesy Introduction to Oceanography, Sverdrup et al. Prentice Hall
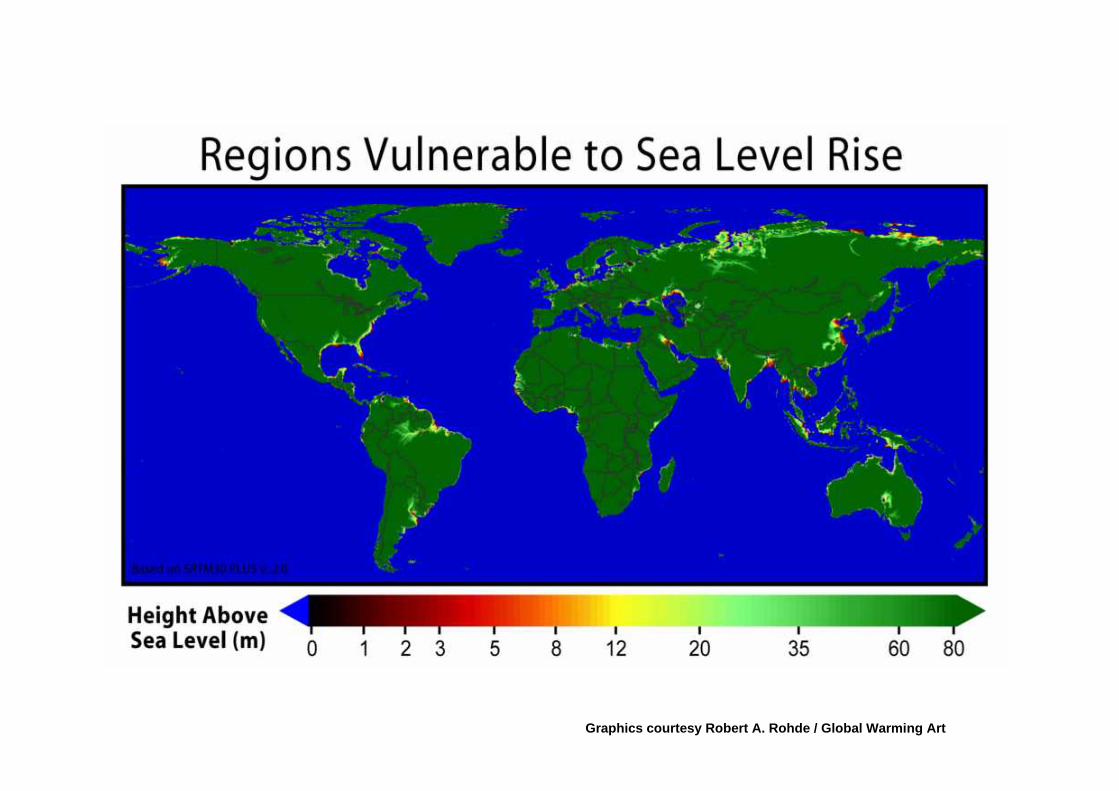
Graphics courtesy Robert A. Rohde / Global Warming Art
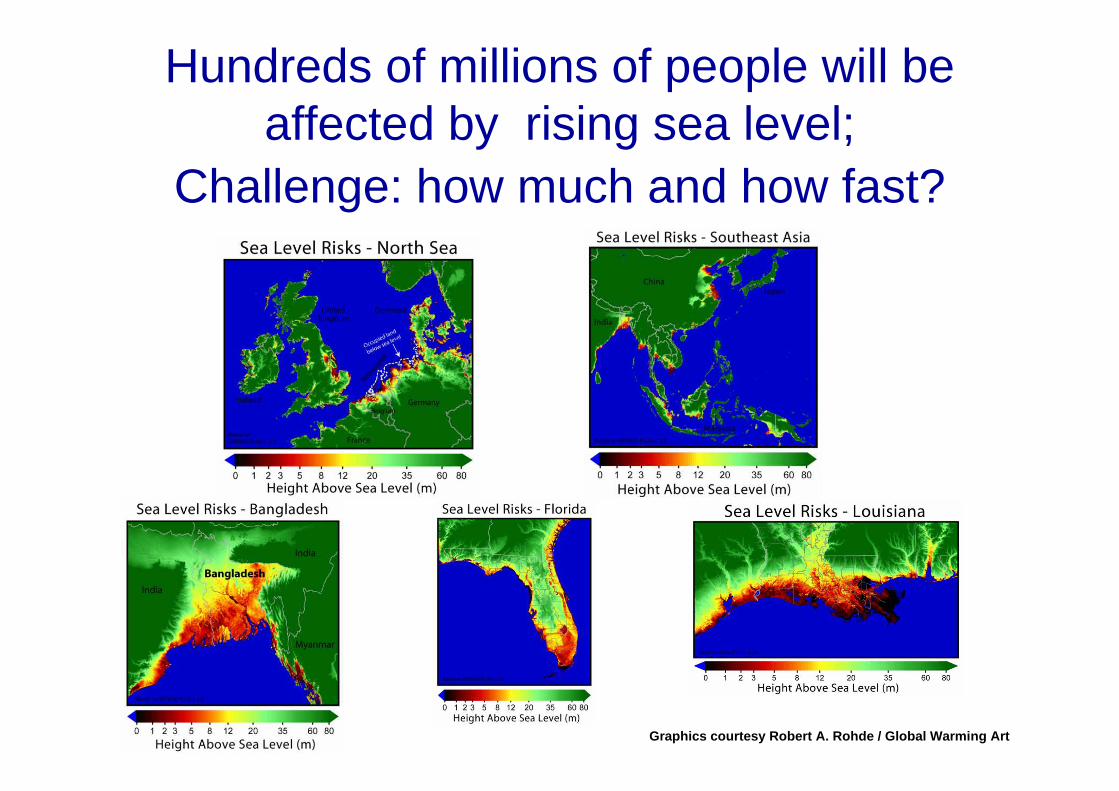
Hundreds of millions of people will be affected by rising sea level;
Challenge: how much and how fast?
Graphics courtesy Robert A. Rohde / Global Warming Art
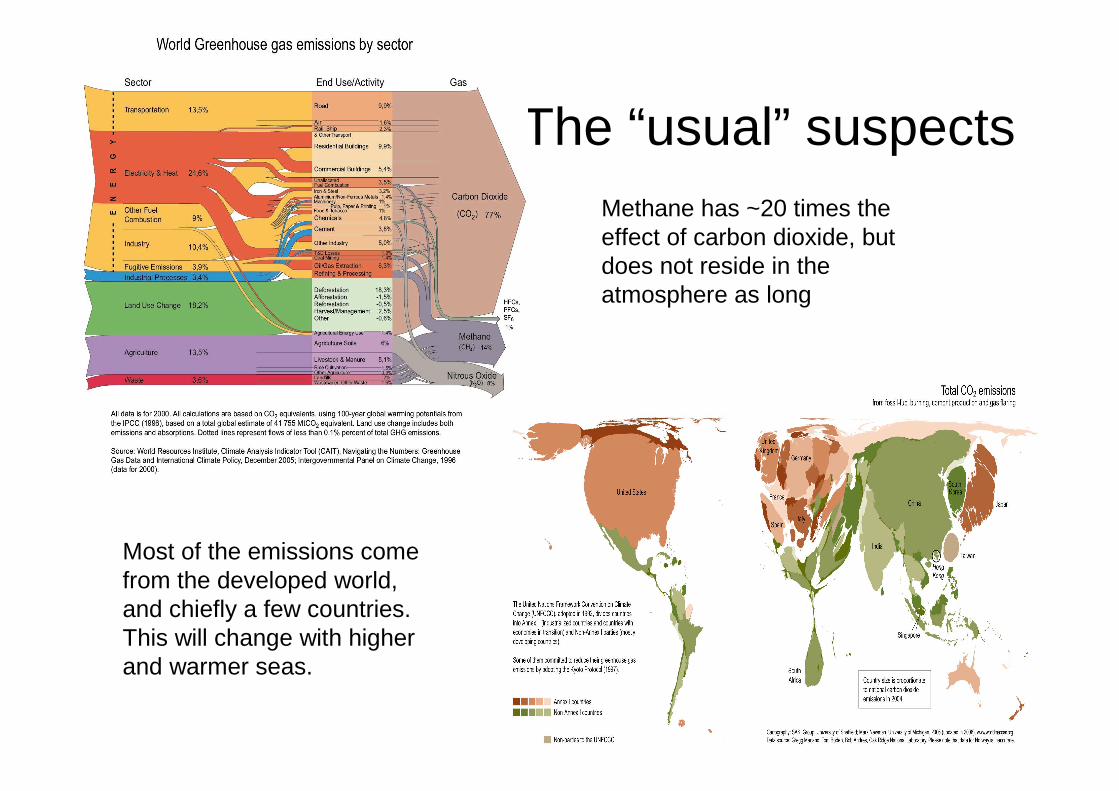
The “usual” suspectsMethane has ~20 times the effect of carbon dioxide, but does not reside in the atmosphere as long
Most of the emissions come from the developed world, and chiefly a few countries. This will change with higher and warmer seas.

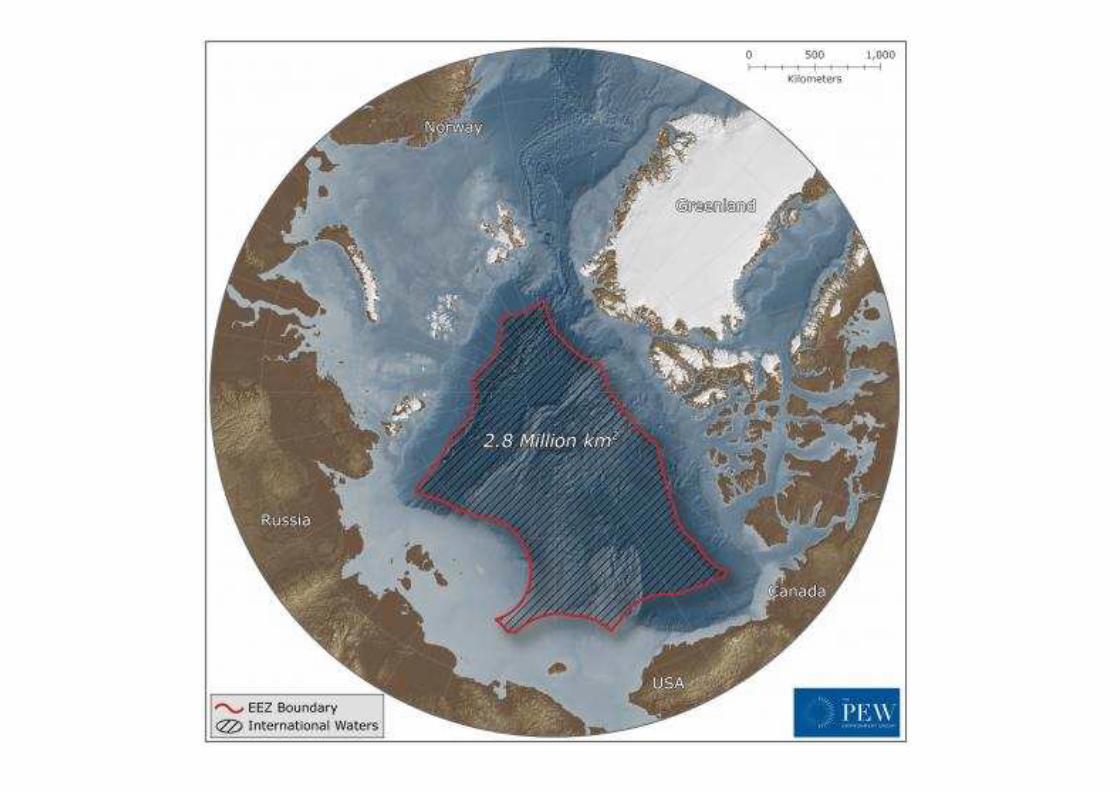
Modification of coasts (loss of peats and permafrost, release of methane, also in the
subsurface seabed- 1,000s of Gt)Challenge: How much and how fast?
Lena River delta , Siberia
Photo credit Department of Energy
North slope, Alaska
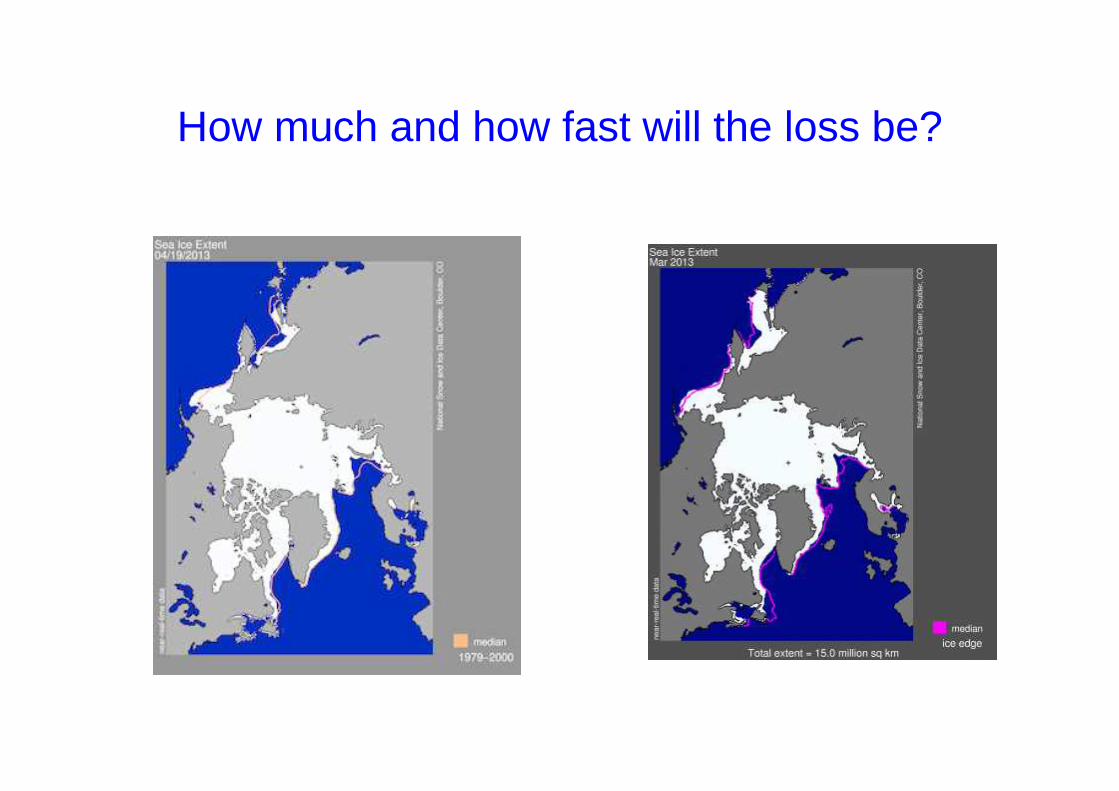
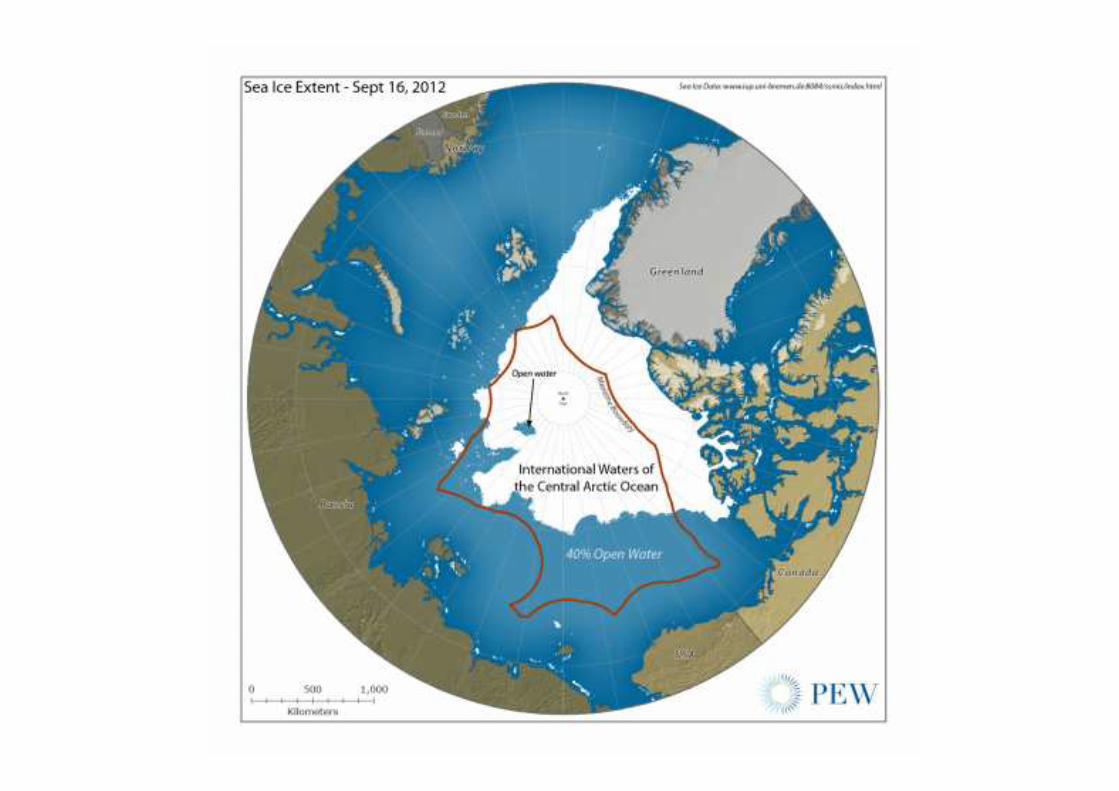
How much and how fast will the loss be?

SUMMER 2012 LOWEST EVER
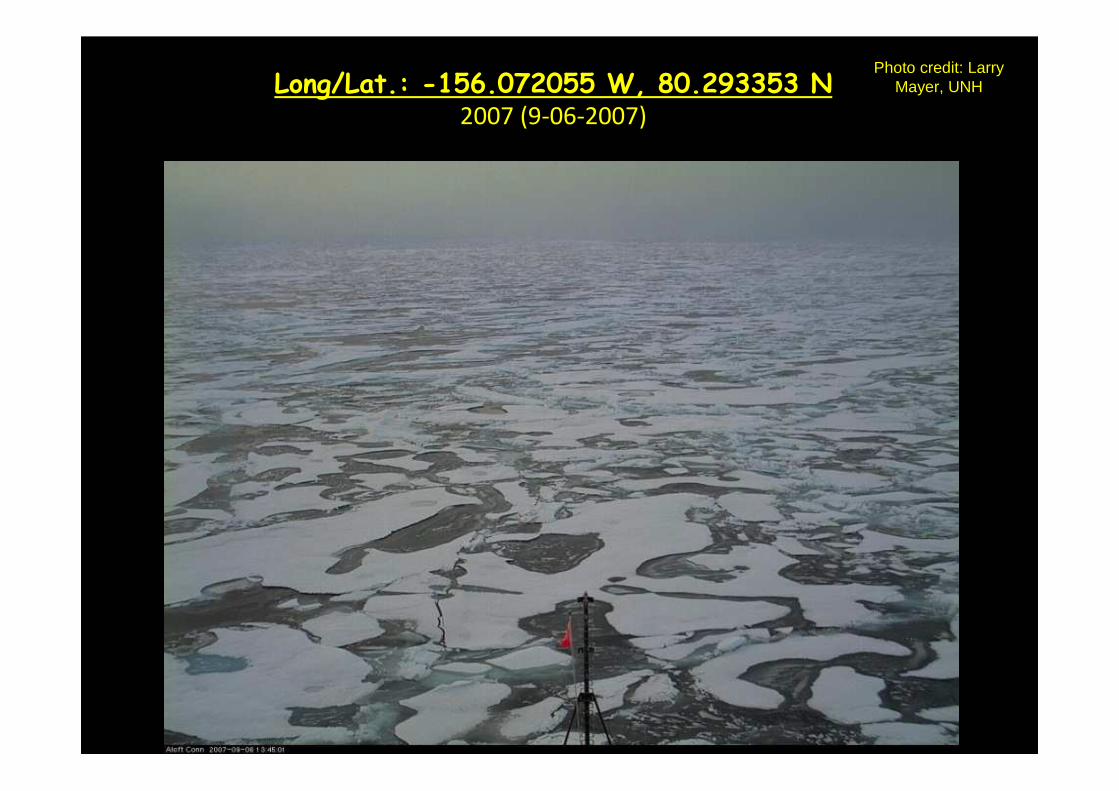
Long/Lat.: -156.072055 W, 80.293353 N2007 (9-06-2007)
Photo credit: Larry Mayer, UNH

Long/Lat.: -156.072055 W, 80.293353 N2012 (9-12-2012)
Photo credit: Larry Mayer, UNH
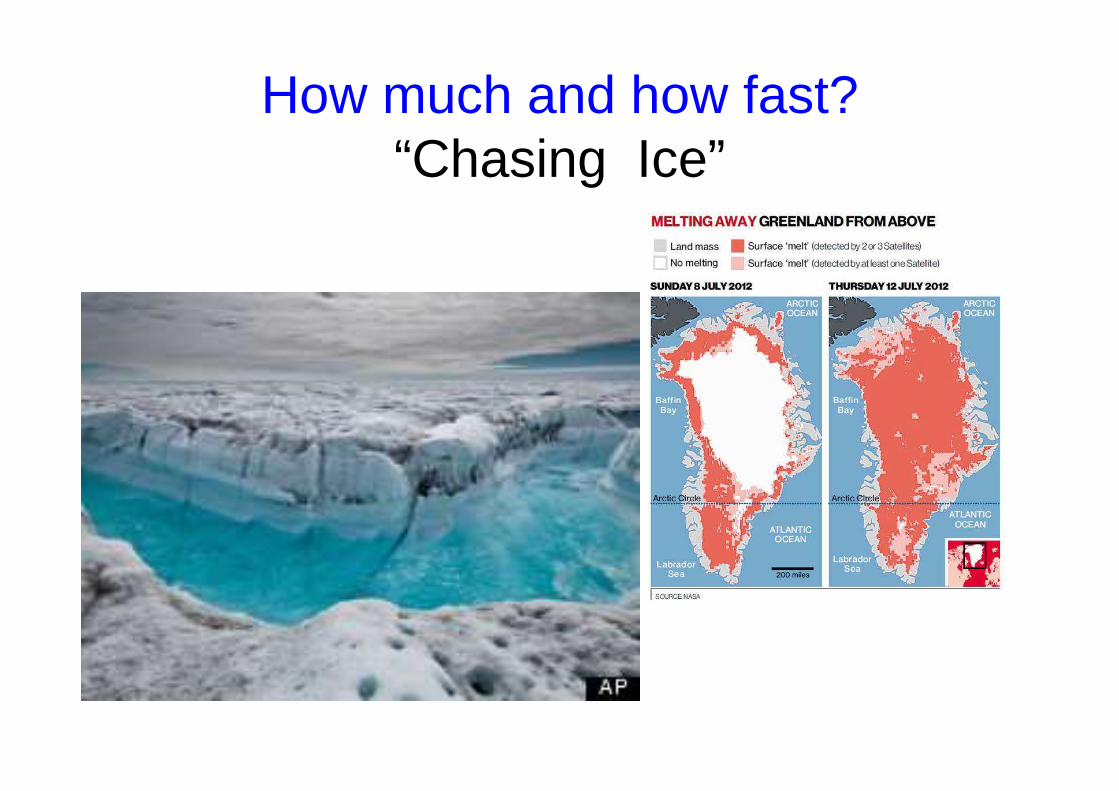
How much and how fast?“Chasing Ice”
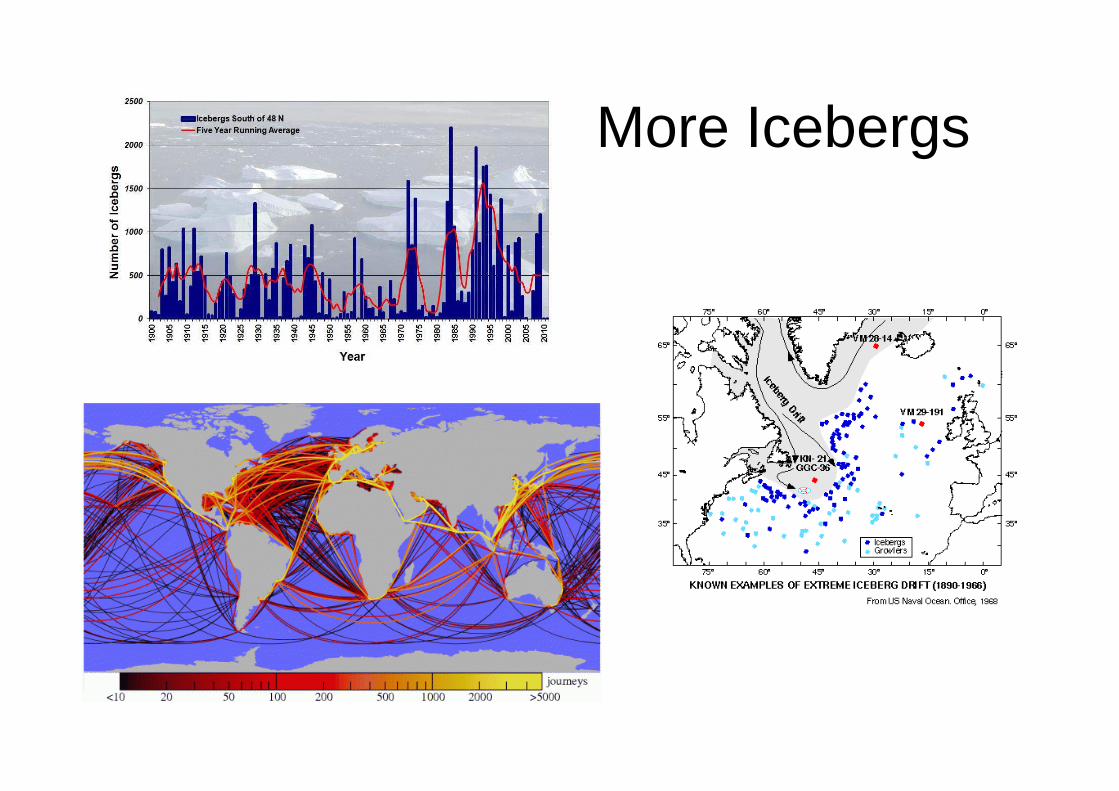
More Icebergs

Transfer by air (winds) and water (currents)
Surplus
Deficit
Currents carry about 50-60% of excess at the equator
Winds dominate in high latitudes
Graphic courtesy Introduction to Oceanography, Sverdrup et al. Prentice Hall
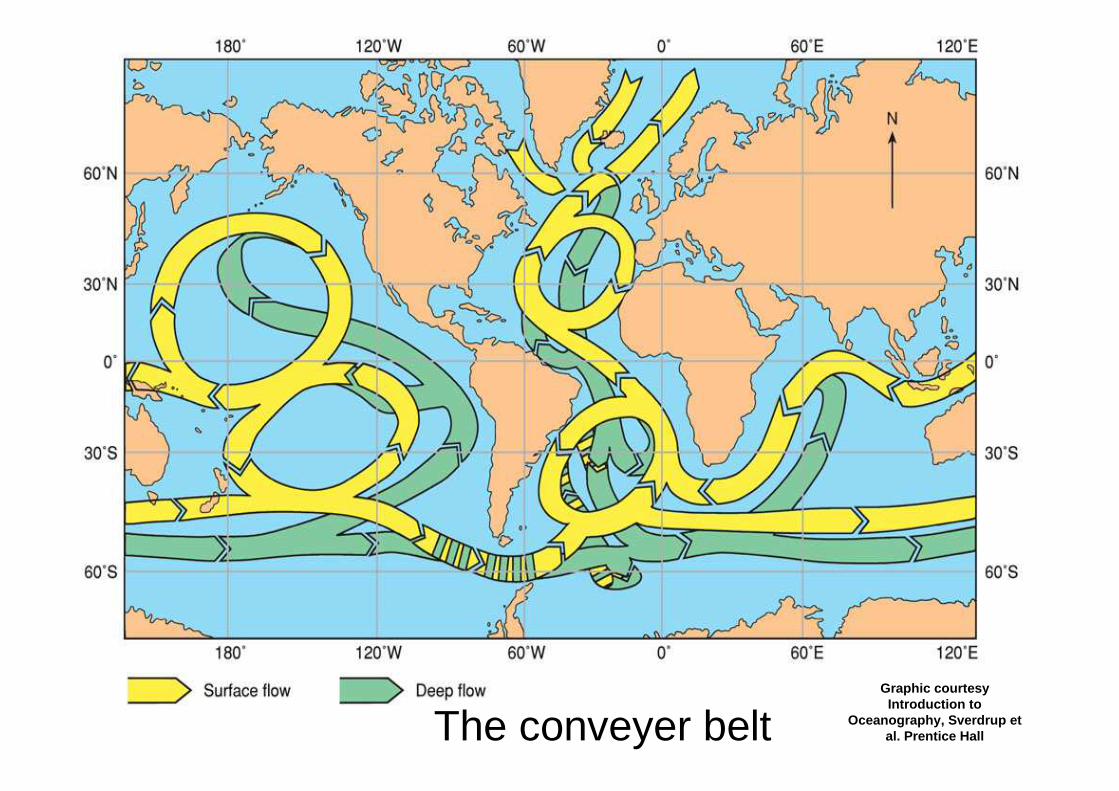
The conveyer beltGraphic courtesy
Introduction to Oceanography, Sverdrup et
al. Prentice Hall
How much and how fast?

Implications: High pressure/ low pressure systems
• Zones of water land interactions/onshore and the offshore

Challenge: a growing population
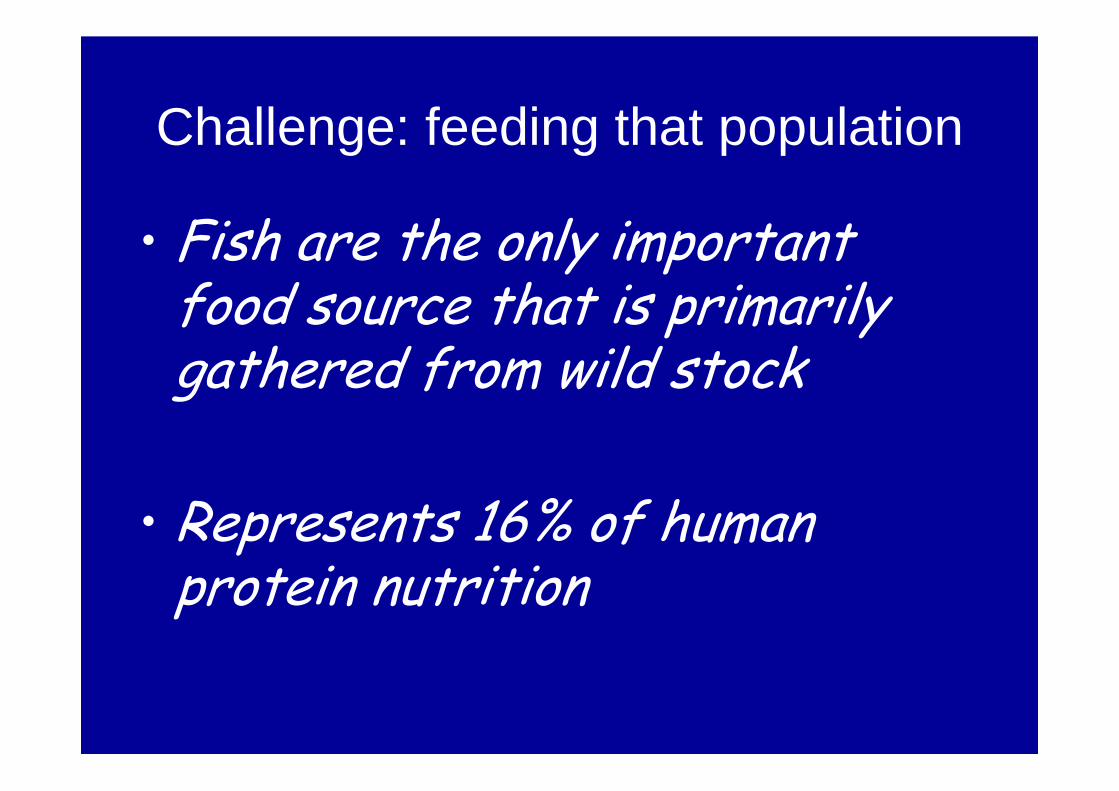
Challenge: feeding that population
• Fish are the only important food source that is primarily gathered from wild stock
• Represents 16% of human protein nutrition
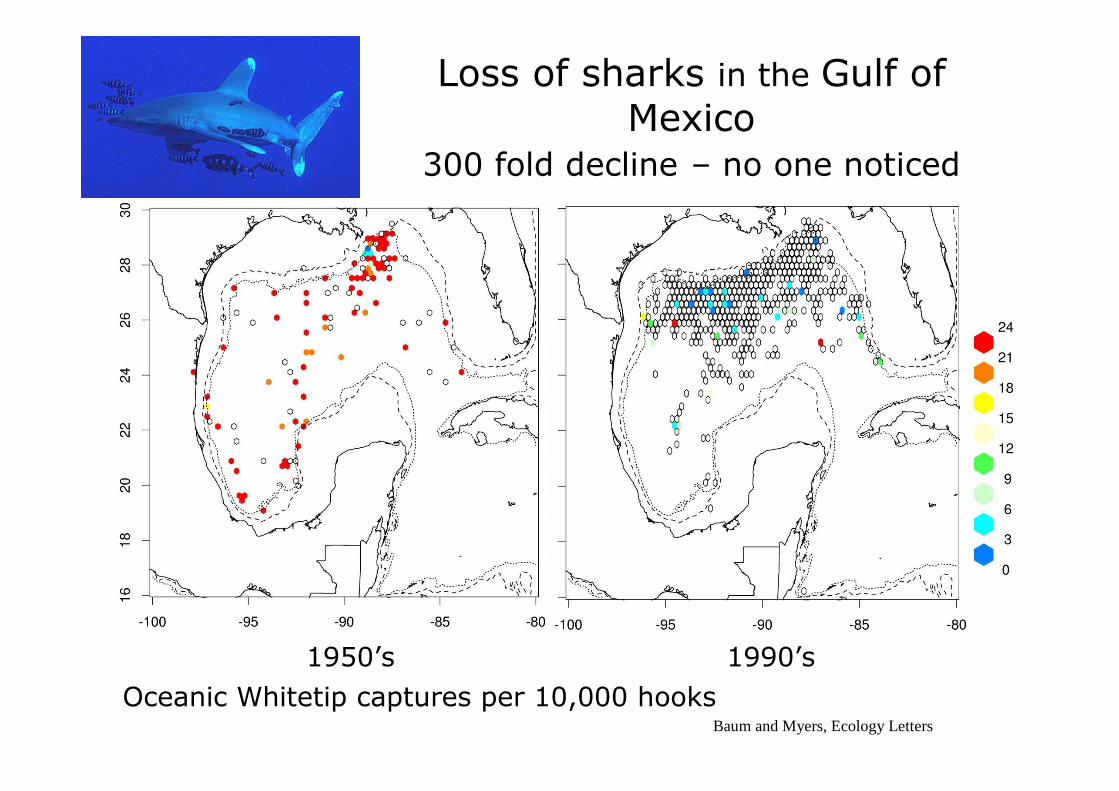
Loss of sharks in the Gulf of Mexico
300 fold decline – no one noticed
Oceanic Whitetip captures per 10,000 hooks
1950’s 1990’s
Baum and Myers, Ecology Letters
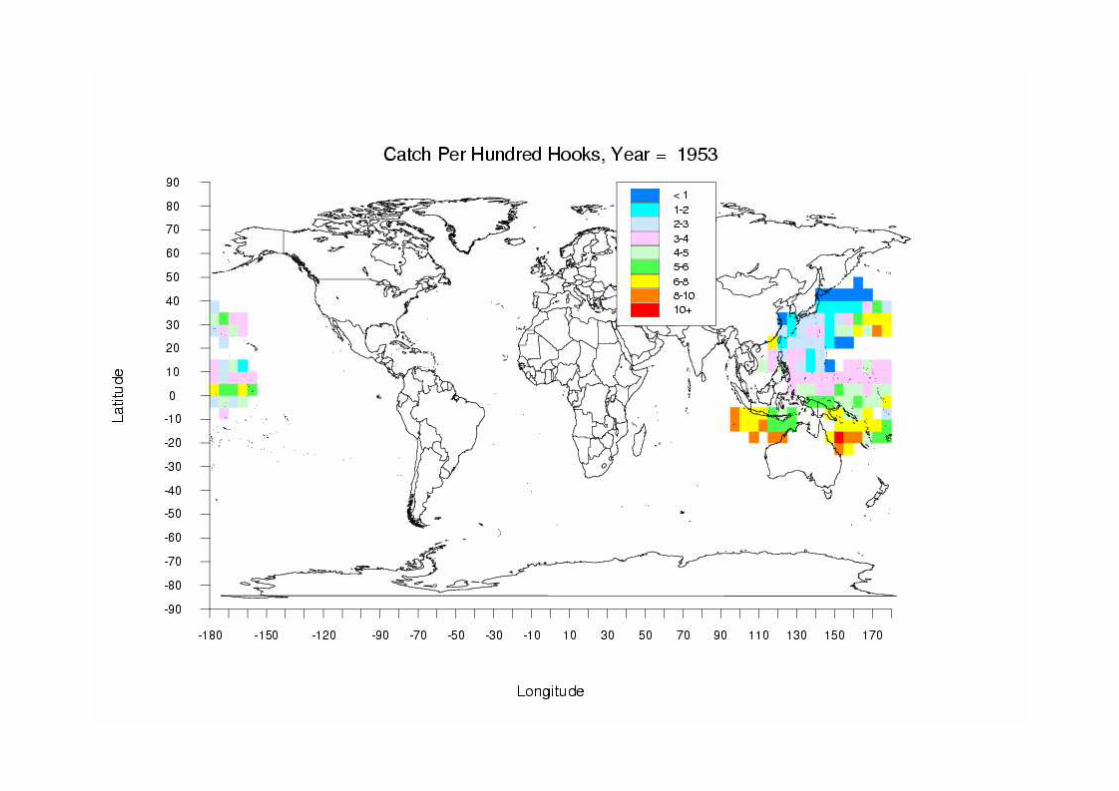
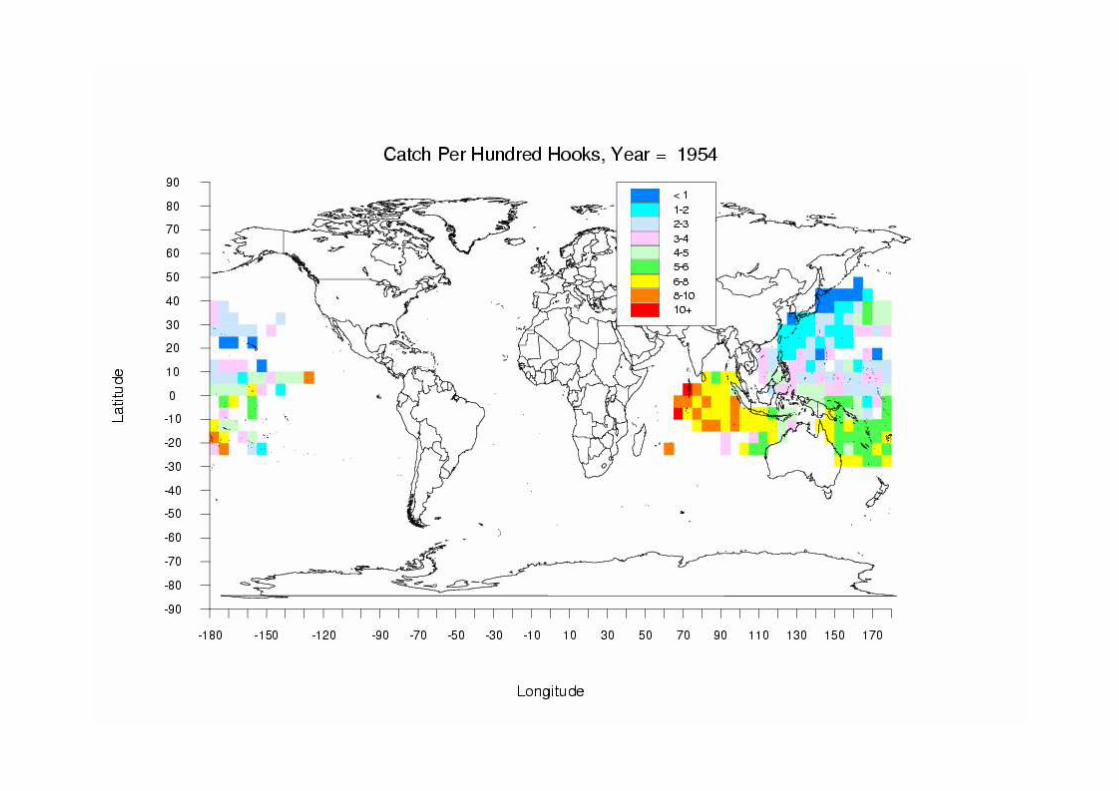
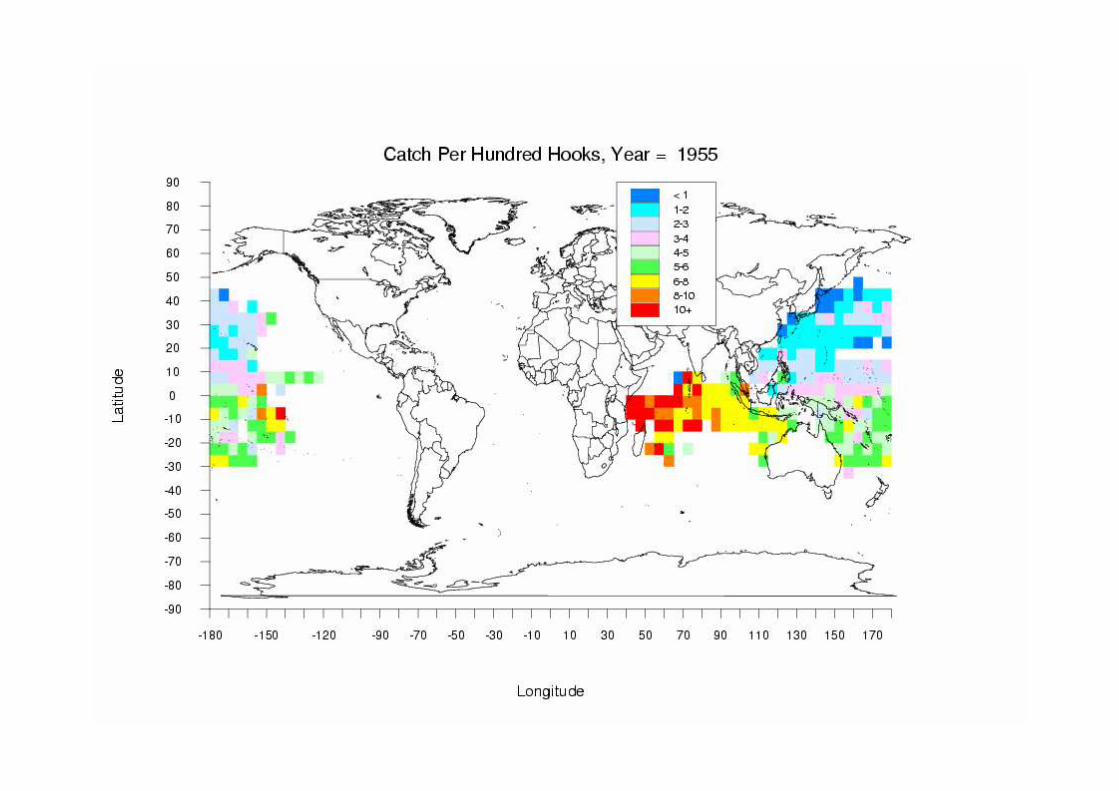
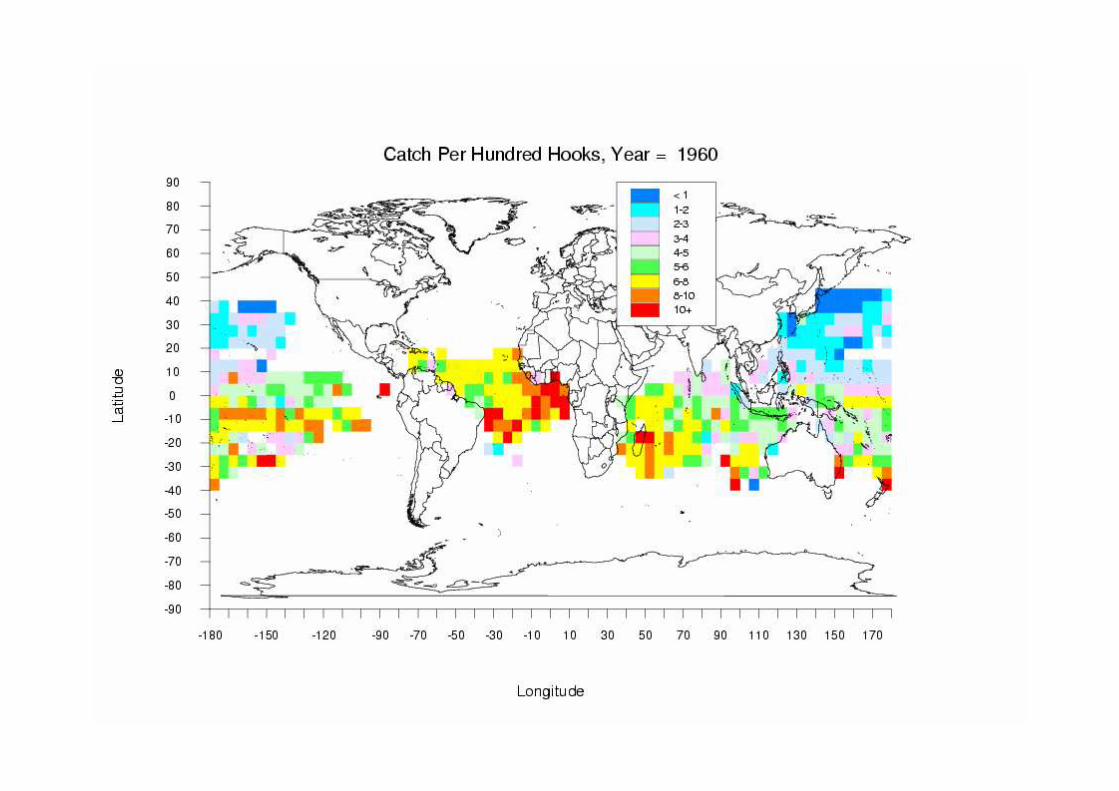

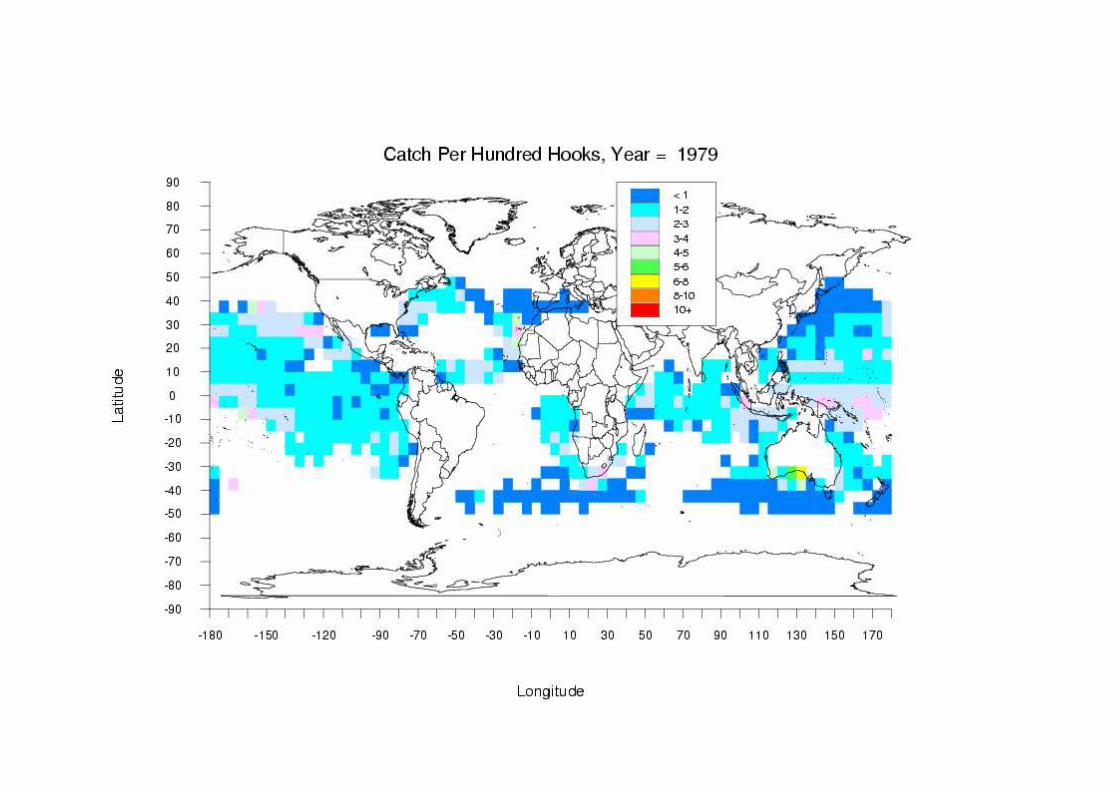
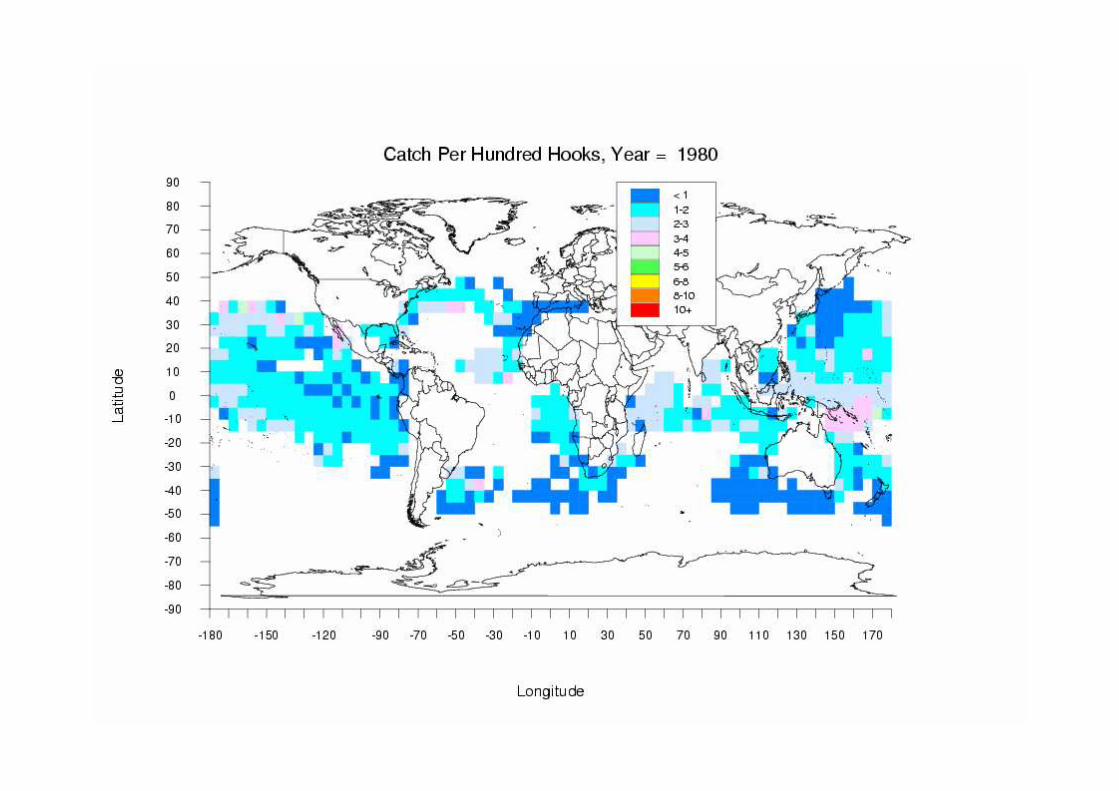

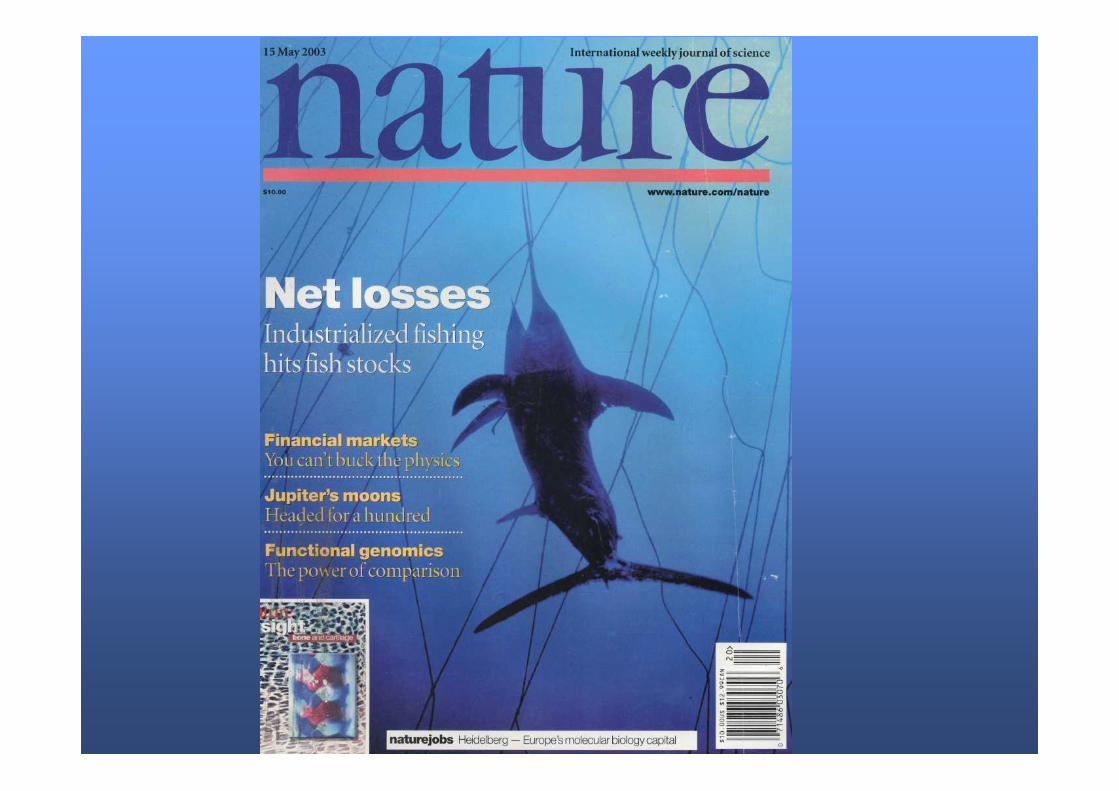
Open Ocean Fishery: Ram Myers: Science
� Tuna, billfishes, sharks
� In the northern hemisphere intensive fisheries were being
conducted before quantitative records were kept
� Japan harvested ~1,000,000 tons of tuna and marlin in the 5 years before WWII.
� In 1950 the US harvested ~170,000 tons.
� The 1950 harvest of albacore by Spain was greater than the recent total recent harvest in the North Atlantic.
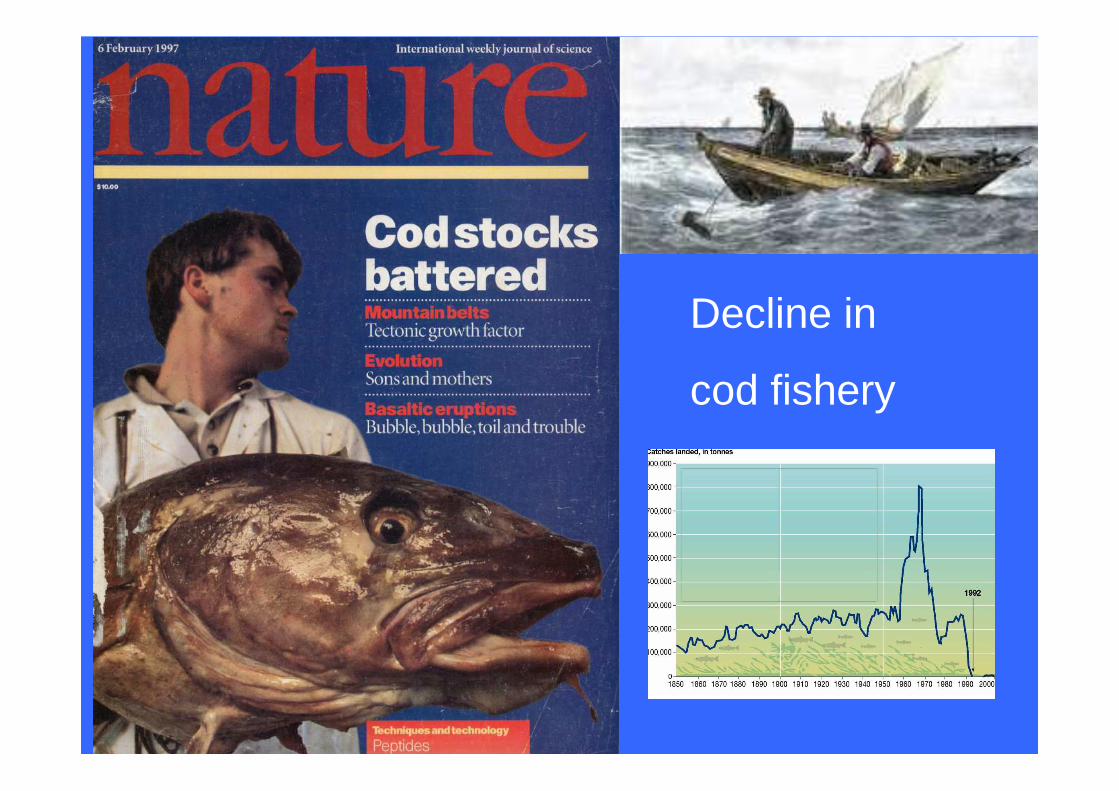
Decline in
cod fishery

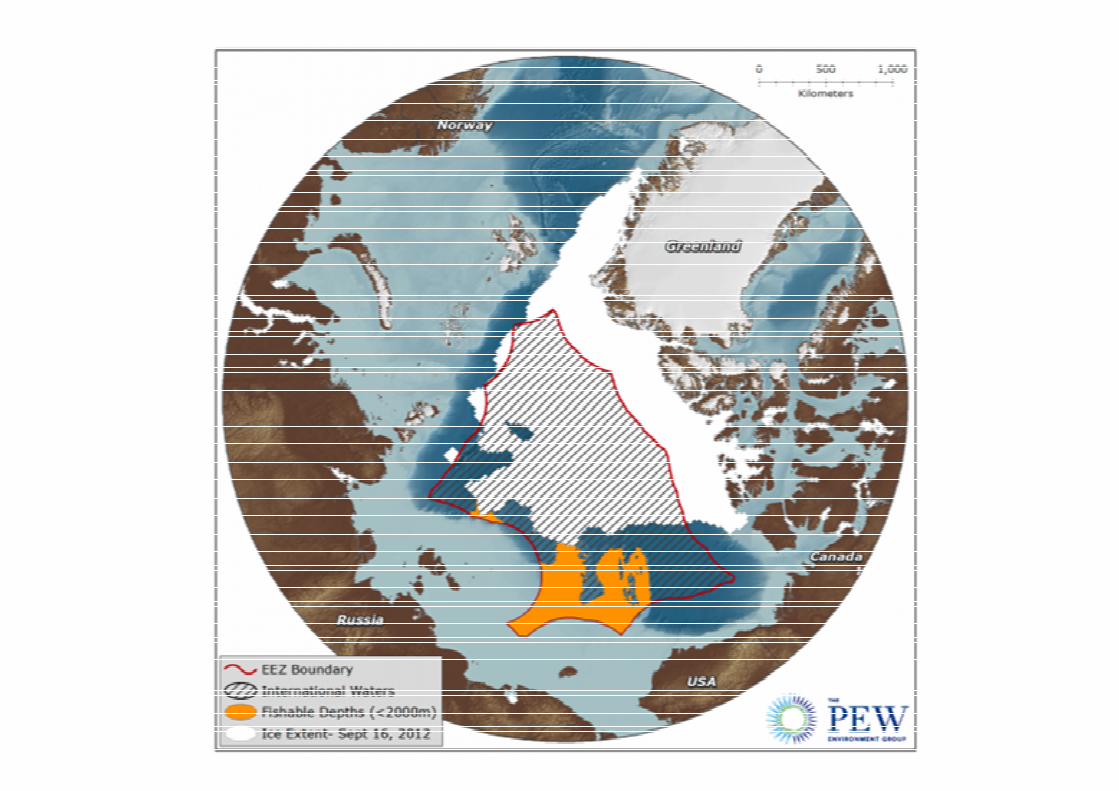
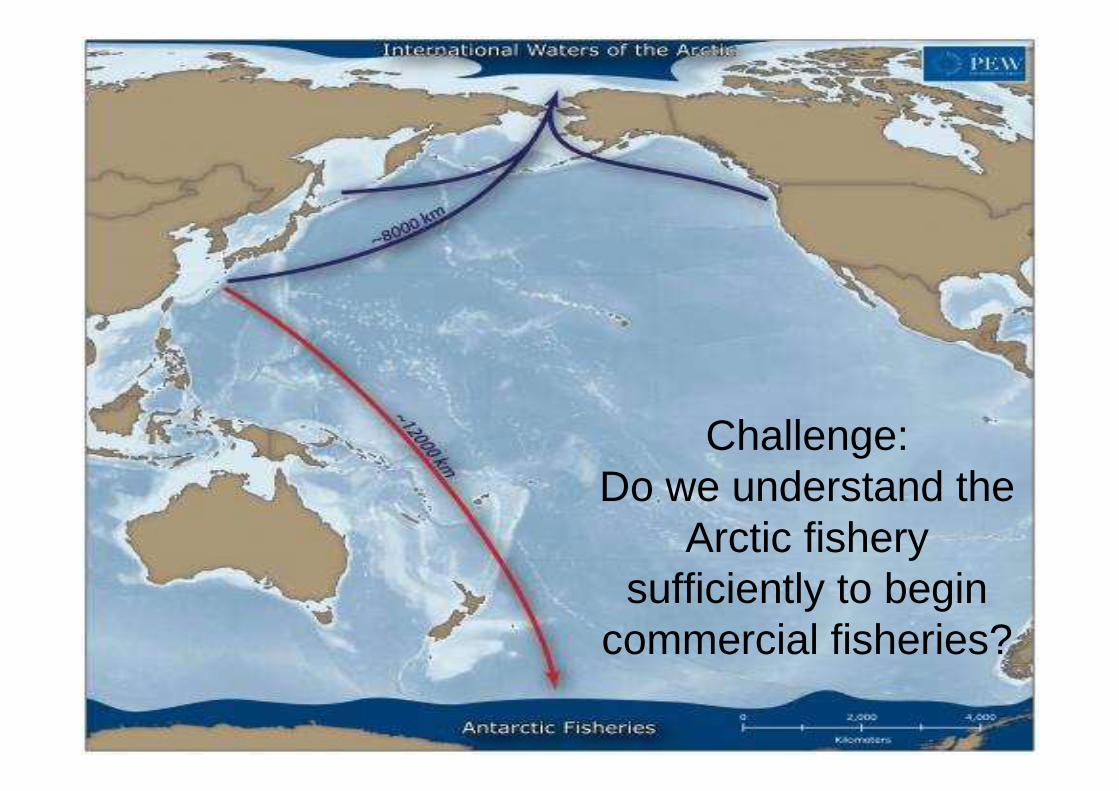
Challenge: Do we understand the
Arctic fishery sufficiently to begin
commercial fisheries?
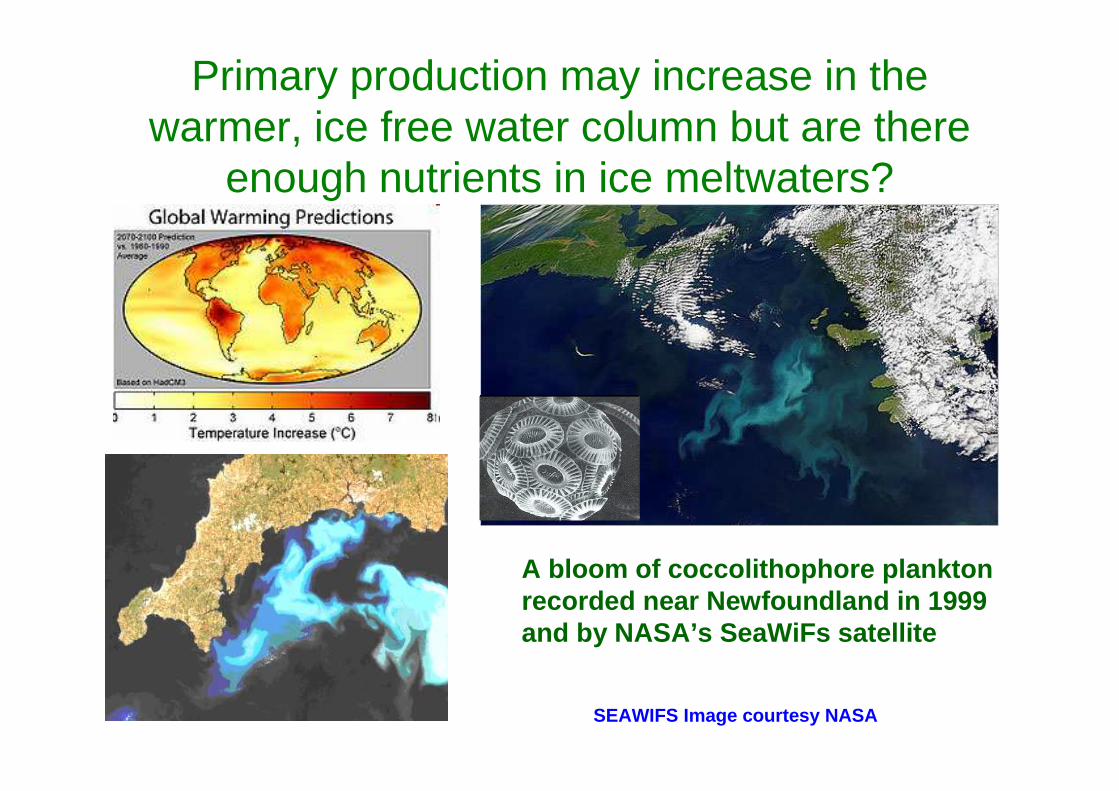
Primary production may increase in the warmer, ice free water column but are there
enough nutrients in ice meltwaters?
A bloom of coccolithophore plankton recorded near Newfoundland in 1999 and by NASA’s SeaWiFs satellite
SEAWIFS Image courtesy NASA
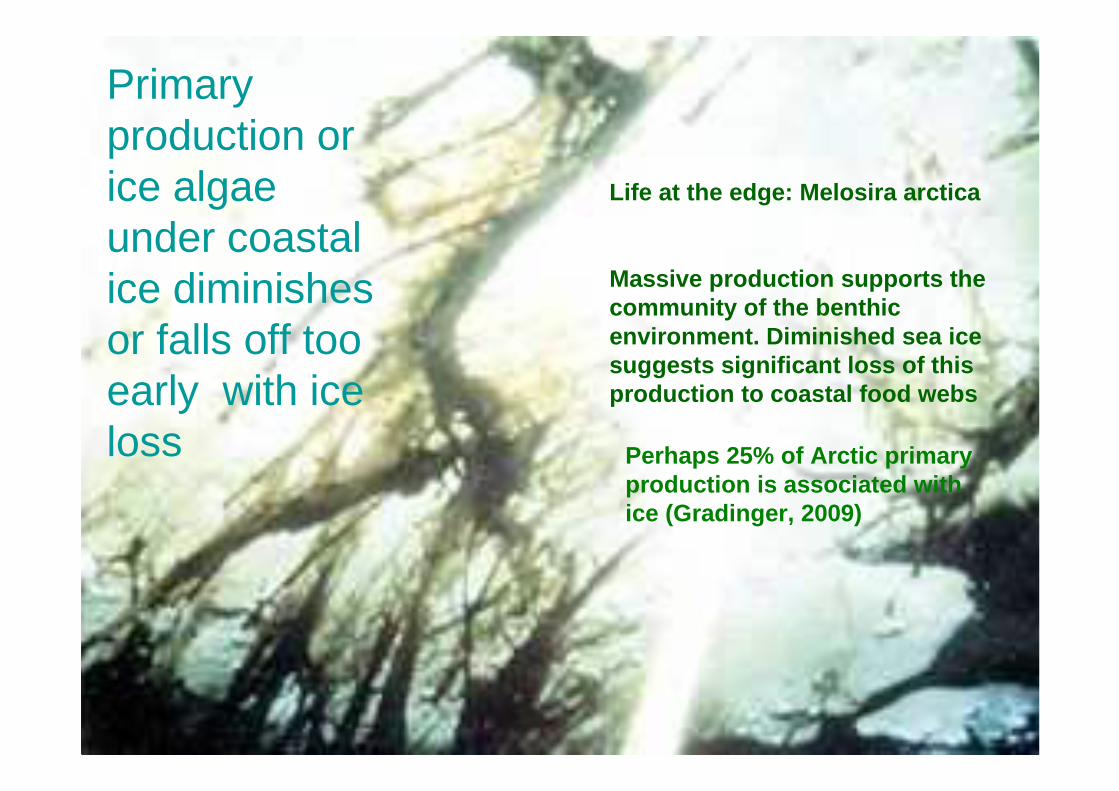
Life at the edge: Melosira arctica
Massive production supports the community of the benthic environment. Diminished sea ice suggests significant loss of this production to coastal food webs
Perhaps 25% of Arctic primary production is associated with ice (Gradinger, 2009)
Primary production or ice algae under coastal ice diminishes or falls off too early with ice loss

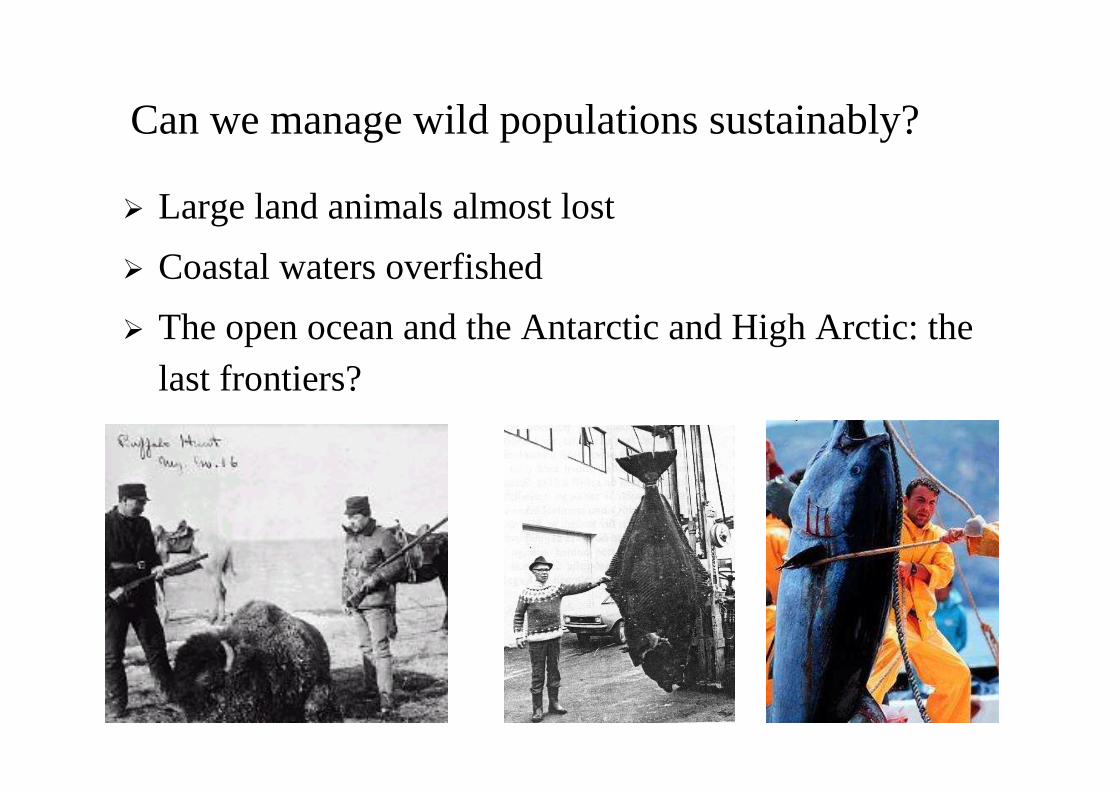
Can we manage wild populations sustainably?
� Large land animals almost lost
� Coastal waters overfished
� The open ocean and the Antarctic and High Arctic: the last frontiers?

U.S. Bans Commercial Fishing in Warming Arctic : 2009

Overfished , closed and still has not recovered

Not aimed at conservation
but on management
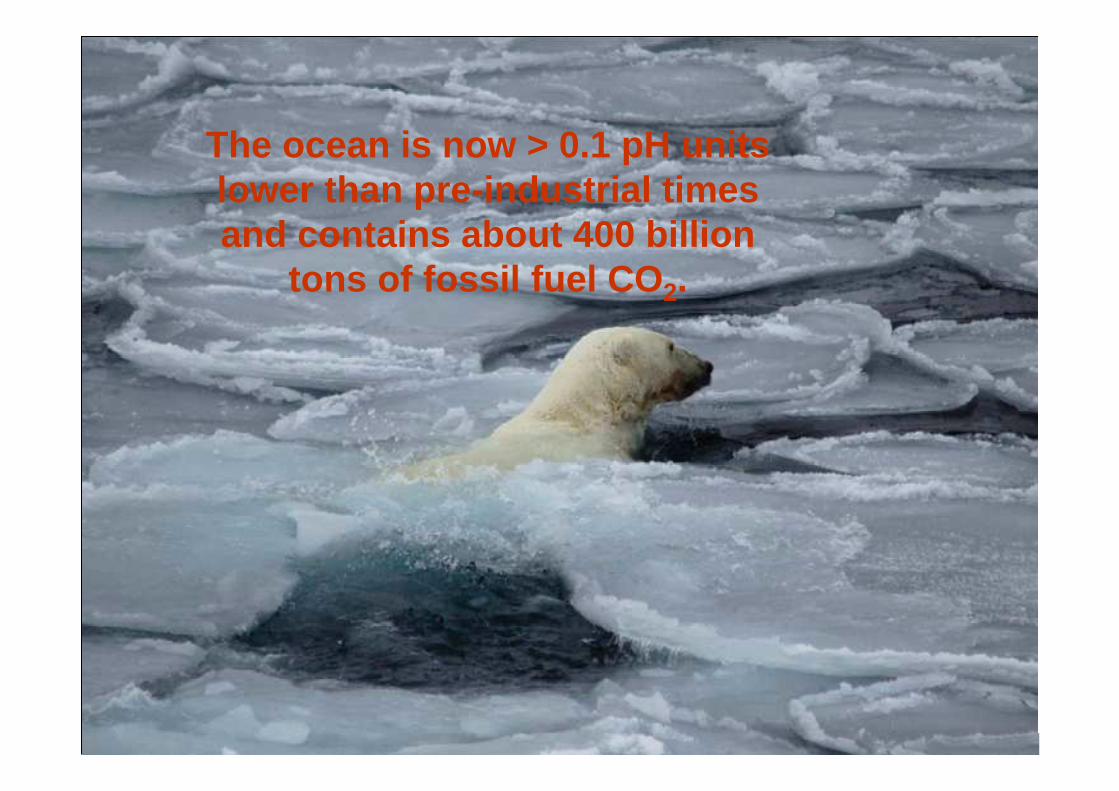
The ocean is now > 0.1 pH units lower than pre-industrial times and contains about 400 billion
tons of fossil fuel CO 2.
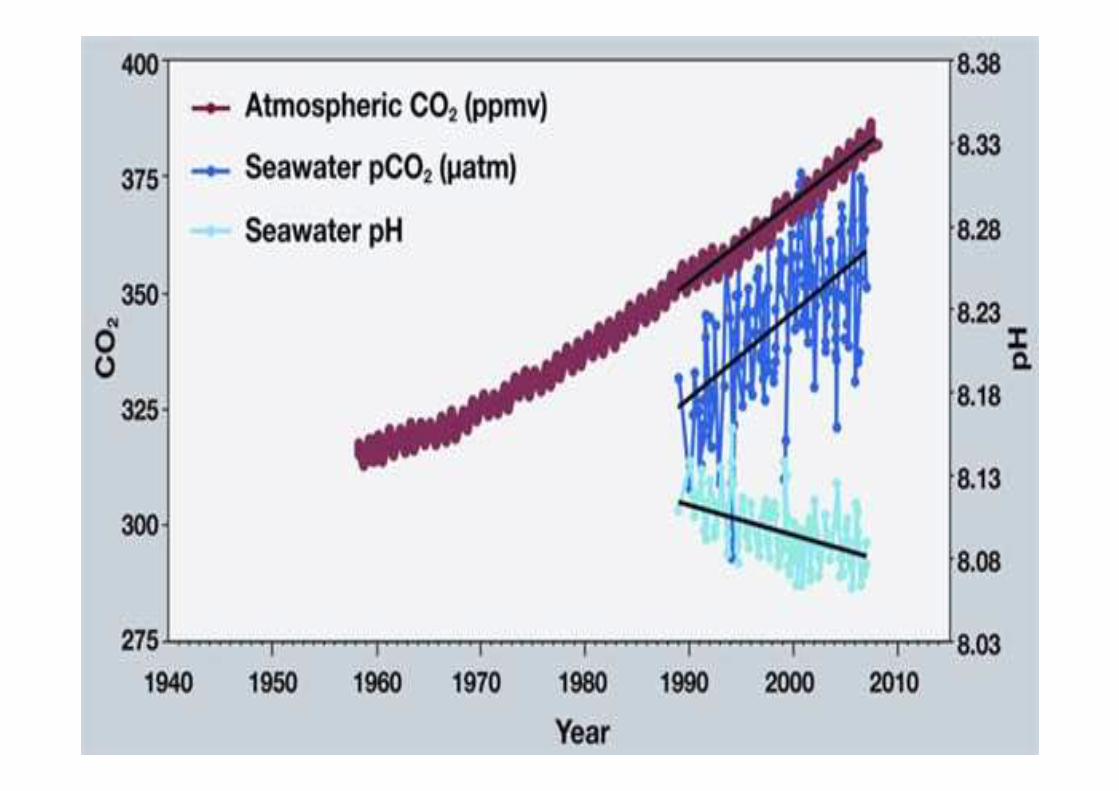

Declining pH of the Ocean:increasing acidity, declining carbonate
7.87(2.35x H+)
8.13(1.29x H+)
8.24pH of the Ocean
750 (2.73x)375 (1.36x)275CO2 ppm
2100?20001750Year
Lowest pH in millions of years
Effect is highly predictable
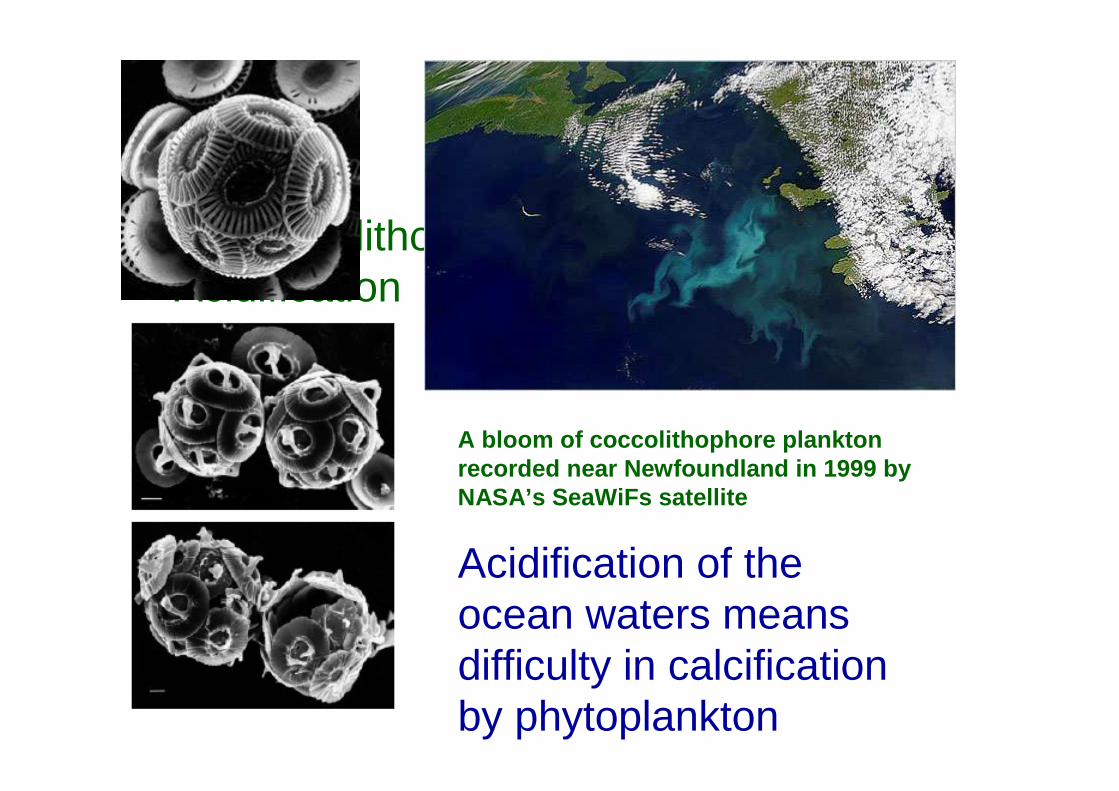
Coccolithophores and Ocean Acidification
A bloom of coccolithophore plankton recorded near Newfoundland in 1999 by NASA’s SeaWiFs satellite
Acidification of the ocean waters means difficulty in calcification by phytoplankton

Graphic courtesy Introduction to Oceanography, Sverdrup et al. Prentice Hall
Recognize change cascades with trophic level
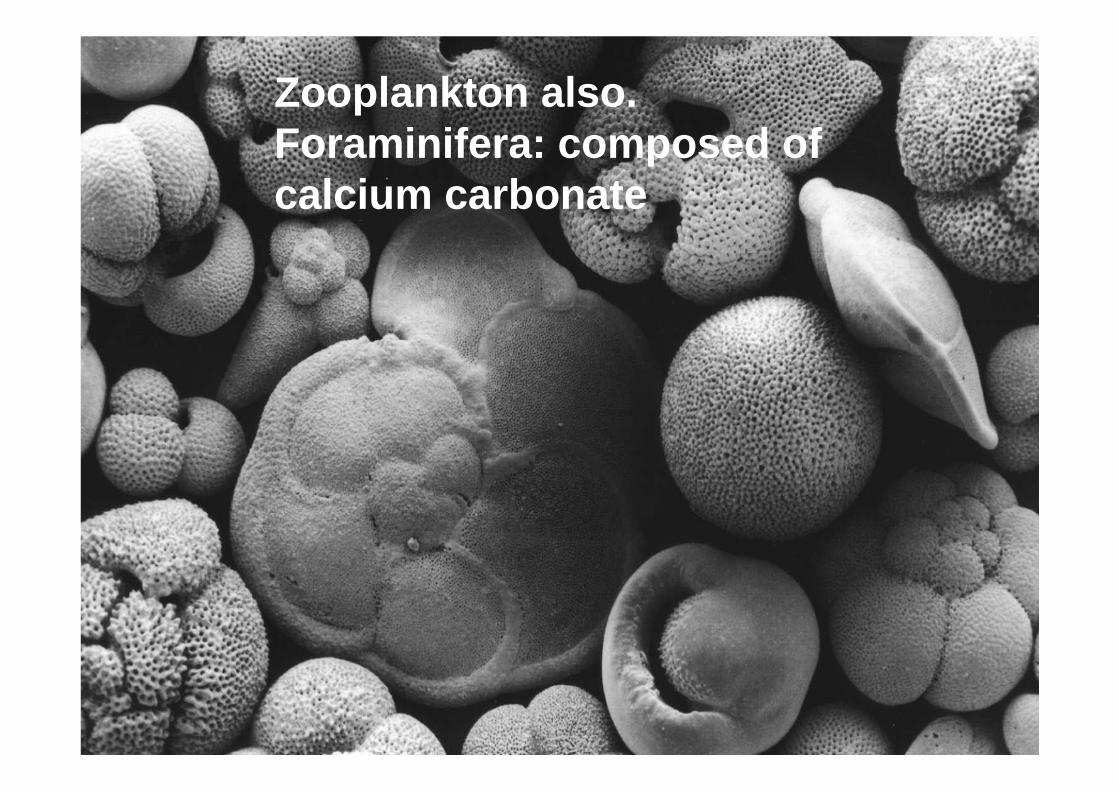
Zooplankton also. Foraminifera: composed of calcium carbonate
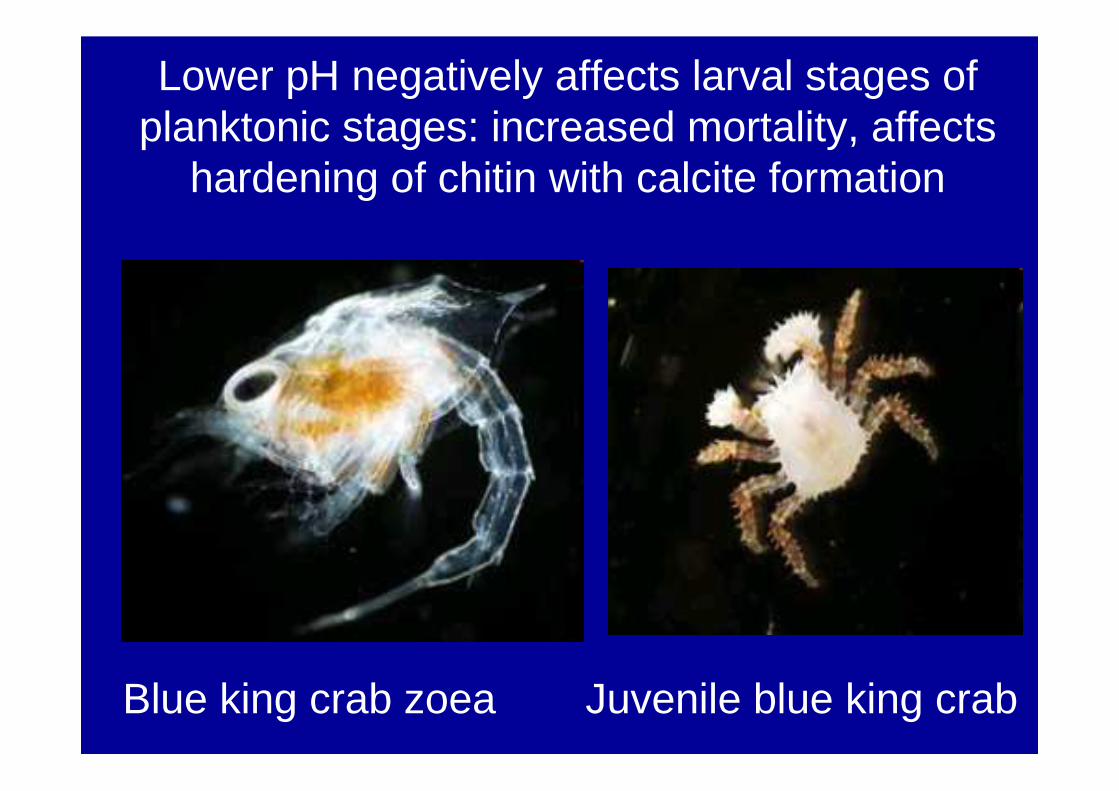
Lower pH negatively affects larval stages of planktonic stages: increased mortality, affects
hardening of chitin with calcite formation
Blue king crab zoea Juvenile blue king crab
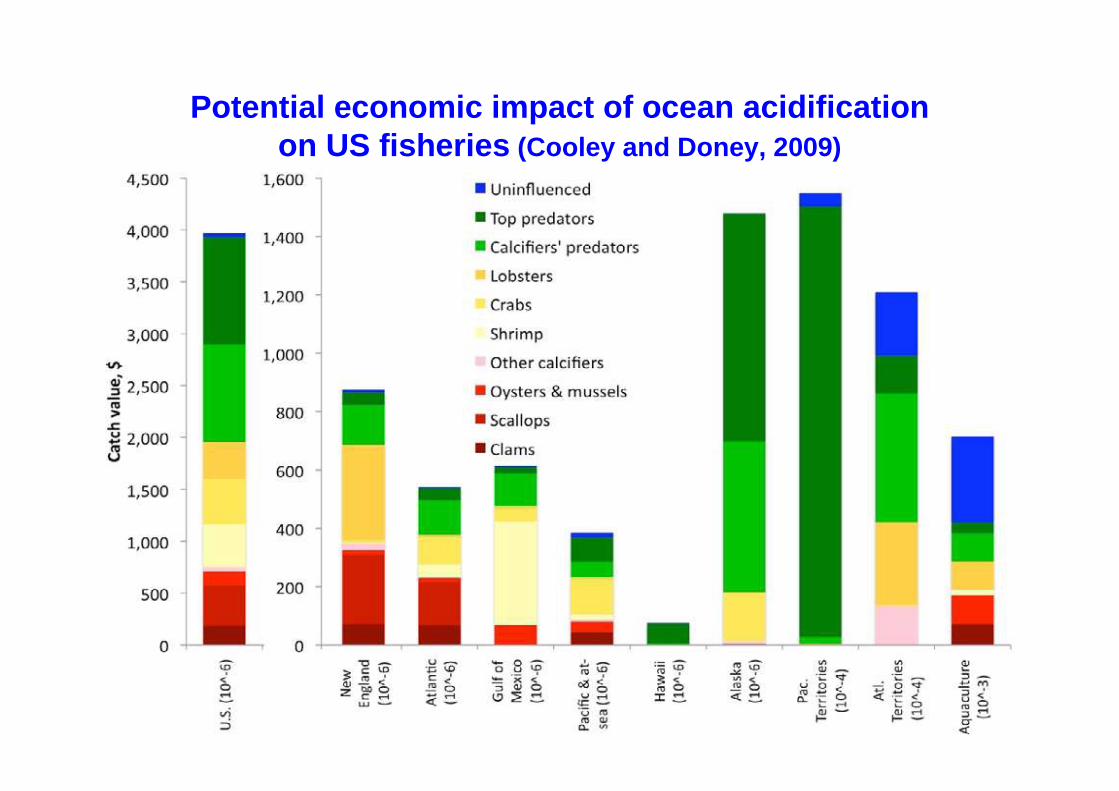
Potential economic impact of ocean acidification on US fisheries (Cooley and Doney, 2009)

Spill date: 20 April – 15 July 2010Well officially sealed: 19 September 2010
Challenge:Technology has outpaced our ability to respond.
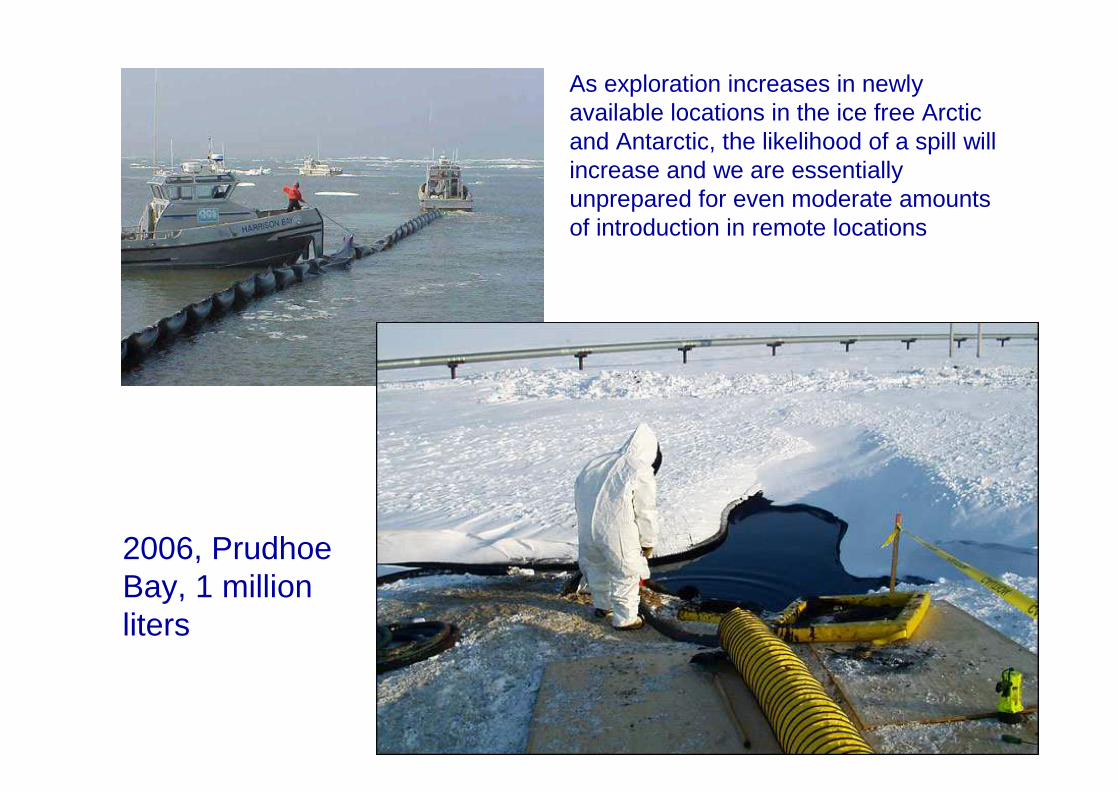
As exploration increases in newly available locations in the ice free Arctic and Antarctic, the likelihood of a spill will increase and we are essentially unprepared for even moderate amounts of introduction in remote locations
2006, Prudhoe Bay, 1 million liters
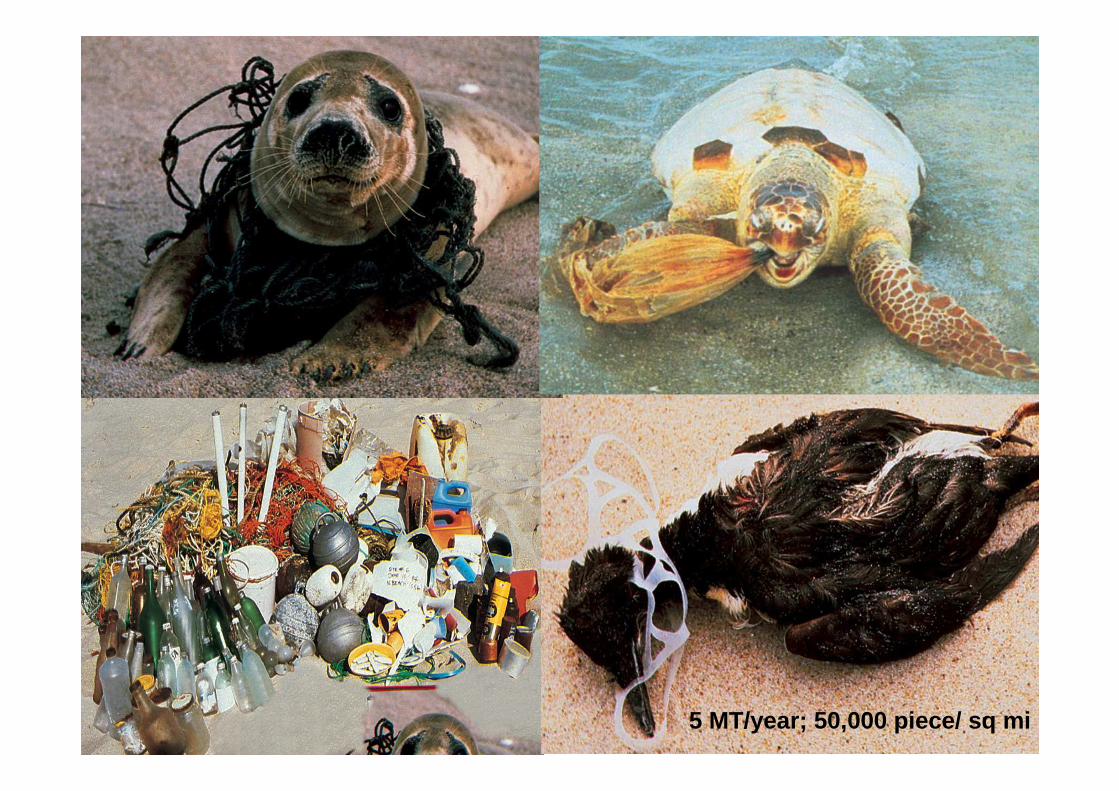
5 MT/year; 50,000 piece/ sq mi

Dead Zones in the Dead Zones in the
Gulf of MexicoGulf of Mexico
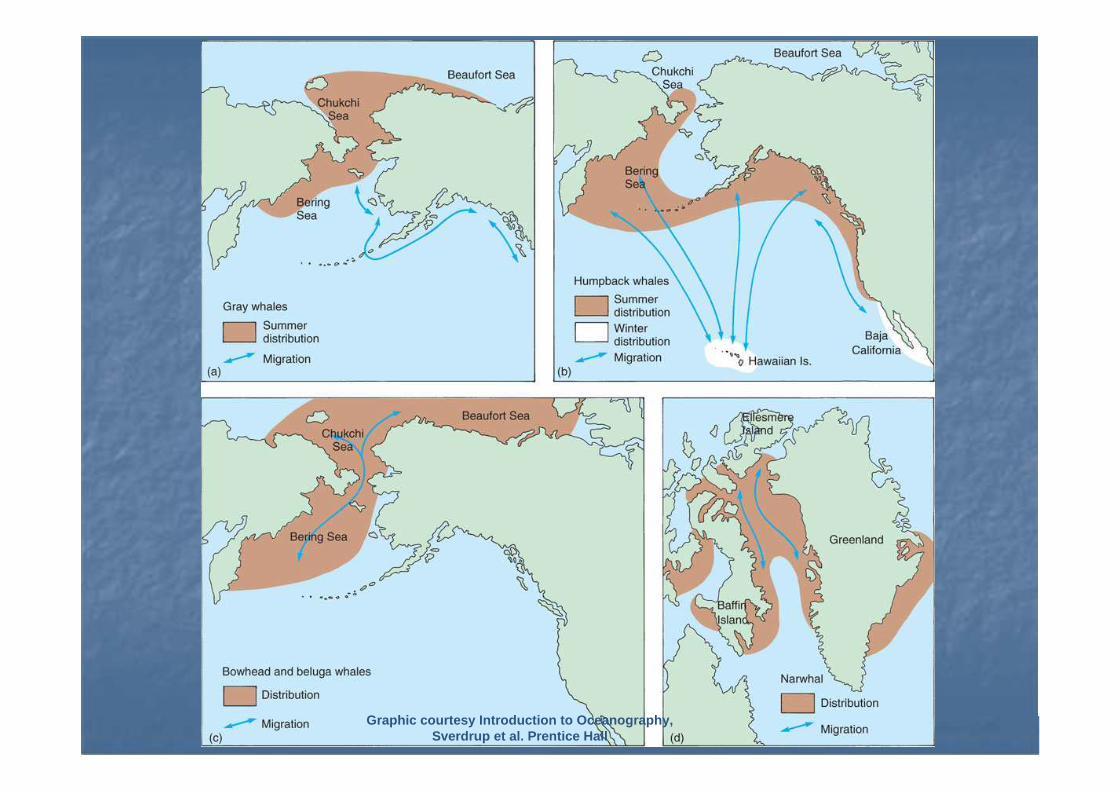
Figure 17_02
Graphic courtesy Introduction to Oceanography, Sverdrup et al. Prentice Hall
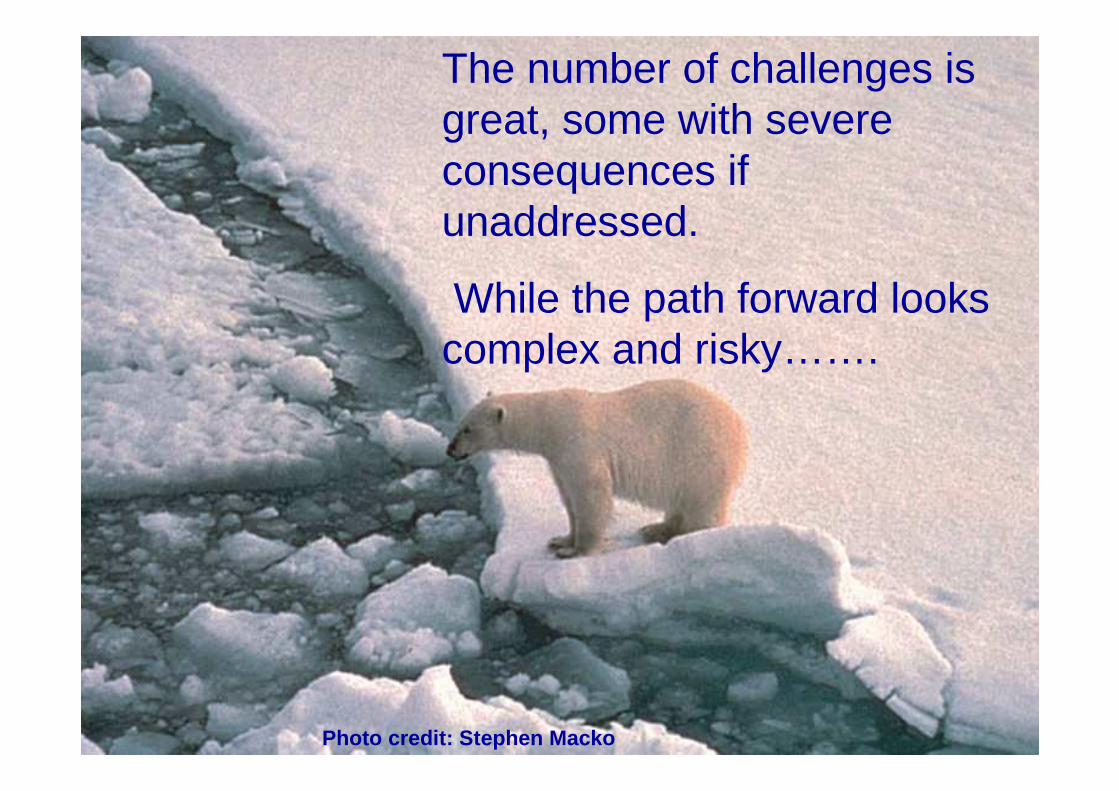
Figure 17_07
The number of challenges is great, some with severe consequences if unaddressed.
While the path forward looks complex and risky…….
Photo credit: Stephen Macko

There are paths…
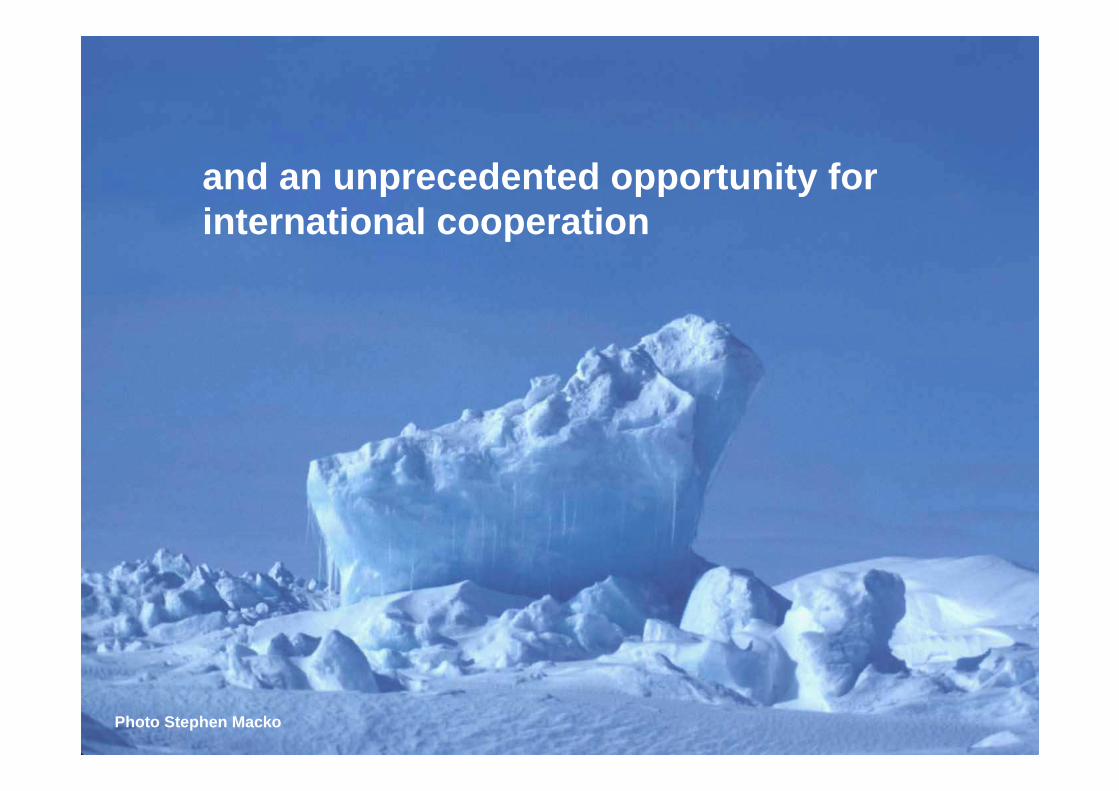
and an unprecedented opportunity for international cooperation
Photo Stephen Macko

Thank you.


