
This article was downloaded by: [84.52.181.24]On: 30 July 2015, At: 12:20Publisher: RoutledgeInforma Ltd Registered in England and Wales Registered Number: 1072954Registered office: 5 Howick Place, London, SW1P 1WG
Feminist EconomicsPublication details, including instructions for authorsand subscription information:http://www.tandfonline.com/loi/rfec20
PlusÇa Change? evidence onglobal trends in gender normsand stereotypesStephanie Seguino aa Department of Economics , University of Vermont ,Old Mill 237, Burlington, Vermont, 05401, USA E-mail:Published online: 06 Nov 2008.
To cite this article: Stephanie Seguino (2007) PlusÇa Change? evidence on globaltrends in gender norms and stereotypes, Feminist Economics, 13:2, 1-28, DOI:10.1080/13545700601184880
To link to this article: http://dx.doi.org/10.1080/13545700601184880
PLEASE SCROLL DOWN FOR ARTICLE
Taylor & Francis makes every effort to ensure the accuracy of all theinformation (the “Content”) contained in the publications on our platform.However, Taylor & Francis, our agents, and our licensors make norepresentations or warranties whatsoever as to the accuracy, completeness, orsuitability for any purpose of the Content. Any opinions and views expressedin this publication are the opinions and views of the authors, and are not theviews of or endorsed by Taylor & Francis. The accuracy of the Content shouldnot be relied upon and should be independently verified with primary sourcesof information. Taylor and Francis shall not be liable for any losses, actions,claims, proceedings, demands, costs, expenses, damages, and other liabilitieswhatsoever or howsoever caused arising directly or indirectly in connectionwith, in relation to or arising out of the use of the Content.
This article may be used for research, teaching, and private study purposes.Any substantial or systematic reproduction, redistribution, reselling, loan, sub-licensing, systematic supply, or distribution in any form to anyone is expressly

forbidden. Terms & Conditions of access and use can be found at http://www.tandfonline.com/page/terms-and-conditions
Dow
nloa
ded
by [
84.5
2.18
1.24
] at
12:
20 3
0 Ju
ly 2
015

PL U S CA CH A N G E? 1 EV ID E N C E O N GL O B A L
TR E N D S I N GE N D E R NO R M S A N D
ST E R E O T Y P E S
Stephanie Seguino
ABSTRACT
Gender norms and stereotypes that perpetuate inequality are deeply embeddedin social and individual consciousness and, as a result, are resistant to change.Gender stratification theories propose that women’s control over materialresources can increase bargaining power to leverage change in key institutions,prompting a shift to more equitable norms. By extension, policies that promotewomen’s paid employment should serve as a fulcrum for gender equitablechange. Is there any evidence to support this hypothesis? Investigating thisrequires a means to capture gender norms and stereotypes. The World ValuesSurvey provides just such a mechanism because it contains a series of genderquestions that span a twenty-year period and includes respondents from morethan seventy countries. This paper uses that survey’s data to analyzedeterminants of trends in norms and stereotypes over time and acrosscountries, and finds evidence that increases in women’s paid employmentpromotes gender equitable norms and stereotypes.
KEYWORDSEconomic growth, employment, gender ideology, gender norms and
stereotypes, gender roles, globalization
JEL Codes: A14, J16, J21
INTRODUCTION
Inequitable gender norms and stereotypes are embedded in political, legal,cultural, and economic domains. Because these domains structure access toand control over resources, they also reproduce, strengthen, and legitimateunequal gender systems. Thus gender inequality has both material andpsychological/social dimensions. This prompts the question: what is therelationship between these two dimensions?
Macrostructural theories of gender stratification, which are systemic innature, link the level of gender inequality to factors influencing women’sbargaining power (Rae L. Blumberg 1984, 1988; Janet Saltzman Chafetz
Feminist Economics 13(2), April 2007, 1 – 28
Feminist Economics ISSN 1354-5701 print/ISSN 1466-4372 online � 2007 IAFFEhttp://www.tandf.co.uk/journals
DOI: 10.1080/13545700601184880
Dow
nloa
ded
by [
84.5
2.18
1.24
] at
12:
20 3
0 Ju
ly 2
015

1989). The degree of gender stratification has been argued to be inverselylinked to the level of women’s economic power and the control over thematerial resources this stratification generates. Increases in women’s abilityto participate in economic production and to control the distribution oftheir production then can enhance their status and reduce physical,political, and ideological oppression.
Gender systems are undergirded by attitudes and behaviors thatlegitimize male control and undervalue women. Thus gender socialdefinitions – ideology, norms, and stereotypes – are a critical link in agender-stratified system. Most feminist theorists agree that the culturaldomain in which institutions reproduce beliefs and attitudes that shapefemale and male behavior is a key component of a gender-stratified system.The perpetuation of gender norms and stereotypes that cause women andmen to internalize as legitimate the current system of inequality results in aperception that the gender order is ‘‘natural’’ – or, as some claim,‘‘hardwired’’ – rather than socially constructed to benefit males.
If macrostructural theories have merit, it follows that the expansion ofwomen’s access to resources may be a vehicle for transforming an unequalgender system. In economies with well-developed labor markets, anincrease in women’s share of employment, for example, may providethem with the power to promote change at multiple levels – in thehousehold and in institutional domains that create and reinforce gendernorms and stereotypes. Numerous factors might stimulate increases inwomen’s share of economic activity: rapid economic growth, structuralchange in the economy, or even economic crisis that reduces men’s accessto income. We can hypothesize that women’s increased economic activity islikely to exert a positive effect on gender equality and should producechanges in gender norms and stereotypes, although with a lag. This papertests that hypothesis using data from the World Values Survey (variousyears). In particular, it assesses the effect of changes in women’s economicactivity on trends in gender norms and stereotypes to determine if there is asignificant causal relationship.
THE LINK BETWEEN WOMEN’S RELATIVE ECONOMICPOWER AND GENDER NORMS AND STEREOTYPES
The stratified gender system that results in material inequality betweenwomen and men is buttressed by social definitions – that is, a set of genderideology, norms, and stereotypes. These serve to devalue women andsupport traits and behaviors for men and women that reinforce the genderdivision of labor and male power. Gender ideologies justify the genderimbalance in power and resources. Gender stereotypes describe themanner in which men and women presumably differ, usually in ways thatjustify to some extent the gender division of labor. And finally, gender
ARTICLES
2
Dow
nloa
ded
by [
84.5
2.18
1.24
] at
12:
20 3
0 Ju
ly 2
015

norms specify acceptable behavioral boundaries for women and men,congruent with the gender division of labor and male power. Inculcation ofthese norms results in negative consequences attached to acts thattransgress defined gender boundaries. Those consequences may be inthe form of social stigma, with violation of one’s gender identity boundariesoften leading to anxiety and distress.2
Social definitions, thus, play an important role in reducing resistance togender inequality in favor of men. To the extent that social definitionsinstill an acceptability of gender gaps in everyday behavior, there is lessneed to employ overt forms of power to maintain gender hierarchies. Suchnorms and stereotypes affect not only adults, but perhaps moreimportantly, also children’s socialization, with children internalizing theboundaries placed on their behavior and the behavioral expectationsthey learn.3
What, then, are the pivotal targets that will leverage change forgreater gender equality? Two important targets stand out: the genderdivision of labor that structures control over material resources and thepsychological/social system that creates gendered personalities andbehavior with the use of social definitions that legitimate the status quo.In the former, the target variables to leverage change are women’s access topaid employment and equal pay, thus contributing to greater genderincome equality. In the latter case, a remedy is the acceptance of a set offeminist social definitions, facilitated by women’s entrance into high-statuspositions in institutions. Women’s representation in academia, religiousorganizations, leadership roles, and legislative positions can act as animpetus for change.
Some have raised doubts about relying on increasing women’srepresentation in key institutions as a strategy for success. Chafetz (1989)argues, for example, that engendered personalities and behavior are set inchildhood. Increasing women’s access to institutions that mold socialdefinitions may eventually have an effect on women and men, such thatchildren might observe more gender-equitable behavior in the household,but this process may take a very long time. Further, even if social definitionschange (leading to a gender-equitable transformation of children’ssocialization), men’s power over resources will inhibit progress in materialequality between men and women. Increasing women’s access to income istherefore likely to yield more immediate results in improving women’seconomic empowerment, hastening the alteration of power dynamicswithin the household that shape children’s perceptions.
This is not to suggest that simultaneous efforts to change norms andstereotypes should be eschewed, as norms themselves inhibit the effective-ness of women’s access to income. For example, Barbara Burnell andJohanna Ratzel (2005) find evidence that cultural norms that shapewomen’s sense of agency mediate the effect of wages on bargaining in
EVIDENCE ON GLOBAL TRENDS IN GENDER NORMS
3
Dow
nloa
ded
by [
84.5
2.18
1.24
] at
12:
20 3
0 Ju
ly 2
015

India. Nevertheless, it is important for economists to understand the effectthat women’s access to income can have on gender norms and stereotypes,since this has implications for the effects of employment-stimulatingmacroeconomic policies.
Torben Iversen and Frances Rosenbluth (2005) link the relative strengthof patriarchal norms to the relationship between the mobility of maleeconomic assets to the mobility of female economic assets, with mobility afunction of the structure of the economy and the gender division of labor.Thus modes of production shape intrahousehold bargaining power. Forexample, in labor-intensive agricultural systems, the requirement ofphysical strength as an agricultural input encourages a gender division oflabor that gives men command over assets that are more mobile thanwomen’s household labor-specific assets.4 Iverson and Rosenbluth arguethat in post-industrial economies where brawn matters less, gender normsand attitudes are more egalitarian because families in such societies chooseto socialize their daughters in more gender-neutral ways to assist them insecuring a stable livelihood. Subservience in such a scenario, as well asspecialization in unpaid caring labor, would be economically costly. Theirkey point is that the structure of the economy has a powerful influence ongender norms and stereotypes.
While the structure of the economy is a slow-changing variable, even inthe short run, some argue, the state of the macroeconomy may also exertan independent effect on trends in gender norms and stereotypes. Oneview is that economic growth may facilitate a positive change in women’swell-being and gender roles (David Dollar and Roberta Gatti 1999; WorldBank 2001). Empirically, this argument is based on regressions of gendergaps in educational attainment on levels of development (measured as percapita income). The reasoning behind this correlation asserts that in low-income, gender-stratified societies, women are at the back of the queue foreconomic resources. With higher per capita incomes, proportionally moreresources reach the back of the line and lead to changed perceptions aboutgender roles. This view suggests that growth is itself sufficient to improvegender equity (World Bank 2001).
In principle, periods of economic expansion can result in increasedincome to fund social spending and safety nets and permit women toenlarge their share of employment and managerial slots. Such conditionscan promote gender equity without a frontal assault on norms andstereotypes that might provoke male resistance and backlash. Whether ornot women benefit from economic growth, however, depends on thedistributional effects of growth in three areas: within the household, inlabor markets, and at the level of the state. That is, women benefit only ifthe net distributional effect, via these three pathways, is positive. It is anempirical question as to whether growth yields such results, particularly inthe current context of liberalization.
ARTICLES
4
Dow
nloa
ded
by [
84.5
2.18
1.24
] at
12:
20 3
0 Ju
ly 2
015

A growth process that increases gender inequality by marginalizingwomen from paid employment, or in which inequality grows due towomen’s segregation in the lowest wage jobs, may not facilitate a revisionof gender ideology in favor of women. Numerous scholars argue that thecurrent era of globalization-cum-economic liberalization has indeed had adeleterious effect on women’s income opportunities and conditions ofwork in both developed and developing economies (Lourdes Benerıa2003; V. Spike Peterson 2003; Stephanie Seguino 2006). There is, forexample, an increased use of home workers, primarily women, as aresponse to greater competitive pressures on firms to reduce costs (Ping-Chun Hsiung 1996; Elisabeth Prugl 1999; Peterson 2003). The lowerwages paid to home workers and the reduction in overhead costs, whilebeneficial to firms, reinforce gender norms and stereotypes that linkwomen to the home and to their role as caretakers, and perpetuate theirdesignation as secondary wage earners. This type of work also limitswomen’s ability to bargain for a better distribution of work and labor inthe household. These factors suggest that economic growth in the currentperiod of globalization may not promote a movement to more equitablegender norms and stereotypes.
Further, economic crisis – measured as negative growth rates of GDP –may itself provoke a return to norms and stereotypes that underminegender equality. Diane Elson (1991, 2002) has provided a trenchantanalysis of structural adjustment programs in developing economies, which,by contributing to economic stagnation and cuts in public expenditures onhealth, education, and food subsidies, have negatively affected women’swell-being. She argues that women bear an undue burden of stimulatinggrowth in liberalized economies where the role of the state is reduced andmacroeconomic volatility is heightened.
Such economic crises have led, in many cases, not only to increases inwomen’s unpaid labor burden but also to their ‘‘distress’’ sales of labor inthe informal sector to replace income lost from male wage cuts or job losses(Nilufer Cagatay and Sule Ozler 1995; Maria S. Floro 1995; Joseph Lim2000).5 Periods of economic crisis may in fact exacerbate gender tensionsbecause they can have negative effects on men’s income-generatingpossibilities, undermining masculine ‘‘male breadwinner’’ norms (SylviaChant 2002).6
In some cases, women who take on paid employment during economiccrises feel even more pressure to accede to male-dominant norms in thehousehold as a way to assuage men’s perceptions of their diminished statusin the workplace (Naila Kabeer 2000). Evidence from Latin America linksthe growth of inequality in that region – due in part to economicliberalization and associated structural adjustment policies – to increases indomestic violence, precisely because of the negative effect of such policieson male income and their loss of status (Soledad Larraın 1999).
EVIDENCE ON GLOBAL TRENDS IN GENDER NORMS
5
Dow
nloa
ded
by [
84.5
2.18
1.24
] at
12:
20 3
0 Ju
ly 2
015

Ronald Inglehart and Pippa Norris (2003) take a different approach togender inequality, attributing what they call the ‘‘rising tide of genderequality’’ to the process of modernization, with agricultural societiesreflecting traditional values that undermine women’s choices and powerand post-industrial societies reflecting the most gender egalitarianattitudes. They note that growth alone is insufficient to ensure genderequity, citing the examples of high per capita income countries such asSaudi Arabia and Qatar. What is it then about modernization that canpromote gender equity? The authors have linked this to changes in culturallegacies and religious traditions and also to the role of the state in post-industrial societies in expanding women’s agency via affirmative action,equal pay, and other forms of legislation and social protections.7
Some authors suggest that changes in social institutions that embody andperpetuate social definitions of female subservience will influence women’saccess to income-generating opportunities, such as employment. To testthis hypothesis, Christian Morrisson and Johannes Jutting (2005) useregression analysis on a new and unique database to evaluate the effect onfemale employment of a variety of institutional characteristics proxied bypolygamy, female genital mutilation, percentage of 15 to 19 year olds evermarried, and access to capital. They find evidence that education andgrowth have little effect on women’s employment and instead observe thatsocial institutions are a major determinant of female employment. There is,however, an issue of causality: are the institutions causing female employ-ment or is it the reverse? Unfortunately, the paper does not address thisquestion since it is a purely cross-sectional analysis.8 More importantly, theirstudy does not take up what causes social definitions to change.
To summarize, for the purposes of empirical analysis, the female share ofemployment, the structure of the economy, and economic growth arepotentially distinct factors that affect gender norms and stereotypes.9 Socialrole theory undergirds the choice of female share of employment as theindicator of women’s increased control over material resources. If therequisite data were available, it would also be useful to test the effect offemale relative wages and female share of income on gender norms andstereotypes, insofar as these better capture female relative economic poweridentified by Blumberg (1988) as a mechanism for change. However,gender-disaggregated income data is lacking; there are no sources ofinternationally comparable data on female share of income.10
Agriculture as a share of GDP is used to capture the structure of theeconomy. We would expect a society to reflect more patriarchal attitudes,the larger the share of agriculture in GDP. This follows from Iversen andRosenbluth’s (2005) hypothesis, mentioned earlier in this paper, thatdifferent modes of production shape intrahousehold bargaining power.
Because norms and stereotypes are slow-changing variables, it is likelythat women’s economic activity and macroeconomic variables will operate
ARTICLES
6
Dow
nloa
ded
by [
84.5
2.18
1.24
] at
12:
20 3
0 Ju
ly 2
015
with a lag. Little research in economics literature gives guidance on howlong it takes for norms and stereotypes to change. The social psychologyliterature, however, shows that attitudes that reflect underlying norms canchange in relatively short periods of time.11 For instance, cross-culturalevidence demonstrates that norms and stereotypes have changed relativelyquickly in response to political and economic transitions (AmandaDiekman, Wind Goodfriend, and Stephanie Goodwin 2004; AmandaDiekman, Alice Eagly, Antonio Mladinic, and Maria Cristina Ferreira 2005).
An interesting example of the flexibility of gender norms and stereotypesis outlined in a study that evaluates the effects of an experimentalintervention in Brazil (Gary Barker, Marcos Nascimiento, Marcio Segundo,and Julie Pulerwitz 2000). ‘‘Program H’’ (‘‘H’’ refers to homens, Portuguesefor men) was designed to improve attitudes and reduce risk behaviors ofyoung Brazilian men as a means to reduce the incidence of HIV/AIDS.12
Studies increasingly recognize that the promotion of safe sex requires achange in the attitudes of young men. Risky behaviors have been associatedwith more traditional gender attitudes among young men (Alison Clarke,Sherry Hutchinson, and Ellen Weiss 2004). ‘‘Program H’’ used interactivegroup activities and ‘‘social marketing’’ to help young men questiontraditional gender norms related to masculinity and to promote the abilitiesof men to engage in more gender-equitable relationships with their femalepartners. Barker, Nascimiento, Segundo, and Pulerwitz (2000) found asubstantial reduction in gender inequality attitudes from the baseline aftersix months. A one-year, follow-up study showed that the change in attitudespersisted. While this intervention represents a concerted effort to changenorms, it is clear that change is possible in a relatively short period of time.
For the purposes of this study, then, I chose five-year lags under theassumption that some time is required for women’s employment to affecttheir perceptions of their status and to influence societal attitudes. It wouldbe useful, as more data becomes available, to test the data for rates ofchange using longer lags. However, data constraints make such aninvestigation in the present study impossible.
DESCRIPTIVE DATA ANALYSIS OF TRENDSIN NORMS AND STEREOTYPES
The World Values Survey provides a mechanism to capture gender normsand stereotypes because it contains a series of gender questions that spanfour waves, conducted over a twenty-year period. The first wave onlycovered twenty-two countries, so it is not included in this analysis. Thispaper uses data from the second, third, and fourth waves to assess thecauses of differences in gender attitudes over time and across politicalunits. The 1990 – 3 survey covers forty-two political units; the 1995 – 7 surveycovers fifty-four political units; the 1999 – 2001 survey covers sixty. In all,
EVIDENCE ON GLOBAL TRENDS IN GENDER NORMS
7
Dow
nloa
ded
by [
84.5
2.18
1.24
] at
12:
20 3
0 Ju
ly 2
015

over eighty independent countries and Puerto Rico have been surveyed inat least one wave of this investigation. These include almost 85 percent ofthe world’s population.
The World Values Survey data are collected through face-to-faceinterviews. In most countries, some form of stratified multistage randomprobability sampling was used to obtain representative national samples.Other sampling procedures used included cluster sampling, multistagesampling utilizing the Kish-grid method, purposive sampling, and quotasampling (Ronald Inglehart, Miguel Basanez, Jaime Dıez-Medrano, LoekHalman, and Ruud Luijkx 2004).13
This paper analyzes two sets of questions from the World Values Survey.One set directly reflects the degree of adherence to norms and stereotypesabout the gender division of labor, gender power, and men’s and women’srelative rights of access to resources and opportunities. The second set ofquestions reflects gender attitudes more indirectly, providing informationon views towards those with less power and resources in society (a measureof respondents’ altruism), as well as a self-assessment of control over therespondents’ lives and well-being and their interest in politics. Table 1shows both sets of questions.
Each wave added new countries to the sample, and thus the survey resultsfor the full sample are not strictly comparable over time. I therefore presenttrends only for a fixed sample, restricted to those countries included in the
Table 1 World Values Survey questions on gender norms and stereotypes andattitudes
Gender norms and stereotypes1. When jobs are scarce, men have more right to a job than women. (Q 61)2. Do you think that a woman has to have children in order to be fulfilled, or is this
not necessary? (Q 93)3. A working mother can establish just as warm and secure a relationship with her
children as a mother who does not work. (Q 98)4. Being a housewife is just as fulfilling as working for pay. (Q 99)5. Both the husband and wife should contribute to household income. (Q 100)6. Men make better political leaders than women. (Q 101)7. A university education is more important for a boy than for a girl. (Q 103)
Social attitudes1. All things considered, how satisfied are you with your life as a whole these days
(Scale of 1 to 10, with 1¼unsatisfied)? (Q 65)2. Some people feel they have completely free choice and control over their lives,
while other people feel that what they do has no real effect on what happens tothem. Please use this scale where 1 means none at all and 10 means a great deal toindicate how much freedom of choice and control you feel you have over the wayyour life turns out. (Q 66)
3. How interested would you say you are in politics? (Q 117)4. Should incomes be made more equitable, or do we need larger income
differences as incentives for individual effort? (Q 125)
ARTICLES
8
Dow
nloa
ded
by [
84.5
2.18
1.24
] at
12:
20 3
0 Ju
ly 2
015

second, third, and most recent waves. Only four of the relevant questionswere asked in all of these waves. (See Appendix, Table A.2 for a list ofcountries in the fixed and full samples.) Table 2 illustrates gender-disaggregated responses by region as well as the change in responses.14
Several observations are relevant about these data. First, in almost allcases, men’s opinions suggest they adhere more strongly to genderinequitable norms and stereotypes than women. The difference isquantified as the ‘‘gender gap’’ in attitudes – simply the female percentagein agreement less the male percentage; the gap is statistically significant inmost cases.15 The size of the gender gap varies, by region and statement.Second, the change in responses to these questions indicates anattenuation of patriarchal norms and stereotypes in most cases. Forexample, in response to the prompt, ‘‘When jobs are scarce, men havemore right to a job than women,’’ all regions show a decline in the percentof females who agree, with the exception of Asia. In most regions, maleagreement has also declined, with the exception again of Asia as well asSub-Saharan Africa. The case of the transition economies is noteworthy.Agreement with this question has dramatically declined among both menand women. It is possible that the 1990 survey coincided with privatizationand the rapid rise of unemployment in these economies that resulted infierce competition for the sharply reduced number of jobs. If this is thecase, it would seem to suggest that economic crisis can lead to resurgence ofgender inequitable norms.16
Asia is an interesting case. Responses in 2000 may have been influencedby the Asian financial crisis, which led to sharp increases in unemployment.In some countries, such as South Korea, women were exhorted to leave jobsto make room for men as the ‘‘rightful breadwinners’’ (Ajit Singh and AnnZammit 2002). The result was that women’s unemployment rate rose muchmore rapidly than men’s during the crisis in South Korea. Again, economiccrisis that threatened men’s access to jobs may have led to a resurgence andreacceptance of patriarchal norms by both men and women.
Interestingly, the increase in the percentage of Asian women surveyedwho agree with the statement that men have more right to jobs in times ofscarcity is greater than that for men and is statistically significant. The gap,especially in 1990, is very large – more than 9 percentage points.
In contrast, the percentage of men in Sub-Saharan Africa who agree withthat statement jumped by ten percentage points between 1990 and 2000,while the percentage of women in agreement declined. Given that the Sub-Saharan region has undergone a long-term growth slowdown as comparedto Asia’s abrupt crisis and given that women have greater financialresponsibility for care of children in Sub-Saharan Africa, the gender gap inchange of attitudes is not surprising. The Asian and Sub-Saharan examplesunderscore the final observation on the responses to this question, which isalso valid for the remaining questions: that differences in responses
EVIDENCE ON GLOBAL TRENDS IN GENDER NORMS
9
Dow
nloa
ded
by [
84.5
2.18
1.24
] at
12:
20 3
0 Ju
ly 2
015

Tab
le2
Gen
der
no
rms
and
ster
eoty
pes
:R
esp
on
ses
by
regi
on
,19
90to
2000
(per
cen
tin
agre
emen
t,u
nle
sso
ther
wis
en
ote
d)
1990
2000
Per
cen
tage
Poi
nt
Cha
nge
1990
to20
00
All
Asi
aL
atin
Am
eric
aO
EC
D
Sub-
Saha
ran
Afr
ica
Tra
nsi
tion
All
Asi
aL
atin
Am
eric
aO
EC
D
Sub-
Saha
ran
Afr
ica
Tra
nsi
tion
All
Asi
aL
atin
Am
eric
aO
EC
D
Sub-
Saha
ran
Afr
ica
Tra
nsi
tion
Wh
enjo
bs
are
scar
ce,
men
sho
uld
hav
em
ore
righ
tto
ajo
bth
anw
om
en.
Mal
es37
.745
.430
.928
.648
.349
.733
.646
.331
.718
.058
.629
.27
4.1*
*0.
80.
87
10.6
**10
.3**
720
.5**
Fem
ales
30.9
36.3
25.0
26.7
39.0
41.9
26.2
39.6
23.7
16.1
37.5
23.5
74.
6**
3.3*
*7
1.4
710
.6**
71.
5**
718
.4**
Gen
der
Gap
76.
8**
79.
2**
75.
9**
71.
9**
79.
3**
77.
8**
77.
3**
76.
7**
78.
0**
71.
9**
721
.1**
75.
7**
Do
you
thin
kth
ata
wo
man
has
toh
ave
chil
dre
nin
ord
erto
be
fulfi
lled
,o
ris
this
no
tn
eces
sary
?(%
rep
ort
ing
that
aw
om
ann
eed
sch
ild
ren
tob
efu
lfill
ed).
Mal
es58
.75
70.3
59.0
43.3
76.1
87.0
54.7
69.5
53.6
39.2
68.7
69.5
4.1*
*7
0.8
75.
4**
74.
1**
77.
4**
717
.5**
Fem
ales
58.6
873
.058
.240
.676
.287
.454
.670
.555
.136
.169
.471
.27
4.0*
*7
2.5*
*7
3.2*
*7
4.5*
*7
6.8*
*7
16.2
**G
ende
rG
ap7
0.1
2.7
**7
0.7
72.
7**
0.1
0.4*
*7
0.1
1.0
1.5
73.
1**
0.7
1.7*
*
Aw
ork
ing
mo
ther
can
esta
bli
shju
stas
war
man
dse
cure
are
lati
on
ship
wit
hh
erch
ild
ren
asa
mo
ther
wh
od
oes
no
tw
ork
.M
ales
66.4
969
.966
.266
.566
.761
.974
.681
.871
.974
.074
.674
.58.
1**
11.9
**5.
7**
7.5*
*7.
9**
12.6
**F
emal
es71
.72
70.2
73.5
74.3
69.9
66.0
80.1
85.8
82.4
81.3
80.7
79.6
8.4*
*15
.6**
8.9*
*7.
0**
10.8
**13
.5**
Gen
der
Gap
5.2
**0.
37.
3**
7.8*
*3.
2**
4.1*
*5.
5**
4.0*
*10
.4**
7.3*
*6.
1**
5.1*
*
Bei
ng
ah
ou
sew
ife
isju
stas
fulfi
llin
gas
wo
rkin
gfo
rp
ay.
Mal
es68
.02
72.6
70.8
62.7
48.1
71.0
66.9
82.2
72.1
63.1
54.3
64.0
71.
19.
6**
1.4
0.4
6.2*
*7
6.9*
*F
emal
es64
.47
69.8
65.1
59.7
49.9
64.6
63.5
83.7
68.0
58.8
54.3
56.8
71.
014
.0**
2.8*
*7
0.9*
*4.
4**
77.
7**
Gen
der
Gap
73.
6**
72.
9**
75.
7**
73.
1**
1.8
76.
4**
73.
4**
1.5*
*7
4.2*
*7
4.3*
*0.
07
7.2*
*
Not
es:T
he
gen
der
gap
issi
mp
lyth
efe
mal
ep
erce
nta
gein
agre
emen
tw
ith
the
stat
emen
tm
inu
sth
em
ale
per
cen
tage
.Tw
oas
teri
sks
(**)
den
ote
stat
isti
call
ysi
gnifi
can
td
iffe
ren
ce(o
rch
ange
)at
5%le
vel.
‘‘A
ll’’
refe
rsto
all
cou
ntr
ies
inth
efi
xed
sam
ple
,m
easu
red
asan
un
wei
ghte
dav
erag
e.
ARTICLES
10
Dow
nloa
ded
by [
84.5
2.18
1.24
] at
12:
20 3
0 Ju
ly 2
015

between regions are sometimes as large as or larger than genderdifferences.
The remaining three questions in Table 2 refer to stereotypes aboutwomen’s roles as parents. The results here are somewhat contradictory.Roughly the same percentages of women and men hold the view thatwomen must have children to be fulfilled across regions, though theOrganisation for Economic Co-operation and Development (OECD) andLatin American countries adhere less strongly to this view than otherregions. Over time, however, there has been a marked decline in thepercentage of both men and women who hold this view, and in all cases,the decline is statistically significant. The most pronounced change is intransition economies with declines of 17.5 percentage points for men and16.2 percentage points for women.
Even in 1990, a large majority of respondents, both male and female,agreed that working mothers can have close relationships with children,although more women than men held that view. Since that time, there hasbeen a substantial increase in the percentage of men and women inagreement with that statement, again with women reflecting a greaterincrease in gender-equitable attitudes.
On the other hand, the high level of agreement with the statementthat being a housewife is just as fulfilling as working for pay suggestssome nostalgia and ambivalence about changing gender roles for bothmen and women. In Asia and Sub-Saharan Africa, both regions wherecrisis and/or slow growth have led to greater unpaid labor and careburdens for women, the increase in percentage of women and menagreeing with this statement is particularly pronounced. This trend may beread as a compensatory shift in attitudes to accommodate and adjust tochanging economic fortunes and women’s more limited access to re-munerative employment.
It is often claimed that men are threatened by women’s movement intothe paid labor market, leading to a backlash in attitudes calling for women’sreturn to their role as caretakers (Claudia Minolti, Alejandra Rotania, andIrma Vichich 1991; Susan Fleck 1998). These results do not support thatview and are particularly noteworthy because the period 1990 to 2000 is oneof slow growth, increasing joblessness, and economic crisis in transitioneconomies and for some regions, including Asian, Latin American, andAfrican economies. However, as the next section will demonstrate, theeconometric results are not entirely consistent with this generalization andinstead, suggest a negative effect of economic crisis on equitable norms andstereotypes.
Table 3 presents descriptive gender-disaggregated data on norms andstereotypes for questions asked only in the 1995 and 2000 waves. Thepercentages are unweighted country averages. In addition, I provide someillustrative data on questions reflecting social attitudes on degrees of life
EVIDENCE ON GLOBAL TRENDS IN GENDER NORMS
11
Dow
nloa
ded
by [
84.5
2.18
1.24
] at
12:
20 3
0 Ju
ly 2
015

satisfaction, control, and altruism. The results were mixed. Between 1995and 2000, the percentage of men and women who believe that men makebetter political leaders fell slightly. The gender gap in attitudes was quitewide but did not diminish over this time period.
The percentage of men and women who believed both the husband andwife should contribute to income was very high in both waves, with a smallgender gap. One explanation for this result is that the role of the maleparent, whose primary concern is for his children’s welfare, trumpsmasculinist norms that are threatened by female contributions to income.Between 1995 and 2000, there was little change in male agreement thatboth the husband and wife should contribute, but the percentage ofwomen agreeing declined. There was also a decline in the belief that boys
Table 3 Gender differences in norms/stereotypes and social attitudes, all countries,1995 to 2000 (percent in agreement, unless otherwise noted)
1995 2000 Change
On the whole, men make better political leaders than women do.Males 47.8 46.2 71.5**Females 37.4 35.9 71.5**Gender Gap 710.4** 710.3**
Both the husband and wife should contribute to household income.Males 82.3 82.2 70.1Females 85.9 84.1 71.8**Gender Gap 3.7** 2.0**
A university education is more important for a boy than for a girl.Males 26.0 24.5 71.5**Females 20.9 19.2 71.7**Gender Gap 75.1** 75.3**
Taking all things together, how happy would you say you are? (% very happy or happy)Males 79.7 66.3 713.5**Females 79.4 57.2 722.2**Gender Gap 70.3 79.0**
How much freedom and control (1 – 10 with 1 no control)?Males 6.9 6.6 70.3Females 6.8 6.3 70.5Gender Gap 70.1 70.4
How interested would you say you are in politics? (% very interested)Males 19.7 12.0 77.7**Females 12.8 6.4 76.4**Gender Gap 77.0** 75.7**
Should incomes be made more equal?Males 17.3 15.3 72.0**Females 19.4 16.1 73.2**Gender Gap 2.0** 0.9**
Notes: The gender gap is the female percentage in agreement with the statement minus the malepercentage. Two asterisks (**) denote statistically significant difference (or change) at 5% level.
ARTICLES
12
Dow
nloa
ded
by [
84.5
2.18
1.24
] at
12:
20 3
0 Ju
ly 2
015

deserve a university education more than girls; most striking about thesedata is the low percentages of both women and men who hold that attitude.
Interestingly, there was a sharp decline in life satisfaction for both menand women but much stronger for women over this time period. Thegender gap reported for feelings of freedom and control over lives was verysmall, and the changes are not statistically significant for men or women.17
Women and men rated the degree of control they feel over their lives quitesimilarly in 1995. Both groups perceived themselves as having less controlby 2000, but the decline is not statistically significant. There was a widegender gap in interest in politics, however. Interestingly, both men andwomen indicated a declining interest in politics, a trend that was slightlymore accentuated for men.
The last question in Table 3 reflects attitudes towards income equality. Acommon theme of the feminist economics literature is that globally, womenare more economically vulnerable than men due to their greaterrepresentation in contingent employment and limited access to socialsafety nets (Diane Elson and Nilufer Cagatay 2000; Benerıa 2003). Thisexperience could lead to women’s stronger support for redistributiveprograms.18 On the other hand, if women are experiencing increases inaccess to and control over income relative to men, their support forredistributive programs may decline. The results are consistent with thelatter hypothesis. Between 1995 and 2000, the percentage of men andwomen who believed incomes should be made more equal decreased,though for men, the decrease was smaller. Economic trends that havedestabilized men’s perceptions of their security may be a causal factor aswell as shifts in men’s economic status relative to women and other men.
Most striking about these data is that, for most questions and mostregions, the trend is toward more gender equitable attitudes both from1990 to 2000 and from 1995 to 2000. The magnitude and direction ofchange in men’s attitudes is quite similar to that of women and, in somecases, their movement towards gender equitable attitudes exceeds that ofwomen. The one exception to this generalization is from 1995 to 2000 inwhich there was an increase in the percentage of both men and womenwho believed that women must have children to be fulfilled.
ECONOMETRIC ANALYSIS
Do improvements in gendered norms stem from women’s increasinglyvisible economic role that empowers them in the home and in the publicdomain? I test this hypothesis econometrically for several questions in theWorld Values Survey. The econometric analysis uses generalized leastsquares (GLS) estimation with robust standard errors.19 The data set is thethree most recent waves of the survey and covers seventy-eight countriesand Puerto Rico. Due to missing observations, the panel is unbalanced.
EVIDENCE ON GLOBAL TRENDS IN GENDER NORMS
13
Dow
nloa
ded
by [
84.5
2.18
1.24
] at
12:
20 3
0 Ju
ly 2
015

This should not present problems of consistency so long as the reason forthe unbalanced panel is uncorrelated with the error term. In the case of theWorld Values Survey data, addition or exclusion of questions in variouswaves of country surveys appears to be random, and therefore, estimates arelikely to be consistent.
The independent variables are female share of employment, femaleshare of parliamentary seats (for one question), agriculture value-added asa share of GDP to capture the structure of production, and growth rate ofGDP.20 (See Table A.1 in the Appendix for a list of variables, definitions,and sources.) All except the agriculture variable are measured as theaverage over the previous five years.21 The lagged approach is used sinceindependent variables are likely to affect attitudes with some delay.Agricultural share of GDP, a slower moving variable, is measured for thecurrent period.22 I perform a robustness check, using female share of thelabor force in place of female share of employment and include levels ofper capita income as an explanatory variable to proxy for level ofdevelopment and structure of production.23 As noted previously, wage(and income) data would be good measures of women’s economicempowerment. Wage data are sparse, however; relying on this variablewould markedly reduce the sample size.24
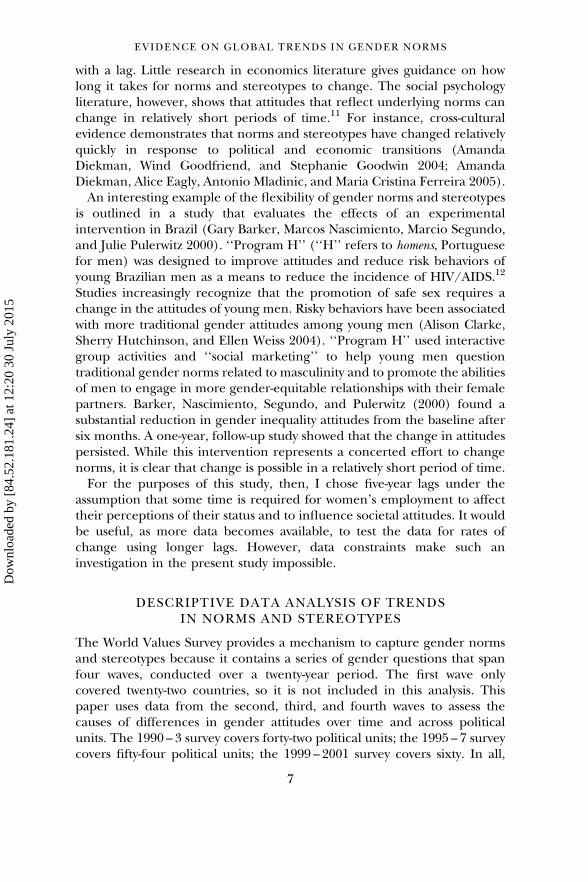
Specifically, in these tests, the goal is to determine whether women’sshare of economic activity has an independent effect on gender norms andstereotypes, after controlling for region (intended to capture culturaldifferences), agriculture’s share of GDP to reflect the economic structure,the growth rate of GDP, and time dummies to capture exogenous changesthat influence gender norms not otherwise specified in the empiricalmodel. Table 4 reports results for males and females for each question. Theomitted region is Sub-Saharan Africa.
The percentage of men and women in each country who agree with astatement serves as the dependent variable. For the statement: ‘‘Men havemore right to a job than women when jobs are scarce,’’ female share ofemployment has a negative effect on the percentage of both men andwomen who agree with this statement. While the effect on men is stronger,the difference is not statistically significant. The share of agriculture in GDPhas a positive effect on agreement with this statement, suggesting a genderinequitable correlation if not causation. Growth of GDP has a negativeeffect on the belief in men’s right to a job, and again, the effect on men isstronger than on women. Several regional dummies are also statisticallysignificant and are very large. For example, the percentage of Asian womenwho agree with this view is over 13 percentage points greater than ofwomen surveyed in Sub-Saharan Africa. The twenty-two-percentage pointdifference between views held by OECD and Sub-Saharan men is notable,as are the stark differences between MENA and Sub-Saharan Africa forboth men and women, indicating that culture and level of development
ARTICLES
14
Dow
nloa
ded
by [
84.5
2.18
1.24
] at
12:
20 3
0 Ju
ly 2
015
Tab
le4
Infl
uen
ceo
fge
nd
ereq
ual
ity
and
mac
roec
on
om
icva
riab
les
on
atti
tud
esb
etw
een
1995
and
2000
Q61
Men
righ
tto
job
Q93
Wom
enn
eed
chil
dren
tobe
fulfi
lled
Q98
Wor
kin
gm
omca
nha
veas
good
rela
tion
ship
wit
hch
ildr
en
Q10
1M
enbe
tter
poli
tica
lle
ader
s
Q10
3U
niv
ersi
tyed
uca
tion
mor
eim
pt.
for
boys
FM
FM
FM
FM
FM
Fsh
are
emp
loym
ent
70.
371
(0.1
9)*
70.
336
(0.1
4)**
*7
0.30
5(0
.16)
*7
0.28
7(0
.16)
*0.
710
(0.2
0)**
*0.
719
(0.3
0)**
0.24
1(0
.18)
70.
108
(0.1
8)7
0.05
3(0
.13)
70.
268
(0.1
5)*
Agr
icu
ltu
re0.
414
(0.1
4)**
*0.
581
(0.1
7)**
*0.
644
(0.2
0)**
*0.
474
(0.1
6)**
*7
0.19
1(0
.19)
70.
154
(0.2
1)7
0.09
4(0
.17)
0.18
8(0
.20)
70.
025
(0.1
2)7
0.00
1(0
.14)
Gro
wth
GD
P7
0.63
6(0
.20)
***
70.
698
(0.2
3)**
*0.
218
(0.3
5)0.
004
(0.2
8)7
0.34
8(0
.26)
70.
179
(0.3
1)7
0.60
6(0
.17)
***
70.
551
(0.2
4)**
*7
0.46
7(0
.18)
***
70.
676
(0.1
8)**
*A
sia
13.4
0(5
.69)
**0.
811
(5.3
3)2.
312
(5.8
0)5.
026
(6.3
1)8.
771
(7.6
8)7.
524
(7.8
8)19
.07
(20.
43)
2.66
3(1
7.38
)0.
432
(6.5
5)7
7.37
4(9
.79)
Tra
nsi
tio
n0.
974
(6.0
8)7
10.9
8(5
.78)
*0.
827
(5.0
3)7
0.64
1(5
.54)
70.
833
(7.1
0)7
4.38
0(7
.80)
6.27
8(1
9.81
)1.
232
(7.1
4)9.
16(6
.71)
718
.38
(9.2
4)M
EN
A32
.95
(9.7
7)**
*22
.83
(9.8
7)**
*7
0.10
1(7
.55)
2.70
1(8
.19)
5.24
9(8
.98)
75.
085
(11.
24)
33.8
4(2
1.21
)27
.99
(18.
71)
75.
631
(7.3
3)7
8.31
(12.
12)
LA
C7
3.82
4(6
.01)
716
.63
(6.2
5)**
*7
15.1
4(6
.02)
***
713
.57
(5.9
7)**
0.53
3(7
.44)
72.
166
(7.8
2)7
1.15
5(2
1.39
)7
9.92
(17.
58)
711
.26
(6.5
2)*
719
.46
(9.7
2)**
OE
CD
76.
912
(6.3
8)7
22.3
3(6
.61)
***
734
.48
(6.6
1)**
*7
31.3
7(7
.33)
***
2.97
2(8
.00)
71.
365
(8.5
3)7
11.1
8(2
0.31
)7
22.7
4(1
7.71
)7
17.8
5(6
.51)
***
728
.02
(9.5
0)**
*F
shar
ep
arli
amen
t7
0.09
4(0
.09)
70.
365
(0.1
0)**
*C
on
stan
t33
.76
(9.0
5)**
*57
.32
(9.1
3)**
*76
.14
(10.
25)*
**76
.32
(7.4
4)**
*46
.33
(12.
55)*
**41
.77
(16.
51)*
*20
.41
(23.
31)
58.3
4(2
1.36
)***
30.9
5(9
.31)
***
53.5
2(1
4.08
)***
Ad
just
edR
20.
713
0.80
90.
740
0.74
30.
345
0.43
50.
782
0.79
00.
606
0.63
7N
9090
100
100
9393
5050
6363
Not
es:N
isth
en
um
ber
of
cou
ntr
ies
inth
esa
mp
lew
ith
dat
am
easu
red
asco
un
try
aver
ages
.GL
Sp
anel
dat
aes
tim
atio
nw
ith
rob
ust
stan
dar
der
rors
.Sta
nd
ard
erro
rsin
par
enth
eses
.Th
ree
aste
risk
s(*
**)
den
ote
sign
ifica
nce
atth
e1
per
cen
tlev
el,t
wo
(**)
atth
e5
per
cen
tle
vel,
and
on
e(*
)at
the
10p
erce
ntl
evel
.Om
itte
dre
gio
nis
Sub
-Sa
har
anA
fric
a.C
oef
fici
ents
on
tim
ed
um
mie
s,si
gnifi
can
to
nly
for
Q93
,ar
en
ot
rep
ort
edh
ere.
ME
NA
isM
idd
leE
ast
and
No
rth
Afr
ica.
EVIDENCE ON GLOBAL TRENDS IN GENDER NORMS
15
Dow
nloa
ded
by [
84.5
2.18
1.24
] at
12:
20 3
0 Ju
ly 2
015

matter (insofar as regions reflect similar stages of development). It isnotable that even when controlling for regional differences, female share ofemployment has an independent effect on norms and stereotypes.
The significant effect of growth on attitudes is also of interest, althoughthe size of the effect is relatively small, with a 1 percentage point increase ingrowth leading to a less than 1 percentage point decline in both womenand men agreeing with the statement. The negative sign on this variablemay be a signal that periods of economic crisis – a shrinking economic pieduring macroeconomic contraction – contribute to more gender inequi-table attitudes. This would occur particularly if men had also sufferedduring these downturns, challenging traditional lines of gendered power inthe household. Such an interpretation would be consistent with theextensive analyses by feminist economists that have highlighted thenegative effects of economic crisis on families and the tendency for womento engage in ‘‘distress’’ sales of labor as a response to crisis.
The results for the statement ‘‘Women need children to be fulfilled’’ arequite similar to those for the first prompt, that men have more right to a jobthan women when jobs are scarce. The OECD, Latin American, and theCaribbean (LAC) dummies indicate a much lower percentage of men andwomen who adhere to this view as compared to Sub-Saharan Africa. Otherregional dummies were not significant. Also, the impact of economicgrowth on the view that women need children to be fulfilled was muchsmaller than for the question about men having more of a right to jobs. Thedifference between the coefficients on female share of employment formen and women are again not significantly different. The share ofagriculture in output, however, has a positive significant effect on thecoefficients for both men and women, but the effect on men is smaller, andsignificantly so. The size of this effect on both women’s and men’s views isnevertheless quite small.
On the ability of working mothers to have as good a relationship withtheir children as compared to housewives, female share of employment hasa positive and indeed virtually identical effect on men and women’sattitudes. The social experience of women moving into paid employment, itappears, undermines negative stereotypes about the effect of women’s paidwork on children’s well-being. The growth rate of GDP is not significant inthis case nor are any of the regional dummies or agriculture’s share ofGDP. The R2 on this regression is relatively lower than the others,indicating additional important factors may be at work here that are notspecified in the model.
In the regression assessing the determinants of agreement with thestatement that men make better political leaders than women, female shareof parliamentary seats (lagged five years) is included as an additionalexplanatory variable. In the same way that increased female employmentmay ameliorate perceptions of women’s worth as economic beings, their
ARTICLES
16
Dow
nloa
ded
by [
84.5
2.18
1.24
] at
12:
20 3
0 Ju
ly 2
015

participation in political life might be expected to enhance perceptions oftheir value as leaders. The effect of that variable on women’s responses tothis question is not significant (but negative, as would be expected). Men’sagreement also declines as the female share of parliamentary seatsincreases, but this effect is statistically significant. While it is difficult toassess the importance of the size of this coefficient, what can be said is thatthe difference between women and men is not coincidental. Female shareof employment has no effect, nor does the agricultural variable. Regionaldummies are surprisingly not significant after controlling for these otherfactors. The coefficient on growth is negative, indicating that economicdownturns lead to less acceptance of women as political leaders – or thatgrowth contributes to more positive perceptions of females as leaders. Whythis would be so is not readily apparent.
Finally, on the statement that university education is more important forboys than girls, female share of employment has a negative statisticallysignificant effect on this bias for men but is not significant for women.Thus, a 1 percentage point increase in female share of employmentcontributes to a decline of one quarter of a percentage point in the share ofmen who believe a university education is more important for boys. Thismay seem to be a small effect. Nevertheless, given the large sample size ofthe survey, this causal link on the impact of women’s increased visibility asincome generators is noteworthy. Growth has a strong negative effect forboth men and women, while the share of agriculture in GDP is notsignificant. Dummies for LAC and OECD countries are statisticallysignificant and indicate substantially smaller percentages of men andwomen hold those views than in the Sub-Saharan Africa region.
In sum, the results for all five questions consistently identify the potentialfor increases in women’s economic activity relative to men’s to reducegender-biased norms and stereotypes, an effect that is independent of theperformance of the economy and regional cultural norms. On the twoquestions related to women’s role as workers in the productive sector of theeconomy, the share of agricultural output in GDP appears to contribute toinequitable gender norms and stereotypes.
As a robustness check, I reran these regressions using female share of thelabor force in place of female share of employment. The reason for usingfemale share of the labor force is two-fold. First, the data for this variableare more readily available, and its inclusion allows us to expand the numberof observations in our sample. Second, it may be that women’sidentification of themselves as being economically active (even if theycan’t find a job) is sufficient to leverage changes in norms and stereotypes.
In addition, I control for natural log of per capita GDP to account for thepossibility that a country’s level of development can contribute to greatergender equity in line with the reasoning of Inglehart and Norris (2003),although to some extent, regional dummies capture level of development
EVIDENCE ON GLOBAL TRENDS IN GENDER NORMS
17
Dow
nloa
ded
by [
84.5
2.18
1.24
] at
12:
20 3
0 Ju
ly 2
015

as noted earlier. The inverted-U hypothesis, which links women’s increasedlabor force participation with the level of development, might be expectedto lead to collinearity between these two variables. As seen below, this doesnot appear to be a problem with these data, perhaps because this analysisuses female share of the labor force rather than the simple female rate ofparticipation.
Table 5 reports the results of these regressions. Increases in per capitaGDP are associated with more gender-equitable attitudes. Inclusion of thisvariable causes the standard errors on the OECD dummy to become largerin some questions, suggesting that the OECD dummy is proxying for percapita income. The results are otherwise very similar to those with femaleshare of employment: female share of the labor force attenuates rigidgender norms and stereotypes for men and women. This result suggeststhat, apart from the effect of ‘‘modernization’’ on cultural values (Inglehartand Norris 2003), women’s role in the economy has an independent effecton gender norms and stereotypes.25
A NOTE ON CLASS
Women’s and men’s class locations may affect the degree to which theyadhere to traditional gender norms and stereotypes. Women’s classpositions, which can of course be influenced by their male partners’ classpositions, may be a factor in determining the extent to which they aremotivated to work in the paid labor force. Globalization has led todeterioration in outcomes for low-income males as well as females. Com-petition for employment and family tensions over shifting gender access toincome may cause there to be differences in norms and stereotypes held bymen in low-income households and men in other classes.
To consider this question, I examine the data from the 1995 wave forseveral questions by class and gender. Table 6 presents the data, with classself-reported by respondents. Two generalizations can be made from thesedata. First, men in all classes hold more patriarchal views than women onevery question, whether in reference to economic, political, or educationalissues. Second, among men and women, the richest and poorest hold themost discriminatory attitudes, while those in middle-income groups havemore gender-equitable attitudes.
There is one caveat to this last generalization. On the question ofwhether both husband and wife should contribute to household income, ifwe were to infer that agreement indicates a more gender equitable attitude,both rich men and rich women could be considered less egalitarian thanthose in other classes, including low-income groups. This could be due tothe fact that masculinist norms trump economic need in high-incomehouseholds, underscoring the role of wealth as a contributing factor to thedisempowering ‘‘trophy wife’’ effect.
ARTICLES
18
Dow
nloa
ded
by [
84.5
2.18
1.24
] at
12:
20 3
0 Ju
ly 2
015

Tab
le5
Ro
bu
stn
ess
chec
k:In
flu
ence
of
gen
der
equ
alit
yan
dm
acro
eco
no
mic
vari
able
sfr
om
1995
to20
00
Q61
Men
righ
tto
job
Q93
Wom
enn
eed
chil
dren
tobe
fulfi
lled
Q98
Wor
kin
gm
omca
nha
veas
good
rela
tion
-sh
ipw
ith
chil
dren
Q10
1M
enm
ake
bett
erpo
liti
cal
lead
ers
Q10
3U
niv
.ed
.m
ore
impt
.fo
rbo
ys
FM
FM
FM
FM
FM
Fsh
are
of
lab
or
forc
e7
0.85
1(0
.22)
***
70.
878
(0.2
2)**
*7
0.32
2(0
.35)
70.
410
(0.3
3)0.
856
(0.2
8)**
*0.
840
(0.4
1)**
0.00
1(0
.32)
70.
345
(0.3
2)7
0.12
8(0
.21)
70.
512
(0.2
7)*
Lo
g(P
erca
pit
aG
DP
)7
3.47
1(0
.75)
***
75.
047
(1.0
2)**
*7
4.98
8(0
.43)
***
73.
856
(1.3
7)**
*2.
807
(1.4
5)*
3.15
2(1
.57)
**7
4.64
1(0
.99)
72.
622
(1.2
68)*
*7
1.96
1(0
.75)
***
72.
745
(1.3
9)G
row
thG
DP
70.
638
(0.9
2)**
*0.
759
(0.1
2)**
*0.
030
(0.2
6)7
0.07
4(0
.22)
70.
185
(0.2
7)7
0.10
3(0
.26)
70.
890
(0.1
8)**
*7
0.74
5(0
.19)
***
70.
311
(0.1
1)**
*7
0.44
9(0
.13)
***
Asi
a12
.27
(3.7
8)**
*4.
804
(4.5
4)7.
274
(7.0
7)8.
436
(7.0
6)0.
362
(5.8
9)7
1.21
4(6
.26)
6.51
3(1
0.43
)7
2.62
6(1
0.03
)7.
577
(5.4
5)5.
131
(8.0
2)T
ran
siti
on
5.95
(3.8
0)7
2.72
1(4
.59)
7.01
0(6
.99)
6.55
7(6
.61)
73.
01(4
.71)
77.
960
(4.7
8)*
0.58
2(9
.70)
0.72
4(9
.24)
1.00
5(5
.32)
71.
317
(7.5
0)M
EN
A27
.01
(5.8
4)**
*22
.65
(5.5
7)**
*3.
224
(8.0
6)4.
682
(8.1
0)7
2.75
7(6
.28)
711
.44
(6.6
7)*
15.4
1(1
1.33
)14
.83
(11.
52)
3.50
2(5
.86)
6.42
1(8
.77)
LA
C7
11.1
6(3
.88)
***
720
.86
(4.9
2)**
*7
15.3
0(7
.71)
*7
14.2
1(7
.62)
*2.
340
(5.4
9)7
1.60
1(5
.80)
711
.47
(10.
27)
715
.63
(9.6
3)7
2.86
0(5
.71)
78.
074
(8.7
2)O
EC
D7
12.2
7(4
.09)
**7
12.1
4(5
.45)
**7
26.1
6(9
.04)
**7
23.6
3(8
.42)
***
73.
725
(6.3
0)7
10.9
6(6
.33)
*7
19.5
0(9
.16)
**7
24.4
2(8
.61)
***
75.
207
(5.0
5)7
8.58
1(8
.17)
Fsh
are
par
liam
ent
0.11
1(0
.15)
70.
183
(0.1
4)C
on
stan
t93
.41
(10.
8)**
*12
3.57
(10.
2)**
*12
1.84
(15.
8)**
*11
5.51
(15.
5)**
*18
.67
(13.
4)14
.28
(18.
4)63
.21
(20.
1)**
*95
.47
(21.
3)**
*40
.21
(10.
8)**
*71
.01
(14.
8)**
*A
dju
sted
R2
0.70
80.
789
0.70
60.
689
0.57
00.
269
0.73
50.
770
0.60
50.
564
N13
613
614
914
913
813
858
5873
73
Not
es:N
isth
en
um
ber
of
cou
ntr
ies
inth
esa
mp
lew
ith
dat
am
easu
red
asco
un
try
aver
ages
.GL
Sp
anel
dat
aes
tim
atio
nw
ith
rob
ust
stan
dar
der
rors
.Sta
nd
ard
erro
rsin
par
enth
eses
.T
hre
eas
teri
sks
(***
)d
eno
tesi
gnifi
can
ceat
the
1p
erce
nt
leve
l,tw
o(*
*)at
the
5p
erce
nt
leve
l,an
do
ne
(*)
atth
e10
per
cen
tle
vel.
Om
itte
dre
gio
nis
Sub
-Sah
aran
Afr
ica.
Co
effi
cien
tso
nti
me
du
mm
ies,
sign
ifica
nt
for
all
bu
tQ
101,
are
no
tre
po
rted
her
e.M
EN
Ais
Mid
dle
Eas
tan
dN
ort
hA
fric
a.
EVIDENCE ON GLOBAL TRENDS IN GENDER NORMS
19
Dow
nloa
ded
by [
84.5
2.18
1.24
] at
12:
20 3
0 Ju
ly 2
015

Interestingly, the gender gap in attitudes (again measured as femalepercentage minus male percentage) was smallest for the statement ‘‘Ifwomen earn more than men, it is bound to create problems,’’ with theexception of the wealthiest income group. This question is not strictly avalues question. It reflects observations about the effect on householddynamics of women transgressing a long-held gender norm that men arethe breadwinners and heads of household. There seems to be genderagreement that income inequality in favor of women is likely to bedisruptive, and this view again is especially pronounced in high and low-income households.26
These results suggest that although there are class differences inattitudes, the gender difference persists across income groups, to a greateror lesser extent. More investigation into the causes of greater degree ofpatriarchal attitudes at the extremes of the income distribution would be afruitful endeavor. This finding raises another question. Given the growth ofincome inequality globally, with the size of the middle-income groupsshrinking, will there be greater movement toward gender inequitableattitudes if this trend persists? Perhaps not, as the data in this paper imply atrend toward more gender equitable attitudes. Nevertheless, given the time
Table 6 Class-disaggregated responses to selected questions, 1995 wave (percent thatAgree/Strongly Agree)
Upper Upper-Middle Lower-Middle Working Lower
When jobs are scarce, men have more right to a job than women.Males 50.1 47.1 53.0 51.2 67.0Females 34.6 38.8 40.5 37.8 48.7Gender gap 715.5** 78.3** 712.5** 713.4** 718.3**
A unversity education is more important for a boy than for a girl.Males 33.5 25.4 29.4 27.4 40.1Females 19.4 16.9 18.1 19.5 29.2Gender gap 714.1** 78.6** 711.3** 77.9** 710.9**
Both the husband and wife should contribute to household income.Males 82.6 79.2 81.7 82.7 84.3Females 84.5 85.2 87.6 88.6 87.3Gender gap 1.8 6.0** 5.9** 5.9** 3.0**
Men make better political leaders than women do.Males 61.3 54.7 59.5 57.0 67.8Females 43.6 41.9 43.2 42.1 55.6Gender gap 717.7** 712.8** 716.3** 714.3** 712.2**
If a woman earns more than her husband, it’s almost certain to cause problems.Males 55.0 43.0 47.1 46.3 56.1Females 44.0 44.0 46.2 46.2 52.8Gender gap 711.0** 1.0 70.9 70.1 73.3**
Notes: The gender gap is the female percentage in agreement with the statement minus the malepercentage. Two asterisks (**) denote statistically significant difference (or change) at 5% level.
ARTICLES
20
Dow
nloa
ded
by [
84.5
2.18
1.24
] at
12:
20 3
0 Ju
ly 2
015

that it takes for norms and stereotypes to solidify via the transmission tochildren (a kind of cohort effect), this is a potential problem in the future.
CONCLUSIONS
The expression ‘‘Plus ca change, plus c’est la meme chose’’ implies thatwhile surface phenomena may change, profound transformation is harderto come by. Is that the case with gender-biased norms and stereotypes? Iseek to answer this question using data from the World Values Survey, andfind evidence that things do change. All in all, the evidence suggests thatnorms and stereotypes are shifting in a gender-equitable direction. This istrue for both men and women; although the gap between men’s andwomen’s attitudes continues to exist, it has closed on a few issues. Eventhough women internalize gender norms and stereotypes, they appear todo so to a lesser extent than men.
The regression results further suggest that women’s economic empower-ment is one factor in this shift, whether that occurs by example or throughpersuasion. Previous studies have argued that structural change of theeconomy and modernization are the major factors behind this shift, withwomen’s increased share of employment as an outcome of those processes(Inglehart and Norris 2003; Iversen and Rosenbluth 2005). The resultspresented here show that women’s increased share of employment hasan independent effect on norms and stereotypes, even after controllingfor region, macroeconomic conditions, and the structure of production,although each of these additional variables also explains some of thedifferences and trends in norms and stereotypes.
It is somewhat more challenging to interpret the results on the effects ofgrowth. It would seem simplistic to infer that economic growth in therecent period has been of a kind that unambiguously reduces patriarchalattitudes, given the widespread evidence of harsh and often insecure workarrangements women have been able to secure. It may be more useful toexplain the role of macroeconomic conditions as related to the socialeffects of an expanding or contracting economic pie. One interpretation isthat as the economic pie expands, there is less male resistance to femaleeconomic empowerment, even though relative economic standing isshifting in favor of women. Another interpretation is that during periodsof economic crisis (negative GDP growth), patriarchal attitudes resurge.
The policy implications of these results are important. BarbaraBergmann (2001), for one, has long advocated that the key to genderequity is expanding women’s participation in paid labor, arguing thatpolicies that glorify women’s caretaker role and keep them out of the labormarket will undermine the possibilities for progressive change. Her stanceseems to be vindicated by the results presented here. Policies that enablewomen to combine work with care responsibility thus appear to be a fruitful
EVIDENCE ON GLOBAL TRENDS IN GENDER NORMS
21
Dow
nloa
ded
by [
84.5
2.18
1.24
] at
12:
20 3
0 Ju
ly 2
015
avenue to promoting still greater improvement not only in well-being but inhastening the dismantling of restrictive norms and stereotypes that inhibitwomen and give men justification for their greater material and socialstatus.
Stephanie Seguino, University of Vermont, Department of Economics,Old Mill 237, Burlington, Vermont 05401, USA
e-mail: [email protected]
ACKNOWLEDGMENTS
I am grateful to three anonymous referees for their incisive comments. Iwould also like to acknowledge the impressive research assistance of JamesLovinsky and Tarik Yeasir. Irene van Staveren, Heather Antecol, JohannesJutting, and Nancy Folbre generously provided useful comments as well. Toall, thank you.
NOTES1 ‘‘Plus ca change, plus c’est la meme chose’’ is a French idiomatic expression that
literally translates as ‘‘The more things change, the more things stay the same.’’Metaphorically, it can be translated as ‘‘History repeats itself.’’ Or, to expand that,‘‘That which has been is what will be, and that which has been done is that which willbe done. So, there is nothing new under the sun.’’
2 Individuals may have multiple goals and diverse identities that sometimes clash.Gender identity, however, has been cited as being of singular importance in shapingindividual actions and societal pressures. For analyses of how identity affects economicbehavior, see Nancy Folbre (1994) from a gender perspective, and George Akerlofand Rachel Kranton (2000).
3 How children absorb gender roles continues to be debated. Social learning theory(Julian Rotter 1982) emphasizes the importance of direct reinforcement andmodeling in shaping children’s behavior and attitudes. Cognitive theories, such asgender schema theory, posit that children very early recognize that they are a boy or agirl, not both (Sandra Bem 1981). This categorization serves as a magnet for newinformation and the child begins assimilating new experiences into this schema.Broad distinctions between what kinds of behaviors and activities go with each genderare acquired by observing other children and through the reinforcement they receivefrom their parents.
4 It should be noted that while Iversen and Rosenbluth (2005) may be accurate in theirrepresentation of agricultural societies in earlier periods, their generalization of thegender division of labor is not universally applicable today. For example, in Sub-Saharan Africa, both women and men participate in agriculture, but often there is agender division of labor in crop production.
5 ‘‘Distress’’ sales of labor refer to women’s increase in paid labor time in response todeclines in income or wages of other family members (often husbands), with the ideathat in order to maintain a target level of household income, women must increasetheir time in paid labor.
6 Structural adjustment programs that lead to economic crisis, informalization of labor,and more insecure work conditions have also, in some cases, created the conditions
ARTICLES
22
Dow
nloa
ded
by [
84.5
2.18
1.24
] at
12:
20 3
0 Ju
ly 2
015

for an increase in sex work – one of the few viable alternatives for generating incomefor women (Kamala Kempadoo 1999, 2004). Both women and men (but primarilywomen) are engaging in this work. Given the sexualization of women’s paid labor, it isunclear to what extent this affects gender norms.
7 Post-industrial societies are defined in this study as the twenty most affluent countriesin the world.
8 Morrisson and Jutting (2005) argue that these institutions are exogenous in that theyhave been in practice for many years, if not decades or centuries. For this reason, theyview the customs as pre-dating current trends in female employment.
9 It is useful at this point to recall the evidence on the U-shaped relationship betweenfemale labor force participation and GDP per capita. This finding implies that poorand rich countries experience high female labor force participation rates, whereasmiddle income countries are characterized by low female labor force participation.Theorists have attributed this relationship to changes in labor market structure, socialnorms regarding the nature of women’s work, and cultural factors such as religion,social mobility, and family structure (see, for example, Claudia Goldin [1995]). Thisargument is compatible with that made by Inglehart and Norris (2003) who assert thatmodernization of cultural norms leads to gender equitable changes in norms andstereotypes. Using a relative measure, Cagatay and Olzer (1995) find that at earlierstages of development, women’s share of the labor force falls and attribute this tourbanization and a separation of productive from reproductive work, with womenfinding it difficult to combine both roles. As growth proceeds, however, relativefemale labor force participation rises with the commodification of domestic labor,falling fertility, and more education for women. Both approaches use per capitaincome as a measure of the stage of development. This suggests that in the empiricalanalysis, there may be some collinearity between GDP and women’s share ofemployment or feminization of the labor force.
10 Two possible sources are the International Labour Organization’s Yearbook of LabourStatistics (various years) and the United Nation Development Programme’s (UNDP)Human Development Report (various years). In the former, gender-disaggregated wagedata, primarily for the manufacturing sector, are reported, but data for manycountries are missing. With regard to the UNDP, which provides data on female shareof income, data are often only estimated, based on the assumption that on averagewomen earn 75 percent of men’s income. This is because, again, country-level datathat can be used to make reliable estimates are simply not available. I have, therefore,used only female access to paid employment as a second best alternative.
11 Psychologists who investigate the dynamics of gender norms and stereotypes, however,are not so much focused on the length of time it takes for change to occur as they areon the factors that induce change.
12 Attitudes, of course, are not strictly speaking norms and stereotypes. But attitudestowards various subject matters are based on the underlying set of gender definitionsthat a person holds.
13 For a more detailed discussion of the World Values Survey’s sampling methods, seeInglehart, Basanez, Dıez-Medrano, Halman, and Luijkx (2004). The Kish-grid systemensures that the household member to be interviewed is selected entirely at randomand has an equal chance of being interviewed. It thus avoids the possible bias that canbe caused by interviewers interviewing only the most accessible household members.The modified quota sampling approach used is described as follows. ‘‘Some surveysused a probability model (area sampling) down to the household level, but switchedto a quota design at this last stage’’ (2004: 390).
14 No countries from the Middle East and North Africa (MENA) were included in the1990 wave.
EVIDENCE ON GLOBAL TRENDS IN GENDER NORMS
23
Dow
nloa
ded
by [
84.5
2.18
1.24
] at
12:
20 3
0 Ju
ly 2
015

15 The gap is positive in those cases where the question is posed in a gender equitablefashion and negative when the question is posed such that agreement suggests a morepatriarchal attitude.
16 To some extent, an explanation for the declines in the transition economies must befound at the country level. The data reveal a wide dispersion in average male andfemale attitudes to the question about jobs. For example, in Russia the percentage ofmen who agreed with this statement was 50.0 percent in 1990, falling to 42.5 percentin 2000, while Slovenia reveals, on average, more equitable norms held by men, with34.0 percent agreeing in 1990 and 17.9 percent in 2000.
17 Regionally disaggregated data, however, show a sharp decline in feelings of controlover lives in Sub-Saharan Africa.
18 It is sometimes claimed that women are more altruistic than men, that is, that womenexhibit greater empathy (James Andreoni and Lise Vesterlund 2001; AlessandroInnocenti and Maria Grazia Pazienza 2006). This may also be a factor motivatingwomen’s greater support for redistributive programs (Torben Iversen and FrancesRosenbluth 2006; Torben Iversen, Frances Rosenbluth, and David Soskice 2005).Insofar as this is viewed as a fixed trait, we would not expect to see evidence thatgender differences in empathy change over time. And yet, the evidence presented inthis paper suggests changes over time in both men’s and women’s attitudes towardsredistribution.
19 GLS is a method for dealing with cross-sectional heteroskedasticity. Heteroskedasticitymay be a problem in a panel data analysis such as this if, for example, the quality ofenumeration differs between countries, leading to larger variances in responses. I alsoconducted these analyses with OLS and results were very similar.
20 GDP is inherently a problematic measure. While it is often viewed as an indicator ofaccess to material resources, it undercounts much of women’s production and givescredit to some kinds of economic activity that have harmful effects. There is a gooddeal of research that shows that growth is not equal to well-being, and indeed, it wasprecisely this recognition that led to the development of Amartya Sen’s capabilitiesapproach (Sen 1999). Interpretation of the effects of this variable then should beviewed with caution and a clear understanding of the limitations of this measure. Infact, it may be useful to read this variable as a measure of commodification ofeconomies rather than as an indicator of the size of the economic pie. The question ofhow to measure material resources available for distribution is one that feministeconomists have been grappling with in recent years when exploring the impact ofglobalization-cum-liberalization on well-being. Absent a more generalizable measure ofmaterial well-being, however, GDP remains the single quantifiable measure widelyavailable.
21 Thus, for example, the average of female share of employment from 1985 – 9 is usedto explain gender norms and stereotypes in 1990 and so on.
22 Agriculture’s share of GDP in 1990 is used to explain gender norms in stereotypes in1990. For consistency, it would have been useful to measure agriculture with the samelagged approach as used for the remaining variables. However, that would havecaused a dramatic reduction in the sample size since, for most of the transitioneconomies, these data are not available before 1990.
23 Robustness checks seek to determine how sensitive the results are to the modelspecification. In this case, I vary the choice of variables used to measure female accessto work and the structure of the economy to assess whether these variables continue toproduce the same effect on norms and stereotypes.
24 For the regressions (not reported here) in which I did use female relative wages, thatvariable was insignificant. But the sharply reduced sample size leads me to be cautiousabout those results.
ARTICLES
24
Dow
nloa
ded
by [
84.5
2.18
1.24
] at
12:
20 3
0 Ju
ly 2
015

25 Inglehart and Norris (2003), as noted, also make the point that the relationshipbetween the level of development and gender equitable attitudes may well have to dowith the role of the state in implementing policies such as affirmative action, equalpay, reproductive rights, and equitable access to education may play an importantmediating role. Governments in higher income countries have been more active inimplementing such policies, although certainly some lower income countries havealso adopted some of these policies (e.g., Viet Nam and a number of transitioneconomies). Thus, level of development does not adequately proxy for the role of thestate in influencing gender norms and stereotypes.
26 In the regionally disaggregated data, we find that in the OECD and LAC regions, ahigher percentage of women than men agreed with this statement.
REFERENCES
Akerlof, George and Rachel Kranton. 2000. ‘‘Economics and Identity.’’ Quarterly Journalof Economics 115(3): 715 – 53.
Andreoni, James and Lise Vesterlund. 2001. ‘‘Which is the Fair Sex? Gender Differencesin Altruism.’’ Quarterly Journal of Economics 116(1): 293 – 312.
Barker, Gary, Marcos Nascimiento, Marcio Segundo, and Julie Pulerwitz. 2000. How DoWe Know If Men Have Changed? Promoting and Measuring Attitude Change with Young Men:Lessons from Program H in Latin America. Washington, DC: Oxfam.
Bem, Sandra. L. 1981. ‘‘Gender Schema Theory: A Cognitive Account of Sex Typing.’’Psychological Review 88: 354 – 64.
Benerıa, Lourdes. 2003. Gender, Development, and Globalization: Economics as if PeopleMattered. New York and London: Routledge.
Bergmann, Barbara R. 2001. ‘‘Subsidizing Child Care by Mothers at Home.’’ FeministEconomics 6(1): 77 – 88.
Blumberg, Rae Lesser. 1984. ‘‘A General Theory of Gender Stratification.’’ SociologicalTheory 2: 23 – 101.
——. 1988. ‘‘Income Under Female vs. Male Control: Hypotheses from a Theory ofGender Stratification and Data from the Third World.’’ Journal of Family Issues 9(1):51 – 84.
Burnell, Barbara and Johanna Ratzel. 2005. The Effects of Social Norms and Perceptionson the Relationship Between Labor Market Opportunities and Women’s Status inIndia. Paper presented at annual IAFFE meetings, Washington, DC.
Cagatay, Nilufer and Sule Ozler. 1995. ‘‘Feminization of the Labour Force: The Effects ofLong-Term Development and Structural Adjustment.’’ World Development 23(11):1883 – 984.
Chafetz, Janet Saltzman. 1989. ‘‘Gender Equality: Toward a Theory of Change,’’ in RuthWallace, ed. Feminism and Sociological Theory, pp. 135 – 60. Newbury Park, CA: Sage.
Chant, Sylvia. 2002. ‘‘¿Crisis en la familia? ¿Crisis en la masculinidad? Reflexiones sobrelas masculinidades, el trabajo y la familia en el noroeste de Costa Rica [Crisis in theFamily? Crisis in Masculinity? Reflections on Masculinities, Work, and Family inNorthwestern Costa Rica],’’ in Eugenia Rodrıguez, ed. Un siglo de luchas femeninas enAmerica Latina, pp. 177 – 96. San Jose, Costa Rica: Universidad de Costa Rica.
Clarke, Alison, Sherry Hutchinson, and Ellen Weiss. 2004. Involving Young Men in HIVPrevention Programs. Washington, DC: Population Council.
Diekman, Amanda, Alice Eagly, Antonio Mladinic, and Maria Cristina Ferreira. 2005.‘‘Dynamic Stereotypes about Women and Men in Latin America and the UnitedStates.’’ Journal of Cross-Cultural Psychology 36(2): 209 – 26.
EVIDENCE ON GLOBAL TRENDS IN GENDER NORMS
25
Dow
nloa
ded
by [
84.5
2.18
1.24
] at
12:
20 3
0 Ju
ly 2
015

Diekman, Amanda, Wind Goodfriend, and Stephanie Goodwin. 2004. ‘‘DynamicStereotypes of Power: Perceived Change and Stability in Gender Hierarchies.’’ SexRoles 50(3/4): 201 – 15.
Dollar, David and Roberta Gatti. 1999. Gender Inequality, Income, and Growth: AreGood Times Good for Women? Policy Research Report on Gender and Development,Working Paper Series 1, World Bank, Washington, DC.
Elson, Diane. 1991. ‘‘Male Bias in Macro-Economics: The Case of StructuralAdjustment,’’ in Diane Elson, ed. Male Bias in the Development Process, pp. 164 – 90.Manchester: Manchester University Press.
——. 2002. ‘‘Gender Justice, Human Rights, and Neo-Liberal Economic Policy,’’ inM. Molyneux and S. Razavi, eds. Gender Justice, Development, and Human Rights, pp. 78 –114. Oxford: Oxford University Press.
Elson, Diane and Nulifer Cagatay. 2000. ‘‘The Social Content of MacroeconomicPolicies.’’ World Development 28(67): 1347 – 64.
Fleck, Susan. 1998. Choice or Bargain? Married Women’s Labor Force Participation inHonduras. PhD diss., American University.
Floro, Maria S. 1995. ‘‘Economic Restructuring, Gender, and the Allocation of Time.’’World Development 23(11): 1913 – 29.
Folbre, Nancy. 1994. Who Pays for the Kids? Gender and Structures of Constraint. New Yorkand London: Routledge.
Goldin, Claudia. 1995, ‘‘The U-shaped Female Labor Force Function in EconomicDevelopment and Economic History,’’ in T. Paul Schultz, ed. Investment in Women’sHuman Capital, pp. 61 – 90. Chicago: University of Chicago Press.
Hsiung, Ping-Chun. 1996. Living Rooms as Factories: Class, Gender, and the Satellite FactorSystem in Taiwan. Philadelphia: Temple University Press.
Inglehart, Ronald, Miguel Basanez, Jaime Dıez-Medrano, Loek Halman, and RuudLuijkx. 2004. Human Beliefs and Values: A Cross Cultural Sourcebook Based on the 1999 –2002 Surveys. Mexico City: Siglo XXI Editores.
Inglehart, Ronald and Pippa Norris. 2003. Rising Tide: Gender Equality and Cultural ChangeAround the World. Cambridge, UK: Cambridge University Press.
Innocenti, Alessandro and Maria Grazia Pazienza. 2006. Altruism and Gender in theTrust Game. Working Paper 5/2006, Department of Economic Policy, Finance andDevelopment, University of Siena, and Dipartimento di Studi sullo Stato, University ofFlorence.
Iversen, Torben and Frances Rosenbluth. 2005. Gender Socialization: How BargainingPower Shapes Social Norms and Political Attitudes. Working Paper, Department ofGovernment, Harvard University and Department of Political Science, Yale University.
——. 2006. ‘‘The Political Economy of Gender: Explaining Cross-National Variation inthe Gender Division of Labor and the Gender Voting Gap.’’ American Journal of PoliticalScience 50(1): 1 – 10.
Iversen, Torben, Frances Rosenbluth, and David Soskice. 2005. ‘‘Divorce and the GenderDivision of Labor in Comparative Perspective.’’ International Studies in Gender, State andSociety 12(2): 216 – 42.
Kabeer, Naila. 2000. The Power to Choose: Bangladeshi Women and Labour Market Conditionsin London and Dhaka. London and New York: Verso.
Kempadoo, Kamala. 1999. Sun, Sex and Gold: Tourism and Sex Work in the Caribbean.Lanham, MD: Rowman and Littlefield.
——. 2004. Sexing the Caribbean: Gender, Race, and Sexual Labor. New York and London:Routledge.
Larraın, Soledad. 1999. ‘‘Curbing Domestic Violence: Two Decades of Action,’’ inAndrew, Morrison and Marıa Loreto Biehl, eds. Too Close to Home: Domestic Violence inthe Americas, pp. 105 – 30. Washington, DC: Inter-American Bank.
ARTICLES
26
Dow
nloa
ded
by [
84.5
2.18
1.24
] at
12:
20 3
0 Ju
ly 2
015

Lim, Joseph. 2000. ‘‘The Effects of the East Asian Crisis on the Employment of Womenand Men: The Philippine Case.’’ World Development 28(7): 1285 – 306.
Minolti, Claudia, Alejandra Rotania, and Irma Vichich. 1991. Textile Workers in Brazil andArgentina A Study of the Interrelationships between Work and Households. Tokyo: UnitedNations University Press.
Morrisson, Christian and Johannes Jutting. 2005. ‘‘Women’s Discrimination inDeveloping Countries: A New Data Set for Better Policies.’’ World Development 33(7):1065 – 81.
Peterson, V. Spike. 2003. A Critical Rewriting of Global Political Economy. New York andLondon: Routledge.
Prugl, Elisabeth. 1999. The Global Construction of Gender: Home-Based Work in the PoliticalEconomy of the 20th Century. New York: Columbia University Press.
Rotter, Julian B. 1982. The Development and Application of Social Learning Theory.New York: Praeger.
Seguino, Stephanie. 2006. ‘‘The Great Equalizer? Globalization Effects on Gender Equityin Well-Being in Latin America and the Caribbean,’’ in Anwar Shaikh, ed. Globalizationand the Myths of Free Trade, pp. 177 – 214. New York and London: Routledge.
Sen, Amartya. 1999. Development as Freedom. New York: Anchor Books.Singh, Ajit and Ann Zammit. 2002. Gender Effects of the Financial Crisis in South Korea.
Paper presented at New Directions in Research on Gender-Aware Macroeconomicsand International Economics: An International Symposium, Levy Economics Instituteof Bard College, Annandale-on-Hudson, NY.
World Bank. 2001. Engendering Development. Oxford: Oxford University Press.World Values Survey. Various years. Data from the World Values Survey. www
.worldvaluessurvey.org (accessed October 2006).
APPENDIX
Table A.1 Data definitions and sources
Variable Source
Agriculture Value Added as % of GDP World Development Indicators 2005(online)
Female share of employment Laborstat, International LabourOrganization (http://laborsta.ilo.org/)
Female share of labor force World Development Indicators 2005(online)
Female Share of Parliamentary Seats Millennium Development Goals,Taskforce on Gender Equality(http://unstats.un.org/unsd/mi/mi_goals.asp)
GDP growth World Development Indicators 2005(online)
Per capita GDP World Development Indicators 2005(online)
EVIDENCE ON GLOBAL TRENDS IN GENDER NORMS
27
Dow
nloa
ded
by [
84.5
2.18
1.24
] at
12:
20 3
0 Ju
ly 2
015

Table A.2 Countries represented in the World Values Survey
Fixed sampleArgentinaBritainBulgariaChileChinaFinlandGermanyIndiaJapanMexicoNigeriaPolandPortugalRussiaSloveniaSouth AfricaSouth KoreaSpainSwedenUSA
Full sampleAlbania Czech Republic Israel Poland VenezuelaAlgeria Denmark Italy Portugal VietnamArgentina Dominican Rep. Japan Puerto Rico ZimbabweArmenia Egypt Jordan RomaniaAustralia El Salvador Latvia RussiaAustria Estonia Lithuania SingaporeAzerbaijan Finland Luxembourg SlovakiaBangladesh France Macedonia SloveniaBelarus Georgia Malta South AfricaBelgium Germany Mexico South KoreaBrazil Ghana Moldova SpainBritain Greece Netherlands SwitzerlandCanada Hungary New Zealand TanzaniaChile Iceland Nigeria TurkeyChina India Norway UgandaColombia Indonesia Pakistan UkraineCongo, Dem. Rep. Iran Peru UruguayCroatia Ireland Philippines USA
ARTICLES
28
Dow
nloa
ded
by [
84.5
2.18
1.24
] at
12:
20 3
0 Ju
ly 2
015


