
Graphing andtransforming functions
5Chapter
Contents: A
B
C
D
Families of functions
Transformations of graphs
Simple rational functions
Further graphicaltransformations
Review set 5A
Review set 5B
IB_HL-2edmagentacyan yellow black
0 05 5
25
25
75
75
50
50
95
95
100
100 0 05 5
25
25
75
75
50
50
95
95
100
100
Y:\HAESE\IB_HL-2ed\IB_HL-2ed_05\125IB_HL-2_05.CDR Wednesday, 24 October 2007 11:40:00 AM PETERDELL

126 GRAPHING AND TRANSFORMING FUNCTIONS (Chapter 5)
There are several families of functions that you are already familiar with. These include:
Name General form Function notation
Linear f(x) = ax + b, a 6= 0 f : x 7! ax + b, a 6= 0
Quadratic f(x) = ax2 + bx + c, a 6= 0 f : x 7! ax2 + bx + c, a 6= 0
Cubic f(x) = ax3 + bx2 + cx + d, a 6= 0 f : x 7! ax3 + bx2 + cx + d, a 6= 0
Absolute value f(x) = jxj f : x 7! jxjExponential f(x) = ax, a > 0, a 6= 1 f : x 7! ax, a > 0, a 6= 1
Logarithmic f(x) = loge x or f(x) = lnx f : x 7! lnx
Reciprocal f(x) =k
x, x 6= 0 f : x 7! k
x, x 6= 0
These families of functions have different and distinctive graphs. We can compare them by
considering important graphical features such as:
² the axes intercepts (where the graph cuts the x and y-axes)
² slopes
² turning points (maxima and minima)
² values of x where the function does not exist
² the presence of asymptotes (lines or curves that the graph approaches).
FAMILIES OF FUNCTIONSA
INVESTIGATION FUNCTION FAMILIES
1 From the menu, graph on the same set of axes:
y = 2x + 1, y = 2x + 3, y = 2x¡ 1
Comment on all lines of the form y = 2x + b.
2 From the menu, graph on the same set of axes:
y = x + 2, y = 2x + 2, y = 4x + 2, y = ¡x + 2, y = ¡12x + 2
Comment on all lines of the form y = ax + 2.
3 On the same set of axes graph:
y = x2, y = 2x2, y = 12x
2, y = ¡x2, y = ¡3x2, y = ¡15x
2
Comment on all functions of the form y = ax2, a 6= 0.
4 On the same set of axes graph:
y = x2, y = (x¡ 1)2 + 2, y = (x + 1)2 ¡ 3, y = (x¡ 2)2 ¡ 1
and other functions of the form y = (x¡ h)2 + k of your choice.
Comment on the functions of this form.
In this investigation you are encouraged to use the graphingpackage supplied. Click on the icon to access this package.�
What to do:
GRAPHING
PACKAGE
IB_HL-2edmagentacyan yellow black
0 05 5
25
25
75
75
50
50
95
95
100
100 0 05 5
25
25
75
75
50
50
95
95
100
100
Y:\HAESE\IB_HL-2ed\IB_HL-2ed_05\126IB_HL-2_05.CDR Wednesday, 24 October 2007 11:46:55 AM PETERDELL

GRAPHING AND TRANSFORMING FUNCTIONS (Chapter 5) 127
1 If f(x) = x, find in simplest form:
a f(2x) b f(x) + 2 c 12 f(x) d 2 f(x) + 3
2 If f(x) = x3, find in simplest form:
a f(4x) b 12 f(2x) c f(x + 1) d 2 f(x + 1) ¡ 3
Note: (x + 1)3 = x3 + 3x2 + 3x + 1. See the binomial theorem, Chapter 8.
3 If f(x) = 2x, find in simplest form:
a f(2x) b f(¡x) + 1 c f(x¡ 2) + 3 d 2 f(x) + 3
4 If f(x) =1
x, find in simplest form:
a f(¡x) b f(12x) c 2 f(x) + 3 d 3 f(x¡ 1) + 2
5 On the same set of axes, graph these absolute value functions:
a y = jx j, y = 2 jx j, y = j 2x jb y = jx j, y = jx j + 2, y = jx j ¡ 3
c y = jx j, y = jx¡ 2 j, y = jx + 3 j, y = jx¡ 1 j + 2
Write a brief report on your discoveries.
6 On the same set of axes, graph these functions:
a y =1
x, y =
3
x, y =
10
xb y =
¡1
x, y =
¡2
x, y =
¡5
x
c y =1
x, y =
1
x¡ 2, y =
1
x + 3d y =
1
x, y =
1
x+ 2, y =
1
x¡ 2
e y =2
x, y =
2
x¡ 1+ 2, y =
2
x + 2¡ 1
Write a brief report on your discoveries.
If f(x) = x2, find in simplest form:
a f(2x) b f³x
3
´c 2 f(x) + 1 d f(x + 3) ¡ 4
a f(2x)
= (2x)2
= 4x2
b f³x
3
´=
³x3
´2
=x2
9
c 2 f(x) + 1
= 2x2 + 1
d f(x + 3) ¡ 4
= (x + 3)2 ¡ 4
= x2 + 6x + 9 ¡ 4
= x2 + 6x + 5
Example 1
EXERCISE 5A
IB_HL-2edmagentacyan yellow black
0 05 5
25
25
75
75
50
50
95
95
100
100 0 05 5
25
25
75
75
50
50
95
95
100
100
Y:\HAESE\IB_HL-2ed\IB_HL-2ed_05\127IB_HL-2_05.CDR Wednesday, 24 October 2007 11:48:13 AM PETERDELL

128 GRAPHING AND TRANSFORMING FUNCTIONS (Chapter 5)
For the following questions, use the graphing package or your graphics
calculator to graph and find the key features of the functions.
5 Consider f : x 7! 2x + 3 or y = 2x + 3.
a Graph the function.
b Find algebraically, the: i x-axis intercept ii y-axis intercept iii slope.
c Use technology to check the axes intercepts found in b.
6 Consider f : x 7! (x¡ 2)2 ¡ 9.
a Graph the function.
b Find algebraically the x and y axes intercepts.
c Use technology to check that:
i the x-axis intercepts are ¡1 and 5 ii the y-intercept is ¡5
iii the vertex is (2, ¡9).
7 Consider f : x 7! 2x3 ¡ 9x2 + 12x¡ 5.
a Graph the function.
b Check that: i the x-intercepts are 1 and 212 ii the y-intercept is ¡5
iii the minimum turning point is at (2, ¡1)
iv the maximum turning point is at (1, 0).
8 Sketch the graph of y = jx j.Note: jx j = x if x > 0 and jx j = ¡x if x < 0.
9 Consider f : x 7! 2x. Graph the function and
check these key features:
a as x ! 1, 2x ! 1b as x ! ¡1, 2x ! 0 (from above)
c the y-intercept is 1
d 2x is > 0 for all x.
10 Consider f : x 7! loge x.
Graph the function and then check that:
a as x ! 1, lnx ! 1 b as x ! 0 (from the right), lnx ! ¡1c lnx only exists if x > 0 d the x-intercept is 1
e the y-axis is an asymptote.
In the next exercise you should discover the graphical connection between y = f(x) and
functions of the form:
² y = f(x) + b, b is a constant ² y = f(x¡ a), a is a constant
² y = p f(x), p is a positive constant ² y = f(kx), k is a positive constant
² y = ¡f(x) ² y = f(¡x)
! reads‘ ’or ‘ ’approaches
tends to
GRAPHING
PACKAGE
TRANSFORMATIONS OF GRAPHSB
IB_HL-2edmagentacyan yellow black
0 05 5
25
25
75
75
50
50
95
95
100
100 0 05 5
25
25
75
75
50
50
95
95
100
100
Y:\HAESE\IB_HL-2ed\IB_HL-2ed_05\128IB_HL-2_05.CDR Wednesday, 24 October 2007 11:53:44 AM PETERDELL

GRAPHING AND TRANSFORMING FUNCTIONS (Chapter 5) 129
1 a Sketch the graph of f(x) = x2.
b On the same set of axes sketch the graphs of:
i y = f(x) + 2, i.e., y = x2 + 2 ii y = f(x) ¡ 3, i.e., y = x2 ¡ 3
c What is the connection between the graphs of y = f(x) and y = f(x) + b if:
i b > 0 ii b < 0?
2 For each of the following functions f , sketch on the same set of axes y = f(x),y = f(x) + 1 and y = f(x) ¡ 2.
a f(x) = jx j b f(x) = 2x c f(x) = x3 d f(x) =1
xSummarise your observations by describing the graphical transformation of y = f(x)as it becomes y = f(x) + b.
3 a On the same set of axes, graph: f(x) = x2, y = f(x¡ 3) and y = f(x+ 2).
b What is the connection between the graphs of y = f(x) and y = f(x¡ a) if:
i a > 0 ii a < 0?
4 For each of the following functions f , sketch on the same set of axes the graphs of
y = f(x), y = f(x¡ 1) and y = f(x + 2).
a f(x) = jx j b f(x) = x3 c f(x) = lnx d f(x) =1
xSummarise your observations by describing the geometrical transformation of y = f(x)as it becomes y = f(x¡ a).
5 For each of the following functions sketch:
y = f(x), y = f(x¡ 2) + 3 and y = f(x + 1) ¡ 4 on the same set of axes.
a f(x) = x2 b f(x) = ex c f(x) =1
x
6 Copy these functions and then draw the graph of y = f(x¡ 2) ¡ 3:
a b
7 Given f(x) = x2 is transformed to g(x) = (x¡ 3)2 + 2 :
a find the images of the following points on f(x) :
i (0, 0) ii where x = ¡3 iii where x = 2
b find the points on f(x) which correspond to the following points on g(x) :
i (1, 6) ii (¡2, 27) iii (112 , 41
4 )
TYPES y f x b y f x a= ( ) + = ( )AND ¡
EXERCISE 5B.1
y
x
y
x
IB_HL-2edmagentacyan yellow black
0 05 5
25
25
75
75
50
50
95
95
100
100 0 05 5
25
25
75
75
50
50
95
95
100
100
Y:\HAESE\IB_HL-2ed\IB_HL-2ed_05\129IB_HL-2_05.CDR Wednesday, 24 October 2007 11:55:56 AM PETERDELL

130 GRAPHING AND TRANSFORMING FUNCTIONS (Chapter 5)
1 Sketch on the same set of axes, the graphs of y = f(x), y = 2 f(x) and y = 3 f(x)for each of:
a f(x) = x2 b f(x) = jx j c f(x) = x3
d f(x) = ex e f(x) = lnx f f(x) =1
x
2 Sketch on the same set of axes, the graphs of y = f(x), y = 12f(x) and y = 1
4f(x)for each of:
a f(x) = x2 b f(x) = x3 c f(x) = ex
3 Using 1 and 2, summarise your observations by describing the graphical transformation
of y = f(x) to y = p f(x) for p > 0.
4 Sketch on the same set of axes, the graphs of y = f(x) and y = f(2x) for each of:
a y = x2 b y = (x¡ 1)2 c y = (x + 3)2
5 Sketch on the same set of axes, the graphs of y = f(x) and y = f(3x) for each of:
a y = x b y = x2 c y = ex
6 Sketch on the same set of axes, the graphs of y = f(x) and y = f¡x2
¢for each of:
a y = x2 b y = 2x c y = (x + 2)2
7 Using 4, 5 and 6, summarise your observations by describing the graphical transformation
of y = f(x) to y = f(kx) for k > 0.
8 Consider the function f : x 7! x2.
On the same set of axes sketch the graphs of:
a y = f(x), y = 3f(x¡ 2) + 1 and y = 2f(x+ 1)¡ 3
b y = f(x), y = f(x¡ 3), y = f¡x2 ¡ 3
¢, y = 2f
¡x2 ¡ 3
¢and y = 2f
¡x2 ¡ 3
¢+ 4
c y = f(x) and y = 14 f(2x+ 5) + 1.
9 a Given that the following points lie on y = f(x), find the corresponding points on
the image function y = 3f(2x) :
i (3, ¡5) ii (1, 2) iii (¡2, 1)
b Find the points on y = f(x) which are moved to the following points under the
transformation y = 3f(2x) :
i (2, 1) ii (¡3, 2) iii (¡7, 3)
10 The function y = f(x) is transformed to the function g(x) = 3 + 2f(12x + 1):
a Fully describe the transformation that maps f(x) onto g(x).
b Using a, find the image points of the following points on f(x):
i (1, ¡3) ii (2, 1) iii (¡1, ¡2)
c Find the points on f(x) which correspond to the following points on g(x):
i (¡2, ¡5) ii (1, ¡1) iii (5, 0)
EXERCISE 5B.2
TYPES ANDy p f x p > y f kx k >= ( ) 0 = ( ) 0, ,
IB_HL-2edmagentacyan yellow black
0 05 5
25
25
75
75
50
50
95
95
100
100 0 05 5
25
25
75
75
50
50
95
95
100
100
Y:\HAESE\IB_HL-2ed\IB_HL-2ed_05\130IB_HL-2_05.CDR Wednesday, 24 October 2007 11:59:23 AM PETERDELL

GRAPHING AND TRANSFORMING FUNCTIONS (Chapter 5) 131
1 On the same set of axes, sketch the graphs of:
a y = 3x and y = ¡3x b y = ex and y = ¡ex
c y = x2 and y = ¡x2 d y = lnx and y = ¡ lnx
e y = x3 ¡ 2 and y = ¡x3 + 2 f y = 2(x + 1)2 and y = ¡2(x + 1)2
2 Based on question 1, what transformation moves y = f(x) to y = ¡f(x)?
3 a Find f(¡x) for:
i f(x) = 2x + 1 ii f(x) = x2 + 2x + 1 iii f(x) = jx¡ 3 jb Graph y = f(x) and y = f(¡x) for:
i f(x) = 2x + 1 ii f(x) = x2 + 2x + 1 iii f(x) = jx¡ 3 j4 Based on question 3, what transformation moves y = f(x) to y = f(¡x)?
5 The function y = f(x) is transformed to g(x) = ¡f(x):
a Find the points on g(x) corresponding to the following points on f(x):
i (3, 0) ii (2, ¡1) iii (¡3, 2)
b Find the points on f(x) that have been transformed to the following points on g(x):
i (7, ¡1) ii (¡5, 0) iii (¡3, ¡2)
6 The function y = f(x) is transformed to h(x) = f(¡x):
a Find the image points on h(x) for the following points on f(x):
i (2, ¡1) ii (0, 3) iii (¡1, 2)
b Find the points on f(x) corresponding to the following points on h(x):
i (5, ¡4) ii (0, 3) iii (2, 3)
7 A function y = f(x) is transformed to the function y = ¡f(¡x) = g(x):
a Describe the nature of the transformation.
b If (3, ¡7) lies on y = f(x), find the transformed point on g(x).
c Find the point on f(x) that transforms to the point (¡5, ¡1).
Summary of graphical transformations on y = f(x)
I For y = f(x) + b, the effect of b is to translate the graph vertically through
b units.
² If b > 0 it moves upwards. ² If b < 0 it moves downwards.
I For y = f(x¡ a), the effect of a is to translate the graph horizontally
through a units.
² If a > 0 it moves to the right. ² If a < 0 it moves to the left.
I For y = f(x¡ a) + b, the graph is translated horizontally a units and
vertically b units. We say it is translated by the vector£ab
¤:
TYPES ANDy f x y f x= ( ) = ( )¡ ¡EXERCISE 5B.3
continued next page
IB_HL-2edmagentacyan yellow black
0 05 5
25
25
75
75
50
50
95
95
100
100 0 05 5
25
25
75
75
50
50
95
95
100
100
Y:\HAESE\IB_HL-2ed\IB_HL-2ed_05\131IB_HL-2_05.CDR Wednesday, 24 October 2007 12:04:48 PM PETERDELL

132 GRAPHING AND TRANSFORMING FUNCTIONS (Chapter 5)
I For y = p f(x), p > 0, the effect of p is to vertically stretch the graph by a
factor of p.
² If p > 1 it moves points of y = f(x) further away from the x-axis.
² If 0 < p < 1 it moves points of y = f(x) closer to the x-axis.
I For y = f(kx), k > 0, the effect of k is to horizontally compress the graph by
a factor of k.
² If k > 1 it moves points of y = f(x) closer to the y-axis.
² If 0 < k < 1 it moves points of y = f(x) further away from the y-axis.
I For y = ¡f(x), the effect is to reflect y = f(x) in the x-axis.
I For y = f(¡x), the effect is to reflect y = f(x) in the y-axis.
Note: Stretching by a factor of 1p
is equivalent to compressing by a factor of p.
For example, y = 13 f(x) indicates that y = f(x) is vertically stretched by
a factor of 13 , or compressed by a factor of 3.
Likewise, y = f(14x) indicates that y = f(x) is horizontally compressed by
a factor of 14 , or stretched by a factor of 4.
1 Copy the following graphs for y = f(x) and sketch the graphs of y = ¡f(x) on
the same axes.
a b c
2 Given the following graphs of y = f(x), sketch graphs of y = f(¡x) :
a b c
3 The scales on the graphs below are the same. Match each equation to its graph.
A y = x4 B y = 2x4 C y = 12x
4 D y = 6x4
a b c d
EXERCISE 5B.4
y
x
1
y
x
2
y
x
y
x
y
x
1
y
x
y = 1
x = 2
y
x
y
x
y
x
y
x
continued from previous page
IB_HL-2edmagentacyan yellow black
0 05 5
25
25
75
75
50
50
95
95
100
100 0 05 5
25
25
75
75
50
50
95
95
100
100
Y:\HAESE\IB_HL-2ed\IB_HL-2ed_05\132IB_HL-2_05.CDR Wednesday, 24 October 2007 12:06:44 PM PETERDELL

GRAPHING AND TRANSFORMING FUNCTIONS (Chapter 5) 133
4 For the graph of y = f(x) given, draw
sketches of:
a y = 2f(x) b y = 12f(x)
c y = f(x + 2) d y = f(2x)
e y = f(12x)
5 For the graph of y = g(x) given, draw
sketches of:
a y = g(x) + 2 b y = ¡g(x)
c y = g(¡x) d y = g(x + 1)
6 For the graph of y = h(x) given, draw
sketches of:
a y = h(x) + 1 b y = 12h(x)
c y = h(¡x) d y = h¡x2
¢
Any function x 7! ax + b
cx + d, x 6= ¡d
cwhere a, b, c and d are constants
is called a simple rational function.
These functions are characterised by the presence of both a horizontal asymptote (HA) and
a vertical asymptote (VA).
Any graph of a simple rational function can be
obtained from the reciprocal function x 7! 1
x
by a combination of transformations including:
² a translation
(vertical and/or horizontal)
² stretches and compressions
(vertical and/or horizontal)
y
x1 3
���
�
y
x
����
y h x� � �
y
x�
�
g x( )
y
x
xy
1�
SIMPLE RATIONAL FUNCTIONSC
IB_HL-2edmagentacyan yellow black
0 05 5
25
25
75
75
50
50
95
95
100
100 0 05 5
25
25
75
75
50
50
95
95
100
100
Y:\HAESE\IB_HL-2ed\IB_HL-2ed_05\133IB_HL-2_05.CDR Wednesday, 24 October 2007 12:07:45 PM PETERDELL
134 GRAPHING AND TRANSFORMING FUNCTIONS (Chapter 5)
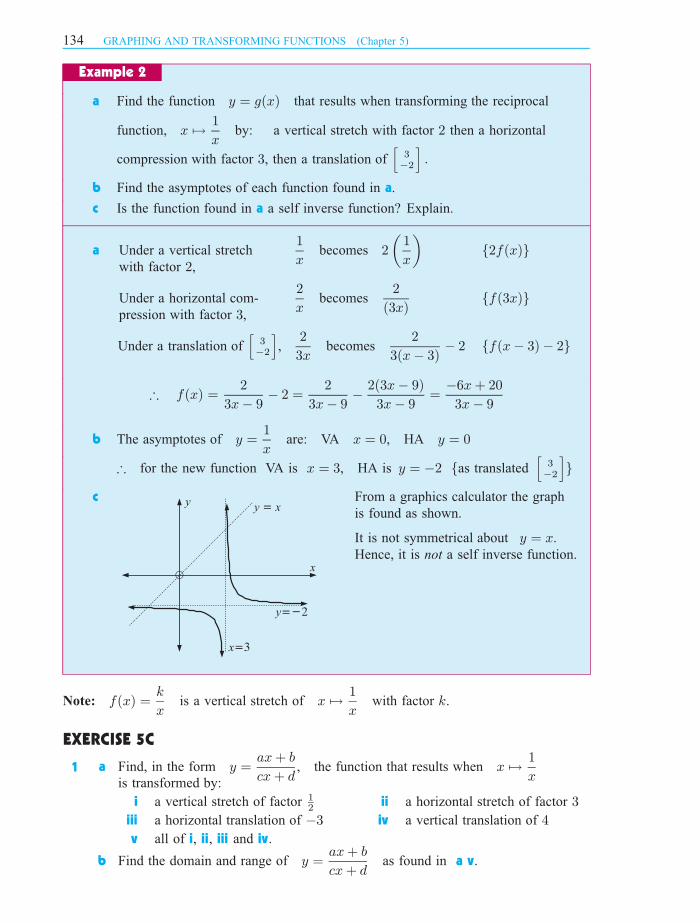
a Find the function y = g(x) that results when transforming the reciprocal
function, x 7! 1
xby: a vertical stretch with factor 2 then a horizontal
compression with factor 3, then a translation ofh
3¡2
i:
b Find the asymptotes of each function found in a.
c Is the function found in a a self inverse function? Explain.
a Under a vertical stretch
with factor 2,
1
xbecomes 2
µ1
x
¶f2f(x)g
Under a horizontal com-
pression with factor 3,
2
xbecomes
2
(3x)ff(3x)g
Under a translation ofh
3¡2
i,
2
3xbecomes
2
3(x¡ 3)¡ 2 ff(x¡ 3) ¡ 2g
) f(x) =2
3x¡ 9¡ 2 =
2
3x¡ 9¡ 2(3x¡ 9)
3x¡ 9=
¡6x + 20
3x¡ 9
b The asymptotes of y =1
xare: VA x = 0, HA y = 0
) for the new function VA is x = 3, HA is y = ¡2 fas translatedh
3¡2
ig
c From a graphics calculator the graph
is found as shown.
It is not symmetrical about y = x.
Hence, it is not a self inverse function.
Note: f(x) =k
xis a vertical stretch of x 7! 1
xwith factor k.
1 a Find, in the form y =ax + b
cx + d, the function that results when x 7! 1
xis transformed by:
i a vertical stretch of factor 12 ii a horizontal stretch of factor 3
iii a horizontal translation of ¡3 iv a vertical translation of 4
v all of i, ii, iii and iv.
b Find the domain and range of y =ax + b
cx + das found in a v.
Example 2
y
x
x��
y��
y x�
EXERCISE 5C
IB_HL-2edmagentacyan yellow black
0 05 5
25
25
75
75
50
50
95
95
100
100 0 05 5
25
25
75
75
50
50
95
95
100
100
Y:\HAESE\IB_HL-2ed\IB_HL-2ed_05\134IB_HL-2_05.CDR Wednesday, 24 October 2007 12:09:26 PM PETERDELL

GRAPHING AND TRANSFORMING FUNCTIONS (Chapter 5) 135
For the function f : x 7! 2x¡ 6
x + 1, find:
a the asymptotes b how to transform the function to give x 7! 1
x
a f(x) =2x¡ 6
x + 1=
2(x + 1) ¡ 8
x + 1= 2 ¡ 8
x + 1=
¡8
x + 1+ 2
This represents a translation of£¡1
2
¤from f(x) =
¡8
xwhich has
VA x = 0 and HA y = 0.
So, f(x) =2x¡ 6
x + 1has VA x = ¡1 and HA y = 2.
Note: ² 2x¡ 6
x + 1is undefined when x = ¡1
² as jxj ! 1, f(x) ! 2
² the domain of f(x) =2x¡ 6
x + 1is fx: x 6= ¡1g
the range of f(x) =2x¡ 6
x + 1is fy: y 6= 2g
b To get f(x) =2x¡ 6
x + 1from f(x) =
1
xwe
vertically stretch by a factor of 8 f 1
xbecomes 8
µ1
x
¶=
8
xg
then reflect in the x-axis f 8
xbecomes ¡8
xg
then translate by£¡1
2
¤ f¡8
xbecomes
¡8
x + 1+ 2g
So, to do the opposite we
translate byh
1¡2
i, then reflect in the x-axis, then vertically stretch by factor 1
8 .
Check: y =2x¡ 6
x + 1becomes y =
2(x¡ 1) ¡ 6
(x¡ 1) + 1¡ 2 =
2x¡ 8
x¡ 2 = ¡8
x
then ¡8
xbecomes
8
xand
8
xbecomes
8
(8x)=
1
x.
2 For these functions find:
i the asymptotes ii how to transform f(x) to give the function x 7! 1
x.
a f : x 7! 2x + 4
x¡ 1b f : x 7! 3x¡ 2
x + 1c f : x 7! 2x + 1
2 ¡ x
Example 3
IB_HL-2edmagentacyan yellow black
0 05 5
25
25
75
75
50
50
95
95
100
100 0 05 5
25
25
75
75
50
50
95
95
100
100
Y:\HAESE\IB_HL-2ed\IB_HL-2ed_05\135IB_HL-2_05.CDR Wednesday, 24 October 2007 12:10:34 PM PETERDELL

136 GRAPHING AND TRANSFORMING FUNCTIONS (Chapter 5)
Consider f(x) =4x + 3
x¡ 2.
a Find the asymptotes of y = f(x):
b Find the axes intercepts.
c Discuss the behaviour of f near its i VA ii HA.
d Sketch the graph of the function.
e Describe the transformations which move x 7! 1
xto x 7! 4x + 3
x¡ 2.
a y =4x + 3
x¡ 2=
4(x¡ 2) + 11
x¡ 2= 4 +
11
x¡ 2
So, the function has VA x = 2 fwhere y is undefinedgand has HA y = 4 fas jxj ! 1, y ! 4g
b When x = 0, y = 3¡2 ) y-intercept is ¡11
2
when y = 0, 4x + 3 = 0
x = ¡34 ) x-intercept is ¡3
4
c i as x ! 2 (from the left), y ! ¡1as x ! 2 (from the right), y ! 1
ii as x ! ¡1, y ! 4 (from below)
as x ! 1, y ! 4 (from above)
d e1
xbecomes
11
xunder a vertical
stretch with factor 11, and then
11
xbecomes
4x + 3
x¡ 2under a
translation of£24
¤
3 For the following functions:
i find the asymptotes ii find the axes intercepts
iii discuss the graph’s behaviour near its VA and its HA
iv sketch the graph.
v Describe the transformations which move x 7! 1
xto the given function.
a y =2x + 3
x + 1b y =
3
x¡ 2c y =
2x¡ 1
3 ¡ xd y =
5x¡ 1
2x + 1
4 In order to remove noxious weeds from her property Helga sprays with a weedicide. The
chemical is slow acting and the number of weeds per hectare remaining after t days is
modelled by N = 20 +100
t + 2weeds/ha.
a How many weeds per ha were alive before the spraying?
b How many weeds will be alive after 8 days?
c How long will it take for the number of weeds still alive to be 40/ha?
d Sketch the graph of N against t
e According to the model, is the spraying going to eradicate all weeds?
Example 4
y
x
y��
x�-1\Qw_
-\Er_
IB_HL-2edmagentacyan yellow black
0 05 5
25
25
75
75
50
50
95
95
100
100 0 05 5
25
25
75
75
50
50
95
95
100
100
Y:\HAESE\IB_HL-2ed\IB_HL-2ed_05\136IB_HL-2_05.CDR Wednesday, 24 October 2007 12:12:55 PM PETERDELL

GRAPHING AND TRANSFORMING FUNCTIONS (Chapter 5) 137
Graphics calculator tips:
² To find the zeros of a function y = f(x), simply graph the function and find
its x-intercepts.
This is equivalent to finding the roots or solutions of the equation f(x) = 0:
² To check that you have found the correct asymptotes (VA and HA):
I Try to find y for the x-asymptote value. It should be undefined.
I Try to find y for large x values, e.g., §109. It should give a value close
to the y-asymptote value.
In this exercise you should discover the graphical connection between y = f(x) and
functions of the form y =1
f(x), y = j f(x) j and y = f(jx j):
y =1
f(x)
Graph on the same set of axes:
a y = x¡ 2 and y =1
x¡ 2b y = x2 and y =
1
x2
a b
1 Graph on the same set of axes:
a y = ¡x2 and y =¡1
x2b y = (x¡ 1)(x¡ 3) and y =
1
(x¡ 1)(x¡ 3)
2 Invariant points are points which do not move under a transformation.
Show that if y = f(x) is transformed to y =1
f(x), invariant points occur at y = §1.
Check your results in question 1 for invariant points.
FURTHER GRAPHICAL TRANSFORMATIONSD
THE RECIPROCAL FUNCTION
Example 5
y
x
x�
�
-\Qw_
2
2xy ��
21
xy
��
y
x
2
1
xy �
y 2x�
EXERCISE 5D.1
IB_HL-2edmagentacyan yellow black
0 05 5
25
25
75
75
50
50
95
95
100
100 0 05 5
25
25
75
75
50
50
95
95
100
100
Y:\HAESE\IB_HL-2ed\IB_HL-2ed_05\137IB_HL-2_05.CDR Wednesday, 24 October 2007 12:20:12 PM PETERDELL
138 GRAPHING AND TRANSFORMING FUNCTIONS (Chapter 5)
DISCUSSION THE GRAPHICAL CONNECTION BETWEENANDy = f(x), y = j f(x) j y = f (jx j)
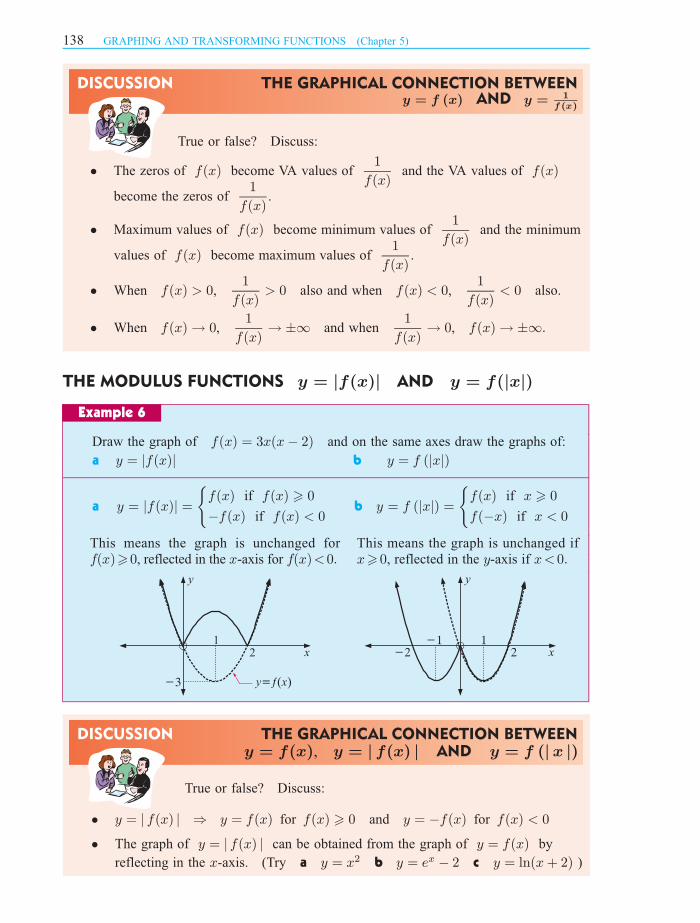
Draw the graph of f(x) = 3x(x¡ 2) and on the same axes draw the graphs of:
a y = jf(x)j b y = f (jxj)
a y = jf(x)j =
(f(x) if f(x) > 0
¡f(x) if f(x) < 0b y = f (jxj) =
(f(x) if x > 0
f(¡x) if x < 0
True or false? Discuss:
² y = j f(x) j ) y = f(x) for f(x) > 0 and y = ¡f(x) for f(x) < 0
² The graph of y = j f(x) j can be obtained from the graph of y = f(x) by
reflecting in the x-axis. (Try a y = x2 b y = ex ¡ 2 c y = ln(x + 2) )
Example 6
y
x21
�� y x� � �ƒ
y
x��
� �
This means the graph is unchanged for, reflected in the -axis forf x x f x < :( ) 0 ( ) 0� � � �>
This means the graph is unchanged if, reflected in the -axis ifx y x< :� � � �>0 0
DISCUSSION THE GRAPHICAL CONNECTION BETWEENANDy = f (x) y = 1
f (x)
True or false? Discuss:
² The zeros of f(x) become VA values of1
f(x)and the VA values of f(x)
become the zeros of1
f(x).
² Maximum values of f(x) become minimum values of1
f(x)and the minimum
values of f(x) become maximum values of1
f(x).
² When f(x) > 0,1
f(x)> 0 also and when f(x) < 0,
1
f(x)< 0 also.
² When f(x) ! 0,1
f(x)! §1 and when
1
f(x)! 0, f(x) ! §1:
y = jf(x)j y = f(jxj)THE MODULUS FUNCTIONS AND
IB_HL-2edmagentacyan yellow black
0 05 5
25
25
75
75
50
50
95
95
100
100 0 05 5
25
25
75
75
50
50
95
95
100
100
Y:\HAESE\IB_HL-2ed\IB_HL-2ed_05\138IB_HL-2_05.CDR Wednesday, 24 October 2007 12:23:35 PM PETERDELL

GRAPHING AND TRANSFORMING FUNCTIONS (Chapter 5) 139
² Points on the y-axis are invariant for f(x) ! j f(x) j² The graph of y = f (jx j) can be obtained from the graph of y = f(x) by
reflecting in the y-axis.
² y = f (jx j) ) y = f(x) for x > 0 and y = f(¡x) for x < 0:
² Points on the x-axis are invariant for f(x) ! f (jx j)
1 Draw y = x(x + 2) and on the same set of axes graph:
a y = j f(x) j b y = f (jx j)
2 Copy the following graphs for y = f(x) and on the same axes graph y =1
f(x):
a b c
3 Copy the following graphs for y = f(x) and on the same axes graph y = j f(x) j :
a b c
4 Repeat question 3, but this time graph y = f (jx j) instead of y = j f(x) j .
5 Suppose the function f(x) is transformed to j f(x) j :For the following points on f(x) find the image points on j f(x) j :
a (3, 0) b (5, ¡2) c (0, 7) d (2, 2)
6 Suppose the function f(x) is transformed to f (jx j) :a For the following points on f(x) find the image points:
i (0, 3) ii (1, 3) iii (7, ¡4)
b For the points on f (jx j) find the points on f(x) that have been transformed:
i (0, 3) ii (¡1, 3) iii (10, ¡8)
y
x
y x����( )
�
y
x
x��
y��
y x����( )
y
x
x��
y�
y x����( )y
x
�
y x����( )y
x�
y x����( )
y
x3
(1\Qw_\'-2)
y x����( )
EXERCISE 5D.2
IB_HL-2edmagentacyan yellow black
0 05 5
25
25
75
75
50
50
95
95
100
100 0 05 5
25
25
75
75
50
50
95
95
100
100
Y:\HAESE\IB_HL-2ed\IB_HL-2ed_05\139IB_HL-2_05.CDR Friday, 4 January 2008 9:12:38 AM DAVID3

REVIEW SET 5A
140 GRAPHING AND TRANSFORMING FUNCTIONS (Chapter 5)
1 If f(x) = x2 ¡ 2x, find in simplest form:
a f(3) b f(¡2) c f(2x) d f(¡x) e 3f(x) ¡ 2
2 If f(x) = 5 ¡ x¡ x2, find in simplest form:
a f(4) b f(¡1) c f(x¡ 1) d f³x
2
´e 2f(x) ¡ f(¡x)
3 Consider the function f : x 7! x2. On the same set of axes graph:
a y = f(x) b y = f(x + 2) c y = 2f(x + 2) d y = 2f(x + 2) ¡ 3
4 The graph of f(x) = 3x3 ¡ 2x2 + x + 2 is translated to its image g(x) by the
vector£
1¡2
¤. Write the equation of g(x) in the form g(x) = ax3 +bx2 +cx+d.
5 Consider f(x) = (x + 1)2 ¡ 4.
a Use your calculator to help graph the function.
b Find algebraically i the x-intercepts ii the y-intercept.
c What are the coordinates of the vertex of the function?
d Use your calculator to check your answers to b and c.
6 Consider f : x 7! 2¡x.
a Use your calculator to help graph the function.
b True or false: i as x ! 1, 2¡x ! 0 ii as x ! ¡1, 2¡x ! 0
iii the y-intercept is 12 iv 2¡x > 0 for all x?
7 Sketch the graph of f(x) = ¡x2, and on the same set of axes sketch the graph of:
a y = f(¡x) b y = ¡f(x) c y = f(2x) d y = f(x¡ 2)
8 The graph of y1 = f(x) is shown alongside.
The x-axis is a tangent to f(x) at x = aand f(x) cuts the x-axis at x = b.
On the same diagram sketch the graph of
y2 = f(x¡ c) where 0 < c < b¡ a.
Indicate the coordinates of the points
of intersection of y2 with the x-axis.
9 The graph of f(x) is drawn alongside.
a Copy the graph of f(x) and draw
the graph of j f(x) j on the same
set of axes.
b Find the y-intercept of1
f(x).
c Show on the diagram the points that
are invariant for the function1
f(x):
d Draw the graph of y =1
f(x)on the same set of axes.
y
xa b
��
�
� � �
�( )x
x
( )���, ( )����,
( )���,
IB_HL-2edmagentacyan yellow black
0 05 5
25
25
75
75
50
50
95
95
100
100 0 05 5
25
25
75
75
50
50
95
95
100
100
Y:\HAESE\IB_HL-2ed\IB_HL-2ed_05\140IB_HL-2_05.CDR Thursday, 25 October 2007 3:17:48 PM PETERDELL

REVIEW SET 5B
GRAPHING AND TRANSFORMING FUNCTIONS (Chapter 5) 141
10 a If f(x) = x+2, find the equation of the function F obtained by stretching the
function f vertically by a factor of 2 and compressing the function horizontally
by a factor of 2, followed by a translation of 12 horizontally and ¡3 vertically.
b i Check that the point (1, 3) remains invariant under the transformation de-
scribed in part a.
ii What happens to the points (0, 2) and (¡1, 1) under the transformation
given in part a?
iii Show that the points in ii lie on the graph of y = F (x):
11 The graph of f(x) = x2 is transformed
to the graph of g(x) by a reflection and
a translation as illustrated in the diagram
alongside.
Find the equation of y = g(x) in the
form ax2 + bx + c.
1 If f(x) =4
x, find in simplest form:
a f(¡4) b f(2x) c f³x
2
´d 4f(x + 2) ¡ 3
2 Consider f(x) : x 7! 3x¡ 2.
a Sketch the function f:
b Find algebraically the i x-intercept ii y-intercept iii slope.
c i Find y when x = 0:3 ii Find x when y = 0:7
3 For what values of x, where a is a positive real number, is jx¡ a j = jx j ¡ a ?
4 Let f(x) =c
x + c, x 6= ¡c, c > 0.
a On a set of axes like those shown, sketch the graph
of f(x). Label clearly any points of intersection
with the axes and any asymptotes.
b On the same set of axes, sketch the graph of1
f(x).
Label clearly any points of intersection with the
axes.
5 For the graph of y = f(x), sketch graphs of:
a y = f(¡x) b y = ¡f(x)
c y = f(x + 2) d y = f(x) + 2
y
x
y x��( )
y g x� ( )
V ,( )����
y
x�c c
3
31
�������
������y
x
�����
y x����( )
IB_HL-2edmagentacyan yellow black
0 05 5
25
25
75
75
50
50
95
95
100
100 0 05 5
25
25
75
75
50
50
95
95
100
100
Y:\HAESE\IB_HL-2ed\IB_HL-2ed_05\141IB_HL-2_05.CDR Thursday, 25 October 2007 3:26:33 PM PETERDELL

142 GRAPHING AND TRANSFORMING FUNCTIONS (Chapter 5)
6 The graph of y = f(x) is given.
On the same set of axes graph each pair
of functions:
a y = f(x) and y = f(x¡ 2) + 1
b y = f(x) and y =1
f(x)
c y = f(x) and y = j f(x) j
7 a Find the equation of the function y = f(x) that results from transforming the
function x 7! 1
xby: a reflection in the y-axis, then a vertical stretch of
factor 3, then a horizontal compression of factor 2, then a translation of£11
¤:
b Sketch y = f(x) and state its domain and range.
c Does y = f(x) have an inverse function? Explain.
d Is the function f a self-inverse function? Give graphical and algebraic evidence.
8 Discuss and sketch the graph of y =2x¡ 3
3x + 5.
Your discussion should include: the asymptote equations, axes intercepts, and what
happens near the asymptotes.
9 The graph alongside is that of a rational relation.
Find its equation in the form y =ax + b
cx + d:
10 For each of the following functions:
i find y = f(x), the result of a translationh
1¡2
i:
ii Sketch the original function and its translated function on the same set of
axes.
iii Clearly state any asymptotes of each function.
iv State the domain and range of each function.
a y = 2x b y = log4 x
11 a Sketch the graph of f(x) = ¡2x + 3, clearly showing the axis intercepts.
b Find the invariant points for the graph of y =1
f(x):
c State the equation of the vertical asymptote and find the y-intercept of the graph
of y =1
f(x).
d Sketch the graph of y =1
f(x)on the same axes as in part a, showing clearly
the information found in parts b and c.
e On a new pair of axes, sketch the graphs of y = j f(x) j and y = f (jx j)showing clearly all important features.
( )��
x����
y
x
y x����( )
y
x
y 2���
x 3�
IB_HL-2edmagentacyan yellow black
0 05 5
25
25
75
75
50
50
95
95
100
100 0 05 5
25
25
75
75
50
50
95
95
100
100
Y:\HAESE\IB_HL-2ed\IB_HL-2ed_05\142IB_HL-2_05.CDR Wednesday, 24 October 2007 12:33:25 PM PETERDELL


