University of Northern ColoradoScholarship & Creative Works @ Digital UNC
Dissertations Student Research
12-2017
Grit as a Predictor of Academic Success for First-Time Undergraduate StudentsSean M. Broghammer
Follow this and additional works at: https://digscholarship.unco.edu/dissertations
This Text is brought to you for free and open access by the Student Research at Scholarship & Creative Works @ Digital UNC. It has been accepted forinclusion in Dissertations by an authorized administrator of Scholarship & Creative Works @ Digital UNC. For more information, please [email protected].
Recommended CitationBroghammer, Sean M., "Grit as a Predictor of Academic Success for First-Time Undergraduate Students" (2017). Dissertations. 463.https://digscholarship.unco.edu/dissertations/463

© 2017
SEAN M. BROGHAMMER
ALL RIGHTS RESERVED

UNIVERSITY OF NORTHERN COLORADO
Greeley, Colorado
The Graduate School
GRIT AS A PREDICTOR OF ACADEMIC SUCCESS FOR
FIRST-TIME UNDERGRADUATE STUDENTS
A Dissertation Submitted in Partial Fulfillment
of the Requirements of the Degree of
Doctor of Philosophy
Sean M. Broghammer
College of Education and Behavioral Sciences
Department of Leadership, Policy, and Development:
Higher Education and P-12 Education
Higher Education and Student Affairs Leadership
December 2017

This Dissertation by: Sean M. Broghammer
Entitled: Grit as a Predictor of Academic Success for First-Time Undergraduate Students
has been approved as meeting the requirement for the Degree of Doctor of Philosophy in
College of Education and Behavioral Sciences in the Department of Leadership, Policy
and Development: Higher Education and P-12 Education, Program of Higher Education
and Student Affairs Leadership.
Accepted by the Doctoral Committee
____________________________________________________
Matthew Birnbaum, Ph.D., Research Advisor
____________________________________________________
Susan R. Hutchinson, Ph.D., Committee Member
____________________________________________________
Tamara Yakaboski, Ph.D., Committee Member
____________________________________________________
Thomas Lee Morgan, Ph. D., Faculty Representative
Date of Dissertation Defense .
Accepted by the Graduate School
____________________________________________________________
Linda L. Black, Ed.D.
Associate Provost and Dean
Graduate School and International Admissions
iii
ABSTRACT
Broghammer, Sean M. Grit as a Predictor of Academic Success for First-Time
Undergraduate students. Published Doctor of Philosophy dissertation, University
of Northern Colorado, 2017.
A majority of institutions of higher education in the U.S. rely primarily on
traditional academic factors of high-school grade point average (HSGPA) and
standardized test scores to admit students to undergraduate studies. Recent research has
supported the use of noncognitive variables in conjunction with traditional factors in
predicting college student success. This study sought to investigate further if the
noncognitive variable of grit could predict first-year college grade point average
(FYGPA), first semester persistence, and first year retention beyond existing pre-
collegiate indicators. Previous studies involving grit on college students were completed
at highly selective institutions or highly competitive environments such as military
academies. Through a longitudinal study design, this study investigated grit on a sample
of 544 first-year students at a regional research university in an effort to add to the
literature of grit on a more traditional sample of college students. The grit score was
collected utilizing the Grit-S short scale while demographics of ethnicity, PELL
eligibility, first-generation status, and gender were collected through institutional
research along with HSGPA and standardized test score. Tests of hierarchical multiple
regression and binary logistic regression were employed to investigate the amount of
variance explained in FYGPA and ability to predict persistence to second semester and
retention to second year. This study found with statistical significance that grit did

iv
explain additional variance in FYGPA beyond traditional pre-collegiate indicators while
controlling for demographic variables. Grit was also able to explain an equal amount of
variance in FYGPA as standardized test score while controlling for demographics and
HSGPA. This study did not find grit to be a predictor of persistence or retention. This
research showed that grit may be a positive predictor of FYGPA and may increase the
probability of predicting college success for students. These findings provide support in
questioning the continued use of standardized test scores specifically by less selective
institutions. Results of this study can assist enrollment managers and institutions of
higher education to inform current admission practices and improve access to post-
secondary education through noncognitive variables.

v
ACKNOWLEDGEMENTS
I wholeheartedly believe that I would not have completed this dissertation without
the support of my committee, colleagues, and my family.
I have spent nearly the past decade working toward this achievement. Since I
began pursuing this degree, many life moments have come and gone. I have watched my
daughter grow into an amazing young woman. I have witnessed a two-year old boy grow
into a middle-school student and my third child turned eight in August. How much I have
missed and how much I have gained. There are many people to thank and show
appreciation for their continued support throughout this journey.
To begin, I want to express my gratitude and appreciation of Dr. Matt Birnbaum
serving as my research advisor. Dr Birnbaum continuously challenged me to “lean in”
while maintaining high expectations and I am a better scholar and practitioner because of
his dedication. Thank you, Matt.
I especially thank Dr. Susan Hutchinson. You are an outstanding faculty member
with a commitment to furthering student’s educational ambitions and goals. Your support
these past eighteen months is immeasurable and I am convinced that you are a primary
reason for me achieving this moment. Thank you, Susan.
To the remainder of my committee, Dr. Yakaboski and Dr. Morgan, thank you for
your time and support as I navigated each step. In addition, thank you to Dr. Roehrs for
serving as my faculty representative the first year of dissertation phase. I hope retirement
is treating you well!

vi
To the numerous colleagues both present and in the past; thank you! Special
appreciation to the office of admissions at UNC for being understanding and supportive
along the way. In addition, a special appreciation to Dana and Ceri for your unwavering
support. It was encouraging to have two amazing people to count on. I owe you both.
To my EMSA colleagues (Jennifer, Tammie, Sherri, Jaqueline, Jenna, Larissa,
and Tobias), thank you. I especially want to thank Dr. Tobias Guzmán for your
mentorship and guidance. I have appreciated your encouragement and for creating a
space for me to be challenged and grow as a colleague and professional.
To Dr. Raymond, Dr. Cobb, and Dr. Finley. Each of you has been an inspiration
for me. I was able to learn from you and I appreciate your words of wisdom along the
way.
I would be lost without the support and love from my family. From my wife
Becky and kids Julia, Davis, and Cullen, to my mom Jane, and my in-laws Jim and
Marta. These past ten years were possible due to your flexibility, patience, and love. I am
proud of what we have accomplished together.
Cullen, I will never forget your words of encouragement. Your thoughtful
questions and inquisitive nature is wonderful. I am excited to spend more time with you
and we finally have our weekends back!
Davis, your understanding these past few years has been such a relief. It is
amazing to think that I started this process when you were just two years old. You have
always known me as a graduate student working on school. I look forward to watching
you grow and continue to develop into a confident and caring young man. You have
much to offer.

vii
Julia, where do I begin? I am so proud of the young woman you have become.
This year is a monumental year for you and I cannot wait to hear about your new
adventures and the challenges you meet. Nothing has ever slowed you down. I am
inspired by your confidence to try anything and succeed, undeterred by the unknown.
Keep your eye on the prize and good things are bound to happen.
Finally, to my wife Becky. You have always and I mean always been there for
me. When I doubted myself, questioned the value and purpose of this moment, you
pushed me. You stood by my side and provided the extra support and motivation to keep
going. You would not let me give up. You would not let me settle. I am thankful and
fortunate to have someone in my life that cares as deeply as you do. Thank you for your
support, your compassion, and your love. Best of wives and best of Women.

viii
TABLE OF CONTENTS
CHAPTER
I. INTRODUCTION .......................................................................................1
Traditional Measures and Noncognitive Variables......................................2
Common Admission Practices .........................................................3
Problem with Common Admission Practices ..................................4
Retention and Graduation Rates ......................................................5
Access to Higher Education .........................................................................6
Diversifying Campus Community ...................................................9
Purpose of the Study ....................................................................................9
Research Questions ....................................................................................10
Design Overview .......................................................................................11
Significance of the Study ...........................................................................11
Limitations of this Study ............................................................................12
Race/Ethnicity Categories ..........................................................................13
Definition of Terms....................................................................................13
Summary ....................................................................................................14
II. REVIEW OF LITERATURE ....................................................................16
Pre-Collegiate Academic Predictors of Success in College ......................17
High School Grade Point Average (HSGPA) ................................18
Inequities in high school grade point average....................21
Grade inflation ...................................................................21
Standardized Test Scores (SAT/ACT) ...........................................22
Effectiveness of standardized test scores ...........................23
Differences across ethnicity ...............................................25
Optional standardized test scores .......................................28
ix
CHAPTER
II. continued
College Preparatory Core and High School Rigor .........................28
Unknown Variance in Retention ....................................................31
Retention and Persistence Research...............................................32
Existing Persistence and Retention Theories .............................................33
Noncognitive Predictors of College Success .............................................36
Importance of Inclusion of Noncognitive ......................................37
Predictive Ability ...........................................................................38
College Readiness ..........................................................................39
Holistic Review ..............................................................................41
Grit….. .......................................................................................................42
Development and Validation of the Grit-O Scale ..........................42
Development and Validation of the Grit-S Scale ..........................44
Controversy Surrounding Grit .......................................................45
Differentiating Grit from Other Research ......................................46
Grit Research on College Students ................................................46
Grit and Persistence in Life Situations...........................................49
Theoretical Framework for the Study ........................................................50
Deliberate Practice .........................................................................51
Resilience .......................................................................................52
Self-Control....................................................................................53
Flow/Engagement ..........................................................................54
Section Summary ...........................................................................55
Background Characteristics’ Impact on College Success ..........................55
Gender. ...........................................................................................55
Race/Ethnicity ................................................................................56
Socio-Economic Status ..................................................................57
First-Generation Status ..................................................................58
Section Summary ...........................................................................58
Summary ....................................................................................................59

x
CHAPTER
III. METHODOLOGY ....................................................................................61
Purpose of the Study and Research Questions ...........................................61
Research Hypotheses .................................................................................61
Research Design and Procedures ...............................................................62
Study Site .......................................................................................63
Participants .....................................................................................64
Gender ................................................................................68
Ethnicity .............................................................................68
Pell eligibility .....................................................................68
First-Generation status .......................................................69
Procedures ......................................................................................69
MapWorks® First-Year Transition Survey ...................................70
Qualtrics Survey Administration ...................................................71
Collection Periods ..........................................................................72
Instrumentation ..........................................................................................73
Dependent Variables ......................................................................74
Demographics ................................................................................74
Pre-Collegiate Academic Factors ..................................................75
College Academic Success Factors ...............................................76
Grit….. ...........................................................................................76
Data Analysis .............................................................................................78
Confirmatory Factor Analysis ........................................................79
Regression Diagnostics ..................................................................81
Binary Logistic Regression Diagnostics ........................................82
Analyses of Research Questions ....................................................83
Research question 1 ...........................................................83
Research questions 2 and 3 ................................................84
Summary ....................................................................................................85
IV. RESULTS ..................................................................................................86
Preliminary Analysis ..................................................................................95
Confirmatory Factor Analysis ........................................................95
Internal Consistency Reliability .....................................................96

xi
CHAPTER
IV. continued
Results for Research Questions .................................................................97
Diagnostics for Regression ............................................................97
Research Question One ................................................................100
Supplementary Analysis ..............................................................104
Research Question Two ...............................................................107
Research Question Three .............................................................110
Summary ..................................................................................................113
V. DISCUSSION ..........................................................................................114
Summary of Results .................................................................................114
Research Question 1 ....................................................................115
Research Question 2 ....................................................................115
Research Question 3 ....................................................................116
Supplementary Analysis ..............................................................117
Section Summary .........................................................................117
Implications for Theory ...........................................................................118
Retention and Persistence Theories .............................................118
Grit Research within Existing Theories .......................................119
Implications for Practice ..........................................................................120
Current Practice ...........................................................................121
Usefulness of Test Scores for Less Selective Institutions ...........122
Grit Outcomes ..............................................................................124
Limitations ...............................................................................................124
Grit Measurement ........................................................................125
Survey Administration .................................................................126
Non-Response Bias ......................................................................126
Convenience Sample ....................................................................127
Future Research .......................................................................................127
Collection of Grit-S Scores ..........................................................128
Community Privilege Influencing Outcomes ..............................128
Interchangeability of Standardized Test Score and Grit ..............129

xii
CHAPTER
V. continued
Qualitative Exploration of Grit ....................................................130
Additional Populations to Consider Exploring ............................131
Conclusion ...............................................................................................132
REFERENCES ................................................................................................................135
APPENDICES
A. Grit-S Short Scale ....................................................................................157
B. Institutional Review Board Approval ......................................................161
xiii
LIST OF TABLES
Table
1. Percentage of Colleges Attributing Different Levels of Importance
to Factors in Admission Decisions: First-Time Freshmen ........................19
2. Demographics of Sample by Gender, Ethnicity, Pell Status, and
First-Generation Status ..............................................................................66
3. Demographics of Sample Responders by Enrollment Status ....................67
4. Test Score Submission by Provider for Entire Cohort...............................87
5. Pre-Collegiate Academic Indicators by Grit Response .............................88
6. Pre-Collegiate Academic indicators and Grit-S Score by Enrolled
Status ..........................................................................................................89
7. First-Semester GPA and Grit-S Scores by Demographics ........................90
8. First-Year GPA and Grit-S Scores by Demographics ...............................93
9. Internal Consistency Reliability for the Grit-S Scale, Factor 1:
Consistency of Interest and Factor 2: Perseverance of Effort ....................96
10. Collinearity Information for Diagnostics ...................................................98
11. Results from Hierarchical Multiple Regression Model 1
(Demographics)........................................................................................101
12. Results from Hierarchical Multiple Regression Model 2
(Demographics and Pre-Collegiate) .........................................................102
13. Results from Hierarchical Multiple Regression Model 3
(Demographics, Pre-Collegiate Characteristics, and Grit-S Mean
Score) .......................................................................................................103
14. Hierarchical Regression Model Summary ...............................................104
15. Hierarchical Regression Model Summary (Grit Only) ............................105

xiv
Table
16. Hierarchical Regression Model Summary (Supplementary Analysis) ....106
17. Pearson Correlation Coefficients .............................................................108
18. Logistic Regression Analyses Summary Table for Demographic
Variables (Step 1) ....................................................................................109
19. Logistic Regression Analyses Summary Table for Variables
Associated with Student Persistence (Step 2) ..........................................109
20. Logistic Regression Analyses Summary Table (Full Model) ..................110
21. Logistic Regression Analyses Summary Table for Demographic
Variables (Step 1) ....................................................................................111
22. Logistic Regression Analyses Summary Table for Variables
Associated with Student Persistence (Step 2) ..........................................112
23. Logistic Regression Analyses Summary Table (Full Model) ..................113

xv
LIST OF FIGURES
Figure
1. Swail’s Geometric Model of Student Persistence and Achievement .........35
2. The Construct of Grit Displayed from Multiple Facets of Four
Related but Differing Theories ..................................................................51
3. Cook’s D Measure of Influence .................................................................99

1
CHAPTER I
INTRODUCTION
In education, the one thing we know how to measure best is IQ. But what if doing
well in school and in life depends on much more than your ability to learn quickly
and easily.
--Duckworth, 2013, 1:30
Pat and Terry, two friends from the same neighborhood, enter college for the first
time and possess seemingly similar personal and academic backgrounds. They each come
from two parent households, they are the same gender, and both attended the same high
school and had similar grades, course rigor, and scored the same on standardized testing.
They enroll in the same regional college, declare the same major, take the same number
of credits their first semester, and experience a similar level of integration and
involvement in clubs and organizations. There were no observable differences of note in
their personal lives from time of entry to the end of their first year. Based on their
individual entering characteristics, enrollment officials at the regional college would
expect the two students to perform similarly in college. However, during the first year,
Pat was placed on academic probation and makes the decision to not return for following
year. Terry is performing exceptionally well and continues to make progress toward
degree. Enrollment officials are left wondering why Terry performed better than Pat?
Were there additional considerations, perhaps noncognitive, the institution could have
identified to predict these different outcomes? Institutions face the dilemma posed by
Terry and Pat’s two outcomes and this type of dilemma is the basis for this study.

2
Traditional Measures and Noncognitive
Variables
A majority of institutions of higher education in the U.S. rely primarily on
traditional academic factors to admit students to undergraduate studies. Traditional
factors generally consist of high-school grade point average (HSGPA) and standardized
testing (i.e., ACT [formerly American College Test] and SAT [formerly Scholastic
Aptitude Test]). While the traditional measures of HSGPA and ACT/SAT scores have
been shown to have predictive value for academic success in college as measured by
grade point average (Hezlett et al., 2001), research has shown that when traditional
measures are combined with other factors the predictive value can be more accurate
(Sternberg, Bonney, Gabora, & Merrifield, 2012).
Recent literature has demonstrated the importance of noncognitive skills on
assessing student outcomes such as persistence, retention, and graduation (Duckworth,
Tsukayama, & May, 2010; C. Peterson & Seligman, 2004; Schmitt et al., 2009).
Noncognitive variables are associated with individuals’ success and include constructs
such as optimism, motivation, resilience, adaptability, conscientiousness, interest in
school, and encouragement from parents (Egalite, Mills, & Greene, 2014; Ransdell,
2001). Credé and Kuncel (2008) completed a meta-analysis to examine the predictive
validity of 10 study skill constructs and found that study habits and skills improve
prediction of academic performance more than any other noncognitive individual
difference variable and are approximately as strongly correlated to academic performance
as the two most frequently used predictors of academic performance: HSGPA and
standardized tests. Although the findings of Credé and Kuncel suggested that
consideration of using study habits, skills, and attitudes in admissions is promising, there

3
has not been enough research into the validity of individual inventories to be consistent
across multiple college academic success measures of grades, persistence, and
graduation.
In this study, I focused on grit, which is a newer noncognitive construct that
Duckworth, Peterson, Matthews, and Kelly (2007) defined as a “passion and
perseverance for especially long-term goals” (p.1087). I intended to determine if grit
further explains college student academic success beyond traditional factors and
contribute findings to the emerging literature on noncognitive research. For the purposes
of this study, college student academic success is defined as first-year college grade point
average (FYGPA), first semester persistence (FSP), and first-year retention (FYR) to the
college. Additionally, the term college is utilized to refer to four-year colleges and
universities interchangeably. A definition of terms is provided toward the end of this
chapter.
Common Admission Practices
Institutions vary widely in what each requires as part of an admission packet. In
addition to traditional requirements of HSGPA and standardized test scores, application
materials may include items such as personal statements, topic essays, letters of
recommendation, and individual interviews. Admission offices use an array of measures
to rate each applicant and identify personal qualities which are often referred to as a
holistic review (Rigol, 2003). A holistic review is meant to consider measures of the
cognitive traits of academic achievement or academic aptitude such as standardized test
score or HSGPA but also to include behavioral and noncognitive factors. But for many

4
campuses holistic review is not achievable given resource limitations, staffing levels, and
potential to delay admission decisions and notification to students.
It is most common for institutions to rely on traditional forms of evaluation such
as HSGPA and SAT/ACT (Komarraju, Ramsey, & Rinella, 2013) as a way to sift through
the hundreds, if not thousands, of applications received on an annual basis. This practice
began as college enrollments grew steadily in the mid-20th century following significant
public investment in higher education. Fueled by the G.I. Bill of Rights, colleges began to
rely on standardized tests to screen potential applicants (Lemann, 1999). The utilization
of standardized test scores gained attention as critics of standardized testing argued that
noncognitive skills such as motivation, imagination, and overcoming challenges are not
measured by standardized tests and that the tests are biased against students of color and
students from low socioeconomic backgrounds (Helms, 2009; Sedlacek, 2004).
Problem with Common Admission
Practices
Admission into a college is a privilege for many students who desire to further
formal education with the hopes of creating a rewarding future. For many
underrepresented populations, admission-based policies focused on HSGPA and
standardized test scores can derail hopes for furthering their education and reaching
monumental goals. First generation college students often come from lower socio-
economic status backgrounds and include a higher percentage of students of color (Bui,
2002; Hertel, 2010; Terenzini, Springer, Yaeger, Pascarella, & Nora, 1996). A 2016
report by College Board indicates a substantial gap in test scores between Black or
African American, Hispanic or Latino, and American Indian or Alaska Native students
when compared to White students (College Board, 2016). When a college places
5
emphasis on traditional measures for admission decisions, a large pool of diverse
candidates with potential may be excluded from consideration.
Academic performance or grades in college have been found to be the single best
indicator of students being retained to graduation (Pascarella & Terenzini, 2005) which
makes it important for colleges to identify pre-collegiate academic indicators or student
background characteristics that may predict future academic success in college. Examples
of prior research into noncognitive measures include the exploration of motivation, self-
efficacy, study habits, self-control, leadership, creative thinking, personality, and
attitudes (Sommerfeld, 2011). While current admission practices focus attention on
traditional factors for predicting academic success in college, there remains inconsistent
evidence regarding the relationship of those factors on post-secondary success (Stewart,
2015). A significant portion of unexplained variance remains and further investigation of
additional traits of academic success is necessary.
Retention and Graduation Rates
Admission practices can have an impact on future outcomes of students
specifically in the areas of retention and graduation. While enrollment in higher education
has increased, retention rates for first-year students to their second year of college have
remained nearly unchanged in the last decade at nearly 72% (National Student
Clearinghouse Research Center, 2016). Nationally, across all four-year institutions, the
six-year graduation rate of undergraduate students was near 60% in 2014 (National
Center for Education Statistics, Integrated Postsecondary Education Data, 2016)
compared to 58% of first time students who graduated in six years in 2000 (Farrington et
al., 2012; Komarraju et al., 2013). This increase is promising as institutions of higher

6
education focus additional resources on retention efforts but remains below acceptable
rates of completion.
Since 1990, there has been substantial growth in the numbers of first-generation
and students of color attending postsecondary schooling; however, college graduation
rates by race and income have remained flat or in some cases widened between
underrepresented populations and their White/middle income peers (Bowen, Chingos, &
McPherson, 2009). For all four-year institutions, nearly 57.4% of White students
graduate within six years while Hispanic or Latino and Black or African American
students’ six-year graduation rate is 45.0% and 34.2%, respectively (National Center
for Education Statistics, Integrated Postsecondary Education Data, 2014). As access
improves, it is evident that there remains a significant gap in completion rates by race.
Even ignoring the completion rate disparity, the overall rates remain well below
acceptable levels. Current admission criteria are not doing an adequate job of predicting
academic success across racial identities and additional factors should be explored
further.
Access to Higher Education
Funding for higher education has shifted over the last 20 years with students and
families increasingly burdened to cover a higher portion of tuition attendance costs
(Schuh, 2005). Specifically, public colleges are more tuition dependent than ever with a
reduction in percentage of funding derived from government and a higher portion
covered by students and families. Nationally, colleges have benefitted from a decade of
growth where enrollments at four-year, public, degree-granting postsecondary
institutions increased 22% between 2004 and 2014 (National Center for Education
7
Statistics, Integrated Postsecondary Education Data, 2016). Growth over the last decade
has been positive, but from 2014 to 2023, the anticipated annual number of high school
graduates shows little to no growth while fluctuating from 2.9 to 3.1 million annually
(Prescott & Bransberger, 2012). With the annual number of high school graduates
reaching a plateau, the competition for meeting enrollment goals becomes increasingly
challenging. As institutions seek to increase headcounts of entering classes the
identification of potential factors that influence retention is critical for long-term
sustainability. Current admission practices should be evaluated to expand the
identification of talented students who may not exhibit traditional indicators of college
success.
Attainment of a college degree provides an educated workforce, which benefits
individuals and society as a whole. Employers are interested in recruiting talented and
skilled employees to meet growing demands in the job market. Three-quarters of the
fastest growing occupational sectors in the US require more than a high school diploma;
yet barely over half of the US population has the educational qualifications to qualify for
these careers (Farrington et al., 2012). Many educational research and philanthropic
organizations such as the Lumina Foundation have demonstrated that the U.S. will need
to find successful paths to higher education for hundreds of thousands of additional first-
generation, minority, immigrant, and rural students in order to grow the economy (Hiss &
Franks, 2014). As a greater number of students complete college and personally benefit
from acquiring new skills there are also societal gains from an educated workforce.
One segment of the population that greatly benefits from earning a college degree
is low-income students who have the highest likelihood of improving their economic

8
status beyond what is currently attainable without formal education (Engle & Tinto,
2008). The benefit of higher education is significant given the earning potential
difference between a high school graduate and a college graduate. The Bureau of Labor
Statistics (2015) reported weekly earnings for a person with a bachelor’s degree was 67%
higher than a person who had obtained a high school diploma.
There are a number of individual benefits from earning a college degree. College
graduates have increased income potential (Schmitt & Boushey, 2012) and experience
lower unemployment rates and poverty (Baum, Ma, & Payea, 2013). Society benefits
with an increased college educated population by increasing workplace productivity,
increased tax revenues, and decreased dependency on social programs (Institute for
Higher Education Policy, 1998). With the growing needs and demands of an educated
workforce, access to higher education and completion of an undergraduate degree must
improve to meet individual and societal needs. Institutions that consider additional
admission factors, including grit, can potentially enroll a greater number of students with
a propensity to persist and graduate which ultimately leads to institutional, individual,
and societal advantages.
Horn and Berger (2004) reported college attrition (percent of students who leave
an institution) in most cases prevents social mobility and economic success, which for
underrepresented and traditionally marginalized populations further exacerbates the
divide in socio-economic status within the U.S. It is critical for institutions to reevaluate
how students are admitted and identify new factors that predict academic success while
placing greater emphasis on better understanding the predictive factors of persistence and
the ability to identify those traits during the admission process.

9
Diversifying Campus Community
A recent report highlights changing demographics facing institutions of higher
education. Selingo (2016) shared that the most likely scenario facing higher education
enrollment, is “. . . a student body that is much less affluent and less prepared
academically for college than the one that propelled the expansion of higher education
during the past two decades” (p.2).
Colleges that rely heavily on traditional factors for admission purposes create
daunting obstacles for marginalized populations especially admission to selective
colleges (Deil-Amen & Tevis, 2010). Students of color have been shown to score lower
on standardized tests; account for a larger proportion of first generation students; and
often come from lower socio-economic status households (Kaufman, 2010; Nasim,
Roberts, Harrell, & Young, 2005). For colleges that value diversity and improving access
to higher education, exploring additional factors beyond traditional measures is critical.
One way to consider diversifying an incoming class would be to think differently about
entry characteristics and the expectations placed on HSGPA and standardized test scores.
Purpose of the Study
There is an abundance of literature that suggests HSGPA and standardized test
scores are strong predictors of academic success in college (Moffat, 1993; Wolfe &
Johnson, 1995; Zheng, Saunders, Shelley, & Whalen, 2002). Recent studies have
suggested that success in college may also be related to predictors beyond cognitive
measures of HSGPA and SAT/ACT (Duckworth et al., 2007; Duckworth, Quinn, &
Tsukayama, 2012; Hiss & Franks, 2014; Nasim et al, 2005). However, one unanswered
10
question is; does the use of noncognitive variables in admissions enhance what we know
about applicants to better identify and support students from access to completion?
The purpose of this study was to examine the construct of grit on a first-year
student’s success during the first year of college to predict if an increase in probability of
academic success beyond HSGPA and standardized test scores exists. In this research I
compared the predictive value of grit to HSGPA and SAT/ACT to determine if grit
explains additional variance in academic success in college above HSGPA and
standardized measures. The variable of discovery for this study was the grit score, as
measured by the Short Grit Scale (Grit-S) survey found in Appendix A (Duckworth &
Quinn, 2009) after controlling for students’ background characteristics and pre-collegiate
academic factors. This study included an analysis on the following student demographics:
socio-economic status, gender, ethnicity, and first generation status. Additionally, the
construct of grit was explored to identify the relationship between background
characteristics, pre-collegiate academic factors, and college academic performance,
defined by first-year grade point average, first-year persistence, and first-year retention.
Better understanding the role grit has in academic success is increasingly important if
U.S. Institutions of Higher Education are to increase retention and graduation rates.
Research Questions
The following research question(s) were examined in this study:
Q1 To what extent does grit predict 1st-year college GPA when controlling
for background characteristics and pre-collegiate academic factors?
Q2 To what extent does grit explain retention to second semester when
controlling for background characteristics and pre-collegiate academic
factors?
11
Q3 To what extent does grit predict retention to second year when controlling
for background characteristics and pre-collegiate academic factors?
Design Overview
This research is a cross-sectional non-experimental design utilizing a survey to
collect a grit score and institutional data to collect demographic variables and pre-
collegiate academic measures of HSGPA and standardized test scores. Survey research
affords investigators the opportunity to administer a survey to a sample or to an entire
population of people to describe attitudes, opinions, behaviors, or characteristics of the
population (Creswell, 2008). For the purposes of this study, I collected data utilizing the
Short Grit Scale (Grit-S) developed by Duckworth and Quinn (2009) nested within the
MapWorks® First Year Transition Survey, which is distributed twice annually at the
study site. The Grit-S scale is an 8-item Likert-type survey. Along with Grit-S scores,
demographic information for the entire cohort of 2,052 students was collected through
the institution’s institutional research area as requested through the institution’s
Institutional Review Board (IRB). To answer the research questions I completed a
hierarchical regression technique to determine the increase in observed variance of grit on
student grades, first-semester persistence, and first-year retention, while controlling for
differences in demographics and pre-collegiate academic factors.
Significance of the Study
There exists a primary assumption that HSGPA and standardized test scores are
the best predictors of future success. Habley, Bloom, and Robbins (2012) posited that
grade inflation has led colleges and admissions professionals to believe a more
academically prepared student class has applied and enrolled whereas in reality
preparation remains level while grade inflation can account for the reported increase in

12
HSGPA. In this study, I aimed to provide additional evidence of support for noncognitive
variables to be considered more prominently in admission practices.
A major gap in the literature is the application of grit as an element of admission
decisions among traditional college populations. Existing studies were completed at elite
private campuses, military colleges, spelling bee competitions, and with adults. Through
this study, I researched the explanatory and predictive value of grit on college grades,
first-year persistence, and first-year retention at a residential campus of traditional
students with more generalizable findings than what has previously been studied.
The study findings will contribute to the emerging literature on the noncognitive
factor of grit by comparing the explanatory and predictive value of grit to HSGPA and
standardized test scores, both of which are commonly used by colleges to admit students.
Although not a part of this study, existing research does suggest that grit is malleable in
the childhood period (Alan, Boneva, & Ertac, 2016) and can be taught and nurtured
which could lead student service areas to proactively support students once on-campus
with new methods (Duckworth et al., 2007). Findings from this study contribute to the
existing literature within higher education in the areas of admission requirements,
persistence, retention, and potentially address systemic biases.
Limitations of this Study
This study had a number of limitations, which may reduce the generalizability of
the results. Limitations include the timing of the survey administration, the potential for
non-response bias, and the use of a convenience sample. Each of these limitations has the
potential to limit the generalizability of findings. Each limitation is further explained in
Chapter V.
13
Delimitations of this Study
Data for this study utilized a convenience sample on undergraduate students
enrolled at one regional research university who entered college as a first-time/full-time
student in the fall of 2016. The use of convenience sampling meant that there is a
possibility of populations being under or over represented in the data. My findings are
only generalizable to similar populations.
Race/Ethnicity Categories
This study will commonly refer to race/ethnicity using the singular label of
ethnicity. Ethnicities of the study population and sample will be reported using the host
institutions application data and nationally recognized census categories for consistency.
Ethnicities included in this sample are: American Indian or Alaska Native, Asian, Black
or African American, Hispanic or Latino, Native Hawaiian or Other Pacific Islander,
White, or multiracial. Prior research referenced in this dissertation, which refers to
student identities and assignment/reporting of ethnicity or race, will be preserved to
honor the previous research. The term students of color will be used when referencing
American Indian or Alaska Native, Asian, Black or African American, Hispanic or
Latino, Native Hawaiian or Other Pacific Islander, or multiracial, collectively. For data
anlysis purposes, analyses were often completed and summarized as students of color.
Definition of Terms
The following are terms that are used frequently throughout this document.
American College Testing (ACT) - national standardized test administered by ACT.
First semester persistence (FSP) - refers to students’ persistence from first semester to
second semester of first year in college.

14
First-year grade point average (FYGPA) - refers to students’ cumulative grade point
average at the end of their first year in college.
First-year retention (FYR) - refers to students’ retention from first fall semester to second
fall semester indicating the student returned for a second year.
High school grade point average (HSGPA) - explains the recorded high school grade
point average student’s collected officially from the high school transcript and is
recorded on a 0.0 to 4.0 scale.
Mountain States University (MSU) - pseudonym for the study location.
NonCognitive Variables (NCV) - used to describe variables that are known as character
traits and psycho-social factors such as motivation, commitment, persistence,
dealing with adversity, overcoming loss, etc.
Scholastic Aptitude Test (SAT) - national standardized test administered by College
Board.
Standard Test Score – Used in data analysis to label test scores from all sources which
have been concordant to an ACT composite scale for analyses procedures.
Standardized test scores - interchangeably used in reference to the American College
Testing (ACT) and the Scholastic Aptitude Test (SAT) to indicate pre-college
standardized testing.
Summary
Chapter I provided an overview of the study and included an introduction to the
problem of persistence, retention, and graduation related to admission standards limited
scope of focus primarily on pre-collegiate academic factors of HSGPA and standardized
test scores. Further explanation was provided to describe the purpose of the study,
15
research questions, significance of the study, limitations, delimitations, and scope of the
study as they applied to academic performance outcomes of undergraduate students.
Chapter II provides an in-depth literature review of pre-collegiate academic
factors, persistence and retention theory, introduction to noncognitive research, grit
literature, theoretical framework, and background characteristics impact on college
success. Chapter III includes research hypotheses, research design and procedures,
instrumentation, and data analysis. Chapter IV reports all results from preliminary
analysis and analysis for the research questions. Chapter V concludes with discussion,
implications for practice, limitations, and implications for future research.

16
CHAPTER II
REVIEW OF LITERATURE
This chapter begins with a review of the most common pre-collegiate factors
evaluated as part of an admission decision: high-school grade point average (HSGPA),
standardized test scores (SAT/ACT), and rigor of high-school curriculum. It is important
to have a broad understanding of the primary evaluative criteria, predictability of each
factor as it pertains to college success, and the rationale that each are relied upon today in
college admissions.
This chapter is organized to provide content on pre-collegiate factors, theories on
retention and persistence, and existing research on the use of noncognitive variables to
predict student outcomes to provide a foundation for exploration of grit. A review of grit
and the development of the grit scale, prior research involving grit, and a review of the
populations of study and relevant findings is provided. Finally, a brief review of
background demographics of interest for this study related to grit is presented which
include gender, ethnicity, socio-economic status, and parental education. The four
demographics selected as part of this study are researched extensively on college
campuses, commonly found in noncognitive research, and are generally reported on an
admissions application or to the institution in another form, i.e. Free Application for
Federal Student Aid (FAFSA).
17
Pre-Collegiate Academic Predictors of Success
in College
Traditionally, many colleges have primarily used HSGPA and standardized test
scores to evaluate a student’s application for admission (Harackiewicz, Barron, Tauer, &
Elliot, 2002). The use of standardized test scores dates back to the early 1900’s.
Following the lead of the U.S Army, standardized test scores (IQ tests) grew in popularity
as a way to filter intelligence into ranks for military leaders. Beginning in 1928 at the
University of Chicago and quickly followed by other institutions, standardized tests such
as the College Board SAT were utilized as a way to select and acquire higher quality
students (Berger, 2012). Over the next few decades, the use of the SAT expanded to
fulfill the purpose of granting students admission to college. The ACT was created in
1959 as a competitor to the SAT (Atkinson & Geiser, 2009). Focused on testing content
mastery the ACT assesses different abilities than the SAT, which traditionally assessed
inherent intelligence. Each test has experienced negative publicity for socio-economic
and racial biases and questions about the predictive value for academic achievement
(Douglass, 2012). One way to consider diversifying an incoming class would be to think
differently about entry characteristics and the expectations placed on HSGPA and
standardized test scores.
In 2015, the State of College Admission annual report cited admission decision
factors for first-time freshman, “. . . have been consistent for decades. The No. 1
factor--rated as considerably important by 79 percent of colleges--was grades in college
prep courses, followed by strength of curriculum and grades in all courses (each 60
percent), and admission test scores (53 percent)” (National Association for College
Admission Counseling, 2015, p. 16). As shared previously, HSGPA and standardized test

18
scores are strong predictors of academic success in college (Moffat, 1993; Wolfe &
Johnson, 1995; Zheng et al., 2002).
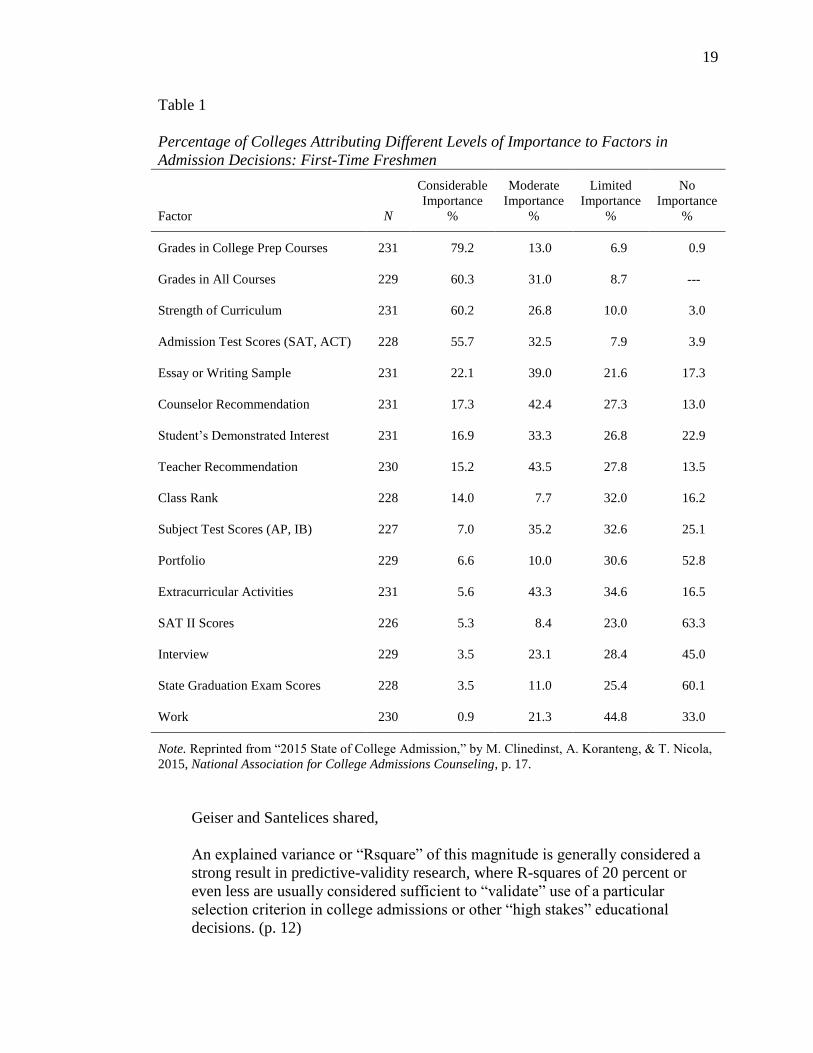
The National Association for College Admission Counseling (2015) documents
the level of importance attached to common admission requirements as indicated by
colleges and universities, which is summarized in Table 1. It is evident admission
decisions are focused on traditional factors of HSGPA, rigor of curriculum, and
standardized test scores while a majority of other criteria are listed as having moderate to
limited or no importance.
High School Grade Point Average
(HSGPA)
HSGPA is one of the most studied factors to predict future performance in
college. Studies have found that HSGPA is a better predictor for college success than any
other single factor (Astin & Oseguera, 2005; Geiser & Santelices, 2007). Geiser and
Santelices (2007) studied the relative contribution of high-school grades and standardized
admissions tests in predicting students’ long-term performance in college, including
cumulative grade-point average and college graduation. Surprising to Geiser and
Santelices was that in the University of California system, HSGPA actually predicted an
increased variance in college GPA after first year from 24.5% to 26.9% the second year
to 27.2% the third year. This increased variance meant that HSGPA explained a higher
percentage variance of college GPA in the second and third years than the first year. The
explained variance declined in the fourth year to 26.2% but still was higher than the
explained variance the first year.
19
Table 1
Percentage of Colleges Attributing Different Levels of Importance to Factors in
Admission Decisions: First-Time Freshmen
Factor N
Considerable
Importance
%
Moderate
Importance
%
Limited
Importance
%
No
Importance
%
Grades in College Prep Courses 231 79.2 13.0 6.9 0.9
Grades in All Courses 229 60.3 31.0 8.7 ---
Strength of Curriculum 231 60.2 26.8 10.0 3.0
Admission Test Scores (SAT, ACT) 228 55.7 32.5 7.9 3.9
Essay or Writing Sample 231 22.1 39.0 21.6 17.3
Counselor Recommendation 231 17.3 42.4 27.3 13.0
Student’s Demonstrated Interest 231 16.9 33.3 26.8 22.9
Teacher Recommendation 230 15.2 43.5 27.8 13.5
Class Rank 228 14.0 7.7 32.0 16.2
Subject Test Scores (AP, IB) 227 7.0 35.2 32.6 25.1
Portfolio 229 6.6 10.0 30.6 52.8
Extracurricular Activities 231 5.6 43.3 34.6 16.5
SAT II Scores 226 5.3 8.4 23.0 63.3
Interview 229 3.5 23.1 28.4 45.0
State Graduation Exam Scores 228 3.5 11.0 25.4 60.1
Work 230 0.9 21.3 44.8 33.0
Note. Reprinted from “2015 State of College Admission,” by M. Clinedinst, A. Koranteng, & T. Nicola,
2015, National Association for College Admissions Counseling, p. 17.
Geiser and Santelices shared,
An explained variance or “Rsquare” of this magnitude is generally considered a
strong result in predictive-validity research, where R-squares of 20 percent or
even less are usually considered sufficient to “validate” use of a particular
selection criterion in college admissions or other “high stakes” educational
decisions. (p. 12)

20
In their study, Geiser and Santelices found support for the utilization of HSGPA as a
primary indicator of future success accurately explaining greater than 20.0% of the
variance. Additionally, the same study attempted to answer the predictability of long-
term goals such as college graduation using seven logistic regression models to analyze
the relationship between four year graduation and HSGPA, SAT I (SAT), and SAT II
(SAT Subject tests). Across the seven models, HSGPA had the greatest predictive weight
of any one variable while controlling for parents’ education, family income, and high
school academic rank, which is defined as a measure of school quality developed by the
California Department of Education. The seventh model had the greatest concordant
percentage (64.7%) when all variables were assigned and each accounted for weight in
the model (HSGPA = .19; SAT I Verbal = -.02; SAT I Math = .00; SAT II Writing = .16;
SAT II Math = -.04; SAT II 3rd test = .03; Parental education = .07; Family income =
.03; and School rank = .04). An explanation of concordant percentage applied to this
example is stated as the probability that a randomly selected student who graduated will
have a higher predicted probability of graduating than a student randomly selected from a
sample of non-graduates (Austin & Steyerberg, 2012).
When HSGPA is compared to standardized test scores, HSGPA is a better
predictor of academic success in college (Geiser & Santelices, 2007; Hoffman, 2002;
Zheng et al., 2002). Geiser and Santelices (2007) argued standardized tests are generally
administered over a three-hour period usually during the junior year of high school and
are thought to predict success in college but can also be a measurement of, “test
preparation, repeat test-taking, and test-wise strategies to boost scores” (p.26). Test
preparation and test-wise strategies generally favor students from a higher socio-

21
economic status further creating a divide and separation of scores by household income
and could include other demographic differences (Ravitch, 2016). HSGPA reflects a
student’s achievement over a prolonged period of time across a variety of subjects, which
exhibits other qualities and personal traits such as motivation, perseverance, and personal
discipline.
Inequities in high school grade point average. Critics of admission decisions
primarily based on HSGPA, observe high school grades are not comparable from one
school to the next. High schools offer different curricula, access to technology, and
generally are resourced at varying levels from one another. Therefore, it is impossible to
compare students from different schools on the same metric of HSGPA (National
Association for College Admission Counseling, 2008).
Grade inflation. A national high school transcript study found that between 1990
and 2009, average HSGPA increased from 2.77 to 3.10 for women and from 2.59 to 2.9
for men (Nord et al., 2011). An increase in observed grade point averages challenges
admission offices to differentiate students using other predictive indicators. A publication
scheduled to print in 2018 by Michael Hurwitz from College Board and researcher Jason
Lee found that grade inflation was most prevalent in affluent and primarily White serving
high schools (Jaschik, 2017). The report also states that an “A” grade is now the modal
grade in high schools with the proportion of students with A averages increasing from
38.9% in 1998 to 47.0% in 2016 (Jaschik, 2017). This more recent study mirrors findings
from Woodruff and Ziomek (2004) who found the mean HSGPA for ACT-tested students
rose from 2.94 in 1991 to 3.20 in 2003. Collectively, these findings of grade inflation
could weaken the predictive validity of HSGPA and makes it more difficult to compare

22
students and make admission decisions (Godfrey, 2011). Intuitively, higher entry grades
would lead colleges to believe a more academically prepared student class has applied
and enrolled whereas in reality the level of preparation remains level while grade
inflation can account for the reported increase in HSGPA (Habley et al. 2012).
The use of HSGPAs as a primary means for admission to college has been
supported by data as the best predictor of future success. Yet, recent studies are beginning
to cast doubt on placing too great of importance on HSGPA when attempting to predict
completion. While grade point averages have increased in the last 20 years, standardized
test scores over the same period have actually decreased (Toppo, 2017). Additionally,
with the rise of grade inflation primarily occurring in schools with large numbers of
White and affluent families (Jaschik, 2017) the question to ask is: What does the
continued use of HSGPA without other variables mean to low income students and
students of color?
Standardized Test Scores (SAT/ACT)
Many colleges and universities traditionally rely on HSGPA and standardized test
scores (SAT/ACT) as two primary indicators of a student’s potential success in college.
One benefit of using standardized tests is the ease and efficiency of administration to
large numbers of students to provide a standard comparison of students across varying
backgrounds and characteristics. This is an attempt to treat each student on his or her own
merits and have a system to compare one student to the next.
Colleges have supported the use of standardized test scores in part because
standardized scores typically exhibit moderate-to-large correlations with first-year and
cumulative college grade point average (Higdem et al., 2016). Moderate to large

23
correlations would typically equate to a large effect size signifying the strength of the
relationship between two variables (Cohen, 1988). Sackett, Kuncel, Arneson, Cooper,
and Waters (2009) found a moderate relationship between standardized test scores and
college academic performance (r = .44), and the relationship was moderate even after
controlling for factors like socioeconomic status (SES). This finding paired with the
finding that the SAT has a strong positive relationship to measures of family income and
parental education (Geiser & Santelices, 2007) might be a cause for concern. Although
the SAT has demonstrated high criterion validities with college GPA, a byproduct is a
college may inadvertently (or intentionally) admit students from families with higher
incomes and increased levels of parental education. Stated another way, if a college
desires to increase access to lower income students but relies heavily on standardized
tests, then the goal of improved access may be difficult to achieve.
Effectiveness of standardized test scores. The continued use of standardized test
scores and HSGPA by colleges in admissions decisions has raised some reservation and
concern (Sackett et al., 2009). Schmitt et al. (2009) found a large portion of unexplained
variance in college performance utilizing an empirical clustering method which included
biographical data and situational judgments as well as pre-collegiate indicators of test
score and HSGPA. Sparkman, Maulding, and Roberts (2012) found that HSGPA and
standardized test scores are the best predictors of success, but combined only account for
about 25% of variance in a student’s college GPA. Tross, Harper, Osher, and Kneidinger
(2000) found that HSGPA accounts for 19% of variance in college GPA, standardized
test accounts for 18%, while the two predictors together account for 25%.
24
Critics of standardized test scores suggest the SAT is a weak predictor of college
academic success, particularly for nontraditional students (Sedlacek, 2004). A meta-
analysis by Credé and Kuncel (2008), found incremental variance in academic
performance beyond standardized test scores with use of noncognitive factors and there is
some encouragement to expand admission requirements to include noncognitive
assessment. Similar to HSGPA, standardized test scores do not measure students equally.
NACAC (2008) suggested, “. . . colleges that overemphasize the use of standardized test
scores in admissions may in fact be ignoring the disparities among under represented
students as test scores are strongly correlated with student and family attributes” (p. 39).
A study on 14,000 students entering 25 four-year and 23 two-year postsecondary
institutions in the fall of 2003 sought to track the academic performance, retention,
transfer, and degree attainment rates of students over six years (Habley et al. 2012). The
researchers developed this design so they could examine the outcomes by blocks of
variables beginning with demographic factors, pre-collegiate factors, and selected scales
from an ACT student readiness inventory (SRI). Using a hierarchical multiple regression
model, Habley et al. (2012) used first-semester and first-year cumulative GPA as criteria
for the models. Their research found, as expected, traditional standardized achievement
and HSGPA were significant predictors for college GPA and retention in college. Their
study also found the psychosocial factor of general motivational measures was predictive
of academic performance (college GPA). The two psychosocial factors that were found to
be significant for predicting retention after controlling for traditional institution factors
were academic discipline and commitment to college. These findings support existing

25
literature that HSGPA and SAT/ACT are predictive but there remains a large portion of
variance in predicting first-year academic performance and retention.
The National Association for College Admission Counseling (NACAC, 2008)
questioned the continued use of SAT/ACT scores in undergraduate admissions and
encouraged institutions to consider more than standardized test scores when making
admission decisions. NACAC offered a few considerations to dissuade campuses from
focusing on SAT/ACT including that low income students often do not understand the
significance of testing on college options and lack knowledge of and access to critical
information about preparing for the tests.
Differences across ethnicity. Grodsky, Warren, and Felts (2008) report that,
“racial and ethnic differences in mean standardized test scores are evident from the
earliest years of formal schooling, with African American and Hispanic children scoring
below non-Hispanic White children” (p.387). The pervasive difference is noticed
beginning as early as elementary school and extends through middle and high school, and
on to college entrance exams (Grodsky et al., 2008). As of 2016, the SAT score gap is
widening by race. The median score for Whites on the SAT reading section was 528 and
for Black or African Americans was 430 and in math, the average score for Whites was
533 and for Black or African Americans 425 (Persisting Large Racial Gap, 2016).
Additionally in 2015, 49% of white test takers met three or more benchmarks on the
ACT, while only 11% of Black or African Americans, 17% of American Indian or Alaska
Native, 23% Hispanic or Latino, and 25% Hawaiian Pacific Islander students met three or
more benchmarks (ACT, 2016b).
26
A number of theories and analyses have been posited to explain test score
differences across ethnicity. As recent as 2010, critical analysis of SAT test items
reported a relationship between item difficulty and differential item functioning (DIF) for
Black or African American and White test takers (Santelices & Wilson, 2010). DIF
studies attempt to determine how individual items function while statistically removing
score distribution between groups (Santelices & Wilson, 2010). Easier items on the test
were found to benefit White students while the more difficult items benefitted Black or
African American test takers. Although not generalizable to all groups, Santelices and
Wilson’s findings suggest sufficient evidence to question the validity of SAT verbal
scores. As the new Revised SAT was implemented spring 2016, there is no current
independent research to report changes to the current test and DIF analyses.
Another explanation for score difference has been connected to stereotype threat.
Stereotype threat is defined as, “the pressure that an individual feels when he or she is at
risk of confirming, or being seen as confirming a negative stereotype about a category or
group to which the individual belongs” (Scherbaum, Blanshetyn, Marshall-Wolp,
McCure, & Strauss, 2011, p. 362). The phenomenon of stereotype threat has real
consequences in realizing equal educational achievement. In a seminal article on
stereotype threat, Steele & Aronson (1995) found that social influence within stereotype
threat could play a critical role in racial group difference in scholastic aptitude testing. In
this research, Black or African American students and White students were presented a
diagnostic of intellectual ability and a non-indicative ability assessment. Strikingly, in the
intellectual study White students outperformed Black or African American students
whereas in the non-indicative ability assessment, no difference in aptitude were
27
discovered. The research by Steele and Aronson (1995) leans on stereotype threat as the
primary cause for differing outcomes when the only controlled changes in the two
diagnostics were the instructions and how each diagnostic was framed to the participants.
A final observation connected to lower academic achievement is observed in
funding patterns of school districts and individual schools. The Center for American
Progress completed a study in 2009 that researched funding outcomes and return on
investment within the education system. The report found that schools in high poverty
areas were twice as likely to be among the least productive school districts in terms of
school outcomes. Hispanic or Latino students were two times and Black or African
American students eight times more likely to be in the least productive school districts
than in the most productive school districts (Layton, 2014). This is further evidence of the
stratification of the education system and the long-lasting impact that is observed at time
of application to college.
As demonstrated above students of color often score lower on cognitive ability
tests and these findings are consistent across academic setting. Cognitive scores do not
accurately reflect ability or confirm the belief that students of color are incapable of
achieving success in higher education. Numerous factors are contributing to lower test
scores and the tests themselves may not be equitable. Regardless, students of color show
little difference to the majority group on noncognitive assessments of background,
motivation, and interests (Hough, 1998; Sackett, Schmitt, Ellingson, & Kabin, 2001).
This is an indication that colleges should reconsider standardized testing requirements
and expand the application requirements to consider other factors such as Grit that if

28
found to be predictive of college success, could lead to a larger number of eligible
enrolled students.
Optional standardized test scores. Standardized test scores remain a commonly
used metric for the purposes of admission to higher education and continued assessment
is needed to determine if SAT/ACT scores measure expected outcomes or if different
evaluation tools exist that can increase not just access to college, but predict a higher
likelihood of success when in college. As of fall 2015, more than 850 accredited,
bachelor-degree granting colleges and universities have announced test-optional policies
(Simon, 2015). The rationale of the decision for test score optional admission
acknowledges “students who have proven themselves quite capable of doing extremely
well in college have nonetheless done only marginally well or worse on college entrance
examinations” (Ransdell, 2001, p. 358). In a recent study of 33 private and public
institutions that implemented test-optional polices, Hiss and Franks (2014) reported
approximately 30% of students admitted were non-submitters of standardized tests, and
there was no significant difference in graduation rates (0.6% lower for nonsubmitters) or
their cumulative college GPAs (2.83 for nonsubmitters to 2.88 with test scores). Data also
showed within the study, nonsubmitters are more likely to be first generation,
underrepresented minorities, women, Pell grant recipients, and students with learning
disabilities (Simon, 2015).
College Preparatory Core and High
School Rigor
Retention research has found the predictive value of students’ completing the
minimum college preparatory core courses in high school. College preparatory core
generally refers to a set of courses students should take in high school which include four

29
years of English, and three years each of mathematics, science, and social science. Noble
and Radunzel (2007) tracked approximately 200,000 ACT-tested students to report on
academic success (defined as >2.5 college GPA), retention from first year to second,
academic progress in number of credits completed, and degree completion. Their findings
indicate 70% of students who complete the college prep core achieved above a 2.5
college GPA compared to 59% of students who do not complete the college prep core.
Retention to second year was 73% for core completers and 66% for non-core completers
while four year graduation rates were 20% for core completers compared to 14% for non-
completers. Students who completed the college preparatory core courses out-performed
students who had not completed the core in each of three areas measured. These findings
suggest that college prep courses have some relationship to college success.
The relationship between individual courses taken by students and college success
has also been researched. It has been suggested that the highest level of math in high
school can be one of the strongest predictors of college success (Adelman, 2006). Klepfer
and Hull (2012) used the Educational Longitudinal Study (ELS) from 2002, which was a
nationally representative sample of high school sophomores in the class of 2002 and
collected follow-up data from this same group in 2004 as seniors, and again in 2006.
From the original sample of over 16,000 students, the ELS looked at 9,060 who
graduated from high school, enrolled in a 2-year or 4-year college immediately after high
school, and were still enrolled in January of 2006. Similar to Adelman (2006), Klepfer
and Hull reported that the higher math course a student completes in high school, the
more likely a student is to persist in college, no matter the level of SES or prior academic
achievement.

30
There are many challenges to consider while focusing on individual levels of
achievement in math. For instance, the base building for a strong math background
begins well before high school. Although Klepfer and Hull (2012) reported significant
improvement in college retention rates for students who complete Pre-Calculus or
Calculus instead of Algebra I or Geometry across SES, the ability for students to
overcome early deficiencies in math may exclude them from achieving this skill level.
Although the rate of high school graduates who completed Calculus has increased from
7% in 1990 to 16% in 2009, there still remains many students who do not achieve the
level indicated in the prior research and completion of Calculus does not seem feasible to
use as part of an admission requirement (National Center for Education Statistics, 2009).
Another way for colleges to assess college readiness is the opportunity to take
Advanced Placement (AP) and/or International Baccalaureate (IB) courses. The Center
for Public Education found that students who took AP courses were at least twice as
likely to graduate college within five years (Center for Public Education, 2012) than
students who did not take AP courses. Klepfer and Hull (2012) reported similar results
with AP course takers but have interesting findings across SES for students persisting at
four year colleges. For a high SES group (61st to 80th percentile), persistence in college
increased 6%, middle SES (41st to 60th percentile) group increased by 9%, and for the
low SES (21st to 40th percentile) group, persistence increased by 13% over non-AP
course takers. These reported increases provide encouragement to all students to
challenge themselves in high school but specifically those from lower income
households. Klepfer and Hull found no statistically significant difference between how
students scored on an AP exam (1-5) and persistence in college. The fact that a student
31
took the class and attempted the exam showed an increased indicator of success in
college over students who did not take AP courses. This suggests that the rigor of AP
curriculum improves student persistence in college.
Unknown Variance in Retention
While the use of pre-collegiate factors is shown to predict future academic
success, there remains a high portion of unknown variance. Cognitive ability (prior
academic achievement) and academic preparation are important to college success
(Adelman, 2006) but there remains significant variation in outcomes of students with
similar abilities (Dweck, Walton, Cohen, Paunesku, & Yeager, 2011). In a study at a
research university in the Midwest, pre-collegiate characteristics of HSGPA, SAT/ACT,
and course rigor explained one-third the variance in students’ first-year grades in college
(Pike & Saupe, 2002). Johnson (2012) reported that only about 10% of students who
leave college early have achieved college GPAs of less than 2.0. This statistic, coupled
with the large amount of unknown variance, leaves open the possibility other factors yet
unmeasured could be keys in determining student retention and progress to degree. If the
reason for departure is less associated with academic ability, then what other factors
could be considered to predict future academic achievement?
Early evidence suggests that grit can add incremental support to the variance of
predicting first-year GPA and retention, which suggests that the inclusion of noncognitive
variables (NCVs) could increase the number of underrepresented populations on four-
year college campuses. There are a limitless number of noncognitive traits to consider
and explore in an effort to better explain the unpredictable outcomes for student success
at the collegiate level. Grit was chosen for this study as it has been differentiated from

32
other noncognitive traits by focusing on stamina while working toward goals. Grit is
comprised of two factors: consistency of interest and perseverance of effort. Duckworth
and Quinn (2009) expanded on the differences between grit and other traits as, “. . . grit
entails the capacity to sustain both effort and interest in projects that take months or even
longer to complete” (p.166). This current research is guided by further exploration of grit
and how it interacts and relates to academic progress toward degree, which is highly
influenced by first year GPA, persistence, and retention.
Regardless of the differing stance on the use of HSGPA, standardized tests, or
high school curriculum rigor as primary indicators for admission, a social justice issue
remains that should be considered. Institutions that value a diverse student population and
desire to improve access to students across ethnicity, socioeconomic status, and college
generational status should think differently about admission criteria and the impact
policies have on enrollment and the demographics of the student body.
Retention and Persistence Research
Balancing enrollment and student attrition is a challenging problem facing higher
education. Differing opinions exist as to the main cause of student attrition and there
remains disagreement over what intervention strategies would help reduce the rate of
dropout (Kelly, Kendrick, Newgent, & Lucas, 2007). Improving student persistence and
retention is of great significance on many levels including individual, social, and
economic reasons (Tinto, 1993). In this section, I will discuss theories that institutions
employ to support students post-enrollment in an attempt to prevent attrition. Each theory
is open for interpretation and depending on the constructs, may not be relevant for all
people, organizations, and situations (Swail, Redd, & Perna, 2003).

33
Reason, Terenzini, and Domingo (2006) completed a study of nearly 6,700
students and 5,000 faculty members on 30 campuses nationwide. Their study led to the
development of seven principles called “Foundational Dimensions” (p. 151) that
institutions should strive to promote in order to improve the success and persistence of
first-year students. The principle from Reason et al., most closely aligned with this
current study is to, “Facilitate appropriate recruitment, admissions, and student transitions
through policies and practices that are intentional and aligned with institutional mission”
(Reason et al., 2006). This principle is predicated on the belief that the
withdrawal/success process begins before students enter the university (Paulsen & St.
John, 2002).
Colleges recognize the decision for students to attend and leave an institution is
influenced by similar characteristics often unrelated to academic preparedness
(Ackerman & Schibrowsky, 2007). The most common reason for students leaving a
university is personal reasons, at nearly 59% (Kelly et al., 2007). Grit can potentially help
explore this phenomenon. Personal reasons often can be viewed as a challenging life
event or dealing with adversity. Overcoming challenges while maintaining focus and
completing a long-range goal is at the core of a student’s demonstration of grit. Naturally,
with such a wide range of variables influencing student persistence, it is reasonable to
assume that not all students entering as freshman will be academically successful (Tinto,
1993).
Existing Persistence and Retention
Theories
A number of theories exist to help explain student persistence and attrition. Two
existing theories that connect to this study are departure theory (Tinto, 1993) and the

34
geometric model of student achievement and persistence (Swail, 1995). Departure theory
(Tinto, 1987) looks at student attrition from pre-determined factors that will influence the
persistence of each student. Tinto further explained eight factors that influence student
persistence: academic difficulty, adjustment, goals, uncertainty, commitments, integration
and community membership, incongruence, and isolation. These factors highlight the
challenges of balancing the transition to the university in terms of academic and social
involvement. Adjustment specifically addresses the lack of preparedness to make the
change. Students do not leave college because they are not able to perform but because
they did not make the transition to college smoothly (Tinto, 1987). Without assistance,
these students are likely to leave before they learn how to successfully perform college
level work.
Another dimension of student persistence focuses on the separation stage of
Tinto’s theory. The feeling of membership to a group or culture has long been known to
come in three distinct stages: separation, transition, and incorporation (Elkins, Braxton, &
James, 2000). Tinto (1987) described separation from previous communities such as
family and friends as well as high school and church as the introduction to college begins.
The separation stage may be difficult for students’ that had close family connections and
may have found the college experience difficult to navigate and understand. Elkins et al.
(2000) found that students who were able to negotiate through the stage of separation
were more likely to return for a second semester. Within Tinto’s theory, I believe grit is
embedded in the ability to persevere and stay focused on long-term goals while dealing
with the challenges that transition entails.

35
A different approach to understanding retention was researched and created by
Swail (1995) with a focus on minority student persistence. Swail introduced the
Geometric Model of Student Persistence and Achievement. This model is a triangular
shape with cognitive, social, and institutional factors labeled on each side (Figure 1).
Figure 1. Swail’s Geometric Model of Student Persistence and Achievement (Swail,
2014, p. 76).
The model is guided by placing the student experience inside the triangle and
describing the three forces that affect student persistence. I believe grit to be present
within the social factor domain with close relation to goal commitment, attitude toward
learning, and social lifestyle.
Swail (2014) identified a set of attributes that students may possess:
Attend part-time,
Have a low GPA,
Are of non-traditional age (e.g., older),
Are non-White (with exception of Asian),
Are first generation,
Are low income and/or independent,

36
Have a variety of risk factors (including having children, being single),
Delay entry into college,
Attend an HBCU or HSI,
Have lower levels of high school mathematics,
Attend more than one institution (although this can depend), and
Work more than 20 hours per week. (p. 21)
Swail concluded that these risk factors play a significant part in the predictability of
students earning a college degree in six years. Based on his research, in general 66% of
first-time college students graduate in six years whereas by possessing just one of the risk
factors mentioned above, the graduation rate drops to 44% in six years and students who
possess two or more risk factors lower their graduation rate even further to 34% in six
years.
As part of the Geometric model (Swail, 1995), the institutional factor contains
sub-categories such as Financial Aid, Recruitment and Admissions, Academic Services,
Curriculum and Instruction, and Student Services collectively known as a Student
Monitoring System. Within the recruitment and admissions domain, Swail et al. (2003)
stressed the importance of institutions establishing admissions criteria using a holistic
approach for a more comprehensive assessment of students’ commitment to college and
compatibility with the institution. This recommendation by Swail et al., connected well
with this current study and the goal of determining if the use of the grit scale can further
enhance and predict student academic success beyond traditional measures.
Noncognitive Predictors of College Success
The concept of noncognitive variables (NCV) for the purposes of admission has
grown from the,
37
. . . decades of disparity between college acceptance, attendance and completion
by non-traditional college students (i.e., students of color, first-generation college
students, older students, student with special learning needs, etc.) in comparison
to the more traditional college going population (i.e., White, middle to upper-
middle class men). (Sommerfeld, 2011, p. 1)
By placing importance on standardized tests for admission, which have shown to
be effective at identifying students who will succeed, institutions were criticized for the
negative impact that decisions based on standardized tests had on groups that are more
diverse. In the following section, I expand on examples of noncognitive research to
include noncognitive, predictive ability, college readiness, and holistic review.
Importance of Inclusion of
Noncognitive
Research has shown that although standardized test scores and HSGPA have
predictive value, these predictions could be stronger when combined with noncognitive
factors (Sternberg et al., 2012). Standardized test scores do not provide the psychosocial
skills that noncognitive traits can provide when evaluating predictive abilities. The use of
noncognitive variables is useful for all students, but these variables have been shown to
provide a viable option for fairly assessing the abilities of students of color, international
students, students with disabilities, and older students (Sedlacek, 2011). A number of
scholars have supported including noncognitive factors in assessments for college
readiness as a way to improve the accuracy of selection criteria, casting light on students’
abilities to navigate multiple demands of the college environment (Sommerfeld, 2011).
Traditional HSGPA and test score measures in admissions may not be optimal
when underrepresented populations are involved (Young & Koplow, 1997). Young and
Koplow (1997) studied fourth year students at a mid-Atlantic University. They found that
using just precollegiate variables led to an overstatement of the prediction of success for

38
students of color. They also found that academic predictors can explain about 45% of the
difference in cumulative GPA between White students and students of color and another
25% can be explained by a noncognitive variable of academic adjustment. Their research
provides support for the predictive validity of the noncognitive variable of academic
adjustment.
Predictive Ability
A number of nonability measures have been found to predict a student’s potential
academic career including personality, motivation, and past experiences (Robbins et al.,
2004). Although cognitive ability has been shown to inform us about what a student may
be capable of, noncognitive factors help explain what the student may actually achieve
(Dee & West, 2011; Jackson, 2012; Komarraju et al., 2013). Noncognitive variables have
been researched in a variety of ways related to persistence and retention. Nettles, Theony,
and Gosman (1986) and Tracey and Sedlacek, (1982, 1985), have studied noncognitive
dimensions which include student aspirations or motivation. There are a number of
factors to explore related to noncognitive variables and use for determining a student’s
disposition to perform at a desired level on a college campus. Post-secondary institutions
would benefit from identifying students who are the right fit for the college and have the
necessary skills and abilities to be successful and persist.
Three goals have led to increased research into NCVs and their use in admissions
as a predictor of future success (Thomas, Kuncel, & Credé, 2007). The three goals are;
increasing admissions of students of color, improved prediction of student performance,
and increased college student retention of all students, but primarily underrepresented and
students of color (Komarraju et al., 2013; Sparkman et al., 2012; Thomas et al., 2007). A
39
number of researchers have turned to noncognitive variables as a way to explain the
differences between students of color and nonminority students on traditional predictors
and have found that NCVs are important indicators of success and persistence in college
across race, but primarily in students of color (Izaak, 2001; Sedlacek, 2004; Wood,
Smith, Altmaier, Tarico, & Franken, 1990).
Schmitt et al. (2009) found by incorporating biodata measures (knowledge and
continuous learning similar to noncognitive variables) and situational judgment
questionnaires into the admission criteria, the percentage of Hispanic or Latino and Black
or African American students in an incoming class increased while students who
identified as Asian or White decreased proportionally. This finding suggests that if a
campus were to incorporate different measures, specifically a noncognitive assessment, in
their admission process, the campus might expect a larger proportion of students of color
to be admitted. Additionally in their study, Schmitt et al. (2009) found under the two
samples studied (standard cognitive evaluation and standard cognitive with noncognitive
measures evaluation), there was no difference in graduation rates while the diversity of
the student body increased in number of students of color.
College Readiness
A similar study on cognitive and noncognitive predictors of college readiness
found similar value in noncognitive variables. Komarraju et al. (2013) examined three
outcomes: (a) differences in college readiness between students who scored in the upper
half and lower half on the ACT and those who were above the median and below the
median for HSGPA; (b) predictive validity of ACT scores, HSGPA, and academic
discipline with regard to college GPA; and (c) a potential mediating relationship between

40
high school GPA, academic discipline, and college GPA. One of their findings was
students with higher HSGPAs appear to be more academically disciplined, determined,
and self-confident. These characteristics could lead one to believe that each of the
noncognitive factors influenced greater academic success. An interesting belief shared by
the authors was of students who scored lower on the ACT, those students may employ
noncognitive psychosocial skills to work towards academic goals. In addition, those
scoring lower on the ACT but with relatively high HSGPAs may generally possess
noncognitive skills including motivation, commitment, and sound study skills which are
key factors influencing college completion and may provide encouragement for
admissions personnel to reevaluate decision criteria before denying strictly off of lower
test scores (Komarraju et al., 2013).
Ting (2001) studied 124 academically high-risk students to determine if cognitive
and psycho-social variables could predict academic performance. Findings suggest that
standardized test scores along with class rank added 11% of variance to predicting first
semester GPA and the psychosocial predictor of long-range goals added 10% variance.
Ting concluded that standardized test scores were insufficient predictors of academic
success alone and that a combination of cognitive and psychosocial factors may better
predict academic success. Adebayo (2008) combined cognitive and noncognitive
measures to affect the academic performance and retention of conditionally admitted
freshmen who were primarily from underrepresented populations. Abedayo’s study was
administered to conditional admits (those who were below the generally admissible range
of the host institution) and whom the author identified as “at-risk.” The findings of the

41
study suggest for conditionally-admitted students the combination of cognitive and
noncognitive factors has some merit to predict future academic success.
Holistic Review
Habley et al. (2012) proposed a single model for bringing together HSGPA,
standardized tests, and psychosocial and behavioral factors. To combine the independent
variables of cognitive and psychosocial data improves predictive models and intervention
strategies (Habley et al., 2012). Research by Habley et al. resulted in the creation of the
Student Readiness Inventory (SRI) which met the goal of their research to integrate
relevant persistence and motivation theory constructs into a coherent model. I find
support to research noncognitive variable from a concluding thought by Duckworth and
Yeager (2015) who wrote:
What is new is the expectation that one can measure, with precision and accuracy,
the many positive personal qualities other than cognitive ability that contribute to
student well-being and achievement. Quantifying, even imperfectly, the extent to
which young people express self-control, gratitude, purpose, growth mind-set,
collaboration, emotional intelligence, and other beneficial personal qualities has
dramatically advanced scientific understanding of their development, impact on
life outcomes, and underlying mechanisms. It is no surprise that policymakers and
practitioners have grown increasingly interested in using such measures for
diverse purposes other than theory development. (p. 246)
Identifying and researching noncognitive variables for the purposes of predicting
college student success has been hypothesized comprehensively over the past 30 years.
And yet it remains reasonably unknown within behavioral science what best predicts
future behavior and ultimately performance and persistence at the post-secondary level.
Further research into the use of noncognitive variables in university admissions could
lead to a greater understanding of admission rates, persistence, and graduation and yield
42
improvements in educational attainment for all students but particularly those from
underrepresented backgrounds.
Grit
The construct of grit was first introduced as a trait-level perseverance and passion
for long term goals (Duckworth et al., 2007). Initial research showed potential to predict
achievement against odds over and above measures of talent. Duckworth et al. (2007)
proposed grit is distinct from other noncognitive factors as a skill and is associated with
lifetime educational achievement (Duckworth & Quinn, 2009). There is limited research
on grit and its effectiveness to predict student success within the academic environment.
Development and Validation of the
Grit-O Scale
Duckworth et al. (2007) defined grit as “perseverance and passion for long-term
goals. Grit entails working strenuously toward challenges, maintaining effort and interest
over years despite failure, adversity, and plateaus in progress” (p. 1087). The authors
believed individuals with grit stay the course and their advantage is stamina. Individuals
with high grit do not stray from long-term goals in the face of adversity. Duckworth et al.
sought to develop a scale as a standalone measure of grit to:
. . . adolescents and adults pursuing goals in a variety of domains (ie. not just
work or school), low likelihood of ceiling effects in high-achieving populations,
and most important, a precise fit with the construct of grit. (p. 1089)
Duckworth et al. (2007) embarked on a study to develop and validate scores from
a self-report measure of grit in a large sample of adults. In 2004, a website was created to
assist with the development of the scale. Over the course of 18 months, nearly 1,545
participants aged 25 and older completed the survey. Originally designing the instrument
as a 27-item survey with the goal of exploring the construct of grit, the authors sought to

43
capture attitudes and behaviors of high achieving individuals. Specifically, they desired
to identify traits of individuals with careers such as lawyers, businesspeople, academics,
and other professional fields. Two distinct areas emerged in their scale design. Sustained
effort was the first area they were interested to better understand. Example questions to
determine sustained effort include, “I have overcome setbacks to conquer an important
challenge” and “I have achieved a goal that took years of work.” The second area the
authors wanted to measure was consistency of interests. Example questions of the subset
consistency of interest include “New ideas and projects sometimes distract me from
previous ones” and “My interests change from year to year.” The scale was administered
as a Likert-type scale with items rated 1-5 with 1 = not at all like me to 5 = very much
like me.
Analysis of the items included item-total correlations, internal consistency
reliability coefficients, redundancy, and simplicity of vocabulary which led to 10 items
being eliminated (Duckworth et al., 2007). Of the 17 remaining items, an exploratory
factor analysis was completed on half the respondents (n = 772) chosen at random. After
running a two-factor oblique solution with promax rotation, 12 items were retained with
loadings of at least .40. The first factor contained six items indicating consistency of
interests and the second factor contained six items indicating perseverance of effort. The
two factors were correlated at r = .45. Duckworth et al. (2007) then tested the integrity of
the final two-factor solution to ensure the portion of variance not shared by the other
factor was larger than the error variance for that factor. A confirmatory factor analysis
was completed on the remaining participants (n = 773) which supported the two factors
with a comparative fit index (CFI) = .83 and root-mean-square error of approximation =
44
.11. The authors reported the “resulting 12-item Grit scale demonstrated high internal
consistency (α = .85) for the overall scale and for each factor (Consistency of Interests, α
= .84; Perseverance of Effort, α = .78)” (p. 1091). When responses to items from the
same scale have high internal consistency reliability, this means the items that were
proposed to measure the same construct produce similar scores. Furthermore, neither
factor was consistently more predictive than the other and in most cases, the two factors
together were more predictive than either alone (Duckworth et al., 2007).
Development and Validation of the
Grit-S Scale
Modeled after the original Grit Scale, Duckworth and Quinn (2009) embarked on
improving the original scale. They cite the model fit (CFI = .83) of the Grit-O scale as
evidence for improvement. Duckworth and Quinn applied the short scale version (Grit-S)
to four samples originally presented in Duckworth et al. (2007). The Grit-S scale
maintained the 2-factor structure with four fewer items and was able to improve
psychometric properties, maintain internal consistency, test-retest stability, and predictive
validity (Duckworth & Quinn, 2009). The researchers recommended the use of Grit-S
over Grit-O due to the “superior psychometric properties, comparable predictive validity,
and fewer items relative to the Grit-O” (p. 174). The authors concluded they had
developed and validated scores from the Grit-S questionnaire as a more efficient measure
of trait-level perseverance and passion for long-term goals. Following the development of
the Grit-O and Grit-S scales and validation of inferences from respondents’ scores, other
researchers have utilized one of these primary scales to explain if grit can predict
academic success, persistence in careers, and commitment in long term relationships. The
45
Grit-O and Grit-S scales are available online (http://angeladuckworth.com/research/) and
researchers and educators are welcome to use them for non-commercial purposes.
Controversy Surrounding Grit
When grit was introduced in 2007, there was excitement and interest regarding
the potential of a new psychological variable that could increase persistence in careers,
education, and relationships. Nearly 10 years later, the shine and excitement has begun to
wear off. A Google search for grit will find a number of online blogs that question the
construct of grit and specifically its development, purpose, and intentions. Specific to the
topic of race and low-income students, grit is being viewed as “an appealing policy target
for those who believe that if we could just cultivate ‘right’ qualities among ‘low-
achieving’ then they would be able to transcend conditions of poverty and other obstacles
in their way” (Ravitch, 2014, para. 2).
From the initial introduction of grit in 2007 by lead author Angela Duckworth,
challenges to the theory began to surface primarily from social science researchers and
K-12 educators. In a recent interview (Dahl, 2016), Duckworth herself in response to
hasty curriculum changes and so called “Grit week” challenges stated, “… grit becomes a
scapegoat – another reason to blame kids for not doing well, or to say that we don’t have
a responsibility as a society to help them” (p. 1). The questioning in current research is
the belief that grit is not any different than conscientiousness from the Big 5 personality
trait research in psychology. While conscientiousness does include the concept of
perseverance, the second part of grit known as passion is often less defined.
Credé, Tynan, and Harms (2017) completed a meta-analytic review of grit
literature to focus on the structure and relation between grit and other noncognitive and

46
demographic variables. After reviewing 88 independent samples and a critical review of
the existing literature, Credé et al. presented three primary findings: (a) the factor
structure appears to result in a loss of ability to predict performance; (b) grit exhibits
relations with academic performance and retention although modestly; (c) the
incremental value of grit for the prediction of performance is likely to be limited. In
support of this current study, Credé et al. reported that grit was successful in predicting
retention approximately as well as traditional factors such as cognitive ability and high
school grades, which supports continued assessment of grit in educational settings where
retention is problematic.
Differentiating Grit from Other
Research
A number of studies have looked at grit in an attempt to predict future outcomes
across populations including youth, college students, and adults. Related research into
other psychosocial variables connected to grit include self-control, motivation, big five
inventory of personality traits, deliberate practice, resilience, and persistence in life
situations. Grit is unique in that individuals who exhibit a high level of grit typically do
not deviate from their goals, even in the presence of distractions or absence of
recognition (Duckworth & Quinn, 2009). A unique difference between the Big 5
Conscientiousness and grit is that researchers have categorized conscientiousness as a
trait that develops over time and is not trainable whereas grit is recognized as a skill that
has shown promise to be developed (Kamenetz, 2016).
Grit Research on College Students
A seminal research study on college students involving the construct of grit was
designed and initiated in 2002 that considered predicting performance among high
47
achievers. This early research by Duckworth et al. (2007) tested whether grit was
associated with cumulative GPA among undergraduates at an elite university. The
authors also tested if grit could explain variance in GPA over and beyond SAT scores
which would be used as a proxy for intelligence. This research fit with the desire of the
researchers to establish if grit is more predictive of future outcomes than talent. The
sample included 139 undergraduate students (69% women, 31% men) majoring in
Psychology at the University of Pennsylvania where the average SAT score of this
sample was 1,415 which is achieved by fewer than 4% of all SAT test takers. This
research found that grit scores were associated with higher GPAs (r = .25, p < .01), a
relationship that was even stronger when controlling for SAT (r = .34, p < .001). As
shown, grit explained 25% of the variance of GPA and 34% of the variance in GPA when
controlling for SAT. SAT scores were also found to be related to GPA (r = .30, p < .001).
This last finding is congruent with existing research on SAT and college GPA. The
authors did note an unexpected finding in their research. Grit was associated with lower
SAT scores (r = -.20, p < .03). The authors suggested that smarter students may exhibit
less grit than their peers. This finding suggests “among relatively intelligent individuals,
those who are less bright than their peers compensate by working harder and with more
determination” (Duckworth et al., 2007, p. 1093). Although their study was useful in
beginning to understand relationship of grit to college GPA, the sample studied had an
academic profile with an average SAT of 1,415, at an institution with an acceptance rate
of 21% in 2002. This sample varies greatly from a typical college student at a traditional
research university where SAT scores range from 840 - 1190 and an acceptance rate
between 75%-90% (ACT, 2016a).

48
West Point, a United States Military Academy, was the site of another early grit
study involving college students. Standard admission to West Point depends on a
combination of factors but is heavily weighted toward a Whole Candidate Score, which is
a weighted average of the SAT, class rank in high school, demonstrated leadership
ability, and physical aptitude. Generally, about 5% of new cadets drop out prior to
completing the first summer of training. Duckworth et al. (2007) conducted a study in
2004 and expected grit to predict retention over the first summer, military performance
score, and academic GPA at the end of the first year. Participants were 1,218 new
students with 84% identifying as men, 77% White, and average age of 19.05 years. The
grit scale was administered and found to have an internal consistency reliability
coefficient of α = .79. Internal consistency reliability is when responses to the items on a
scale are related and the items are measuring similar aspects of the construct. The higher
the internal consistency reliability, the more confidence a researcher can have that the
measure is measuring the factors with minimal random measurement error. Grit was
found to predict completion of the summer training program more strongly than any other
predictor. Using a logistic regression analysis, cadets who were a standard deviation
higher in the grit scale were more than 60% more likely to complete the summer training
program (β = .48, OR = 1.62, p < .001) as shown with the odds ratio of 1.62. The odds
ratio (OR) represents the odds that a specific outcome will occur given a particular
exposure (Szumilas, 2010). The Whole Candidate Score used by West Point to admit
cadets, did not predict summer retention (β = .09, OR = 1.09, ns). Grit was not found to
be a predictor in GPA or military performance score. The authors noted the “superior
prediction” of the whole candidate score to predict military performance score and GPA.
49
Findings suggest that there may be differences in the psychological traits that propel
cadets to stay through the rigorous summer training program compared with those who
score high in GPA or military performance score. Grit was specifically introduced with a
definition of perseverance and passion for long-term goals. Did the trait of grit present
itself differently in regards to admission to West Point, possibly confounded in the high
school grade point average while college GPA was viewed as a necessary requirement to
maintain toward the ultimate goal of graduation?
Grit and Persistence in Life Situations
As the literature around grit continues to grow, a number of studies have been
completed to assess grits impact on life circumstances. Eskreis-Winkler, Duckworth,
Shulman, and Beal (2014) found in a series of studies that individuals with higher grit
scores were less likely to drop out of their respective life commitments. Eskreis-Winkler
et al., shared that,
Gritty soldiers were more likely to complete three weeks of a grueling Army
Special Operations Forces training; gritty sales representatives were more likely to
remain at their jobs three months later; gritty high school juniors were more likely to
graduate from high school one year later; and gritty men (but not women) were more
likely to remain married (p. 14).
These findings suggest a commitment level exists that could help predict retention
in life events. In the realm of athletics, grit was found to be a significant predictor in
exercise programs (Reed, Pritschet, & Cutton, 2013). Cross (2014) found that doctoral
students with higher grit had a more positive association with grades and weekly hours
studying. In the field of education, teachers with higher grit scores were less likely to
leave midyear (Duckworth & Quinn, 2009). I believe these findings support continued
research into the predictability that grit has on a more representative college sample
50
specifically in the areas of academic success. It would seem reasonable to believe that
retention could potentially be attributed to higher levels of grit.
Theoretical Framework for the Study
Psychological research includes countless examples of theories predicated on the
predictive capabilities of a social construct to identify and account for an observed
behavior. The research on grit is still evolving and with this research, I provide a new
view on how grit fits into existing literature and theoretical models while also serving a
unique purpose within the current literature around psychosocial variables. Initial grit
research has found similarities or even overlaps to other theories. I believe grit connects
aspects of existing theories to form the construct of grit. As shown in Figure 2, I believe
grit connects with existing psychosocial theories in the form of persistence, adversity,
engagement, and time. The following section provides a brief review of each
psychosocial theory and how each connects with grit.

51
Figure 2 The construct of grit displayed from multiple facets of four related but differing
theories.
The following section expands on the research and makes connections to grit and
how further exploration is necessary.
Deliberate Practice
Grit has been linked to deliberate practice, which is defined as effortful activities
designed to improve performance (Ericsson, Krampe, & Tesch-Romer, 1993). In a study
focused on spelling bee finalists, researchers attempted to test if spellers with higher grit
scores were more likely to engage in deliberate practice, and their cumulative time
devoted to this activity explains their superior performance (Duckworth, Kirby,
Tsukayama, Berstein, & Ericsson, 2011). Duckworth et al. (2011) invited 274 finalists to
participate, of whom 190 responded. Participants did not differ from nonparticipants on
52
gender, age, or spelling performance. Their study utilized the Short Grit Scale
(Duckworth & Quinn, 2009) and had an internal consistency reliability of α = .82. The
findings of Duckworth et al., (2011) confirmed that spellers with higher grit scores
accumulated more deliberate practice while deliberate practice in turn predicted spelling
performance. A test of the specific indirect effect confirmed that deliberate practice
mediated the effect of grit on spelling performance. This finding was encouraging
because deliberate practice and grit have common themes, specifically maintaining a
perseverance and passion for long-term goals which through deliberate practice may
become possible.
Resilience
Research into resilience began over 50 years ago with primary focus on children
who were at risk due to disadvantage and adversity (Yates, Tyrell, & Masten, 2015).
Primarily researching youth who faced difficult odds on development and nurturing due
to tragedy or absent parental influences, researchers sought to explain how some
individuals performed well when dealing with adversities compared to others who
experienced a less successful outcome (Masten, 2013). Ledesma (2014) defined
resilience as, “the ability to bounce back from adversity, frustration, and misfortune”
(p. 1). Resiliency has been studied in a number of life domains including human
development (Werner & Smith, 2001), change management (Conner, 1993), psychiatry
(Flach, 1988), and social sciences (Henderson & Milstein, 1996). Each model
characterizes the impact resiliency has on the given domain while sticking closely to the
basic understanding of resilience being concerned with individual variations in response
to risk (Yates et al., 2015). From resilience research, the concept of “thriving” was
53
developed Nishikawa (2006) which defined as a cognitive shift in response to a
challenge. I believe adversity is a common trait between resilience and grit which
Obradović, Shaffer, and Masten (2012) stated are negative contexts that have potential to
disrupt adaptive functioning and development. Stated differently, resilience is
overcoming immediate challenges while remaining optimistic (adversity) to succeed
when others fail while grit is sticking with a particular task or goal over a prolonged
period of time in light of setbacks. The connection between these two is dealing with
adversity while the primary difference is the time set of the accomplishment.
Self-Control
Comparisons have been made between self-control and grit. Self-control is
defined as “the capacity to regulate attention, emotion, and behavior in the presence of
temptation” (Duckworth & Gross, 2014, p. 3). Self-control aligns actions with valued
goals when the existence of more rewarding options becomes available (Tangney,
Baumeister, & Boone, 2004). An example of self-control might be when a student
chooses to study the night before a test, instead of acting on an invitation to a social
gathering. The valued goal is performing well on the test and in the class but the more
rewarding immediate option would be to hang out with friends. This would demonstrate
self-control. Grit is defined as “working diligently toward a goal through difficulties and
despite setbacks over a prolonged period of time” (Duckworth & Gross, 2014, p. 3). An
example of grit may be a student’s graduation from college after six years, dealing with
the loss of a parent and changing majors multiple times.
Moffit et al. (2011) reported that self-control and grit predict successful outcomes
over and above intelligence while Duckworth et al. (2007) found the two factors highly

54
correlated (rs = .6). Duckworth et al. also reported in two separate studies (student
retention at West Point and performance in the National Spelling bee) grit predicted
retention and performance when controlling for self-control, but self-control did not
predict these outcomes when controlling for grit. Although self-control and grit have
similarities, they operate in different ways and more importantly at different time scales
(Duckworth & Gross, 2014).
Flow/Engagement
Von Culin, Tsukayama, and Duckworth (2014) completed a study to explore the
motivational orientation correlates of the character strength of grit and its two component
facets: perseverance of effort and consistency of interests over time. Their study
specifically examined associations among three different orientations of happiness
(engagement, meaning, and pleasure) and the personality trait of grit. C. Peterson, Park,
and Seligman (2005) connected the orientation of happiness engagement with the
contemporary research of flow which means the “state of complete absorption and full
mastery in highly challenging, highly skilled activities” (Von Culin et al., 2014, p. 2). Of
the three happiness orientations, engagement was found to be the happiness orientation
most closely aligned with grit as its definition is associated with “flow-producing
activities to be especially likely to sustain effort toward long-term goals” (Von Culin et
al., 2014, p. 1). Von Culin et al. found that individuals who pursued happiness through
engagement were had higher grit scores (β = .34, p < .001). Grit related less to the
happiness orientation of meaning (β = .15, p < .001) and even lower to the happiness
orientation of pleasure (β = -.10, p < .001). Von Culin et al. (2014) found the pursuit of
engagement, as opposed to pleasure, comprised motivational correlates of grit.
55
Section Summary
The inclusion of the four theories above to grit is meant to provide a background
and describe how existing theories are being explored in connection to grit. Deliberate
practice, resilience, self-control, and engagement have all been researched and fit into the
proposed model by Duckworth et al. (2007) based on mediating terms of persistence,
adversity, engagement, and time. Research suggests that grit offers something unique that
is not captured by these other constructs. This section provided further evidence of the
development of grit and a visual presentation of the fit within theory.
Background Characteristics’ Impact on
College Success
In this study, I focused on determining if grit can assess outcomes for college
students during the first year beyond traditional measures of cognitive ability. It is
important to identify a number of student background characteristics that also play an
important role in the success of a college student. This study controlled the following
background demographics to isolate the effectiveness that grit has on predicting future
academic success. The characteristics of interest for this study include gender, ethnicity,
socio-economic status, and parental education. Each of these variables is discussed in
greater details below and the relevance to this study is shared.
Gender
A complicated issue facing colleges and impacting college admissions is
inconsistent outcomes of men and women at the college level. A study by Corbett, Hill,
and Rose (2008) found that women attend and graduate from college at higher rates than
men. Graduation rates have been reported as being 20% higher for women than men
(Hagedorn, 2005). It is also well recognized in the literature that women persist at greater
56
rates than men (Reason, 2009). Keels (2013) reported that women make up a majority of
enrollment in higher education at 57% compared to men but ratios vary depending on
type of campus. For example, highly selective campuses tend to have nearly equal
representation of men and women while liberal arts and less selective colleges are more
heavily skewed toward women (Keels, 2013).
Although research has shown the effect of SAT/ACT scores and HSGPA on
predicting academic performance, outcomes vary based on gender (Chee, Pino, & Smith,
2005). There currently is not enough evidence to make the same claim about grit and
gender. How grit interacts with gender in predicting future behavior is unknown at this
time. I question the extent that proactive support could be implemented if differences
were found. Of course, admissions decisions cannot be based on gender but the
information could be useful from a campus perspective.
Race/Ethnicity
Grit has grown in prominence in K-12 education and curriculum and policies have
been created and developed based on grit literature (Almeida, 2016). Research has shown
the probability of degree completion (DesJardins, Ahlburg, & McCall, 2002) and the
effect of SAT/ACT scores and HSGPA have on predicting college performance
(Culpepper & Davenport, 2009) varies based on race. It is important to critically assess
the value of reporting differences in race and grit while managing not to explain the
differences with a deficiency thinking mindset. A main purpose of the current study was
to draw further attention to the inequities of access to higher education with the continued
use of metrics that marginally explain success in higher education. As of this writing,

57
only one study by Strayhorn (2013) specific to grit, race/ethnicity, and college student
performance has been identified.
Strayhorn (2013) collected data for a study in 2008 to determine if grit could help
predict academic success for Black males at a predominantly White institution (PWI). A
survey was administered to 140 Black males who were enrolled full time at a large, PWI,
in the southeastern region of the country. Sixty-one percent of participants were first
generation. The survey consisted of a researcher developed instrument called the Black
Male Student Success Questionnaire (BMSSQ) and the Short Grit scale (Grit-S). The
study found that Black males with higher grit scores earned higher grades in college than
their same-race male peers with lower grit scores. Although Strayhorn’s (2013) study
findings were positive, I am uncertain about the contributions to literature if grit is found
to affect academic outcomes differently by race/ethnicity.
Socio-Economic Status
Access to higher education is often confounded in the ability to pay for education.
Fortunately, often aid packages are geared towards students from low-income households
with limited means. For institutions that have a large proportion of Pell-eligible students,
this variable is worth investigating further to determine grit levels for overcoming
challenges and dealing with adversity.
In a meta-analytic inquiry to categorize and test psychosocial study skill factors
and traditional factors on academic performance and retention behavior, Robbins et al.
(2004) found that socio-economic status (SES) had a small but statistically significant
correlation as a predictor of retention (r = .212) and was an equally minimal predictor of
college GPA (r = .155). Sternberg et al. (2012) posited that if colleges make decisions

58
largely on test scores (which are highly correlated to SES), then the chances of
maintaining an equitable admissions process are reduced. Klepfer and Hull (2012)
identified SES as a highly predictive factor when looking at college persistence. Students
at four-year institutions from the highest SES quintile persisted at 94% compared to
students from the lowest SES quintile who persisted at 79% (Klepfer & Hull, 2012).
While potentially eliminating the reliance on standardized test scores for purposes of
admissions, the correlation between HSGPA and SES is also high (Zwick & Green,
2007) which further confounds the impact that SES has on access to college. Studies on
grit have not considered or reported on the influence that SES has on academic
achievement and the potential for providing predictive ability across socioeconomic
status.
First-Generation Status
Research to connect grit as a mediating factor to parental education and student
success is limited. In a study by Black (2014), grit did not mediate the relationship
between parent education and college GPA. The belief of Black was, “parents may not
have socialized their students toward positive grit beliefs and behaviors, leading to a lack
of protection for students of less educated parents” (p. 32). I would like to examine if
students who are first-generation college students has an effect on the level of grit
observed in participants across demographics and academic success.
Section Summary
The four demographic variables included in the current study represent segments
that have not been thoroughly researched within grit literature. The current study was
designed to provide additional insight on each segment and importance of considering
59
additional factors in admission that would provide a more equitable review to improve
access for marginalized populations. Further research of each of these sub-populations
will contribute to the existing literature on grit.
Summary
Chapter II provided a review of the literature in four key areas. A section on pre-
college academic indicators provided the basis for current practice, and offered some
challenges that continuing the same practices place on higher education, specifically in
the fair and equitable review of admission applications for diverse populations. A review
of noncognitive variables research was provided. There is value to consider and include
NCVs in admission as a way to acknowledge skills and talents in an applicant that
traditional cognitive measures ignore. These characteristics have been shown to predict
student success as well as or equal to traditional measures while diversifying the
applicant pool. A section on grit provided a background on the development and
validation of the construct and an overview of existing literature was reviewed.
A major gap in the literature is the applicability of using grit on a more traditional
college population. Existing studies have been completed at elite private campuses,
military colleges, spelling bee competitions, and on adults. The current study examined
the predictability of grit at a traditional campus that would be more representative of
college students and a population similar to future expected growth in higher education.
The final section offered a review of demographics and connection to grit and concluded
with current research on grit and college students. A gap in the literature exists due to
limited reporting on differences in grit within populations across demographics.
60
Higher education institutions use a range of criteria to evaluate candidates for
admission. As shown above, the primary indicators of HSGPA and standardized test
scores alone predict a fraction of the potential outcomes for students. A large portion of
unexplained variance exists when predicting first-year success, retention, and graduation.
Further research is necessary to determine if grit could be utilized as an admission
criterion with increased predictive ability of students.

61
CHAPTER III
METHODOLOGY
Purpose of the Study and Research
Questions
The purpose of this study was to explore if grit, a noncognitive variable, predicted
academic success beyond standardized test scores (i.e., American College Test [ACT]
and Scholastic Aptitude Test [SAT]) and high school grade point average (HSGPA). For
the purposes of this study, academic success is defined as first-year college grade point
average (FYGPA), first semester persistence (FSP), and first-year retention (FYR) to the
college. The following research questions were addressed in this study:
Q1 To what extent does grit explain 1st-year college GPA when controlling
for background characteristics and pre-collegiate academic factors?
Q2 To what extent does grit predict retention to second semester when
controlling for background characteristics and pre-collegiate academic
factors?
Q3 To what extent does grit predict retention to second year when controlling
for background characteristics and pre-collegiate academic factors?
Research Hypotheses
The literature review provided examples of a relationship between grit and
college success for specific populations; however, it is unclear as to the importance of the
relationship and how grit and academic success may be connected to students’
background characteristics. This study was conducted with the following hypotheses:

62
H1 There will be a positive relationship between grit and first semester
persistence while controlling for students’ background characteristics of
gender, socio-economic status, race/ethnicity, parental education and pre-
collegiate academic factors. Individuals with a higher grit score will have
a greater likelihood of first semester persistence.
H2 There will be a positive relationship between grit and first-year college
GPA while controlling for students’ background characteristics of gender,
socio-economic status, race/ethnicity, and parental education and pre-
collegiate academic factors. Individuals with a higher grit score will have
a higher first-year college GPA.
H3 There will be a positive relationship between grit and first-year retention
while controlling for students’ background characteristics of gender,
socio-economic status, race/ethnicity, parental education, and pre-
collegiate academic factors. Individuals with higher grit scores will have a
greater likelihood of first-year retention.
H4 There will be a positive relationship between HSGPA and academic
performance (FYGPA, FSP, and FYR) while controlling for students’
background characteristics of gender, socio-economic status,
race/ethnicity, and parental education. Individuals with higher HSGPA
will have higher likelihood of first-year persistence, higher first-year GPA,
and higher likelihood of first-year retention.
H5 There will be a positive relationship between standardized test scores
(SAT/ACT) and academic performance (FYGPA, FSP, and FYR) while
controlling for students’ background characteristics of gender, socio-
economic status, race/ethnicity, and parental education. Individuals with
higher standardized test score will have higher likelihood of first-year
persistence, higher first-year GPA, and higher likelihood of first-year
retention.
Research Design and Procedures
The research questions were designed to determine if grit can be a predictive
variable to better understand persistence, retention, and college academic performance.
This research was conducted as a longitudinal non-experimental design utilizing a survey
to collect a mean grit score. Student demographic variables, pre-collegiate academic
indicators, and college success metrics were collected using institutional data provided by
the college’s institutional research department. Survey research affords investigators the
63
opportunity to administer a survey to a sample or to an entire population of people to
describe attitudes, opinions, behaviors, or characteristics of the population (Creswell,
2008).
Pinsonneault and Kraemer (1993) identified three distinguishing features of
survey research. The first is that survey research is used to quantitatively describe
specific aspects of a given population often times examining the relationships among
variables and/or differences between groups. The second is that the data are subjective
because they are collected from people and the third feature is that survey research uses a
selected portion of the population from which the findings can later be generalized back
to the population. Survey research can be primarily used to identify relationships between
variables or by projecting the findings of a sample toward a greater population
(Pinsonneault & Kraemer, 1993).
Study Site
The study site was a mid-size public institution, categorized by the Carnegie 2015
classification as a Doctoral University located in the western region of the U.S. The
institutional undergraduate profile consists of 37% first generation students, 30%
identified as students of color, 28% low income (Pell eligible), and 88% enrolled full-
time. The academic profile of the most recent entering cohort from high-school had a
mid-50% GPA range of 3.0 to 3.8, ACT composite scores of 19 to 24, and SAT
composites of 940 to 1180 for the math and critical reading sections on the old SAT. The
site of the current study is unique to this type of study as prior research has primarily
been focused on private, highly selective institutions such as University of Pennsylvania,
64
University of Miami, and West Point Military Academy. For the purposes of this study,
the host institution will be known as Mountain States University (MSU).
Participants
The accessible population for this study was from the cohort entering college for
the first time in fall 2016. This cohort was selected to identify if grit has predictive value
in first-year college GPA, retention to second semester, and retention to second year.
Invitations to participate were sent to all first time students entering in the fall of 2016
regardless of their current enrollment status. Respondents include students who are
currently enrolled at the study site as well as students who left during or at the completion
of the first semester. In an effort to better understand the implications of grit across
demographics related to the research questions, it was desired to sample the entire 2016
entering cohort. This study intentionally included the entire cohort instead of a sample
with the desire to collect enough responses to find significance across a number of
demographic variables. Additionally, the use of an existing survey distributed to the
entire cohort was convenient to achieve the desired response rates and number of
responses. Prior research on grit utilizing a similar measure has primarily focused on
White, non-first-generation students, from highly selective academic institutions. This
research will help fill a void in the current literature related to a more diverse population.
The fall 2016 cohort had 2,052 first time, full-time students. A survey was
administered in February 2017 to 1,807 (88.1%) students enrolled at MSU in the spring
of 2017 and to 245 (11.9%) students no longer enrolled. Of the fall 2016 cohort, 544
students completed the grit short scale survey for an overall response rate of 26.51%.
Students who were enrolled in spring 2017 accounted for 513 (94.3%) respondents. This
65
sample was predominantly female (n = 409; 75.2%), White (n = 372; 68.4%), not Pell
eligible (n = 387; 71.1%), and not first generation (n = 348; 64.0%). The sample had an
average HSGPA of 3.47 (SD = .441) and a standardized test score of 23.11 (SD = 4.04)
on the ACT. The following sub-sections provide further detail regarding the specific
demographics of the sample.
Table 2 shows frequency by gender, ethnicity, Pell eligibility, and first generation
status for the population and sample. To determine if the students completing the grit
scale differed from the full cohort on key demographic characteristics, I conducted χ2
tests of independence. A χ2 tests of independence is used to test statistical independence
between two or more variables (Wagner, 2016). An alpha level of .05 was utilized for chi
square tests of independence. When comparing the differences between the two groups
(responders and non-responders), the χ2 tests of independence identified that females
were over-represented while students of color, Pell eligible, and first generation students
were under-represented in the sample. Additional descriptive statistics are shown in Table
3 for the 513 responders who were enrolled at MSU at time of Grit-S completion and the
31 responders who were no longer enrolled at MSU at time of Grit-S completion. As
shown in Table 3, the proportion of responders were weighted heavily toward students
enrolled in the spring semester. This proportionate difference ended up having an
influence on the analysis and is described in detail in Chapter IV.
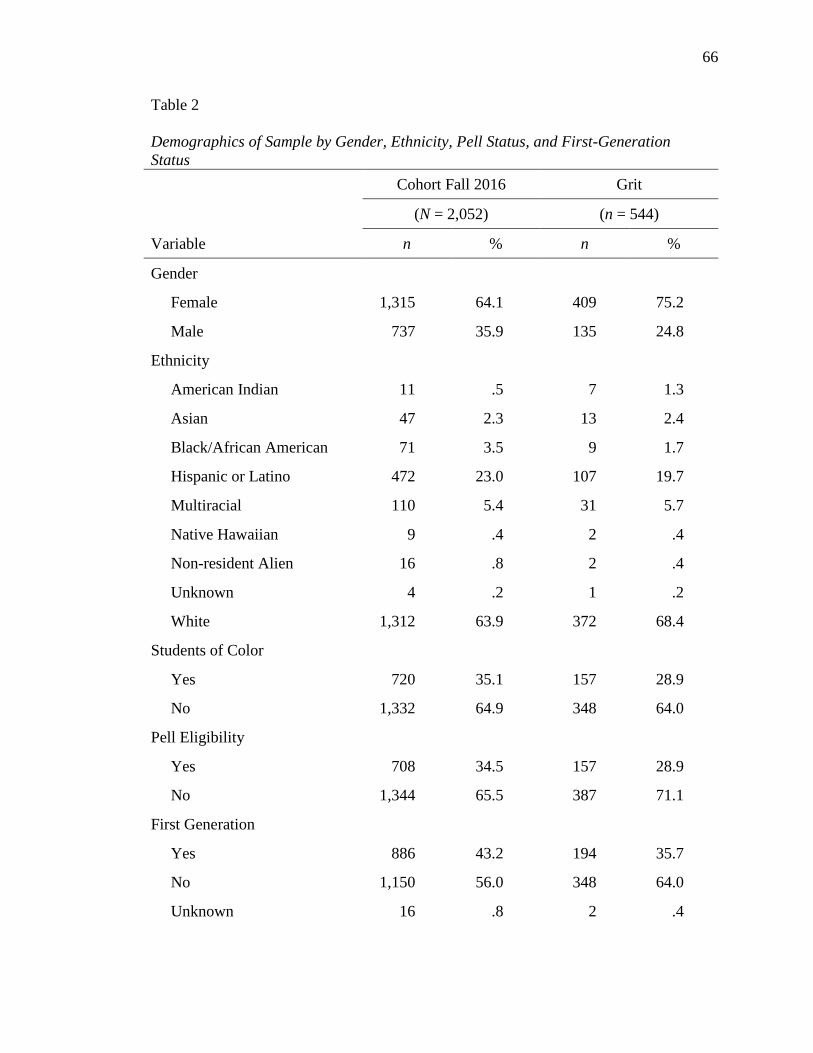
66
Table 2
Demographics of Sample by Gender, Ethnicity, Pell Status, and First-Generation
Status
Cohort Fall 2016 Grit
(N = 2,052) (n = 544)
Variable n % n %
Gender
Female 1,315 64.1 409 75.2
Male 737 35.9 135 24.8
Ethnicity
American Indian 11 .5 7 1.3
Asian 47 2.3 13 2.4
Black/African American 71 3.5 9 1.7
Hispanic or Latino 472 23.0 107 19.7
Multiracial 110 5.4 31 5.7
Native Hawaiian 9 .4 2 .4
Non-resident Alien 16 .8 2 .4
Unknown 4 .2 1 .2
White 1,312 63.9 372 68.4
Students of Color
Yes 720 35.1 157 28.9
No 1,332 64.9 348 64.0
Pell Eligibility
Yes 708 34.5 157 28.9
No 1,344 65.5 387 71.1
First Generation
Yes 886 43.2 194 35.7
No 1,150 56.0 348 64.0
Unknown 16 .8 2 .4

67
Table 3
Demographics of Sample Responders by Enrollment Status
Enrolled Spring 2017
Non-Enrolled
Spring 2017
(n = 513) (n = 31)
Variable n % n %
Gender
Female 388 75.6 21 67.7
Male 125 24.4 10 32.3
Ethnicity
American Indian 5 .5 2 6.5
Asian 13 2.5 0 0.0
Black/African American 9 1.8 0 0.0
Hispanic or Latino 101 19.7 6 19.4
Multiracial 29 5.7 2 6.5
Native Hawaiian 2 .4 0 0.0
Non-resident Alien 1 .2 1 3.2
Unknown 1 .2 0 0.0
White 352 68.6 20 64.5
Students of Color
Yes 159 31.0 10 32.3
No 354 69.0 21 67.7
Pell Eligibility
Yes 147 28.7 10 32.3
No 366 71.3 21 67.7
First Generation
Yes 183 35.7 11 35.5
No 329 64.1 19 61.3
Unknown 1 .2 1 3.2

68
Gender. Gender was collected on a binary scale of male and female due to the
application for admission being restricted. For the overall cohort, 64.1% (n = 1,315) of
the students were female and 35.9% (n = 737) were male. When examining the sample of
students who responded to the Grit-S survey, 75.2% (n = 409) were female and 24.8% (n
= 135) were male. Females were over-represented among responders by about 11%. The
proportion difference between the grit sample and the 2016 fall cohort population showed
a statistically significant difference between the sample and population by gender (χ2 [1,
N = 2,052] = 39.63, p < .001).
Ethnicity. The ethnicity of the cohort was 63.9% (n = 1,312) White, 23.0% (n =
472) Hispanic or Latino, 5.4% (n = 110) multiracial, 3.5% (n = 71) Black or African
American, 2.3% (n = 47) Asian, .5% (n = 11) Native American, .4% (n = 9) Native
Hawaiian, and 1.0% (n = 20) reported non-resident alien or unknown. When considering
grit responders, the ethnicity was 68.4% (n = 372) White, 19.7% (n = 107) Hispanic or
Latino, 5.7% (n = 31) multiracial, 1.7% (n = 9) Black or African American, 2.4% (n =
13) Asian, 1.3% (n = 7) Native American, .4% (n = 2) Native Hawaiian, and .6% (n = 3)
reported non-resident alien or unknown. White students were over-represented in the
population of responders by about 4.5%. The proportion difference between the grit
sample and the 2016 fall cohort population showed a statistically significant difference
between the sample and population by students of color (χ2 [1, N = 2,052] = 5.26, p =
.022).
Pell eligibility. Pell eligibility is defined as anyone who is Pell eligible according
to federal expected family contribution guidelines. For the cohort group, 34.5% (n = 704)
students were Pell eligible while 65.5% (n = 1,344) were not Pell eligible. Of the students

69
who completed the grit scale, 28.9% (n = 157) were Pell eligible while 71.1% (n = 387)
were not Pell eligible. Non-Pell eligible students were over-represented in the population
of responders by nearly 6%. The proportion difference between the grit sample and the
2016 fall cohort population showed a statistically significant difference between the
sample and population by Pell eligibility (χ2 [1, N = 2,052] = 10.43, p = .001).
First-Generation status. First generation status was collected through a self-
report item at time of application to the University. For the fall cohort, 43.2% (n = 886)
reported being a first generation student while 56% (n = 1,150) reported not being a first
generation student. Grit responders who identified as first generation were found to be
35.7% (n = 194) of the sample while 64.0% (n = 348) were not first-generation students.
First-generation students were under-represented in the population of responders by
7.5%. The proportion difference between the grit sample and the 2016 fall cohort
population showed a statistically significant difference between the sample and
population by first generation status (χ2 [1, N = 2,036] = 17.93, p < .001).
Procedures
To begin the research, I submitted a research proposal to the institution’s
Institutional Review Board (IRB). This research had limited foreseeable risks to the
participants and was categorized as an expedited review which involves minimal risk
defined by the IRB as, “Minimal risk means that the probability and magnitude of harm
or discomfort anticipated in the research are not greater in and of themselves than those
ordinarily encountered in daily life or during the performance of routine physical or
psychological examinations or tests” (Office of Sponsored Programs, 2014, p. 10). The
type of data collected was not of a sensitive nature and should not create concern.

70
MapWorks® First-Year Transition
Survey
One form of data collection for this research study was the use of MapWorks®
First Year Transition Survey that is administered on an annual basis by the MSU’s
housing office. The Grit-S survey was attached to the end of the MapWorks® survey and
sent to all students who were currently enrolled at MSU from the fall cohort (n = 1,807).
Included with the questionnaire was a copy of the consent form for participation. The
decision to integrate the Grit-S scale into an existing survey was based on allowing the
greatest opportunity of achieving a high response rate. There was concern about
administering a separate survey around the same general timeline of MapWorks® and not
receiving a high enough response rate to facilitate the necessary data analysis of this
study. It is important to establish a high response rate in survey research to support
generalizable findings (Creswell, 2008; Groves et al., 2009).
The housing office at MSU administered the MapWorks® survey with the
additional eight Grit-S questions attached to all first-year students from the 2016 cohort
who were still enrolled in the second semester. Recipients included students who were
living in the residence halls and students living off-campus. Distribution of the survey
began the fourth week of classes in the spring semester and concluded the sixth week of
classes. The survey was web-based and students received instructions and an invitation to
participate through an email from the director of their living community. Housing staff
worked diligently to accomplish a high response rate including pre-survey advertisements
in all forms (word of mouth, electronic, poster, etc.). The survey was expected to take
between 30 and 45 minutes to complete depending on individual responses, which may
lead to additional branching questions. The grit specific questions were expected to take
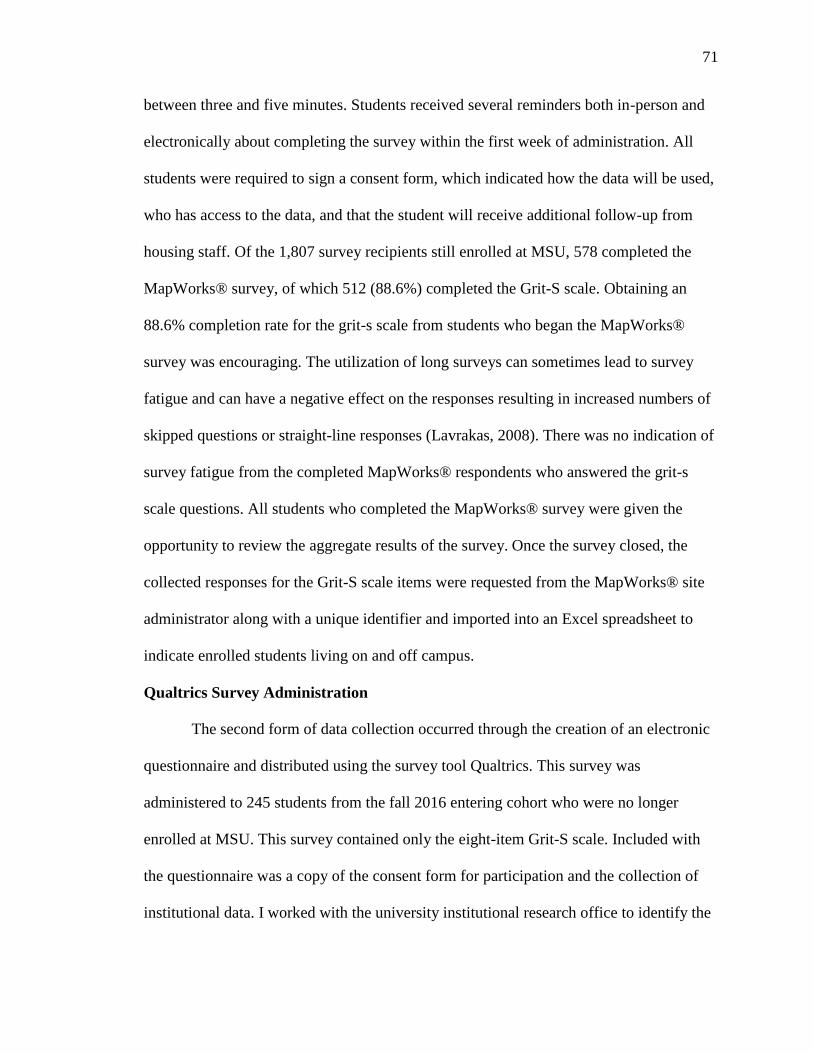
71
between three and five minutes. Students received several reminders both in-person and
electronically about completing the survey within the first week of administration. All
students were required to sign a consent form, which indicated how the data will be used,
who has access to the data, and that the student will receive additional follow-up from
housing staff. Of the 1,807 survey recipients still enrolled at MSU, 578 completed the
MapWorks® survey, of which 512 (88.6%) completed the Grit-S scale. Obtaining an
88.6% completion rate for the grit-s scale from students who began the MapWorks®
survey was encouraging. The utilization of long surveys can sometimes lead to survey
fatigue and can have a negative effect on the responses resulting in increased numbers of
skipped questions or straight-line responses (Lavrakas, 2008). There was no indication of
survey fatigue from the completed MapWorks® respondents who answered the grit-s
scale questions. All students who completed the MapWorks® survey were given the
opportunity to review the aggregate results of the survey. Once the survey closed, the
collected responses for the Grit-S scale items were requested from the MapWorks® site
administrator along with a unique identifier and imported into an Excel spreadsheet to
indicate enrolled students living on and off campus.
Qualtrics Survey Administration
The second form of data collection occurred through the creation of an electronic
questionnaire and distributed using the survey tool Qualtrics. This survey was
administered to 245 students from the fall 2016 entering cohort who were no longer
enrolled at MSU. This survey contained only the eight-item Grit-S scale. Included with
the questionnaire was a copy of the consent form for participation and the collection of
institutional data. I worked with the university institutional research office to identify the
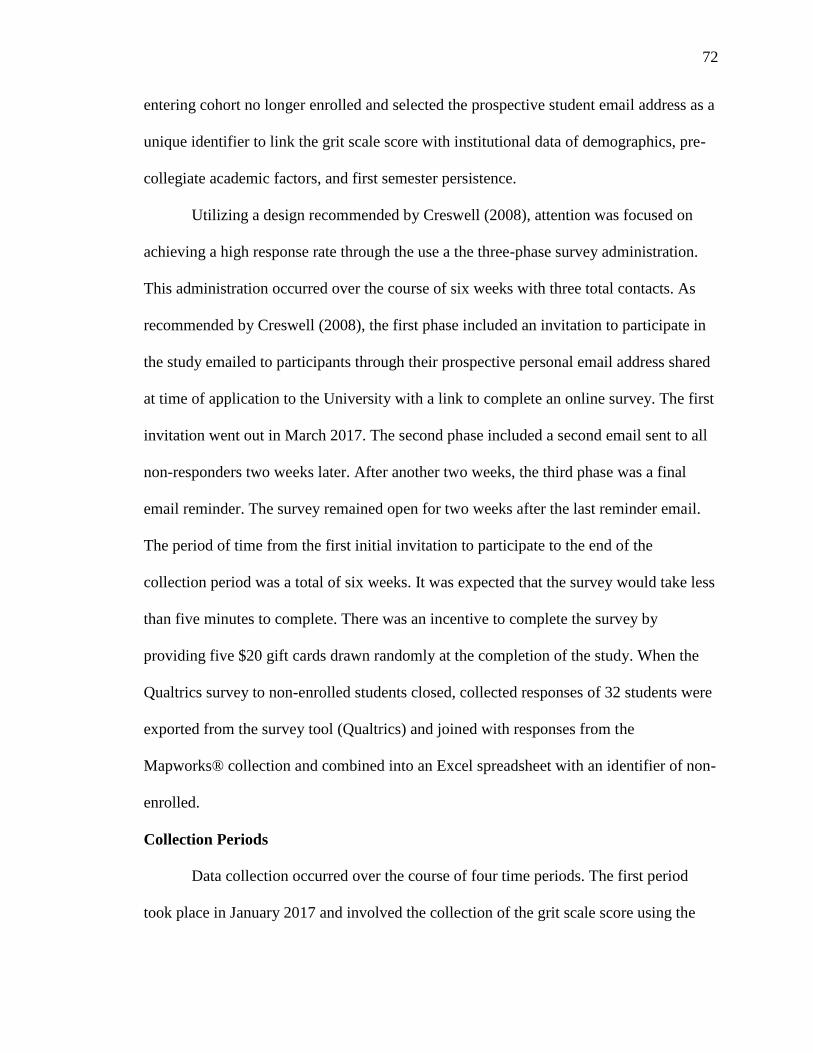
72
entering cohort no longer enrolled and selected the prospective student email address as a
unique identifier to link the grit scale score with institutional data of demographics, pre-
collegiate academic factors, and first semester persistence.
Utilizing a design recommended by Creswell (2008), attention was focused on
achieving a high response rate through the use a the three-phase survey administration.
This administration occurred over the course of six weeks with three total contacts. As
recommended by Creswell (2008), the first phase included an invitation to participate in
the study emailed to participants through their prospective personal email address shared
at time of application to the University with a link to complete an online survey. The first
invitation went out in March 2017. The second phase included a second email sent to all
non-responders two weeks later. After another two weeks, the third phase was a final
email reminder. The survey remained open for two weeks after the last reminder email.
The period of time from the first initial invitation to participate to the end of the
collection period was a total of six weeks. It was expected that the survey would take less
than five minutes to complete. There was an incentive to complete the survey by
providing five $20 gift cards drawn randomly at the completion of the study. When the
Qualtrics survey to non-enrolled students closed, collected responses of 32 students were
exported from the survey tool (Qualtrics) and joined with responses from the
Mapworks® collection and combined into an Excel spreadsheet with an identifier of non-
enrolled.
Collection Periods
Data collection occurred over the course of four time periods. The first period
took place in January 2017 and involved the collection of the grit scale score using the

73
Mapworks® survey administration for students who were enrolled in spring 2017. This
administration went out to 1,807 students from the fall 2016 cohort who returned to the
institution for the spring 2017 semester.
The second collection period occurred in March 2017 with institutional research
providing contact information for 245 students who did not return to the university for
spring 2017. This list included primary email address, pre-collegiate academic factors of
HSGPA and standardized test scores, demographic variables of gender, ethnicity, first
generation status and Pell eligibility, and the students fall term grade point average. This
list was used to survey non-enrolled students in an effort to obtain their grit scale score.
Administration of the Qualtrics survey to the 245 students who were not enrolled for
spring 2017 commenced and data collection concluded in April 2017.
In May 2017, institutional research provided a complete fall 2016 cohort file of
the 1,807 students enrolled as of census in spring 2017. This file included demographic
variables of gender, ethnicity, first generation status, and Pell eligibility; pre-collegiate
academic factors of HSGPA and standardized test scores; and college academic metrics
of fall 2016 grade point average and spring 2017 grade point average. The final period of
data collection occurred in September of 2017 with the collection of retention data for the
fall 2016 cohort and indicated which students returned to the university for their second
year.
Instrumentation
To operationalize this study, demographic data, pre-collegiate academic factors,
and college academic success variables were collected through institutional research
while grit was gathered utilizing the eight item Grit-S scale developed by Duckworth and
74
Quinn (2009). To help ensure a response rate that produced the necessary data for
analysis, the eight items were attached as the last set of questions on the MapWorks®
First Year Transition Survey, which is an existing survey administered by Mountain
States University (MSU). Both surveys are discussed in greater detail below.
Dependent Variables
Dependent variables (DV) for this study include first-year college GPA, first-
semester persistence, and first-year retention and are referred to as college academic
success factors. Each variable was obtained through the institution’s institutional research
office. First-year college GPA and first semester persistence was collected at the end of
spring semester and first-year retention data was collected at census date of the fall 2017
semester.
Demographics
For the purposes of this study, four demographic variables were collected through
institutional research and are among the independent variables in the current study. Data
were institutional data that had been self-reported by each student to the institution at
time of application and include ethnicity, gender, and first generation college student
status. Socio-economic status was collected through institutional data by identifying if a
student was Pell eligible. To determine which students were Pell eligible, institutional
research provided a “Y” indicator for any student who met the requirements to be
considered Pell eligible and was recorded as: Y = Yes and N = No. Ethnicity was
collected using federal values and recorded as: 1 = American Indian or Alaska Native, 2
= Asian, 3 = Black or African American, 4 = Hispanic or Latino, 5 = Native Hawaiian or
Other Pacific Islander, 6 = White, 7 = Multiracial, 8 = Non-resident Alien, or 9 =
75
Unknown. Gender was limited to a binary variable on the application and included
female and male and was recorded as: F = female and M = male. The binary option was a
limitation as analysis of students who do not identify as either were forced into answering
on the binary scale. To identify if a student was a first-generation college student,
responses were collected to a question from the admission application that asked each
applicant at time of application if either parent had completed a college degree and was
recorded as: N = No and Y = Yes.
Pre-Collegiate Academic Factors
High school grade point average (HSGPA) and standardized test scores, which
served as two of the independent variables in the current study, were requested and
provided by institutional research. HSGPA was reported on a 4.0 scale and based on
admission records from time of admission to the institution. Standardized test scores
include either the ACT, SAT (test taken prior to March 2016), or the Revised SAT (test
taken after March 2016) and were requested and provided by institutional research. The
ACT score was reported as a composite score with a range of 12 to 34 for the sample.
The SAT was reported as a combined score for the SAT math and SAT verbal sections
for tests taken prior to March 2016 with a range of 590 to 1470 and a combined score of
the Revised SAT Evidence Based Reading and Writing and Revised SAT Math for tests
taken after March 2016 with a range of 880 to 1350.
For data analysis purposes, a new field (standard scale) was computed to
standardize test scores across testing service and concordant to the comparable ACT
composite score (ACT Research & Policy, 2009). Redesigned SAT scores (RSAT) do not
have a concordance to ACT as of the writing of this dissertation. Of the 12 students who

76
submitted a RSAT score, 10 also submitted either an ACT or SAT score. The 2016 first
year cohort consists of 2,052 students of which a concordance test score for 2,036
(99.2%) was available for analysis.
College Academic Success Factors
Three academic success measures, which were the dependent variables for the
current study, were collected and include: (a) persistence from first semester to second
semester, (b) first-year college grade point average, and (c) retention from first fall
enrollment to second fall enrollment. If a student persisted to spring semester,
institutional research reported a “Y” for each student which was recorded as: Y = Yes
and N = No. If a student was retained to the second year, a “Y” was provided and coded
as: Y = Yes and N = No. A fall grade point average was provided for all students who
recorded a first-semester grade point average. A cumulative grade point average of the
entire first year was collected for students who completed their first year of study.
Grit
I utilized an existing measure developed by Duckworth and Quinn (2009) titled
the Short Grit Scale (Grit-S) which is a Likert-type measure to measure the primary
independent variable of interest: grit. The general construct of grit is defined as,
“perseverance and passion for long-term goals” (Duckworth et al., 2007, p. 1087). The
intended purpose of the instrument is to determine if incremental value could be found to
illustrate personal characteristics of individuals to stick with an activity or interest for a
long period of time in overcoming challenges and adversity. The result of the Grit-S scale
combined with traditional application requirements such as high school grade point
average (HSGPA) and standardized test scores can be more accurate measures of

77
predicting a student’s success (Duckworth et al., 2009). Examples of existing research
that utilized the Grit-S scale with published response rates are first-year West Point
cadets (99.6%; Duckworth et al., 2007), high-achieving students at an Ivy League college
(39.7%; Duckworth et al., 2007), contestants in the national spelling bee (64%;
Duckworth et al., 2007), and Black males at a predominantly White institution (51%;
Strayhorn, 2013).
The Grit-S scale is a revised version of the Grit scale and consists of eight items.
Duckworth and Quinn (2009) conducted a confirmatory factor analysis (CFA) on the
Grit-S scale tested on four samples engaged in a variety of challenging domains across
differing age groups which included West Point students, national spelling bee
participants, ivy league undergraduates, and predictive validity for career changes among
adults. They reported that their analysis on the Grit-S scale showed adequate internal
consistency with Cronbach’s alpha ranging from .73 to .83 across the four samples.
Consistency of Interest was reported with an internal consistency for alphas ranging from
.73 to .79 while Perseverance of Effort reported alpha values ranging from .60 to .78.
Scores on the revised Grit-S research supported a two factor structure in which
Consistency of Interest and Perseverance of Effort were moderately intercorrelated, r =
.59, p < .001 (Duckworth and Quinn, 2009). In a separate longitudinal study of high-
achieving, middle and high school students, Duckworth and Quinn reported a test-retest
stability coefficient of the Grit-S as r = .68 one-year after the original test with an internal
consistency at both the 2006 and 2007 assessments of αs = .82 and .84, respectively. The
psychometric analyses conducted by Duckworth and Quinn (2009) were tested on four
samples to validate the Grit-S scale.

78
The response format of the Grit-S scale is a Likert-type scale (1-5) with the
response options ranging from very much like me, mostly like me, somewhat like me, not
much like me, and not at all like me. There are eight individual items on the Grit-S scale
that consist of statements like, “Setbacks don’t discourage me” and “I finish whatever I
begin.” It is important to note that half of the items are reverse coded and are further
discussed later. The scores are summed and divided by the number of items to develop a
mean grit score with possible scores ranging from 1 to 5. This grit score was used in the
analysis to determine if grit can predict the outcome variables. Permission to utilize the
Grit-S scale is granted through the creator’s website for non-commercial uses.
Data Analysis
Prior to merging data from all sources (grit scale and institutional data), individual
student records were coded by response population: (a) assigned to respondents enrolled
in spring 2017 and (b) assigned to respondents no longer enrolled at Mountain States
University as of spring 2017. Demographic information (variables of gender, ethnicity,
1st-generation status, and Pell eligibility), persistence data for first semester and first-year
college GPA at the end of the spring semester was requested from Institutional Research
and joined into the data set using the unique variable.
Once the Grit-S responses and the demographic data were joined, the data were
analyzed using SPSS version 24.0 to review descriptive statistics and frequency
distributions. This is an important step to verify that data were entered correctly and
make necessary corrections to the data set. At this point, item transformation was
completed to recode reverse worded items, create dummy variables, and compute the
mean of the grit items to develop a composite grit score.

79
Ethnicity data were entered into SPSS by ethnicity group and coded into a new
category of “Student of Color” (SOC). The combined category of SOC include students
from ethnicities of American Indian or Alaska Native, Asian, Black or African American,
Hispanic or Latino, Multiracial, and Native Hawaiian. For the category SOC, dummy
variables were created and coded as “1” for students of color and “0” for all others
including White, non-resident alien, and unknown. Pell eligible students were entered
into SPSS as a “Y” or “N” for group membership and dummy coded “1” for Pell eligible
and “0” for not Pell eligible for regression analysis. First generation status was entered
into SPSS as a “Y” or “N” for group membership and dummy coded “1” for first
generation and “0” for not first generation for regression analysis.
Prior to computing the grit mean, I ran reliability and item analysis using
Cronbach’s alpha. Because this was an existing measure with evidence of reliability and
validity in other samples, I did not expect there to be reliability or item analysis concerns
in the current sample which would require dropping items to improve reliability;
however, as with any type of descriptive statistic for sample responses, I estimated
reliability for the current sample. Tests of significance used alpha of .05 throughout this
study in statistical analysis. This is a common significance level for social science
research that states with a 95% confidence level that the observed outcome would happen
again.
Confirmatory Factor Analysis
While a confirmatory factor analysis had been previously conducted on data from
the Grit-S scale (Duckworth & Quinn, 2009), I also performed a confirmatory factor
analysis (CFA) to observe if the demonstrated factor structure maintained on this sample.
80
Recommendations of sample size range from 50 participants to 300 or more to conduct a
CFA (Furr, 2011). I used LISREL 8.8 to conduct the CFA. This analysis was chosen to
determine if the measure is compatible with the sample and determine whether or not the
latent variables are correlated and if items load on each latent variable in the expected
pattern. To test the factor structure, I performed the CFA by selecting the two latent
variables of consistency of interest and perseverance of effort from Duckworth and Quinn
(2009) and specifying the eight items on the two factors (four items each) according to
the hypothesized factor structure. It is important to determine construct validity of the
model to ensure it is measuring the two factors as theory suggests.
The next step was to assess the goodness of fit using a Comparative Fit Index
(CFI, Bentler, 1990). Values range from 0 to 1 and a value of .95 or higher suggests a
good fit (Bentler, 1990). Additional measures of fit include the chi-squared test and a test
of residuals. A chi-squared probability greater than or equal to a .05 would have an
acceptable model fit (Suhr, 2006). To assess the residuals in the model, a Root Mean
Square Error of Approximation (RMSEA) was examined. Suhr (2006) shared that values
range from 0 to 1 with a smaller RMSEA value indicating a better level of fit. An
acceptable model fit for RMSEA values is less than .06 (Hu & Bentler, 1999). Additional
fit indices exist and could be considered such as Incremental Fit Index (IFI) and Non-
normed Fit Index (NNFI; Furr, 2011). Furr (2011) also noted that dismissal of chi-square
findings for CFA is fairly common while incremental fit indices may be more appropriate
depending on sample size. The results from the CFA are shared in Chapter IV.
81
Regression Diagnostics
The data collected were tested for problems that may affect findings using various
diagnostic techniques for regression. Within regression, there are a number of
assumptions to assess prior to interpreting the results. According to Osborne and Waters
(2002), there are four assumptions to be aware of in regression analysis. The first
assumption is that residuals are normally distributed. This can be checked by visual
inspection of normal probability plots and/or histograms of residuals and review of skew
and kurtosis values to identify non-normality. A second assumption is that a linear
relationship exists between dependent and independent variables. One way to determine
if non-linearity exists is to observe scatterplots of residuals versus predicted values
(Osborne & Waters, 2002). A third assumption is that variables are measured without
error. The effects of less than perfect reliability become more complex as additional
independent variables are added to the model (Osborne & Waters, 2002). Osborne and
Waters (2002) reported that when variance is not apportioned correctly as additional
independent variables are added to the model, the potential for Type II errors increases
for variables with poor reliability and Type I errors for other variables in the equation.
And finally there exists the assumption of homoscedasticity which means that all
independent variables have the same variance of errors across all levels of the
independent variables. One way to observe this assumption is through a scatterplot of
standardized residuals versus predicted values to look for random scattering to suggest
the assumption has been satisfied. Diagnostics that were utilized to assess the
assumptions include an examination of normality of residuals with a histogram and P-P
plot and the review of a residual scatterplot. The residual scatterplot helped to diagnose

82
homoscedasticity and linearity of the residuals. Neither the assumption of normality of
the residuals nor the assumption of homoscedasticity appeared to be violated.
Binary Logistic Regression Diagnostics
Either logistic regression or probit regression are analysis options for
dichotomous variables in large samples as each analysis tends to give similar results
(Kline, 2016). A logistic regression has different assumptions than ordinary least squares
regression. The assumptions for a binary logistic regression are that the dependent
variable is binary, the model is fitted correctly, the error terms need to be independent,
linearity of independent variables, and large sample sizes (Remler & Van Ryzon, 2011).
For the purposes of this research, the dependent variable was dichotomous as persistence
was defined as persist/retain versus did not persist/was not retained. The independent
variables contained both continuous and categorical values. The Hosmer and Lemeshow
test (HL) of goodness of fit was performed to examine model fit. When the p-value for
the HL test is less than .05, the null hypothesis is rejected meaning that the observed and
predicted values are in fact different which suggests poor model fit. A model with an HL
p-value less than .05 would indicate a lack of model fit and the unlikely ability to
accurately predict retained or not retained. A model HL p-value test of significance
should be above .05 to indicate the predicted values matched the observed values
indicating adequate model fit for predicting retained or not retained for the purposes of
this study.
In addition to assumptions, multicollinearity and outliers need to be assessed.
Multicollinearity was assessed through an examination of variance inflation factors (VIF)
and tolerance values. As long as collinearity statistics remain below 10 for the VIF and
83
above a .1 for tolerance, there is no evidence of extreme collinearity. Outliers in the data
were identified as having standardized residuals greater than ±3.0. For outliers that
exceeded an observed Cook’s D value greater than 1.0, analyses were run with and
without the outliers to determine if any cases exerted influence on the regression and
assess exclusion in the dataset.
Analyses of Research Questions
Research question 1. To answer the first research question, I completed a
hierarchical multiple regression analysis to explain the relationship between grit and
students’ first-year college GPA while controlling for differences in pre-collegiate
academic factors of HSGPA and standardized test scores and demographic variables of
ethnicity, gender, first generation status, and Pell eligibility. Vogt (1999) referred to a
hierarchical regression analysis as a, “method of regression analysis in which
independent variables are entered into the regression equation in a sequence specified by
the researcher in advance” (p. 129). This type of analysis reduces the chance of making a
type I error by yielding a more conservative estimate of statistical relationships
(Strayhorn, 2013). For the purposes of this study, I entered the demographic variables of
Pell eligibility, race/ethnicity, 1st-generation status, and gender into the model first in an
effort to control the effect of these variables on the desired outcome variable of first-year
college GPA.
After the demographic variables were entered, a second set of variables was
entered which included pre-collegiate academic factors (HSGPA and ACT/SAT
composite scores), and then finally grit was added to the model at the third step to
determine if grit explains any additional variance when controlling for demographics and

84
pre-collegiate factors. The rationale for testing the variables in this order is to attempt to
control for variance explained by demographic characteristics and to isolate the level of
variance explained by grit. Prior research supports entering demographic and pre-
collegiate academic variables into the hierarchical model before grit. Research has shown
that there is a relationship between demographic variables and pre-collegiate factors on
predicting college academic performance (Chee et al., 2005; Culpepper & Davenport,
2009; Zwick & Green, 2007).
The following information from the computer output of the hierarchical multiple
regression was examined. The R2 and associated F tests at each step of the hierarchical
analysis indicated how much variance was explained by the variables entered at each step
and whether or not the increments in explained variance are statistically significant. In
addition, the regression coefficients and statistical significance of those coefficients were
used to identify which specific variables entered at each step of the analysis explained a
unique portion of the variance in GPA.
Research questions 2 and 3. To answer research questions two and three related
to retention and persistence, I utilized a binary logistic regression. Both of these research
questions have dependent variables that are dichotomous, meaning either a success or
non-success (retained/not retained or persisted/not persisted). Pedhazur (1997) noted the
use of logistic regression to answer research questions with a dichotomous (binary)
dependent variable.
I started by reviewing the binary logistic regression output first for the fit of the
model at each step of the hierarchical analysis based on a likelihood ratio χ2 test. This test
indicates if one or more variables entered into the model at that step improve(s) the fit of

85
the model significantly. Then, if the likelihood ratio test was statistically significant, I
reviewed the output to determine the statistical significance of each independent variable
along with their corresponding odds ratios. The odds ratio can be interpreted as the odds
to be retained or odds to persist where the reverse is the odds of not being retained or
persisting.
Summary
This chapter described the methods and procedures executed for this study to
determine if grit does explain college persistence to second semester, predict retention to
second year, and predict first-year college GPA. The purpose of the study, hypothesis,
research design and procedures, instrumentation, and data analysis were included. The
next chapter addresses the answers to the research questions.
86
CHAPTER IV
RESULTS
The purpose of this study was to examine if grit could predict an increase in
probability of academic success of first year college students beyond HSGPA and
standardized test scores. Collecting extensive biographic and demographic data, I was
able to compare grit scale scores across a variety of diverse segments of the sample. This
chapter details the study’s findings and is organized into the following sections:
preliminary analysis, data analysis for the three research questions, and concludes with a
brief summary. The three questions examined in this study are:
Q1 To what extent does grit predict 1st-year college GPA when controlling
for background characteristics and pre-collegiate academic factors?
Q2 To what extent does grit explain retention to second semester when
controlling for background characteristics and pre-collegiate academic
factors?
Q3 To what extent does grit predict retention to second year when controlling
for background characteristics and pre-collegiate academic factors?
The previously described analyses are presented and I conclude with a summary of
findings.
The department of institutional research at Mountain States University (MSU)
provided demographic data for this study. The demographic variables collected include
ethnicity, gender, first generation status, and Pell eligibility along with pre-collegiate

87
academic factors of high school grade point average (HSGPA) and standardized test
scores (ACT or SAT). Additional data in the study included college success indicators of
fall 2016 college GPA, spring 2017 college GPA, first year cumulative college GPA,
persistence from fall 2016 to spring 2017, and retention from fall 2016 to fall 2017.
Mountain States University is primarily a regional-serving institution with 84% of
students enrolling from the institution’s home state. The home state has a contract with
ACT to administer statewide testing to public high school students in the spring of their
junior year. Due to access to statewide testing of the ACT and institutional status as a
regional university primarily serving home state students, a high percentage of test score
senders submitted ACT scores (94.35%). The distribution of test scores by provider is
shown in Table 4.
Table 4
Test Score Submission by Provider for Entire Cohort
Variable n M SD Range
ACT Composite 1,921 22.34 3.98 12-34
SAT Composite (CR and M) 243 1039.42 154.82 590-1470
Redesigned SAT Composite (EBRW and
M)
12 1128.33 144.84 880-1350
Standard Scale 2,036 22.33 3.98 12-34
Note. CR = Critical Reading component from SAT test; M = Math component from SAT and RSAT
test; EBRW = Evidence Based Reading and Writing component score from RSAT
Table 5 illustrates pre-collegiate academic characteristics for the fall 2016 cohort,
by grit response or non-response. As a reminder, standard test score is the concordant
score of all standardized tests collected (SAT, RSAT, and ACT) to an ACT composite
scale to define test results consistently. An independent samples t-test was conducted to
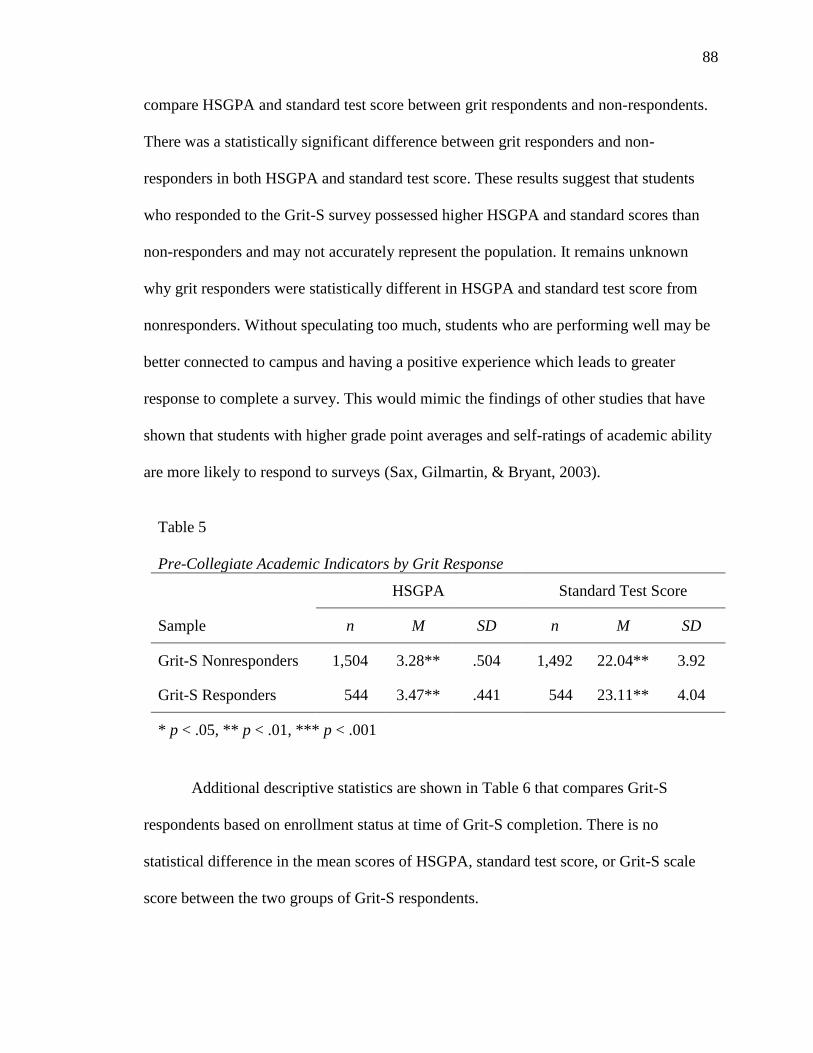
88
compare HSGPA and standard test score between grit respondents and non-respondents.
There was a statistically significant difference between grit responders and non-
responders in both HSGPA and standard test score. These results suggest that students
who responded to the Grit-S survey possessed higher HSGPA and standard scores than
non-responders and may not accurately represent the population. It remains unknown
why grit responders were statistically different in HSGPA and standard test score from
nonresponders. Without speculating too much, students who are performing well may be
better connected to campus and having a positive experience which leads to greater
response to complete a survey. This would mimic the findings of other studies that have
shown that students with higher grade point averages and self-ratings of academic ability
are more likely to respond to surveys (Sax, Gilmartin, & Bryant, 2003).
Table 5
Pre-Collegiate Academic Indicators by Grit Response
HSGPA Standard Test Score
Sample n M SD n M SD
Grit-S Nonresponders 1,504 3.28** .504 1,492 22.04** 3.92
Grit-S Responders 544 3.47** .441 544 23.11** 4.04
* p < .05, ** p < .01, *** p < .001
Additional descriptive statistics are shown in Table 6 that compares Grit-S
respondents based on enrollment status at time of Grit-S completion. There is no
statistical difference in the mean scores of HSGPA, standard test score, or Grit-S scale
score between the two groups of Grit-S respondents.

89
Table 6
Pre-Collegiate Academic indicators and Grit-S Score by Enrolled Status
Enrolled Spring 2017 Not Enrolled Spring 2017
(n = 513) (n = 31)
Variable M SD M SD
HSGPA 3.48 .44 3.37 .46
Standard Test Score 23.15 4.10 22.58 2.77
Grit-S Score 3.49 .57 3.32 .56
* p < .05, ** p < .01, *** p < .001
First-semester college grade point averages were compared within groups by
gender, students of color, Pell eligibility, and first generation status for the entire cohort
of 2,052 students. Table 7 displays means and standard deviations, along with results of
statistical tests, for first-semester GPA and grit scale scores across each of the four
demographic variables. Differences for ethnicity are reported individually and
collectively as students of color.

90
Table 7
First-Semester GPA and Grit-S Scores by Demographics
Cohort Fall GPA (n = 2,052) Grit Scale Scores (n = 544)
Variable n M SD n M SD
Gender
Female 1,313 2.80*** 1.08 409 3.52*** .53
Male 737 2.41 1.12 135 3.34 .66
Ethnicity
American Indian 11 2.55 1.12 7 3.38 .60
Asian 47 2.65 1.13 13 3.39 .62
Black/African American 71 2.29 .91 9 3.50 .30
Hispanic or Latino 472 2.42 1.14 107 3.52 .55
Multiracial 110 2.53 1.04 31 3.37 .53
Native Hawaiian 9 2.27 .97 2 3.06 .09
Non-resident Alien 16 3.25 .68 2 3.21 .30
Unknown 4 3.46 .79 1 3.50
White 1,312 2.70 1.10 372 3.48 .58
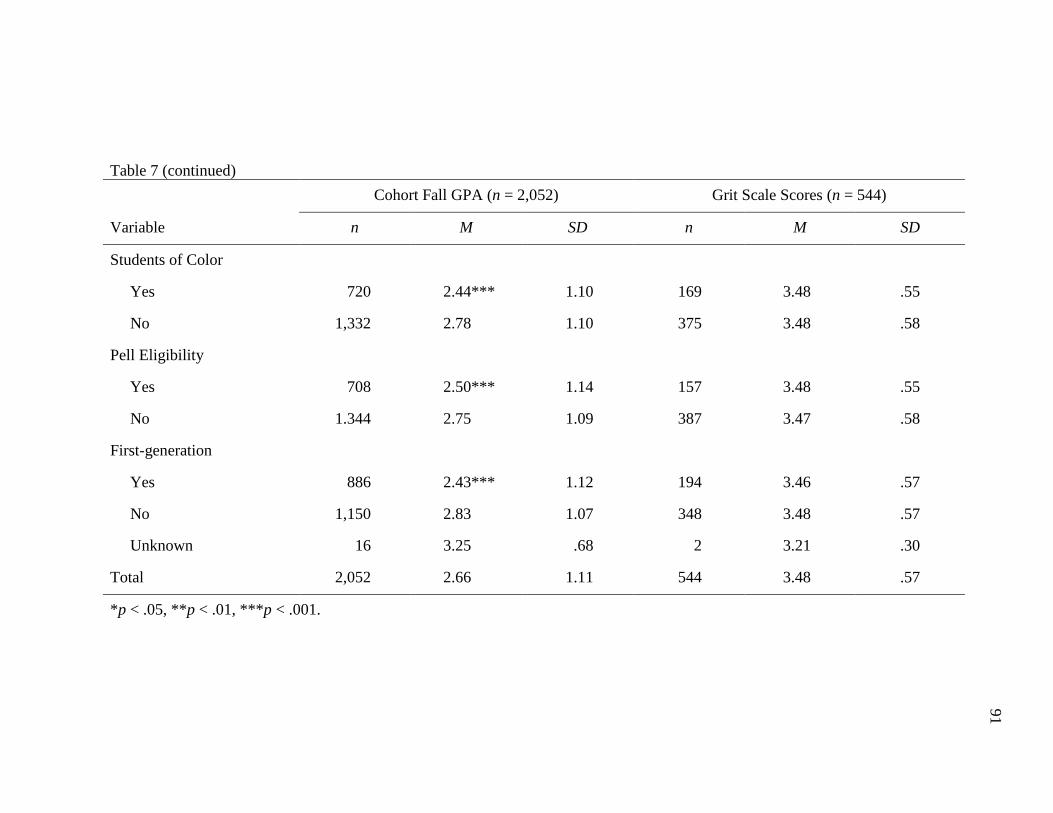
91
Table 7 (continued)
Cohort Fall GPA (n = 2,052) Grit Scale Scores (n = 544)
Variable n M SD n M SD
Students of Color
Yes 720 2.44*** 1.10 169 3.48 .55
No 1,332 2.78 1.10 375 3.48 .58
Pell Eligibility
Yes 708 2.50*** 1.14 157 3.48 .55
No 1.344 2.75 1.09 387 3.47 .58
First-generation
Yes 886 2.43*** 1.12 194 3.46 .57
No 1,150 2.83 1.07 348 3.48 .57
Unknown 16 3.25 .68 2 3.21 .30
Total 2,052 2.66 1.11 544 3.48 .57
*p < .05, **p < .01, ***p < .001.
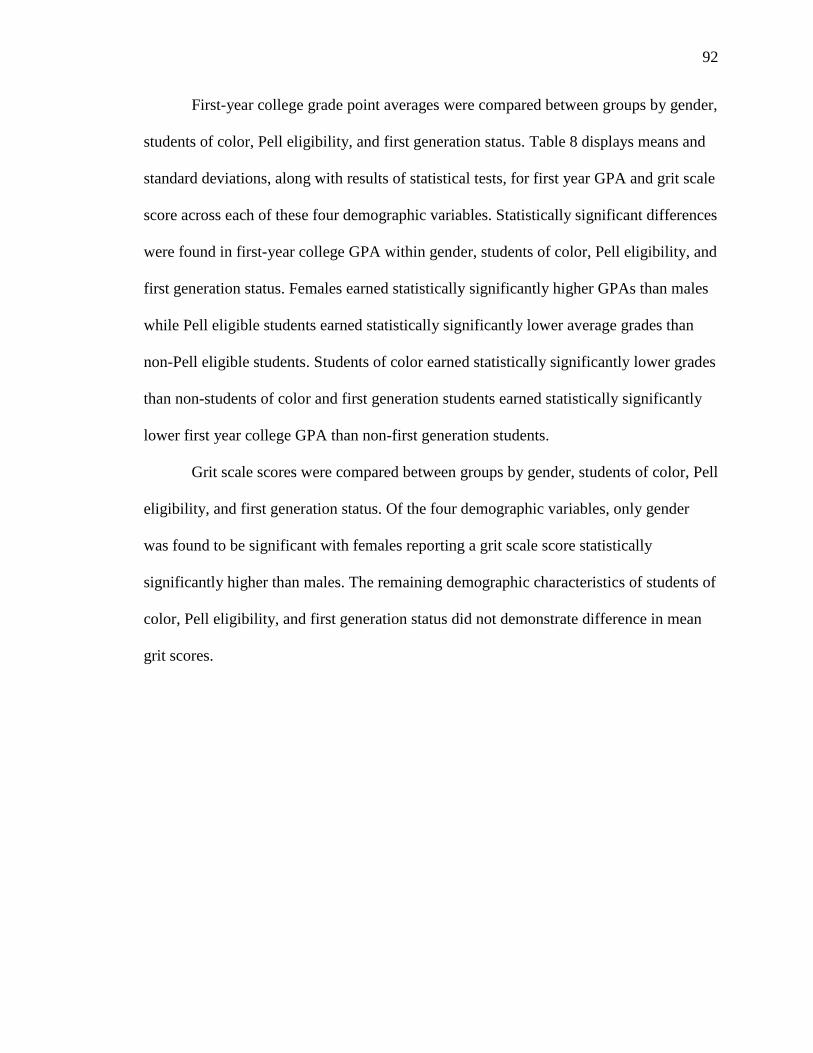
92
First-year college grade point averages were compared between groups by gender,
students of color, Pell eligibility, and first generation status. Table 8 displays means and
standard deviations, along with results of statistical tests, for first year GPA and grit scale
score across each of these four demographic variables. Statistically significant differences
were found in first-year college GPA within gender, students of color, Pell eligibility, and
first generation status. Females earned statistically significantly higher GPAs than males
while Pell eligible students earned statistically significantly lower average grades than
non-Pell eligible students. Students of color earned statistically significantly lower grades
than non-students of color and first generation students earned statistically significantly
lower first year college GPA than non-first generation students.
Grit scale scores were compared between groups by gender, students of color, Pell
eligibility, and first generation status. Of the four demographic variables, only gender
was found to be significant with females reporting a grit scale score statistically
significantly higher than males. The remaining demographic characteristics of students of
color, Pell eligibility, and first generation status did not demonstrate difference in mean
grit scores.

93
Table 8
First-Year GPA and Grit-S Scores by Demographics
Cohort First-year GPA (n = 1,807) Grit Scale Scores (n = 513)
Variable n M SD n M SD
Gender
Female 1,165 2.94*** .91 388 3.53** .52
Male 642 2.56 .94 125 3.33 .66
Ethnicity
American Indian 9 2.41 1.04 5 3.50 .68
Asian 43 2.81 .95 13 3.39 .62
Black/African American 65 2.35 .85 9 3.50 .30
Hispanic or Latino 399 2.59 .97 101 3.54 .55
Multiracial 95 2.69 .90 29 3.35 .55
Native Hawaiian 8 1.97 1.09 2 3.06 .09
Non-resident Alien 13 3.11 .81 1 3.43
Unknown 4 3.10 .97 1 3.50
White 1,171 2.91 .91 352 3.49 .58
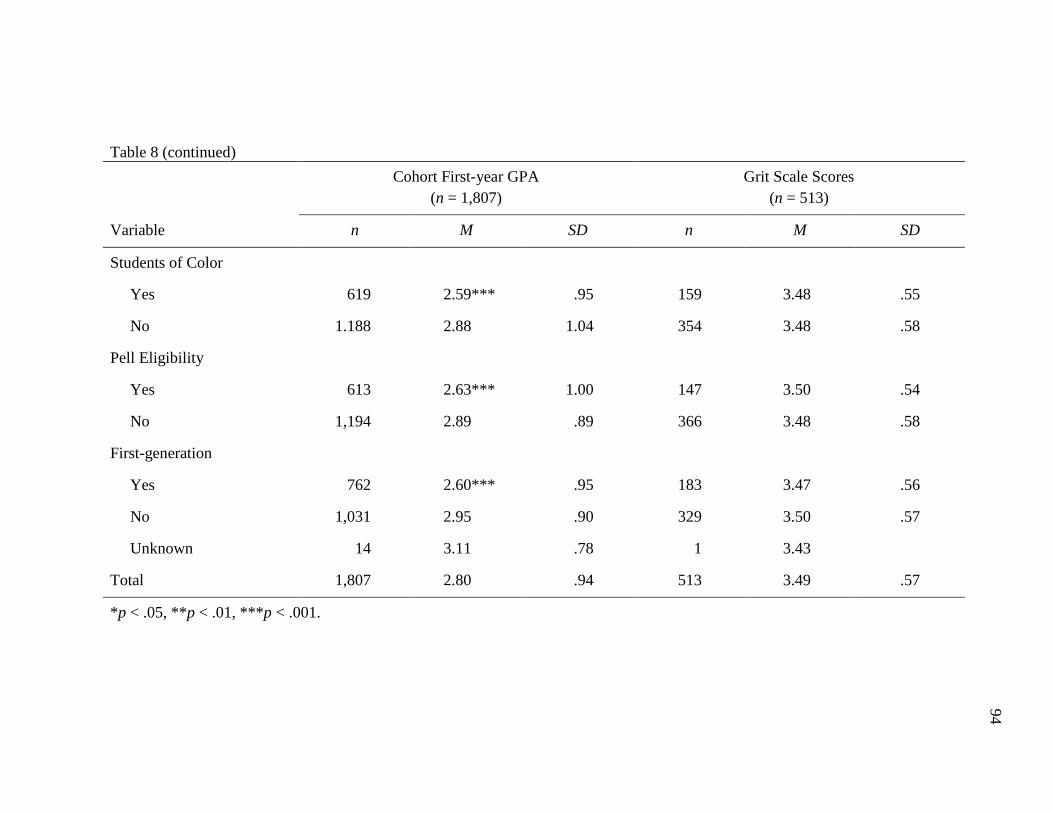
94
Table 8 (continued)
Cohort First-year GPA
(n = 1,807)
Grit Scale Scores
(n = 513)
Variable n M SD n M SD
Students of Color
Yes 619 2.59*** .95 159 3.48 .55
No 1.188 2.88 1.04 354 3.48 .58
Pell Eligibility
Yes 613 2.63*** 1.00 147 3.50 .54
No 1,194 2.89 .89 366 3.48 .58
First-generation
Yes 762 2.60*** .95 183 3.47 .56
No 1,031 2.95 .90 329 3.50 .57
Unknown 14 3.11 .78 1 3.43
Total 1,807 2.80 .94 513 3.49 .57
*p < .05, **p < .01, ***p < .001.

95
Preliminary Analysis
As reported in Chapter III, reliability analysis utilizing Cronbach’s alpha was
completed on the Grit-S scale items and a confirmatory factor analysis (CFA) was
conducted on this sample for model fit. Each of these analyses are presented in detail
followed by analysis for the research questions and diagnostics.
Confirmatory Factor Analysis
A confirmatory factor analysis was conducted to test the model with this sample
and verify model fit using LISREL 8.8. The model used listwise deletion of missing data
that removed records with any missing items. The eight-item grit scores for 526
respondents were analyzed on a two-factor model of Consistency of Interest and
Perseverance of Effort. Items one, three, five, and six loaded on the Consistency of
Interest factor with standardized factor loadings ranging from .42 to .65 while items two,
four, seven, and eight loaded on the Perseverance of Effort factor with standardized
loadings ranging from .23 to .75. The factor loadings follow the expected relationship
based on prior theory associated with the grit-s scale and seem to be acceptable as each
item was found to be statistically significant (p < .05) by reviewing z-scores with all
values above ±2.00. Kline (2016) recommended reviewing chi-square fit, RMSEA, CI of
RMSEA, CFI, and Standardized Root Mean Square Residual (SRMR) to determine
model fit. As a reminder, each statistic was discussed in Chapter III. The model χ2 fit
indexes for the Grit-S suggested a good fit for the sample, χ2 (19, N = 526) = 53.09, p <
.001; RMSEA = .060 (90% confidence interval [CI] = .042 - .079), CFI = .98, and
Standardized RMR = .040.

96
Internal Consistency Reliability
Analysis of the eight-item Grit-S scale demonstrated acceptable internal
consistency reliability, with an alpha reliability estimate of .75. Gliem and Gliem (2003)
suggested a reasonable goal to achieve an alpha of .8 or higher. As shown in Table 9, this
sample maintains similar internal consistency reliability estimates as previous studies
using the Grit-S have demonstrated (Duckworth & Quinn, 2009). Each item was
evaluated through item analysis and was found that removing item (2), “Setbacks don’t
discourage me,” would increase Cronbach’s alpha to .78. No other items would increase
alpha if removed and the decision was made to keep all items in analyses.
Table 9
Internal Consistency Reliability for the Grit-S Scale, Factor 1: Consistency of Interest
and Factor 2: Perseverance of Effort
Sample N Grit-S
Consistency
of Interest
Perseverance
of Effort
West Point 2008 (Duckworth et al., 2007) 1,218 .73 .73 .60
West Point 2010 (Duckworth et al., 2007) 1,308 .76 .74 .65
Ivy League undergraduates
(Duckworth et al., 2007)
139 .83 .79 .78
Current Grit-S Study 524 .75 .66 .65
After thoughtful review of the internal consistency reliability and the CFA, the
decision was made to utilize the total grit score in the current study and keep all eight
items in the remainder of analysis. This decision was informed by the difference in the
consistency reliability between the total grit score and the subscale scores as shown in
Table 9.

97
Results for Research Questions
Hierarchical multiple regression was utilized to answer research question one
while logistic regression was used to answer research questions two and three. This
section contains relevant diagnostics and an analysis for each research question.
Diagnostics for Regression
According to Osborne and Waters (2002), there are four assumptions to be aware
of in regression analysis. The assumptions are: 1) residuals are normally distributed, 2) a
linear relationship exists between dependent and independent variables, 3) variables are
measured without error, and 4) residuals are homoscedastic. Initial review of a scatterplot
between standardized residuals and predicted values exhibit a random scatter of points
with similar spread across most levels. The plot shows residuals falling randomly with no
strong tendency to be either greater or less than zero. The random pattern suggests that
the linearity and homoscedasticity assumptions are satisfied. Through the review of a
histogram for model residuals, the distribution appears to follow a normal distribution.
Further review of the P-P Plot displays some skewness in the data; however, most points
fall near the line. There is sufficient evidence to suggest that the normality assumption
was satisfied. As shown above, the grit-s scale exhibited a reliability of α = .75 which is
acceptable as common reliabilities of many measures in behavioral sciences are found to
be in the .7 - .8 range (Pedhazur, 1997).
In addition to the aforementioned diagnostics for assumptions, it is also important
to assess for potential multicollinearity among the explanatory variables. This diagnostic
is important as it identifies when variables might be highly correlated, meaning they are
measuring the same thing. Two statistics used to determine collinearity issues are

98
tolerance and the variance inflation factor (VIF). To identify a collinearity issue, Kline
(2016) identified tolerance values < .10 or VIF values > 10.0 as exhibiting a concern for
extreme collinearity. Table 10 provides the collinearity diagnostics for the regression
model. No VIF value exceeds 10.0 and the tolerance values exceed .10 indicating no
concern for severe collinearity.
Table 10
Collinearity Information for Diagnostics
Collinearity Statistics
Model Tolerance VIF
1 (Constant)
SOC .896 1.116
Gender .912 1.096
Pell .894 1.118
First Gen .838 1.193
HSGPA .696 1.437
Test Score .715 1.398
Grit Mean .931 1.074
The final diagnostic was to observe Cook’s D in the data for potentially
influential outliers in the dataset. Figure 3 illustrates the Cook’s D values in the data set.
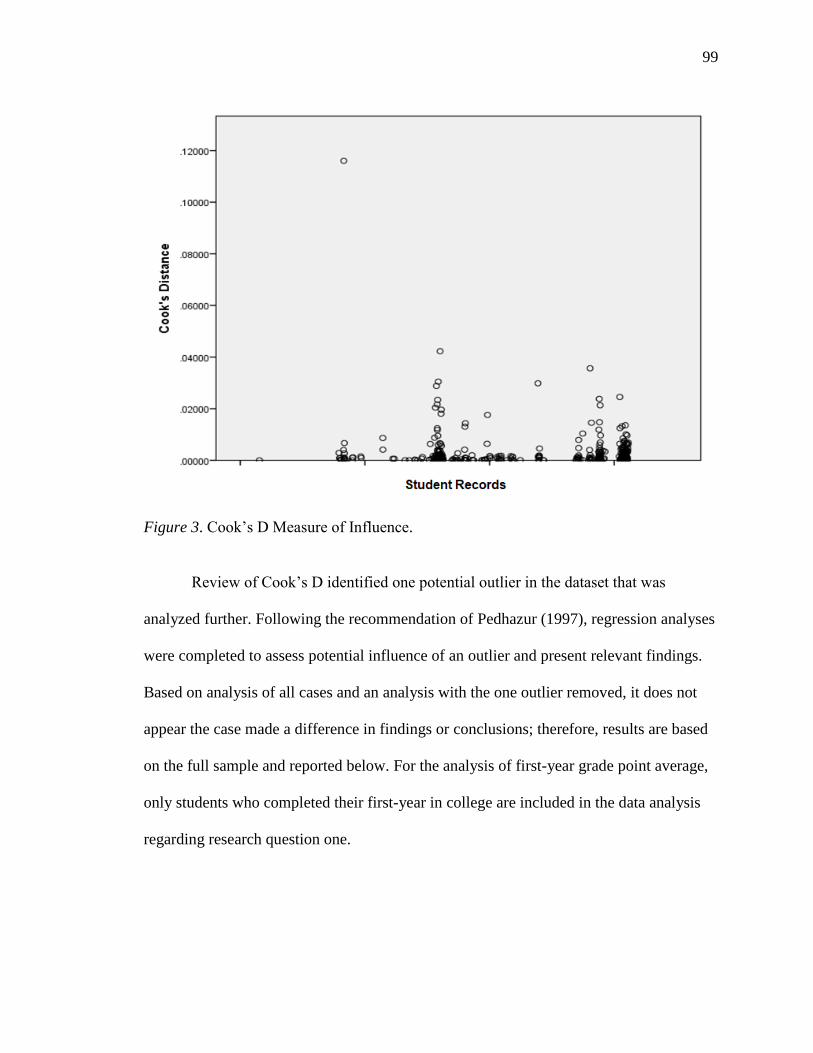
99
Figure 3. Cook’s D Measure of Influence.
Review of Cook’s D identified one potential outlier in the dataset that was
analyzed further. Following the recommendation of Pedhazur (1997), regression analyses
were completed to assess potential influence of an outlier and present relevant findings.
Based on analysis of all cases and an analysis with the one outlier removed, it does not
appear the case made a difference in findings or conclusions; therefore, results are based
on the full sample and reported below. For the analysis of first-year grade point average,
only students who completed their first-year in college are included in the data analysis
regarding research question one.

100
Research Question One
To answer research question one, hierarchical multiple regression was completed
to investigate if grit was able to predict first year college grade point average beyond pre-
collegiate characteristics of HSGPA and standardized test scores while controlling for
demographics of gender, ethnicity, Pell eligibility, and first generation status. For the
hierarchical multiple regression, demographic variables of gender, student of color, Pell
eligibility, and first generation status were entered into the model in the first block,
followed by pre-collegiate indicators of HSGPA and standardized test scores in block 2,
and concluded by adding grit mean score in block 3. As demonstrated in Table 11, the
first block collectively explained a statistically significant amount of variance in first-
year GPA, R2 = .132, adjusted R2 = .125, F(4, 507) = 19.23, p < .001. This indicated
demographic variables together explained 13.2% of the variance in first year college
GPA. Of the four demographic variables, gender (b = .46, p < .001), student of color (b =
-.19, p = .02), and first generation status (b =-.43, p < .001) were significant. The results
indicate that females and non-first generation students, on average, outperformed their
classmates on first year GPA by approximately a half a letter grade, .46 and .43,
respectively, on a 0 to 4.0 GPA scale. Students not of color also earned higher first year
GPAs than students of color with an average difference of .19. Pell eligibility (b = -.06, p
= .516) was not significant in the model.
101
Table 11
Results from Hierarchical Multiple Regression Model 1 (Demographics)
Unstandardized
Coefficients
Standardized
Coefficients
Model
B
Std.
Error
Beta
t
p
1 Constant 2.905 .08 35.60 < .001
SOC -1.9 .08 -.10 -2.31 .02
Gender .46 .08 .23 5.48 .00
Pell -.06 .08 -.03 -.65 .52
First Generation -.43 .08 -.24 -.533 <.001
Note: SOC = Students of color; First-Gen = First generation students
Block 2 added pre-collegiate academic indicators of HSGPA and the standard
score to represent standardized test scores. Standard scores (b = .04, p < .001) and high
school GPA were statistically significant, resulting in a cumulative of R2 = .403, adjusted
R2 = .396, F(6, 505) = 56.81, p < .001. By adding HSGPA and standardized test scores,
the explained variance in first year college GPA increased significantly beyond what was
explained by demographic variables, ∆R2 = .271, F(2, 505) = 114.74, p < .001. This
means that HSGPA and standardized test scores added an additional 27.1% of explained
variance in first year college GPA. Table 12 provides complete results for model 2.

102
Table 12
Results from Hierarchical Multiple Regression Model 2 (Demographics and Pre-
Collegiate)
Unstandardized
Coefficients
Standardized
Coefficients
Model
B
Std.
Error
Beta
t
p
2 Constant -1.00 .27 -3.74 <.001
SOC -.04 .07 -.02 -.53 .60
Gender .25 .07 .12 3.40 .001
Pell -.08 .07 --.04 -1.113 .26
First-Gen -.22 .07 -.12 -3.17 .002
HSGPA .90 .08 .46 11.18 <.001
Standard Score .04 .01 .17 4.07 <.001
Note: SOC = Students of color; First-Gen = First generation students; HSGPA = High school grade point
average
In the final model, grit mean score was added in the third block. The addition of
grit was statistically significant, resulting in a 2% increase in the amount of explained
variance in first year college GPA, after controlling for demographic characteristics,
HSGPA, and standardized test scores, ∆R2 = .020, F(1, 504) = 17.42, p < .001.
Table 13 provides the regression analysis for the third block of the model. In model 3 grit
(b = .22, p < .001) was statistically significant indicating higher grit scores were
associated with higher first year GPAs.
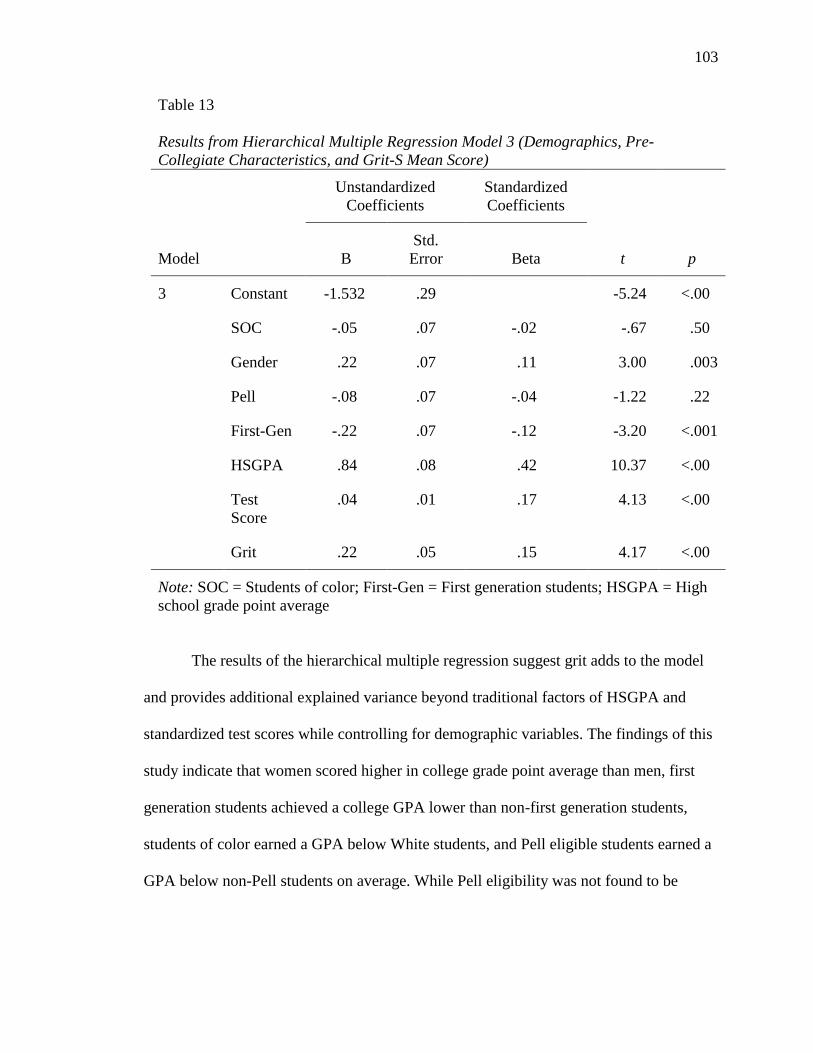
103
Table 13
Results from Hierarchical Multiple Regression Model 3 (Demographics, Pre-
Collegiate Characteristics, and Grit-S Mean Score)
Unstandardized
Coefficients
Standardized
Coefficients
Model
B
Std.
Error
Beta
t
p
3 Constant -1.532 .29 -5.24 <.00
SOC -.05 .07 -.02 -.67 .50
Gender .22 .07 .11 3.00 .003
Pell -.08 .07 -.04 -1.22 .22
First-Gen -.22 .07 -.12 -3.20 <.001
HSGPA .84 .08 .42 10.37 <.00
Test
Score
.04 .01 .17 4.13 <.00
Grit .22 .05 .15 4.17 <.00
Note: SOC = Students of color; First-Gen = First generation students; HSGPA = High
school grade point average
The results of the hierarchical multiple regression suggest grit adds to the model
and provides additional explained variance beyond traditional factors of HSGPA and
standardized test scores while controlling for demographic variables. The findings of this
study indicate that women scored higher in college grade point average than men, first
generation students achieved a college GPA lower than non-first generation students,
students of color earned a GPA below White students, and Pell eligible students earned a
GPA below non-Pell students on average. While Pell eligibility was not found to be

104
statistically significant, it was kept in the final model. Table 14 provides the summary for
all three steps in the model testing.
Table 14
Hierarchical Regression Model Summary
Change Statistics
Model R2 Adj. R2 SE Est R2 ∆ F ∆ p for F ∆
1a .132 .125 .814 .132 19.23 <.001
2b .403 .396 .676 .271 114.74 <.001
3c .423 .415 .666 .020 17.42 <.001
a Predictors: (Constant), First Gen, Gender, SOC, Pell b Predictors: (Constant), First Gen, Gender, SOC, Pell, HSGPA, Standard Test Score c Predictors: (Constant), First Gen, Gender, SOC, Pell, HSGPA, Standard Test Score,
Grit
Supplementary Analysis
While not part of the research questions, a number of supplementary analyses
were completed. The first supplementary analysis was to determine what amount of
variance in first-year College GPA did grit explain when HSGPA and standard test score
were removed from the model. Table 15 reports the regression analysis for the full model.

105
Table 15
Hierarchical Regression Model Summary (Grit Only)
Change Statistics
Model R2 Adj. R2 SE Est R2 ∆ F ∆ p for F ∆
1a .132 .125 .814 .132 19.23 <.001
2b .191 .183 .787 .059 37.03 <.001
a Predictors: (Constant), First Gen, Gender, SOC, Pell b Predictors: (Constant), First Gen, Gender, SOC, Pell, Grit
The first supplementary analysis indicates that grit explained 5.9% of the variance
in first-year College GPA after controlling for demographics and was statistically
significant. This finding will be discussed further in Chapter V.
A second supplementary analysis was completed to determine the statistical
significance of swapping standardized test score and grit mean score within the model.
This additional analysis was to determine if there was sufficient evidence to support the
possibility of including grit in lieu of standardized test score. The first block contained
demographics and remained unchanged from the analyses reported in the primary model.
In the second block, HSGPA and grit were entered simultaneously, and standardized test
score entered into the third block. Table 16 reports the model summary of the
supplementary analysis.

106
Table 16
Hierarchical Regression Model Summary (Supplementary Analysis)
Change Statistics
Model R2 Adj. R2 SE Est R2 ∆ F ∆ p for F ∆
1a .132 .125 .814 .132 19.23 <.001
2b .403 .396 .676 .272 114.99 <.001
3c .423 .415 .666 .020 17.05 <.001
a Predictors: (Constant), First Gen, Gender, SOC, Pell b Predictors: (Constant), First Gen, Gender, SOC, Pell, HSGPA, Grit c Predictors: (Constant), First Gen, Gender, SOC, Pell, HSGPA, Standard Test Score,
Grit
Initial preliminary analysis shows that the addition of HSGPA and grit scores to
the model at block 2 is statistically significant, ∆R2 = .272, F(6, 505) = 56.912, p < .001.
By entering HSGPA and grit in the second block, the supplementary analysis on model 2
was almost identical to the original model when HSGPA and standardized test scores
were entered simultaneously. Grit performed just as well as standardized test scores in
predicting first-year college grade point average.
Table 17 provides the Pearson correlation coefficients for the full model. This
table illustrates how the variables used in this regression model are associated with one
another. A positive value indicates a positive association when the value of one variable
increases another variable also increases linearly. A negative value indicates a negative
association between the two variables. For example, in Table 17, HSGPA and FYGPA
have a moderately positive correlation.

107
Research Question Two
Given the dependent variable for research question two is persistence (persist/did
not persist), a hierarchical logistic regression was used to assess the likelihood of student
persistence to spring semester. The sample includes all students who completed the Grit-
S survey (N = 544). Of the fall cohort, 88.1% persisted to spring semester. To begin, the
four demographic independent variables were entered into the model in the first block.
This process mirrored the order of variable entry in the regression model to determine if
grit strengthened the model for explaining the likelihood of a student’s persisting for
spring semester. Block 1 contained four demographic variables of gender, student of
color, Pell eligibility, and first generation status. Block 2 consisted of the two pre-
collegiate academic indicators of HSGPA and standardized test scores. The third and
final block included the mean grit score.
The step 1 model was found not statistically significant, χ2 (4, N = 542) = .758, p
= .944 meaning that the four demographic variables did not contribute to the model for
predicting retention to spring semester for this sample. Additionally, no individual
variables were found to be statistically significant in the model as shown in Table 18.
The step 2 model was also found not statistically significant, χ2 (6, N = 542) =
1.765, p = .604. No individual variables were found to be statistically significant in the
model as shown in Table 19.
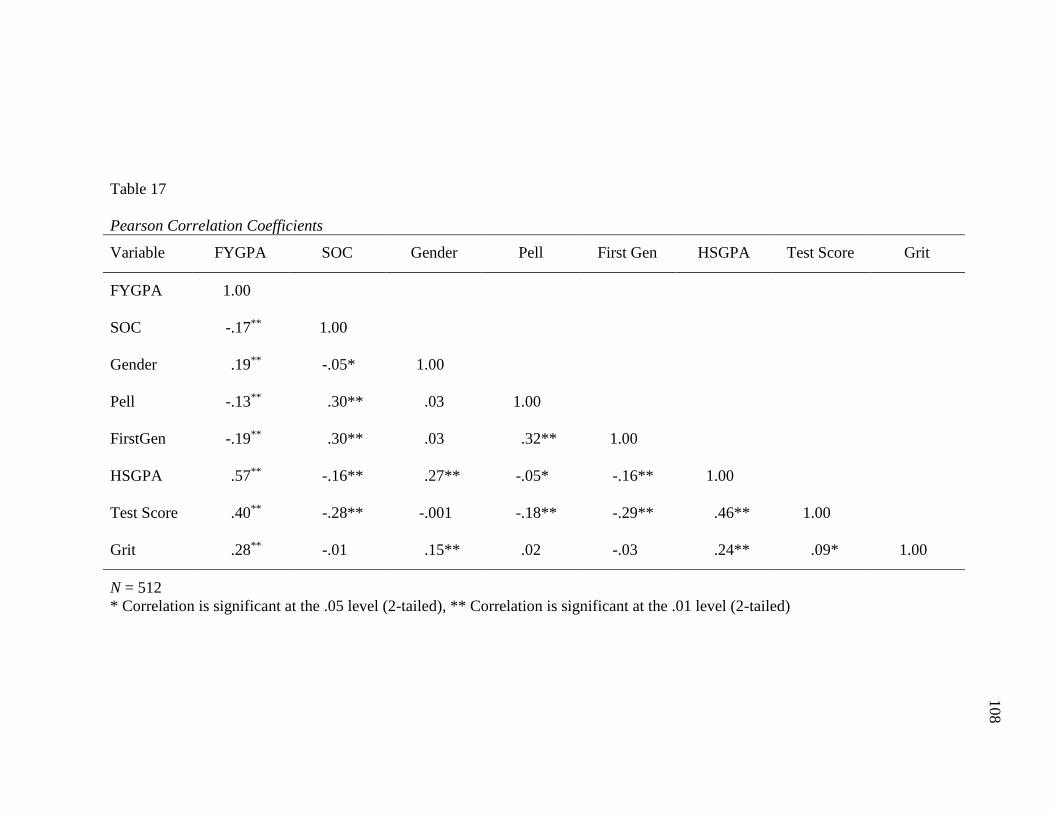
108
Table 17
Pearson Correlation Coefficients
Variable FYGPA SOC Gender Pell First Gen HSGPA Test Score Grit
FYGPA 1.00
SOC -.17** 1.00
Gender .19** -.05* 1.00
Pell -.13** .30** .03 1.00
FirstGen -.19** .30** .03 .32** 1.00
HSGPA .57** -.16** .27** -.05* -.16** 1.00
Test Score .40** -.28** -.001 -.18** -.29** .46** 1.00
Grit .28** -.01 .15** .02 -.03 .24** .09* 1.00
N = 512
* Correlation is significant at the .05 level (2-tailed), ** Correlation is significant at the .01 level (2-tailed)
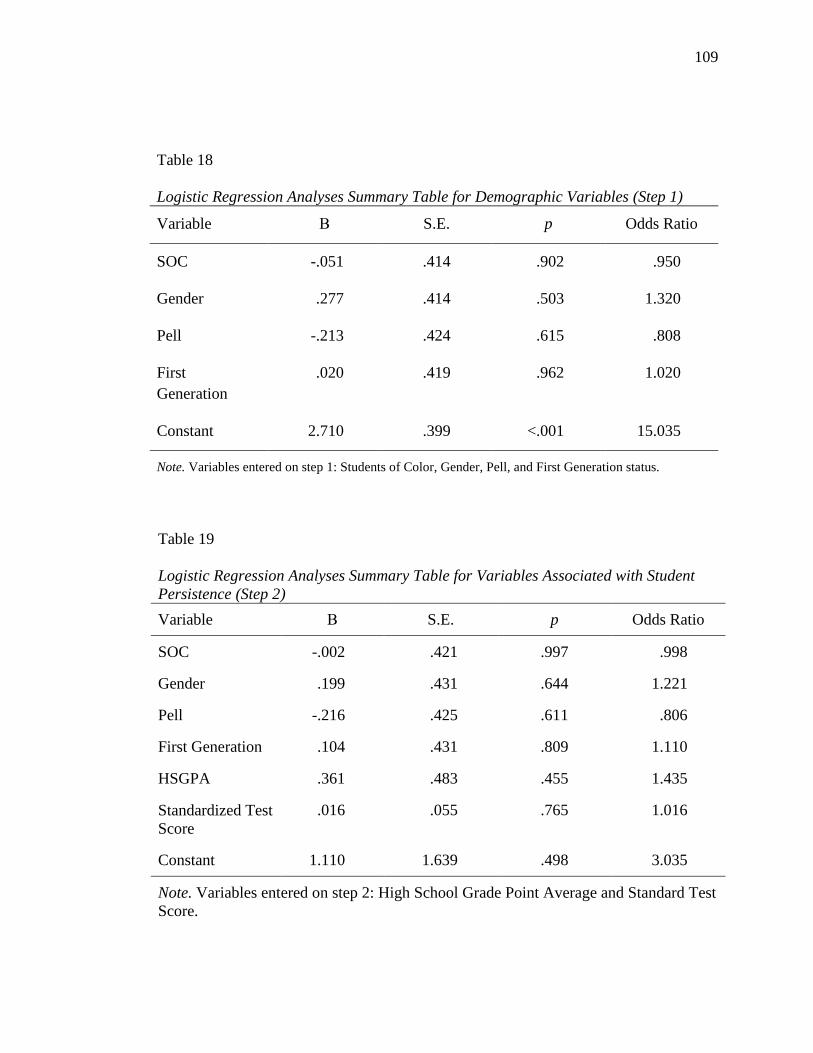
109
Table 18
Logistic Regression Analyses Summary Table for Demographic Variables (Step 1)
Variable Β S.E. p Odds Ratio
SOC -.051 .414 .902 .950
Gender .277 .414 .503 1.320
Pell -.213 .424 .615 .808
First
Generation
.020 .419 .962 1.020
Constant 2.710 .399 <.001 15.035
Note. Variables entered on step 1: Students of Color, Gender, Pell, and First Generation status.
Table 19
Logistic Regression Analyses Summary Table for Variables Associated with Student
Persistence (Step 2)
Variable Β S.E. p Odds Ratio
SOC -.002 .421 .997 .998
Gender .199 .431 .644 1.221
Pell -.216 .425 .611 .806
First Generation .104 .431 .809 1.110
HSGPA .361 .483 .455 1.435
Standardized Test
Score
.016 .055 .765 1.016
Constant 1.110 1.639 .498 3.035
Note. Variables entered on step 2: High School Grade Point Average and Standard Test
Score.
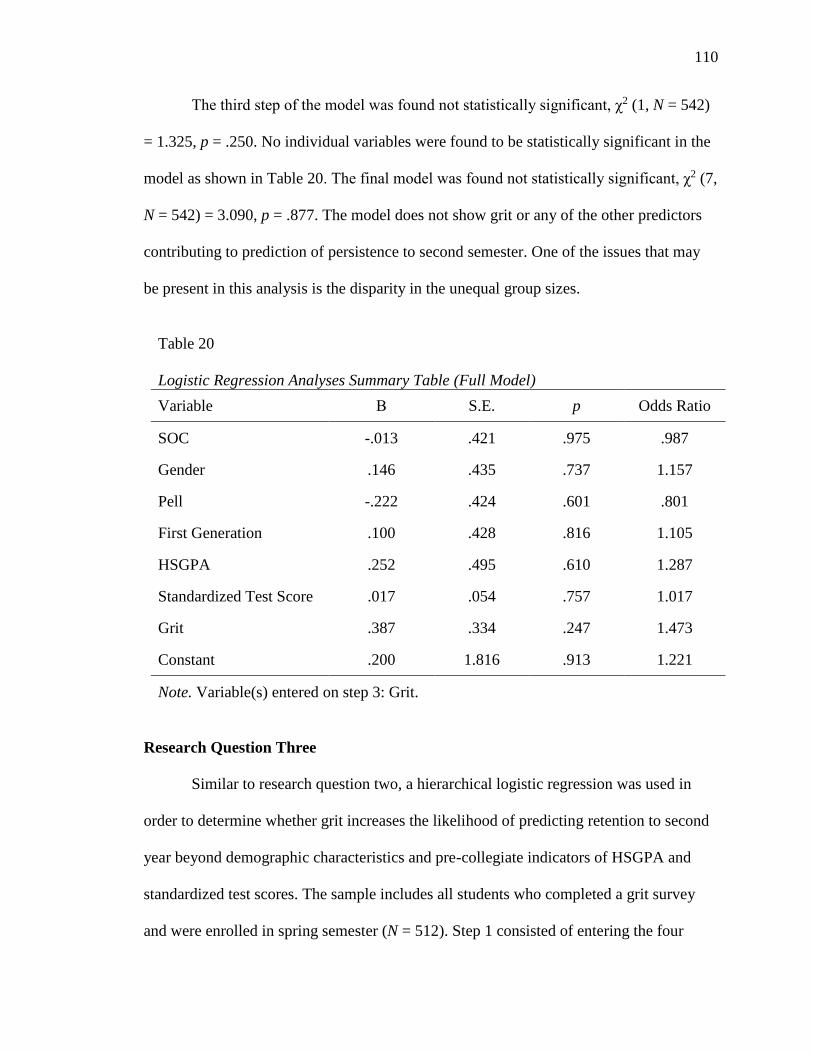
110
The third step of the model was found not statistically significant, χ2 (1, N = 542)
= 1.325, p = .250. No individual variables were found to be statistically significant in the
model as shown in Table 20. The final model was found not statistically significant, χ2 (7,
N = 542) = 3.090, p = .877. The model does not show grit or any of the other predictors
contributing to prediction of persistence to second semester. One of the issues that may
be present in this analysis is the disparity in the unequal group sizes.
Table 20
Logistic Regression Analyses Summary Table (Full Model)
Variable Β S.E. p Odds Ratio
SOC -.013 .421 .975 .987
Gender .146 .435 .737 1.157
Pell -.222 .424 .601 .801
First Generation .100 .428 .816 1.105
HSGPA .252 .495 .610 1.287
Standardized Test Score .017 .054 .757 1.017
Grit .387 .334 .247 1.473
Constant .200 1.816 .913 1.221
Note. Variable(s) entered on step 3: Grit.
Research Question Three
Similar to research question two, a hierarchical logistic regression was used in
order to determine whether grit increases the likelihood of predicting retention to second
year beyond demographic characteristics and pre-collegiate indicators of HSGPA and
standardized test scores. The sample includes all students who completed a grit survey
and were enrolled in spring semester (N = 512). Step 1 consisted of entering the four

111
demographic variables into the model which was found to be significant, χ2 (4, N = 512)
= 10.70, p = .030; however, Table 21 indicates that no individual variables were found
significant in step 1.
Table 21
Logistic Regression Analyses Summary Table for Demographic Variables (Step 1)
Variable Β S.E. p Odds Ratio
SOC -.432 .257 .093 .649
Gender .507 .262 .053 1.660
Pell -.322 .269 .231 .724
First Generation -.137 .265 .604 .872
Constant 1.569 .256 <.001 4.801
Note. Variables entered on step 1: Students of Color, Gender, Pell, and First Generation
status.
At step 2, pre-collegiate factors of HSGPA and standard test scores were entered
which showed statistical significance, χ2 (2, N = 512) = 17.97, p < .001. As shown in
Table 22, the only variable in the model that shows significance at step 2 is HSGPA (b =
1.111, p < .001) which indicates no other variable is influencing the likelihood of being
retained beyond chance.
The final step added grit to the model and does not indicate statistical
significance, χ2 (1, N = 512) = .005, p = .944, with HL p-value of .477, Cox & Snell R2 =
.054, and Nagelkerke R2 = .092. Table 23 provides the regression analysis for the full
model. The full model with all variables did indicate significance, χ2 (7, N = 512) =
28.67, p < .001. The only individual variable that was statistically significant in the
model was HSGPA with an odds ratio (OR) = 3.027, p < .001. This OR is the odds a

112
student will be retained for each unit increase in HSGPA. An example would be a student
with a 4.0 HSGPA has six times greater odds of being retained to the second year than a
student with a 2.0 HSGPA. The remaining variables did not show statistical significance
in the model.
Table 22
Logistic Regression Analyses Summary Table for Variables Associated with Student
Persistence (Step 2)
Variable Β S.E. p Odds Ratio
SOC -.318 .266 .232 .728
Gender .266 .279 .340 1.305
Pell -.386 .275 .160 .680
First Generation .087 .278 .754 1.091
HSGPA 1.111 .313 <.001 3.027
Standardized Test Score .025 .035 .471 1.026
Constant -2.708 1.084 .012 .067
Note. Variable(s) entered on step 2: High School Grade Point Average and Standard
Test Score.

113
Table 23
Logistic Regression Analyses Summary Table (Full Model)
Variable Β S.E. p Odds Ratio
SOC -.318 .266 .231 .727
Gender .264 .281 .347 1.303
Pell -.386 .275 .160 .680
First Generation .087 .278 .754 1.091
HSGPA 1.107 .318 <.001 3.027
Standardized Test Score .025 .035 .471 1.026
Grit .016 .223 .944 1.016
Constant -2.747 1.219 .024 .064
Note. Variable(s) entered on step 3: Grit.
Summary
This chapter contained a comprehensive account of the findings of this research
beginning with a review of the characteristics of the sample, preliminary analysis
including reliability and confirmatory factor analysis, and initial results related to the
research questions. This study relied on ordinary least squares regression and logistic
regression to answer the research questions. It was found that grit does indeed add to the
understanding of first year college grade point average beyond traditional factors of
HSGPA and test scores for this sample. However, data analysis did not reveal that grit
made a significant contribution in predicting persistence or retention for students in this
sample. Chapter V provides a summary of methods, summary of results, implications for
practice, limitations, implications for future research, and conclusion.

114
CHAPTER V
DISCUSSION
The purpose of this study was to examine if grit can be used to explain or predict
first year college student success defined as first year college grade point average,
persistence to second semester, and/or retention to second year beyond traditional
measures of admission criteria. Through this study, I sought to expand the current
literature by investigating if a non-cognitive variable, grit, is able to predict college
performance beyond traditional measures, which could lead to a change in how
institutions admit and enroll students in the future. Guiding this study were three research
questions:
Q1 To what extent does grit predict 1st-year college GPA when controlling
for background characteristics and pre-collegiate academic factors?
Q2 To what extent does grit explain retention to second semester when
controlling for background characteristics and pre-collegiate academic
factors?
Q3 To what extent does grit predict retention to second year when controlling
for background characteristics and pre-collegiate academic factors?
Summary of Results
To answer the research questions, dependent variables of first year college GPA,
persistence to second semester based on being retained or not retained, and retention to
second year based on being retained and not retained were used. Variables used in the
model as predictors (independent variables) were gender, whether or not a student
identified as a student of color, Pell eligibility, first generation status, HSGPA,

115
standardized test score, and a grit mean score from the Short Grit Scale (Grit-S)
developed by Duckworth and Quinn (2009).
Research Question 1
Q1 To what extent does grit predict 1st-year college GPA when controlling
for background characteristics and pre-collegiate academic factors?
Evaluating the results for research question one, I expected to find that grit was
predictive of college GPA. Hierarchical multiple regression indicated that grit did add to
the model when attempting to explain variance in first year college GPA. Demographic
variables statistically predicted first-year college grade point average. The addition of
pre-collegiate factors of HSGPA and standard test score added to this prediction. Most
important to this study, when demographics and pre-collegiate academic factors were
statistically accounted for, grit also explained unique variance in students’ first-year
college grade point average. These findings support my hypothesis that grit scores have a
positive relationship with first-year college grade point average. This finding mirrors
prior research of grit scores being predictive of grade point average (Duckworth et al.,
2007; Duckworth & Quinn, 2009; Strayhorn, 2013) while contradicting other research
where grit did not predict first year college GPA (Chang, 2014)
Research Question 2
Q2 To what extent does grit explain retention to second semester when
controlling for background characteristics and pre-collegiate academic
factors?
I anticipated that grit would be successful in predicting persistence to second
semester. Logistic regression was utilized to answer research question two. Statistical
analysis did not find significance of grit explaining any additional probability of
predicting students who would persist to second semester than traditional admission data.

116
The overall model was not statistically significant and no individual items in the model
were significant predictors for spring persistence on this sample. This finding was not
expected as prior research involving grit has found a positive relationship of grit and
persistence (Duckworth et al., 2007). The timing of the study and data collection may
have overly influenced the findings in the current study. Grit data should have been
collected prior to prediction of persistence to spring semester. Logically, you cannot
predict something that has occurred in the past and this is a significant limitation to the
study.
Research Question 3
Q3 To what extent does grit predict retention to second year when controlling
for background characteristics and pre-collegiate academic factors?
I expected to find that grit was predictive of retention to second year. Similar to
research question two, logistic regression was used to answer research question three.
The sample for analysis was all students who were enrolled in spring semester and
completed the Grit-S scale. The full model did indicate statistical significance, which
means that there is an ability of the variables to predict retention to the fall semester. Of
the seven variables, HSGPA was the only variable statistically significant in the model.
The remaining variables did not show significance in the model.
It was a surprise to find that grit did not predict student retention to second year.
This is in conflict with existing research that found grit to predict retention in educational
settings (Duckworth et al., 2007; Eskreis-Winkler et al., 2014) and life situations like
work place and marriage (Eskreis-Winkler et al., 2014). The findings of the current
research again could be limited by a number of issues including nonresponse bias, time of
data collection, and level of positive experience at the host institution (Sax et al., 2003).
117
Supplementary Analysis
Included in this study was a supplementary analysis to assess two additional
outcomes. The first was to determine the amount of variance that grit predicted in first
year college grade point average while controlling for demographics and without HSGPA
and/or standard test score in the model. Grit was statistically significant in explaining a
portion of variance in first year college grade point average although not to a level that
would give institutions confidence to utilize grit on its own merit for predictive purposes.
HSGPA clearly far outweighs the use of grit on its own.
A desired second outcome of supplementary analysis was to determine if there
was a difference for variance explained in first year college grade point average between
standardized test score and grit. A hierarchical multiple regression was used to analyze
the amount of variance in first year GPA explained when replacing standardized test
score with grit and adding standardized test score to block three as a single predictor.
Replacing standardized test scores with grit resulted in near identical outcomes of
variance explained in first year college GPA by each variable. These results are intriguing
as more and more colleges further evaluate the continued use of standard test scores
contributing to admission decisions.
Section Summary
Based on the above reported findings it would seem plausible that grit has a place
in predictive situations of future academic outcomes such as academic performance and
retention. Defined as a perseverance and passion for long-term goals (Duckworth et al.,
2007), grit did show usefulness toward predicting academic success in the form of
College GPA but was not significant in predicting persistence or retention. Most

118
important to the current study was the finding that grit equally predicted College GPA as
standardized test score. This finding has significant implications for the continued use of
standardized test scores in admissions and will discussed further in the implications
section.
Implications for Theory
Student development theories are commonly referenced as a way to explain a
phenomenon that exists within college student culture. Theories abound regarding topics
such as student involvement, student transition, and persistence and retention. This study
sought to connect retention and persistence theories of Swail and Tinto to grit and
continue to expand the theoretical basis of grit and noncognitive research. Additionally,
an attempt was to connect grit to existing theories of resilience, deliberate practice, flow,
and self-control. The following sections expand on this topic.
Retention and Persistence Theories
Tinto’s separation stage of departure theory (Tinto, 1987) describes transition
periods that begin just prior to matriculating to college. The eight items that make up the
grit scale and specifically the factor of perseverance of effort lean on the findings of
Tinto and the ability to deal with adversity. Item 7 from the grit scale which is, “I finish
whatever I begin”, is a strong indication of a characteristic trait that symbolizes finishing
a task regardless of difficulty, challenges, or bumps along the way. Elkins et al. (2007)
found that students who could negotiate the stage of separation were more likely to return
for a second semester.
In the current study, grit was not predictive of persistence to second semester or
retention to second year. I anticipated that grit would indicate statistical significance to
119
predict retention outcomes. There is a possibility that the period of one semester or one
year does not fit the defined construct of grit that is focused on achievement of long-term
goals. This result leads me to believe that future research directed at establishing a
longitudinal study over a four to six year timeframe would be valuable to the continued
evaluation of grit as a predictor of student success.
Swail et al., (2003) stressed the importance of institutions establishing admissions
criteria using a holistic approach for a more comprehensive assessment of students’
commitment to college and compatibility with the institution. As shown in the current
study, grit was a more equitable evaluation across demographics when compared to
standard test scores and the observed explanation of first year college grade point
average. Colleges and students would benefit from an expansion of admission
requirements to consider alternative characteristics of talent that have been shown to be
predictive of student success. Holistic admissions eliminates a number of barriers to
college and removes systemic disadvantages for students from underrepresented
populations. The use of noncognitive assessments make the admission process more
equitable and encourage students to pursue higher education at selective institutions.
Grit Research within Existing Theories
As shown in Chapter II, I expected to find that grit demonstrated a role within
existing research related to prediction of student outcomes. Grit was presented as a
connection between resilience (Obradović et al., 2012), deliberate practice (Ericsson et
al., 1993), self-control (Tangney et al., 2004), and flow/engagement (C. Peterson et al.,
2005). Grit seemed to be a collection of a multitude of existing psychosocial theories
120
with overlapping connections to one another focused on the achievement of goals through
adversity, persistence, engagement, and regulation of time.
In the current study, the findings leave a number of questions unanswered. Grit
was predictive of first year grade point average but failed to predict persistence and
retention. As shown in Figure 2 (p. 51), it was anticipated that through connections to
existing literature, grit would likely predict long-range goals such as retention to second
year. Grit did not perform as predicted related to persistence and retention and a primary
issue may be the period of time in which data was collected within the student life cycle
and/or the short period of time from start of academic term to measurement of first
outcome (persistence to second term). The length of observation and measurement may
not have been long enough to effectively capture the usefulness of grit in predicting what
is defined as long-range goals such as retention to second year and beyond. This
implication is further discussed in the future research section.
Implications for Practice
The purpose of this study was to examine whether grit could predict college
success outcomes beyond existing demographic and pre-collegiate variables. While a
body of literature exists to support the continued use of traditional academic factors of
HSGPA and standardized test scores (Geiser & Santelices, 2007; Habley et al., 2012;
Hoffman, 2002), the utilization of non-cognitive variables in addition to traditional
criteria may improve the prediction of college outcomes (Credé & Kuncel, 2008;
Sedlacek, 2011; Thomas et al., 2007). The current study supports these findings.
This section will expand on benefit to colleges and implications in future practice.

121
Current Practice
Current admission standards are a relic of an outdated and elitist process that has
yet to transition to a new age of economic and societal needs, which continues to create
unnecessary barriers to access higher education. While this study found similar
indications that high school GPA is the best predictor of academic success in college
(Astin & Oseguera, 2005; Zheng et al., 2002), there remains a large portion of unknown
variance in first year college grade point average. The findings of the current study
suggest that high school GPA remain a priority for consideration in admission criteria.
One of the more controversial implications is to suggest a greater consideration of
test-optional admission practices. The National Association for College Admission
Counseling (NACAC, 2008) questioned the continued use of SAT/ACT scores in
undergraduate admissions and encouraged institutions to consider more than standardized
test scores when making admission decisions. Findings of the current study support
critically reviewing standardized tests use among admission criteria. The amount of time,
resources, and unnecessary stress on students to complete a standardized test that
nominally predicts first year grade point average beyond HSGPA and equal to a
noncognitive variable of grit is concerning. This finding should lead to further
consideration of a change in policy or practice.
The National Association of College Admission Counseling offered a few
considerations to dissuade campuses from focusing on SAT/ACT including that low
income students often do not understand the significance of testing on college options
and lack knowledge of and access to critical information about preparing for the tests.
Potentially in response to criticism, College Board has partnered with Khan Academy to

122
provide free instruction and practice to students in an effort to improve preparation for
standardized tests. Colleges are often slow to change especially from a standard metric
that has served as a trusted indicator of predictive value in future academic success.
Beyond admissions, implications exist related to financial aid and the allotment of
merit aid based on standardized test scores. Many campuses have admission-based
scholarships that are awarded to students who meet minimum grade point averages and
test scores. If colleges would consider a more holistic review and include grit or other
noncognitive variables into scholarship award models, students may be better served and
benefit in the awarding of valuable aid dollars.
Usefulness of Test Scores for Less
Selective Institutions
Grit research has primarily focused on student populations enrolled at highly
selective institutions or within competitive educational environments. What value does
grit have in selective institutions or is there greater potential of using of grit and
noncognitive variables at less selective colleges? Grit may be most useful to less selective
colleges as an alternative to standard test scores. Less selective colleges often struggle for
enrollment and have performance outcomes that are below selective institutions in areas
of retention and graduation and have higher admittance rates. Many regional colleges
operate with less selectivity including the host institution for this study. The use of grit
and/or noncognitive variables in admissions could be extremely advantageous in
identifying talented students who currently do not meet established test score minimums.
Evidence has been provided that highlights the continued inequality of
standardized tests on low-income students with high correlations of SAT scores to family
income (Sackett et al., 2009; Zwick & Green, 2007) as well as the SAT being ethnically

123
biased based on question selectivity (Rosner, 2012). As shown in the current study, test
scores were statistically different between ethnicities, SES, and first generation status
whereas grit scores showed no statistical difference across demographic groups. The use
of grit or noncognitive assessments would clearly apply a more fair evaluation of
applicants and improve access without relying on an instrument that only marginally
predicts academic success beyond HSGPA.
Less selective colleges have missions that often focus on providing access and
education but differ in competitiveness and academic credentials for entrance than larger
selective colleges. MSU currently requires a high school transcript and standardized test
scores for determining an admission decision. Institutions like MSU could benefit from
removing the standardized test score requirement and may in fact experience positive
benefits in enrollment, diversity of students, and student outcomes. Campuses that
implement noncognitive variables in their admissions process should expect to have
stronger predictions of student outcomes (Sternberg et al., 2012).
The use of noncognitive variables has been shown to benefit all students but
primarily students of color, international students, and older students (Sedlacek, 2011).
Most importantly to counter any argument lessoning selectivity or admission standards,
Schmitt et al., (2009) found that students who were evaluated using standard cognitive
and noncognitive measures increased the numbers of ethnically diverse students while
achieving the same rate of graduation when compared to an admission process that relied
solely on standard cognitive measures. Campuses should examine existing practices and
implement policy changes to create a more inclusive application and admission process.
124
Grit Outcomes
As mentioned in the previous section, the grit score was not statistically
significantly different across SES, parental education, or ethnicity. This is critical in the
advancement of grit research and providing equality in access to college. Additionally,
the finding that grit scores were equally predictive of first year GPA as standardized test
scores is important. This finding alone supports further exploration of grit and
noncognitive assessments to more fairly evaluate students.
Does grit measure what it says it does? Grit provided a small explanation of
variance beyond HSGPA in this sample. However, what if grit is primarily a product of
HSGPA and confounded in other variables? The supplementary analysis confirmed that
3.9% of the variance that grit explained in first year college grade point average was
already explained by HSGPA. HSGPA may in fact be as strong of an indicator in
predicting future academic success due to the overlap of the qualities one must possess to
achieve a high GPA such as determination, motivation, and resilience.
Students must maintain consistency in their studies and persevere through life
challenges. Each of these experiences draws from noncognitive traits and may present at
varying levels through HSGPA. The current study provided evidence that grit (and
potentially other noncognitive variables) may be used more effectively and with greater
inclusion of student differences to evaluate potential students for admissions. This is a
significant finding that could make the admissions process more equitable.
Limitations
This study had a number of limitations, which may reduce the generalizability of
the results. When this research began, the focus was to provide increased awareness of

125
the changing demographics of students pursuing higher education and attempt to explore
and challenge the use of traditional pre-collegiate factors to gain access to higher
education through admissions requirements. Most of the prior research on grit has been
limited to populations that do not accurately reflect traditional college students. Examples
include participants from highly selective institutions, predominantly White, and often in
upper level college courses. As demonstrated in prior sections, academic outcomes and
noncognitive variables are often times influenced by confounding variables of SES,
ethnicity, and first generation status. Through this study, I sought to provide a wider and
more reflective sample to evaluate the concept of grit.
Grit Measurement
I believe a limitation in this study is the grit scale itself and the connection to
measuring what the survey is intended to do. Grit has been researched over the last ten
years in a myriad of ways from educational outcomes to life situations. This current study
found marginal improvement over existing measures for college academic success. This
finding supports sentiment by Credé et al., (2017) who suggested the incremental value
of grit for the prediction of performance is likely to be limited.
Although the scale has met generally accepted metrics for reliability, numerous
concerns exist regarding the measurement of the grit scale. The factor structure is tenable
at best (Credé et al., 2017) and grit has been viewed as a policy target and a fix-all for
underrepresented populations to cultivate the right qualities (Ravitch, 2014). These
concerns begin to cast doubt and question the use of the existing scale in high stakes
situations.

126
Survey Administration
A primary limitation of this study was timing of data collection and ability to
predict specific outcomes. Data were collected in the spring semester of students’ first
year in college. This method posed a challenge with generalizability as the analysis
showed there was a significant difference in responders and non-responders to the grit
measure on almost all variables included in the study. By initiating the survey collection
in the spring semester, nearly 12.0% of the fall cohort were no longer enrolled at the
university and were not equally represented in the sample results. Of all Grit responders,
94.3% were enrolled in spring semester, which represented a disproportionate sample
causing challenges in data analysis with groups differing so greatly in size. Collecting
data in the fall semester or prior to enrollment would potentially yield different results
and provide a more holistic picture of the effects grit has on predicting college outcomes.
A secondary limitation to the survey administration timing was the effectiveness
of capturing the prediction of grit on outcomes measured in short succession. Following
the definition of Duckworth et al. (2007), it would seem plausible that persistence and
retention to second semester or even second year does not link directly with a
perseverance and passion for long-term goals but may predict retention to third year or
graduation. The timing of data collection and outcomes could have played a significant
role in the findings.
Non-response Bias
Online survey response rates remain a challenge with an average response rate for
email surveys of 24.8% (Fluidsurveys, 2014). Students who completed the grit-s scale
(26.5%) were statistically different from non-responders in HSGPA, standardized test

127
scores, first semester college grade point average, and first year college grade point
average. This sample did yield a large sample size (N = 544), which should help alleviate
concerns of non-response bias; nevertheless, it exists and needs to be considered.
Additionally, with the discrepancy in response rates overall and the
disproportionate response of students enrolled in spring semester, it is possible that this
contributed to the ineffectiveness of predicting probability of enrollment patterns. By
improving the response rate and expanding the representation within the sample, it is
possible to believe a different outcome in the results of the study may be attained.
Convenience Sample
This research only considered students who enrolled at one four-year University
from a non-random sample of respondents. Results may not be representative of samples
from other institutions with different institutional and student characteristics. With
convenience sampling, it is possible to conceptualize a population that the sample
represents in research as long as caution is applied on the generalizability of the findings
(Gall, Gall, & Borg, 2007). This research involved a population and sample that was
accessible and convenient.
Future Research
Researchers are encouraged to replicate this study on similar populations to
determine if results are consistent in regards to first year GPA, persistence to second
semester, and retention to second year. In addition, other interests may be worthwhile to
explore if grit has influence on college success.

128
Collection of Grit-S Scores
An idea for future research would be to collect grit scores on an entire incoming
class through an orientation program or similar and have the data prior to the academic
year commencing. It would be valuable to have a larger sample size and duplicate the
analysis from this current study in an effort to predict persistence, retention, and first year
grade point average. Additionally, research could determine how grit is moderated by
demographics and observe interactions within outcomes to expand what is known. The
results of a full study on the entire cohort would potentially yield promising results in
persistence and retention data on the target population. The purpose of this study on this
sample was to have a more representative sample of college bound students than prior
research. A sample representing a more traditional college student cohort would be
promising to determine if grit has value in prediction of student success.
Community Privilege Influencing
Outcomes
As mentioned previously, grade inflation is transforming the stratification of
applicants to college. Research has shown that White and affluent families benefit the
greatest from grade inflation (Jaschik, 2017). School resources play a role in student
outcomes. Schools and districts from lower resourced areas perform lower on academic
achievement than better-resourced schools (Layton, 2014). So colleges should ask, what
does the continued use of HSGPA without other variables mean to low income students
and students of color? It means that some low-income students and students of color are
not being given a fair opportunity in college admissions. A system is controlling their
path and further exacerbates existing oppression and eliminates opportunity for certain
129
populations. Can grit offer an alternative pathway for students who are continuously
disadvantaged by existing processes?
Grit and other noncognitive variables may indeed offer a solution for students to
be treated equitably in a process that favors privilege and social capital. The use of grit or
noncognitive variables could assist in differentiating students and providing some level of
stratification in assessment of potential students and create less reliance on HSGPA.
Future research could begin to assess the implications of grit on outcomes and further
explore differences across ethnicity and SES.
Interchangeability of Standardized
Test Score and Grit
This study did illuminate a difference in the sample within marginalized
populations (students of color, low SES, and first generation) and entering standardized
test score. Test scores were correlated and had significance by students of color, SES, and
first generation status. Those differences did not exist when comparing marginalized
populations (students of color, low SES, and first generation,) and grit as grit was not
significant or correlated with students of color, SES, or first generation status. It should
be noted that males and females were not significantly different in test score but were
significantly different on grit scale with males reporting lower grit scales than females.
This finding provides credibility that grit may be a more unbiased view of potential in
applicants than a test score. Based on findings in research question one, grit may be a
suitable replacement (explaining nearly equivalent variance in first year college GPA) for
standardized test scores on this sample.
Future research should further investigate the potential impact of grit on
populations that have been systematically denied access to higher education and the

130
differences in entering test scores. Time spent on preparation by students, cost to
administer standardized tests, and the high stakes implications of underperforming on
standardized tests, leaves open the possibility for an alternative evaluation of potential to
succeed at the college level. Critics will argue that an eight-item grit scale would be
prone to abuse and that students will know how to answer the questions to “game the
system.” Although an 8-item Likert-type scale may be easy to respond to in an untruthful
manner, there remains clear support to continue to think of ways to holistically evaluate
students at time of admission utilizing more than HSGPA and test scores.
Qualitative Exploration of Grit
It may be important for institutions of higher education to understand the
experiences that shaped an individual’s level of grit. Initial research suggested grit may
be malleable and not definitive, always changing based on life circumstances (Alan et al.,
2016). Olson (2017) completed a qualitative content analysis study on a first-year
seminar course and found that intentional assignments could facilitate the development of
grit, which could lead to greater persistence and retention in college. Colleges should
explore if teaching grit in first-year seminars is worthwhile and improves the chances of
students being retained and improving completion rates.
A number of quantitative studies have researched grit utilizing the original grit
scale or the short grit scale. An area that has not been explored is a qualitative review of
grit and diving deeper into a pool of responders to better gain an understanding of where
and how grit may or may not be developed. An example could be a cohort study to track
across time through graduation or dropout and contact students at various points to begin
to learn the qualitative side of grit. I think this research would illuminate the differences
131
in how different populations view grit and score on the grit scale. This could be valuable
for a better understanding of the construct and future use of grit in educational
environments.
Additional Populations to Consider
Exploring
Grit has grown in popularity and exploration continues to shape what is known
about the noncognitive characteristic. A population to consider that I have not found in
the research would be transfer students. Specifically, research could be conducted on
transfer students enrolled at a community college and designed as a longitudinal study to
determine if grit predicts students who successfully complete an associate’s degree and
transfer to a 4-year college and graduate. This population consists of a diverse population
of students from differing backgrounds including academic preparation, socio-economic
status, first generation, and ethnicity. As the cost of higher education continues to rise,
the pool of candidates eligible to transfer to four-year colleges will increase and it would
be valuable for an admissions office to have a holistic review of transfer students beyond
transfer GPA and high school transcript. Community colleges would also benefit from
learning more about their student body and provide focused intervention to improve
success rates of community college students.
A final population to consider researching grit would be adult students.
Admission offices often receive applications from students who are 25 years of age or
older and the admission requirements are typically different due to the amount of time
that has passed since high school. Often students do not have standardized test scores,
and rely heavily on high school transcripts to support admission to the university. This
population may also include larger numbers of veterans who may not have performed

132
well in high school, chose military as an option, and now wish to enroll in a four-year
university. Adding a holistic review that includes noncognitive assessment would be
beneficial and provide greater knowledge of candidates to support admission to the
college.
Conclusion
I am not fully convinced that the value of grit in admissions has been
demonstrated in this study or existing research. There remains an obligation on the part of
enrollment managers and institutional leaders to improve access to higher education and
move beyond traditional measures of evaluation in college admissions. Demographics are
changing dramatically across the U.S. The current higher education systems in
admissions has persisted for decades without disruption. Higher education is in the midst
of a significant disruption, as incomes have remained flat or with little increase and the
cost of education has increased substantially in the past ten years alone. While aid
programs are primarily dedicated toward low income families, both low income and
middle-income families are being priced out of education.
Many public institutions of higher education were founded under the Land Grant
initiative, which focused on inclusion, opportunity, and success. The opportunity to
change the trajectory of an individual and potentially a family’s way of life. Colleges are
struggling to meet enrollment goals while dealing with ever-growing expectations from
state legislators, board of trustees, and the public. Unfortunately, this is the new normal
for higher education. Dwindling resources, expanding accountability, and an increasingly
critical consumer base who question the value of a college degree has changed the
recruitment landscape.

133
Are noncognitive variables the answer? I believe grit and other noncognitive
variables provide an approach for expanding how to identify traits and predictive
qualities of students for success in college. The high school graduating population is
growing in two areas that should cause concern for colleges; less prepared academically
and lower ability to pay for college (Selingo, 2016). These two segments of the
population typically have not gone to college or been limited in options for post-
secondary education. Less selective colleges could benefit from determining how to
identify talent in an effort to boost enrollment and not be restricted to traditional
measures of pre-collegiate achievement.
I began this study with a desire to explore and expand what is known about the
use of noncognitive variables and specifically grit in regards to college admissions. While
grit added a small amount of additional explanation in first year college grade point
average, additional exploration is necessary. Although this study controlled for four
demographic factors and pre-collegiate academic indicators, other factors remain
unknown. Opportunity, privilege, culture, economic situation, and social capital all play a
role in a person’s academic and career trajectory. The exploration of social science
research is necessary and in the case of college outcomes, any attempt at narrowing in on
predictors of future college success, especially for marginalized populations, is worth the
time and effort.
In summary, this research shows that grit may be a positive predictor of first year
college grade point average and may increase the probability of predicting college
success for students. Results of this study can assist enrollment managers and institutions

134
of higher education to inform current admission practices and improve access to post-
secondary education through noncognitive variables.

135
REFERENCES
Ackerman, R., & Schibrowsky, J. (2007). A business marketing strategy applied to
student retention: A higher education initiative. Journal of College Student
Retention: Research, Theory & Practice, 9(3), 307-336.
Adebayo, B. (2008). Cognitive and non-cognitive factors: Affecting the academic
performance and retention of conditionally admitted freshmen. Journal of College
Admissions, 200, 15-21.
ACT. (2016a). Institutional data file. Retrieved from http://www.act.
org/content/dam/act/unsecured/documents/Retention-Persistence-Tables-2016.pdf
ACT. (2016b). Condition of College & Career Readiness. Retrieved from
http://www.act.org/condition2016
Adelman, C. (2006). The toolbox revisited: Paths to degree completion from high school
through college. Washington, D.C.: U.S. Department of Education.
Alan, S., Boneva, T., & Ertac, S. (2016). Ever failed, try again, succeed better: Results
from a randomized educational intervention on grit (March 9, 2016). HCEO
Working Paper. Available at SSRN: https://ssrn.com/abstract=2761390
Almeida, D. J. (2016). Understanding grit in the context of higher education. Higher
Education: Handbook of Theory and Research, 31, 559-609.
Astin, A. W., & Oseguera, L. (2005). Pre-college and institutional influences on degree
attainment. In A. Seidman (Ed.), College student retention: Formula for student
success (pp. 245-276). Westport, CT: Praeger.

136
Atkinson, R. C., & Geiser, S. (2009). Reflections on a century of college admissions
tests. Educational Researcher, 38(9), 665-676.
Austin, P. C., & Steyerberg, E. W. (2012). Interpreting the concordance statistic of a
logistic regression model: Relation to the variance and odds ratio of a continuous
explanatory variable. BMC Medical Research Methodology, 12(1), 1-8.
Baum, S., Ma, J., & Payea, K. (2013). Education pays, 2013: The benefits of higher
education for individuals and society. Retrieved from
http://trends.collegeboard.org/sites/default/files/education-pays-2013-full-report-
022714.pdf
Bentler, P. M. (1990). Comparative fit indexes in structural models. Psychological
Bulletin, 107(2), 238-246.
Berger, S. (2012). The rise and demise of the SAT. American Educational History
Journal, 39(1), 165-180.
Black, K. R. (2014). Grit in college students: Associations with achievement and parental
influences (Master’s thesis). Available from Proquest Dissertations and Theses
database. (UMI No. 1573292)
Bowen, W. G., Chingos, M. M., & McPherson, M. S. (2009). Crossing the finish line:
Completing college at America's public universities. Princeton, NJ: Princeton
University Press.
Bui, K. (2002). First-generation college students at a four-year university: Background
characteristics, reasons for pursuing higher education, and first-year experiences.
College Student Journal, 36(1), 3-22.
137
Bureau of Labor Statistics. (2015). Earnings and unemployment rates by educational
attainment. Retrieved from http://www.bls.gov/emp/ep_table_001.htm
Center for Public Education. (2012). Is high school tough enough. Retrieved from
http://www.centerforpubliceducation.org/Main Menu/Instruction/Is-high-school-
tough-enough-At-a-glance
Chang, W. (2014). Grit and academic performance: Is being grittier better? (Doctoral
dissertation) University of Miami, Miami, FL.
Chee, K., Pino, N. W., & Smith, W. L. (2005). Gender differences in the academic ethic
and academic achievement. College Student Journal, 39(3), 604-618.
Cohen, J. (1988). Statistical power analysis for the behavioral sciences. Erlbaum.
Hillsdale, NJ.
College Board. (2016). 2016 College-bound seniors: Total group profile report. Retrieved
from https://secure-media.collegeboard.org/digitalServices/pdf/sat/total-group-
2016.pdf
Conner, D. R. (1993). Managing at the speed of change: How resilient managers succeed
and prosper where others fail. New York, NY: Villard Books.
Corbett, C., Hill, C., & Rose, A. S. (2008). Where the girls are: The facts about gender
equity in education. Washington, DC: American Association of University
Women.
Credé, M., & Kuncel, N. (2008). Study habits, skills, and attitudes. Perspectives on
psychological science, 3(6), 425-453.

138
Credé, M., Tynan, M. C., & Harms, P. D. (2017). Much ado about grit: A meta-analytic
synthesis of the grit literature. Journal of Personality and Social Psychology,
113(3), 492-511.
Creswell, J. W. (2008). Educational research: Planning, conducting, and evaluating
quantitative and qualitative research. Upper Saddle River, NJ: Pearson
Education, Inc.
Cross, T. M. (2014). The gritty: Grit and non-traditional doctoral student success. Journal
of Educators Online, 11(3), n3.
Culpepper, S. A., & Davenport, E. C. (2009). Assessing differential prediction of college
grades by race/ethnicity with a multilevel model. Journal of Educational
Measurement, 46(2), 220-242.
Dahl, M. (2016). Don’t believe the hype about grit, pleads the scientist behind the
concept. Retrieved from http://nymag.com/scienceofus/2016/05/dont-believe-the-
hype-about-grit-pleads-the-scientist-behind-the-concept.html
Dee, T. S., & West, M. R. (2011). The non-cognitive returns to class size. Educational
Evaluation and Policy Analysis, 33(1): 23-46.
Deil-Amen, R., & Tevis, T. L. (2010). Circumscribed agency: The relevance of
standardized college entrance exams for low SES high school students. The
Review of Higher Education, 33(2), 141-175.
DesJardins, S. L., Ahlburg, D. A., & McCall, B. P. (2002). Simulating the longitudinal
effects of changes in financial aid on student departure from college. Journal of
Human Resources, 653-679.

139
Douglass, J. A. (2012). SAT wars at the University of California. In J. A. Soares (Ed.),
SAT wars: The case for test-optional admissions. New York NY: Teachers
College Press.
Duckworth, A. L. (2013). Grit: The power of passion and perseverance. Retrieved from
https://www.ted.com/talks/angela_lee_duckworth_grit_the_power_of_passion_an
d_perseverance.
Duckworth, A. L., & Gross, J. (2014). Self-control and grit: Related but separable
determinants of success. Invited manuscript. Current Directions in Psychological
Science, 23(5), 319-325.
Duckworth, A. L., Kirby, T. A., Tsukayama, E., Berstein, H., & Ericsson, K. A. (2011).
Deliberate practice spells success: Why grittier competitors triumph at the
national spelling bee. Social Psychological and Personality Science, 2(2),
174-181.
Duckworth, A. L., Peterson, C., Matthews, M. D., & Kelly, D. R. (2007). Grit:
Perseverance and passion for long-term goals. Journal of Personality, Processes,
and Individual Differences, 92(6), 1087-1101.
Duckworth, A. L., & Quinn, P. D. (2009). Development and validation of the short grit
scale (Grit-S). Journal of Personality Assessment, 91(2), 166-174.
Duckworth, A. L., Quinn, P. D., & Tsukayama, E. (2012). What no child left behind
leaves behind: The roles of IQ and self-control in predicting standardized
achievement test scores and report card grades. Journal of Educational
Psychology, 104(2), 439-451.

140
Duckworth, A. L., Tsukayama, E., & May, H. (2010). Establishing causality using
longitudinal hierarchical linear modeling: An illustration predicting achievement
from self-control, Social Psychological & Personality Science, 1(4), 311-317.
Duckworth, A. L., & Yeager, D. S. (2015). Measurement matters: Assessing personal
qualities other than cognitive ability for educational purposes. Educational
Researcher, 44(4), 237-251.
Dweck, C., Walton, G. M., Cohen, G. L., Paunesku, D., & Yeager, D. (2011). Academic
tenacity: Mindset and skills promote long-term learning. Seattle, WA: Bill &
Melinda Gates Foundation.
Egalite, A. J., Mills, J. N., & Greene, J. P. (2014). The softer side of learning: Measuring
students' non-cognitive skills. Improving Schools, 19(1), 27-40.
Elkins, S., Braxton, J., & James, G. (2000). Tinto’s separation stage and its influence on
first-semester college student persistence. Research in Higher Education, 41(2),
251-268.
Engle, J., & Tinto, V. (2008). Moving beyond access: College success for low-income,
first-generation students. Washington, DC: The Pell Institute.
Ericsson, K. A., Krampe, R. T., & Tesch-Romer, C. (1993). The role of deliberate
practice in the acquisition of expert performance. Psychological review, 100(3),
363-406.
Eskreis-Winkler, L., Duckworth, A. L., Shulman, E. P., & Beal, S. (2014). The grit
effect: Predicting retention in the military, the workplace, school, and marriage.
Frontiers in Psychology, 5(36), 1-28.

141
Farrington, C. A., Roderick, M., Allensworth, E., Nagaoka, J., Keyes, T. S., Johnson, D.
W., & Beechum, N. O. (2012). Teaching adolescents to become learners. The role
of noncognitive factors in shaping school performance: A critical literature
review. Chicago, IL: Consortium on Chicago School Research.
Flach, F. (1988). Resilience: Discovering a new strength at times of stress. New York,
NY: Fawcett Columbine.
Fluidsurveys, (2014, October). Response rate statistics for online surveys- What numbers
should you be aiming for? Retrieved from
http://fluidsurveys.com/university/response-rate-statistics-online-surveys-aiming/
Furr, M. (2011). Scale construction and psychometrics for social and personality
psychology. London, England: SAGE Publications Ltd.
Gall, M. D., Gall, J. P., & Borg, W. R. (1996). Educational research: An introduction, 6th
ed. White Plains, NY, England: Longman Publishing.
Geiser, S., & Santelices, M.V. (2007). The validity of high-school grades in predicting
student success beyond the freshman year: High school record vs. standardized
tests as indicators of four-year college outcomes. Retrieved from
http://escholarship.org/uc/item/7306z0zf.
Gliem, J. A., & Gliem, R. R. (2003). Calculating, interpreting, and reporting Cronbach’s
alpha reliability coefficient for Likert-type scales. Paper presented at the Midwest
Research-to-Practice Conference in Adult, Continuing, and Community
Education, The Ohio State University, Columbus, OH.
Godfrey, K. E. (2011). Investigating grade inflation and non-equivalence. New York,
NY: College Board.

142
Grodsky, E., Warren, J. R., & Felts, E. (2008). Testing and social stratification in
American education. Annual Review of Sociology, 34, 385-404.
Groves, R. M., Fowler, F., Couper, M., Lepkowski, J., Singer, E., & Tourangeau, R.
(2009). Survey methodology. Hoboken, NJ: John Wiley & Sons.
Habley, W. R., Bloom, J. L., & Robbins, S. B. (2012). Increasing persistence: Research-
based strategies for college student success. San Francisco, CA: Jossey-Bass.
Hagedorn, L. S. (2005). How to define retention. College student retention formula for
student success, 90-105.
Harackiewicz, J. M., Barron, K. E., Tauer, J. M., & Elliot, A. J. (2002). Predicting
success in college: A longitudinal study of achievement goals and ability
measures as predictors of interest and performance from freshman year through
graduation. Journal of Educational Psychology, 94(3), 562-575.
Helms, J. E. (2009). Defense of tests prevents objective considerations of validity and
fairness. American Psychologist, 64(4), 283-284. doi:10.1037/a0014924
Henderson, N., & Milsetin, M. M. (1996). Management of organizational behavior:
Utilizing human resources (5th ed.). Thousand Oaks, CA: Corwin Press.
Hertel, J. B. (2010). College student generational status: Similarities, differences, and
factors in college adjustment. The Psychological Record, 52(1), 3-18.
Hezlett, S. A., Kuncel, N. R., Vey, M. A., Ahart, A. M., Ones, D. S., Campbell, J. P., &
Camara, W. (2001). The predictive validity of the SAT: A meta-analysis. Paper
presented at the 16th annual convention of the Society for Industrial and
Organizational Psychology, San Diego, CA.
143
Higdem, J. L., Kostal, J. W., Kuncel, N. R., Sackett, P. R., Shen, W., Beatty, A. S., &
Kiger, T. B. (2016), The role of socioeconomic status in SAT–freshman grade
relationships across gender and racial subgroups. Educational Measurement:
Issues and Practice, 35(1), 21-28. doi:10.1111/emip.12103
Hiss, W. C., & Franks, V. W. (2014). Defining promise: Optional standardized testing
policies in American college and university admissions. Retrieved from
http://www.nacacnet.org/research/research-data/nacac-research/
Documents/DefiningPromise.pdf.
Hoffman, J. L. (2002). The impact of student co-curricular involvement on student
success: Racial and religious differences. Journal of College Student
Development, 43(5), 712-739.
Horn, L., & Berger, R. (2004). College persistence on the rise? Changes in 5-year degree
completion and postsecondary persistence rates between 1994 and 2000 (NCES
2005-156). Washington, DC: U.S. Government Printing Office.
Hough, L. M. (1998). Personality at work: Issues and evidence. In M. D. Hakel (Ed.),
Beyond multiple choice: Evaluating alternatives to traditional testing for
selection (pp. 131 - 166). Mahwah, NJ: Erlbaum.
Hu, L., & Bentler, P. M. (1999) Cutoff criteria for fit indexes in covariance structure
analysis: Conventional criteria versus new alternatives, Structural Equation
Modeling: A Multidisciplinary Journal, 6(1), 1-55. doi:10.1080/10705519
909540118

144
Institute for Higher Education Policy. (1998). Reaping the benefits: Defining the public
and private value of going to college. Retrieved from
http://www.ihep.org/publications/publications-detail.cfm?id=70
Izaak, A. R. (2001). The prediction of clinical competence in clinical psychology
graduate students (unpublished doctoral dissertation). Chicago School of
Professional Psychology, Chicago, IL.
Jackson, C. K. (2012). Non-cognitive ability, test scores, and teacher quality: Evidence
from 9th grade teachers in North Carolina. Retrieved from
http://www.nber.org/papers/w18624
Jaschik, S. (2017). High school grades: Higher and higher. Inside higher ed. Retrieved
from https://www.insidehighered.com/admissions/article/
2017/07/17/study-finds-notable-increase-grades-high-schools-nationally
Johnson, N. (2012). The institutional costs of student attrition. Retrieved from
http://www.deltacostproject.org/sites/default/files/products/Delta-Cost-Attrition-
Research-Paper.pdf
Kamenetz, A. (2016). MacArthur ”genius” Angela Duckworth responds to a new critique
of grit [Interview]. Retrieved from http://www.npr.org/
sections/ed/2016/05/25/479172868/angela-duckworth-responds-to-a-new-
critique-of-grit
Kaufman, J. C. (2010). Using creativity to reduce ethnic bias in college admissions.
Review of General Psychology, 14(3), 189-203.
145
Keels, M. (2013). Getting them enrolled is only half the battle: College success as a
function of race or ethnicity, gender, and class. American Journal of
Orthopsychiatry, 83(2-3), 310-322.
Kelly, J., Kendrick, M., Newgent, R., & Lucas, C. (2007). Strategies for student
transition to college: a proactive approach. College Student Journal, 41(4), 1021-
1035.
Klepfer, K., & Hull, J. (2012). High school rigor and good advice: Setting up students to
succeed. Alexander, VA: The Center for Public Education.
Kline, R. B. (2016). Principles and practices of structural equation modeling (4th ed.).
New York, NY: The Guilford Press.
Komarraju, M., Ramsey, A., & Rinella, V. (2013). Cognitive and non-cognitive
predictors of college readiness and performance: Role of academic discipline.
Learning and Individual Differences, 24, 103-109
Lavrakas, P. (2008). Encyclopedia of survey research methods. Thousand Oaks, CA:
SAGE Publications Ltd doi: 10.4135/9781412963947
Layton, L. (2014). Connecting school spending and student achievement. Retrieved from
https://www.washingtonpost.com/local/education/connecting-school-spending-
and-student-achievement/2014/07/09/cfc82cf6-06fd-11e4-bbf1-
cc51275e7f8f_story.html
Ledesma, J. (2014). Conceptual frameworks and research models of resilience in
leadership. Sage Open, 4(3), 1-8.
Lemann, N. (1999). The big test: The secret history of the American meritocracy. New
York, NY: Farrar, Straus and Giroux.
146
Masten, A. S. (2013). Risk and resilience in development. In P.D. Zelazo (Ed.), Oxford
handbook of developmental psychology: Vol 2. (pp.579-607). New York, NY:
Oxford University Press.
Moffat, G. K. (1993, February). The validity of the SAT as a predictor of grade point
average for nontraditional college students. Paper presented at the Eastern
Educational Research Association, Clearwater Beach, FL.
Moffit, T. E., Arseneault, L., Belsky, D., Dickson, N., Hancox, R. J., Harrington, H. L., &
Caspi, A. (2011). A gradient of childhood self-control predicts health, wealth, and
public safety. Proceedings of the National Academy of Sciences, 108(7), 2693-
2698.
Nasim, A., Roberts, A., Harrell, J., & Young, H. (2005). Non-cognitive predictors of
academic achievement for African Americans across cultural contexts. The
Journal of Negro Education; 74(4), 344-358.
National Association for College Admission Counseling (NACAC). (2008). Report of the
commission on the use of standardized tests in undergraduate admission.
Arlington, VA: Author.
National Association for College Admission Counseling (NACAC). (2015). 2015 State of
college admission report. Arlington, VA: Author.
National Center for Education Statistics. (2009). Advanced mathematics and science
courses. Retrieved from https://nces.ed.gov/fastfacts/display.asp?id=97
147
National Center for Education Statistics, Integrated Postsecondary Education Data
System. (2014). Selected cohort entry years of 1996 to 2007, graduation rates
table 326.10. Retrieved from https://nces.ed.gov/programs/
digest/d14/tables/dt14_326.10.asp
National Center for Education Statistics, Integrated Postsecondary Education Data
System. (2016). Fall 2004 through Fall 2014, enrollment component. Retrieved
from http://nces.ed.gov/programs/digest/d15/tables/dt15_303.25.asp
National Student Clearinghouse Research Center. (2016). Snapshot report persistence.
Retrieved from https://nscresearchcenter.org/wp-
content/uploads/SnapshotReport22-PersistenceRetention.pdf
Nettles, M. T., Theony, A. R., & Gosman, E. J. (1986). Comparative and predictive
analysis of Black and White students’ college achievement and experiences.
Journal of Higher Education, 57(3), 289-328.
Nishikawa, Y. (2006). Thriving in the face of adversity: Perceptions of elementary-school
principals. La Verne, CA: University of La Verne.
Noble, J., & Radunzel, J. (2007). College readiness college success beyond the first year.
Paper Presented at the Annual Forum of the Association for Institutional Research
in Kansas City, MO.
Nord, C., Roey, S., Perkins, R., Lyons, M., Lemanski, N., Brown, J., & Schuknecht, J.
(2011). The nation’s report card: America’s high school graduates (NCES 2011-
462). Washington, DC: U.S. Government Printing Office.
148
Obradović, J., Shaffer, A., & Masten, A. S. (2012). Risk in developmental
psychopathology: Progress and future directions. In L. C. Mayes & M. Lewis
(Eds.), The Cambridge handbook of environment in human development. (pp. 35-
57). New York, NY: Cambridge University Press.
Office of Sponsored Programs. (2014). Procedures for research involving human
participants. Retrieved from http://www.unco.edu/osp/doc/irb/procedures.pdf
Olson, J. S. (2017). Helping first-year students get grit: The impact of intentional
assignments on the development of grit, tenacity, and perseverance. Journal of
The First-Year Experience & Students in Transition, 29(1), 99-118.
Osborne, J. W. & Waters, E. (2002). Fur assumptions of multiple regression that
researchers should always test. Practical Assessment, Research & Evaluation.
8(2), 1-5.
Pascarella, E. T., & Terenzini, P. T. (2005). How college affects students: A third decade
of research (Vol. 2). San Francisco, CA: Jossey-Bass.
Paulsen, M., & St. John, E. (2002). Social class and college costs: Examining the
financial nexus between college choice and persistence. Journal for Higher
Education 73(2), 189-236.
Pedhazur, E. J. (1997). Multiple regression in behavioral research: Explanation and
prediction.
Persisting Large Racial Gap in SAT Score Results. (October 4, 2016). The Journal of
Blacks in Higher Education. Retrieved from https://www.jbhe.com/2016/10/the-
persisting-large-racial-gap-in-sat-score-results/
149
Peterson, C., Park, N., & Seligman, M. E. P. (2005). Orientations to happiness and life
satisfaction: The full life versus the empty life. Journal of Happiness Studies,
6(1), 25-41.
Peterson, C., & Seligman, M. E. P. (2004). Character strengths and virtues: A handbook
and classification. Washington, DC: American Psychological Association.
Pike, G. R., & Saupe, J. L. (2002). Does high school matter? An analysis of three
methods of predicting first-year grades. Research in Higher Education, 43(2),
187-207.
Pinsonneault, A., & Kraemer, K. (1993). Survey research methodology in management
information systems. Journal of Management Information Systems, 10(2), 75-105.
Prescott, B. T., & Bransberger, P. (2012). Knocking at the college door: Projections of
high school graduates (8th Ed.). Boulder, CO: Western Interstate Commission for
Higher Education.
Ransdell, S. (2001). Predicting college success: the importance of ability and non-
cognitive variables. International Journal of Educational Research, 35(4),
357-364.
Ravitch, D. (2014, March 22). Lauren Anderson: Why the focus on “grit”? [Web blog
post] Retrieved from https://dianeravitch.net/2014/03/22/lauren-anderson-why-
the-focus-on-grit/
Ravitch, D. (2016). The death and life of the great American school system: How testing
and choice are undermining education. New York, NY: Basic Books.

150
Reason, R. D. (2009). An examination of the persistence research through the lens of a
comprehensive conceptual framework. Journal of College Student Development,
50(6), 659-682.
Reason, R., Terenzini, P., & Domingo, R. (2006). First things first: Developing academic
competence in the first year of college. Research in Higher Education, 47(2),
149-175.
Reed, J., Pritschet, B. L., & Cutton, D. M. (2013). Grit, conscientiousness, and the trans-
theoretical model of change for exercise behavior. Journal of Health Psychology,
18(5), 612-619.
Remler, D. K., & Van Ryzon, G. (2011). Research methods in practice: strategies for
description and causation. Thousand Oaks, CA: Sage Publications.
Rigol, G. W. (2003). Admissions decision-making models: How U.S. institutions of
higher education select undergraduate students. New York: College Board.
Robbins, S. B., Lauver, K., Le, H., Davis, D., Langley, R., & Carlstrom, A. (2004). Do
psychosocial and study skill factors predict college outcomes? A meta-analysis.
Psychological Bulletin, 130(2), 261-288.
Rosner, J. (2012). SAT wars at the University of California. In J. A. Soares (Ed.), SAT
wars: The case for test-optional admissions, 122-137. New York, NY: Teachers
College Press.
Sackett, P., Kuncel, N., Arenson, J., Cooper, S., & Waters, S. (2009). Does
socioeconomic status explain the relationship between admissions tests and post-
secondary academic performance? Psychological Bulletin, 13(1), 1-22.

151
Sackett, P. R., Schmitt, N., Ellingson, J. E., & Kabin, M. B. (2001). High-stakes testing in
employment, credentialing, and higher education: Prospects in a post-affirmative
action world. American Psychologist, 56(4), 302-318.
Santelices, M. V., & Wilson, M. (2010). Unfair treatment? The case of Freedle, the SAT,
and the standardization approach to differential item functioning. Harvard
Educational Review, 80(1), 106-133.
Sax, L. J., Gilmartin, S. K., & Bryant, A. N. (2003). Assessing response rates and
nonresponse bias in web and paper surveys. Research in Higher Education, 44(4),
409-432.
Scherbaum, C. A., Blanshetyn, V., Marshall-Wolp, E., McCue, E., & Strauss, R. (2011).
Examining the effects of stereotype threat on test-taking behaviors. Social
Psychology of Education: An International Journal, 14(3), 361.
Schmitt, N., Keeney, J., Oswald, F. L., Pleskac, T. J., Billington, A. Q., Sinha, R., &
Zorzie, M. (2009). Prediction of 4-year college student performance using
cognitive and noncognitive predictors and the impact on demographic status of
admitted students. Journal of Applied Psychology, 94(6), 1479-1497.
Schmitt, J., & Boushey, H. (2012, July/August). Why don’t more young people go to
college? Challenge, 55(4), 78-93.
Schuh, J. H. (2005). Finances and retention: Trends and potential implications. In A.
Seidman (Ed.), College student retention: Formula for student success (pp. 278-
293). Westport, CT: Praeger.
Sedlacek, W. E. (2004). Beyond the big test: Noncognitive assessment in higher
education. San Francisco, CA: Jossey Bass.

152
Sedlacek, W. E. (2011). Using noncognitive variables in assessing readiness for higher
education. Readings on Equal Education, 25(13), 187-205.
Selingo, J. J. (2016). The biggest problem facing higher education, in one chart.
Retrieved from https://www.washingtonpost.com/news/grade-
point/wp/2016/03/08/the-biggest-problem-facing-higher-education-in-one-chart/
Simon, C. C. (2015). The Test-Optional Surge. The New York Times. Retrieved from
http://www.nytimes.com/2015/11/01/education/edlife/the-test-optional-
surge.html?_r=0
Sommerfeld, A. (2011). Recasting non-cognitive factors in college readiness as what they
truly are: non-academic factors. Journal of College Admission, 213, 18-22.
Sparkman, L., Maulding, W., & Roberts, J. (2012). Non-cognitive predictors of student
success in college. College Student Journal, 46(3), 642-652.
Steele, C. M., & Aronson, J. (1995). Stereotype threat and the intellectual test-
performance of African-Americans. Journal of Personality and Social
Psychology, 69(5), 797-811.
Sternberg, R. J., Bonney, C. R., Gabora, L., & Merrifield, M. (2012). WICS: a model for
college and university admissions. Educational Psychologist, 47(1), 30-41.
Stewart, S. B. (2015). Grit and self-control as predictors of first-year student success
(Doctoral dissertation). Available from ProQuest Dissertations & Theses Global.
(No. 3722559)
Strayhorn, T. L. (2013). What role does grit play in the academic success of Black male
collegians at predominantly White institutions? Journal of African American
Studies, 18(1), 1-10.

153
Suhr, D. D. (2006). Exploratory or confirmatory factor analysis? Proceedings of the 31st
Annual SAS? Users Group International Conference. Cary, NC: SAS Institute
Inc., Paper Number: 200-31.
Swail, W. S. (1995). The development of a conceptual framework to increase student
retention in science, engineering, and mathematics programs at minority
institutions of higher education (Doctoral Dissertation). Retrieved from
http://files.eric.ed.gov/fulltext/ED396921.pdf
Swail, W. S. (2014). A different viewpoint on student retention. Higher Learning
Research Communications, 4(2), 18-25.
Swail, W. S., Redd, K. E., & Perna, L. W. (2003). Retaining minority students in higher
education: A framework for success. In A. Kezar (Ed.), ASHE-ERIC Higher
Education Report, 30(2), Wiley, Hoboken, NJ.
Szumilas, M. (2010). Explaining odds ratios. Journal of the Canadian Academy of Child
and Adolescent Psychiatry, 19(3), 227-229.
Tangney, J. P., Baumeister, R. F., & Boone, A. L. (2004, April). High self-control
predicts good adjustment, less pathology, better grades, and interpersonal success.
Journal of Personality, 72(2), 271-324.
Terenzini, P. T., Springer, L., Yaeger, P. M., Pascarella, E. T., & Nora, A. (1996). First-
generation college students: Characteristics, experiences, and cognitive
development. Research in Higher Education, 37(1), 1-22.
Thomas, L., Kuncel, N., & Credé, M. (2007). Noncognitive variables in college in
admissions. Educational and Psychological Measurement, 67(4), 635-657.

154
Ting, S. (2001). Predicting academic success of first-year engineering students from
standardized test scores and psychosocial variables. International Journal of
Engineering Education, 17(1), 75-80.
Tinto, V. (1987). Principles of effective retention. Paper presented at University of
Maryland, Largo, MD.
Tinto, V. (1993). Leaving College: Rethinking the causes and cures of student attrition.
University of Chicago Press, Chicago, IL.
Toppo, G. (2017, July). A's on the rise in U.S. report cards, but SAT scores flounder.
USAToday. Retrieved from
https://www.usatoday.com/story/news/2017/07/17/easy-a-nearly-half-hs-seniors-
graduate-average/485787001/
Tracey, T., & Sedlacek, W. E. (1982). Non-cognitive variables in predicting academic
success by race. Paper presented at the annual meeting of the American
Educational Research Association, New York, NY.
Tracey, T. J., & Sedlacek, W. E. (1985). The relationship of noncognitive variables to
academic success: A longitudinal comparison by race. Journal of College Student
Personnel, 26, 405-410.
Tross, S. A, Harper, J. P., Osher, L. W, & Kneidinger, L. M. (2000, May/June). Not just
the usual cast of characteristics: Using personality to predict college performance
and retention. Journal of College Student Development, 41(3), 323-334.
Vogt, W. P. (1999). Dictionary of statistics and methodology: a non-technical guide for
the social sciences. Thousand Oaks, CA: Sage.

155
Von Culin, K. R., Tsukayama, E., & Duckworth, A. L. (2014): Unpacking grit:
Motivational correlates of perseverance and passion for long-term goals, The
Journal of Positive Psychology, 9(4), 306-312.
Wagner, W. E., III. (2016). Using IBM® SPSS® statistics for research methods and
social science statistics. Sage Publications, Thousand Oaks: CA.
Werner, E. E., & Smith, R. S. (2001). Journeys from childhood to midlife: Risk resilience
and recovery. New York, NY: Villard Books.
Wolfe, R. N., & Johnson, S. D. (1995). Personality as a predictor of college performance.
Educational and Psychological Measurements, 55(2), 177-185.
Wood, P. S., Smith, A. L., Altmaier, E. M., Tarico, V. S., & Franken, E. A. (1990). A
prospective study of cognitive and noncognitive selection criteria as predictors of
resident performance. Investigative Radiology, 25(7), 855-859.
Woodruff, D. J., & Ziomek, R. L. (2004). High school grade inflation from 1991 to 2003
ACT Research Reports, Iowa City: ACT.
Yates, T., Tyrell, F., & Masten, A. (2015). Resilience theory and the practice of positive
psychology from individuals to societies. In S. Joseph (Ed.), Positive psychology
in practice: Promoting human flourishing in work, health, education, and
everyday life (2nd ed., pp. 773-788). Hoboken, NJ: John Wiley.
Young, J. W., & Koplow, S. L. (1997). The validity of two questionnaires for predicting
minority students’ college grades. The Journal of General Education, 46(1),
45-55.

156
Zheng, J. L., Saunders, K. P., Shelley, M. C., II, & Whalen, D. F. (2002). Predictors of
academic success for freshman residence hall students. Journal of College Student
Development, 43(2), 267-283.
Zwick, R., & Green, J. G. (2007). New perspectives on the correlation of SAT scores,
high school grades, and socioeconomic factors. Journal of Educational
Measurement, 44(1), 23-45.

157
APPENDIX A
GRIT-S SHORT SCALE

158
Short Grit Scale
Directions for taking the Grit Scale: Here are a number of statements that may or may not
apply to you. For the most accurate score, when responding, think of how you compare to
most people--not just the people you know well, but most people in the world. There are
no right or wrong answers, so just answer honestly!
1. New ideas and projects sometimes distract me from previous ones.*
Very much like me
Mostly like me
Somewhat like me
Not much like me
Not like me at all
2. Setbacks don’t discourage me.
Very much like me
Mostly like me
Somewhat like me
Not much like me
Not like me at all
3. I have been obsessed with a certain idea or project for a short time but later lost
interest.*
Very much like me
Mostly like me
Somewhat like me
Not much like me
Not like me at all
4. I am a hard worker.
Very much like me
Mostly like me
Somewhat like me
Not much like me
Not like me at all

159
5. I often set a goal but later choose to pursue a different one.*
Very much like me
Mostly like me
Somewhat like me
Not much like me
Not like me at all
6. I have difficulty maintaining my focus on projects that take more than a few
months to complete.*
Very much like me
Mostly like me
Somewhat like me
Not much like me
Not like me at all
7. I finish whatever I begin.
Very much like me
Mostly like me
Somewhat like me
Not much like me
Not like me at all
8. I am diligent.
Very much like me
Mostly like me
Somewhat like me
Not much like me
Not like me at all
Scoring:
1. For questions 2, 4, 7 and 8 assign the following points:
5 = Very much like me
4 = Mostly like me
3 = Somewhat like me
2 = Not much like me
1 = Not like me at all

160
2. *For questions 1, 3, 5 and 6 assign the following points:
1 = Very much like me
2 = Mostly like me
3 = Somewhat like me
4 = Not much like me
5 = Not like me at all
Add up all the points and divide by 8. The maximum score on this scale is 5 (extremely
gritty), and the lowest score on this scale is 1 (not at all gritty).
Grit Scale citation:
Duckworth, A. L, & Quinn, P. D. (2009). Development and validation of the Short Grit
Scale (Grit-S). Journal of Personality Assessment, 91:2, 166-174. Retrieved from
http://www.sas.upenn.edu/~duckwort/images/Duckworth%20and%20Quinn.pdf
Duckworth, A. L., Peterson, C., Matthews, M. D., & Kelly, D. R. (2007). Grit:
Perseverance and passion for long-term goals. Journal of Personality and Social
Psychology, 92(6), 1087-1101. Retrieved from
http://www.sas.upenn.edu/~duckwort/images/Grit%20JPSP.pdf

161
APPENDIX B
INSTITUTIONAL REVIEW BOARD APPROVAL

162

163
Institutional Review Board
Researcher: Sean Broghammer, M.Ed., Higher Education and Student Affairs Leadership
(HESAL) 970-351-2806
Research Advisor: Dr. Matthew Birnbaum, Higher Education and Student Affairs
Leadership, 970-351-2598.
This past year you enrolled at the University of Northern Colorado as a first-year student.
In an effort to better understand the pre-collegiate indicators of students, I am interested
to assess your level of grit. I am a graduate student in UNC’s Higher Education and
Student Affairs Leadership doctoral program and this survey is designed to find out how
grit is associated with future academic success in college, specifically predicting college
grade point average, persistence to second semester, and retention to second year.
This survey takes most students only about 5 minutes and contains eight questions that
may or may not apply to you. By clicking “Finished” at the end of this survey, you are
giving your consent to participate.
I will not have any contact with you other than this email. When responses are submitted
electronically they cannot be guaranteed secure and therefore confidentially cannot be
guaranteed. However, the name of participants will not appear in any report of this
research and your name will not appear anywhere on the survey, so your answers will
remain anonymous. There are no foreseeable risks associated with you completing this
survey. Although there are not likely to be any direct benefits to you, your responses will
be useful to the Admissions department at UNC and potentially offer greater
opportunities for students to gain access to higher education.
Please feel free to call me if you have any questions or concerns about this research.
Thank you for your participation.
Sean Broghammer
Graduate Student at UNC
970-351-2806

164
Participation is voluntary. You may decide not to participate in this study and if you
begin participation you may still decide to stop and withdraw at any time. Your decision
will be respected and will not result in loss of benefits to which you are otherwise
entitled. Having read the above and having had an opportunity to ask any questions
please complete the questionnaire if you would like to participate in this research. By
completing the questionnaire, you give me the permission to link your grit scores to
institutional data including demographic, first-year college grade point average,
persistence and retention data. You may keep this form for future reference. If you have
any concerns about your selection or treatment as a research participant, please contact
the Office of Sponsored Programs, Kepner Hall, University of Northern Colorado
Greeley, CO 80639; 970-351-1907.
Click “Next” to get started.


