IOSR Journal of Applied Geology and Geophysics (IOSR-JAGG)
e-ISSN: 2321–0990, p-ISSN: 2321–0982.Volume 2, Issue 2 Ver. II. (Mar-Apr. 2014), PP 57-66
www.iosrjournals.org
www.iosrjournals.org 57 | Page
Groundwater Quality and its Suitability for Domestic and
Agricultural Use in Khanaqin Town, Iraq
Khalid Abdullah and Bhavana N. Umrikar* Department of Geology, University of Pune, Pune-411007, Maharashtra, India.
Abstract: Khanaqin area is drained by an ancient river Al-Wand which is a vital source of water for
agricultural activities in the area. In summer months, discharge in Al-Wand River decreases
considerably, threatening the agricultural practices and economic situation in Khanaqin. It has been
observed that the water levels were high in 1980s, reaching a discharge/flow of 10m3/s whereas the
river flow has been reduced to >1m3/s or sometimes dry up in summer. As a result the province is
suffering from severe scarcity of both drinking- and irrigation water. Ultimately the groundwater
dependency is on rise and during last few years the number of bore wells has increased in and
around Khanaqin area. In present situation, groundwater is the major source for domestic and
agricultural activity in this area. For the present study, the need for groundwater quality analysis
was felt and the samples were collected from 16 representative bore wells in the year 2012. These
groundwater samples were analyzed for physico-chemical parameters. Based on the limits
prescribed by WHO, Iraqi Drinking Water Standards and Bureau of Indian Standard (2003) 25%,
68.75%, 68.75%, 43.75%, 18.75%, 50%, 12.5%, 50% and 6.25% of the samples did not fall under
the prescribed safe limits for Total Dissolved Solids, Total Hardness, Ca+2
, Mg+2
, Na+, Alkalinity, Cl
-
, SO4-2
and K+ respectively. Suitability of groundwater for irrigation was evaluated based on various
indices. Kelly’s Ratio, Permeability Index and Soluble Sodium Percentage analysis shows two, six
and two samples falling in unsuitable category respectively, whereas all sixteen samples fall in safe
category for Residual Sodium Carbonate index.
Keywords: Groundwater quality, drinking, agriculture, suitability indices, Khanaqin, Iraq.
I. Introduction The study based on GRACE data carried out by scientists [1] (The team led by Jay Famiglietti and Kate
Voss of the University of California–Irvine (UCI) and Georgetown University with other researchers from
NASA’s Goddard Space Flight Center and the National Center for Atmospheric Research, used the data
acquired by twin gravity-measuring satellites of the Gravity Recovery and Climate Experiment) depicted an
alarming rate of decrease in total water storage in the Euphrates and Tigris river basins. The main reasons for
this loss of water were listed as increasing demand, over pumping of groundwater, poor management and the
impact of the devastating 2007 drought, whose effects are still being felt. Water resources in Kurdistan region
comprise the large amount of surface water including the main rivers namely Greater Zab, Lesser Zab, Sirwan
and Al-Wand rivers. Al-Wend River flows east - west through the Khanaqin town. The discharge of the river is
decreasing at an alarming rate, threatening the agricultural practices and economic situation in Khanaqin. As a
result dependency on groundwater is on rise and the integrated approach for water resource management is
necessary [2, 3]. The groundwater quality in the study area is equally important as its quantity [4, 5]. On this
background, the quality of groundwater in Khanaqin town has been evaluated based on different indices to
understand the groundwater suitability for drinking and irrigation purposes.
II. The Study Area
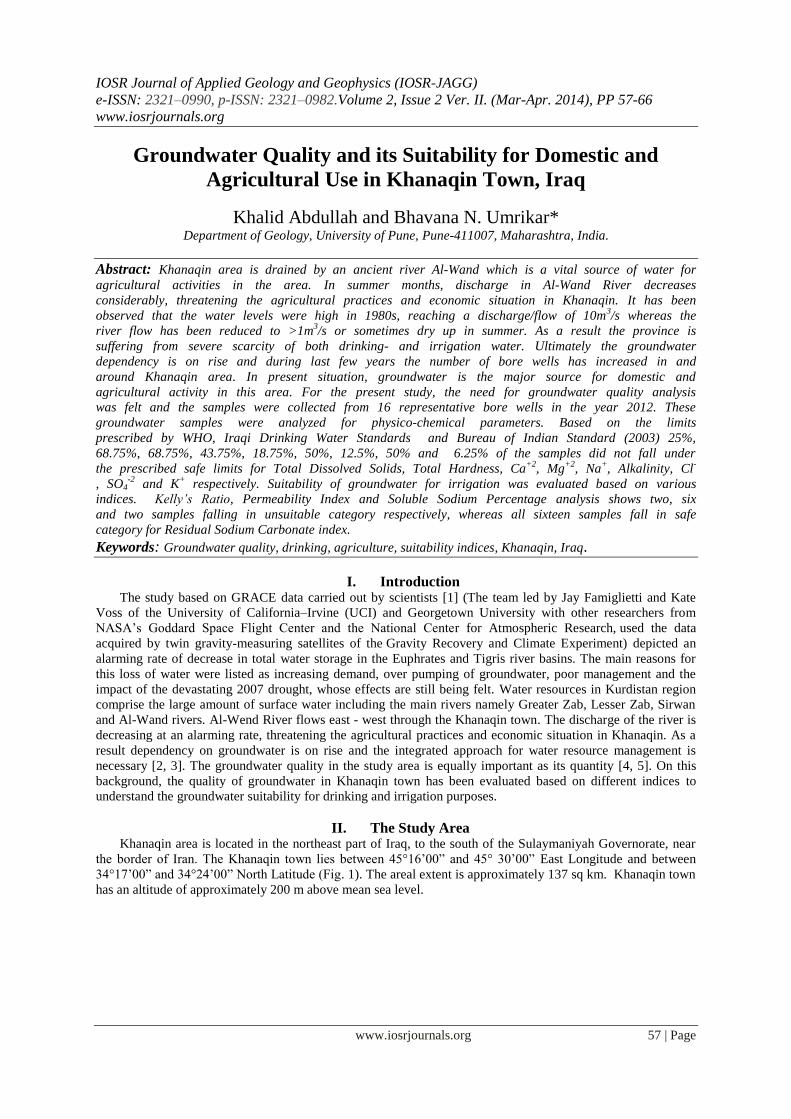
Khanaqin area is located in the northeast part of Iraq, to the south of the Sulaymaniyah Governorate, near
the border of Iran. The Khanaqin town lies between 45°16’00” and 45° 30’00” East Longitude and between
34°17’00” and 34°24’00” North Latitude (Fig. 1). The areal extent is approximately 137 sq km. Khanaqin town
has an altitude of approximately 200 m above mean sea level.
Groundwater Quality and its Suitability for Domestic and Agricultural Use in Khanaqin Town, Iraq
www.iosrjournals.org 58 | Page
Fig. 1. Location map of Khanaqin town.
The climate of the country is arid to semi- arid continental type. The climate of study area is affected by
Mediterranean Climatological System. The climate of north Iraq is very hot-dry in summer and cold in winter,
whereas the climate of Khanaqin area is characterized by semi-arid type with hot summer and mild to cold
winter. There is a wide variation in distribution of rainfall in the country. Annual rainfall in the northern hills
and mountain ranges varies between 300 and 1000 mm whereas in the extreme south and west it is in the range
of 100 to 200 mm. Khanaqin weather station data reveals that the average annual relative humidity is 48.54%.
The maximum annual average monthly evaporation is 575.5mm in July, while the minimum is 49.9mm in
January.
III. Geological Setting The study area comprises of Tertiary and Quaternary deposits. Tertiary deposits are divided into Upper
Bakhtiary and Lower Bakhtiary formations. The brief description of these formations is given below:
3.1 Tertiary Deposits
3.1.1 Upper Bakhtiari formation (Bai Hassan)
This formation is characterized by alternate layers of conglomerate, sandstone, clay stone and siltstone.
The thickness of this formation ranges between 300 - 1900m [6]. The formation is overlain by alluvial deposits
and also covered by fine grained sediment of Quaternary age in some parts. The Bai Hassan formation is
originated from the highly folded Zagros zone (Fig. 2).
3.1.2 Lower Bakhtiari formation (Muqdadiya)
The Lower Bakhtiari formation comprises of (fining upwards) cycles of gravely sandstone, sandstone
and red clay stones [7]. The thickness of the formation in the study area ranges from 1200-1300m [8]. The
formation is distributed mostly in the Foothill and Mesopotamian Zone .The Lower Bakhtiari was deposited in
fluvial environment in the rapidly subsidence fore deep basin. The Upper and Lower Bakhtiari formations cover
the eastern and southern part of the study area.
3.2 Quaternary Deposits
The age of these deposits is mostly of Holocene and Pleistocene. It covers a wide area of Khanaqin
town and comprises of gravel, sand, clay, loam and conglomerate. The particles size varies from the course
gravel to fine silt as well as loam [9]. The intergranular type comprises a good aquifer mostly in the North and
Southwest part of the study area.

Groundwater Quality and its Suitability for Domestic and Agricultural Use in Khanaqin Town, Iraq
www.iosrjournals.org 59 | Page
The soil in the study area is suitable for agriculture. It has greater thickness near the bank of Al-wand River. The
increasing degradation of soils, salinity and the desertification is a common problem in Iraq.
Fig. 2. Geological map of the study area.
IV. Hydrogeology
Hydrogeological rock units in the Khanaqin area consist of Lower Bakhtiari Formation, Upper Bakhtiari
Formation and Quaternary deposits. The hydrogeological characteristics of foothill zone have been studied by
Araim and Said [10] and Alsam and Hanna [11]. Local aquifer system or main aquifer system in the Khanaqin
area is represented by both Quaternary deposits and Lower Bakhtiari formation [12].
Quaternary deposits consist of conglomerate, gravel, sand, silt and clay. Quaternary aquifers have thickness
ranging between 5 and 40 m. These aquifers have high transmissivity and high discharge in wells with low
salinity in majority of the wells. Lower Bakhtiari aquifer includes gravel, sandstone and clay stone.
V. Materials And Methods
Bore well is the main source for water supply in the area. Total 16 bore wells tapping Lower Bakhtiari,
Upper Bakhtiari and Quaternary aquifers were inventoried. According to the lithological profile / section of the
wells observed in study area, most of the wells penetrate through Quaternary deposits and few of them have
struck the Bakhtiari Formation. The groundwater samples were collected from the bore wells located at the
Khanaqin town, as few dug wells exist in this region. The water samples were analyzed in the laboratory of the
Directory of Water, Sulaimaniyah Division. The hydrochemical study of groundwater in Khanaqin town
includes analysis of major cations - anions [13] and also total alkalinity, Total Hardness (TH), Electrical
Conductivity (EC), and hydrogen reactivity (pH).
In the study area the ground elevations were measured by a handheld GPS and depth to static water
level was marked by using the electrical sounder in the month of June, 2012. Reduced Level (RL) was
calculated by subtracting the static water level from the ground elevation of the well. The location of these wells
is shown in Figure 3 and the bore well inventory details are included in Table –1. The depth of the bore wells in
the study area ranges from 36 - 72 m and the depth to static water level (S.W.L.) ranges from 8 - 30 m. The
static water level data has been interpolated to generate the water table contours for the dry season (June, 2012)
as shown in Figure 4.

Groundwater Quality and its Suitability for Domestic and Agricultural Use in Khanaqin Town, Iraq
www.iosrjournals.org 60 | Page
Fig.3. Location map of bore wells inventoried in study area.
Table 1. The details of bore well inventory.
Sr. No.
Location Northing (UTM
coordinate)
Easting (UTM
coordinate)
Elevation (m)
Depth (m)
Static Water
Level
(m)
Discharge (liters per
second)
1 Banmil 3 341846.5 452406.1 186 60 14.0 6.0
2 Upper Kerez 341928.6 452313.3 185 54 10.0 6.0
3 Banmil Center 341853.8 452460.0 186 60 18.4 7.0
4 Banmil 2 341857.1 452353.9 187 60 19.4 7.0
5 Mazrae 342023.5 452326.0 190 36 17.0 5.0
6 Imam Abas 342022.5 452159.0 188 60 08.0 7.0
7 Mutanaza 342009.2 452219.3 186 60 13.0 7.0
8 Tola frosh 342125.1 452231.7 181 60 10.0 8.0
9 Imam Abas - ezae 342020.3 452148.4 189 60 30.0 3.5
10 Kalat 341933.5 452335.9 185 72 25.0 5.0
11 Mekhas 1 342232.5 452225.7 179 72 10.4 8.0
12 Mekhas 2 342240.3 452221.5 177 72 10.5 8.0
13 Alimurad 342143.6 452246.2 183 60 10.0 8.0
14 Azadi 2 341828.7 452301.1 188 54 15.0 7.0
15 Azadi 1 341906.0 452249.0 187 54 20.0 8.0
16 Ahmad tahir 341920.9 451913.1 156 66 23.0 8.0
Fig.4. Groundwater table contour map of the study area.

Groundwater Quality and its Suitability for Domestic and Agricultural Use in Khanaqin Town, Iraq
www.iosrjournals.org 61 | Page
VI. Results And Discussion
It is revealed from the groundwater table contour map that the water table contours are closely spaced
in the central part of the study area compared to the periphery. The hydraulic head is decreasing towards south
and southwest part of the study area. It is depicted from the groundwater table contours that the River has an
influent status and hence decreasing discharge in the river will result into decrease in groundwater recharge.
6.1 Groundwater chemistry
The pH values for drinking water as per World Health Organization [14] and Iraqi Drinking Water
Standards [15] are falling between 6.5 and 8.5. The pH value for groundwater samples in study area ranges from
7.12 - 8.30 which shows alkaline nature (Table -2). The lowest value of EC is 388μs/cm in the Mekhas2 bore
well located in the north of Khanaqin town, while the highest value of EC 1988 μs/cm is recorded in Banmil
Center bore well located toward south of Khanaqin. Most of the groundwater samples show TDS values less
than 1000 ppm, except the bore wells in Banmil Center, Imam Abas-Ezae, Ali Murad and Azadi 2 sites that
show the TDS content more than 1000 ppm. The lowest value of TDS is 194 ppm in Mekhas bore well, while
the highest value is 1272 ppm in bore well located at Banmil Center.
Table 2: Physico-chemical data of the bore well groundwater samples.
Sr. No.
Location pH EC
μs/cm TDS
Ca⁺²
mg/l
Mg⁺² mg/l
Na⁺ mg/l
K⁺ mg/l
HCO₃⁻ mg/l
SO₄⁻² mg/l
Cl⁻ mg/l
1 Banmil 3 7.7 1518 972 216 188.6 220 1.29 255 640 88
2 Upper karez 7.9 1518 974 400 339.9 356 3.73 325 1080 342
3 Banmil-Center 7.6 1988 1272 264 225.15 127 1.38 325 665 121
4 Banmil 2 8.2 1505 963 240 197.18 83 1.38 200 675 92
5 Mazrae’ 8.1 1433 910.7 236 2.4 69.7 3.07 290 358.4 83
6 Imam abas 8.1 1251 800.6 188 36.4 65.6 3.1 310 324.8 83
7 Mutanaza 8.0 1262 807.6 184 47.5 67.6 3.45 316 259.2 84
8 Tola frosh 7.6 1135 726.4 144 116.3 40.8 1.85 325 187 54
9 Imam Abas-ezae
7.8 1931 1235 336 227.4 65.6 1.85 150 132 75
10 Kalat 8.3 1940 988 140 46 47 2.37 160 162 68
11 Mekhas 1 7.4 1062 205 66.1 25.4 56 1.3 175 53 39
12 Mekhas 2 7.5 388 194 48 36 21.2 1.42 210 62.31 32
13 Ali murad 8.2 945 1173 2.5 1.8 10.3 2.15 25 9 3.8
14 Azadi 2 7.1 1760 1186 110 65 264 12 88 499 380
15 Azadi 1 7.4 1321 670 75.1 25 81 2.02 92 200 117
16 Ahmad Tahir 7.1 1075 713 53 28 148 0.6 68 230 190
6.2 Hydrochemical Facies
Piper plot has been used to infer the hydrochemical facies of groundwater. It has been depicted from
the Piper Trilinear Diagram [16] that most of the groundwater samples in study area fall under the Ca2+
+ Mg2+
–
Cl- +SO4
2- groundwater facies (Fig. 5). The facies falls within the alkaline earth water type.
Fig.5. Piper’s trilinear diagram showing hydrochemical facies for the groundwater samples.
Groundwater Quality and its Suitability for Domestic and Agricultural Use in Khanaqin Town, Iraq
www.iosrjournals.org 62 | Page
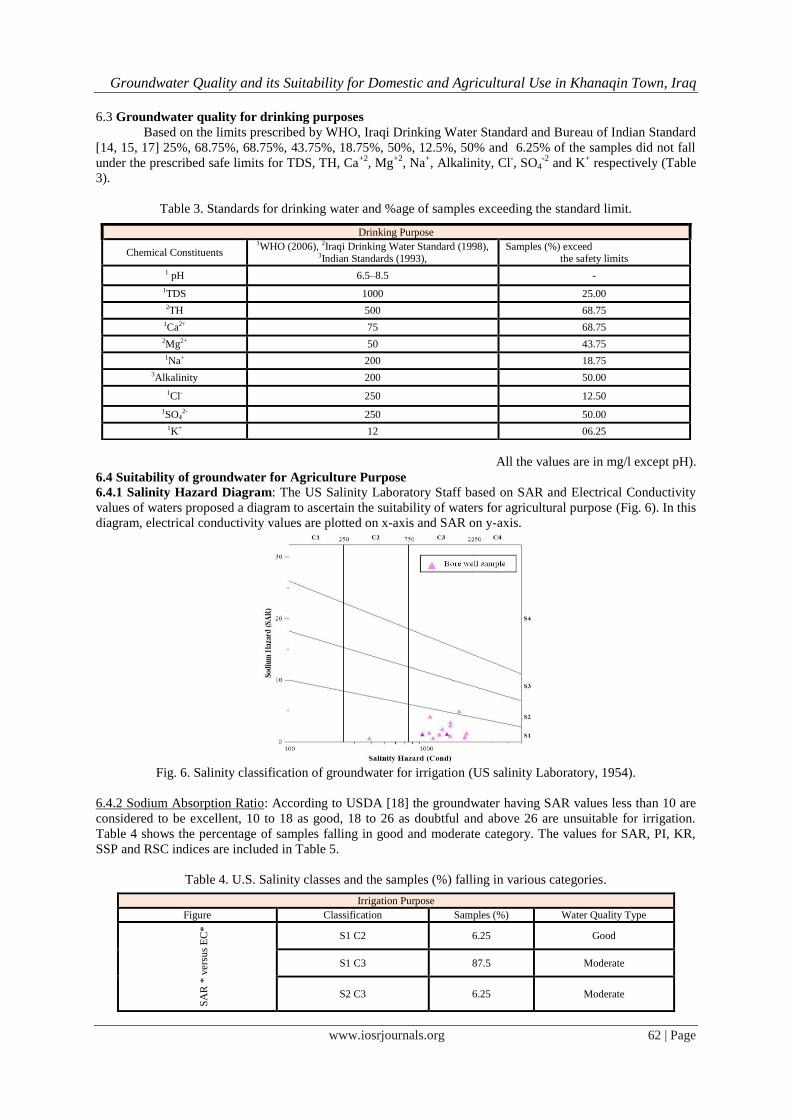
6.3 Groundwater quality for drinking purposes
Based on the limits prescribed by WHO, Iraqi Drinking Water Standard and Bureau of Indian Standard
[14, 15, 17] 25%, 68.75%, 68.75%, 43.75%, 18.75%, 50%, 12.5%, 50% and 6.25% of the samples did not fall
under the prescribed safe limits for TDS, TH, Ca+2
, Mg+2
, Na+, Alkalinity, Cl
-, SO4
-2 and K
+ respectively (Table
3).
Table 3. Standards for drinking water and %age of samples exceeding the standard limit.
All the values are in mg/l except pH).
6.4 Suitability of groundwater for Agriculture Purpose
6.4.1 Salinity Hazard Diagram: The US Salinity Laboratory Staff based on SAR and Electrical Conductivity
values of waters proposed a diagram to ascertain the suitability of waters for agricultural purpose (Fig. 6). In this
diagram, electrical conductivity values are plotted on x-axis and SAR on y-axis.
Fig. 6. Salinity classification of groundwater for irrigation (US salinity Laboratory, 1954).
6.4.2 Sodium Absorption Ratio: According to USDA [18] the groundwater having SAR values less than 10 are
considered to be excellent, 10 to 18 as good, 18 to 26 as doubtful and above 26 are unsuitable for irrigation.
Table 4 shows the percentage of samples falling in good and moderate category. The values for SAR, PI, KR,
SSP and RSC indices are included in Table 5.
Table 4. U.S. Salinity classes and the samples (%) falling in various categories.
Drinking Purpose
Chemical Constituents 1WHO (2006), 2Iraqi Drinking Water Standard (1998),
3Indian Standards (1993), Samples (%) exceed
the safety limits
1 pH 6.5–8.5 -
1TDS 1000 25.00 2TH 500 68.75
1Ca2+ 75 68.75 2Mg2+ 50 43.75 1Na+ 200 18.75
3Alkalinity 200 50.00
1Cl- 250 12.50
1SO42- 250 50.00
1K+ 12 06.25
Irrigation Purpose
Figure Classification Samples (%) Water Quality Type
SA
R *
ver
sus
EC
*
S1 C2 6.25 Good
S1 C3 87.5 Moderate
S2 C3 6.25 Moderate

Groundwater Quality and its Suitability for Domestic and Agricultural Use in Khanaqin Town, Iraq
www.iosrjournals.org 63 | Page
Table 5. Values of SAR, PI, KR, SSP and RSC in groundwater samples.
Well No* Location %Na SAR PI KR SSP RSC
1 Banmil 3 26.73 2.64 32.36 0.36 26.66 -22.12
2 Upper karez 24.51 3.16 28.05 0.32 24.41 -42.61
3 Banmil-Center 14.91 1.39 21.03 0.17 14.83 -26.37
4 Banmil 2 11.45 0.96 17.04 0.13 11.35 -24.92
5 Mazrae’ 9.66 0.79 16.23 0.10 9.44 -24.31
6 Imam Abas 40.27 3.32 50.96 0.67 40.04 -7.29
7 Mutanaza 18.74 1.15 32.50 0.22 18.29 -7.91
8 Tola frosh 9.78 0.61 22.01 0.11 9.55 -11.43
9 Imam Abas-ezae 7.55 0.68 11.52 0.08 7.43 -33.03
10 Kalat 16.31 0.88 28.54 0.19 15.91 -8.16
11 Mekhas1 31.32 1.48 52.75 0.45 31.03 -2.51
12 Mekhas1 15.16 0.56 44.25 0.17 14.67 -1.91
13 Ali Murad 10.51 0.31 22.79 0.10 9.47 -3.90
14 Azadi 2 52.10 4.93 56.81 1.06 51.43 -9.40
15 Azadi 1 38.11 2.07 50.95 0.61 37.77 -4.29
16 Ahmad Tahir 56.61 4.09 65.82 1.30 56.55 -3.83
6.4.3 Permeability Index (PI): Doneen [19] and WHO [op cit] has mentioned the criterion for
assessing the suitability of groundwater for irrigation based on this index, where the concentrations
are in meq/l. The PI values above 75 are indicative of excellent quality of groundwater for irrigation;
between 25 and 75 good quality and the values below 25 reflect unsuitability of groundwater for
agriculture purpose (Table 6).
Table 6. Number of samples falling in excellent, good and unsuitable category
Groundwater
samples
PI
>75 25-75 <25
Excellent Good Unsuitable
No. of samples 1 9 6
6.4.4 Kelly’s Ratio (KR): Sodium measured against calcium and magnesium was considered by
Kelly [20] to calculate this parameter, in order to evaluate the suitability of groundwater for
agricultural purpose. There are 14 samples falling in excellent category (Table 7).
Table 7. Number of samples showing excellent and unsuitable category.
Groundwater samples
KR
< 1
> 1
Excellent Unsuitable
No. of samples 14 2
Groundwater Quality and its Suitability for Domestic and Agricultural Use in Khanaqin Town, Iraq
www.iosrjournals.org 64 | Page
6.4.5 Soluble Sodium Percentage (SSP): The values of SSP, if less than 50, indicate good quality of
groundwater whereas above 50 unsuitability of water for agricultural purpose (Table 8).
Table 8. Soluble sodium percentage based classification of groundwater samples.
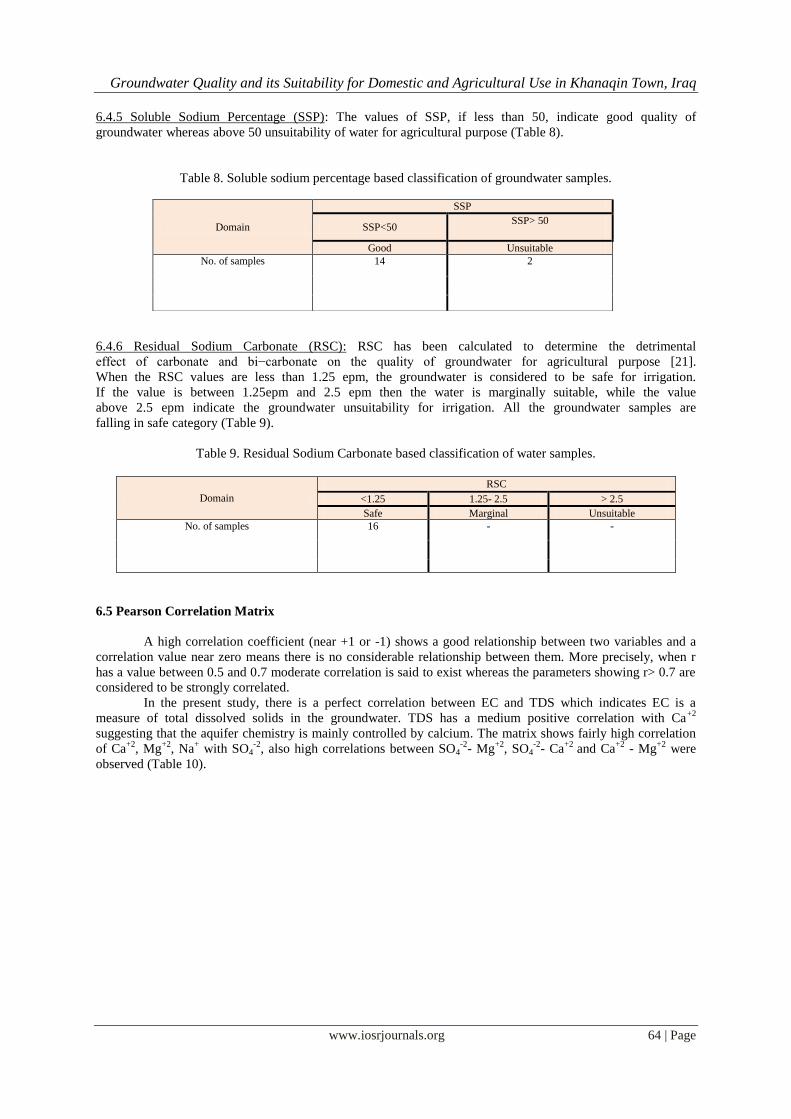
6.4.6 Residual Sodium Carbonate (RSC): RSC has been calculated to determine the detrimental
effect of carbonate and bi−carbonate on the quality of groundwater for agricultural purpose [21].
When the RSC values are less than 1.25 epm, the groundwater is considered to be safe for irrigation.
If the value is between 1.25epm and 2.5 epm then the water is marginally suitable, while the value
above 2.5 epm indicate the groundwater unsuitability for irrigation. All the groundwater samples are
falling in safe category (Table 9).
Table 9. Residual Sodium Carbonate based classification of water samples.
Domain
RSC
<1.25 1.25- 2.5 > 2.5
Safe Marginal Unsuitable
No. of samples 16
- -
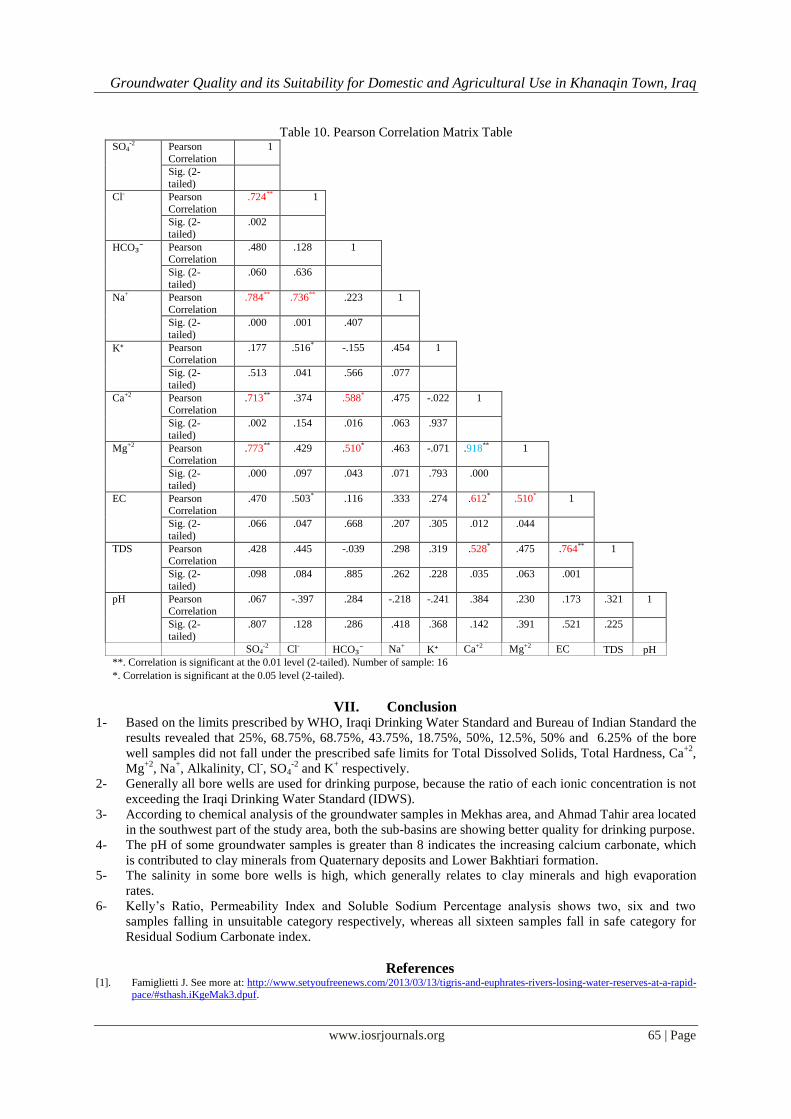
6.5 Pearson Correlation Matrix
A high correlation coefficient (near +1 or -1) shows a good relationship between two variables and a
correlation value near zero means there is no considerable relationship between them. More precisely, when r
has a value between 0.5 and 0.7 moderate correlation is said to exist whereas the parameters showing r> 0.7 are
considered to be strongly correlated.
In the present study, there is a perfect correlation between EC and TDS which indicates EC is a
measure of total dissolved solids in the groundwater. TDS has a medium positive correlation with Ca+2
suggesting that the aquifer chemistry is mainly controlled by calcium. The matrix shows fairly high correlation
of Ca+2
, Mg+2
, Na+ with SO4
-2, also high correlations between SO4
-2- Mg
+2, SO4
-2- Ca
+2 and Ca
+2 - Mg
+2 were
observed (Table 10).
Domain
SSP
SSP<50 SSP> 50
Good Unsuitable
No. of samples 14 2
Groundwater Quality and its Suitability for Domestic and Agricultural Use in Khanaqin Town, Iraq
www.iosrjournals.org 65 | Page
Table 10. Pearson Correlation Matrix Table SO4
-2 Pearson
Correlation
1
Sig. (2-
tailed)
Cl- Pearson
Correlation
.724** 1
Sig. (2-
tailed)
.002
HCO₃⁻ Pearson Correlation
.480 .128 1
Sig. (2-
tailed)
.060 .636
Na+ Pearson Correlation
.784** .736** .223 1
Sig. (2-
tailed)
.000 .001 .407
K⁺ Pearson Correlation
.177 .516* -.155 .454 1
Sig. (2-
tailed)
.513 .041 .566 .077
Ca+2 Pearson Correlation
.713** .374 .588* .475 -.022 1
Sig. (2-
tailed)
.002 .154 .016 .063 .937
Mg+2 Pearson Correlation
.773** .429 .510* .463 -.071 .918** 1
Sig. (2-
tailed)
.000 .097 .043 .071 .793 .000
EC Pearson Correlation
.470 .503* .116 .333 .274 .612* .510* 1
Sig. (2-
tailed)
.066 .047 .668 .207 .305 .012 .044
TDS Pearson Correlation
.428 .445 -.039 .298 .319 .528* .475 .764** 1
Sig. (2-
tailed)
.098 .084 .885 .262 .228 .035 .063 .001
pH Pearson Correlation
.067 -.397 .284 -.218 -.241 .384 .230 .173 .321 1
Sig. (2-
tailed)
.807 .128 .286 .418 .368 .142 .391 .521 .225
SO4-2 Cl- HCO₃⁻ Na+ K⁺ Ca+2 Mg+2 EC TDS pH
**. Correlation is significant at the 0.01 level (2-tailed). Number of sample: 16
*. Correlation is significant at the 0.05 level (2-tailed).
VII. Conclusion 1- Based on the limits prescribed by WHO, Iraqi Drinking Water Standard and Bureau of Indian Standard the
results revealed that 25%, 68.75%, 68.75%, 43.75%, 18.75%, 50%, 12.5%, 50% and 6.25% of the bore
well samples did not fall under the prescribed safe limits for Total Dissolved Solids, Total Hardness, Ca+2
,
Mg+2
, Na+, Alkalinity, Cl
-, SO4
-2 and K
+ respectively.
2- Generally all bore wells are used for drinking purpose, because the ratio of each ionic concentration is not
exceeding the Iraqi Drinking Water Standard (IDWS).
3- According to chemical analysis of the groundwater samples in Mekhas area, and Ahmad Tahir area located
in the southwest part of the study area, both the sub-basins are showing better quality for drinking purpose.
4- The pH of some groundwater samples is greater than 8 indicates the increasing calcium carbonate, which
is contributed to clay minerals from Quaternary deposits and Lower Bakhtiari formation.
5- The salinity in some bore wells is high, which generally relates to clay minerals and high evaporation
rates.
6- Kelly’s Ratio, Permeability Index and Soluble Sodium Percentage analysis shows two, six and two
samples falling in unsuitable category respectively, whereas all sixteen samples fall in safe category for
Residual Sodium Carbonate index.
References [1]. Famiglietti J. See more at: http://www.setyoufreenews.com/2013/03/13/tigris-and-euphrates-rivers-losing-water-reserves-at-a-rapid-
pace/#sthash.iKgeMak3.dpuf.

Groundwater Quality and its Suitability for Domestic and Agricultural Use in Khanaqin Town, Iraq
www.iosrjournals.org 66 | Page
[2]. Al-Manmi DA. Water Resources management in Rania Area, Sulaimaniyah, NE-Iraq. Unpublished P.hD. Thesis, College of
Science, University of Baghdad. 2008; 225. Heshmati A. Integrated Water Resource Management in the Kurdistan Region (Water Resource Planning, Development and Management). Nova Science Publishers, Inc., 2013; ISBN-13: 978-1607412953, 225.
[3]. Lawa FA, Kareem KH, Ali SS. Hydrogeological study of Sulaimaniyah and part of Kirkuk areas, NE Iraq.Part two: Bazian-Sangaw
Basin, Surdash-Koya asin, Qaradagh-Kalar Basin. Report, FAO GWU documentation Fund, Erbil; 2002. [4]. Nabi AQ. Limnological and bacteriological studies on some wells within Hawler city, Kurdistan region, Iraq. M.Sc. Thesis, Univ.
of Salahaddin, Hawler; 2005.
[5]. Al-Jibori H. Hydrogeological map of Khanaqin, sheet (NI, 38-7), state company of geological survey and mining –Iraq; 2006. [6]. Buday.T, Jassim SZ. The regional geology of Iraq, vol.2:Tectonism., Magmatism and metamorphism. Publication of GEOSURV,
Baghdad, 1987; 352.
[7]. Taha MA. The Displacement Criteria in Fibrous Crystalline Gypsum Veins in Hamrin South Anticline East of Iraq. J. of Basra Researches (Sciences); 2010; 36 (4): 29-41.
[8]. Buday T. The Regional Geology of Iraq, Vol. I. Stratigraphy and Paleogeography. I.I.M. Kassab and S.Z.Jassim (eds). SOM,
Baghdad, Dar El Kutib Publ. House, Univ. of Mosul., 1980; 445. [9]. Araim HI, Said H. Groundwater regional study in the adhaim river basin with emphasis on the pain area. Manuscript report,
Geosurv, Baghdad, 1980.
[10]. Alsam SI, Hanna F. Evoluation of groundwater resources in Khazir-Gomel basin. Manuscript report, Geosurv, Baghdad.Ameen,
M.S. (1992) Effect of basement tectonics on hydrocarbon generation, migration, and accumulation in northern Iraq. AAPG; 1983;
76(3): 356–370.
[11]. Shawkat A. Hydrogeology of Khanaqin area. Ministry of water resource. 2005; 127. [12]. American Public Health Association (A.P.H.A). Standard Methods For The Examination of Water and Waste Water, 16th ed.
A.P.H.A., 1015 Eighteenth street NW, Washington, DC. 1989; 36.
[13]. WHO. Guidelines to drinking water quality. World Health Organization, Geneva; 1996; 2:989. [14]. Iraq Drinking Water Standards. First update–drinking-water, IQS 417/2001, ICS: 13.060.20, Council of Ministers – Central Agency
for Meteorology and Quality Control; 2001.
[15]. Piper AM. A graphical procedure in the geochemical interpretation of water analysis. Transactions American Geophysical Union; 1944; 25: 914–928.
[16]. BIS. Bureau of Indian Standards Specification for drinking water. IS: 10500:91. Revised 2003, Bureau of Indian Standards, New
Delhi. 2003. [17]. U.S. Department of Agriculture. Diagnosis and Improvement of Saline and Alkali Soils, U.S. Salinity Laboratory Staff. Handbook,
Government Printing Office, Washington D.C.; 1954; 60.
[18]. Doneen LD. Water quality for agriculture. Department of Irrigation, University of California, Davis. 1964; 48. [19]. Kelly WP. Adsorbed sodium cation exchange capacity and percentage sodium sorption in alkali soils. Science. 1957; 84: 473–477.
[20]. Eaton FM. Significance of carbonate in irrigation waters. Soil Science, 1950; 69: 123–133.


