
Group 21 Member: Lam King Ho (98003010)
Lau Shu Fat (98003430)
Li Chi Chung (98002690)
Lam Wing Yin (98002850)
Poon Hing Sheng (98249700)
Educational Communication and Technology (EDD5161A)
PowerPoint Presentation
Topic: Concept and Graphical Representation of Functions
GO
Concept of function:
Trigonometric functionLogarithmic functionQuadratic function
Design Objectives:
Enhance students’ interest in understanding concept of functions and graphical representation of functionsProvide a time-saving package for student/teacher in drawing graphs of different functionsEnable a quick understanding of graphical variations upon changes of the coefficientsApplicable to varies level of students ( Form 3 to 5)

Guidelines to use:
Designed for students to use before or after the class but NOT in the class
Designed as assisting program besides the classroom teaching
Target Student :Age: Form two to Form fourAbility: Band 3Attitude: self-motivated, eager to learn
Authors’ part of design:
Concept of function ( Lam king ho & Poon hing sheng )Trigonometric function ( Li chi chung & Lau shu fat )Logarithmic function ( Lam wing yin & Lam king ho )Quadratic function ( Lau shu fat & Lam king ho )


Function: f(x)=x+5

x
Function: f(x)=x+5
x
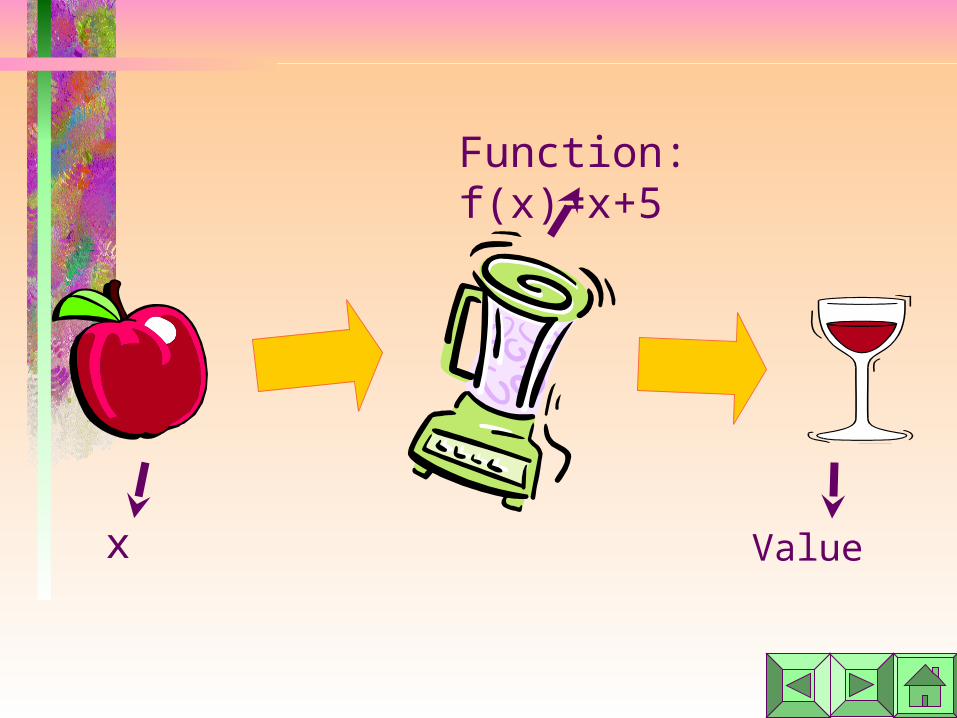
Function: f(x)=x+5
Value

x= 1 6
Function: f(x)=x+5
Value=
Function: f(x)=x+5Function: f(x)=x+5Function: f(x)=x+5

x= -3 2
Function: f(x)=x+5
Value=
Function: f(x)=x+5Function: f(x)=x+5Function: f(x)=x+5
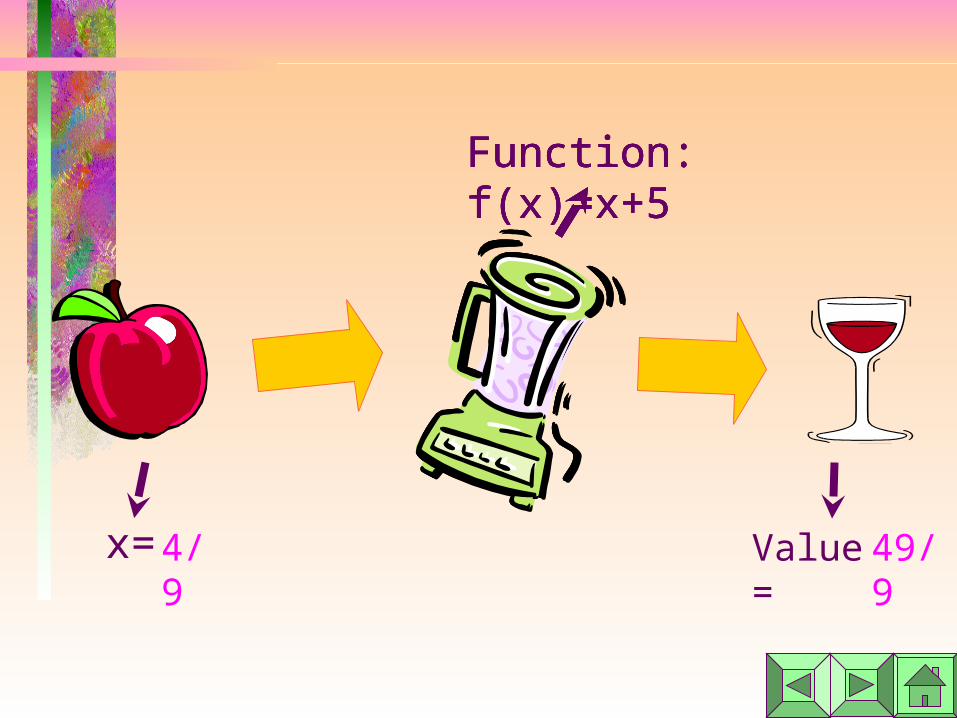
x= 4/9 49/9
Function: f(x)=x+5
Value=
Function: f(x)=x+5Function: f(x)=x+5Function: f(x)=x+5

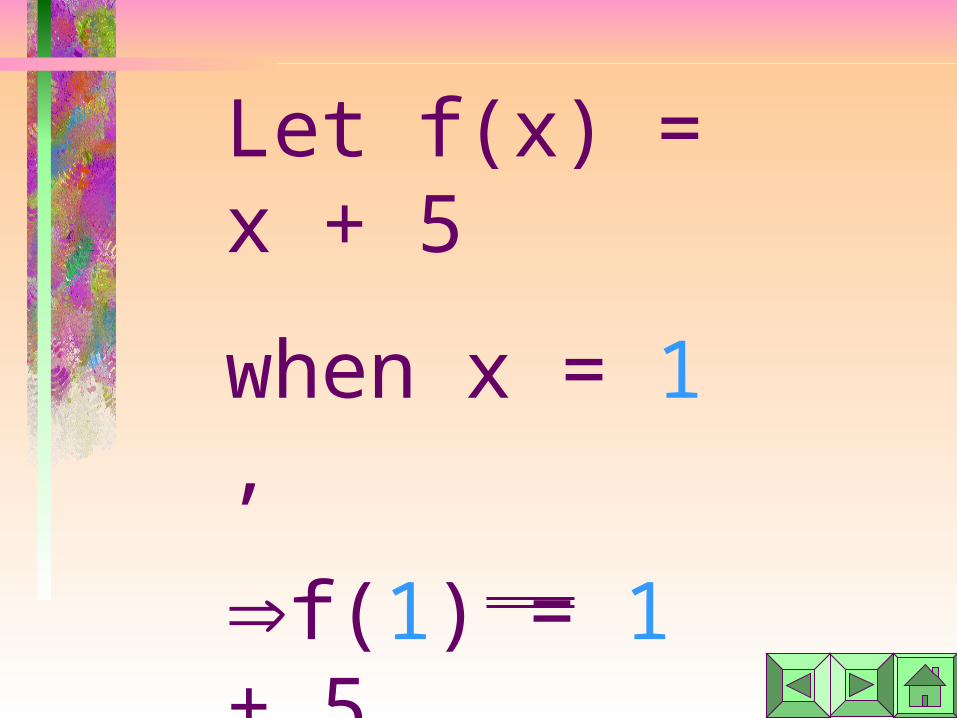
Let f(x) = x + 5
when x = 1 ,
f(1) = 1 + 5
= 6
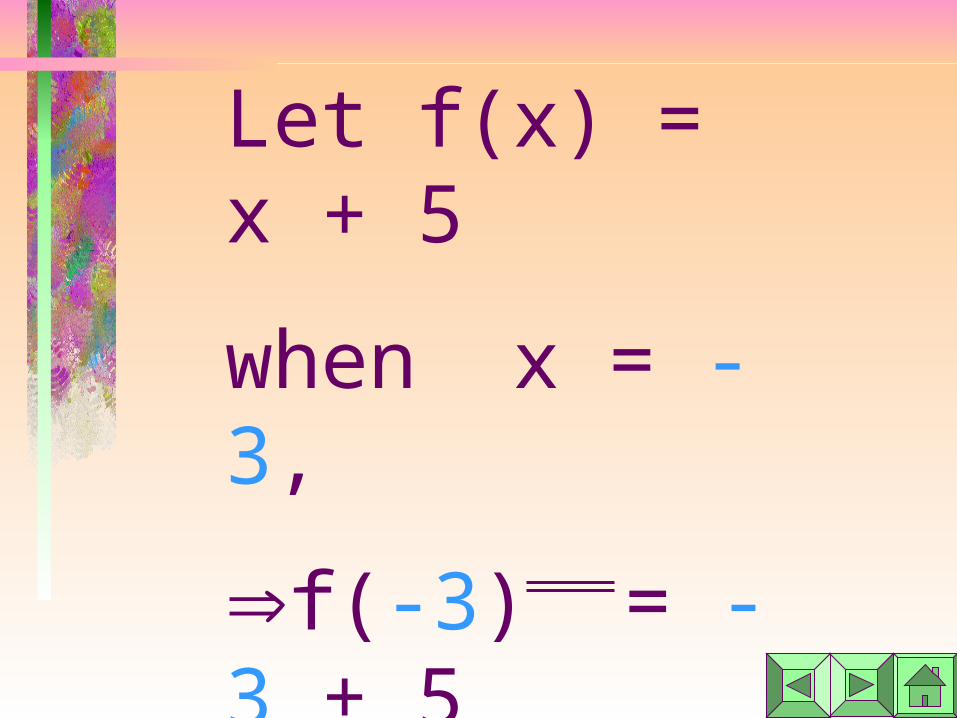
Let f(x) = x + 5
when x = -3,
f(-3) = -3 + 5
= 2

Let f(x) = x + 5
find f(4/9).
y
x
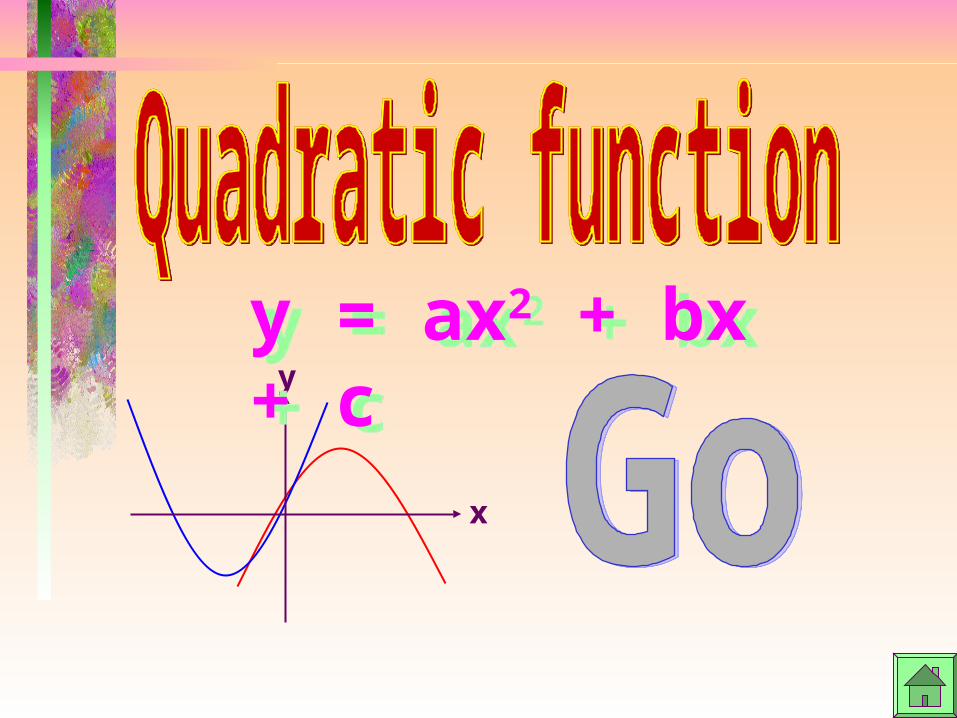
y = ax2 + bx + cy = ax2 + bx + c

Use this to plot the following graphs
y = x2
y = -x2
y = x2 - x - 6
y = -x2 - x - 6
y = 2x2 - x + 5
y = -2x2 - x + 5
1.
2.
3.
Then comparing their shapesThen comparing their shapes

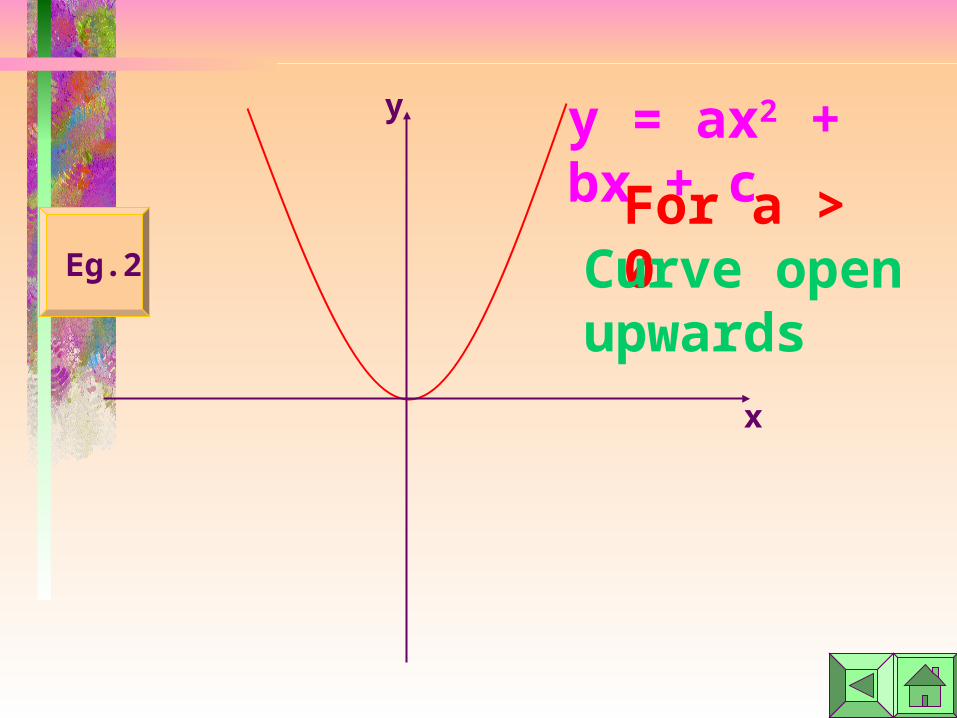
y = ax2 + bx + c
For a > 0Curve open upwards
Eg.1
y
x
y
x
Eg.2
y = ax2 + bx + c
For a > 0Curve open upwards

y = ax2 + bx + c
For a > 0Curve open upwards
y
x

y
x
y = ax2 + bx + c
For a < 0Curve open downwards
Eg.1
y
x
y = ax2 + bx + c
For a < 0Curve open downwards
Eg.2

y
x
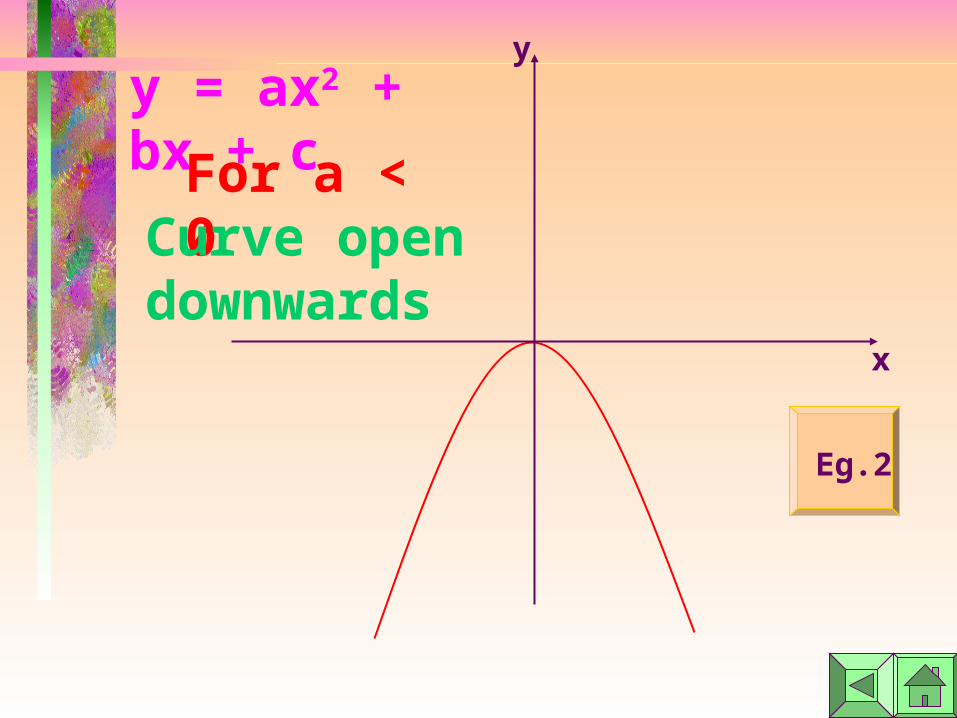
y = ax2 + bx + c
For a < 0Curve open downwards

y = ax2 + bx + c
For c > 0y-intercept is positive
y
x
Eg.1
y = ax2 + bx + c
For c > 0y-intercept is positive
y
x
(0, c)
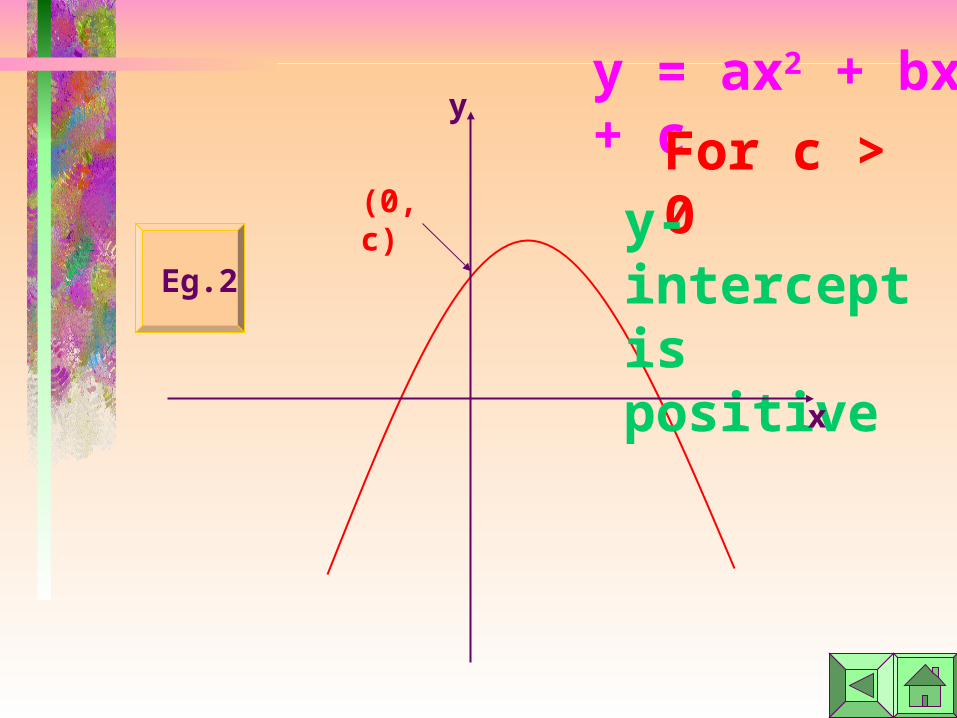
Eg.2
y = ax2 + bx + c
For c > 0y-intercept is positive
y
x
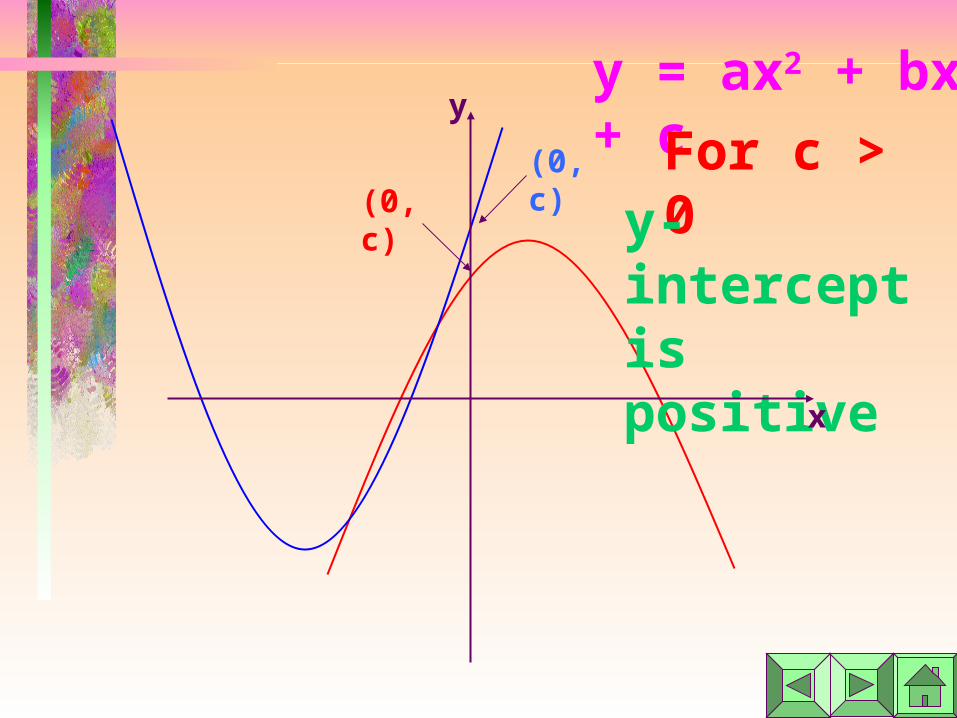
(0, c)(0, c)

y
x
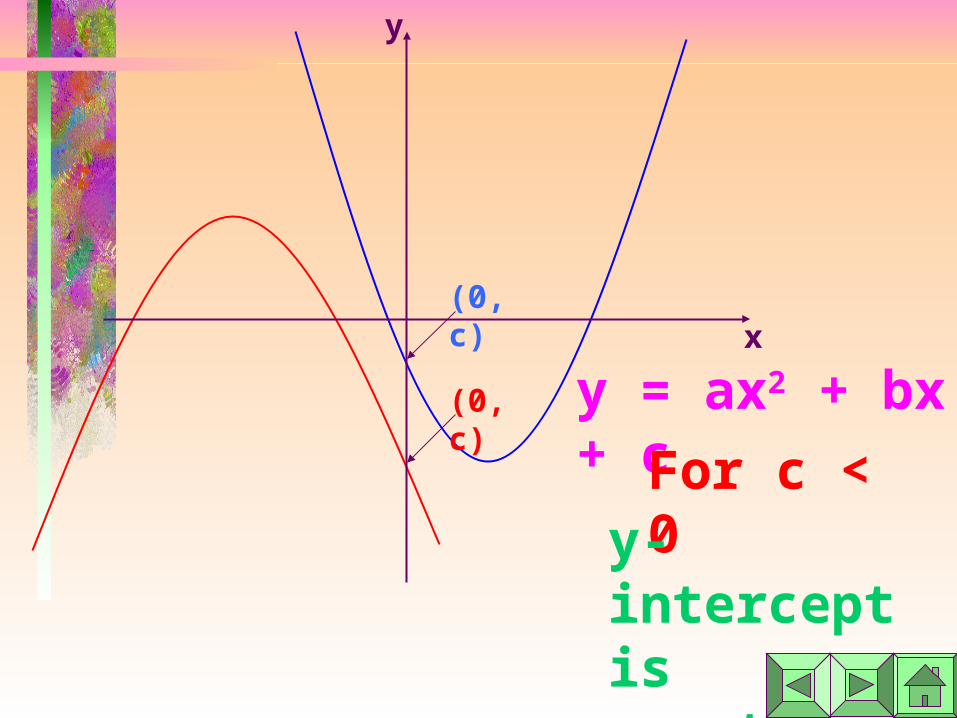
y = ax2 + bx + c
For c < 0y-intercept is negative
Eg.1
y
x
(0, c) y = ax2 + bx + c
For c < 0y-intercept is negative
Eg.2
y
x
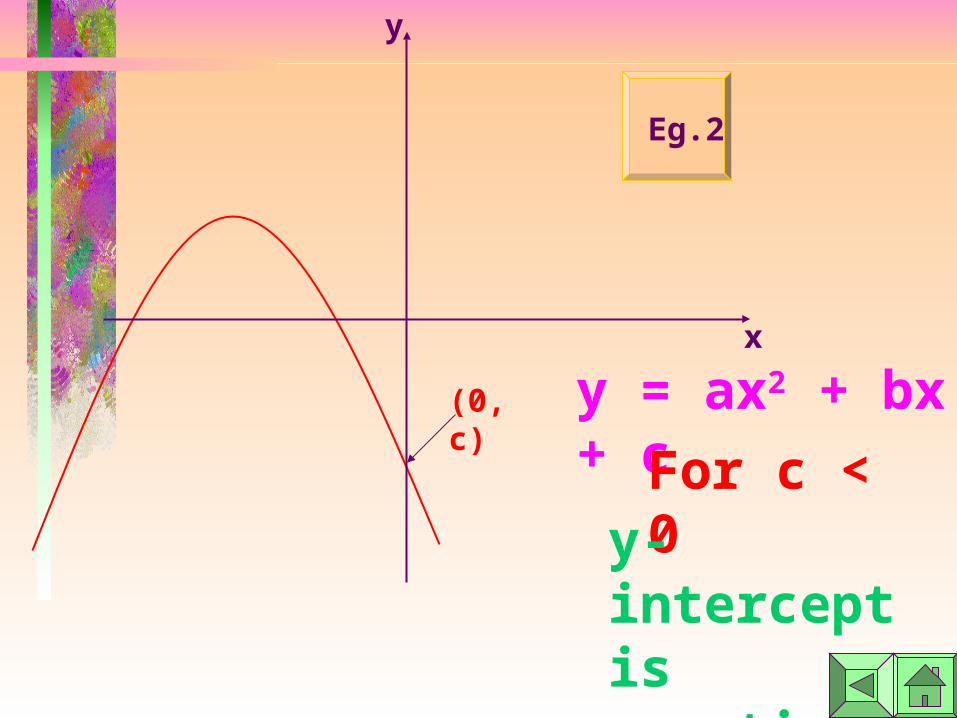
(0, c)
(0, c)
y = ax2 + bx + c
For c < 0y-intercept is negative

y
x
y = ax2 + bx + c
For c = 0Eg.1

y
x
y = ax2 + bx + c
For c = 0
Eg.2
y
x
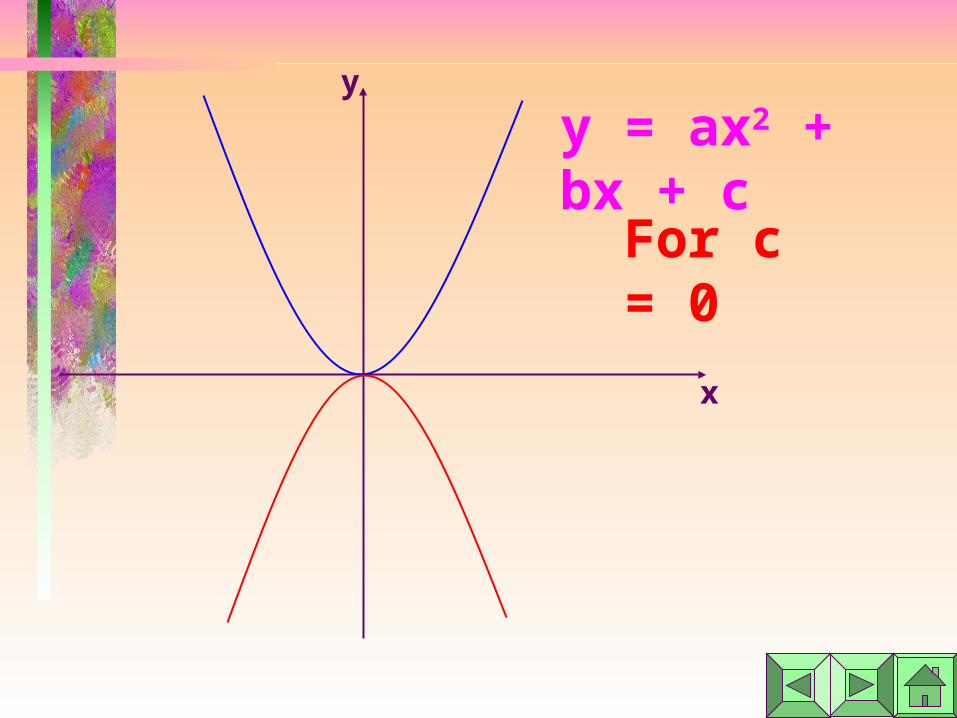
y = ax2 + bx + c
For c = 0

y
x
y = ax2 + bx + c
a > 0,c > 0
a < 0,c > 0
a < 0,c < 0
a > 0,c < 0
Click the corrected answer
y
x
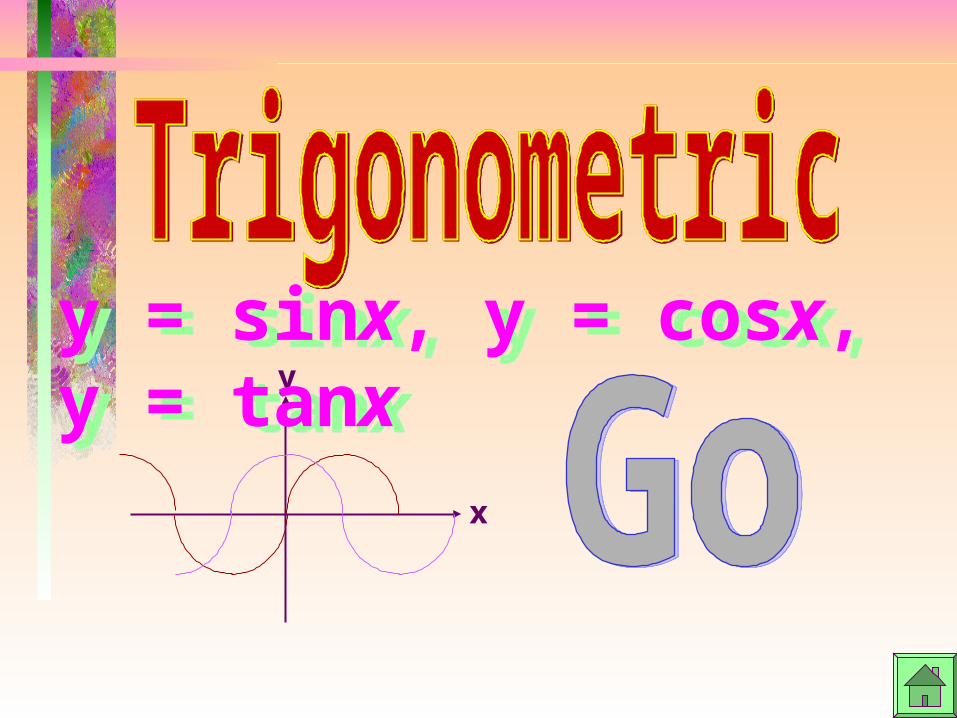
y = sinx, y = cosx, y = tanxy = sinx, y = cosx, y = tanx

Use this to plot the following graphs
1. sinx
Then comparing their shapesThen comparing their shapes
2. cosx
3. tanx

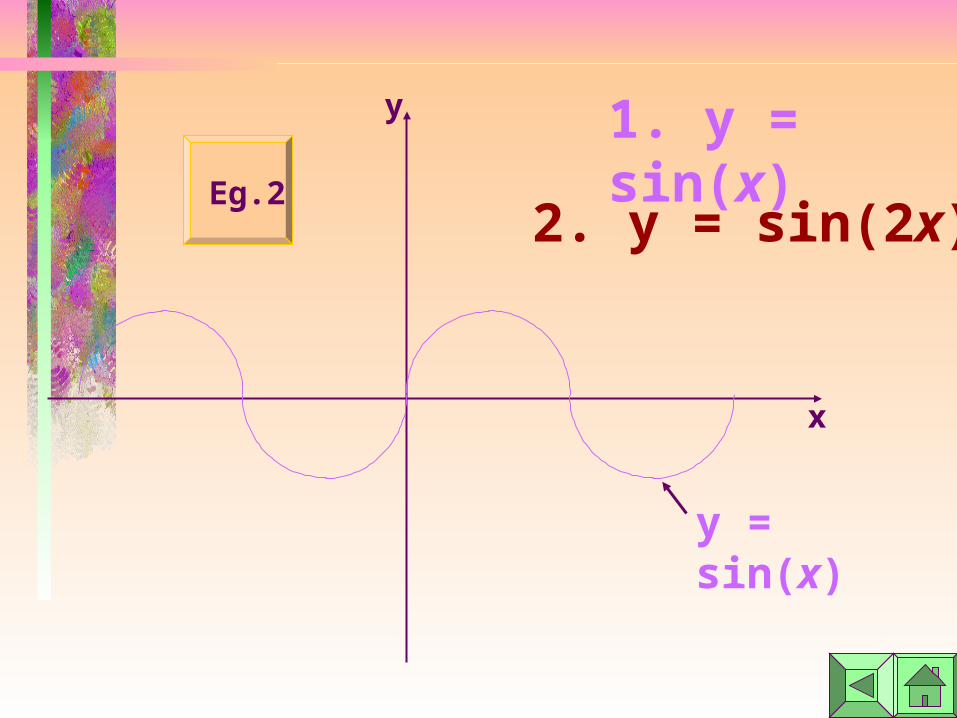
1. y = sin(x)Eg.1
y
x
2. y = sin(2x)
1. y = sin(x)Eg.2
y
x
2. y = sin(2x)
y = sin(x)

1. y = sin(x)y
x
2. y = sin(2x)
y = sin(2x)
y = sin(x)

1. y = cos(x)Eg.1
y
x
2. y = cos(2x)

1. y = cos(x)Eg.2
y
x
2. y = cos(2x)
y = cos(x)

1. y = cos(x)y
x
2. y = cos(2x)y = sin(2x)
y = cos(x)

1. y = tan(x)Eg.1 y
x
2. y = tan(2x)
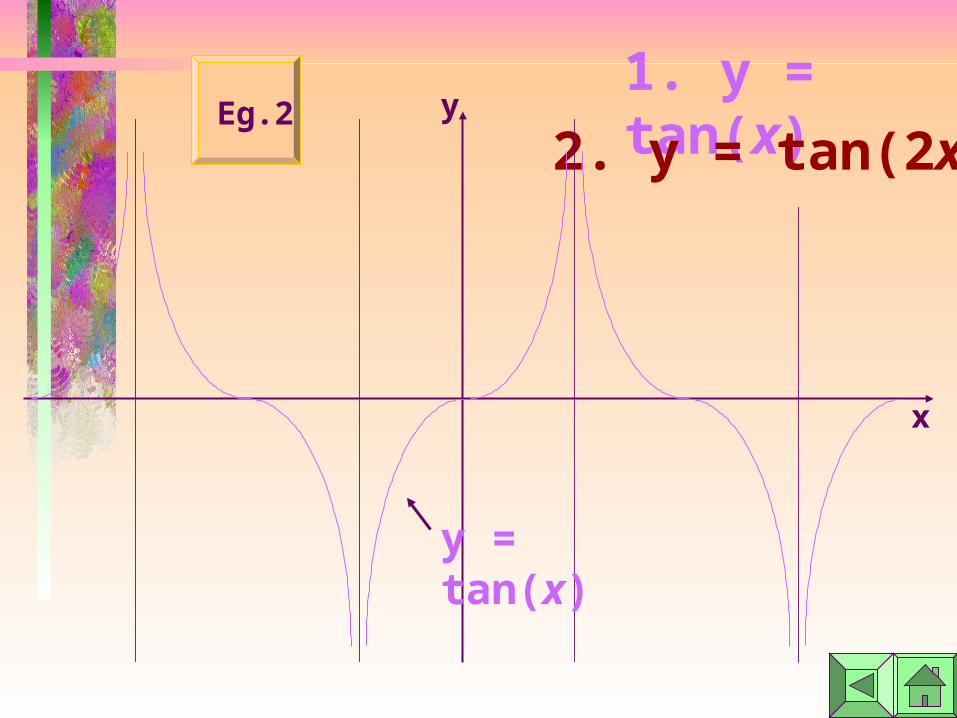
1. y = tan(x)Eg.2 y
x
2. y = tan(2x)
y = tan(x)

y
x
y = tan(x)
y = tan(2x)
1. y = tan(x)
2. y = tan(2x)

y
x
A , B , C
B , C , A
C , B , A
C , A , B
Match the corrected order:
A
C
B
Sin ,Cos, Tan


Meaning of Common Meaning of Common LogarithmLogarithm
Graph of y=10x
0
1
2
3
4
5
6
7
8
9
10
0.0 0.1 0.2 0.3 0.4 0.5 0.6 0.7 0.8 0.9 1.0x
y
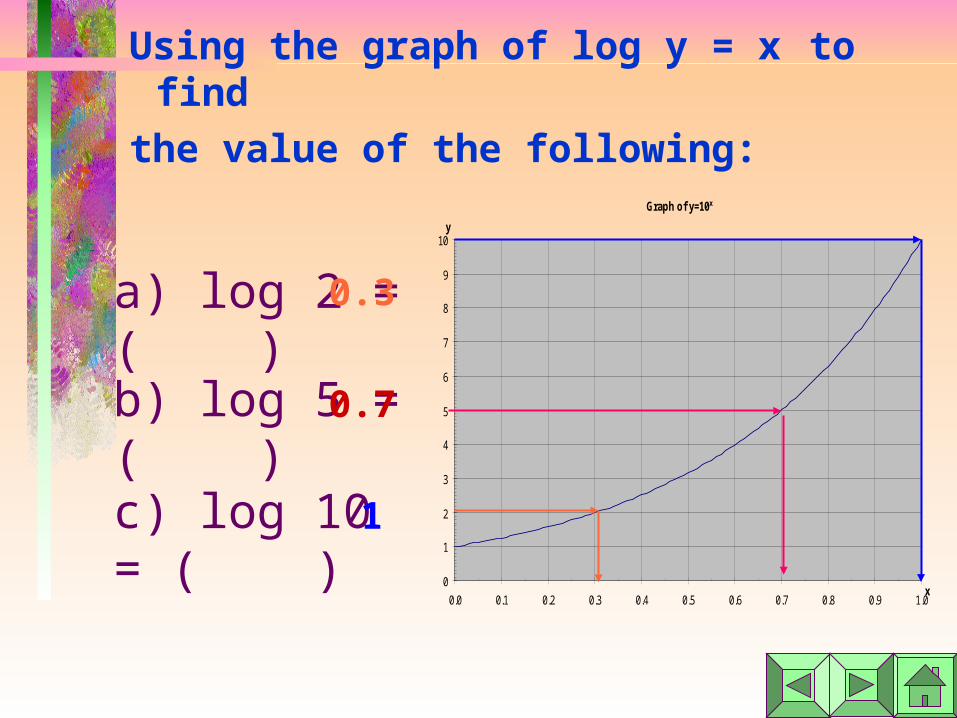
Using the graph of log y = x to find
the value of the following:
a) log 2 = ( )
Graph of y=10x
0
1
2
3
4
5
6
7
8
9
10
0.0 0.1 0.2 0.3 0.4 0.5 0.6 0.7 0.8 0.9 1.0x
y
b) log 5 = ( )
c) log 10 = ( )
0.3
0.7
1

Graph of y=10x
0
1
2
3
4
5
6
7
8
9
10
0.0 0.1 0.2 0.3 0.4 0.5 0.6 0.7 0.8 0.9 1.0x
y
For y = 10x
a: y = 6
b: y = 7
c: y = 8
d: y = 9
When x = 0.85, value of y is :


