Download - GrowCommerce 2016 — Shopping Apps: A Deep Dive into Mobile User Acquisition Trends & Benchmarks

SHOPPING APPSMobile User Acquisition Trends and Benchmarks 2016
Dennis Mink, VP Marketing @Liftoff
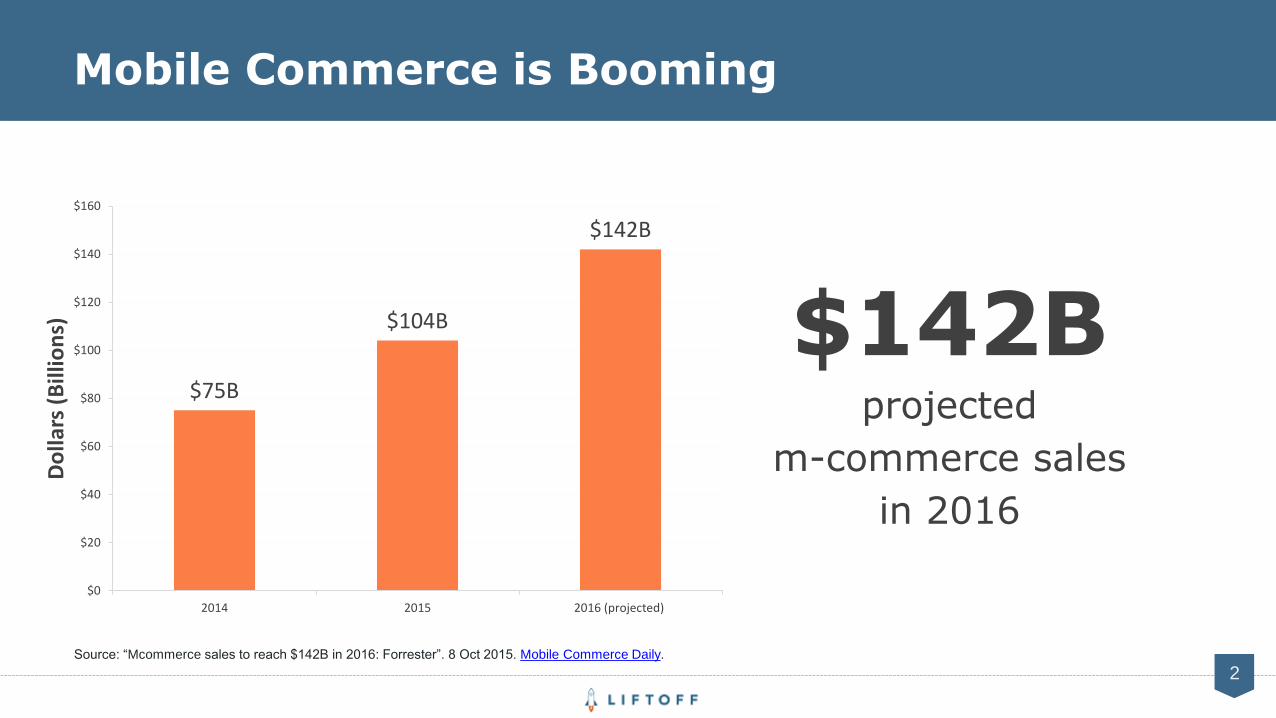
$142B projected
m-commerce sales
in 2016
Mobile Commerce is Booming
2
$75B
$104B
$142B
$0
$20
$40
$60
$80
$100
$120
$140
$160
2014 2015 2016 (projected)
Do
llars
(B
illio
ns)
Source: “Mcommerce sales to reach $142B in 2016: Forrester”. 8 Oct 2015. Mobile Commerce Daily.
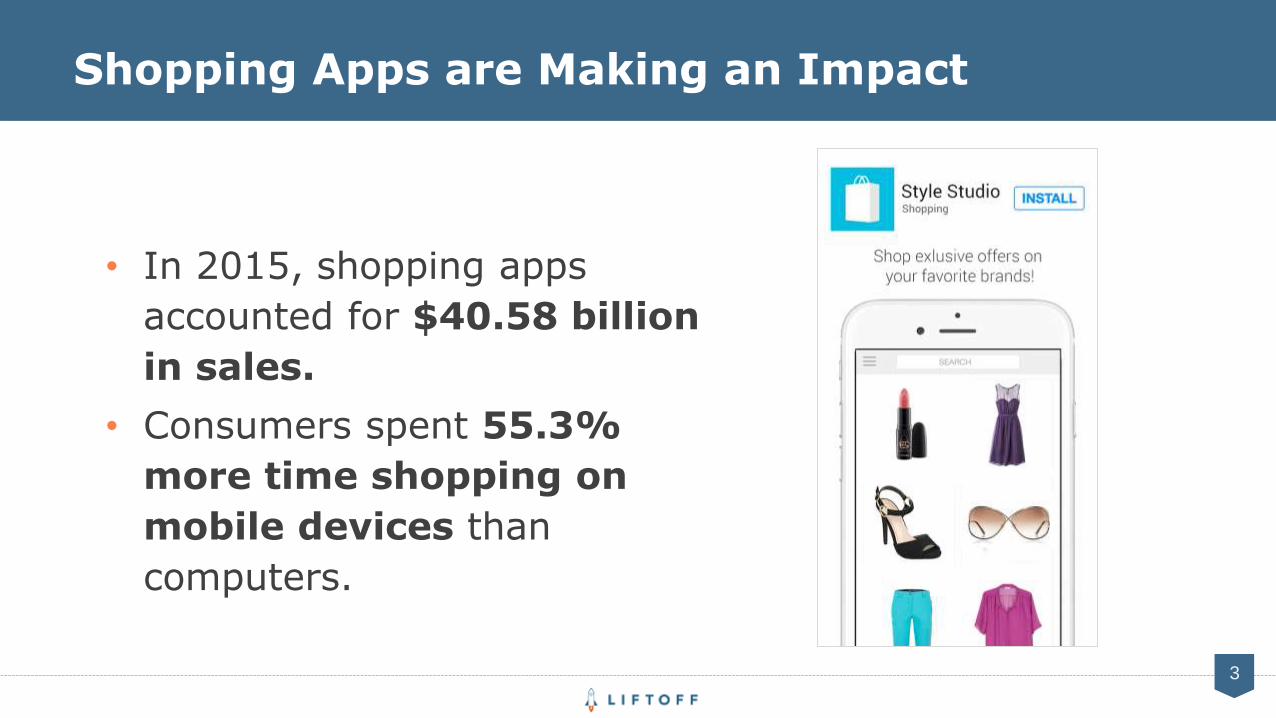
• In 2015, shopping apps
accounted for $40.58 billion
in sales.
• Consumers spent 55.3%
more time shopping on
mobile devices than
computers.
Shopping Apps are Making an Impact
3
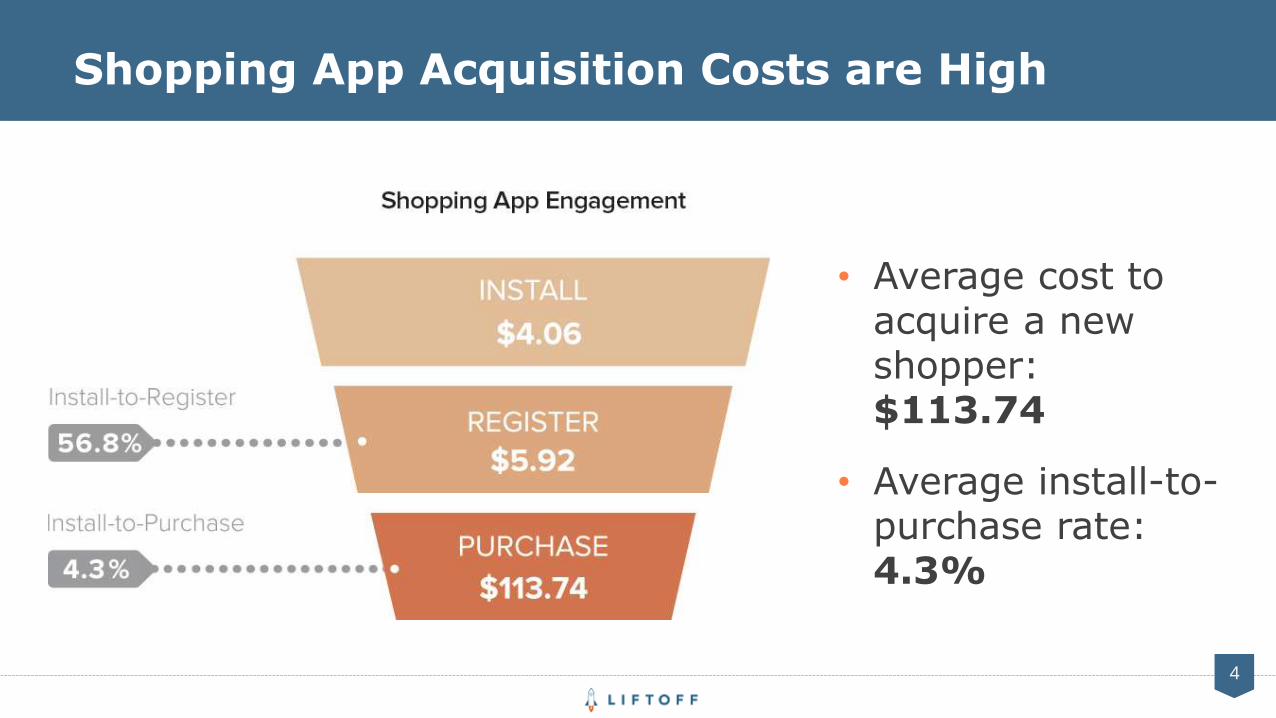
• Average cost to acquire a new shopper: $113.74
• Average install-to-purchase rate: 4.3%
4
Shopping App Acquisition Costs are High
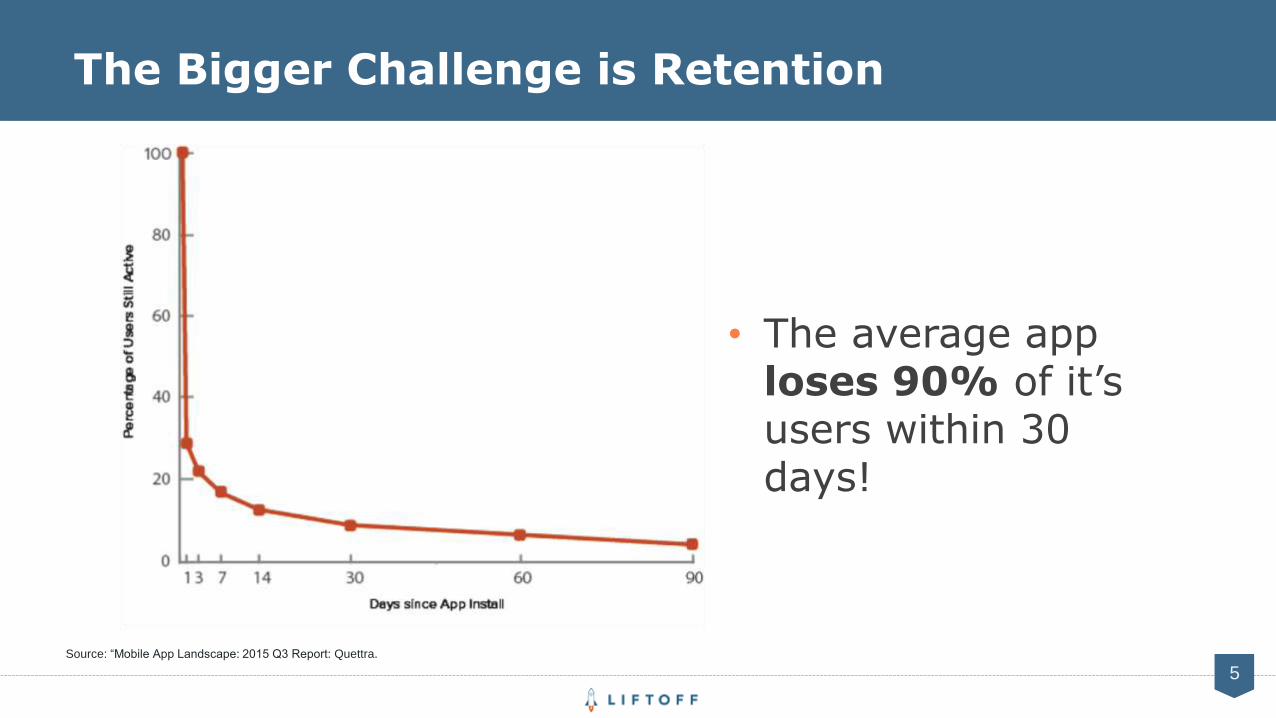
• The average app loses 90% of it’s users within 30 days!
5
The Bigger Challenge is Retention
Source: “Mobile App Landscape: 2015 Q3 Report: Quettra.
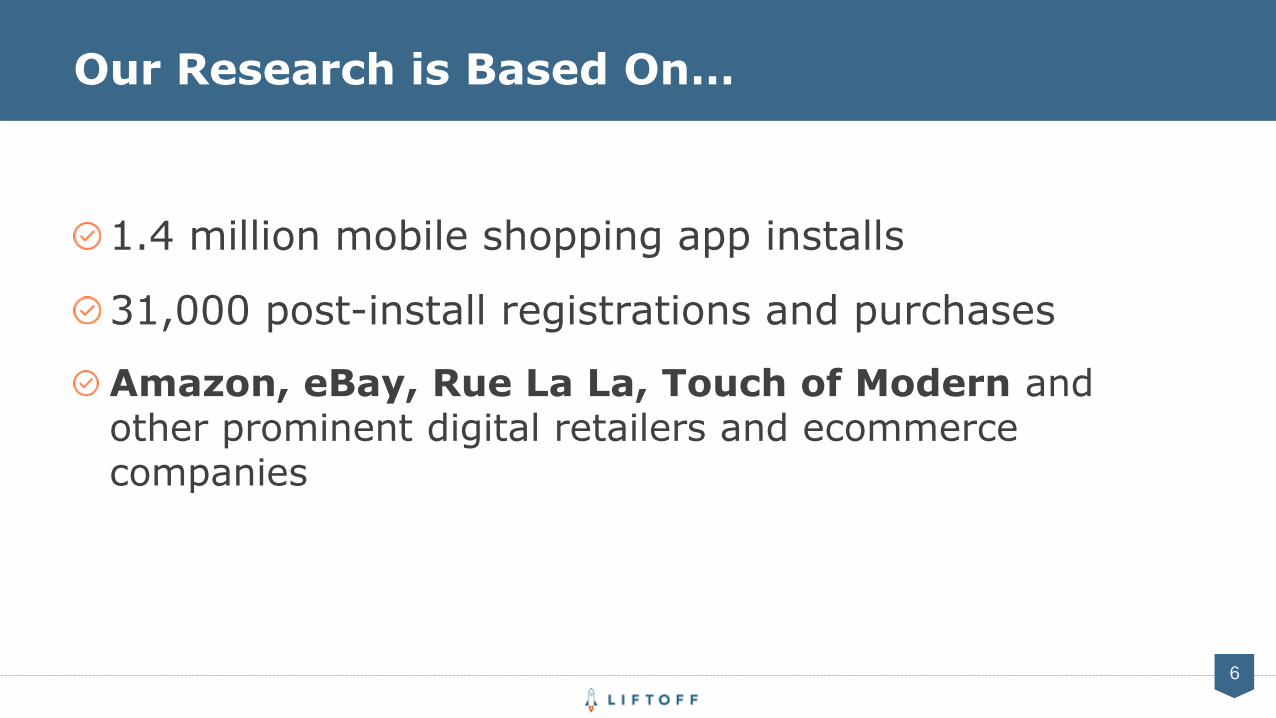
1.4 million mobile shopping app installs
31,000 post-install registrations and purchases
Amazon, eBay, Rue La La, Touch of Modern and other prominent digital retailers and ecommerce companies
Our Research is Based On…
6
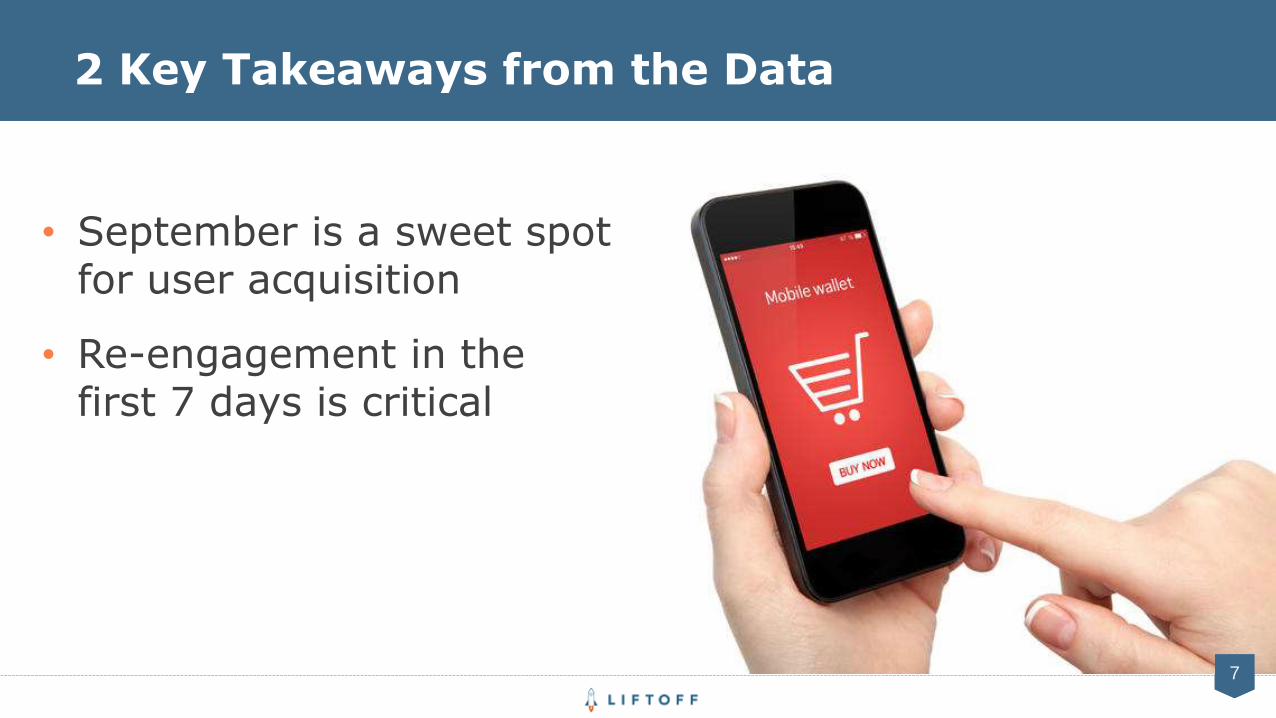
• September is a sweet spot for user acquisition
• Re-engagement in the first 7 days is critical
7
2 Key Takeaways from the Data

THE SEPTEMBER SWEET SPOT
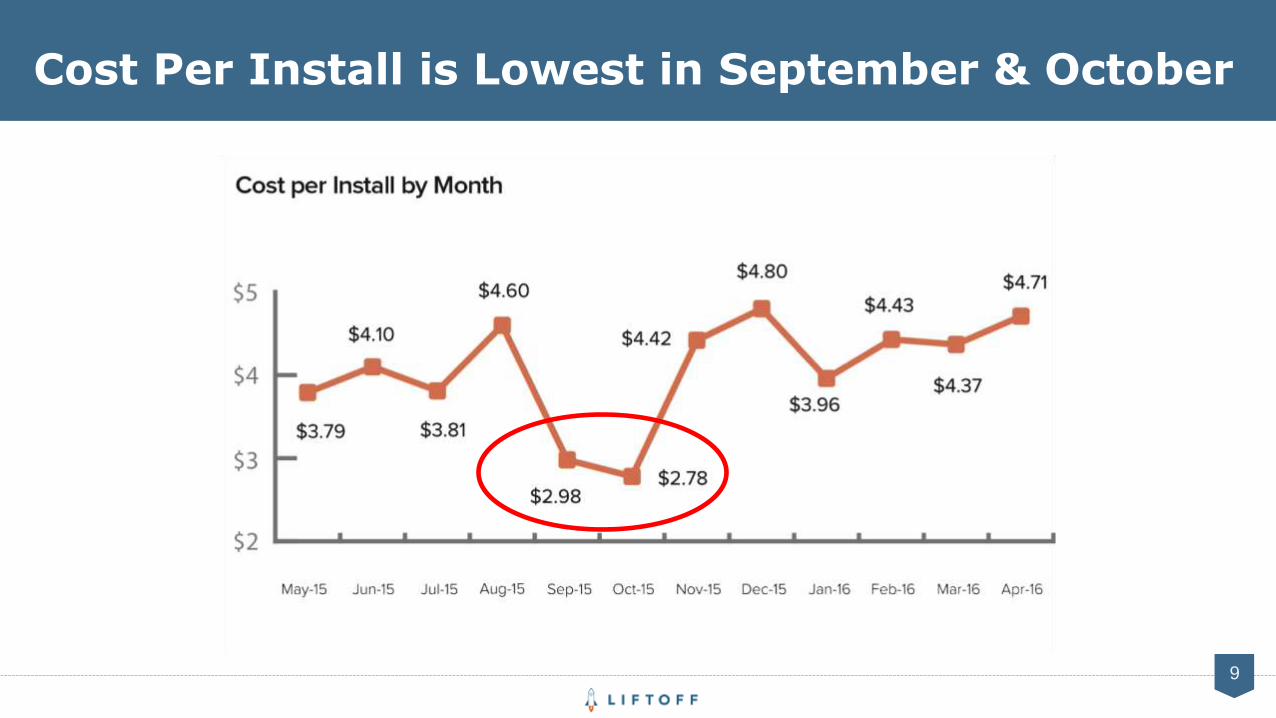
Cost Per Install is Lowest in September & October
9
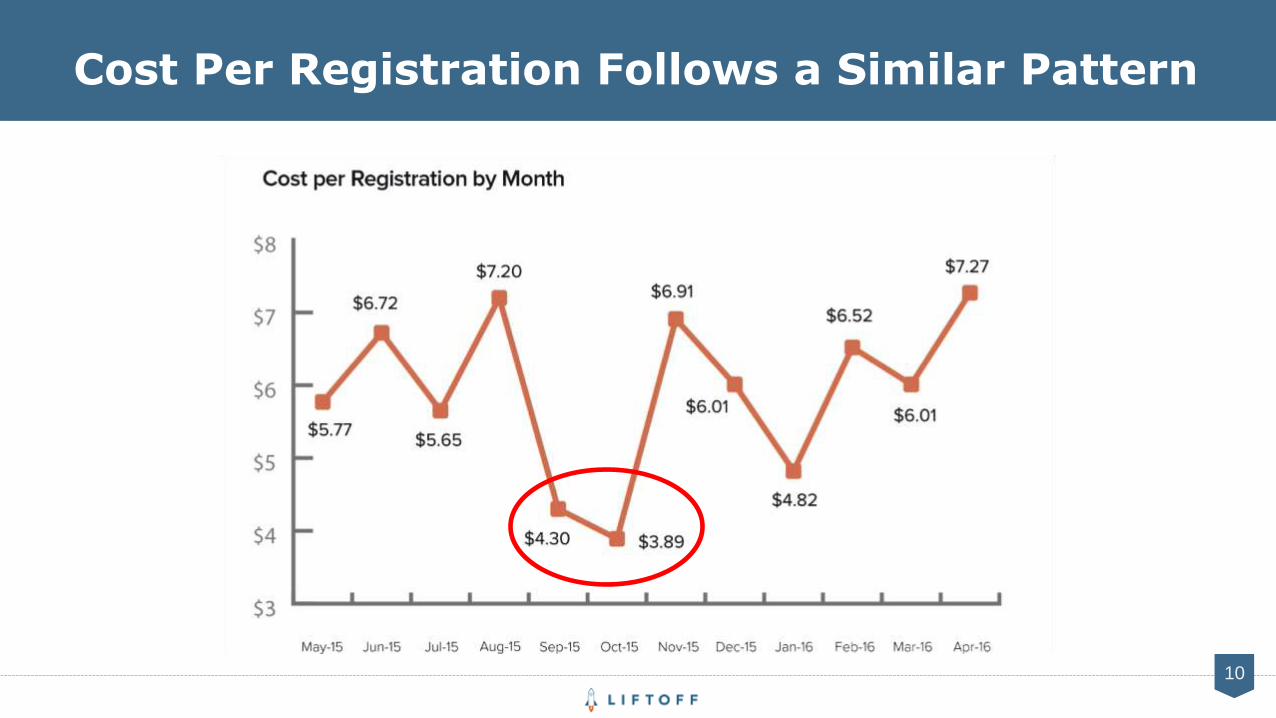
Cost Per Registration Follows a Similar Pattern
10
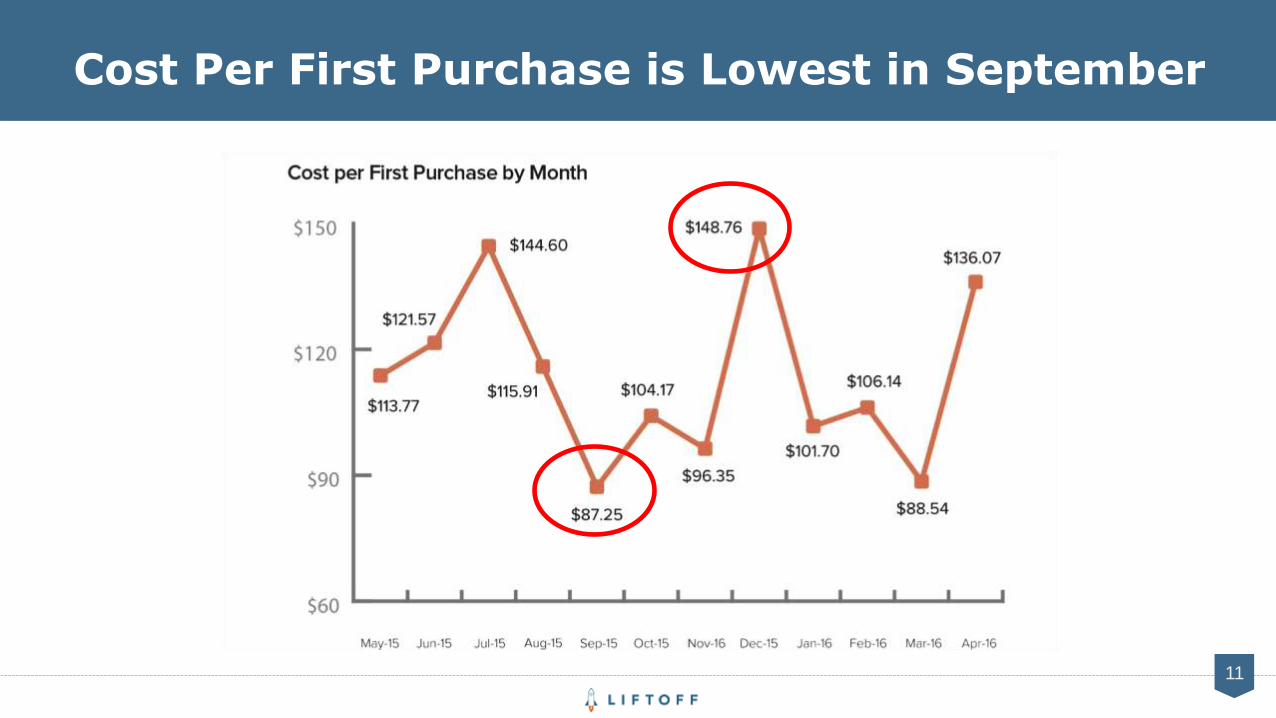
Cost Per First Purchase is Lowest in September
11
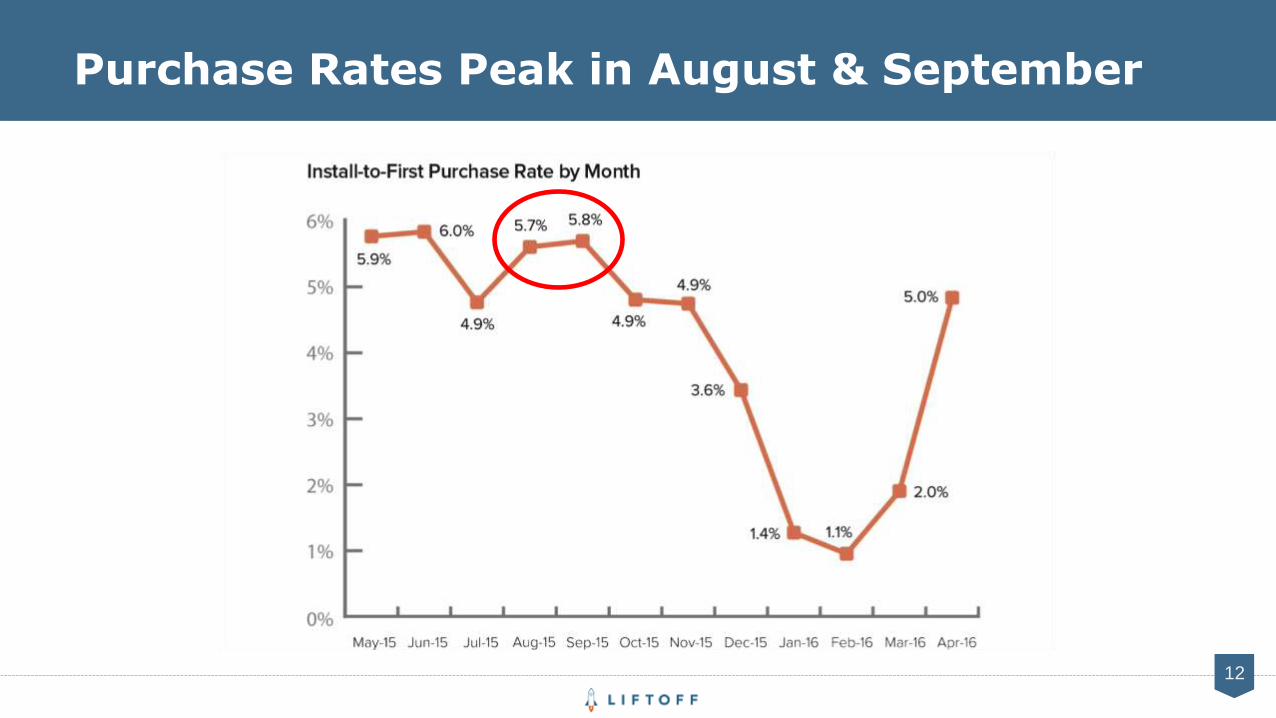
Purchase Rates Peak in August & September
12
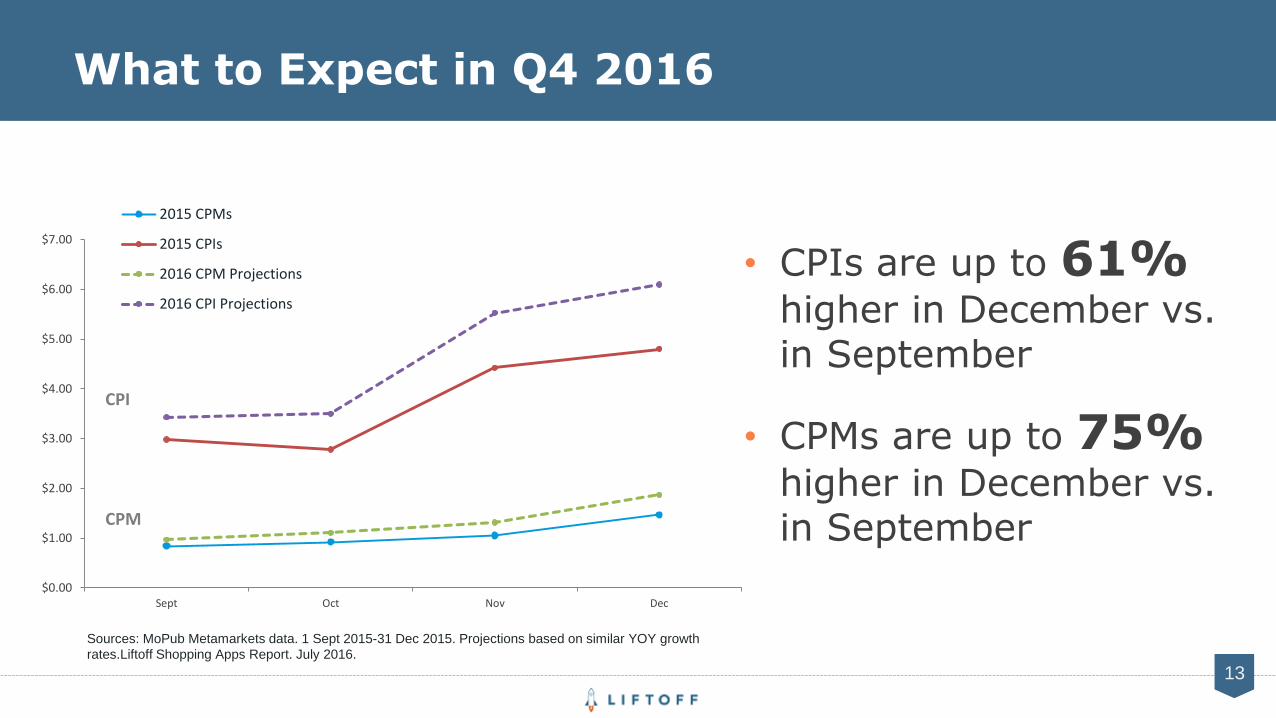
• CPIs are up to 61% higher in December vs. in September
• CPMs are up to 75% higher in December vs. in September
13
What to Expect in Q4 2016
$0.00
$1.00
$2.00
$3.00
$4.00
$5.00
$6.00
$7.00
Sept Oct Nov Dec
2015 CPMs
2015 CPIs
2016 CPM Projections
2016 CPI Projections
CPI
CPM
Sources: MoPub Metamarkets data. 1 Sept 2015-31 Dec 2015. Projections based on similar YOY growth
rates.Liftoff Shopping Apps Report. July 2016.

RE-ENGAGE EARLY & OFTEN
15
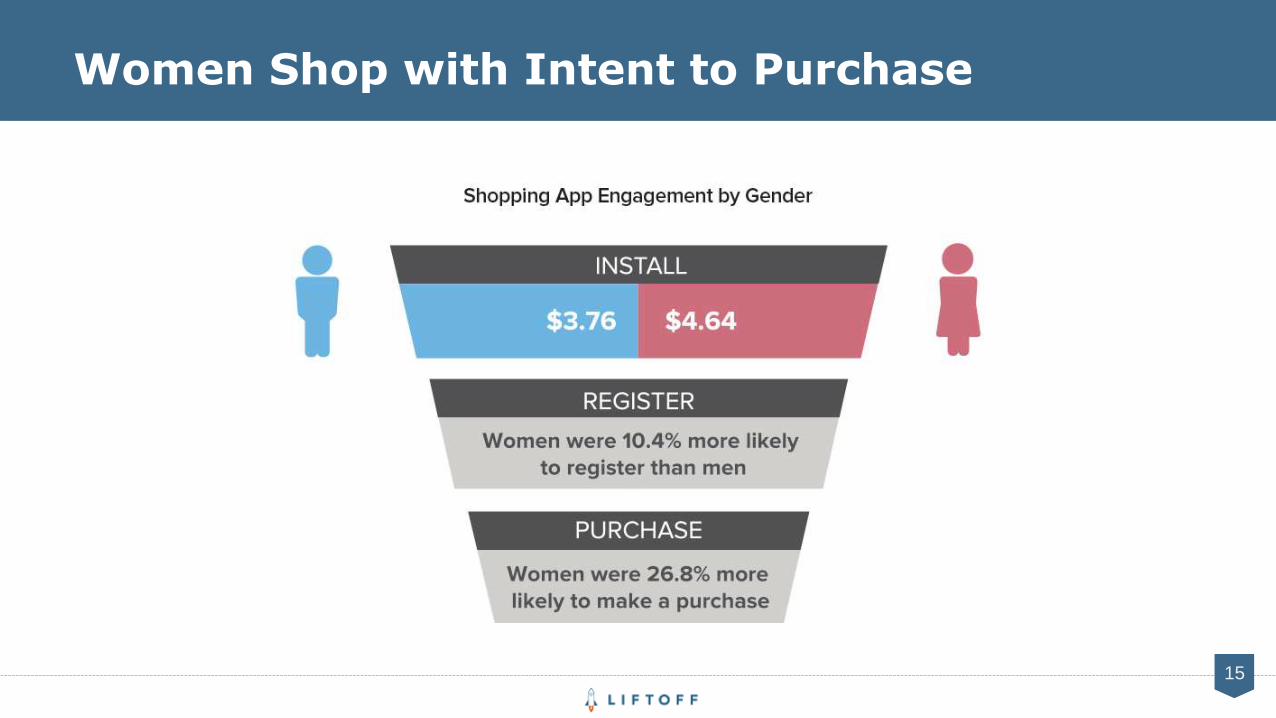
Women Shop with Intent to Purchase
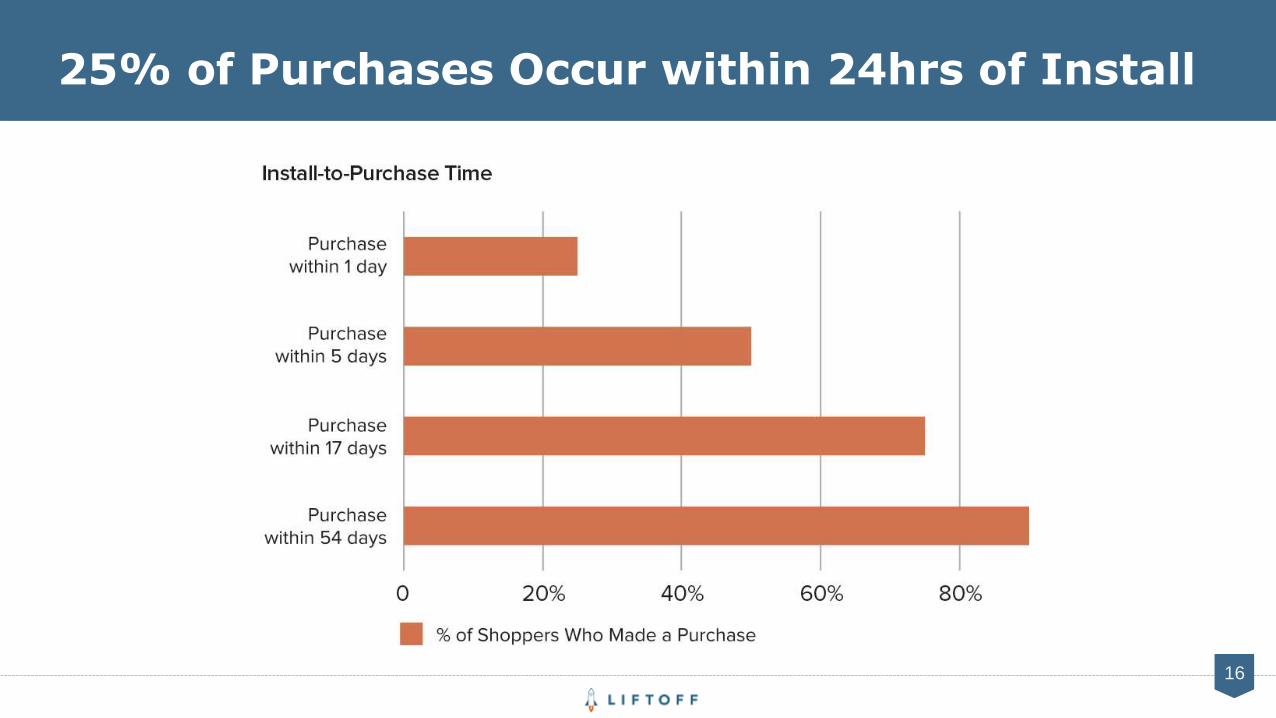
25% of Purchases Occur within 24hrs of Install
16
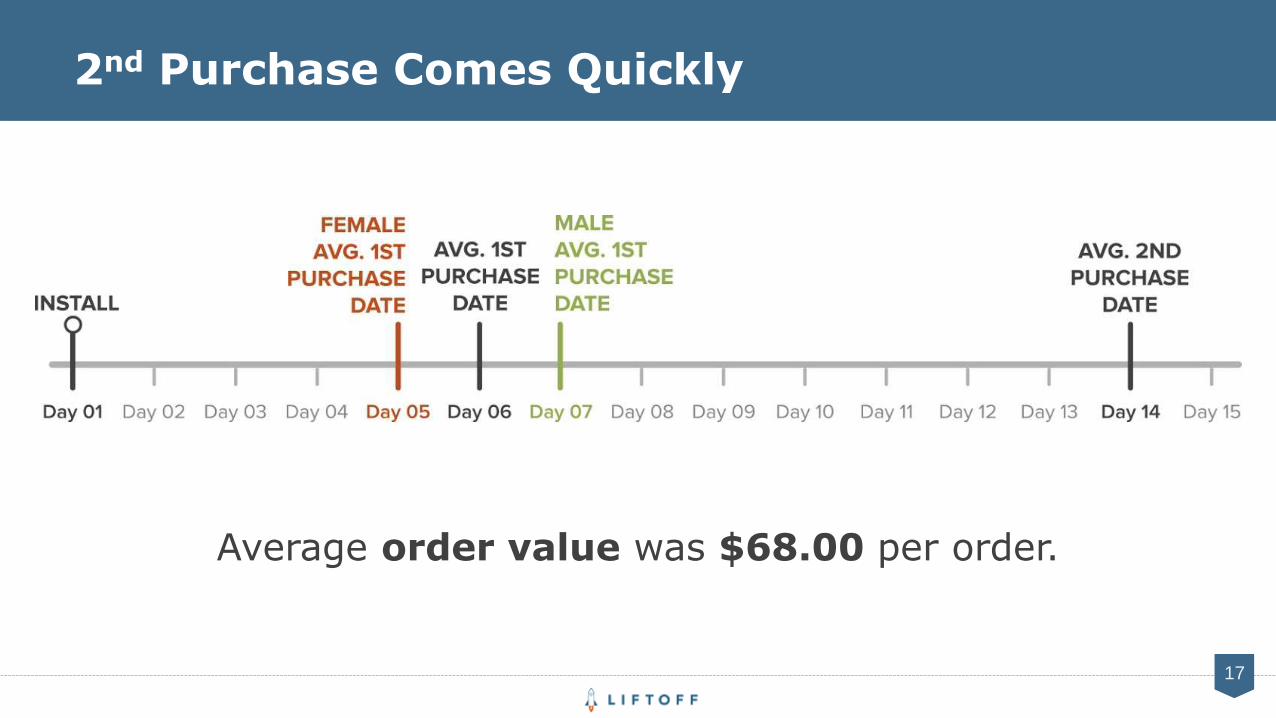
2nd Purchase Comes Quickly
17
Average order value was $68.00 per order.

PLANNING FOR Q4
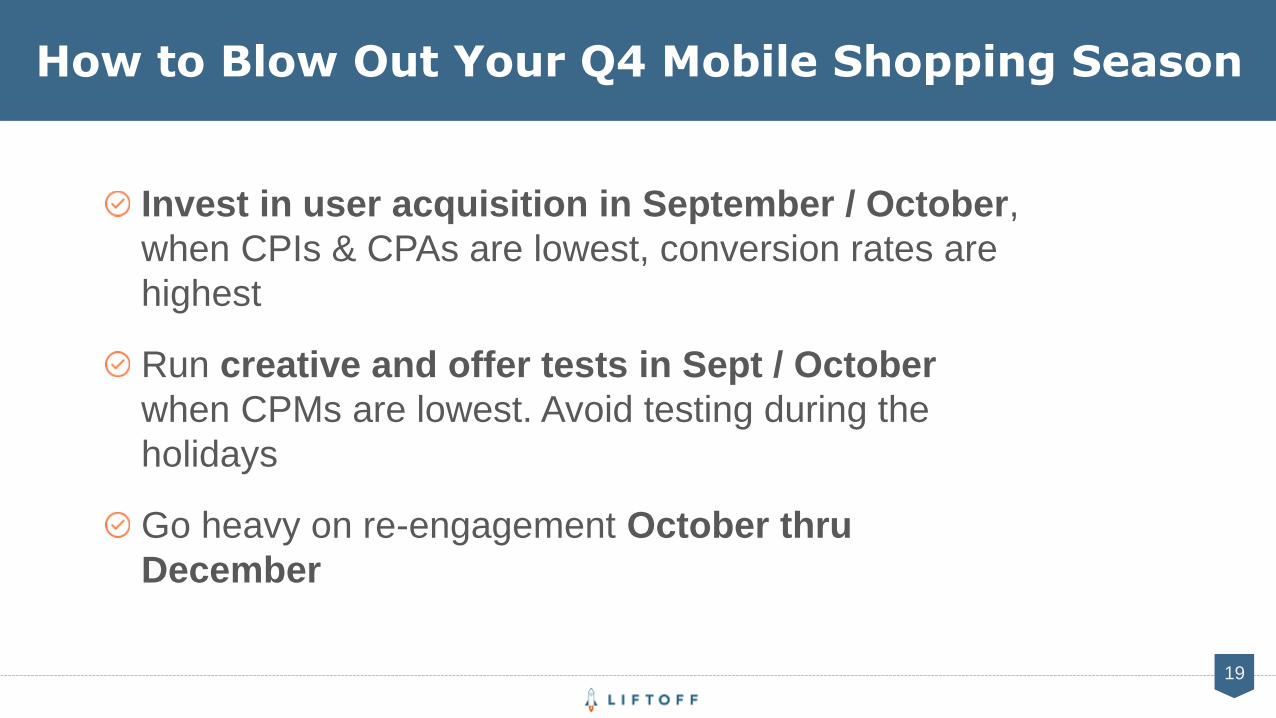
Invest in user acquisition in September / October,
when CPIs & CPAs are lowest, conversion rates are
highest
Run creative and offer tests in Sept / October
when CPMs are lowest. Avoid testing during the
holidays
Go heavy on re-engagement October thru
December
19
How to Blow Out Your Q4 Mobile Shopping Season

BONUS
21
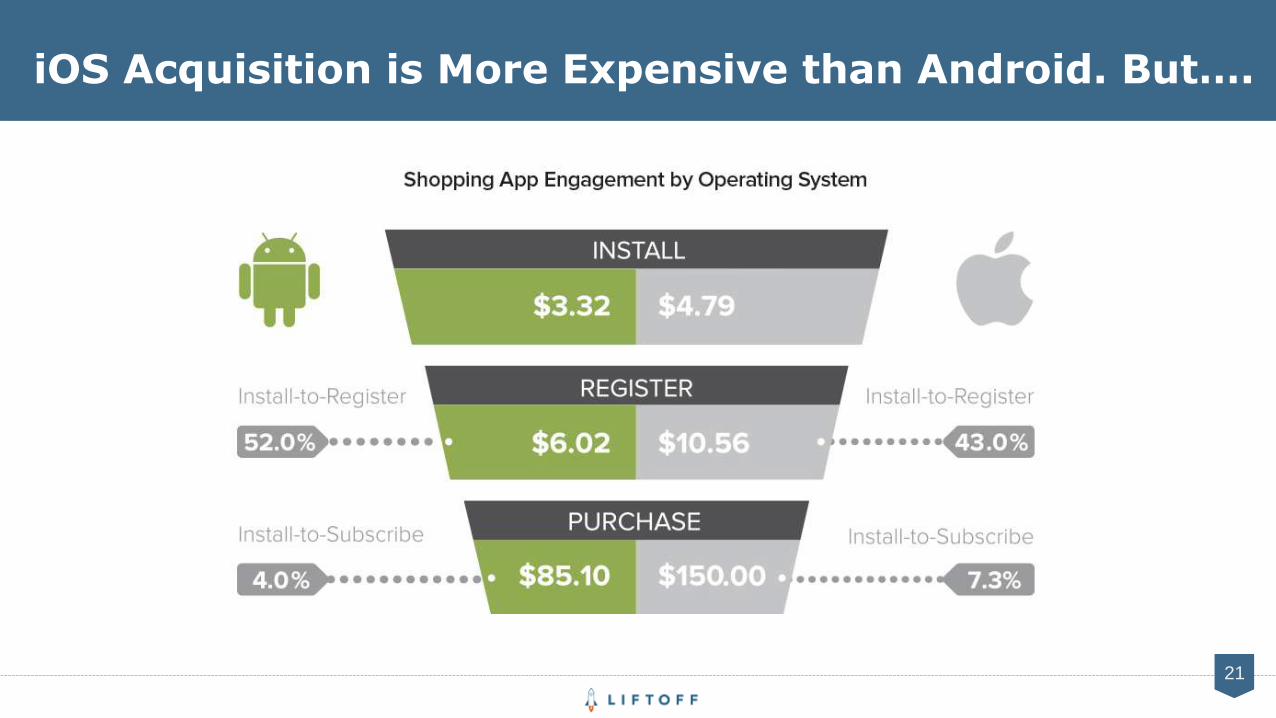
iOS Acquisition is More Expensive than Android. But….

For more mobile shopping insights,
download our latest Mobile Shopping report @
www.liftoff.io
Thanks!


