
Planetary Economics: framework and dynamics
Outline of this talk
Part 1: The Structures of ‘Planetary Economics:
Three Domains, Pillars and risk conceptions
Part 2: Economics of adaptive economic systems
A numerical illustration
Part 3: First among equals? A suggested approach to real-world carbon pricing
http://climatestrategies.org/projects/planetary-economics/for additional information, presentations and slide sets

Transforming
(3rd Domain)Innovation &
evolution of
complex systems
Satisficing
(1st Domain)Diverse individual
and organisational
decision-making
Optimising
(2nd Domain)Idealised /
‘representative’
optimising
behaviour
Economic Output / Consumption
Behavioural and
organisational economics
Neoclassical
and welfare economics
Evolutionary and
institutional economics
Typical social and organisational scale
Typical timescale
Re
sou
rce
use
/ E
ne
rgy
& E
mis
sio
ns
The Domains involve different processes with different theoretical foundations operating at different scales

H
M
L
H Highest relevance
M Medium relevance
Satisfice
Transform
Optimise
DomainStandards & Engagement
Markets & Prices
Strategic Investment
1 2 3
L/M
H
L/M
L
M
H
Policy pillars
Solutions need to harness corresponding policy pillars, based on the Three Domains, to transform energy systems

Fig. 12.3 Public and private returns in the 3 domains
Reso
urc
e U
se / E
nerg
y &
Em
issio
ns
Economic Output / Consumption
Pillar III
1. Private returns
>> public returns
but not realised
=> Standards and
engagement
Innovation and
infrastructure
Cleaner products
and processes
Pillar I
Smarter choices
Pillar II
3. Public returns
(including innovation,
security & environment)
>> private returns
=> Strategic investment
Effective mitigation policy needs to understand the complementary economic roles of the different pillars
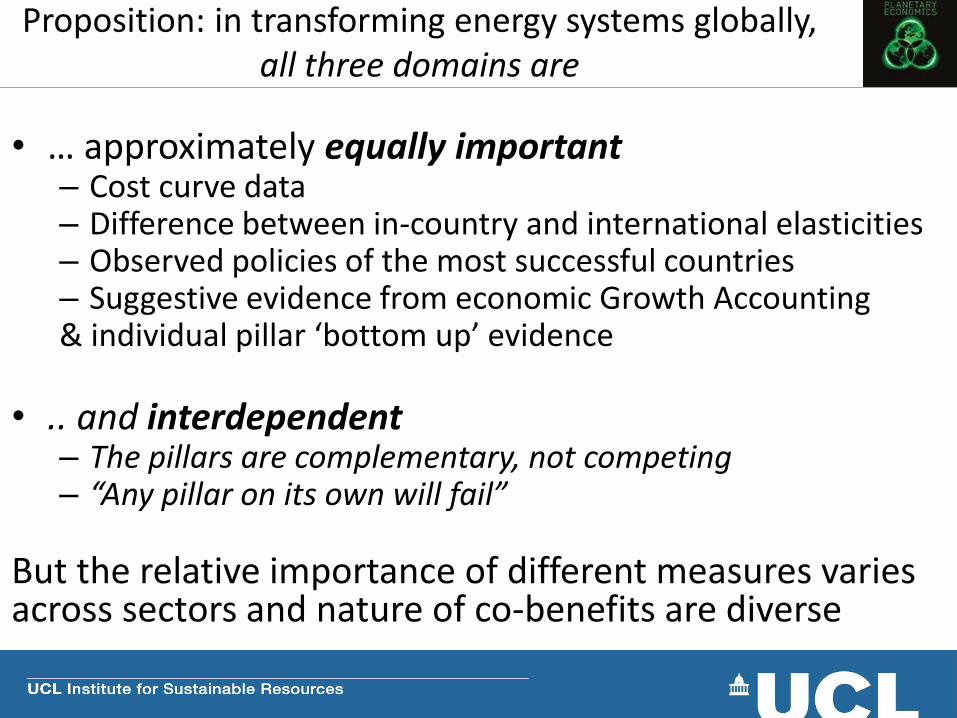
Proposition: in transforming energy systems globally, all three domains are
• … approximately equally important – Cost curve data – Difference between in-country and international elasticities– Observed policies of the most successful countries – Suggestive evidence from economic Growth Accounting& individual pillar ‘bottom up’ evidence
• .. and interdependent– The pillars are complementary, not competing – “Any pillar on its own will fail”
But the relative importance of different measures varies across sectors and nature of co-benefits are diverse

The Three Domains also link to debates about macroeconomic growth
• Neoclassical economic growth models have consistently found a ‘residual’ accounting for typically half of observed economic growth that cannot be explained by resource and capital accumulation (Ch.11 the “Dark Matter” of growth)
• Economic research points two broad explanatory areas:– Reducing suboptimal performance of many economic actors and structures
– Education, infrastructure and innovation
• ie. First and Third domain processes are recognised as important for macroeconomic growth. Yet these remain– largely absent in global (or national) modelling
– poorly charted in policy
• Energy is a particularly strong candidate because– Pervasive input to numerous production sectors
– Fossil fuel markets are intrinsically unstable
– Exceptionally low rates of innovation particularly electricity & construction

Risk conception / Domain
Dominantscale
Decision framework
Field of theory
Mitigation economic
process
Realm of opportunity
Pillar ofpolicy/
response
Ignore / Satisfice
Short term / local
Indifferent or disempowered
Behavioural & Organisational
Move closerto the ‘best
practice frontier’’
‘Smarter choices’
Standards and
engagement
(Pillar I)
Compensate/Optimise
Medium term/ regional
Costs / impacts are tangible
and significant
Neoclassical & welfare
economics
Make best trade-offs along the frontier
Substitutecleaner
production & products
Markets and pricing
(Pillar II)
Secure/ Transform
Long term / global
Transformational risks and opportunities
Evolutionary & Institutional
Evolve the frontier
Innovation &infrastructure
Strategic investment
(Pillar III)
Figure 2-6 Alignments within each domain
A key to Planetary Economics – and politics – lies in the potential to align different levels of risk conception with the different pillars of response

Expectations, Investment stability and macro-economic dimensions
Planetary Econ & the contours of carbon pricing
Outline of this talk
Setting the scene: four conceptions of carbon pricing
Part 1: The Structures of ‘Planetary Economics:
Three Domains, Pillars and risk conceptions
Part 2: Economics of adaptive economic systems
A numerical illustration
Part 3: First among equals?
A suggested approach to real-world carbon pricing
Conclusions
http://climatestrategies.org/projects/planetary-economics/for additional information, presentations and slide sets

• How are ‘optimal’ trajectories affected by:
– the inertial characteristics of energy systems
– the potential for energy systems to adapt to emission constraints through i.a. long-run infrastructure & innovation
• How important are different possible specifications of climate damage?
• Are there interactions between these structural dimensions of mitigation and damage costs?
• Is ambition really about any more than assumed discount rate, equity weighting & risk aversion?
Some key strategic / modelling questions

• Huge literature on global cost/benefit/trajectories
• Seemingly big discrepancies between different views of the urgency of climate action & cost of delay– Eg. IEA vs Nordhaus
• Proposition that this is not only due to different specifications of climate damage, but also assumed characteristics of the emission systems (particularly energy)
• The vast majority of stylised global cost-benefit models assume a cost function in relation to the degree of abatement from ‘reference projection’ at time t
• This has no underlying history – no inertia or induced tech eg. DICE equations
Motivations for the research (1)

Motivations for the research (2)
Inertia and Adaptability emerge strongly in the Three Domains
Enduring structural differences between countries
“First Domain” & corresponding Pillar of policy
• Most energy efficiency gains become embedded
• Most energy efficiency policies do not reverse,
but if anything are systematically strengthened
“Third Domain” & corresponding Pillar of policy
• Long lived assets (eg. Grids, urban forms)
• Overwhelming evidence on learning-by-doing,
scale economies, induced innovation
Structural inertia also around pricing (Second Domain / Pillar)

Abatement cost at time t = Ca x (degree of abatement)² + Cb x (rate of abatement)²
Or more compactly:
Abatement cost C(t) = Ca . ε(t) ² + Cb . (dε/dt) ²
where ε(t) is the degree of cutback
• Mitigation (abatement) costs defined to depend on both the degree and the rate of abatement relative to ref projection:– Degree of deviation from baseline is classical, DICE-like formulation
– Rate-dependent costs reflect the inertia of change – investment in changing the underlying pathway
– The Ratio of the two reflects the adaptive capacity of the system
• Each rises non-linearly: the model assumes quadratic dependence (like DICE for the enduring cost term):
Model Fundamentals 1: Mitigation costs

Present model assumes that global damage increases in proportion to the square of
temperature change:
Annual damage from climate change at time t,
d(t) proportional to (temperature change) 2 = (E(t)/500)2
Where E(t) is the cumulative CO2 emissions (in GtC) at time t.
• Climate Damage: a simplified approach, inspired by the observation from model ensembles finding a closely linear relationship between cumulative CO2 emissions and global temperature change at a given point in time– central estimate that 500GtC cumulative emissions increases global temperature by
about 1 deg.C (some time lags of secondary importance for most practical emission
trajectories).
• Generally accepted non-linear relationship between temperature change and damage
Model Fundamentals 2: Climate damage

Real discount rate 2.5%/yr.
Climate change damage $3trn/yr for an additional 500GtC emission. – cf global GDP mid
Century typically projected in range $85-150 trn/yr
Reference emissions growth linear 800MtC/yr (2% of 2010 emissions) - corresponds closely
to the reference projection of the IEA (2012).
Abatement costs parameters
Purely enduring costs (Cb =0): 50% cut in global CO2 emissions in 2040 costs $2trn (eg
2% of GDP@$100trn). This is towards the pessimistic end of literature.
Purely transitional costs (Ca =0): the same cutback, on a linear trajectory of abatement,
results in the same total integrated cost over the 30-year period, but these are now
attributed as transitional costs of reorienting the energy system over these decades.
Some key assumptions

2025. 2040. 2055. 2070. 2085. 2100.Year
5
10
15
20
25
30
GtC yr
Annual emissions
Adaptive energy system
2025. 2040. 2055. 2070. 2085. 2100.Year
1000
1500
2000
GtC
Cumulative emissions
Adaptive energy system
The ‘global optimal trajectory’ is radically different for an adaptive energy system, given ‘typical’ damage & discounting assumptions
Default (reference)
trajectory
Default (reference)
trajectory
Standard (non-adaptive)
Standard (non-adaptive)
• Both First and Third pillar policies – which can be broadly characterised as regulatory and technological systems innovation – are adaptive in nature (ie. transitional cost with enduring benefit)• A significant degree of direct response to prices may also be adaptive

2010. 2025. 2040. 2055. 2070. 2085. 2100.Year0
2
4
6
8
$trillion
Annual damages from climate change
‘Optimal’ effort
2010. 2025. 2040. 2055. 2070. 2085. 2100.Year0
2
4
6
8
$trillion
Annual abatement cost
• For an adaptive system (characterised by transitional costs with enduring benefits) early efforts have much higher benefit than just emission reductions • eg. Optimal global investment c. $1trn/yr can cut annual costs (abatement + damage) towards end of century by at least 5 times as much
Measures which steadily adjust the pathway are optimal at much higher ‘cost of carbon’
Adaptive energy system
Default (reference)
trajectoryStandard (non-
adaptive)
Standard (non-adaptive)
Adaptive energy system

Comparison with DICE: Emissions reference almost identical (GDP also) but response differs widely

• With any significant discount rate, the time delay between emissions and assumed impacts is a crucial determinant
• Standard frameworks imply sharply rising costs – both damages and mitigation costs - over the century
• The adaptability of energy systems is also a major driver of the net benefits of early action – will vary by specific options and would justify diversity in apparent mitigation costs
• The combination can lead to ‘cost benefit’ effort levels similar to a risk-averse strategy dominated by non-linearly / threshold assumptions, may almost stabilise gross costs
Conclusion from comparative study:
It is not just the assumed discount rate and
scale and non-linearity of impacts that matters!
Expectations, Investment stability and macro-economic dimensions
Planetary Econ & the contours of carbon pricing
Outline of this talk
Setting the scene: four conceptions of carbon pricing
Part 1: The Structures of ‘Planetary Economics:
Three Domains, Pillars and risk conceptions
Part 2: Economics of adaptive economic systems
A numerical illustration
Part 3: First among equals?
A suggested approach to real-world carbon pricing
http://climatestrategies.org/projects/planetary-economics/for additional information, presentations and slide sets

Standards &
Engagement
Markets &
PricesStrategic
Investment
POLICY PILLARS
Technology
options &
competitiveness
Changing course requires a sustained package -Viable & effective carbon pricing must tap into the other domains and support the other pillars
Manage bills,
increase
responsiveness
Revenues,
revealed costs,
strategic value
Values, pull & preferences
Attention,
products &
finance
Education, access & control

Key policy implication of some numerical analysis
• The value of measures which adjust the pathway is several times that of measures which just save CO2
• Useful to think of a ’base’ carbon reduction value as that which can be implemented today to reflect the assumed damage of CO2 emissions – classic ‘second domain’
• Measures in the First and Third Domains may well justify a short-run “cost of carbon” well above this base carbon reduction value
• A rising base carbon reduction value can also enhance in particular strategic investments & leverage long term institutional finance

1. Attention effects and
funding
• rising steadily enables efficiency to keep pace and stop much rise in total bills
• efficiency programmes may counter regressive concerns?
2. Rising price differential
• steadily reduce use of coal in power generation without huge asset stranding
• help to move renewables over time from transitional subsidies into mainstream market
3. Long term visibility and
leverage
• increased investment stability • time and leveraged funding for innovation,
infrastructure and tech transfer programmes
… so just maybe could design a ‘First among Equals?’
A rising base carbon reduction value could contribute across domains:
Embedding in international agreement could enhance stability and credibility

Planetary Economics: Energy, Climate Change and the Three Domains of Sustainable Development
Pillar 1
• Standards and engagement for smarter choice• 3: Energy and Emissions – Technologies and Systems
• 4: Why so wasteful?
• 5: Tried and Tested – Four Decades of Energy Efficiency Policy
Pillar II
• Markets and pricing for cleaner products and processes
• 6: Pricing Pollution – of Truth and Taxes
• 7: Cap-and-trade & offsets: from idea to practice
• 8: Who’s hit? Handling the distributional impacts of carbon pricing
Pillar III
• Investment and incentives for innovation and infrastructure
• 9: Pushing further, pulling deeper
• 10: Transforming systems
• 11: The dark matter of economic growth
1. Introduction: Trapped?2. The Three Domains
12. Conclusions: Changing Course
http://climatestrategies.org/projects/planetary-economics/for information and register of related events.
#Planetaryeconomics
Kindle: http://www.amazon.co.uk/Planetary-Economics-Sustainable-Development-sustainable-
ebook/dp/B00JQFBWDO/ref=tmm_kin_swatch_0?_encoding=UTF8&sr=8-1&qid=1415625933


