
COMMONWEALTH OF VIRGINIA
DEPARTMENT OF ENVIRONMENTAL QUALITY
WATER PERMITTING DIVISION
P.O.BOX 1105 Richmond, VA 23218
Subject: Guidance Memo No. 16-2001 - Updated Virginia Runoff Reduction Method Compliance
Spreadsheets - Version 3.0
To: Regional Directors and VSMP Administrators
From: Melanie D. Davenport, Director
Date: May 2, 2016
Copies: James Golden, Jeff Steers, Fred Cunningham, Jerome Brooks, Ben Leach, Robert
Cooper, Regional Stormwater Compliance Managers
Summary:
The Virginia Stormwater Management Program (VSMP) regulation requires use of the Virginia Runoff
Reduction Method (VRRM) or another equivalent methodology approved by DEQ for compliance with
the Part IIB water quality criteria (9VAC25-870-65). This guidance revises the Virginia Runoff
Reduction Method: Instructions & Documentation (March 28, 2011) and updates the VRRM Excel
spreadsheets. Virginia Runoff Reduction Method Compliance Spreadsheet User’s Guide &
Documentation (Version 3.0, April 2016) is included as Attachment 1. This document provides
stepwise user instructions as well as a thorough explanation of the spreadsheet logic, equations, and
reference information. The updated VRRM Excel spreadsheets may be found on the DEQ web page as
part of GM 16-2001 and the BMP Clearinghouse website. The spreadsheets serve as the DEQ
compliance tool for projects subject to the VRRM and the Part IIB water quality criteria.
Key new features of VRRM spreadsheets (Version 3.0) include:
Summary land cover statistics including the composite runoff coefficient for the entire site in its
developed condition, the pollutant load (total phosphorus and total nitrogen), and the
corresponding treatment volume (Tv).
Ability for the designer to evaluate the effectiveness of different BMPs and BMP combinations
with respect to water quality compliance using up to five different drainage area tabs within a
site.
Summary information in each drainage area tab for the land cover, runoff volume and generated
pollutant load, the BMPs selected, and the runoff volume and pollutant load reduced by the
selected BMPs.
Tracking of volume reduction in each drainage area tab for use in compliance with water
quantity control requirements.
A summary compliance report for BMP implementation in each drainage area tab as well as
overall site compliance.
This guidance memorandum does not replace the VRMM instructions and document (March 28, 2011)
that was incorporated by reference into the VSMP regulation. DEQ plans to update the VSMP

GM16-2001 Updated Virginia Runoff Reduction Method- Version 3.0 Page 2
regulation to replace the VRMM instructions and document with the definitions, equations, and protocol
for calculation of the VRRM.
DEQ staff and VSMP Authorities should encourage designers to start using Version 3.0 on the effective
date of this guidance although designers may utilize earlier spreadsheet versions. DEQ staff and VSMP
Authorities should utilize VRRM Version 3.0 for review of all plans received after July 1, 2016.
Electronic Copy:
An electronic copy of this guidance is available for DEQ staff internally on DEQNET, and for the
general public on DEQ’s website and the BMP Clearinghouse website.
Contact Information:
Please contact Robert Cooper, Office of Stormwater Management (804) 698-4033
[email protected] with any questions regarding the application of this guidance.
Disclaimer:
This document is provided as guidance and, as such, sets forth standard operating procedures for
the agency. However, it does not mandate any particular method nor does it prohibit any
particular method for the analysis of data, establishment of a wasteload allocation, or
establishment of a permit limit. If alternative proposals are made, such proposals should be
reviewed and accepted or denied based on their technical adequacy and compliance with
appropriate laws and regulations.
Attachment 1
VIRGINIA RUNOFF REDUCTION METHOD
Compliance Spreadsheet User’s Guide & Documentation
(Version 3.0, April 2016)
Table of Contents
1.0 INTRODUCTION ..................................................................................................................... 6
2.0 BASICS FOR USING SPREADSHEET AND GUIDANCE .................................................................. 7
2.1. SPREADSHEET BASICS ........................................................................................................................ 7
2.2. SOFTWARE SPECIFICATIONS ............................................................................................................... 8
2.3. GUIDANCE BASICS ............................................................................................................................ 8
3.0 SITE TAB (NEW DEVELOPMENT) ............................................................................................. 9
3.1. SITE TAB – LAND COVER ................................................................................................................. 11
3.2. SITE TAB – CONSTANTS ................................................................................................................... 14
3.3. SITE TAB – COMPUTATIONS ............................................................................................................. 15
4.0 SITE TAB (RE-DEVELOPMENT) ............................................................................................... 17
4.1. WHAT’S SIMILAR? .......................................................................................................................... 19
4.2. WHAT’S DIFFERENT? ...................................................................................................................... 20
4.2.1. Site Tab (ReDevelopment) – Land Cover Area Inputs ....................................................... 20
4.2.2. Site Tab (ReDevelopment) – Land Cover Summaries ........................................................ 27
4.2.3. Site Tab (ReDevelopment) – Water Quality Requirements ............................................... 33
5.0 DRAINAGE AREA (D.A.) TABS ................................................................................................ 39
5.1. DRAINAGE AREA TAB LAND COVER AREAS ......................................................................................... 41
5.2. DRAINAGE AREA LAND COVER SUMMARY .......................................................................................... 42
5.3. DRAINAGE AREA TAB STORMWATER BMPS ....................................................................................... 43
5.3.1. BMP Design Levels ............................................................................................................ 43
5.3.2. Runoff Reduction BMPs .................................................................................................... 44
5.3.3. Non-Runoff Reduction BMPs ............................................................................................. 45
5.3.4. Drainage Area Tab BMP Computations ............................................................................ 48
5.3.5. Drainage Area Tab Computation Summaries (Runoff Reduction BMPs and All BMPs) .... 51
6.0 WATER QUALITY COMPLIANCE TAB ...................................................................................... 54
7.0 RUNOFF VOLUME AND CN TAB ............................................................................................ 59
7.1. RUNOFF VOLUME AND CN TAB USER INPUTS AND LIMITATIONS ............................................................ 60
7.2. RUNOFF VOLUME AND CN TAB RESULTS ........................................................................................... 62
7.3. INTEGRATING WATER QUALITY TREATMENT WITH CONTROL OF LARGER STORMS ..................................... 64
8.0 SUMMARY TAB (COMPLIANCE SUMMARY) ........................................................................... 65
Attachment 1
Virginia Runoff Reduction Method Compliance Spreadsheet April 2016
2
9.0 VRRM SPREADSHEET EQUATIONS ........................................................................................ 72
9.1. SITE TAB ....................................................................................................................................... 72
9.2. D.A. TABS .................................................................................................................................... 75
9.3. RUNOFF VOLUME AND CN TAB ........................................................................................................ 80
9.4. REDEVELOPMENT SITE TAB – COMPUTATIONS .................................................................................... 83
9.4.1. ReDevelopment with Impervious Cover Increase, (𝑨𝑰𝑪, 𝒑𝒐𝒔𝒕 − 𝑨𝑰𝑪, 𝒑𝒓𝒆) > 𝟎 ............ 83
9.4.2. ReDevelopment with No Impervious Cover Increase, (𝑨𝑰𝑪, 𝒑𝒐𝒔𝒕 − 𝑨𝑰𝑪, 𝒑𝒓𝒆) ≤ 𝟎 ....... 89
9.4.3. Final Post-Development Site Requirement ....................................................................... 89
10.0 REFERENCES ........................................................................................................................ 90
11.0 ACRONYMS AND DEFINITIONS ............................................................................................. 91

Attachment 1
Virginia Runoff Reduction Method Compliance Spreadsheet April 2016
3
List of Figures
FIGURE 1. ENABLING MACROS ............................................................................................................................................... 8
FIGURE 2. VRRM NEW DEVELOPMENT COMPLIANCE SPREADSHEET – SITE TAB WITH NO USER INPUTS ............................................. 9
FIGURE 3. VRRM NEW DEVELOPMENT COMPLIANCE SPREADSHEET – SITE TAB WITH USER LAND COVER INPUTS .............................. 10
FIGURE 4. VRRM REDEVELOPMENT COMPLIANCE SPREADSHEET – SITE TAB (UPPER CELLS) ........................................................... 22
FIGURE 5. VRRM REDEVELOPMENT COMPLIANCE SPREADSHEET – SITE TAB (LOWER CELLS) – LAND COVER AREAS AND TOTAL DISTURBED
ACREAGE NOT ENTERED .................................................................................................................................... 23
FIGURE 6. VRRM REDEVELOPMENT SITE TAB (LOWER CELLS) – LAND COVER AREAS AND TOTAL DISTURBED ACREAGE ENTERED .......... 24
FIGURE 7. VRRM REDEVELOPMENT SITE TAB (LOWER CELLS) – LAND COVER AREAS ENTERED, TOTAL DISTURBED ACREAGE NOT ENTERED
.................................................................................................................................................................... 25
FIGURE 8. VRRM REDEVELOPMENT SITE TAB (UPPER CELLS) – LINEAR DEVELOPMENT PROJECT SELECTED ........................................ 26
FIGURE 9. VRRM REDEVELOPMENT SITE TAB (LOWER CELLS) – LINEAR DEVELOPMENT PROJECT SELECTED ....................................... 26
FIGURE 10. USER LISTED PRE-REDEVELOPMENT AND POST-DEVELOPMENT LAND COVER AREAS. ....................................................... 35
FIGURE 11. PRE-REDEVELOPMENT LAND COVER AREAS SHOWING CHANGES FROM LISTED TO ADJUSTED SPREADSHEET LAND COVER AREAS
AND APPLICABLE TP LOAD REDUCTION REQUIREMENTS ........................................................................................... 36
FIGURE 12. REDUCTION REQUIREMENTS FOR REDEVELOPMENT PROJECTS (NO NEW NET IMPERVIOUS COVER) ..................................... 37
FIGURE 13. DRAINAGE AREA TAB (SECTIONS) ........................................................................................................................ 40
FIGURE 14. DRAINAGE AREA TAB, LAND COVER AREAS ........................................................................................................... 41
FIGURE 15. DRAINAGE AREA TAB, RR BMP SUMMARY........................................................................................................... 53
FIGURE 16. DRAINAGE AREA TAB, BMP SUMMARY (ALL BMPS) .............................................................................................. 53
FIGURE 17. WATER QUALITY COMPLIANCE TAB, REDEVELOPMENT SPREADSHEET WITH LINEAR PROJECT RESULTS SECTION ................... 58
FIGURE 18. RUNOFF AND CN TAB, LIMITATIONS .................................................................................................................... 60
FIGURE 19. RUNOFF AND CN TAB, DRAINAGE AREA A SUMMARY ............................................................................................. 62
FIGURE 20. NEW DEVELOPMENT SUMMARY TAB – WATER QUALITY COMPLIANCE, SITE SUMMARY SECTIONS .................................. 65
FIGURE 21. REDEVELOPMENT SUMMARY TAB – WATER QUALITY COMPLIANCE, SITE SUMMARY SHOWING ERRORS ........................... 66
FIGURE 22. NEW DEVELOPMENT SUMMARY TAB – DRAINAGE AREA SUMMARY AND DRAINAGE AREA COMPLIANCE SUMMARY ........... 67
FIGURE 23. SUMMARY TAB – DRAINAGE AREA A LAND COVER SUMMARY, BMP SELECTIONS, AND WATER QUALITY COMPLIANCE. ..... 67
FIGURE 24. SUMMARY TAB – WATER QUALITY COMPLIANCE, RUNOFF VOLUME AND CN CALCULATIONS ......................................... 68
FIGURE 25. SUMMARY TAB ERROR NOTIFICATIONS FOR NEW DEVELOPMENT (UPPER) AND REDEVELOPMENT (LOWER) SPREADSHEETS. 69
FIGURE 26. SUMMARY TAB – WATER QUALITY COMPLIANCE REPORT – PRINT PREVIEW SCREEN .................................................... 70
FIGURE 27. SITE SUMMARY TAB (PRINT BUTTON ACTIVATED) .................................................................................................. 71
FIGURE 28. DECISION FLOWCHART FOR DETERMINATION OF PERVIOUS AREA CONVERTED TO NEW NET IMPERVIOUS COVER IN
REDEVELOPMENT SPREADSHEET. ......................................................................................................................... 85

Attachment 1
Virginia Runoff Reduction Method Compliance Spreadsheet April 2016
4
List of Tables
TABLE 1. LAND COVER GUIDANCE FOR VRRM COMPLIANCE SPREADSHEETS ............................................................................... 12
TABLE 2. SITE TAB CONSTANTS (NEW DEVELOPMENT) ............................................................................................................ 14
TABLE 3. SITE TAB COMPUTATIONS (NEW DEVELOPMENT) ...................................................................................................... 15
TABLE 4. REDEVELOPMENT SPREADSHEET SITE TAB CONSTANTS ............................................................................................... 19
TABLE 5. REDEVELOPMENT SPREADSHEET – SITE TAB, LAND COVER AREAS ................................................................................. 21
TABLE 6. SITE TAB COMPUTATIONS FOR LAND COVER SUMMARY (PRE-REDEVELOPMENT, LISTED) .................................................. 28
TABLE 7. SITE TAB COMPUTATIONS FOR LAND COVER SUMMARY (PRE-REDEVELOPMENT, ADJUSTED) ............................................. 29
TABLE 8. SITE TAB COMPUTATIONS FOR LAND COVER SUMMARY (FINAL POST-DEVELOPMENT) ...................................................... 30
TABLE 9. SITE TAB COMPUTATIONS FOR LAND COVER SUMMARY (POST-REDEVELOPMENT) ........................................................... 31
TABLE 10. SITE TAB COMPUTATIONS FOR LAND COVER SUMMARY (POST-REDEVELOPMENT, NEW IMPERVIOUS) .............................. 32
TABLE 11. SITE TAB COMPUTATIONS FOR TOTAL SITE AREA POST-DEVELOPMENT ........................................................................ 34
TABLE 12. DRAINAGE AREA TAB COMPUTATIONS FOR LAND COVER SUMMARY ........................................................................... 42
TABLE 13. STORMWATER BEST MANAGEMENT PRACTICES – WITH RUNOFF REDUCTION ................................................................ 44
TABLE 14. STORMWATER BEST MANAGEMENT PRACTICES – NO RUNOFF REDUCTION .................................................................. 45
TABLE 15. DRAINAGE AREA TAB VOLUME COMPUTATIONS PER BMP ........................................................................................ 48
TABLE 16. DRAINAGE AREA TAB TP LOAD COMPUTATIONS PER BMP ........................................................................................ 49
TABLE 17. DRAINAGE AREA TAB TN LOAD COMPUTATIONS PER BMP ....................................................................................... 50
TABLE 18. DRAINAGE AREA TAB RUNOFF REDUCTION BMP SUMMARY...................................................................................... 51
TABLE 19. DRAINAGE AREA TAB TOTAL BMP SUMMARY ......................................................................................................... 52
TABLE 20. WATER QUALITY COMPLIANCE TAB SITE RESULTS (AREAS AND CHECKS) ...................................................................... 54
TABLE 21. WATER QUALITY COMPLIANCE TAB SITE RESULTS (VOLUME, TP, AND TN* BY DA TABS) ............................................... 55
TABLE 22. WATER QUALITY COMPLIANCE TAB SITE RESULTS (TOTAL PHOSPHORUS, TOTAL NITROGEN) ........................................... 56
TABLE 23. RUNOFF VOLUME AND CN TAB LIMITATIONS .......................................................................................................... 61
TABLE 24. RUNOFF VOLUME AND CN TAB RESULTS ................................................................................................................ 63

Attachment 1
Virginia Runoff Reduction Method Compliance Spreadsheet April 2016
5
List of Equations
EQUATION 1.1A. FOREST/OPEN SPACE RUNOFF COEFFICIENT (WEIGHTED FOR SOIL GROUPS): ...................................................... 72
EQUATION 1.1B. PERCENTAGE FOREST/OPEN SPACE AREA: ..................................................................................................... 72
EQUATION 1.2A. MANAGED TURF RUNOFF COEFFICIENT (WEIGHTED FOR SOIL GROUPS): ............................................................. 72
EQUATION 1.2B. PERCENTAGE MANAGED TURF AREA: ........................................................................................................... 72
EQUATION 1.3A. IMPERVIOUS COVER RUNOFF COEFFICIENT: ................................................................................................... 72
EQUATION 1.3B. PERCENTAGE IMPERVIOUS COVER AREA: ....................................................................................................... 73
EQUATION 2. SITE COMPOSITE RUNOFF COEFFICIENT .............................................................................................................. 73
EQUATION 3. POST-DEVELOPMENT SITE TREATMENT VOLUME ................................................................................................. 74
EQUATION 4. POST-DEVELOPMENT SITE TP LOAD .................................................................................................................. 74
EQUATION 5. REQUIRED SITE TP LOAD REDUCTION ................................................................................................................ 74
EQUATION 6. RUNOFF VOLUME FROM ENTIRE DRAINAGE AREA (CELL M8) ................................................................................ 75
EQUATION 7. TOTAL PHOSPHORUS AVAILABLE FOR REMOVAL FROM ENTIRE DRAINAGE AREA (CELL M7)......................................... 75
EQUATION 8. RUNOFF VOLUME FROM CONTRIBUTING DRAINAGE AREA ..................................................................................... 76
EQUATION 9. RUNOFF REDUCTION ACHIEVED BY PRACTICE (COLUMN F) .................................................................................... 76
EQUATION 10. REMAINING RUNOFF VOLUME LEAVING THE PRACTICE (COLUMN G) ..................................................................... 77
EQUATION 11. BMP TREATMENT VOLUME (TOTAL RUNOFF VOLUME TO PRACTICE, COLUMN H) ................................................... 78
EQUATION 12. UNTREATED POLLUTANT LOAD TO PRACTICE (PHOSPHORUS, COLUMN K; NITROGEN, COLUMN S) .............................. 78
EQUATION 13. TOTAL LOAD REMOVAL BY PRACTICE (PHOSPHORUS, COLUMN L; NITROGEN, COLUMN T) ........................................ 79
EQUATION 14. REMAINING LOAD (PHOSPHORUS, COLUMN M; NITROGEN, COLUMN U)............................................................... 79
EQUATION 15. COMPOSITE CURVE NUMBER (CN) ................................................................................................................. 80
EQUATION 16. RUNOFF VOLUME WITH NO RUNOFF REDUCTION, ROW 33 ................................................................................. 81
EQUATION 17. RUNOFF VOLUME WITH RUNOFF REDUCTION, ROW 34 ...................................................................................... 81
EQUATION 18. ADJUSTED CURVE NUMBER ........................................................................................................................... 82
EQUATION 19. NET CHANGE IN IMPERVIOUS COVER ............................................................................................................... 83
EQUATION 20. TP LOAD REDUCTION REQUIREMENT FOR NEW NET IMPERVIOUS COVER ............................................................... 83
EQUATION 21. NET DECREASE IN PERVIOUS AREAS ................................................................................................................ 84
EQUATION 22A. TP LOAD REDUCTION REQUIREMENT FOR POST-REDEVELOPMENT AREA (WHEN TARGET TP BASELINE LESS THAN OR
EQUAL TO TARGET TP LOAD, 𝑳𝑻𝑷 𝑩𝒂𝒔𝒆𝒍𝒊𝒏𝒆 ≤ 𝑳𝒕𝒂𝒓𝒈𝒆𝒕, 𝒑𝒓𝒆𝑹𝒆𝑫𝒆𝒗) .......................................................... 86
EQUATION 22B. TP LOAD REDUCTION REQUIREMENT FOR POST-REDEVELOPMENT AREA (WHEN TARGET TP LOAD LESS THAN TP
BASELINE, 𝑳𝒕𝒂𝒓𝒈𝒆𝒕, 𝒑𝒓𝒆𝑹𝒆𝑫𝒆𝒗 < 𝑳𝑻𝑷 𝑩𝒂𝒔𝒆𝒍𝒊𝒏𝒆) .................................................................................. 87
EQUATION 23. FINAL TP LOAD REDUCTION REQUIREMENT FOR REDEVELOPMENT ....................................................................... 89

Attachment 1
Virginia Runoff Reduction Method Compliance Spreadsheet April 2016
6
1.0 INTRODUCTION
The Virginia Stormwater Management Program (VSMP) regulations utilize the Virginia Runoff
Reduction Method (VRRM) for compliance with the water quality criteria (9VAC25-870-65).
The VRRM is supported by stormwater research for runoff reduction and pollutant removal
capabilities of various stormwater best management practices (BMPs). Information and
documentation concerning the development of the VRRM can be obtained from Technical
Memorandum: The Runoff Reduction Method prepared by the Center for Watershed Protection
(CWP) (www.cwp.org) and the Chesapeake Stormwater Network (CWP, 2008).
DEQ has developed two Excel spreadsheets to assist in determining compliance with the VRRM;
one spreadsheet is for new development and the other is for redevelopment. The spreadsheets are
designed to help users see the benefits of environmental site design (ESD) and experiment with
various stormwater BMPs on a particular site. Selected stormwater BMPs can also be evaluated
in series (e.g., treatment trains) to meet the water quality standards in the regulations.
Each VRRM compliance spreadsheet is meant to serve as a tool for determining compliance and
does not limit the use of other tools or methods consistent with the water quality requirements. It
is important to note that compliance determination is only the first step in the design process.
The suitability of environmental site design features and design BMP specifications to a project
site are not determined by the spreadsheets. When a BMP is selected in the spreadsheet, it is
assumed that the designer will locate and design the BMP according to the design criteria
provided in the Virginia Stormwater BMP Standards and Specifications.
Key Features of New Development and ReDevelopment VRRM Spreadsheets:
Provide a summary of land cover statistics that includes the composite runoff coefficient
for the entire site in its developed condition, the pollutant load (total phosphorus [TP] and
total nitrogen [TN]), and the corresponding treatment volume (Tv).
Allow the designer to evaluate the effectiveness of different BMPs and BMP
combinations with respect to water quality compliance using up to five different drainage
area tabs within a site.
Provide a summary for each drainage area tab that includes the land cover, runoff volume
and pollutant load generated, the BMPs selected, and the runoff volume and pollutant
load reduced by the selected BMPs.
Track the volume reduction that can be counted towards compliance with water quantity
control requirements in each drainage area tab.
Provide an overall compliance summary report that itemizes BMP implementation in
each drainage area tab as well as overall site compliance.

Attachment 1
Virginia Runoff Reduction Method Compliance Spreadsheet April 2016
7
2.0 BASICS FOR USING SPREADSHEET AND GUIDANCE
2.1. SPREADSHEET BASICS
The VRRM New Development and VRRM ReDevelopment Compliance Spreadsheets are each
composed of six different types of tabs. The Site tab calculates a nutrient load for the site and
runoff treatment volume based on the proposed land cover characteristics. The five Drainage
Area tabs (A to E), which are identical, can represent different drainage areas discharging to
different outfalls located within the site, or BMPs can be grouped together on a single Drainage
Area tab for more complex designs. BMPs applied to the site within user defined drainage areas
for water quality compliance are selected within the Drainage Area tabs. The Water Quality
Compliance tab provides information on site and drainage area nutrient loads and runoff
volumes. This tab’s primary function is to indicate whether or not compliance with phosphorus
load limitations has been achieved, and if not, where there may be further opportunity for
phosphorus reductions. The Runoff Volume and CN tab provides the user with volume tracking
information, runoff depth, and curve number (CN) adjustments associated with runoff volume-
reducing BMPs. The Summary tab organizes and displays the information entered and
calculated on the other tabs. The Summary tab information can easily be printed as a report for
submittal or review purposes. The final tab, the Notes tab, is a running list of the changes
associated with the different released versions of the spreadsheet including changes and
corrections made in Version 3.0.
The ReDevelopment Spreadsheet and the New Development Spreadsheet are essentially the
same with a few exceptions reflected in two of the spreadsheet tabs. The Site tab has a different
look between the two spreadsheets due to differences in data inputs and compliance
requirements. Similarly, the Summary tab differs given the respective reporting of each
spreadsheet’s data inputs and calculated results. The Site tab for the ReDevelopment
Spreadsheet requires data input on the existing site and proposed site conditions and incorporates
different compliance computations in accordance with the regulations, 9VAC25-870-63 A 2. The
nutrient loads and volumes are calculated for both the existing site and the proposed site, and the
regulatory phosphorus load reduction requirement for the site is comprised of both a reduction to
the existing nutrient load and meeting the new development compliance phosphorus limitation
for any new net impervious areas. Once the load reduction requirements are determined, the
procedures for selecting the BMPs and verifying compliance are the same as those for new
development. Instructions on using the Site tab for redevelopment (including site area versus
disturbed area) are included in Section 4.
Both spreadsheets can incorporate use of either the 2011 BMP Standards and Specifications
included in the VSMP regulations (9VAC25-870-65 B) or the Draft 2013 BMP Standards and
Specifications. The user’s selection is made through a two-option button included at the top of

Attachment 1
Virginia Runoff Reduction Method Compliance Spreadsheet April 2016
8
the Site tab. There is only one difference between the two specifications that is applicable to the
spreadsheets: the revised runoff reduction credit for compost amended grass channels (BMP No.
4) in the Draft 2013 BMP Standards and Specifications.
2.2. SOFTWARE SPECIFICATIONS
The spreadsheet files (Version 3.0) are Excel documents and were developed using Microsoft
Excel 2007 in a macro-enabled workbook format (.xlsm). Users must enable macros in order for
the spreadsheets to function properly (Fig. 1).
Figure 1. Enabling macros
2.3. GUIDANCE BASICS
The basic components and terms of the VRRM compliance spreadsheets are discussed in the
sections below and presented along with step-by-step user instructions. This guidance applies to
Version 3.0 of the spreadsheets. This guidance can be used for older versions of the
spreadsheets but cell references may differ. Version 3.0 provides corrections for several errors
found in the earlier spreadsheet versions and adds ease-of-use features.
Using the VRRM spreadsheet
Functional spreadsheet cells are color-coded as follows:
Green Cells (unlocked) are for user data entries
Yellow cells (locked) are fixed constant values.
Grey cells (locked) are calculated values.
Indigo Cells (locked) are final results (Total Phosphorus reduction requirement).
Click to enable macros

Attachment 1
Virginia Runoff Reduction Method Compliance Spreadsheet April 2016
9
3.0 SITE TAB (NEW DEVELOPMENT)
The Site tab requires site data inputs and provides overall site information. The main purpose of
this tab is to compute the required reduction of TP for the site based on the proposed site land
cover characteristics. Using the land cover data entered by the user and the fixed constant values
the site TP loading is calculated using the Simple Method equation (Eq. 4). The required load
reduction is based on the difference between the post-development site load and the load limit of
0.41 pounds TP per acre per year. The tab also shows the calculated values used to derive the
required site load reduction. The data input cells and constants used in the Simple Method load
calculations are described below and shown on the Site tab screen shot in Fig. 2.
Co
nst
an
ts
Site load TP
requirement does
not compute until
site land cover
areas entered
Clears user
inputs from all
spreadsheets
Cell Color Scheme
Land Cover
Type and
Soils
Use
r In
pu
ts
BMP Design Specifications List selection
Project
Information
Figure 2. VRRM New Development Compliance Spreadsheet – Site Tab with No User Inputs

Attachment 1
Virginia Runoff Reduction Method Compliance Spreadsheet April 2016
10
Figure 2 shows a screenshot of the Site tab when land cover data has been entered.
Site tab computations
Notification
appears when
Forest/Open Space
proposed
Site load TP
requirement
Figure 3. VRRM New Development Compliance Spreadsheet – Site Tab with User Land Cover Inputs
Attachment 1
Virginia Runoff Reduction Method Compliance Spreadsheet April 2016
11
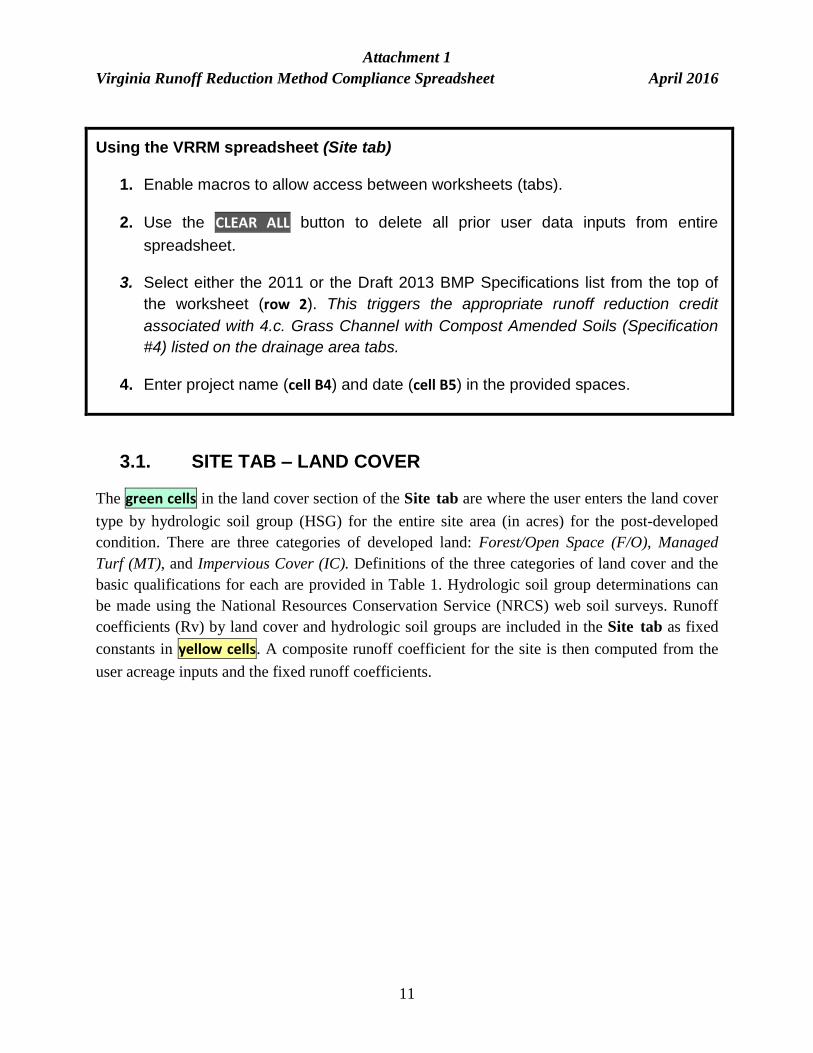
Using the VRRM spreadsheet (Site tab)
1. Enable macros to allow access between worksheets (tabs).
2. Use the CLEAR ALL button to delete all prior user data inputs from entire
spreadsheet.
3. Select either the 2011 or the Draft 2013 BMP Specifications list from the top of
the worksheet (row 2). This triggers the appropriate runoff reduction credit
associated with 4.c. Grass Channel with Compost Amended Soils (Specification
#4) listed on the drainage area tabs.
4. Enter project name (cell B4) and date (cell B5) in the provided spaces.
3.1. SITE TAB – LAND COVER
The green cells in the land cover section of the Site tab are where the user enters the land cover
type by hydrologic soil group (HSG) for the entire site area (in acres) for the post-developed
condition. There are three categories of developed land: Forest/Open Space (F/O), Managed
Turf (MT), and Impervious Cover (IC). Definitions of the three categories of land cover and the
basic qualifications for each are provided in Table 1. Hydrologic soil group determinations can
be made using the National Resources Conservation Service (NRCS) web soil surveys. Runoff
coefficients (Rv) by land cover and hydrologic soil groups are included in the Site tab as fixed
constants in yellow cells. A composite runoff coefficient for the site is then computed from the
user acreage inputs and the fixed runoff coefficients.
Attachment 1
Virginia Runoff Reduction Method Compliance Spreadsheet April 2016
12
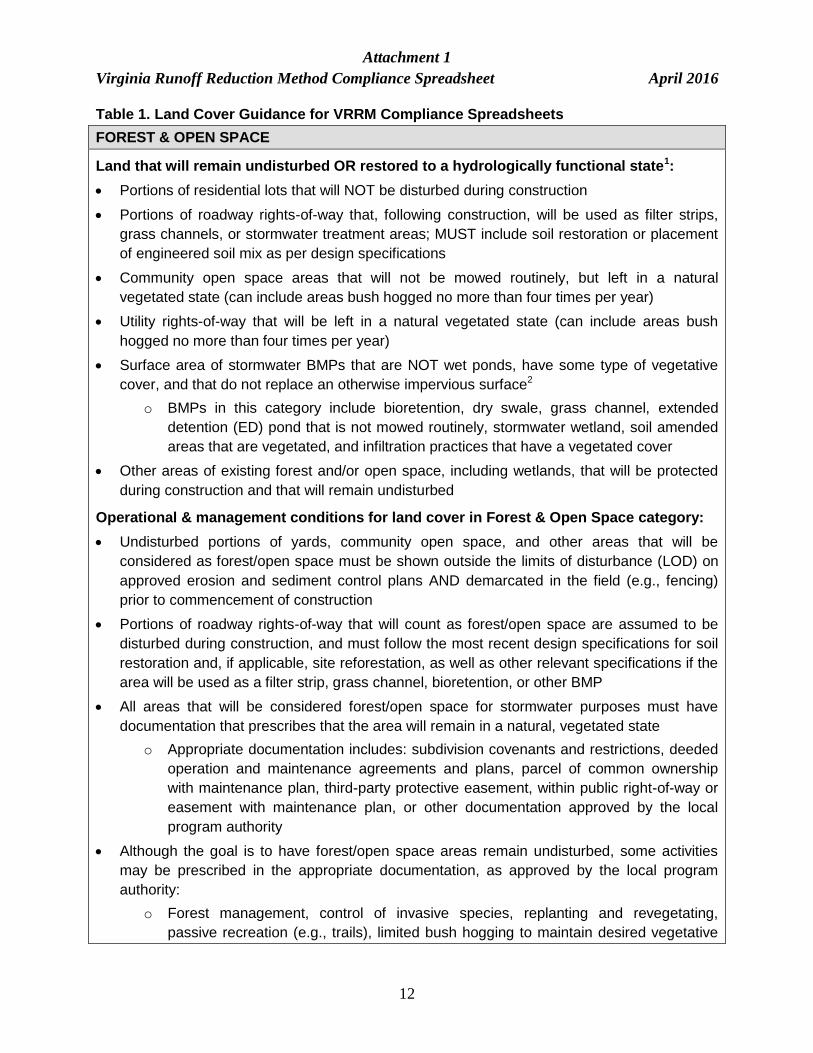
Table 1. Land Cover Guidance for VRRM Compliance Spreadsheets
FOREST & OPEN SPACE
Land that will remain undisturbed OR restored to a hydrologically functional state1:
Portions of residential lots that will NOT be disturbed during construction
Portions of roadway rights-of-way that, following construction, will be used as filter strips,
grass channels, or stormwater treatment areas; MUST include soil restoration or placement
of engineered soil mix as per design specifications
Community open space areas that will not be mowed routinely, but left in a natural
vegetated state (can include areas bush hogged no more than four times per year)
Utility rights-of-way that will be left in a natural vegetated state (can include areas bush
hogged no more than four times per year)
Surface area of stormwater BMPs that are NOT wet ponds, have some type of vegetative
cover, and that do not replace an otherwise impervious surface2
o BMPs in this category include bioretention, dry swale, grass channel, extended
detention (ED) pond that is not mowed routinely, stormwater wetland, soil amended
areas that are vegetated, and infiltration practices that have a vegetated cover
Other areas of existing forest and/or open space, including wetlands, that will be protected
during construction and that will remain undisturbed
Operational & management conditions for land cover in Forest & Open Space category:
Undisturbed portions of yards, community open space, and other areas that will be
considered as forest/open space must be shown outside the limits of disturbance (LOD) on
approved erosion and sediment control plans AND demarcated in the field (e.g., fencing)
prior to commencement of construction
Portions of roadway rights-of-way that will count as forest/open space are assumed to be
disturbed during construction, and must follow the most recent design specifications for soil
restoration and, if applicable, site reforestation, as well as other relevant specifications if the
area will be used as a filter strip, grass channel, bioretention, or other BMP
All areas that will be considered forest/open space for stormwater purposes must have
documentation that prescribes that the area will remain in a natural, vegetated state
o Appropriate documentation includes: subdivision covenants and restrictions, deeded
operation and maintenance agreements and plans, parcel of common ownership
with maintenance plan, third-party protective easement, within public right-of-way or
easement with maintenance plan, or other documentation approved by the local
program authority
Although the goal is to have forest/open space areas remain undisturbed, some activities
may be prescribed in the appropriate documentation, as approved by the local program
authority:
o Forest management, control of invasive species, replanting and revegetating,
passive recreation (e.g., trails), limited bush hogging to maintain desired vegetative

Attachment 1
Virginia Runoff Reduction Method Compliance Spreadsheet April 2016
13
community, etc.
MANAGED TURF
Land disturbed and/or graded for eventual use as managed turf:
Portions of residential yards that are graded or disturbed, including yard areas, septic fields,
residential utility connections
Roadway rights-of-way that will be mowed and maintained as turf
Turf areas intended to be mowed and maintained as turf within residential, commercial,
industrial, and institutional settings
IMPERVIOUS COVER
Roadways, driveways, rooftops, parking lots, sidewalks, and other impervious areas
This category also includes the surface area of stormwater BMPs that: (1) are wet ponds, OR
(2) replace an otherwise impervious surface (e.g., green roof, pervious parking) 1
1Pre-redevelopment areas that are undisturbed and naturally vegetated are considered forest/open
space in the redevelopment spreadsheet.
2Certain stormwater BMPs are considered impervious with regard to the land cover computations.
These BMPs are still assigned Runoff Reduction and/or Pollutant Removal rates within the
spreadsheet, so their “values” for stormwater management are still accounted for. The reason they
are considered impervious is that they either do not reduce runoff volumes (e.g., wet ponds) OR
their Runoff Reduction rates are based on comparison to a more conventional land cover type (e.g.,
green roofs, pervious parking).
Whenever Forest/Open Space acreages are entered as post-development land cover, a
notification will appear below the land cover inputs in row 16 reminding the user that
Forest/Open Space areas must be protected in accordance with the Virginia Runoff Reduction
Method (see Fig. 3). Users should review the Forest/Open Space definition and be familiar with
protection and maintenance requirements if this land cover type is proposed (see Table 1).
Using the VRRM spreadsheet (Site tab)
5. Enter the post-development acreages of each land cover type by soil group (cells
B13 to E15).
Emphasis should be placed on environmental design principles during the early phases of project
development. If Forest/Open space is used, take note of pop-up message in cell A16.
Attachment 1
Virginia Runoff Reduction Method Compliance Spreadsheet April 2016
14
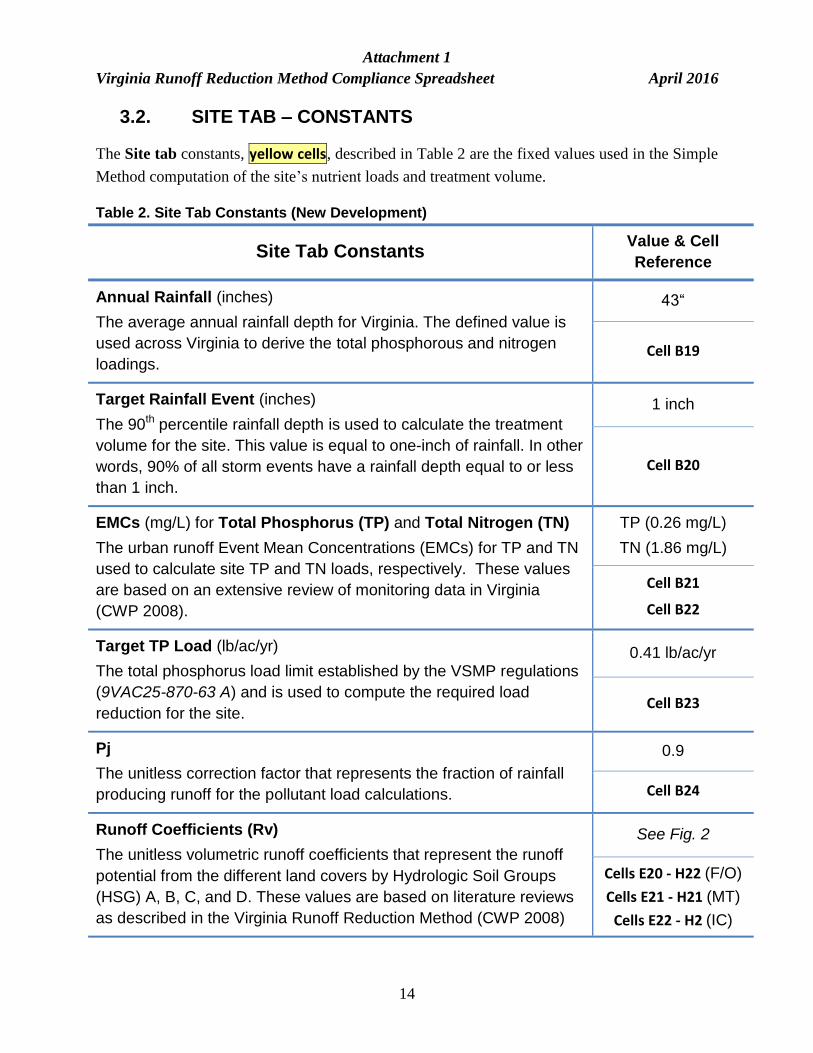
3.2. SITE TAB – CONSTANTS
The Site tab constants, yellow cells, described in Table 2 are the fixed values used in the Simple
Method computation of the site’s nutrient loads and treatment volume.
Table 2. Site Tab Constants (New Development)
Site Tab Constants Value & Cell
Reference
Annual Rainfall (inches)
The average annual rainfall depth for Virginia. The defined value is
used across Virginia to derive the total phosphorous and nitrogen
loadings.
43“
Cell B19
Target Rainfall Event (inches)
The 90th percentile rainfall depth is used to calculate the treatment
volume for the site. This value is equal to one-inch of rainfall. In other
words, 90% of all storm events have a rainfall depth equal to or less
than 1 inch.
1 inch
Cell B20
EMCs (mg/L) for Total Phosphorus (TP) and Total Nitrogen (TN)
The urban runoff Event Mean Concentrations (EMCs) for TP and TN
used to calculate site TP and TN loads, respectively. These values
are based on an extensive review of monitoring data in Virginia
(CWP 2008).
TP (0.26 mg/L)
TN (1.86 mg/L)
Cell B21
Cell B22
Target TP Load (lb/ac/yr)
The total phosphorus load limit established by the VSMP regulations
(9VAC25-870-63 A) and is used to compute the required load
reduction for the site.
0.41 lb/ac/yr
Cell B23
Pj
The unitless correction factor that represents the fraction of rainfall
producing runoff for the pollutant load calculations.
0.9
Cell B24
Runoff Coefficients (Rv)
The unitless volumetric runoff coefficients that represent the runoff
potential from the different land covers by Hydrologic Soil Groups
(HSG) A, B, C, and D. These values are based on literature reviews
as described in the Virginia Runoff Reduction Method (CWP 2008)
See Fig. 2
Cells E20 - H22 (F/O)
Cells E21 - H21 (MT)
Cells E22 - H2 (IC)
Attachment 1
Virginia Runoff Reduction Method Compliance Spreadsheet April 2016
15
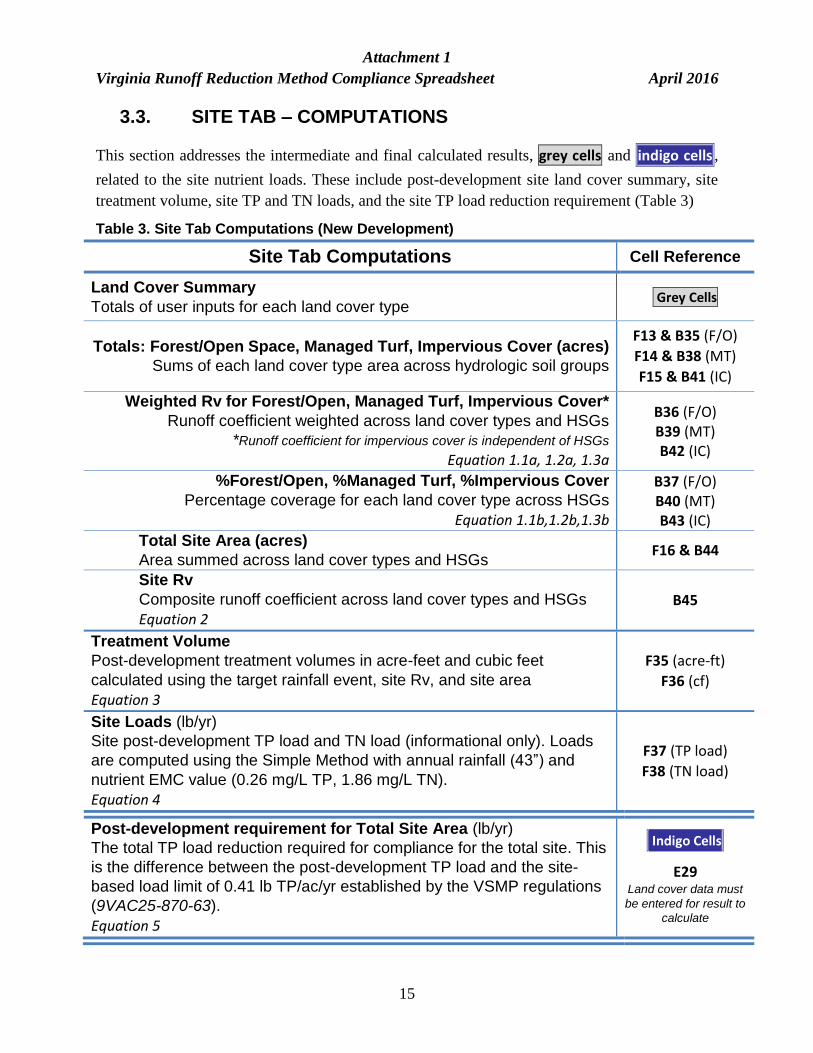
3.3. SITE TAB – COMPUTATIONS
This section addresses the intermediate and final calculated results, grey cells and indigo cells ,
related to the site nutrient loads. These include post-development site land cover summary, site
treatment volume, site TP and TN loads, and the site TP load reduction requirement (Table 3)
Table 3. Site Tab Computations (New Development)
Site Tab Computations Cell Reference
Land Cover Summary
Totals of user inputs for each land cover type Grey Cells
Totals: Forest/Open Space, Managed Turf, Impervious Cover (acres)
Sums of each land cover type area across hydrologic soil groups
F13 & B35 (F/O)
F14 & B38 (MT)
F15 & B41 (IC)
Weighted Rv for Forest/Open, Managed Turf, Impervious Cover*
Runoff coefficient weighted across land cover types and HSGs
*Runoff coefficient for impervious cover is independent of HSGs
Equation 1.1a, 1.2a, 1.3a
B36 (F/O) B39 (MT) B42 (IC)
%Forest/Open, %Managed Turf, %Impervious Cover
Percentage coverage for each land cover type across HSGs
Equation 1.1b,1.2b,1.3b
B37 (F/O) B40 (MT) B43 (IC)
Total Site Area (acres)
Area summed across land cover types and HSGs F16 & B44
Site Rv
Composite runoff coefficient across land cover types and HSGs
Equation 2
B45
Treatment Volume
Post-development treatment volumes in acre-feet and cubic feet
calculated using the target rainfall event, site Rv, and site area
Equation 3
F35 (acre-ft)
F36 (cf)
Site Loads (lb/yr)
Site post-development TP load and TN load (informational only). Loads
are computed using the Simple Method with annual rainfall (43”) and
nutrient EMC value (0.26 mg/L TP, 1.86 mg/L TN).
Equation 4
F37 (TP load)
F38 (TN load)
Post-development requirement for Total Site Area (lb/yr)
The total TP load reduction required for compliance for the total site. This
is the difference between the post-development TP load and the site-
based load limit of 0.41 lb TP/ac/yr established by the VSMP regulations
(9VAC25-870-63).
Equation 5
Indigo Cells
E29 Land cover data must
be entered for result to
calculate

Attachment 1
Virginia Runoff Reduction Method Compliance Spreadsheet April 2016
16
Using the VRRM spreadsheet (Site tab)
6. Take note of the post-development TP reduction requirement in cell E29.
a. This requirement is a site-based water quality requirement and unlike
water quantity control requirements, which must be met at each of the
site’s stormwater discharge points (per 9VAC25-870-66), the TP load
reduction requirement may be met using various Drainage Area tab load
reduction combinations, unless restricted as per 9VAC25-870-65.E.
b. Depending on the post-development land cover type and HSGs, the site
may or may not require further TP load reduction to meet the water quality
compliance requirements.
If the computed TP load reduction requirement (cell E29) is:
i. Less than or equal to zero (site is at or below the 0.41 lb/ac/yr load
limit), the site’s TP load meets water quality compliance
requirements. A message will appear in cell G29:
TP load reduction is not required;
ii. Greater than zero (site is above the 0.41 lb/ac/yr load limit), cell E29
will reflect the TP load reduction required for site compliance.
7. If cell E29 is greater than zero, proceed to Drainage Area tab.

Attachment 1
Virginia Runoff Reduction Method Compliance Spreadsheet April 2016
17
4.0 SITE TAB (RE-DEVELOPMENT)
The VSMP regulations refer to redevelopment as development on prior developed lands. In
accordance with 9VAC25-870-10:
"Prior developed lands" means land that has been previously utilized for residential, commercial,
industrial, institutional, recreation, transportation or utility facilities or structures, and that will
have the impervious areas associated with those uses altered during a land-disturbing activity.”
The water quality requirements for redevelopment (9VAC25-870-63 A 2) apply to those projects
where impervious areas, as part of the existing conditions, are altered during the course of
construction, as applicable to regulated land-disturbing activities.
The basic structure of the VRRM ReDevelopment Compliance Spreadsheet and the VRRM New
Development Compliance Spreadsheet are similar. One of the main differences between the two
spreadsheets is the computation of the site TP load reduction requirement on the Site tab, which
for redevelopment projects, other than linear projects, is influenced by whether or not there is an
increase in net impervious cover.
When there is no net increase in impervious cover from the predevelopment condition, the
post-development TP load must simply be reduced to below the predevelopment TP load by
either 10 or 20% depending on the total area of land disturbance in accordance with 9VAC25-
870-63 A 2 a and A 2 b.
When there is a net increase in impervious cover from the predevelopment condition: the
new net impervious area must meet the TP new development load limitation of 0.41 lb/ac/yr
in accordance with 9VAC25-870-63 A 2 c, and the post-development TP load for the
remaining area of the site must be reduced to below the predevelopment TP load of the same
area by either 10 or 20% depending on the total area of land disturbance (per 9VAC25-870-
63 A 2 a and A 2 b).
When the redevelopment project is a linear project, the post-development TP load must be
reduced to 20% below the predevelopment TP load irrespective of whether or not there has
been an increase in impervious cover as per 9VAC25-870-63 A 2 d.
It should be noted that impervious areas included within the site of a linear redevelopment
project must be undergoing alteration during the land disturbing activity as per the definition
of “prior developed lands” in (9VAC25-870-10) listed above.
Users should also note the definition of routine maintenance, which is not considered
redevelopment in § 62.1-44.15:34.C.7:
“Routine maintenance that is performed to maintain the original line and grade, hydraulic capacity, or
original construction of the project. The paving of an existing road with a compacted or impervious
surface and reestablishment of existing associated ditches and shoulders shall be deemed routine
maintenance if performed in accordance with this subsection;…”

Attachment 1
Virginia Runoff Reduction Method Compliance Spreadsheet April 2016
18
Compared to the New Development Site tab, the TP load computations for the ReDevelopment
Site tab require additional user inputs and result in a more complex look for the tab. The
ReDevelopment Site tab also has different cell references (locations of cells or cell ranges within
sheet tabs) for similar elements. This section highlights and describes the similarities and
differences for the two spreadsheets.
Once the load reduction requirement for the redevelopment site has been determined, the
procedures for using the spreadsheet (Drainage Area tabs, Water Quality Compliance tab,
Runoff Volume and CN tab, and Summary tab) are the same as those of for the New
Development Compliance Spreadsheet described in this document. Any Summary tab
dissimilarities reflect the distinct regulatory requirements and computations between new
development and redevelopment.
Summary o Any new net impervious areas must meet 0.41 lb TP/acre/year
o Total disturbed area < 1 acre, 10% TP load reduction required for remainder of site
o Total disturbed area ≥ 1 acre, 20% TP load reduction required for remainder of site o Linear projects, 20% TP load reduction required for site
Attachment 1
Virginia Runoff Reduction Method Compliance Spreadsheet April 2016
19
4.1. WHAT’S SIMILAR?
The land cover categories of Forest/Open Space, Managed Turf, and Impervious Cover and the
corresponding definitions are the same as those for the new development computations (see
Table 1 in Section 3.1).
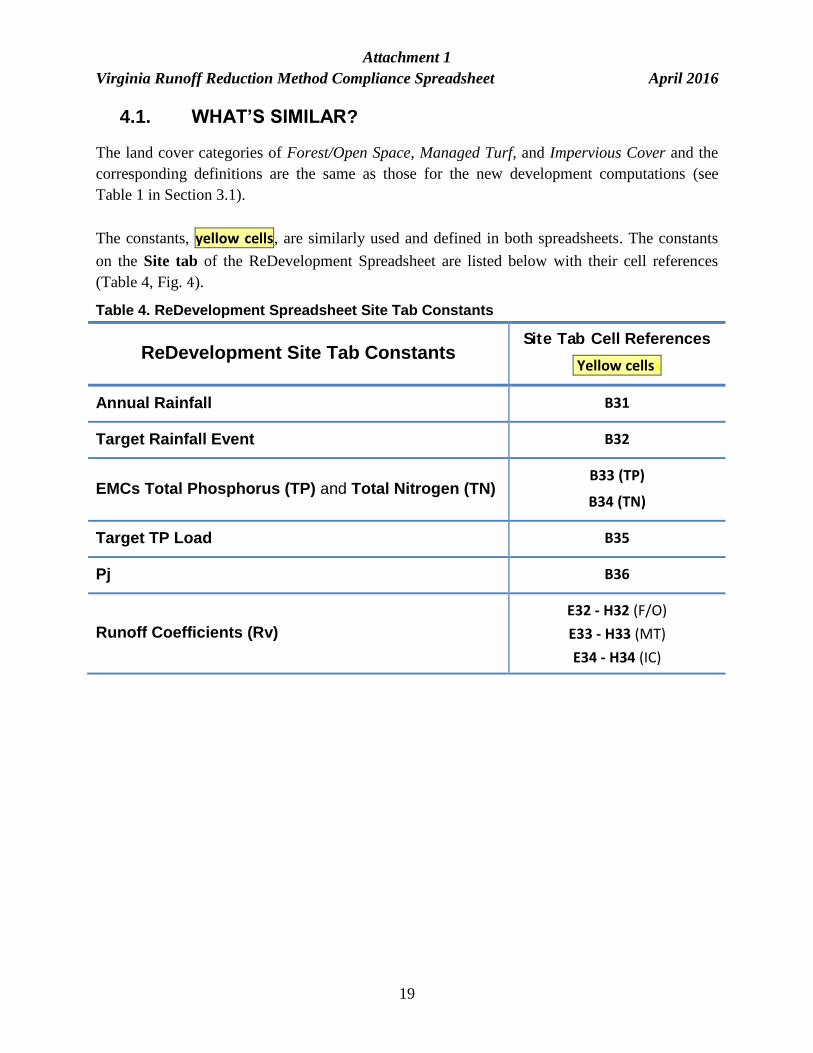
The constants, yellow cells, are similarly used and defined in both spreadsheets. The constants
on the Site tab of the ReDevelopment Spreadsheet are listed below with their cell references
(Table 4, Fig. 4).
Table 4. ReDevelopment Spreadsheet Site Tab Constants
ReDevelopment Site Tab Constants Site Tab Cell References
Yellow cellss
Annual Rainfall B31
Target Rainfall Event B32
EMCs Total Phosphorus (TP) and Total Nitrogen (TN) B33 (TP)
B34 (TN)
Target TP Load B35
Pj B36
Runoff Coefficients (Rv)
E32 - H32 (F/O)
E33 - H33 (MT)
E34 - H34 (IC)
Attachment 1
Virginia Runoff Reduction Method Compliance Spreadsheet April 2016
20
4.2. WHAT’S DIFFERENT?
4.2.1. SITE TAB (REDEVELOPMENT) – LAND COVER AREA INPUTS
Whereas the New Development Spreadsheet requires the user to input post-development land
cover areas, the ReDevelopment Spreadsheet requires the user to input existing (prior to
redevelopment) and post-development (following redevelopment) land cover areas as well as the
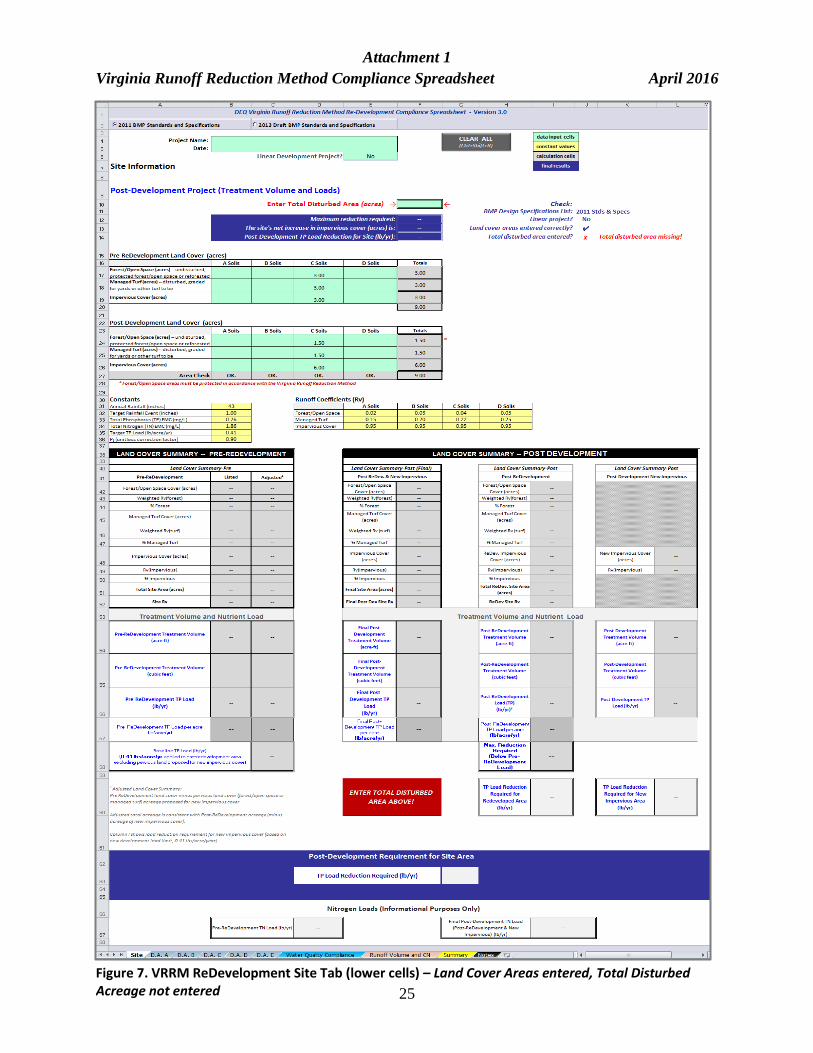
total disturbed area (Table 5). Consequently, area checks are included in the Site tab along with
an error notification summary in cells H10-K13 for Site tab user inputs that are missing or in
error. Furthermore, spreadsheet calculated results will not populate until all user errors are
reconciled (See Figs. 4 to 7).
As noted in Section 4.0, the redevelopment water quality criteria include a percent reduction
requirement (for existing site areas not replaced by new net impervious cover), which is
dependent on the total land disturbance acreage being either (i) less than, or (ii) greater than or
equal to one acre.
It is important for the user to understand that both spreadsheets (ReDevelopment and New
Development) use the site area for load calculations. In the case of redevelopment, the site area
may or may not be the same as the total disturbed area. For example, if post-development areas
are being preserved as Forest/Open Space, then the site area will necessarily be greater than the
disturbed acreage. The user should check with the VSMP authority for any applicable restrictions
that could limit available options.
A new feature included in the ReDevelopment Spreadsheet is the option to indicate a linear
development project by selecting “Yes” from the dropdown menu in row 6 of the Site tab. This
will set the TP percent load reduction requirement at 20% (final TP load must be at least 20%
below the pre-redevelopment TP load). (See Figs. 8 and Error! Reference source not found.).
A separate section for linear project water quality compliance results will appear in both the
Water Quality Compliance tab and the Summary tab when a linear project is indicated on the
Site tab (See related figures in Sections 6 and 8).
Attachment 1
Virginia Runoff Reduction Method Compliance Spreadsheet April 2016
21
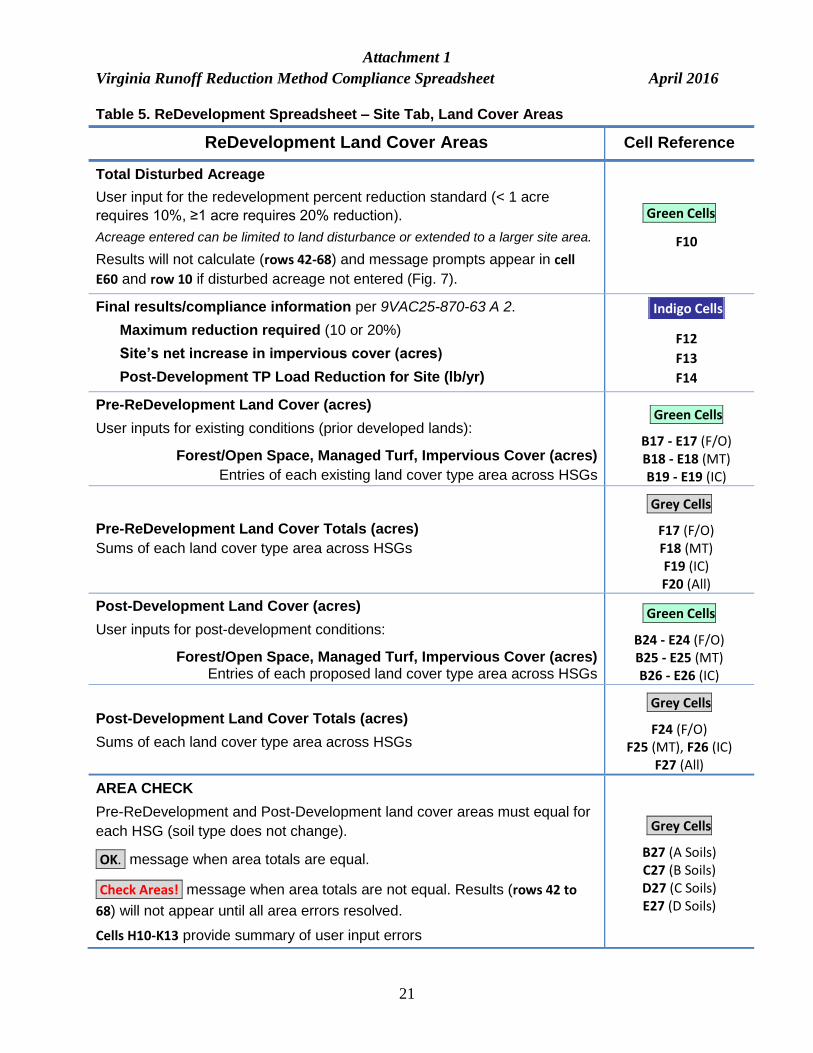
Table 5. ReDevelopment Spreadsheet – Site Tab, Land Cover Areas
ReDevelopment Land Cover Areas Cell Reference
Total Disturbed Acreage
User input for the redevelopment percent reduction standard (< 1 acre
requires 10%, ≥1 acre requires 20% reduction).
Acreage entered can be limited to land disturbance or extended to a larger site area.
Results will not calculate (rows 42-68) and message prompts appear in cell
E60 and row 10 if disturbed acreage not entered (Fig. 7).
Green Cells
F10
Final results/compliance information per 9VAC25-870-63 A 2.
Maximum reduction required (10 or 20%)
Site’s net increase in impervious cover (acres)
Post-Development TP Load Reduction for Site (lb/yr)
Indigo Cells
F12
F13
F14
Pre-ReDevelopment Land Cover (acres)
User inputs for existing conditions (prior developed lands):
Forest/Open Space, Managed Turf, Impervious Cover (acres)
Entries of each existing land cover type area across HSGs
Green Cells
B17 - E17 (F/O) B18 - E18 (MT) B19 - E19 (IC)
Pre-ReDevelopment Land Cover Totals (acres)
Sums of each land cover type area across HSGs
Grey Cells
F17 (F/O) F18 (MT) F19 (IC) F20 (All)
Post-Development Land Cover (acres)
User inputs for post-development conditions:
Forest/Open Space, Managed Turf, Impervious Cover (acres) Entries of each proposed land cover type area across HSGs
Green Cells
B24 - E24 (F/O) B25 - E25 (MT) B26 - E26 (IC)
Post-Development Land Cover Totals (acres)
Sums of each land cover type area across HSGs
Grey Cells
F24 (F/O) F25 (MT), F26 (IC)
F27 (All)
AREA CHECK
Pre-ReDevelopment and Post-Development land cover areas must equal for
each HSG (soil type does not change).
OK. message when area totals are equal.
Check Areas! message when area totals are not equal. Results (rows 42 to
68) will not appear until all area errors resolved.
Cells H10-K13 provide summary of user input errors
Grey Cells
B27 (A Soils) C27 (B Soils) D27 (C Soils) E27 (D Soils)

Attachment 1
Virginia Runoff Reduction Method Compliance Spreadsheet April 2016
22
BMP Design Specifications List selection
Co
nst
an
ts
Clears all user inputs
from all spreadsheets
Area Checks
Disturbed Area
Cell Color Scheme
Land Cover
Type and Soils
before
ReDevelopment
Land Cover Type
and Soils after
ReDevelopment
Use
r In
pu
ts
Figure 4. VRRM ReDevelopment Compliance Spreadsheet – Site Tab (upper cells)
Error check
for user inputs

Attachment 1
Virginia Runoff Reduction Method Compliance Spreadsheet April 2016
23
Figure 5. VRRM ReDevelopment Compliance Spreadsheet – Site Tab (lower cells) – Land Cover Areas and Total Disturbed Acreage not entered

Attachment 1
Virginia Runoff Reduction Method Compliance Spreadsheet April 2016
24
Figure 6. VRRM ReDevelopment Site Tab (lower cells) – Land Cover Areas and Total Disturbed Acreage entered
Site
tab
c
om
pu
tatio
ns
Site Load Reduction
Requirement
Pre-ReDevelopment
Land Cover Summary
Post-ReDevelopment
(not including
new net impervious) (Listed, Adjusted)
Post-Development
(new net impervious)
Post-Development Land Cover Summary
Post-ReDevelopment
& New Impervious
Attachment 1
Virginia Runoff Reduction Method Compliance Spreadsheet April 2016
25
Figure 7. VRRM ReDevelopment Site Tab (lower cells) – Land Cover Areas entered, Total Disturbed Acreage not entered

Attachment 1
Virginia Runoff Reduction Method Compliance Spreadsheet April 2016
26
Linear Project Load
Reduction Requirement
appears when user indicates
linear development project in
upper cells
Figure 8. VRRM ReDevelopment Site Tab (upper cells) – Linear Development Project selected
Linear Project selected
Figure 9. VRRM ReDevelopment Site Tab (lower cells) – Linear Development Project selected

Attachment 1
Virginia Runoff Reduction Method Compliance Spreadsheet April 2016
27
4.2.2. SITE TAB (REDEVELOPMENT) – LAND COVER SUMMARIES
The ReDevelopment Spreadsheet differs from the New Development Spreadsheet in that the
Land Cover Summaries (rows 38-58) are organized into land cover summary information for the
pre-redevelopment condition (Land Cover Summary-Pre) and the post-redevelopment condition
(Land Cover Summary-Post) (Figs. 6 and 7). In addition, both pre-redevelopment and post-
development are further subdivided as follows:
Land Cover Summary-Pre
Pre-ReDevelopment – Listed: Cells B42-B52 represent information derived directly from
the pre-redevelopment land cover areas entered in rows 17-19 (Table 6).
Pre-ReDevelopment – Adjusted: Cells C42-C52 reflect the pre-redevelopment land cover
areas entered in rows 17-19 after excluding pervious areas (Forest/Open Space and/or
Managed Turf) that will be converted to new net impervious cover (Table 7). If there is
no post-development increase in net impervious cover, then there is no adjustment to the
land cover areas entered by the user for pre-redevelopment, and the adjusted cells are the
same as the listed cells.
The Adjusted Pre-ReDevelopment data are needed to compute the site’s baseline TP load
(cell C58, based on 0.41 lb/acre/year applied to the pre-redevelopment area excluding
pervious land proposed for new impervious cover).
Land Cover Summary-Post
(Final) Post-ReDevelopment & New Impervious: Cells F42-F52 represent the entire post-
development site, which is the combination of the post-redevelopment land cover areas
and any new net impervious cover area (Table 8).
Post-ReDevelopment: Cells I42-I52 represent the post-development land cover areas
entered in rows 24-26 excluding any new net impervious cover area (Table 9).
Post-Development New Impervious: Cells L48-L49 represent the post-development new
net impervious cover (Table 10).
The Listed and Adjusted Pre-ReDevelopment computed site data in the Land Cover Summary-
Pre section of the Site tab is needed to facilitate the computation of distinct water quality criteria
applicable to different portions of the site in a single spreadsheet, without overlap.
Tables 6 to 10 list the computational areas of the ReDevelopment Site tab with cell references.
Brief descriptions are included where differences exist with the New Development Site tab.

Attachment 1
Virginia Runoff Reduction Method Compliance Spreadsheet April 2016
28
Table 6. Site Tab Computations for Land Cover Summary (Pre-ReDevelopment, Listed)
Site Tab Computations
Land Cover Summary – Pre ReDevelopment (Listed)
Cell Reference
Column B
The land cover summary for the existing conditions (prior developed lands):
Totals: Forest/Open Space, Managed Turf, Impervious Cover (acres) B42 (F/O) B45 (MT) B48 (IC)
Weighted Rv for Forest/Open, Managed Turf, Impervious Cover
B43 (F/O) B46 (MT) B49 (IC)
%Forest/Open, %Managed Turf, %Impervious Cover B44 (F/O) B47 (MT) B50 (IC)
Total Site Area (acres) B51
Site Rv B52
Treatment Volume B54 (acre-ft)
B55 (cf)
Pre-ReDevelopment TP Load
Site pre-redevelopment TP load computed using the Simple Method
based on the annual rainfall, and the TP EMC value (0.26 mg/L TP).
The lb/acre/yr TP loading rate is also included for comparison purposes.
B56 (lb/yr)
B57 (lb/acre/yr)
Attachment 1
Virginia Runoff Reduction Method Compliance Spreadsheet April 2016
29
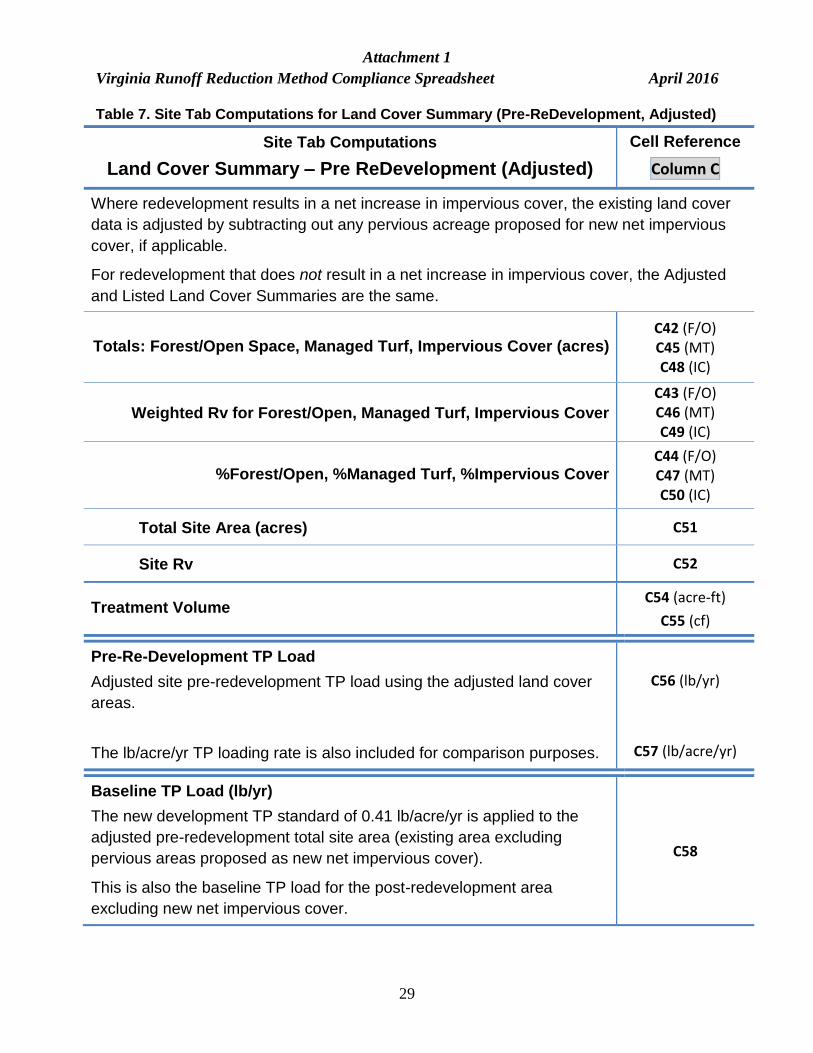
Table 7. Site Tab Computations for Land Cover Summary (Pre-ReDevelopment, Adjusted)
Site Tab Computations
Land Cover Summary – Pre ReDevelopment (Adjusted)
Cell Reference
Column C
Where redevelopment results in a net increase in impervious cover, the existing land cover
data is adjusted by subtracting out any pervious acreage proposed for new net impervious
cover, if applicable.
For redevelopment that does not result in a net increase in impervious cover, the Adjusted
and Listed Land Cover Summaries are the same.
Totals: Forest/Open Space, Managed Turf, Impervious Cover (acres) C42 (F/O) C45 (MT) C48 (IC)
Weighted Rv for Forest/Open, Managed Turf, Impervious Cover
C43 (F/O) C46 (MT) C49 (IC)
%Forest/Open, %Managed Turf, %Impervious Cover C44 (F/O) C47 (MT) C50 (IC)
Total Site Area (acres) C51
Site Rv C52
Treatment Volume C54 (acre-ft)
C55 (cf)
Pre-Re-Development TP Load
Adjusted site pre-redevelopment TP load using the adjusted land cover
areas.
The lb/acre/yr TP loading rate is also included for comparison purposes.
C56 (lb/yr)
C57 (lb/acre/yr)
Baseline TP Load (lb/yr)
The new development TP standard of 0.41 lb/acre/yr is applied to the
adjusted pre-redevelopment total site area (existing area excluding
pervious areas proposed as new net impervious cover).
This is also the baseline TP load for the post-redevelopment area
excluding new net impervious cover.
C58

Attachment 1
Virginia Runoff Reduction Method Compliance Spreadsheet April 2016
30
Table 8. Site Tab Computations for Land Cover Summary (Final Post-Development)
Site Tab Computations
Land Cover Summary – Post (Final)
Cell Reference
Column F
The final post development land cover summary represents the total site area (all land cover areas including new net impervious cover).
Totals: Forest/Open Space, Managed Turf, Impervious Cover (acres)
F42 (F/O) F45 (MT) F48 (IC)
Weighted Rv for Forest/Open, Managed Turf, Impervious Cover
F43 (F/O) F46 (MT) F49 (IC)
%Forest/Open, %Managed Turf, %Impervious Cover
F44 (F/O) F47 (MT) F50 (IC)
Final Site Area (acres) F51
Final Post Dev Site Rv F52
Final Post-Development Treatment Volume F54 (acre-ft)
F55 (cf)
Final Post-Development TP Load
Site post-redevelopment TP load (excluding new net impervious cover).
The TP loading rate (lb/acre/yr) is also included for comparison purposes.
F56 (lb/yr)
F57 (lb/acre/yr)

Attachment 1
Virginia Runoff Reduction Method Compliance Spreadsheet April 2016
31
Table 9. Site Tab Computations for Land Cover Summary (Post-ReDevelopment)
Site Tab Computations
Land Cover Summary – Post ReDevelopment
Cell Reference
Column I
The post-redevelopment land cover summary represents the land cover area entered by the user as post-redevelopment, not including new net impervious cover.
Totals: Forest/Open Space, Managed Turf, Impervious Cover (acres)
I42 (F/O) I45 (MT) I48 (IC)
Weighted Rv for Forest/Open, Managed Turf, Impervious Cover
I43 (F/O) I46 (MT) I49 (IC)
%Forest/Open, %Managed Turf, %Impervious Cover
I44 (F/O) I47 (MT) I50 (IC)
Total ReDev Site Area (acres) I51
ReDev Site Rv I52
Post-ReDevelopment Treatment Volume I54 (acre-ft)
I55 (cf)
Post-ReDevelopment TP Load
Site post-redevelopment TP load (excluding new net impervious cover).
The lb/acre/yr TP loading rate is also included for comparison purposes.
I56 (lb/yr)
I57 (lb/acre/yr)
Max. Reduction Required (Below Pre-ReDevelopment Load)
The applicable percent reduction standard (based on the Total Disturbed Acreage (cell F10) entered by the user).
I58
(10 or 20%)
TP Load Reduction Required for Redeveloped Area (lb/yr)
The TP load reduction requirement for the redeveloped area (proposed site not including new net impervious cover)
If the adjusted pre-redevelopment TP load after application of the required percent reduction is below the baseline load for the adjusted pre-redevelopment area, then:
- The required post-development load cannot be less than the baseline load unless a more stringent standard has been established by a local VSMP authority.
- A notification just below cell I60 will appear:
*Reduction below baseline TP Load (0.41 lb/acres) not required
I60
Equations
22a & 22b
Attachment 1
Virginia Runoff Reduction Method Compliance Spreadsheet April 2016
32
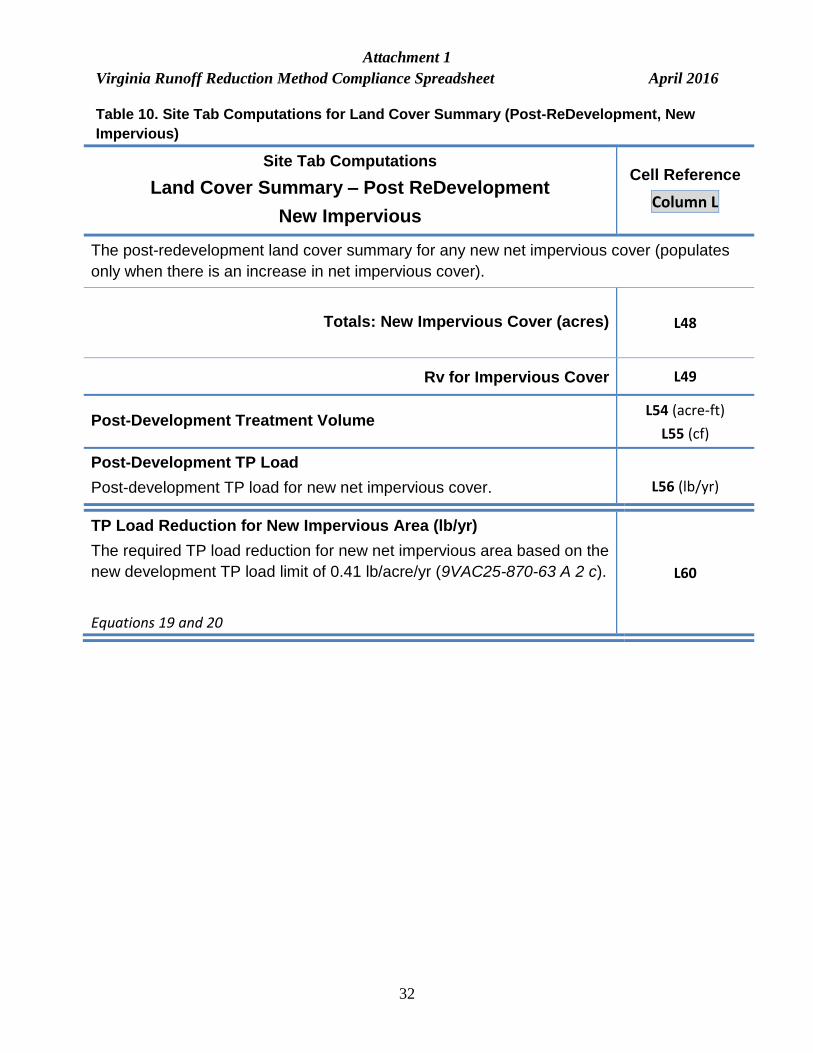
Table 10. Site Tab Computations for Land Cover Summary (Post-ReDevelopment, New
Impervious)
Site Tab Computations
Land Cover Summary – Post ReDevelopment
New Impervious
Cell Reference
Column L
The post-redevelopment land cover summary for any new net impervious cover (populates
only when there is an increase in net impervious cover).
Totals: New Impervious Cover (acres) L48
Rv for Impervious Cover L49
Post-Development Treatment Volume L54 (acre-ft)
L55 (cf)
Post-Development TP Load
Post-development TP load for new net impervious cover.
L56 (lb/yr)
TP Load Reduction for New Impervious Area (lb/yr)
The required TP load reduction for new net impervious area based on the
new development TP load limit of 0.41 lb/acre/yr (9VAC25-870-63 A 2 c).
Equations 19 and 20
L60

Attachment 1
Virginia Runoff Reduction Method Compliance Spreadsheet April 2016
33
4.2.3. SITE TAB (REDEVELOPMENT) – WATER QUALITY REQUIREMENTS
There are two water quality criteria for redevelopment projects under the VSMP regulations
(9VAC25-870-63 A 2 a to c). Compliance is achieved as follows:
For new net impervious cover (cell L60), the total phosphorus load must be
reduced to meet the new development criteria of 0.41 lb TP/acre/yr, and
For the remaining site area (not including any new net impervious cover), the total
phosphorus load must be reduced to either 10 or 20% below the pre-
redevelopment total phosphorus load, depending on the project’s total disturbed
acreage (cell I60). The reduction requirement is either:
— 10% if the total disturbed acreage is less than 1 acre, or
— 20% if the total disturbed acreage is greater than or equal to 1 acre.
— Both of these reduction requirements are limited in that a reduction to
below the applicable standard for new development (0.41 lb TP/acre/yr
cannot be required unless a more stringent standard is established by a
local VSMP authority) (9VAC25-870-63 A 2 e).
The ReDevelopment spreadsheet automatically calculates the required reductions as soon as the
total disturbed area and land cover areas are entered with no errors (See Table 11).
The rest of this section further explains and highlights the logic used for the redevelopment load
computations. The area and load equations (Eq. 19-23) and a decision flowchart for the
spreadsheet computations (Fig. 28) are provided in Section 9.4.
Attachment 1
Virginia Runoff Reduction Method Compliance Spreadsheet April 2016
34
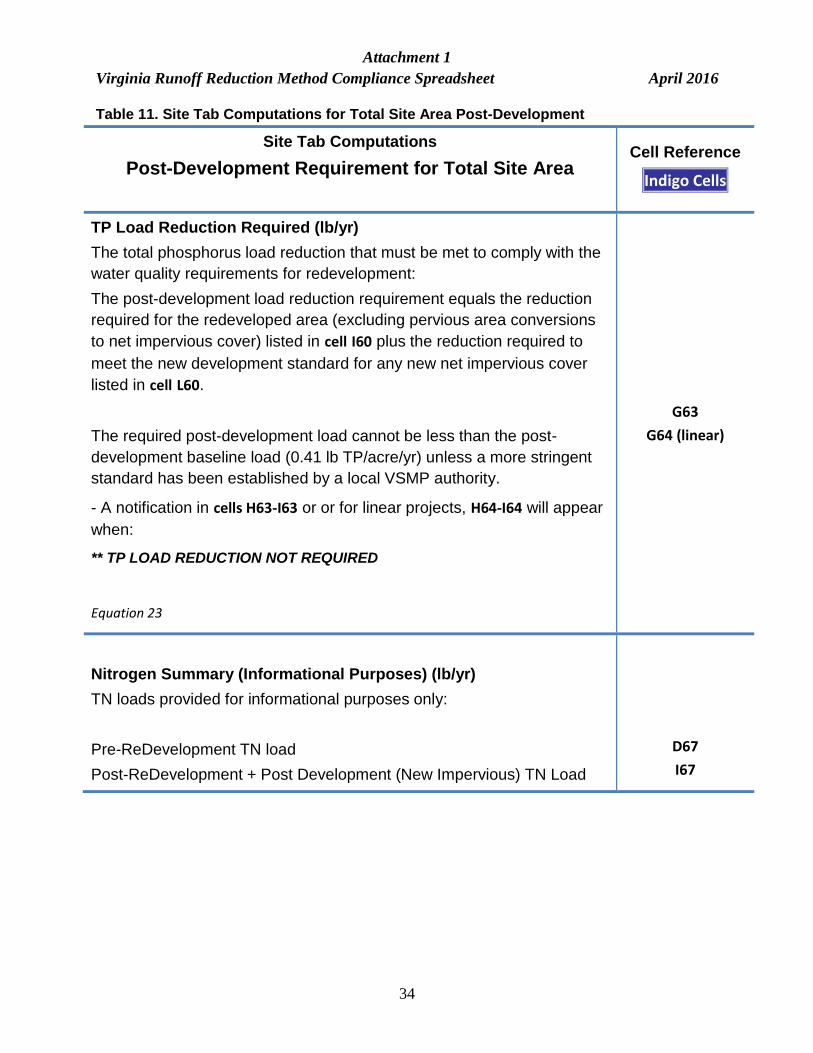
Table 11. Site Tab Computations for Total Site Area Post-Development
Site Tab Computations
Post-Development Requirement for Total Site Area
Cell Reference
Indigo Cells
TP Load Reduction Required (lb/yr)
The total phosphorus load reduction that must be met to comply with the
water quality requirements for redevelopment:
The post-development load reduction requirement equals the reduction
required for the redeveloped area (excluding pervious area conversions
to net impervious cover) listed in cell I60 plus the reduction required to
meet the new development standard for any new net impervious cover
listed in cell L60.
The required post-development load cannot be less than the post-
development baseline load (0.41 lb TP/acre/yr) unless a more stringent
standard has been established by a local VSMP authority.
- A notification in cells H63-I63 or or for linear projects, H64-I64 will appear
when:
** TP LOAD REDUCTION NOT REQUIRED
Equation 23
G63
G64 (linear)
Nitrogen Summary (Informational Purposes) (lb/yr)
TN loads provided for informational purposes only:
Pre-ReDevelopment TN load
Post-ReDevelopment + Post Development (New Impervious) TN Load
D67
I67

Attachment 1
Virginia Runoff Reduction Method Compliance Spreadsheet April 2016
35
In order to calculate the TP load requirement for the redevelopment project, it is necessary to
establish:
1) The increase in net impervious cover proposed (if applicable),
2) The pervious land cover areas (Forest/Open Space and/or Managed Turf) that will be
converted to new net impervious cover (if any), and as applicable,
3) The minimum regulatory (or baseline) TP load for the adjusted total site area (pre-
redevelopment site area not including pervious areas converted to impervious cover).
4) The least stringent TP load requirement for the post-redevelopment site area (not
including any new net impervious area, if applicable).
These three necessary steps for the computation of the TP load requirement are explained in
detail below:
1) The increase in net impervious cover proposed (if applicable) (cell L48) is determined in
order to apply the new development 0.41 lb/acre/yr TP load limitation to any new net
increases in impervious cover as per 9VAC25-870-63 A 2 c. (see also Eq. 19 in Section
9.4),
2) The pervious land cover areas (Forest/Open Space and/or Managed Turf) that will be
converted to new net impervious cover (if applicable) are determined for exclusion from
the pre-redevelopment TP load calculation (adjusted pre-redevelopment) to ensure that
both water quality criteria are not simultaneously applied to new net impervious cover
areas.
The net decrease in pervious land cover areas occurs as a result of the net increase in
impervious cover (Fig. 10). The total pre-redevelopment and post-development site
acreages (cell F20 and F27), which sum the user input pre- and post-redevelopment land
cover areas (rows 17-19 and 24-26, respectively), must be equal in order to enable the
spreadsheet computation of the appropriate load requirements.
Figure 10. User listed pre-redevelopment and post-development land cover areas.
Forest/Open Space
Managed Turf
Impervious Cover
Post-Development
Forest/Open Space
Managed Turf
Impervious Cover
Pre-ReDevelopment (Listed)

Attachment 1
Virginia Runoff Reduction Method Compliance Spreadsheet April 2016
36
The pervious areas that are converted to impervious cover are excluded from the adjusted
pre-redevelopment areas (cells C42 and C45) and the pre-redevelopment TP load (Fig.
11). The equation used to determine the net decrease in pervious areas (Eq. 21) and
decision flowchart (Fig. 28) for the spreadsheet computation are presented in Section
9.4.1.
3) The minimum regulatory (or baseline) TP load for the adjusted pre-redevelopment
area is the new development standard of 0.41 lb TP/acre/yr multiplied by the adjusted
total site acreage, cell C58. The adjusted pre-redevelopment area equals the post-
redevelopment area minus any new net impervious area, if applicable. This baseline TP
load is the most stringent load that can be required for water quality compliance of the
post-redevelopment area (not including any new net impervious area, if applicable).
4) The target TP load of the pre-redevelopment adjusted area (the TP load after 10 or 20%
reduction, i.e., 80 or 90% of the TP load for the pre-redevelopment adjusted area,
respectively), is compared to the baseline TP load, and the least stringent becomes the
required compliance load for the post-redevelopment area, not including any new net
impervious area, if applicable.
The regulations do not require a post-development TP load below the new development
standard of 0.41 lb TP/acre/yr for any part of the site, unless a more stringent standard
has been established by the VSMP authority.
TP Load Reduction Requirement
Adjusted Pre-
ReDevelopment Managed Turf
Adjusted Pre-ReDevelopment Impervious Cover
Adjusted Pre-ReDevelopment Forest/Open Space
New Net Impervious Cover:
cannot exceed 0.41 lb TP/acre/yr
New Net Impervious Cover: cannot exceed
0.41 lb TP/acre/yr
Impervious Cover
FO to new net post IC
Forest/Open Space
Managed Turf
MT to new net post IC
Pre-ReDevelopment - Listed to Adjusted
Adjusted
areas used to
calculate Pre-
ReDev.TP
load reduction
Figure 11. Pre-redevelopment land cover areas showing changes from Listed to Adjusted spreadsheet land cover areas and applicable TP load reduction requirements

Attachment 1
Virginia Runoff Reduction Method Compliance Spreadsheet April 2016
37
Example 1
Example 2
Two examples are graphically represented in Fig. 12 to illustrate when each of the two
different load reduction requirements apply. Both examples show TP loads for re-
development sites with more than one acre of disturbance. Example 1 in Fig. 12 shows a
site where the adjusted pre-redevelopment TP load reduced by 20% (orange, short-dashed
line) is the required post-development compliance load (with no net increases in
impervious cover). Example 2 in Fig. 12 shows a site where the new development criteria
of 0.41 lb TP/acre/yr (black, long-dashed line) applied to the pre-redevelopment adjusted
site area is the required post-development compliance load (with no net increases in
impervious cover). See also Eqns. 22a and 22b in Section 9.4.1.
Figure 12. Reduction requirements for redevelopment projects (no new net impervious cover)

Attachment 1
Virginia Runoff Reduction Method Compliance Spreadsheet April 2016
38
Using the VRRM spreadsheet (Re-Development Site tab)
RD1. Select either the 2011 or the Draft 2013 BMP Stds and Specs (row 2)
RD2. Enter Total Disturbed Acreage (cell F10)
RD3. Enter Pre-ReDevelopment land cover based on existing conditions (conditions at
time application submitted).
RD4. Enter Post-ReDevelopment Land Cover based on proposed conditions.
RD5. Any error notifications (cells H10-K13) or Check Areas! messages (row 27) must be
resolved before proceeding.
RD6. Take note of the Indigo Cells indicating maximum reduction required (cell F12), the
site’s net increase in impervious cover (cell F13), the post-development TP
reduction requirement in cell F14 and also G63 within the indigo results section
(rows 62-65).
a. As noted in Step 6 for New Development, the post-development TP
reduction requirement is a site-based water quality requirement and can
be met using various Drainage Area tab load reduction combinations.
b. Depending on the post-development and pre-redevelopment land cover
areas, TP load reduction within the Drainage Area tabs may or may not
be needed to meet water quality compliance requirements.
If the post-redevelopment TP load, cell I56, (which excludes new net
impervious cover) is less than the target pre-redevelopment TP load or the
TP baseline (see Equations 22a and 22b), then no further TP load
reduction is required for the redevelopment portion of the site, and:
i. A TP load credit will appear as a negative value in cell I60
(see Section 9.4 for more information)
ii. If sufficient, such load credit will be applied to offset TP reduction
requirements for any new net impervious cover (cell L60) which will
reduce the TP load reduction requirement for the total site (cell
G63).

Attachment 1
Virginia Runoff Reduction Method Compliance Spreadsheet April 2016
39
5.0 DRAINAGE AREA (D.A.) TABS
The VRRM spreadsheet contains five Drainage Area tabs (D.A. A to E) that allow the user to
enter land cover data (land cover type by HSGs) for separate Drainage Area tabs (D.A. tabs)
and to select stormwater BMPs for water quality compliance via runoff volume reduction,
pollutant removal, or both (Fig. 13). The D.A. tabs do not reference each other, but the
information and computations within each Drainage Area tab are combined in the Water
Quality Compliance tab, the Runoff Volume and CN tab, and the Summary tab.
Using the VRRM spreadsheet (Drainage Area tab)
8. Determine how many Drainage Area tabs are to be used to evaluate site water
quality compliance. Site compliance may be achieved within one drainage area,
a portion of a drainage area, or in multiple drainage areas (limited by the TP load
available per drainage area):
a. Each Drainage Area tab can reflect a site drainage area with a distinct
discharge point from the site, or
b. Similar BMP credit areas for the same type of practice(s) (areas of the site
draining to specific BMPs or BMP treatment trains) can be grouped
together on one Drainage Area tab even if they exist within different site
drainage areas as long as:
i. Treatment volumes for each individual BMP (TVBMP) are calculated
separately; and
ii. Any managed turf areas draining to separate BMPs within a
grouping must have the same runoff coefficient, i.e., different
managed turf areas must all have the same HSG configurations
(total areas per HSG) in order to be grouped together.
(only applied when managed turf areas are draining to more than
one practice in the grouping).
c. Nutrient removal within each Drainage Area tab is limited by the nutrient
available for removal within that Drainage Area tab (varies with load
generated for that Drainage Area tab, which is based on user inputs for
D.A. tab land cover types by HSGs). TP available for removal is computed
in cell M7 within each Drainage Area tab.
d. Discretion should be exercised if drainage areas or sub-drainage areas
with different flow path times of concentration (Tc) are grouped together in
a single D.A. tab.

Attachment 1
Virginia Runoff Reduction Method Compliance Spreadsheet April 2016
40
Figure 13. Drainage Area Tab (sections)
DA
Land Cover
Areas
RR
BM
Ps
No
n-R
R B
MPs
Runoff
Reduction
Credits
Pollutant
Removal
Credits
TP TN Clears BMP
credit areas
BMP Credit Areas Managed Turf: Column C
Impervious Cover: Column D
RR
BM
P
Su
mm
ary
D
A B
MP
Su
mm
ary
Drop-down menu with Downstream
Practices
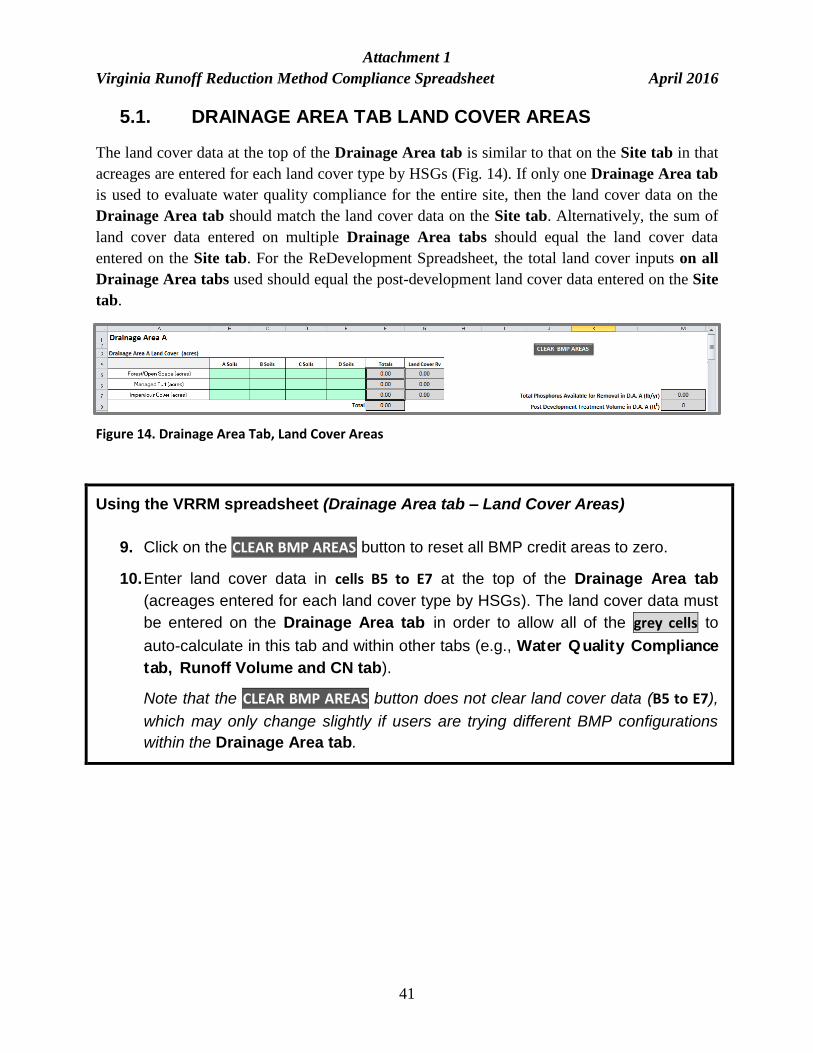
Attachment 1
Virginia Runoff Reduction Method Compliance Spreadsheet April 2016
41
5.1. DRAINAGE AREA TAB LAND COVER AREAS
The land cover data at the top of the Drainage Area tab is similar to that on the Site tab in that
acreages are entered for each land cover type by HSGs (Fig. 14). If only one Drainage Area tab
is used to evaluate water quality compliance for the entire site, then the land cover data on the
Drainage Area tab should match the land cover data on the Site tab. Alternatively, the sum of
land cover data entered on multiple Drainage Area tabs should equal the land cover data
entered on the Site tab. For the ReDevelopment Spreadsheet, the total land cover inputs on all
Drainage Area tabs used should equal the post-development land cover data entered on the Site
tab.
Using the VRRM spreadsheet (Drainage Area tab – Land Cover Areas)
9. Click on the CLEAR BMP AREAS button to reset all BMP credit areas to zero.
10. Enter land cover data in cells B5 to E7 at the top of the Drainage Area tab
(acreages entered for each land cover type by HSGs). The land cover data must
be entered on the Drainage Area tab in order to allow all of the grey cells to
auto-calculate in this tab and within other tabs (e.g., Water Quality Compliance
tab, Runoff Volume and CN tab).
Note that the CLEAR BMP AREAS button does not clear land cover data (B5 to E7),
which may only change slightly if users are trying different BMP configurations
within the Drainage Area tab.
Figure 14. Drainage Area Tab, Land Cover Areas
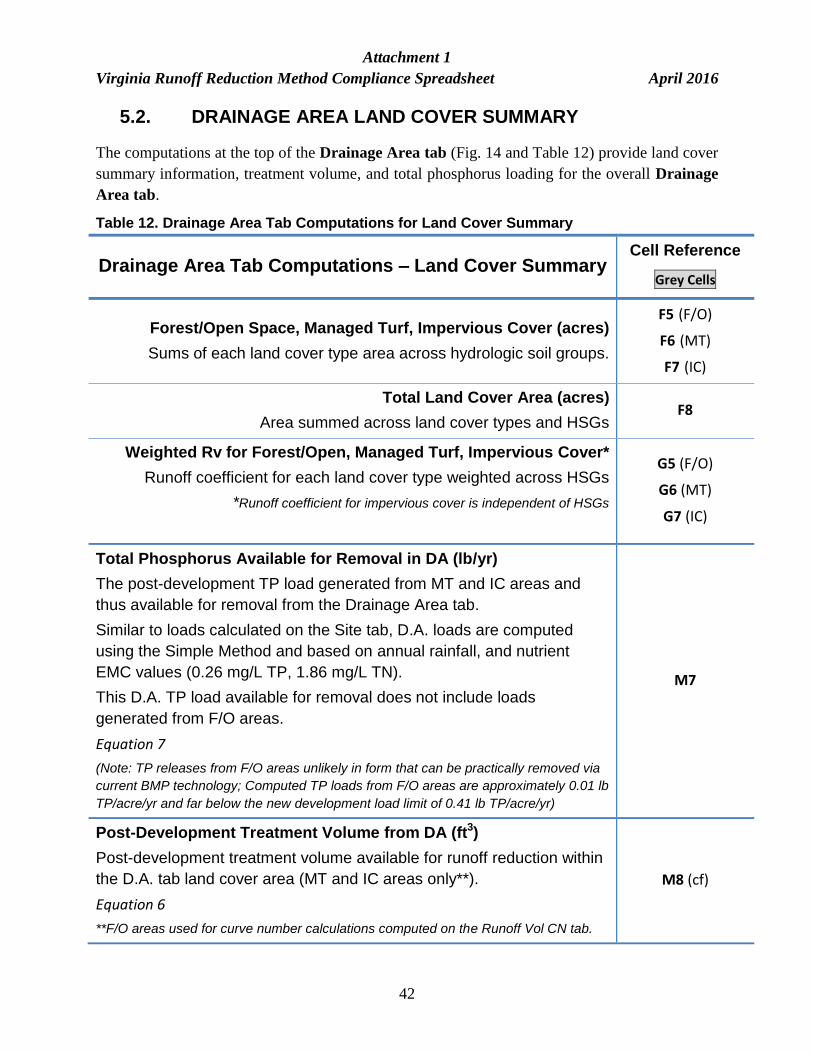
Attachment 1
Virginia Runoff Reduction Method Compliance Spreadsheet April 2016
42
5.2. DRAINAGE AREA LAND COVER SUMMARY
The computations at the top of the Drainage Area tab (Fig. 14 and Table 12) provide land cover
summary information, treatment volume, and total phosphorus loading for the overall Drainage
Area tab.
Table 12. Drainage Area Tab Computations for Land Cover Summary
Drainage Area Tab Computations – Land Cover Summary Cell Reference
Grey Cells
Forest/Open Space, Managed Turf, Impervious Cover (acres)
Sums of each land cover type area across hydrologic soil groups.
F5 (F/O)
F6 (MT)
F7 (IC)
Total Land Cover Area (acres)
Area summed across land cover types and HSGs F8
Weighted Rv for Forest/Open, Managed Turf, Impervious Cover*
Runoff coefficient for each land cover type weighted across HSGs
*Runoff coefficient for impervious cover is independent of HSGs
G5 (F/O)
G6 (MT)
G7 (IC)
Total Phosphorus Available for Removal in DA (lb/yr)
The post-development TP load generated from MT and IC areas and
thus available for removal from the Drainage Area tab.
Similar to loads calculated on the Site tab, D.A. loads are computed
using the Simple Method and based on annual rainfall, and nutrient
EMC values (0.26 mg/L TP, 1.86 mg/L TN).
This D.A. TP load available for removal does not include loads
generated from F/O areas.
Equation 7
(Note: TP releases from F/O areas unlikely in form that can be practically removed via
current BMP technology; Computed TP loads from F/O areas are approximately 0.01 lb
TP/acre/yr and far below the new development load limit of 0.41 lb TP/acre/yr)
M7
Post-Development Treatment Volume from DA (ft3)
Post-development treatment volume available for runoff reduction within
the D.A. tab land cover area (MT and IC areas only**).
Equation 6
**F/O areas used for curve number calculations computed on the Runoff Vol CN tab.
M8 (cf)

Attachment 1
Virginia Runoff Reduction Method Compliance Spreadsheet April 2016
43
5.3. DRAINAGE AREA TAB STORMWATER BMPS
Whereas environmental site design principles can be applied to a site, in terms of proposed land
cover types (i.e., maximizing forest/open space and permeable soils and minimizing managed
turf and impervious cover over impacted soils), often additional measures are required to meet
water quality site compliance. All or a portion of a site or site’s drainage area can be treated
using non-proprietary or proprietary stormwater management facilities approved by DEQ for use
in Virginia. Stormwater management facilities are also referred to as stormwater best
management practices (BMPs) and are listed along with their approved runoff removal credits,
treatment efficiencies and design specifications in the 2011 or Draft 2013 BMP Standards and
Specifications (see Section 1.0).
The approved BMPs are listed in two groups: I) Stormwater BMPs with Runoff Reduction (see
5.3.2, Table 13), and II) Stormwater BMPs with No Runoff Reduction (see 5.3.3, Table 14).
Group I practices are able to reduce the pollutant load through volume reduction of the site’s
runoff or site’s treatment volume and possibly also through a reduction of the runoff pollutant
concentration via non-volumetric pollutant removal treatment (e.g., settling or filtration). Group
II practices are limited to non-volumetric pollutant removal treatment for pollutant load
reductions. The BMPs are thus grouped to highlight those practices that provide runoff volume
reduction (first half) and those that do not. This grouping is used in the BMP list provided in
Tables 13 and 14, reflected in both VRRM spreadsheets.
5.3.1. BMP DESIGN LEVELS
Several of the BMPs can be constructed to two different design level standards, typically with
differing runoff removal credits and/or treatment removal efficiencies. The Level 1 and Level 2
design standards are included in the BMP design specifications and are individually indicated
after the BMP name where they apply as #1 (Level 1) and #2 (Level 2) in column A of the
Drainage Area tab. Each BMP’s approved runoff removal credit is listed in column B. The
approved treatment removal efficiencies are listed in column I (Total Phosphorus) and column Q
(Total Nitrogen).
It is important to review and understand the design criteria associated with the Level 1 and Level
2 designations. Whereas the Level 2 practices will generally provide greater load reductions,
they may also require a larger footprint, specific soil conditions, greater engineering effort, and
other factors for correct implementation. BMP selection and design guidance, including
designated Level 1 and Level 2 criteria, can be found in the BMP Standards and Specifications.

Attachment 1
Virginia Runoff Reduction Method Compliance Spreadsheet April 2016
44
5.3.2. RUNOFF REDUCTION BMPS
Table 13. Stormwater Best Management Practices – with Runoff Reduction
I. Stormwater BMPs with Runoff Reduction (Pollutant removal via runoff reduction w/wo non-volumetric treatment)
BMP Design Spec. (DA Tab Cell Ref.)
1. Vegetated Roof a. Vegetated Roof #1 b. Vegetated Roof #2
Spec. No. 5
(rows 13-14)
2. Rooftop Disconnection a. Simple Disconnection to A/B Soils b. Simple Disconnection to C/D Soils c. Alternative Practice Disconnection to C/D soils with Soil
Amended Filter Path d. Alternative Practice Disconnection to Dry Well/French Drain #1 e. Alternative Practice Disconnection to Dry Well/French Drain #2 f. Alternative Practice Disconnection to Rain Garden #1 g. Alternative Practice Disconnection to Rain Garden #2 h. Alternative Practice Disconnection to Rainwater Harvesting* i. Alternative Practice Disconnection to Stormwater Planter
Spec. No. 1
(rows 17-25)
3. Permeable pavement a. Permeable pavement #1 b. Permeable pavement #2
Spec. No. 7
(rows 28-29)
4. Grass channel a. Grass Channel A/B Soils b. Grass Channel C/D Soils c. Grass Channel with Compost Amended Soils
Spec. No. 3
(rows 32-34)
5. Dry swale a. Dry swale #1 b. Dry swale #2
Spec. No. 10
(rows 37-38)
6. Bioretention a. Bioretention #1 or Micro-Bioretention #1 or Urban Bioretention b. Bioretention #2 or Micro-Bioretention #2
Spec. No. 9
(rows 41-42)
7. Infiltration a. Infiltration #1 b. Infiltration #2
Spec. No. 8
(rows 45-46)
8. Extended detention pond a. ED #1 b. ED #2
Spec. No. 15
(rows 49-50)
9. Sheetflow to Filter/Open Space a. Sheetflow to Conservation Area with A/B Soils b. Sheetflow to Conservation Area with C/D Soils c. Sheetflow to Vegetated Filter Strip in A Soils or Compost
Amended B/C/D Soils (and Spec. No. 4)
Spec. No. 2
(rows 53-55)
* Rainwater Harvesting BMP (Spec.6) restricted to rooftop disconnection option (see 2h above & VRRM spreadsheets).
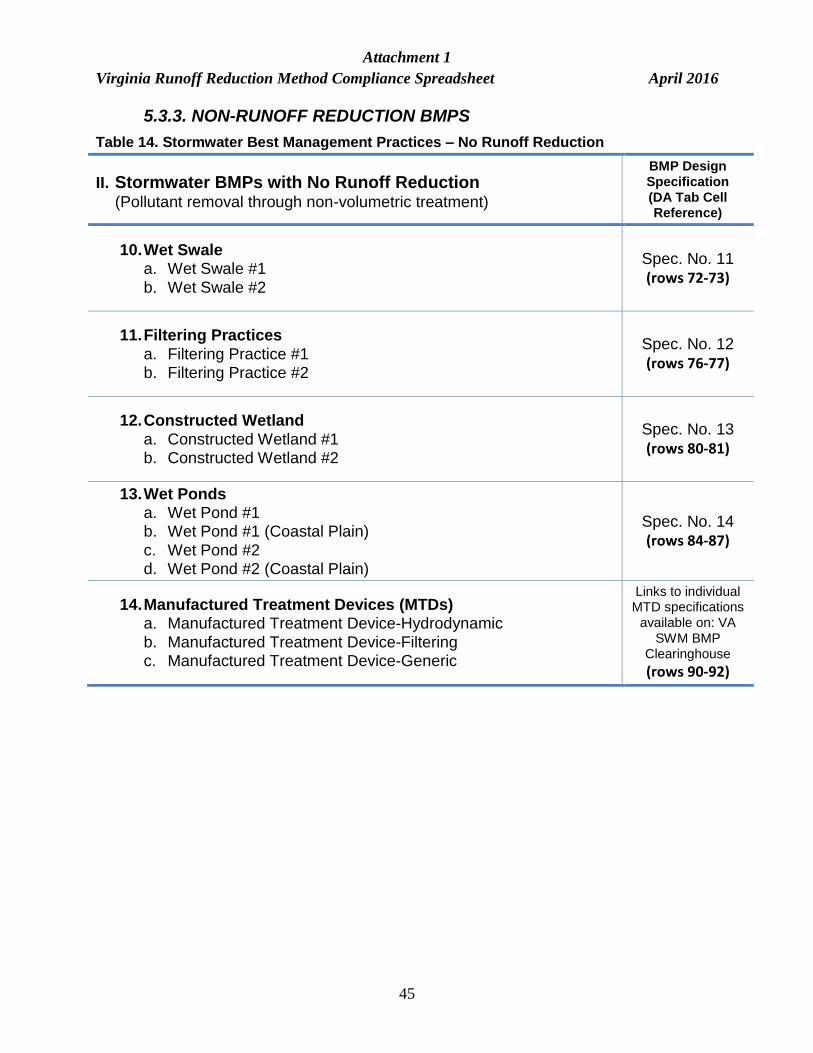
Attachment 1
Virginia Runoff Reduction Method Compliance Spreadsheet April 2016
45
5.3.3. NON-RUNOFF REDUCTION BMPS
Table 14. Stormwater Best Management Practices – No Runoff Reduction
II. Stormwater BMPs with No Runoff Reduction (Pollutant removal through non-volumetric treatment)
BMP Design
Specification
(DA Tab Cell Reference)
10. Wet Swale a. Wet Swale #1
b. Wet Swale #2
Spec. No. 11
(rows 72-73)
11. Filtering Practices
a. Filtering Practice #1 b. Filtering Practice #2
Spec. No. 12
(rows 76-77)
12. Constructed Wetland
a. Constructed Wetland #1 b. Constructed Wetland #2
Spec. No. 13
(rows 80-81)
13. Wet Ponds a. Wet Pond #1 b. Wet Pond #1 (Coastal Plain)
c. Wet Pond #2 d. Wet Pond #2 (Coastal Plain)
Spec. No. 14
(rows 84-87)
14. Manufactured Treatment Devices (MTDs) a. Manufactured Treatment Device-Hydrodynamic
b. Manufactured Treatment Device-Filtering c. Manufactured Treatment Device-Generic
Links to individual MTD specifications
available on: VA
SWM BMP
Clearinghouse
(rows 90-92)

Attachment 1
Virginia Runoff Reduction Method Compliance Spreadsheet April 2016
46
Using the VRRM spreadsheet (Drainage Area tab – BMP selection)
11. Select runoff reduction BMPs (top half of Drainage Area tab) and then, if
necessary, non-runoff reduction pollutant removal BMPs (bottom half of
Drainage Area tab), which can include proprietary BMPs listed as Manufactured
Treatment Devices.
Starting the BMP selection process with runoff reducing BMPs followed by non-runoff reducing
pollutant removal BMPs (and then utilizing a stepwise iterative process back to ESD principles) is
consistent with the VRRM.
12. Find the appropriate rows for the selected BMP(s) and enter the contributing
drainage areas in acres to each of the selected BMP(s) in the Credit Area cells
(column C for Managed Turf and column D for Impervious Cover). Impervious
Cover and Managed Turf areas must be entered separately for each BMP:
a. Forest/Open Space is not treated by BMPs in accordance with the VRRM,
but surface areas of certain BMPs can qualify as Forest/Open Space as
per the VRRM land cover type definitions (Table 1) and should be entered
accordingly in the Land Cover Area sections within both the Drainage
Area tab and the Site tab.
i. Natural undisturbed vegetated areas can be preserved and
protected for certain BMP installations in accordance with design
specifications (e.g., sheetflow to Forest/Open Space, BMP Design
Spec. 2); or
ii. Land cover conversions can be performed to transform areas to
one of the non-proprietary BMPs (e.g., buffer areas can be
reforested as conservation areas or vegetated filter strips, managed
turf can be transitioned to forest/open space via soil amendments
and natural vegetation; see VRRM Land Cover Definitions and
BMP Specifications for additional details).
iii. Increasing Forest/Open Space results in a reduction of generated
runoff volume and consequently nutrient load for the individual
Drainage Area tab(s) and Site tab.
Vegetated Roof, Rooftop Disconnection, and Permeable Pavement allow
credit area entries for only impervious areas.
b. Rooftop Disconnection to Rainwater Harvesting (2.h., Spec. No. 1)
requires the user to enter a runoff volume reduction credit (cell B24), which
is determined separately using the Cistern Design Spreadsheet (see

Attachment 1
Virginia Runoff Reduction Method Compliance Spreadsheet April 2016
47
Virginia Stormwater BMP Clearinghouse) or a similar method that
configures cistern sizing with water budget development.
c. Manufactured Treatment Devices (MTDs) (rows 90-92) require user entries
for phosphorus removal efficiencies. The efficiencies entered for specific
MTD(s) planned for use should match the DEQ approved efficiencies
published on the Virginia Stormwater BMP Clearinghouse website (under
Proprietary BMPs section):
13. If BMP’s are to be used in series (e.g., treatment trains):
a. The credit area draining directly to a BMP should be entered only once.
The next BMP in the treatment train is selected in the same row as the
previous receiving practice from the pull down menu of the Downstream
Practice (columns N-O).
A down arrow will appear at the bottom right of the cell Downstream
Practice to be Employed once that cell is selected. Clicking the arrow will
allow the user to scroll and select from the menu of practice options
applicable to the upstream BMP.
b. The previous step can be repeated if additional BMPs are used in the
treatment train.
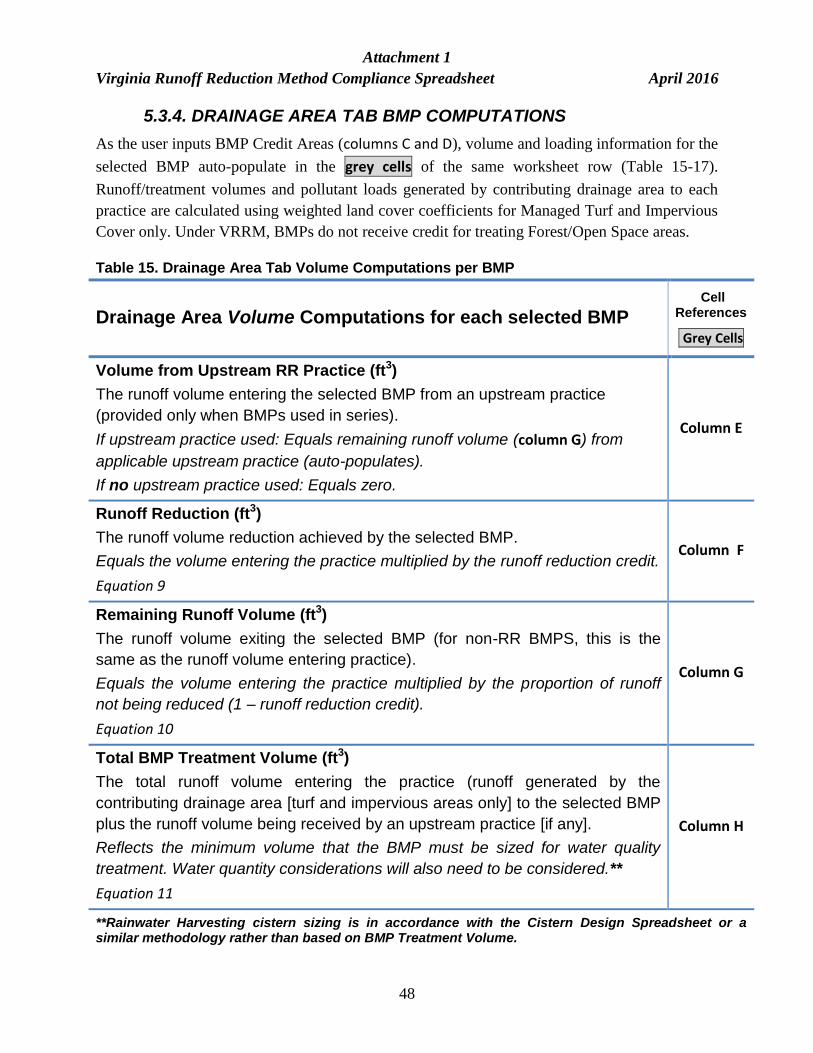
Attachment 1
Virginia Runoff Reduction Method Compliance Spreadsheet April 2016
48
5.3.4. DRAINAGE AREA TAB BMP COMPUTATIONS
As the user inputs BMP Credit Areas (columns C and D), volume and loading information for the
selected BMP auto-populate in the grey cells of the same worksheet row (Table 15-17).
Runoff/treatment volumes and pollutant loads generated by contributing drainage area to each
practice are calculated using weighted land cover coefficients for Managed Turf and Impervious
Cover only. Under VRRM, BMPs do not receive credit for treating Forest/Open Space areas.
Table 15. Drainage Area Tab Volume Computations per BMP
Drainage Area Volume Computations for each selected BMP Cell
References
Grey Cells
Volume from Upstream RR Practice (ft3)
The runoff volume entering the selected BMP from an upstream practice
(provided only when BMPs used in series).
If upstream practice used: Equals remaining runoff volume (column G) from
applicable upstream practice (auto-populates).
If no upstream practice used: Equals zero.
Column E
Runoff Reduction (ft3)
The runoff volume reduction achieved by the selected BMP.
Equals the volume entering the practice multiplied by the runoff reduction credit.
Equation 9
Column F
Remaining Runoff Volume (ft3)
The runoff volume exiting the selected BMP (for non-RR BMPS, this is the
same as the runoff volume entering practice).
Equals the volume entering the practice multiplied by the proportion of runoff
not being reduced (1 – runoff reduction credit).
Equation 10
Column G
Total BMP Treatment Volume (ft3)
The total runoff volume entering the practice (runoff generated by the
contributing drainage area [turf and impervious areas only] to the selected BMP
plus the runoff volume being received by an upstream practice [if any].
Reflects the minimum volume that the BMP must be sized for water quality
treatment. Water quantity considerations will also need to be considered.**
Equation 11
Column H
**Rainwater Harvesting cistern sizing is in accordance with the Cistern Design Spreadsheet or a similar methodology rather than based on BMP Treatment Volume.

Attachment 1
Virginia Runoff Reduction Method Compliance Spreadsheet April 2016
49
Table 16. Drainage Area Tab TP Load Computations per BMP
Drainage Area TP Load Computations for each selected BMP Cell
Reference
Phosphorus load from upstream practice(s) (lb)
The total phosphorus load entering the selected BMP from an upstream
practice (if BMPs used in series).
If upstream practice used: Equals remaining phosphorus load (column M)
from applicable upstream practice (auto-populates).
If no upstream practice used: Equals zero.
Column J
Untreated phosphorus load to practice (lb)
The total phosphorus load generated by the contributing drainage area (or
BMP credit area).
The load calculated using the Simple Method.
Equation 12
Column K
Phosphorus Removed By Practice (lb)
The total phosphorus load removed by the practice through any combination
of runoff reduction and pollutant (treatment) reduction applicable to the
selected BMP.
The TP removal treatment efficiency (column I) is used to compute the
proportion of phosphorus removed from the total phosphorus entering the
practice.
The TP entering the practice is the sum of both the phosphorus load
generated directly by the contributing drainage area (or BMP credit area) to
the practice (column K) and TP contributions (or remaining phosphorus load)
from any upstream practice(s) (column J).
Equation 13
Column L
Remaining Phosphorus Load (lb)
The total phosphorus load that exits the practice.
The total phosphorus load entering the practice (from column J and column K)
minus the total phosphorus load removed by the practice (from column L).
Equation 14
Column M

Attachment 1
Virginia Runoff Reduction Method Compliance Spreadsheet April 2016
50
Table 17. Drainage Area Tab TN Load Computations per BMP
Drainage Area TN Load Computations for each selected BMP Cell
Reference
Nitrogen load from upstream practice(s) (lb)
The total nitrogen load entering the selected BMP from an upstream practice
(if BMPs used in series).
If upstream practice used: Equals remaining nitrogen load (column U) from
applicable upstream practice (auto-populates).
If no upstream practice used: Equals zero.
Column R
Untreated nitrogen load to practice (lb)
The total nitrogen load generated by the contributing drainage area (or BMP
credit area).
The load is calculated using the Simple Method.
Equation 12
Column S
Nitrogen Removed By Practice (lb)
The total nitrogen load removed by the practice through any combination of
runoff reduction and pollutant (treatment) reduction applicable to the
selected BMP.
The TN removal treatment efficiency (column Q) is used to compute the
proportion of nitrogen removed from the total nitrogen entering the practice.
The TN entering the practice is the sum of both the nitrogen load generated
directly by the contributing drainage area (or BMP credit area) to the practice
(column S) and TN contributions (or remaining nitrogen load) from any
upstream practice(s) (column R).
Equation 13
Column T
Remaining Nitrogen Load (lb)
The total nitrogen load that exits the practice.
The total nitrogen load entering the practice (from column R and column S)
minus the total nitrogen load removed by the practice (from column T).
Equation 14
Column U

Attachment 1
Virginia Runoff Reduction Method Compliance Spreadsheet April 2016
51
5.3.5. DRAINAGE AREA TAB COMPUTATION SUMMARIES (RUNOFF REDUCTION BMPS AND ALL BMPS)
There are two locations within each Drainage Area tab where summary information on
treated areas and nutrient loads is provided: one summary for the Runoff Reduction (RR) BMPs
only (rows 57-67); and one general summary for all BMPs (rows 95-112). These summaries are
described in Tables 18 and 19 and shown in Figs. 15 and 16.
Table 18. Drainage Area Tab Runoff Reduction BMP Summary
Drainage Area Tab – Runoff Reduction (RR) BMP Summary Cell
Reference
Total Impervious Cover Treated (acres)
The total impervious areas in the D.A. tab included within all selected Runoff
Reduction (RR) BMP contributing areas (or BMP credit areas)
Area Check indicates (OK. or AREA EXCEEDED!) to notify if sum of all RR-
BMP impervious credit areas (F58) exceeds D.A. tab land cover inputs (F7)
F58
H58
Total Managed Turf Area Treated (acres)
The total managed turf areas in the D.A. tab included within all selected RR
BMP contributing areas (or BMP credit areas)
Area Check indicates (OK. or AREA EXCEEDED!) to notify if sum of all RR-
BMP turf credit areas (F59) exceeds D.A. tab land cover inputs (F6)
F59
H59
Total Runoff Reduction (ft3)
The total runoff reduction volume achieved within D.A. tab by all selected RR-
BMPs.
F60
Total Phosphorus Available for Removal (lb/yr)
The post-development total phosphorus load generated from MT and IC areas
and available for removal within D.A. tab.
Repeated from cell M7 and explained in more detail in Section 5.2.
I62
Total Phosphorus Removed With Runoff Reduction Practices (lb/yr)
The total phosphorus load removed through RR BMPs within D.A. tab. I63
Total Phosphorus Remaining After Applying Runoff Reduction Practices
(lb/yr)
The total phosphorus load that still remains after user selection and application
of RR BMPs in D.A. tab.
I64
Nitrogen Summary for Runoff Reduction in D.A. Tab
Total Runoff Reduction in D.A. (ft3) (from F60)
Nitrogen Removed With Runoff Reduction Practices (lb/yr)
(similar to TP removed with RR-BMPs above)
V63
V64
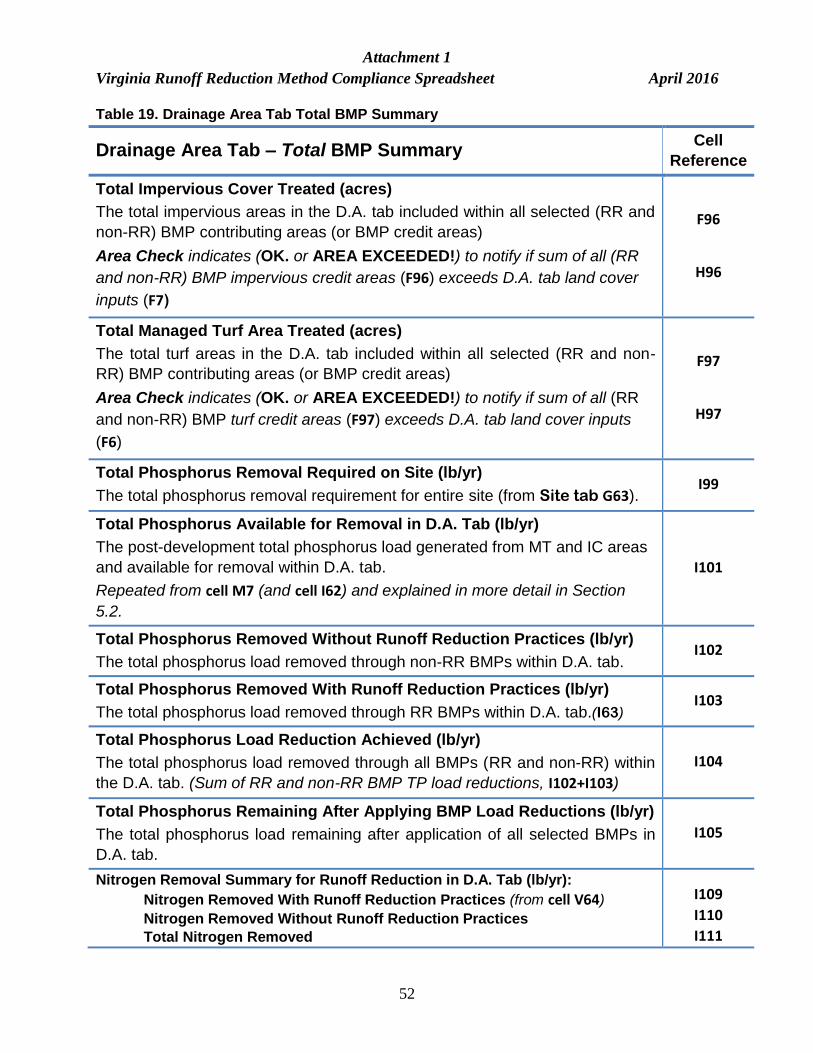
Attachment 1
Virginia Runoff Reduction Method Compliance Spreadsheet April 2016
52
Table 19. Drainage Area Tab Total BMP Summary
Drainage Area Tab – Total BMP Summary Cell
Reference
Total Impervious Cover Treated (acres)
The total impervious areas in the D.A. tab included within all selected (RR and
non-RR) BMP contributing areas (or BMP credit areas)
Area Check indicates (OK. or AREA EXCEEDED!) to notify if sum of all (RR
and non-RR) BMP impervious credit areas (F96) exceeds D.A. tab land cover
inputs (F7)
F96
H96
Total Managed Turf Area Treated (acres)
The total turf areas in the D.A. tab included within all selected (RR and non-
RR) BMP contributing areas (or BMP credit areas)
Area Check indicates (OK. or AREA EXCEEDED!) to notify if sum of all (RR
and non-RR) BMP turf credit areas (F97) exceeds D.A. tab land cover inputs
(F6)
F97
H97
Total Phosphorus Removal Required on Site (lb/yr)
The total phosphorus removal requirement for entire site (from Site tab G63). I99
Total Phosphorus Available for Removal in D.A. Tab (lb/yr)
The post-development total phosphorus load generated from MT and IC areas
and available for removal within D.A. tab.
Repeated from cell M7 (and cell I62) and explained in more detail in Section
5.2.
I101
Total Phosphorus Removed Without Runoff Reduction Practices (lb/yr)
The total phosphorus load removed through non-RR BMPs within D.A. tab. I102
Total Phosphorus Removed With Runoff Reduction Practices (lb/yr)
The total phosphorus load removed through RR BMPs within D.A. tab.(I63) I103
Total Phosphorus Load Reduction Achieved (lb/yr)
The total phosphorus load removed through all BMPs (RR and non-RR) within
the D.A. tab. (Sum of RR and non-RR BMP TP load reductions, I102+I103)
I104
Total Phosphorus Remaining After Applying BMP Load Reductions (lb/yr)
The total phosphorus load remaining after application of all selected BMPs in
D.A. tab.
I105
Nitrogen Removal Summary for Runoff Reduction in D.A. Tab (lb/yr):
Nitrogen Removed With Runoff Reduction Practices (from cell V64)
Nitrogen Removed Without Runoff Reduction Practices
Total Nitrogen Removed
I109
I110
I111

Attachment 1
Virginia Runoff Reduction Method Compliance Spreadsheet April 2016
53
Figure 16. Drainage Area Tab, BMP Summary (All BMPs)
Figure 15. Drainage Area Tab, RR BMP Summary
Using the VRRM spreadsheet (Drainage Area tab – Summary sections)
1. Check the Drainage Area tab summaries for performance of Runoff Reduction
BMPs (rows 57-67), and for performance of all BMPs combined (non-RR BMPs
and RR BMPS), (rows 95-105). Summary information here includes runoff volume
reductions achieved, TP load reductions achieved and TP remaining. Drainage
Area tab area checks should also be reviewed in both summary locations to
ensure BMP credit areas do not exceed Drainage Area tab land cover type
totals (cells F6 and F7). See summary tables above for additional details.
Similar summaries are also provided for Total Nitrogen loading (cells V63-V64 for
RR-BMPs and cells I109-I111 for all BMPs).
2. If other Drainage Area tabs are used, repeat steps 9 through 14 for each
Drainage Area tab.
3. Proceed to the Water Quality Compliance tab for additional area checks and to
verify compliance with water quality requirements for entire site.

Attachment 1
Virginia Runoff Reduction Method Compliance Spreadsheet April 2016
54
6.0 WATER QUALITY COMPLIANCE TAB
The Water Quality Compliance tab provides the user with water quality site results and area
checks drawn from user inputs on the Site tab and Drainage Area tabs. The information is
presented in four sections: Area Checks (rows 3-8), Runoff Reduction Volume and TP (and TN)
by Drainage Area (rows 10-19), Total Phosphorus (rows 22-26), and Total Nitrogen (rows 25-
28). These main sections are described along with the related user instructions in the following
tables (Tables 29-31).
Table 20. Water Quality Compliance Tab Site Results (Areas and Checks)
Site Results (Water Quality Compliance), Area Checks Cell Reference
Forest/Open Space (acres)
Forest/Open spaceareas totaled across HSGs for each Drainage Area tab
C3-G3
D.A. Tab F5
Impervious Cover (acres)
Impervious cover areas totaled across HSGs for each Drainage Area tab
C4-G4
D.A. Tab F7
Impervious Cover Treated (acres)
Total treated impervious cover (BMP Credit Areas) for each Drainage Area tab
C5-G5
D.A. Tab F96
Managed Turf Area (acres)
Turf cover areas totaled across HSGs for each Drainage Area tab
C6-G6
D.A. Tab F6
Managed Turf Area Treated (acres)
Total treated turf cover (BMP Credit Areas) for each Drainage Area tab
C7-G7
D.A. Tab F97
Area Check per D.A. Tabs
Checks to ensure treated impervious cover and managed turf areas do not exceed available impervious cover and managed turf areas, respectively, within each Drainage Area tab.
Indicates (OK. or AREA EXCEEDED!)
C8-G8
Area Check for Impervious Cover and Managed Turf
Checks to ensure impervious cover and managed turf areas totaled across Drainage Area tabs do not exceed impervious cover and managed turf
areas entered on Site tab.
Indicates (OK. or AREA EXCEEDED!)
H3 (FO)
H4 (IC)
H6 (MT)
Area Check for Treated Impervious Cover and Treated Managed Turf
Checks to ensure treated impervious cover and treated managed turf areas totaled across Drainage Area tabs do not exceed available impervious cover and managed turf areas totaled across Drainage Area tabs.
Indicates (OK. or AREA EXCEEDED!)
H5 (IC)
H7 (MT)
Site Treatment Volume (ft3)
Total Treatment Volume for the post-development site area C10
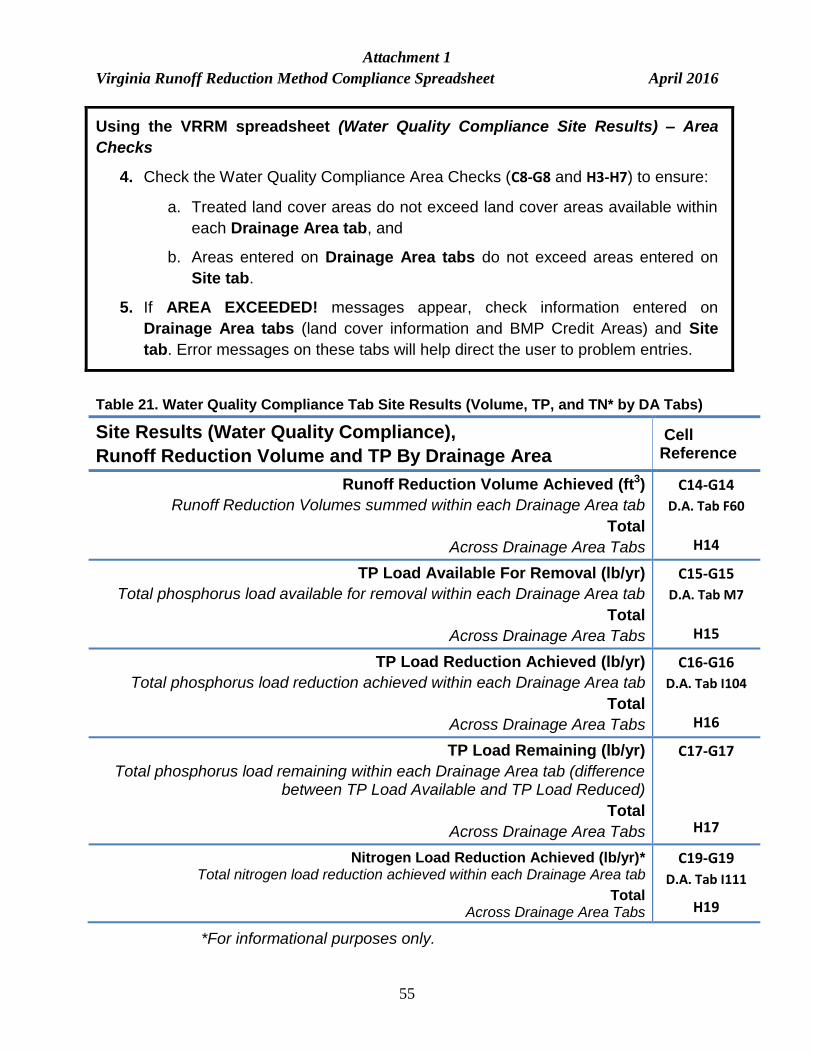
Attachment 1
Virginia Runoff Reduction Method Compliance Spreadsheet April 2016
55
Table 21. Water Quality Compliance Tab Site Results (Volume, TP, and TN* by DA Tabs)
Site Results (Water Quality Compliance),
Runoff Reduction Volume and TP By Drainage Area
Cell Reference
Runoff Reduction Volume Achieved (ft3)
Runoff Reduction Volumes summed within each Drainage Area tab
Total
Across Drainage Area Tabs
C14-G14
D.A. Tab F60
H14
TP Load Available For Removal (lb/yr)
Total phosphorus load available for removal within each Drainage Area tab
Total
Across Drainage Area Tabs
C15-G15
D.A. Tab M7
H15
TP Load Reduction Achieved (lb/yr)
Total phosphorus load reduction achieved within each Drainage Area tab
Total
Across Drainage Area Tabs
C16-G16
D.A. Tab I104
H16
TP Load Remaining (lb/yr)
Total phosphorus load remaining within each Drainage Area tab (difference between TP Load Available and TP Load Reduced)
Total
Across Drainage Area Tabs
C17-G17
H17
Nitrogen Load Reduction Achieved (lb/yr)* Total nitrogen load reduction achieved within each Drainage Area tab
Total Across Drainage Area Tabs
C19-G19
D.A. Tab I111
H19
Using the VRRM spreadsheet (Water Quality Compliance Site Results) – Area
Checks
4. Check the Water Quality Compliance Area Checks (C8-G8 and H3-H7) to ensure:
a. Treated land cover areas do not exceed land cover areas available within
each Drainage Area tab, and
b. Areas entered on Drainage Area tabs do not exceed areas entered on
Site tab.
5. If AREA EXCEEDED! messages appear, check information entered on
Drainage Area tabs (land cover information and BMP Credit Areas) and Site
tab. Error messages on these tabs will help direct the user to problem entries.
*For informational purposes only.

Attachment 1
Virginia Runoff Reduction Method Compliance Spreadsheet April 2016
56
Table 22. Water Quality Compliance Tab Site Results (Total Phosphorus, Total Nitrogen)
*For informational purposes only
Site Results (Water Quality Compliance),
Total Phosphorus
Cell
Reference
Final Post-Development TP Load (lb/yr)
Total phosphorus load reduction achieved across all Drainage Area tabs C22
TP Load Reduction Required (lb/yr)
Total phosphorus load reduction required for site compliance (based on 0.41
lb TP/acre/yr new development load limitation)
C23
TP Load Reduction Achieved (lb/yr)
Total phosphorus load reduction achieved across all Drainage Area tabs C24
TP Load Remaining (lb/yr)
Total phosphorus load reduction achieved across all Drainage Area tabs C25
Remaining TP Load Reduction Required (lb/yr)
Phosphorus load reduction that is still required for site compliance (difference
between TP required and TP achieved).
C27 Indicates:
**No further TP load reduction required
if TP load reduction achieved on site equals compliance requirements
or
TARGET TP REDUCTION EXCEEDED BY __ LB/YEAR**
if TP load reduction achieved on site exceeds compliance requirements.
C26
Total Nitrogen (lb/yr)*
Total nitrogen summary for entire site includes:
Post-Development Load
Nitrogen Load Reduction Achieved
Remaining Post-Development Nitrogen Load
C29
C30
C31

Attachment 1
Virginia Runoff Reduction Method Compliance Spreadsheet April 2016
57
Using the VRRM spreadsheet (Site Results Water Quality Compliance)
– Runoff Reduction Volume and TP By Drainage Area
6. Check to see if water quality compliance has been achieved on the site by going
to the Remaining TP Load Reduction Required result in cell C26:
a. If the result indicates anything greater than zero lb/yr, then the user must
continue to reduce the TP load by the amount indicated in cell C26 (which
is the difference between the site based TP load reduction required in C23
and the reduction which is so far achieved in cell C24):
i. Check the runoff reduction volumes and total phosphorus loadings
(cells C14-H17) for where additional opportunities to reduce the TP
load may be found and optimized.
ii. Return to Site tab and Drainage Area tabs to possibly reconfigure
the site layout and/or revise the on-site BMP strategy (change BMP
credit areas and/or BMP selections).
b. If the result indicates that either:
No further TP reduction required
OR
TARGET TP REQUIRED EXCEED BY __ LB/YR,
then the user can proceed with the proposed site layout and selected
BMPs per Drainage Area tab to begin the site design.
7. If information on nitrogen loads is desired, check the Total Nitrogen sections
(cells C19-H19 and C29-C31).
8. Proceed to the Runoff Volume and CN tab if the spreadsheet results for runoff
(watershed-inches) and/or curve number adjustments will be used in subsequent
water quantity calculations.
9. Proceed to the Summary tab to view and print a VRRM Spreadsheet
Compliance Report.

Attachment 1
Virginia Runoff Reduction Method Compliance Spreadsheet April 2016
58
The layout of the Water Quality Compliance tab for the ReDevelopment spreadsheet differs
from New Development spreadsheet only with respect to the inclusion of a TP load results
section for linear projects in cells E21-I27 as shown in Figure 17 below.
Figure 17. Water Quality Compliance Tab, ReDevelopment spreadsheet with linear project results section
Linear Project TP load results
appears when user indicates
linear development project in
Site tab.
Attachment 1
Virginia Runoff Reduction Method Compliance Spreadsheet April 2016
59
7.0 RUNOFF VOLUME AND CN TAB
The Runoff Volume and CN tab calculates the runoff volume reduction benefit in terms that
can be applied to the water quantity control requirements of the VSMP regulations (Channel
protection and Flood protection, 9VAC25-870-66).
When designed to manage the water quality target rainfall event (one-inch of rainfall), the
volume reduction achieved by the runoff reduction practices will provide some degree of benefit
or credit when complying with any of these water quantity control requirements. This volume
credit is applied in the form of a curve number reduction based on the Natural Resource
Conservation Service (NRCS) runoff equations provided in Urban Hydrology for Small
Watersheds: TR-55 (NRCS 1986).
It is important to understand that the Runoff Volume and CN tab results do not indicate
whether or not water quantity compliance has been achieved. Further computations and/or
analyses are required for this determination. The user should carefully review the water quantity
control regulations (9VAC25-870-66) to ensure understanding of compliance requirements.
It is also important to note that the spreadsheet calculates the volume reduction credit assuming
that each BMP is designed and sized according to the minimum requirements of the BMP Design
Specifications. If the user has oversized a practice, the spreadsheet will not reflect additional
volume reduction credit for channel and flood protection (see Section 7.3). Routing of BMPs can
be a complex task given all the hydrologic and hydraulic variables associated with volume
storage and reduction, and would need to be performed outside of the spreadsheet.
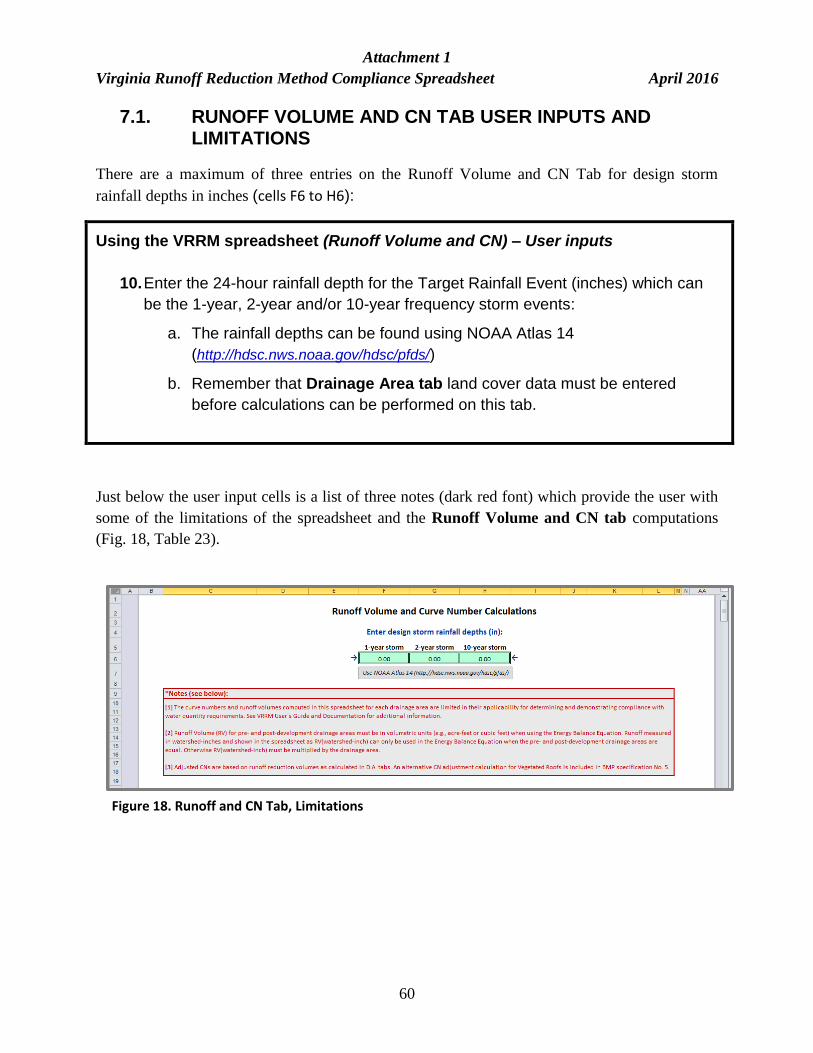
Attachment 1
Virginia Runoff Reduction Method Compliance Spreadsheet April 2016
60
7.1. RUNOFF VOLUME AND CN TAB USER INPUTS AND LIMITATIONS
There are a maximum of three entries on the Runoff Volume and CN Tab for design storm
rainfall depths in inches (cells F6 to H6):
Just below the user input cells is a list of three notes (dark red font) which provide the user with
some of the limitations of the spreadsheet and the Runoff Volume and CN tab computations
(Fig. 18, Table 23).
Using the VRRM spreadsheet (Runoff Volume and CN) – User inputs
10. Enter the 24-hour rainfall depth for the Target Rainfall Event (inches) which can
be the 1-year, 2-year and/or 10-year frequency storm events:
a. The rainfall depths can be found using NOAA Atlas 14
(http://hdsc.nws.noaa.gov/hdsc/pfds/)
b. Remember that Drainage Area tab land cover data must be entered
before calculations can be performed on this tab.
Figure 18. Runoff and CN Tab, Limitations

Attachment 1
Virginia Runoff Reduction Method Compliance Spreadsheet April 2016
61
Table 23. Runoff Volume and CN Tab Limitations
Runoff Volume and CN (Limitations) Cell
Reference
[1] The curve numbers and runoff volumes computed in this spreadsheet for
each drainage area are limited in their applicability for determining and
demonstrating compliance with water quantity requirements. See VRRM User's
Guide and Documentation for additional information.
This note is to inform the user that sites that have more than one drainage area
converging to a common point of analysis is too complex of a drainage network for
this tab to calculate CN values and runoff depths correctly. Hydrologic modeling is
recommended for these and other types of complex configurations.
C10-L12
[2] Runoff Volume (RV) for pre- and post-development drainage areas must be
in volumetric units (e.g., acre-feet or cubic feet) when using the Energy
Balance Equation. Runoff measured in watershed-inches and shown in the
spreadsheet as RV (watershed-inch) can only be used in the Energy Balance
Equation when the pre- and post-development drainage areas are equal.
Otherwise RV (watershed-inch) must be multiplied by the drainage area.
The Runoff Volume (RV) provided in watershed inches is actually a depth
measurement and not volume. When comparing forested, pre-, and post-
development drainage area volumes for energy balance calculations, the volume
units must be in acre-feet or cubic feet unless the drainage areas are the same.
C13-L16
[3] Adjusted CNs are based on runoff reduction volumes as calculated in D.A.
tabs. An alternative CN adjustment calculation for Vegetated Roofs is included
in BMP specification No. 5.
The runoff reduction volumes calculated in the D.A. tabs are used for CN
adjustments. The vegetated roof practice allows a pre-determined curve number
adjustment that is listed in Table 5.1 of Specification No. 5.
C17-L18
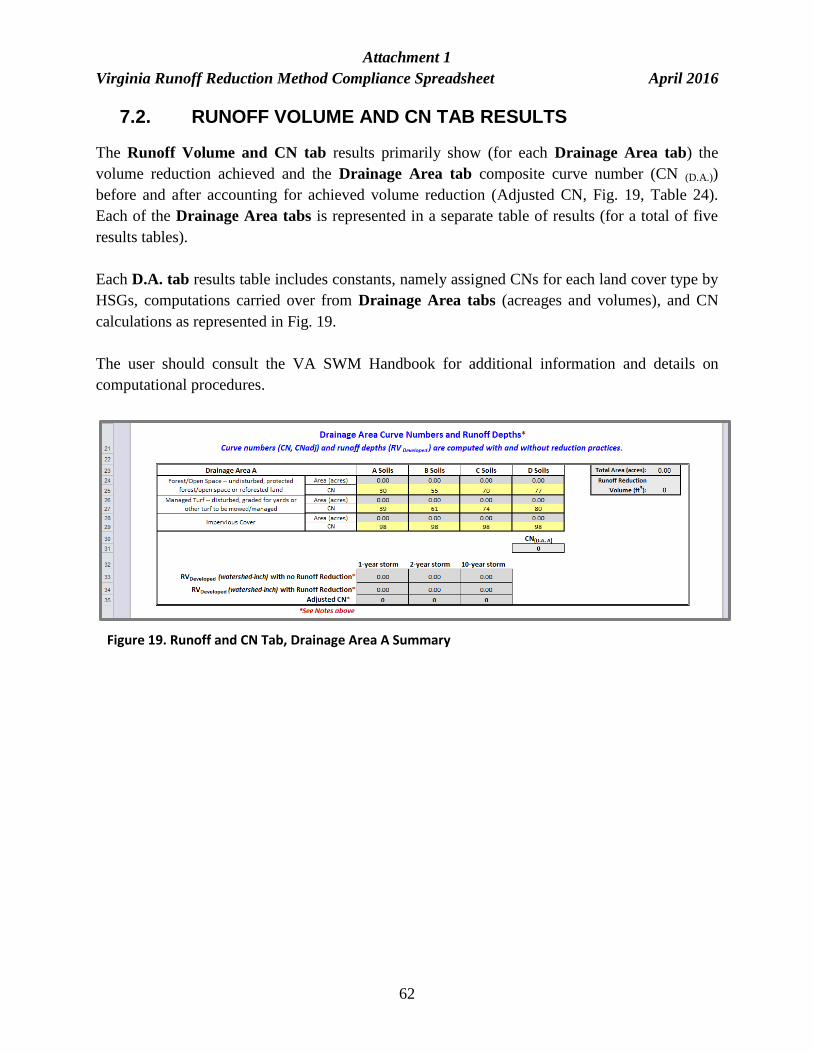
Attachment 1
Virginia Runoff Reduction Method Compliance Spreadsheet April 2016
62
7.2. RUNOFF VOLUME AND CN TAB RESULTS
The Runoff Volume and CN tab results primarily show (for each Drainage Area tab) the
volume reduction achieved and the Drainage Area tab composite curve number (CN (D.A.))
before and after accounting for achieved volume reduction (Adjusted CN, Fig. 19, Table 24).
Each of the Drainage Area tabs is represented in a separate table of results (for a total of five
results tables).
Each D.A. tab results table includes constants, namely assigned CNs for each land cover type by
HSGs, computations carried over from Drainage Area tabs (acreages and volumes), and CN
calculations as represented in Fig. 19.
The user should consult the VA SWM Handbook for additional information and details on
computational procedures.
Figure 19. Runoff and CN Tab, Drainage Area A Summary

Attachment 1
Virginia Runoff Reduction Method Compliance Spreadsheet April 2016
63
Table 24. Runoff Volume and CN Tab Results
Runoff Volume and CN (Results for D.A. A Tab) Cell
Reference
Land Cover Areas by HSGs
Areas of land cover type by hydrologic soil groups is carried over from the Drainage
Area tab.
F24-I24 (F/O) D.A. Tab B5-E5
F26-I26 (MT) D.A. Tab B6-E6
F28-I28 (IC) D.A. Tab B7-E7
Total Area (acres)
The sum of all areas within the Drainage Area tab (across land cover type and HSGs)
L23
D.A. Tab F8
Runoff Reduction Volume (ft3)
The total runoff reduction volume for the Drainage Area tab via runoff reduction BMPs.
L25
D.A. Tab F60
CN
Assigned curve numbers for each land cover type by hydrologic soil groups within the
Drainage Area tab.
F25-I25 (F/O) F27-I27 (MT) F29-I29 (IC)
CN(D.A. A)
The composite curve number for the Drainage Area tab (across land cover types and
hydrologic soil groups).
Equation 15
I31
RVDeveloped (watershed-inch) with no Runoff Reduction
(1-year storm, 2-year storm, 10-year storm)
The post-development runoff volume in watershed-inches for the Drainage Area tab
without applying any RR-BMPs. This value is calculated for each target rainfall event
entered by the user (1-yr, 2-yr, 10-yr storms) using the D.A. tab composite curve
number (CN(D.A.)).
Equation 16
F33 - H33
RVDeveloped (watershed-inch) with Runoff Reduction
(1-year storm, 2-year storm, 10-year storm)
The post-development runoff volume in watershed-inches for the Drainage Area tab
after applying runoff volume reduction from any utilized RR-BMPs. The runoff volume
reduction is subtracted from the post-development runoff volume above (RVDeveloped no
RR) for each target rainfall event and converted to watershed-inches.
Equation 17
F34-H34
Adjusted CN
(1-year storm, 2-year storm, 10-year storm)
The adjusted curve number for each target rainfall event obtained using a look-up
table of curve numbers and corresponding runoff depths (watershed-in). Adjusted CN
can also be determined using Fig. 2-1 of TR-55.
Equation 18
F35-H35
Attachment 1
Virginia Runoff Reduction Method Compliance Spreadsheet April 2016
64
7.3. INTEGRATING WATER QUALITY TREATMENT WITH CONTROL OF LARGER STORMS
Compliance with Part IIB of the VSMP regulations means that stormwater management must
include provisions for channel protection and flood control. The Part IIB water quality
regulations require management of the 1-inch storm event (approximately equivalent to a 3-
month 24-hour storm). The stormwater BMP Design Specifications allow for additional storage
features that go beyond the required BMP treatment volumes and beyond the assigned runoff
reduction credits. If a BMP is designed with increased storage volume to manage the volume
from a 1-, 2-, or 10-year storm event, the VRRM spreadsheet will not recognize this additional
volume stored. The designer will need to perform additional computations outside of the VRRM
spreadsheet.
Stormwater BMPs that provide a runoff reduction (RR) credit do so by providing a storage
component and/or slowing the release of discharge to the nearby receiving stream. These
processes attenuate the runoff by encouraging abstraction and infiltration, resulting in a decrease
in the computed release volume. The effectiveness of a practice’s volume reduction (or ability to
reduce the curve number) during larger storms is dependent on the relative volume of storage
provided versus the volume of runoff generated. As the runoff depth increases, say from a 1-year
frequency rainfall to a 10-year frequency rainfall, the practice’s reduction volume remains the
same but relative to the increased runoff generated, the practice’s proportional runoff reduction
decreases.
BMP practices that can be expanded to provide a greater volume of storage for larger storm
events may be utilized in accordance with guidance provided in the specifications. The designer
may than choose to utilize the total storage volume provided rather than the values used in the
VRRM spreadsheet and compute an adjusted curve number directly from TR-55 for the desired
storm events. A curve number must be computed for each storm event due to the diminishing
effect of storage as rainfall depth increases. It is important to note that the RR credit assigned in
the spreadsheet, and not the actual storage, must be used for the water quality calculations. In
most cases, use of upland runoff reduction practices will reduce the storage volumes needed to
manage the larger storm events associated with channel protection and/or flood control.

Attachment 1
Virginia Runoff Reduction Method Compliance Spreadsheet April 2016
65
8.0 SUMMARY TAB (COMPLIANCE SUMMARY)
The user must enable macros for full functionality of the Summary tab.
The Summary tab compiles a report style summary of the spreadsheet results and water quality
compliance information. All but one section of the Summary tab will auto-populate as user
entries are made on the Site tab, Drainage Area tabs, and Runoff and CN tab. The individual
Drainage Area tab summaries, including BMP selection summaries, will only populate and/or
update once the user clicks the Update Summary Sheet button. The PrintaPreview button was
included to remind the user that the printout can be customized to accommodate user needs (e.g.,
specify 1 page wide by X pages long), and the Print button opens the Excel Print Function (see
user steps 28-29 below).
The upper section of the Summary tab includes site information and water quality compliance
information carried forward from the Site tab and Water Quality Compliance tab, respectively
(rows 5-28 for New Development, Fig.20; rows 5-46 for ReDevelopment, Fig. 20)
Figure 20. New Development Summary Tab – Water Quality Compliance, Site Summary Sections

Attachment 1
Virginia Runoff Reduction Method Compliance Spreadsheet April 2016
66
Figure 21. ReDevelopment Summary Tab – Water Quality Compliance, Site Summary showing errors
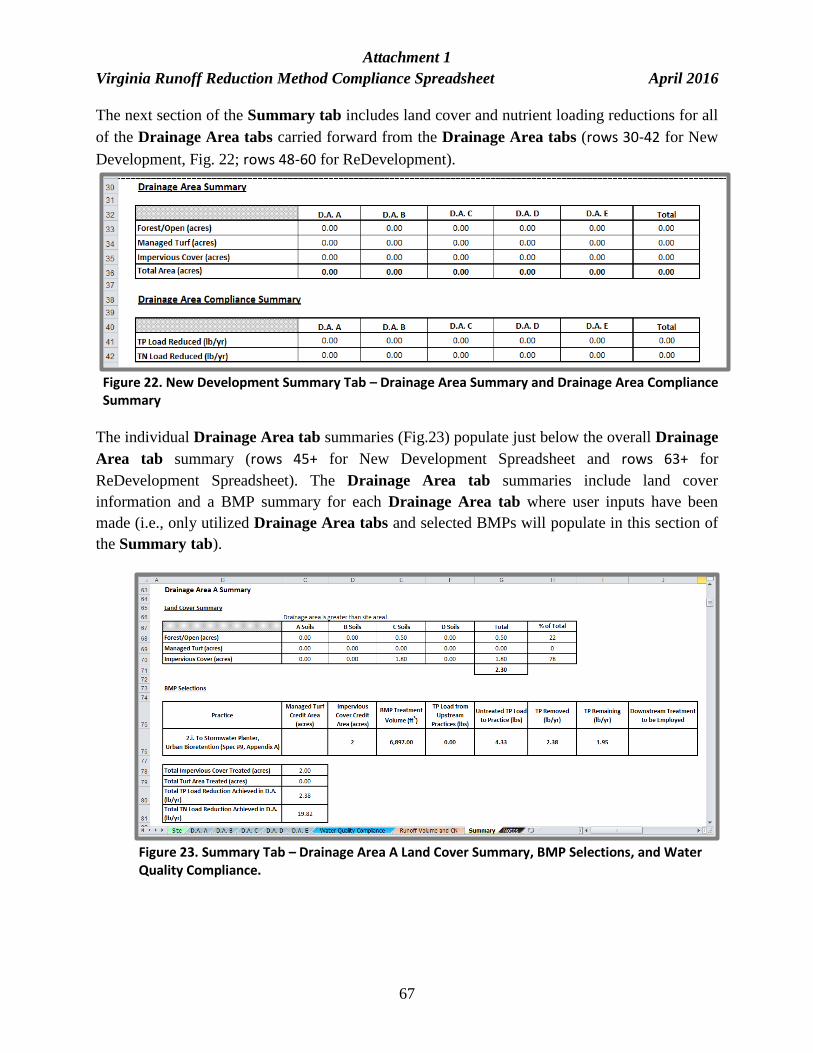
Attachment 1
Virginia Runoff Reduction Method Compliance Spreadsheet April 2016
67
Figure 23. Summary Tab – Drainage Area A Land Cover Summary, BMP Selections, and Water Quality Compliance.
The next section of the Summary tab includes land cover and nutrient loading reductions for all
of the Drainage Area tabs carried forward from the Drainage Area tabs (rows 30-42 for New
Development, Fig. 22; rows 48-60 for ReDevelopment).
The individual Drainage Area tab summaries (Fig.23) populate just below the overall Drainage
Area tab summary (rows 45+ for New Development Spreadsheet and rows 63+ for
ReDevelopment Spreadsheet). The Drainage Area tab summaries include land cover
information and a BMP summary for each Drainage Area tab where user inputs have been
made (i.e., only utilized Drainage Area tabs and selected BMPs will populate in this section of
the Summary tab).
Figure 22. New Development Summary Tab – Drainage Area Summary and Drainage Area Compliance Summary

Attachment 1
Virginia Runoff Reduction Method Compliance Spreadsheet April 2016
68
The bottom section of the Summary tab includes a table of composite curve numbers, runoff
reductions and adjusted curve numbers from the Runoff Volume and CN tab for each drainage
area (Fig. 24). The exact location of this section on the tab will depend on the quantity of
information compiled for the preceding section of individual Drainage Area tab summaries.
Using the VRRM spreadsheet (Summary Tab)
11. Remember: Macros must be enabled for full functionality of the Summary
tab. Return to Site tab and Step 1 in this document.
12. Ensure that the correct BMP Design Specifications list appears in cell C4. If
not, revise the selection in row 2 of the Site tab.
13. Click the Update Summary Sheet button in order to populate the individual
Drainage Area tabs with BMP summaries.
Each time changes are made to individual Drainage Area tabs, the Summary
tab must be updated by selecting this button.
14. Review the summary sheet:
a. If errors are noted, return to the tabs identified in the error notification
table (Fig. 25)
b. If there are no errors, proceed to the next step.
Figure 24. Summary Tab – Water Quality Compliance, Runoff Volume and CN Calculations

Attachment 1
Virginia Runoff Reduction Method Compliance Spreadsheet April 2016
69
Figure 25. Summary Tab Error Notifications for New Development (upper) and ReDevelopment (lower) Spreadsheets.
New Development Spreadsheet
Re-Development Spreadsheet

Attachment 1
Virginia Runoff Reduction Method Compliance Spreadsheet April 2016
70
Using the VRRM spreadsheet (Summary Tab) …..continued
15. Click the Print Preview button. This will open the Excel Print Preview Screen
(Fig. 26) and allow the user to:
a. View the report prior to printing, and/or
b. Select the Excel Page Setup function (top bar menu option) in order to
customize the report printout.
16. At this point, the user can click the Print button, select a connected printer or
print to pdf (Fig. 27).
Figure 26. Summary Tab – Water Quality Compliance Report – Print Preview Screen

Attachment 1
Virginia Runoff Reduction Method Compliance Spreadsheet April 2016
71
Figure 27. Site Summary Tab (Print Button Activated)

Attachment 1
Virginia Runoff Reduction Method Compliance Spreadsheet April 2016
72
9.0 VRRM SPREADSHEET EQUATIONS
9.1. SITE TAB
Equation 1.1a. Forest/Open Space Runoff Coefficient (Weighted for Soil Groups):
𝑅𝑣𝐹𝑂 =[(𝐴𝐹𝑂_𝐴 × 0.02) + (𝐴𝐹𝑂_𝐵 × 0.03) + (𝐴𝐹𝑂_𝐶 × 0.04) + (𝐴𝐹𝑂_𝐷 × 0.05)]
𝐴𝐹𝑂
Equation 1.1b. Percentage Forest/Open Space Area:
%𝐹𝑂 =𝐴𝐹𝑂_𝐴 + 𝐴𝐹𝑂_𝐵 + 𝐴𝐹𝑂_𝐶 + 𝐴𝐹𝑂_𝐷
𝐴𝑠𝑖𝑡𝑒× 100
Equation 1.2a. Managed Turf Runoff Coefficient (Weighted for Soil Groups):
𝑅𝑣𝑀𝑇 =[(𝐴𝑀𝑇_𝐴 × 0.15) + (𝐴𝑀𝑇_𝐵 × 0.20) + (𝐴𝑀𝑇_𝐶 × 0.22) + (𝐴𝑀𝑇_𝐷 × 0.25)]
𝐴𝑀𝑇
Equation 1.2b. Percentage Managed Turf Area:
%𝑀𝑇 =𝐴𝑀𝑇_𝐴 + 𝐴𝑀𝑇_𝐵 + 𝐴𝑀𝑇_𝐶 + 𝐴𝑀𝑇_𝐷
𝐴𝑠𝑖𝑡𝑒× 100
Equation 1.3a. Impervious Cover Runoff Coefficient:
𝑅𝑣𝐼𝐶 = 0.95

Attachment 1
Virginia Runoff Reduction Method Compliance Spreadsheet April 2016
73
Equation 1.3b. Percentage Impervious Cover Area:
%𝐼𝐶 =𝐴𝐼𝐶_𝐴 + 𝐴𝐼𝐶_𝐵 + 𝐴𝐼𝐶_𝐶 + 𝐴𝐼𝐶_𝐷
𝐴𝑠𝑖𝑡𝑒× 100
Where:
𝑅𝑣𝐹𝑂 = weighted forest/open space runoff coefficient across hydrologic soil groups
%𝐹𝑂 = percentage of total forest area for the site
𝐴𝐹𝑂_𝐴 = area of post-development forest/open space with A soils (acres)
𝐴𝐹𝑂_𝐵 = area of post-development forest/open space in B soils (acres)
𝐴𝐹𝑂_𝐶 = area of post-development forest/open space in C soils (acres)
𝐴𝐹𝑂_𝐷 = area of post-development forest/open space in D soils (acres)
𝑅𝑣𝑀𝑇 = weighted managed turf runoff coefficient across hydrologic soil groups
%𝑀𝑇 = percentage of total managed turf area for the site
𝐴𝑀𝑇_𝐴 = area of post-development managed turf in A soils (acres)
𝐴𝑀𝑇_𝐵 = area of post-development managed turf in B soils (acres)
𝐴𝑀𝑇_𝐶 = area of post-development managed turf in C soils (acres)
𝐴𝑀𝑇_𝐷 = area of post-development managed turf in D soils (acres)
𝑅𝑣𝐼𝐶 = impervious cover runoff coefficient across hydrologic soil groups
%𝐼𝐶 = percentage of total impervious cover area for the site
𝐴𝐼𝐶_𝐴 = area of post-development impervious cover in A soils (acres)
𝐴𝐼𝐶_𝐵 = area of post-development impervious cover in B soils (acres)
𝐴𝐼𝐶_𝐶 = area of post-development impervious cover in C soils (acres)
𝐴𝐼𝐶_𝐷 = area of post-development impervious cover in D soils (acres)
𝐴𝑠𝑖𝑡𝑒 = total site area (acres)
Equation 2. Site Composite Runoff Coefficient
𝑅𝑣𝑠𝑖𝑡𝑒 = [(𝑅𝑣𝐹𝑂 × %𝐹𝑂) + (𝑅𝑣𝑀𝑇 × %𝑀𝑇) + (𝑅𝑣𝐼𝐶 × %𝐼𝐶)]/100
Where:
𝑅𝑣𝑠𝑖𝑡𝑒 = unitless composite volumetric runoff coefficient for the site
𝑅𝑣𝐹𝑂 = weighted forest/open space runoff coefficient across hydrologic soil groups (Eq. 1.1a)
𝑅𝑣𝑀𝑇 = weighted managed turf runoff coefficient across hydrologic soil groups (Eq. 1.2a)
𝑅𝑣𝐼𝐶 = impervious cover runoff coefficient across hydrologic soil groups (Eq. 1.3a)
%𝐹𝑂 = percentage of total forest area for the site (Eq. 1.1b)
%𝑀𝑇 = percentage of total managed turf area for the site (Eq. 1.2b)
%𝐼𝐶 = percentage of total impervious cover area for the site (Eq. 1.3b)
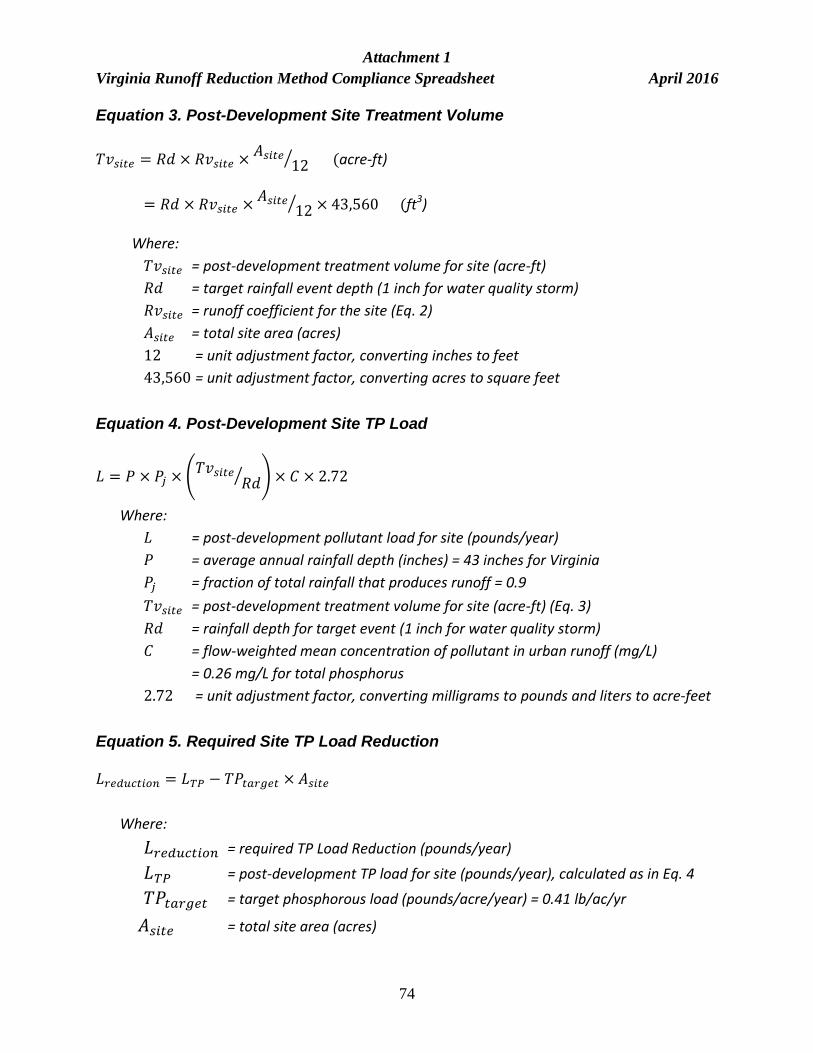
Attachment 1
Virginia Runoff Reduction Method Compliance Spreadsheet April 2016
74
Equation 3. Post-Development Site Treatment Volume
𝑇𝑣𝑠𝑖𝑡𝑒 = 𝑅𝑑 × 𝑅𝑣𝑠𝑖𝑡𝑒 ×𝐴𝑠𝑖𝑡𝑒
12⁄ (acre-ft)
= 𝑅𝑑 × 𝑅𝑣𝑠𝑖𝑡𝑒 ×𝐴𝑠𝑖𝑡𝑒
12⁄ × 43,560 (ft3)
Where:
𝑇𝑣𝑠𝑖𝑡𝑒 = post-development treatment volume for site (acre-ft)
𝑅𝑑 = target rainfall event depth (1 inch for water quality storm)
𝑅𝑣𝑠𝑖𝑡𝑒 = runoff coefficient for the site (Eq. 2)
𝐴𝑠𝑖𝑡𝑒 = total site area (acres)
12 = unit adjustment factor, converting inches to feet
43,560 = unit adjustment factor, converting acres to square feet
Equation 4. Post-Development Site TP Load
𝐿 = 𝑃 × 𝑃𝑗 × (𝑇𝑣𝑠𝑖𝑡𝑒
𝑅𝑑⁄ ) × 𝐶 × 2.72
Where:
𝐿 = post-development pollutant load for site (pounds/year)
𝑃 = average annual rainfall depth (inches) = 43 inches for Virginia
𝑃𝑗 = fraction of total rainfall that produces runoff = 0.9
𝑇𝑣𝑠𝑖𝑡𝑒 = post-development treatment volume for site (acre-ft) (Eq. 3)
𝑅𝑑 = rainfall depth for target event (1 inch for water quality storm)
𝐶 = flow-weighted mean concentration of pollutant in urban runoff (mg/L)
= 0.26 mg/L for total phosphorus
2.72 = unit adjustment factor, converting milligrams to pounds and liters to acre-feet
Equation 5. Required Site TP Load Reduction
𝐿𝑟𝑒𝑑𝑢𝑐𝑡𝑖𝑜𝑛 = 𝐿𝑇𝑃 − 𝑇𝑃𝑡𝑎𝑟𝑔𝑒𝑡 × 𝐴𝑠𝑖𝑡𝑒
Where:
𝐿𝑟𝑒𝑑𝑢𝑐𝑡𝑖𝑜𝑛 = required TP Load Reduction (pounds/year)
𝐿𝑇𝑃 = post-development TP load for site (pounds/year), calculated as in Eq. 4
𝑇𝑃𝑡𝑎𝑟𝑔𝑒𝑡 = target phosphorous load (pounds/acre/year) = 0.41 lb/ac/yr
𝐴𝑠𝑖𝑡𝑒 = total site area (acres)

Attachment 1
Virginia Runoff Reduction Method Compliance Spreadsheet April 2016
75
9.2. D.A. TABS
Equation 6. Runoff Volume from Entire Drainage Area (Cell M8)
𝑇𝑣𝐷𝐴__ = 𝑅𝑑 × 𝑅𝑣𝐷𝐴__𝑀𝑇,𝐼𝐶 × 𝐷𝐴𝑀𝑇,𝐼𝐶 × 3,630
Where:
𝑇𝑣𝐷𝐴__ = runoff or treatment volume for entire drainage area (DA__)
(turf and impervious areas only, cubic feet)
𝑅𝑑 = rainfall depth for target event (1 inch for water quality storm)
𝑅𝑣𝐷𝐴__𝑀𝑇,𝐼𝐶 = composite runoff coefficient for turf and impervious areas in DA__
= (𝑅𝑣𝐷𝐴__𝑀𝑇×𝐷𝐴𝑀𝑇)+(𝑅𝑣𝐷𝐴__𝐼𝐶×𝐷𝐴𝐼𝐶)
𝐷𝐴𝑀𝑇+𝐷𝐴𝐼𝐶
𝐷𝐴𝑀𝑇,𝐼𝐶 = turf and impervious areas in DA__ (acres)
3,630 = unit adjustment factor, converting acre-inches to cubic feet
Equation 7. Total Phosphorus Available for Removal From Entire Drainage Area
(Cell M7)
𝐿(𝑇𝑃,𝐷𝐴__) = 𝑃 × 𝑃𝑗 × (𝑇𝑣𝐷𝐴__
𝑅𝑑⁄ ) × 𝐶 ×
2.72
43,560
Where:
𝐿(𝑇𝑃,𝐷𝐴__) = post-development TP load for DA__ (pounds/year)
𝑃 = average annual rainfall depth (inches) = 43 inches for Virginia
𝑃𝑗 = fraction of total rainfall that produces runoff = 0.9
𝑇𝑣𝐷𝐴__ = treatment volume for DA__
(turf and impervious areas only, cubic feet, Eq. 6)
𝑅𝑑 = rainfall depth for target event (1 inch for water quality storm)
𝐶 = flow-weighted mean concentration of pollutant in urban runoff (mg/L)
= 0.26 mg/L for total phosphorus
2.72 = unit adjustment factor, converting milligrams to pounds and liters to acre-feet
43,560 = unit adjustment factor, converting acres to square feet

Attachment 1
Virginia Runoff Reduction Method Compliance Spreadsheet April 2016
76
Equation 8. Runoff Volume from Contributing Drainage Area
𝑇𝑣𝐶𝐴 = 𝑅𝑑 × 𝑅𝑣𝐶𝐴 × 𝐶𝐴 × 3,630
Where:
𝑇𝑣𝐶𝐴 = treatment volume for contributing drainage area, or Credit Area to practice
(cubic feet)
𝑅𝑑 = rainfall depth for target event (1 inch for water quality storm)
𝑅𝑣𝐶𝐴 = composite runoff coefficient for credit area (CA) being treated by
credit practice (only MT and IC areas considered)
= (𝑅𝑣𝑀𝑇×𝐶𝐴𝑀𝑇)+(𝑅𝑣𝐼𝐶×𝐶𝐴𝐼𝐶)
𝐶𝐴𝑀𝑇+𝐶𝐴𝐼𝐶
𝐶𝐴 = credit area applied to practice (acres, columns C and D)
3,630 = unit adjustment factor, converting acre-inches to cubic feet
Equation 9. Runoff Reduction Achieved by Practice (Column F)
𝑉𝑟𝑒𝑑𝑢𝑐𝑡𝑖𝑜𝑛 = 𝑇𝑣𝐵𝑀𝑃 × 𝑅𝑅𝐶𝑅
= (𝑇𝑣𝐶𝐴 + 𝑉𝑢𝑝𝑠𝑡𝑟𝑒𝑎𝑚) × 𝑅𝑅𝐶𝑅
= [(𝑅𝑑 × 𝑅𝑣𝐶𝐴 × 𝐶𝐴 × 3,630) + 𝑉𝑢𝑝𝑠𝑡𝑟𝑒𝑎𝑚] × 𝑅𝑅𝐶𝑅 *
*formula used in spreadsheet, substituting in Eqs. 8 and 11
Where:
𝑉𝑟𝑒𝑑𝑢𝑐𝑡𝑖𝑜𝑛 = runoff reduction achieved by practice (cubic feet)
𝑇𝑣𝐵𝑀𝑃 = total volume of runoff to practice (cubic feet, Eq. 11, column K)
𝑅𝑅𝐶𝑅 = runoff reduction performance credit for the practice (column B)
𝑇𝑣𝐶𝐴 = treatment volume for credit area (cubic feet, Eq. 8)
𝑉𝑢𝑝𝑠𝑡𝑟𝑒𝑎𝑚 = volume from upstream runoff reduction practice (cubic feet, column E)
𝑅𝑑 = rainfall depth for target event (1 inch for water quality storm)
𝑅𝑣𝐶𝐴 = composite runoff coefficient for credit area (CA) being treated by
credit practice (only MT and IC areas considered)
𝐶𝐴 = credit area applied to practice (acres, columns C and D)
3,630 = unit adjustment factor, converting acre-inches to cubic feet

Attachment 1
Virginia Runoff Reduction Method Compliance Spreadsheet April 2016
77
Equation 10. Remaining Runoff Volume Leaving the Practice (Column G)
𝑉𝑟𝑒𝑚𝑎𝑖𝑛𝑖𝑛𝑔 = 𝑇𝑣𝐵𝑀𝑃 × (1 − 𝑅𝑅𝐶𝑅)
= (𝑇𝑣𝐶𝐴 + 𝑉𝑢𝑝𝑠𝑡𝑟𝑒𝑎𝑚) × (1 − 𝑅𝑅𝐶𝑅)
= [(𝑅𝑑 × 𝑅𝑣𝐶𝐴 × 𝐶𝐴 × 3,630) + 𝑉𝑢𝑝𝑠𝑡𝑟𝑒𝑎𝑚] × (1 − 𝑅𝑅𝐶𝑅) *
*formula used in spreadsheet, substituting in Eqs. 8 and 11
Where:
𝑉𝑟𝑒𝑚𝑎𝑖𝑛𝑖𝑛𝑔 = volume of runoff remaining or discharged from practice after applying
practice’s runoff reduction credit (cubic feet)
𝑇𝑣𝐵𝑀𝑃 = total volume of runoff to practice (cubic feet, Eq. 11, column H)
𝑅𝑅𝐶𝑅 = runoff reduction performance credit for the practice (column B)
𝑇𝑣𝐶𝐴 = treatment volume for credit area (cubic feet, Eq. 8)
𝑉𝑢𝑝𝑠𝑡𝑟𝑒𝑎𝑚 = volume from upstream runoff reduction practice (cubic feet, column E)
𝑅𝑑 = rainfall depth for target event (1 inch for water quality storm)
𝑅𝑣𝐶𝐴 = composite runoff coefficient for credit area (CA) being treated by
credit practice (only MT and IC areas considered)
𝐶𝐴 = credit area applied to practice (acres, columns C and D)
3,630 = unit adjustment factor, converting acre-inches to cubic feet
OR
𝑉𝑟𝑒𝑚𝑎𝑖𝑛𝑖𝑛𝑔 = 𝑇𝑣𝐵𝑀𝑃 − 𝑉𝑟𝑒𝑑𝑢𝑐𝑡𝑖𝑜𝑛
Where:
𝑉𝑟𝑒𝑚𝑎𝑖𝑛𝑖𝑛𝑔 = volume of runoff remaining or discharged from practice after applying
practice’s runoff reduction credit (cubic feet)
𝑇𝑣𝐵𝑀𝑃 = total volume of runoff to practice (cubic feet, Eq. 11, column H)
𝑉𝑟𝑒𝑑𝑢𝑐𝑡𝑖𝑜𝑛 = runoff reduction achieved by practice (cubic feet, Eq. 9, column F)
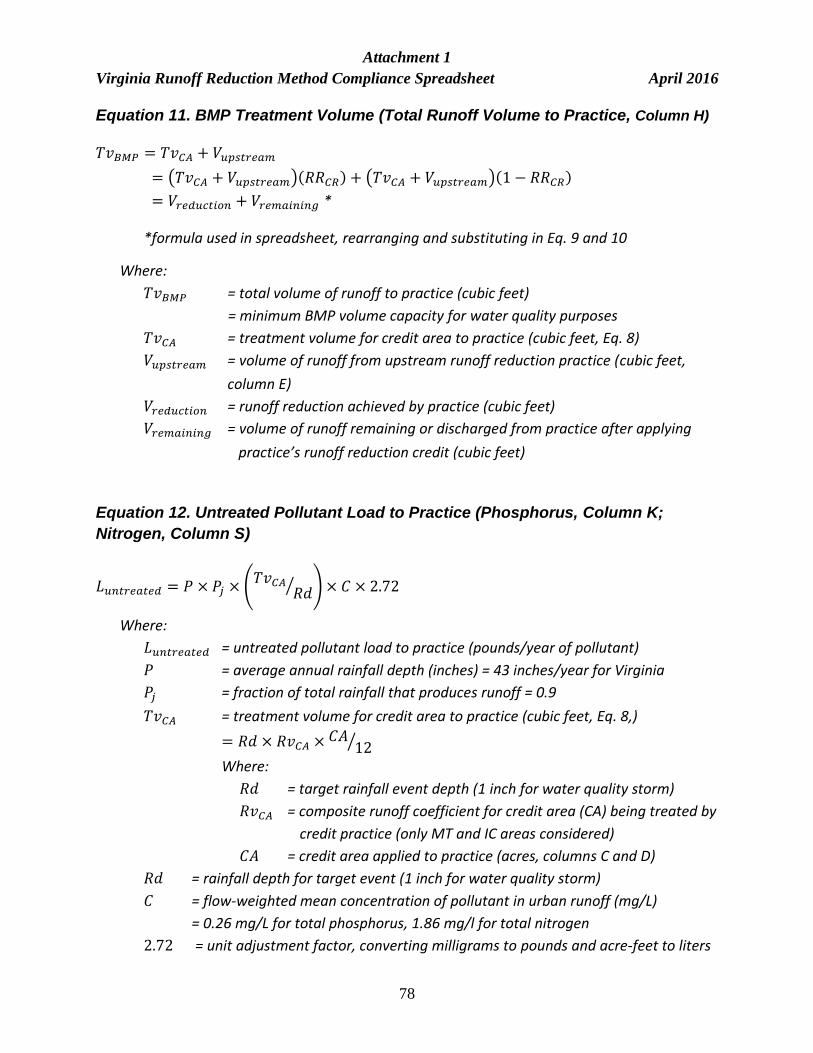
Attachment 1
Virginia Runoff Reduction Method Compliance Spreadsheet April 2016
78
Equation 11. BMP Treatment Volume (Total Runoff Volume to Practice, Column H)
𝑇𝑣𝐵𝑀𝑃 = 𝑇𝑣𝐶𝐴 + 𝑉𝑢𝑝𝑠𝑡𝑟𝑒𝑎𝑚
= (𝑇𝑣𝐶𝐴 + 𝑉𝑢𝑝𝑠𝑡𝑟𝑒𝑎𝑚)(𝑅𝑅𝐶𝑅) + (𝑇𝑣𝐶𝐴 + 𝑉𝑢𝑝𝑠𝑡𝑟𝑒𝑎𝑚)(1 − 𝑅𝑅𝐶𝑅)
= 𝑉𝑟𝑒𝑑𝑢𝑐𝑡𝑖𝑜𝑛 + 𝑉𝑟𝑒𝑚𝑎𝑖𝑛𝑖𝑛𝑔 *
*formula used in spreadsheet, rearranging and substituting in Eq. 9 and 10
Where:
𝑇𝑣𝐵𝑀𝑃 = total volume of runoff to practice (cubic feet)
= minimum BMP volume capacity for water quality purposes
𝑇𝑣𝐶𝐴 = treatment volume for credit area to practice (cubic feet, Eq. 8)
𝑉𝑢𝑝𝑠𝑡𝑟𝑒𝑎𝑚 = volume of runoff from upstream runoff reduction practice (cubic feet,
column E)
𝑉𝑟𝑒𝑑𝑢𝑐𝑡𝑖𝑜𝑛 = runoff reduction achieved by practice (cubic feet)
𝑉𝑟𝑒𝑚𝑎𝑖𝑛𝑖𝑛𝑔 = volume of runoff remaining or discharged from practice after applying
practice’s runoff reduction credit (cubic feet)
Equation 12. Untreated Pollutant Load to Practice (Phosphorus, Column K;
Nitrogen, Column S)
𝐿𝑢𝑛𝑡𝑟𝑒𝑎𝑡𝑒𝑑 = 𝑃 × 𝑃𝑗 × (𝑇𝑣𝐶𝐴
𝑅𝑑⁄ ) × 𝐶 × 2.72
Where:
𝐿𝑢𝑛𝑡𝑟𝑒𝑎𝑡𝑒𝑑 = untreated pollutant load to practice (pounds/year of pollutant)
𝑃 = average annual rainfall depth (inches) = 43 inches/year for Virginia
𝑃𝑗 = fraction of total rainfall that produces runoff = 0.9
𝑇𝑣𝐶𝐴 = treatment volume for credit area to practice (cubic feet, Eq. 8,)
= 𝑅𝑑 × 𝑅𝑣𝐶𝐴 × 𝐶𝐴12⁄
Where:
𝑅𝑑 = target rainfall event depth (1 inch for water quality storm)
𝑅𝑣𝐶𝐴 = composite runoff coefficient for credit area (CA) being treated by
credit practice (only MT and IC areas considered)
𝐶𝐴 = credit area applied to practice (acres, columns C and D)
𝑅𝑑 = rainfall depth for target event (1 inch for water quality storm)
𝐶 = flow-weighted mean concentration of pollutant in urban runoff (mg/L)
= 0.26 mg/L for total phosphorus, 1.86 mg/l for total nitrogen
2.72 = unit adjustment factor, converting milligrams to pounds and acre-feet to liters

Attachment 1
Virginia Runoff Reduction Method Compliance Spreadsheet April 2016
79
Equation 13. Total Load Removal by Practice (Phosphorus, Column L; Nitrogen,
Column T)
𝐿𝑟𝑒𝑚𝑜𝑣𝑒𝑑 = (𝐿𝑢𝑝𝑠𝑡𝑟𝑒𝑎𝑚 + 𝐿𝑢𝑛𝑡𝑟𝑒𝑎𝑡𝑒𝑑) × (𝑇𝑣𝐵𝑀𝑃 ×𝑃𝑅𝐶𝑅
100⁄ ) 𝑇𝑣𝐵𝑀𝑃⁄
Derivation:
[(𝐿𝑢𝑝𝑠𝑡𝑟𝑒𝑎𝑚 + 𝐿𝑢𝑛𝑡𝑟𝑒𝑎𝑡𝑒𝑑) ×𝑉𝑟𝑒𝑑𝑢𝑐𝑡𝑖𝑜𝑛
𝑇𝑣𝐵𝑀𝑃
] + [(𝐿𝑢𝑝𝑠𝑡𝑟𝑒𝑎𝑚 + 𝐿𝑢𝑛𝑡𝑟𝑒𝑎𝑡𝑒𝑑) ×𝑉𝑟𝑒𝑚𝑎𝑖𝑛𝑖𝑛𝑔
𝑇𝑣𝐵𝑀𝑃
× (𝑃𝑅𝐶𝑅
100⁄ )]
= (𝐿𝑢𝑝𝑠𝑡𝑟𝑒𝑎𝑚 + 𝐿𝑢𝑛𝑡𝑟𝑒𝑎𝑡𝑒𝑑) × [𝑉𝑟𝑒𝑑𝑢𝑐𝑡𝑖𝑜𝑛 + 𝑉𝑟𝑒𝑚𝑎𝑖𝑛𝑖𝑛𝑔 × (
𝑃𝑅𝐶𝑅100⁄ )
𝑇𝑣𝐵𝑀𝑃
]
Where:
𝐿𝑟𝑒𝑚𝑜𝑣𝑒𝑑 = total pollutant load removed by practice (pounds/year)
𝐿𝑢𝑝𝑠𝑡𝑟𝑒𝑎𝑚 = pollutant load from upstream treatment practice (pounds/year, TP-column
J, TN-column R)
𝐿𝑢𝑛𝑡𝑟𝑒𝑎𝑡𝑒𝑑 = untreated pollutant load to practice (pounds/year, Eq. 12, TP-column K,
TN-column S)
𝑇𝑣𝐵𝑀𝑃 = total runoff volume to practice (cubic feet, Eq. 11, column H)
𝑃𝑅𝐶𝑅 = pollutant removal performance credit (TP-column I, TN-column Q)
100 = % conversion factor
𝑉𝑟𝑒𝑑𝑢𝑐𝑡𝑖𝑜𝑛 = runoff reduction achieved by practice (cubic feet, column F)
𝑉𝑟𝑒𝑚𝑎𝑖𝑛𝑖𝑛𝑔 = volume of runoff remaining or discharged from practice after applying
practice’s runoff reduction credit (cubic feet, column G)
Equation 14. Remaining Load (Phosphorus, Column M; Nitrogen, Column U)
𝐿𝑟𝑒𝑚𝑎𝑖𝑛𝑖𝑛𝑔 = 𝐿𝑢𝑝𝑠𝑡𝑟𝑒𝑎𝑚 + 𝐿𝑢𝑛𝑡𝑟𝑒𝑎𝑡𝑒𝑑 − 𝐿𝑟𝑒𝑚𝑜𝑣𝑒𝑑
Where:
𝐿𝑟𝑒𝑚𝑎𝑖𝑛𝑖𝑛𝑔 = pollutant load leaving practice or remaining after treatment
(pounds/year, TP-Column M, TN-Column U)
𝐿𝑢𝑝𝑠𝑡𝑟𝑒𝑎𝑚 = pollutant load from upstream treatment practice (pounds/year, TP-column
J, TN-column R)
𝐿𝑢𝑛𝑡𝑟𝑒𝑎𝑡𝑒𝑑 = untreated pollutant load to practice (pounds/year, Eq. 12, TP-column K,
TN-column S)
𝐿𝑟𝑒𝑚𝑜𝑣𝑒𝑑 = total pollutant load removed by practice (pounds/year, Eq. 13, TP-Column L,
TN-Column T)

Attachment 1
Virginia Runoff Reduction Method Compliance Spreadsheet April 2016
80
9.3. RUNOFF VOLUME AND CN TAB
Equation 15. Composite Curve Number (CN)
𝐶𝑁𝐷.𝐴. = [(𝐴𝐹𝑂_𝐴 × 30) + (𝐴𝐹𝑂_𝐵 × 55) + (𝐴𝐹𝑂_𝐶 × 70) + (𝐴𝐹𝑂_𝐷 × 77)]
+[(𝐴𝑀𝑇_𝐴 × 39) + (𝐴𝑀𝑇_𝐵 × 61) + (𝐴𝑀𝑇_𝐶 × 74) + (𝐴𝑀𝑇_𝐷 × 80)
+[(𝐴𝐼𝐶_𝐴 + 𝐴𝐼𝐶_𝐵 + 𝐴𝐼𝐶_𝐶 + 𝐴𝐼𝐶_𝐷) × 98]]/𝐷𝐴
Where:
𝐶𝑁𝐷.𝐴. = composite curve number for Drainage Area
𝐴𝐹𝑂_𝐴 = area of post-development forest/open space with A soils (acres)
𝐴𝐹𝑂_𝐵 = area of post-development forest/open space in B soils (acres)
𝐴𝐹𝑂_𝐶 = area of post-development forest/open space in C soils (acres)
𝐴𝐹𝑂_𝐷 = area of post-development forest/open space in D soils (acres)
𝐴𝑀𝑇_𝐴 = area of post-development managed turf in A soils (acres)
𝐴𝑀𝑇_𝐵 = area of post-development managed turf in B soils (acres)
𝐴𝑀𝑇_𝐶 = area of post-development managed turf in C soils (acres)
𝐴𝑀𝑇_𝐷 = area of post-development managed turf in D soils (acres)
𝐴𝐼𝐶_𝐴 = area of post-development impervious cover in A soils (acres)
𝐴𝐼𝐶_𝐵 = area of post-development impervious cover in B soils (acres)
𝐴𝐼𝐶_𝐶 = area of post-development impervious cover in C soils (acres)
𝐴𝐼𝐶_𝐷 = area of post-development impervious cover in D soils (acres)
30, 55, 70, 77 = assigned curve numbers for forest/open space A, B, C, D soils,
respectively
39, 61, 74, 80 = assigned curve numbers for managed turf A, B, C, D soils, respectively
98 = assigned curve number for impervious cover irrespective of underlying soil groups
𝐷𝐴 = Drainage Area (acres)
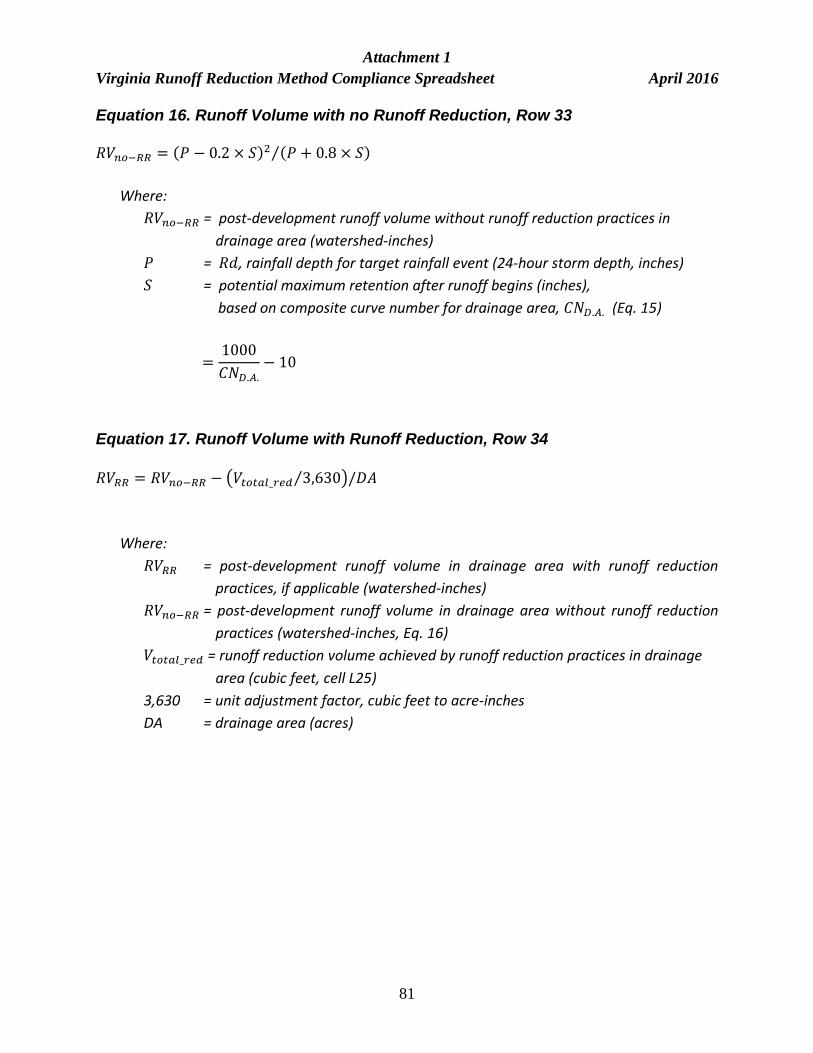
Attachment 1
Virginia Runoff Reduction Method Compliance Spreadsheet April 2016
81
Equation 16. Runoff Volume with no Runoff Reduction, Row 33
𝑅𝑉𝑛𝑜−𝑅𝑅 = (𝑃 − 0.2 × 𝑆)2 (𝑃 + 0.8 × 𝑆)⁄
Where:
𝑅𝑉𝑛𝑜−𝑅𝑅 = post-development runoff volume without runoff reduction practices in
drainage area (watershed-inches)
𝑃 = 𝑅𝑑, rainfall depth for target rainfall event (24-hour storm depth, inches)
𝑆 = potential maximum retention after runoff begins (inches),
based on composite curve number for drainage area, 𝐶𝑁𝐷.𝐴. (Eq. 15)
=1000
𝐶𝑁𝐷.𝐴.− 10
Equation 17. Runoff Volume with Runoff Reduction, Row 34
𝑅𝑉𝑅𝑅 = 𝑅𝑉𝑛𝑜−𝑅𝑅 − (𝑉𝑡𝑜𝑡𝑎𝑙_𝑟𝑒𝑑 3,630⁄ )/𝐷𝐴
Where:
𝑅𝑉𝑅𝑅 = post-development runoff volume in drainage area with runoff reduction
practices, if applicable (watershed-inches)
𝑅𝑉𝑛𝑜−𝑅𝑅 = post-development runoff volume in drainage area without runoff reduction
practices (watershed-inches, Eq. 16)
𝑉𝑡𝑜𝑡𝑎𝑙_𝑟𝑒𝑑 = runoff reduction volume achieved by runoff reduction practices in drainage
area (cubic feet, cell L25)
3,630 = unit adjustment factor, cubic feet to acre-inches
DA = drainage area (acres)

Attachment 1
Virginia Runoff Reduction Method Compliance Spreadsheet April 2016
82
Equation 18. Adjusted Curve Number
Note: The adjusted curve number (𝐶𝑁𝑎𝑑𝑗𝑢𝑠𝑡𝑒𝑑 ) is determined using a lookup table of curve
number and runoff volumes so that:
𝐶𝑁𝑎𝑑𝑗𝑢𝑠𝑡𝑒𝑑 corresponds to Runoff Volume with runoff reduction, 𝑅𝑉𝑅𝑅 (watershed-in, Eq. 17)
such that
𝑅𝑉𝑅𝑅 = (𝑃 − 0.2 × 𝑆𝑎𝑑𝑗𝑢𝑠𝑡𝑒𝑑)2
(𝑃 + 0.8 × 𝑆𝑎𝑑𝑗𝑢𝑠𝑡𝑒𝑑)⁄
and
𝑆𝑎𝑑𝑗𝑢𝑠𝑡𝑒𝑑 =1000
𝐶𝑁𝑎𝑑𝑗𝑢𝑠𝑡𝑒𝑑− 10
Where:
𝐶𝑁𝑎𝑑𝑗𝑢𝑠𝑡𝑒𝑑 = adjusted curve number generating a runoff volume (watershed-inches)
equal to the drainage area runoff volume with runoff reduction practices
(𝑅𝑉𝑅𝑅 , Eq. 17)
𝑅𝑉𝑅𝑅 = Runoff reduction volume in drainage area with runoff reduction practices
(watershed-inches)
𝑃 = 𝑅𝑑, rainfall depth for target rainfall event (24-hour storm depth, inches)
𝑆𝑎𝑑𝑗𝑢𝑠𝑡𝑒𝑑 = potential maximum retention after runoff begins (inches) based upon
adjusted curve number

Attachment 1
Virginia Runoff Reduction Method Compliance Spreadsheet April 2016
83
9.4. REDEVELOPMENT SITE TAB – COMPUTATIONS
This section provides the equations (including logical derivations) for the determination of
redevelopment water quality compliance. A graphical representation is given in Section 4.2.3.
Equation 19. Net Change in Impervious Cover
𝐴𝐼𝐶,𝑝𝑜𝑠𝑡 − 𝐴𝐼𝐶,𝑝𝑟𝑒 = 𝑋𝐼𝐶
Where:
𝐴𝐼𝐶,𝑝𝑜𝑠𝑡 = area of post-development impervious cover (acres)
𝐴𝐼𝐶,𝑝𝑟𝑒 = area of pre-redevelopment impervious cover (acres)
𝑋𝐼𝐶 = the change in pre-redevelopment to post-development impervious acreage
9.4.1. REDEVELOPMENT WITH IMPERVIOUS COVER INCREASE,
(𝑨𝑰𝑪,𝒑𝒐𝒔𝒕 − 𝑨𝑰𝑪,𝒑𝒓𝒆) > 𝟎
Equation 20. TP Load Reduction Requirement for New Net Impervious Cover
𝐿𝑟𝑒𝑑𝑢𝑐𝑡𝑖𝑜𝑛_𝐼𝐶,𝑛𝑒𝑤.𝑝𝑜𝑠𝑡 = 𝐿𝐼𝐶,𝑛𝑒𝑤.𝑝𝑜𝑠𝑡 − 𝑇𝑃𝑡𝑎𝑟𝑔𝑒𝑡 × 𝐴𝐼𝐶,𝑛𝑒𝑤.𝑝𝑜𝑠𝑡
Where:
𝐿𝑟𝑒𝑑𝑢𝑐𝑡𝑖𝑜𝑛_𝐼𝐶,𝑛𝑒𝑤.𝑝𝑜𝑠𝑡 = required TP load reduction for post-development new net
impervious cover (pounds/year)
𝐿𝐼𝐶,𝑛𝑒𝑤.𝑝𝑜𝑠𝑡 = post-development TP load for new net impervious cover (pounds/year),
calculated as in Eq. 4
𝑇𝑃𝑡𝑎𝑟𝑔𝑒𝑡 = target phosphorous load (pounds/acre/year) = 0.41 lb/ac/yr
𝐴𝐼𝐶,𝑛𝑒𝑤.𝑝𝑜𝑠𝑡 = impervious cover net increase from pre-redevelopment to post-
development, equal to 𝑋𝐼𝐶 from Eq. 19 when the impervious cover change
is a net increase (acres)

Attachment 1
Virginia Runoff Reduction Method Compliance Spreadsheet April 2016
84
Equation 21. Net Decrease in Pervious Areas
The net decrease in pervious acreages (forest/open space and/or managed turf) is
equivalent to the post-development increase in impervious cover.
𝑋𝐼𝐶 = −(𝑋𝐹𝑂 + 𝑋𝑀𝑇)
Where: 𝑋𝐹𝑂 = 𝐴𝐹𝑂,𝑝𝑜𝑠𝑡 − 𝐴𝐹𝑂,𝑝𝑟𝑒
𝑋𝑀𝑇 = 𝐴𝑀𝑇,𝑝𝑜𝑠𝑡 − 𝐴𝑀𝑇,𝑝𝑟𝑒
Given that the pre-redevelopment site acreage equals the post-development site acreage:
𝐴𝑠𝑖𝑡𝑒,𝑝𝑟𝑒 = 𝐴𝑠𝑖𝑡𝑒,𝑝𝑜𝑠𝑡 Where: 𝐴𝑠𝑖𝑡𝑒,𝑝𝑟𝑒 = 𝐴𝐹𝑂,𝑝𝑟𝑒 + 𝐴𝑀𝑇,𝑝𝑟𝑒 + 𝐴𝐼𝐶,𝑝𝑟𝑒
And: 𝐴𝑠𝑖𝑡𝑒,𝑝𝑜𝑠𝑡 = 𝐴𝐹𝑂,𝑝𝑜𝑠𝑡 + 𝐴𝑀𝑇,𝑝𝑜𝑠𝑡 + 𝐴𝐼𝐶,𝑝𝑜𝑠𝑡
Therefore:
𝐴𝐹𝑂,𝑝𝑟𝑒 + 𝐴𝑀𝑇,𝑝𝑟𝑒 + 𝐴𝐼𝐶,𝑝𝑟𝑒 = 𝐴𝐹𝑂,𝑝𝑜𝑠𝑡 + 𝐴𝑀𝑇,𝑝𝑜𝑠𝑡 + 𝐴𝐼𝐶,𝑝𝑜𝑠𝑡
We can rearrange to:
𝐴𝐼𝐶,𝑝𝑜𝑠𝑡 − 𝐴𝐼𝐶,𝑝𝑟𝑒 = (𝐴𝐹𝑂,𝑝𝑟𝑒 − 𝐴𝐹𝑂,𝑝𝑜𝑠𝑡) + (𝐴𝑀𝑇,𝑝𝑟𝑒 − 𝐴𝑀𝑇,𝑝𝑜𝑠𝑡)
And, by substitution:
𝑋𝐼𝐶 = −(𝑋𝐹𝑂 + 𝑋𝑀𝑇) (Eq. 21)
Where:
𝐴𝑠𝑖𝑡𝑒,𝑝𝑟𝑒 = pre-redevelopment site area (acres)
𝐴𝑠𝑖𝑡𝑒,𝑝𝑜𝑠𝑡 = post-development site area (acres)
𝐴𝐹𝑂,𝑝𝑟𝑒 = area of pre-redevelopment forest/open space (acres)
𝐴𝑀𝑇,𝑝𝑟𝑒 = area of pre-redevelopment managed turf (acres)
𝐴𝐼𝐶,𝑝𝑟𝑒 = area of pre-redevelopment impervious cover (acres)
𝐴𝐹𝑂,𝑝𝑜𝑠𝑡 = area of post-development forest/open space (acres)
𝐴𝑀𝑇,𝑝𝑜𝑠𝑡 = area of post-development managed turf (acres)
𝐴𝐼𝐶,𝑝𝑜𝑠𝑡 = area of post-development impervious cover (acres)
𝑋𝐼𝐶 = difference in pre-redevelopment to post-development impervious acreage
𝑋𝐹𝑂 = difference in pre-redevelopment to post-development forest/open space acreage
𝑋𝑀𝑇 = difference in pre-redevelopment to post-development managed turf acreage

Attachment 1
Virginia Runoff Reduction Method Compliance Spreadsheet April 2016
85
When the net impervious cover (IC) increases following redevelopment, there must be a
simultaneous decrease in forest/open space (F/O) and/or managed turf (MT). Through a
comparison process, the net decrease for the specific pervious land cover type areas must be
quantified (F/O and/or MT) in order to exclude those acreages from the pre-redevelopment F/O
and MT areas and establish the pre-redevelopment adjusted areas. This computation is performed
in the ReDevelopment spreadsheet Site tab (hidden columns N through S) as follows in Fig. 28:
No
Yes Increase in F/O?
F/Opost > F/Opre ?
Increase in MT?
MTpost > MTpre ?
F/Oadj = F/Opre
MTadj = MTpre − (ICpost − ICpre)
Increase in F/O so any new net IC only from MT
F/Oadj = F/Opre - (ICpost - ICpre)
MTadj = MTpre
Increase in MT so any new net ICly from F/O
F/Oadj = F/Opost
MTadj = MTpost
No increase in F/O or MT so any decreases in post-pervious areas are for new net IC.
Listed post pervious areas are used as the adjusted pre-redevelopment areas.
Figure 28. Decision flowchart for determination of pervious area converted to new net impervious cover in redevelopment spreadsheet.
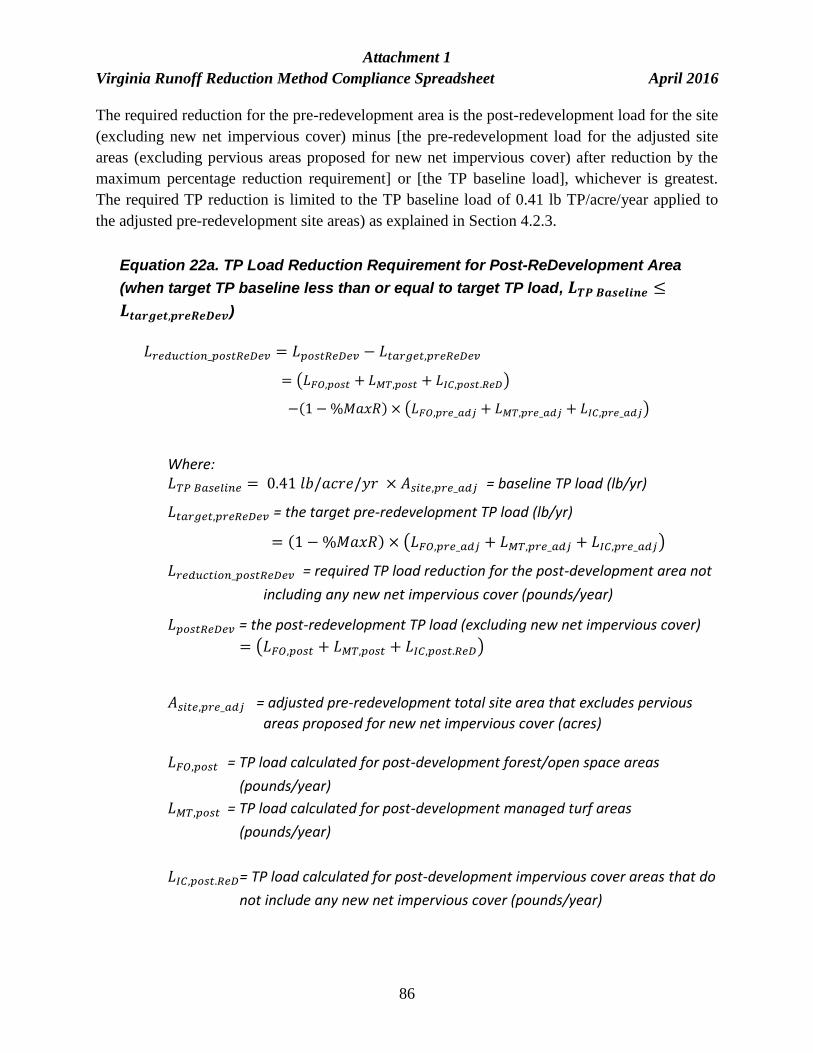
Attachment 1
Virginia Runoff Reduction Method Compliance Spreadsheet April 2016
86
The required reduction for the pre-redevelopment area is the post-redevelopment load for the site
(excluding new net impervious cover) minus [the pre-redevelopment load for the adjusted site
areas (excluding pervious areas proposed for new net impervious cover) after reduction by the
maximum percentage reduction requirement] or [the TP baseline load], whichever is greatest.
The required TP reduction is limited to the TP baseline load of 0.41 lb TP/acre/year applied to
the adjusted pre-redevelopment site areas) as explained in Section 4.2.3.
Equation 22a. TP Load Reduction Requirement for Post-ReDevelopment Area
(when target TP baseline less than or equal to target TP load, 𝑳𝑻𝑷 𝑩𝒂𝒔𝒆𝒍𝒊𝒏𝒆 ≤
𝑳𝒕𝒂𝒓𝒈𝒆𝒕,𝒑𝒓𝒆𝑹𝒆𝑫𝒆𝒗)
𝐿𝑟𝑒𝑑𝑢𝑐𝑡𝑖𝑜𝑛_𝑝𝑜𝑠𝑡𝑅𝑒𝐷𝑒𝑣 = 𝐿𝑝𝑜𝑠𝑡𝑅𝑒𝐷𝑒𝑣 − 𝐿𝑡𝑎𝑟𝑔𝑒𝑡,𝑝𝑟𝑒𝑅𝑒𝐷𝑒𝑣
= (𝐿𝐹𝑂,𝑝𝑜𝑠𝑡 + 𝐿𝑀𝑇,𝑝𝑜𝑠𝑡 + 𝐿𝐼𝐶,𝑝𝑜𝑠𝑡.𝑅𝑒𝐷)
−(1 − %𝑀𝑎𝑥𝑅) × (𝐿𝐹𝑂,𝑝𝑟𝑒_𝑎𝑑𝑗 + 𝐿𝑀𝑇,𝑝𝑟𝑒_𝑎𝑑𝑗 + 𝐿𝐼𝐶,𝑝𝑟𝑒_𝑎𝑑𝑗)
Where: 𝐿𝑇𝑃 𝐵𝑎𝑠𝑒𝑙𝑖𝑛𝑒 = 0.41 𝑙𝑏/𝑎𝑐𝑟𝑒/𝑦𝑟 × 𝐴𝑠𝑖𝑡𝑒,𝑝𝑟𝑒_𝑎𝑑𝑗 = baseline TP load (lb/yr)
𝐿𝑡𝑎𝑟𝑔𝑒𝑡,𝑝𝑟𝑒𝑅𝑒𝐷𝑒𝑣 = the target pre-redevelopment TP load (lb/yr)
= (1 − %𝑀𝑎𝑥𝑅) × (𝐿𝐹𝑂,𝑝𝑟𝑒_𝑎𝑑𝑗 + 𝐿𝑀𝑇,𝑝𝑟𝑒_𝑎𝑑𝑗 + 𝐿𝐼𝐶,𝑝𝑟𝑒_𝑎𝑑𝑗)
𝐿𝑟𝑒𝑑𝑢𝑐𝑡𝑖𝑜𝑛_𝑝𝑜𝑠𝑡𝑅𝑒𝐷𝑒𝑣 = required TP load reduction for the post-development area not
including any new net impervious cover (pounds/year)
𝐿𝑝𝑜𝑠𝑡𝑅𝑒𝐷𝑒𝑣 = the post-redevelopment TP load (excluding new net impervious cover)
= (𝐿𝐹𝑂,𝑝𝑜𝑠𝑡 + 𝐿𝑀𝑇,𝑝𝑜𝑠𝑡 + 𝐿𝐼𝐶,𝑝𝑜𝑠𝑡.𝑅𝑒𝐷)
𝐴𝑠𝑖𝑡𝑒,𝑝𝑟𝑒_𝑎𝑑𝑗 = adjusted pre-redevelopment total site area that excludes pervious
areas proposed for new net impervious cover (acres) 𝐿𝐹𝑂,𝑝𝑜𝑠𝑡 = TP load calculated for post-development forest/open space areas
(pounds/year)
𝐿𝑀𝑇,𝑝𝑜𝑠𝑡 = TP load calculated for post-development managed turf areas
(pounds/year)
𝐿𝐼𝐶,𝑝𝑜𝑠𝑡.𝑅𝑒𝐷= TP load calculated for post-development impervious cover areas that do
not include any new net impervious cover (pounds/year)
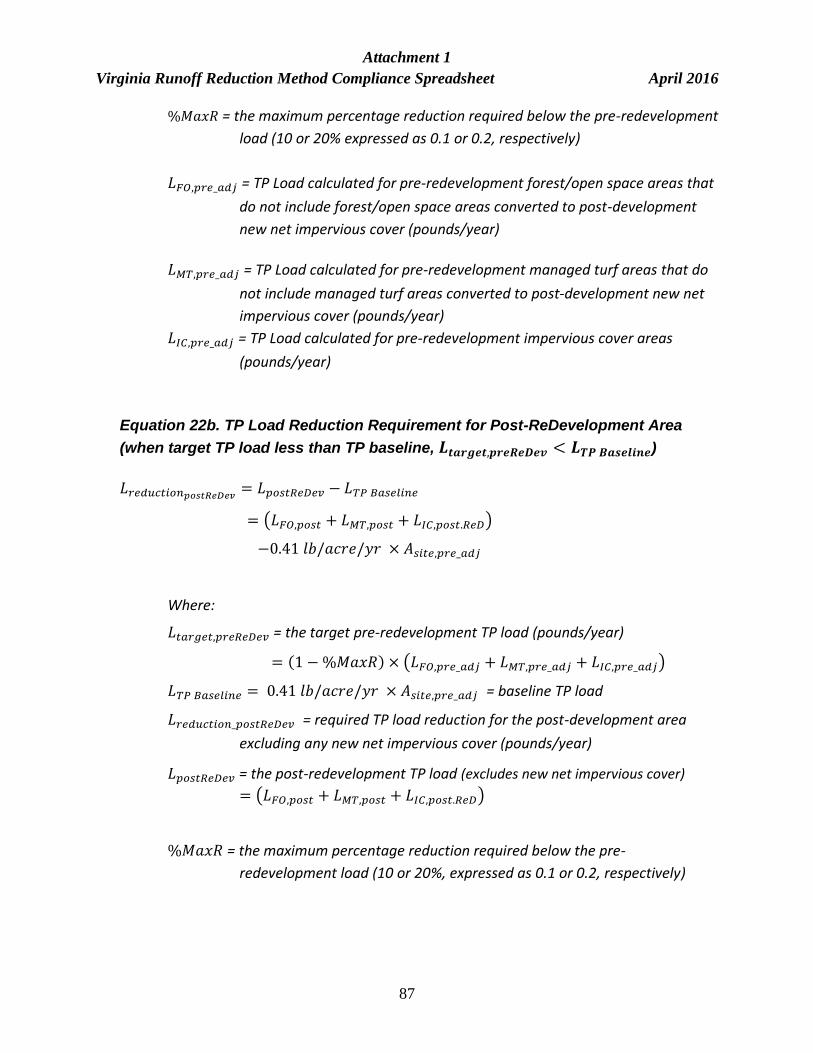
Attachment 1
Virginia Runoff Reduction Method Compliance Spreadsheet April 2016
87
%𝑀𝑎𝑥𝑅 = the maximum percentage reduction required below the pre-redevelopment
load (10 or 20% expressed as 0.1 or 0.2, respectively)
𝐿𝐹𝑂,𝑝𝑟𝑒_𝑎𝑑𝑗 = TP Load calculated for pre-redevelopment forest/open space areas that
do not include forest/open space areas converted to post-development
new net impervious cover (pounds/year)
𝐿𝑀𝑇,𝑝𝑟𝑒_𝑎𝑑𝑗 = TP Load calculated for pre-redevelopment managed turf areas that do
not include managed turf areas converted to post-development new net
impervious cover (pounds/year)
𝐿𝐼𝐶,𝑝𝑟𝑒_𝑎𝑑𝑗 = TP Load calculated for pre-redevelopment impervious cover areas
(pounds/year)
Equation 22b. TP Load Reduction Requirement for Post-ReDevelopment Area
(when target TP load less than TP baseline, 𝑳𝒕𝒂𝒓𝒈𝒆𝒕,𝒑𝒓𝒆𝑹𝒆𝑫𝒆𝒗 < 𝑳𝑻𝑷 𝑩𝒂𝒔𝒆𝒍𝒊𝒏𝒆)
𝐿𝑟𝑒𝑑𝑢𝑐𝑡𝑖𝑜𝑛𝑝𝑜𝑠𝑡𝑅𝑒𝐷𝑒𝑣= 𝐿𝑝𝑜𝑠𝑡𝑅𝑒𝐷𝑒𝑣 − 𝐿𝑇𝑃 𝐵𝑎𝑠𝑒𝑙𝑖𝑛𝑒
= (𝐿𝐹𝑂,𝑝𝑜𝑠𝑡 + 𝐿𝑀𝑇,𝑝𝑜𝑠𝑡 + 𝐿𝐼𝐶,𝑝𝑜𝑠𝑡.𝑅𝑒𝐷)
−0.41 𝑙𝑏/𝑎𝑐𝑟𝑒/𝑦𝑟 × 𝐴𝑠𝑖𝑡𝑒,𝑝𝑟𝑒_𝑎𝑑𝑗
Where:
𝐿𝑡𝑎𝑟𝑔𝑒𝑡,𝑝𝑟𝑒𝑅𝑒𝐷𝑒𝑣 = the target pre-redevelopment TP load (pounds/year)
= (1 − %𝑀𝑎𝑥𝑅) × (𝐿𝐹𝑂,𝑝𝑟𝑒_𝑎𝑑𝑗 + 𝐿𝑀𝑇,𝑝𝑟𝑒_𝑎𝑑𝑗 + 𝐿𝐼𝐶,𝑝𝑟𝑒_𝑎𝑑𝑗)
𝐿𝑇𝑃 𝐵𝑎𝑠𝑒𝑙𝑖𝑛𝑒 = 0.41 𝑙𝑏/𝑎𝑐𝑟𝑒/𝑦𝑟 × 𝐴𝑠𝑖𝑡𝑒,𝑝𝑟𝑒_𝑎𝑑𝑗 = baseline TP load
𝐿𝑟𝑒𝑑𝑢𝑐𝑡𝑖𝑜𝑛_𝑝𝑜𝑠𝑡𝑅𝑒𝐷𝑒𝑣 = required TP load reduction for the post-development area
excluding any new net impervious cover (pounds/year)
𝐿𝑝𝑜𝑠𝑡𝑅𝑒𝐷𝑒𝑣 = the post-redevelopment TP load (excludes new net impervious cover)
= (𝐿𝐹𝑂,𝑝𝑜𝑠𝑡 + 𝐿𝑀𝑇,𝑝𝑜𝑠𝑡 + 𝐿𝐼𝐶,𝑝𝑜𝑠𝑡.𝑅𝑒𝐷)
%𝑀𝑎𝑥𝑅 = the maximum percentage reduction required below the pre-
redevelopment load (10 or 20%, expressed as 0.1 or 0.2, respectively)

Attachment 1
Virginia Runoff Reduction Method Compliance Spreadsheet April 2016
88
𝐿𝐹𝑂,𝑝𝑟𝑒_𝑎𝑑𝑗 = TP Load calculated for pre-redevelopment forest/open space areas that
do not include forest/open space areas converted to post-development
new net impervious cover (pounds/year)
𝐿𝑀𝑇,𝑝𝑟𝑒_𝑎𝑑𝑗 = TP Load calculated for pre-redevelopment managed turf areas that do
not include managed turf areas converted to post-development new net
impervious cover (pounds/year)
𝐿𝐼𝐶,𝑝𝑟𝑒_𝑎𝑑𝑗 = TP Load calculated for pre-redevelopment impervious cover areas
(pounds/year)
𝐴𝑠𝑖𝑡𝑒,𝑝𝑟𝑒_𝑎𝑑𝑗 = adjusted pre-redevelopment total site area that excludes pervious
areas proposed for new net impervious cover (acres) 𝐿𝐹𝑂,𝑝𝑜𝑠𝑡 = TP load calculated for post-development forest/open space areas
(pounds/year)
𝐿𝑀𝑇,𝑝𝑜𝑠𝑡 = TP load calculated for post-development managed turf areas
(pounds/year)
𝐿𝐼𝐶,𝑝𝑜𝑠𝑡.𝑅𝑒𝐷= TP load calculated for post-development impervious cover areas that do
not include any new net impervious cover (pounds/year)

Attachment 1
Virginia Runoff Reduction Method Compliance Spreadsheet April 2016
89
9.4.2. REDEVELOPMENT WITH NO IMPERVIOUS COVER INCREASE,
(𝑨𝑰𝑪,𝒑𝒐𝒔𝒕 − 𝑨𝑰𝑪,𝒑𝒓𝒆) ≤ 𝟎
In the situations where a redevelopment project does not include a net change in
impervious cover acreage (i.e., no new net impervious cover), the post-development site
total phosphorus load must meet the pre-redevelopment total phosphorus load after the 10
or 20% reduction, depending on the project’s total disturbed acreage, up to the pre-
redevelopment project’s baseline load at 0.41 lb TP/acre/yr. This situation is illustrated
above in Section 4.2.3.
Using Equations 19 and 20:
𝐴𝐼𝐶,𝑛𝑒𝑤.𝑝𝑜𝑠𝑡 = 0
And
𝐿𝑟𝑒𝑑𝑢𝑐𝑡𝑖𝑜𝑛_𝐼𝐶,𝑛𝑒𝑤.𝑝𝑜𝑠𝑡 = 0
9.4.3. FINAL POST-DEVELOPMENT SITE REQUIREMENT
Equation 23. Final TP Load Reduction Requirement for ReDevelopment
𝐿𝑟𝑒𝑑𝑢𝑐𝑡𝑖𝑜𝑛_𝐹𝑖𝑛𝑎𝑙𝑃𝑜𝑠𝑡 = 𝐿𝑟𝑒𝑑𝑢𝑐𝑡𝑖𝑜𝑛_𝐼𝐶,𝑛𝑒𝑤.𝑝𝑜𝑠𝑡 + 𝐿𝑟𝑒𝑑𝑢𝑐𝑡𝑖𝑜𝑛_𝑝𝑜𝑠𝑡𝑅𝑒𝐷𝑒𝑣
Where:
𝐿𝑟𝑒𝑑𝑢𝑐𝑡𝑖𝑜𝑛_𝐹𝑖𝑛𝑎𝑙𝑃𝑜𝑠𝑡 = required TP load reduction for the post-development site
consisting of all land cover areas (pounds/year)
𝐿𝑟𝑒𝑑𝑢𝑐𝑡𝑖𝑜𝑛_𝐼𝐶,𝑛𝑒𝑤.𝑝𝑜𝑠𝑡 = required TP load reduction for post-development new net
impervious cover (pounds/year)
𝐿𝑟𝑒𝑑𝑢𝑐𝑡𝑖𝑜𝑛_𝑝𝑜𝑠𝑡𝑅𝑒𝐷𝑒𝑣 = required TP load reduction for the post-development area not
including any new net impervious cover (pounds/year)

Attachment 1
Virginia Runoff Reduction Method Compliance Spreadsheet April 2016
90
10.0 REFERENCES
Center for Watershed Protection, 2008, Technical Memorandum: The Runoff Reduction Method, April
18, 2008:
http://www.deq.virginia.gov/Portals/0/DEQ/Water/StormwaterManagement/VRRM/CWP_TechM
emo_VRRM_20080418.pdf
NOAA Atlas 14 - NWS-NOAA. 2004. Precipitation-Frequency Atlas of the United States, NOAA Atlas
14, Vol 2, Version 3, NOAA, National Weather Service, Silver Spring, MD: Data can be accessed
through the internet Precipitation Frequency Data Server (PFDS):
http://hdsc.nws.noaa.gov/hdsc/pfds/
NRCS (1986) Urban Hydrology for Small Watersheds: Technical Release 55 (TR-55); Second Edition,
June 1986: www.cpesc.org/reference/tr55.pdf
Virginia Runoff Reduction Method Instructions & Documentation (March 28, 2011):
http://www.deq.virginia.gov/Portals/0/DEQ/Water/StormwaterManagement/VRRM/VRRM_InstrD
oc_20110328.pdf
Virginia Stormwater Management Handbook, First Edition (1999)
Volume I - Introductions & Chapters 1-3: http://www.deq.virginia.gov/Portals/0/DEQ/Water/Publications/HndbkVolumeI.pdf
Volume II – Chapters 4-6 & Glossary:
http://www.deq.virginia.gov/Portals/0/DEQ/Water/StormwaterManagement/SWMHandbookV
olume%20II.pdf
Virginia Stormwater Management Handbook, Second Edition (2013 Draft):
http://www.deq.virginia.gov/fileshare/wps/2013_SWM_Handbook/

Attachment 1
Virginia Runoff Reduction Method Compliance Spreadsheet April 2016
91
11.0 ACRONYMS AND DEFINITIONS
BMP: Best Management Practice
BMP Clearinghouse: Virginia Stormwater BMP Clearinhouse, vwrrc.vt.edu/swc/
CN: Curve Number
DA: Drainage Area
DEQ: Virginia Department of Environmental Quality
F/O: Forest or open space
LOD: Limits of disturbance
NRCS: Natural Resources Conservation Service
HSG: Hydrologic Soil Group
IC: Impervious Cover
MT: Managed Turf
MTD: Manufactured Treatment Device
Permanent BMP: Permanent best management practice or stormwater management facilities as
defined in (9VAC25-870-10)
Regulated LDA: Land-disturbing activity of one acre or more, 2,500 square feet in all areas
of jurisdictions designated as subject to the Chesapeake Bay Preservation Act, part of a
larger common plan of development or sale that is one acre or more, or a more stringent
area as established in local ordinance, that must follow the provisions of the VSMP
Regulations and obtain state permit coverage, where applicable, and VSMP authority
permit coverage.
RRM: Runoff Reduction Method
RR: Runoff Reduction
RV: Runoff Volume
Attachment 1
Virginia Runoff Reduction Method Compliance Spreadsheet April 2016
92
SWM: Stormwater management
TN: Total Nitrogen
TP: Total Phosphorus
TV: Treatment Volume
VRRM: Virginia Runoff Reduction Method
VSMP: Virginia Stormwater Management Program


