
Half Year Statement
July 2012

Income Statement
+ 10.2%
£m July
2012 July
2011
Revenue 1,640 1,565
Operating profit (underlying) 266 241
Interest (15) (13)
Profit before tax (underlying) 251 228
Profit after tax 168
Taxation (60) (60)
+ 4.8%
+ 10.2%
191
Total profit 186 209
Exceptionals/Ventura (5) 41
+ 10.2% + 10.2%
+ 13.7% + 13.7%
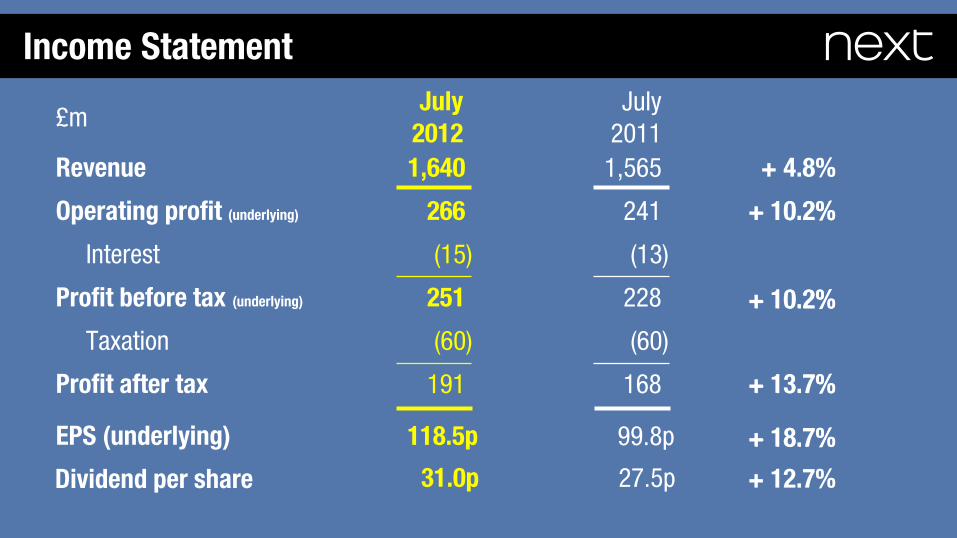
Dividend per share 31.0p 27.5p
EPS (underlying) 118.5p 99.8p
Income Statement
+ 10.2%
£m July
2012 July
2011
Revenue 1,640 1,565
Operating profit (underlying) 266 241
Interest (15) (13)
Profit before tax (underlying) 251 228
Profit after tax 168
Taxation (60) (60)
+ 4.8%
+ 10.2%
191
+ 18.7%
+ 12.7%
+ 10.2% + 10.2%
+ 13.7% + 13.7%
+ 18.7%

Balance Sheet
£m
Fixed assets Goodwill Stocks Debtors Creditors Pension surplus Dividends Buyback / ESOT commitment Net debt Net assets
July 2012
564 45
388 674
(842) 41
(100) (96)
(519) 155
July 2011
582 46
391 608 (817)
48 -
(105) (640) 113
+11% - 1%

Balance Sheet
+11%
£m
Fixed assets Goodwill Stocks Debtors Creditors Pension surplus Dividends Buyback / ESOT commitment Net debt Net assets
July 2012
564 45
388 674
(842) 41
(100) (96)
(519) 155
July 2011
582 46
391 608 (817)
48 -
(105) (640) 113
Directory Debtors
July 2012
£553m + 12% July 2011
£492m Annual Credit Sales Increase
July 2012 + 12% July 2011

£m
600
500
400
300
700
Full Year Debt and Cash Flow Estimate
Jan 2012
575
335 355
Operational
£240m ESOT cover
£20m
Jan 2013e
535
Share buybacks
£180m

Cash Flow
£m
Profit before tax (underlying)
Depreciation / disposals
Capital expenditure
Ventura sale
Working capital / other
Tax paid
ESOT
Share buybacks
Net cash flow
July 2012
251
63
(38)
2
(1)
(72)
(37)
(112)
56
July 2011
228
64
(57)
63
(67)
(68)
4
(188)
(110)
Dividends paid - (89)

Cash Flow
£m
Profit before tax (underlying)
Depreciation / disposals
Capital expenditure
Ventura sale
Working capital / other
Tax paid
ESOT
Share buybacks
Net cash flow
July 2012
251
63
(38)
2
(1)
(72)
(37)
(112)
56
July 2011
228
64
(57)
63
(67)
(68)
4
(188)
(110)
Dividends paid - (89)
2012/13 £105m Warehouse & other
New stores
Refit & other
Extensions
2011/12 £126m
£27m
£14m
£16m
£48m £32m
£13m
£19m
£62m

- 4.5% - 4.8%
- 3.4% - 3.4%
Shares in issue
Gross Net of ESOT
July 2011 173m 167m
July 2012 165m 159m
Year on year
Year on year
Jan 2013e 163m 158m

Retail

Retail : Sales Analysis
Sales from new space
Average net space growth 5.7%
Sales growth from net space 3.7%
Return on space 65%
£m July
2012 July
2011
Revenue (statutory sales) 1,009.9 1,008.2 +0.2%
Operating profit 122.7 122.5

Retail Space Expansion
Stores Sq. Ft.
New 1 9
Closed (3) (20)
Re-sites & extensions (7) - 69
Home stand-alone 2 31 July 2012 536 6,564
July 2011 532 6,256
Jan 2012 536 6,475
Jan 2013e 539 6,725 + 250k sq ft + 3.9%
+ 4.9%
000’s

Retail Space Expansion
New store performance
Sales v target
Mainline + 15%
Home + 6%
Total + 12%
Payback (months)
16
23
19
Store profit
23%
19%
22%
Company avg. store profit
23%
17%
22%

Retail : Profit Analysis
Margin Movement
Bought-in gross margin + 0.5%
Freight and slippage + 0.3%
£m
Revenue (statutory sales) 1,009.9 1,008.2 +0.2%
Operating profit 122.7 122.5 +0.2%
% to revenue 12.2% 12.2%
Achieved gross margin + 0.7%
Markdowns - 0.1%
July
2012 July
2011

Store payroll - 0.1%
Store occupancy - 0.6%
Achieved gross margin + 0.7%
Retail : Profit Analysis
Margin Movement
£m
Revenue (statutory sales) 1,009.9 1,008.2 +0.2%
Operating profit 122.7 122.5 +0.2%
% to revenue 12.2% 12.2%
Margin movement + 0.0%
July
2012 July
2011

Directory

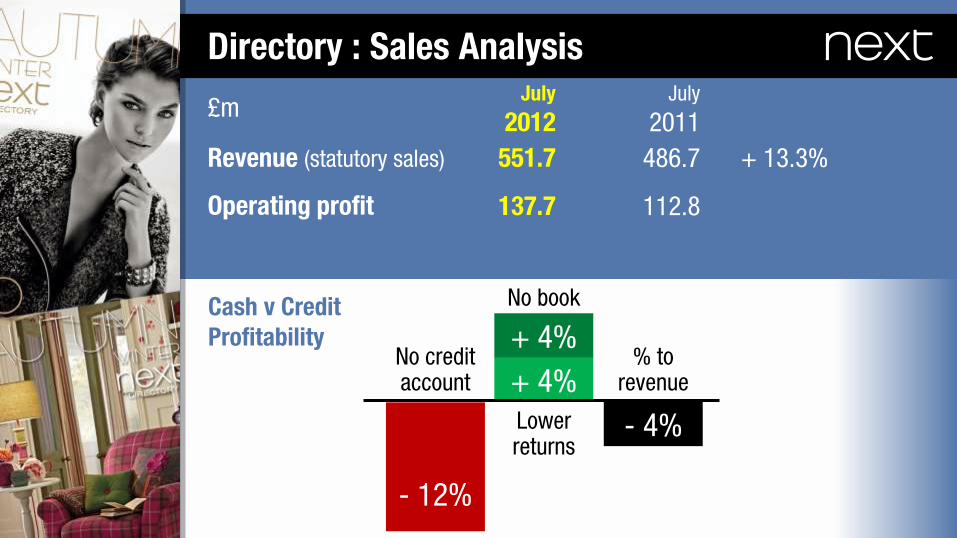
Directory : Sales Analysis
£m
Revenue (statutory sales) 551.7 486.7 + 13.3%
Operating profit 137.7 112.8
July
2012 July
2011
Sales analysis
UK Offers tab + 2.4%
End of season Sale + 1.0%
Sales growth + 13.3%
Contribution to growth
UK full price + 8.0%
International full price + 1.9%

Credit 2.7m +111k + 3.8%
Directory : Sales Analysis
Sales drivers
£m
Revenue (statutory sales) 551.7 486.7 + 13.3%
Operating profit 137.7 112.8
Average active customers 3.3m + 11.7%
Cash 0.6m +231k + 7.9%
Contribution to customer growth
July
2012 July
2011
+342k
Increase
Directory : Sales Analysis
Cash v Credit Profitability
£m
Revenue (statutory sales) 551.7 486.7 + 13.3%
Operating profit 137.7 112.8
July
2012 July
2011
+ 4%
+ 4%
- 12%
- 4% Lower returns
No book
No credit account
% to revenue

Directory : Profit Analysis
Margin movement
£m
Revenue (statutory sales) 551.7 486.7 + 13.3%
Operating profit 137.7 112.8 + 22.1%
% to revenue 25.0% 23.2%
Bought-in gross margin + 1.1%
Freight and slippage + 0.2%
Achieved gross margin + 0.8%
Commission received + 0.3%
Markdowns - 0.8%
July
2012 July
2011

Directory : Profit Analysis
Margin movement
£m
Revenue (statutory sales) 551.7 486.7 + 13.3%
Operating profit 137.7 112.8 + 22.1%
% to revenue 25.0% 23.2%
Achieved gross margin + 0.8% Marketing + 1.0% Catalogue production + 0.9% Warehouse & distribution - 0.6% Central overheads - 0.3%
Margin movement + 1.8%
July
2012 July
2011

Outlook and Plans
The Consumer Economy
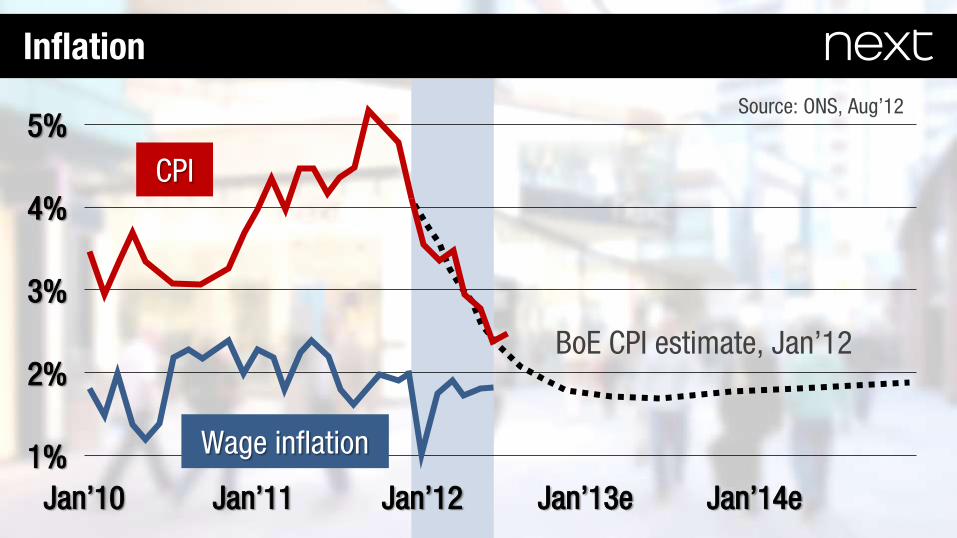
Inflation
5%
4%
2%
1%
3%
Jan’10 Jan’12 Jan’11 Jan’13e Jan’14e
CPI
Source: ONS, Aug’12
Wage inflation
BoE CPI estimate, Jan’12

Employment : Working Hard To Stay Still
Source: ONS, Aug’12 UK 16+, seasonally adjusted, Year on year movement as at March 2012
96k
Public Sector
(278k)
Private Sector
374k Net

September 2012 2011/12
£570m
2012/13 Central Profit Scenario
RETAIL LFLs -£39m
COST INCREASES -£40m
COST SAVINGS +£41m
DIRECTORY +£39m
NEW SPACE +£26m
2012/13
£597m

DIRECTORY
COST SAVINGS
RETAIL SPACE
Our continued focus is on…
Rigorous
Developing
Growing

Rigorous Cost Savings - Managing Manhours
Improved returns
Saving £1.2m

Rigorous Cost Savings - Surplus Management
R to D D to R R to R

Next Day To Store
Developing Directory - UK Deliveries
Sunday Evening
Next Day 10pm Cutoff
Order by 12 for Same Day
80% of the UK
Next Day To Store
October November November

DEVELOPMENT COST £2.4M
Developing Directory - New UK Website

New menus

Improved page turn

Grid view

61 Countries
Last Year This Year (e)
Sales £33m £52m Profit £7m £10m
Developing Directory - International

Now in most of our chosen territories
Developing Directory - International

Development of a new web platform
Developing Directory - International
Tender Types
Duty and Tax
Differential Delivery Charges
Currencies and Prices

0
100
200
300
400
500
600
800
700
0
200
300
400
500
600
700
800
100 Already Open
2012 2013 2014 2012-2017
Growing Retail Space - Five Year Pipeline Sq. Ft.
Total
1.2m
700k
Definite
Probable
Possible
300k
240k

0
100
200
300
400
500
600
800
700
0
200
300
400
500
600
700
800
100 Already Open
2012 2013 2014 2012-2017
Growing Retail Space - Three Year Estimate Sq. Ft.
Total
1.2m
700k
Definite
Probable
Possible
300k
240k
Est
250k 250k
350k?
Est
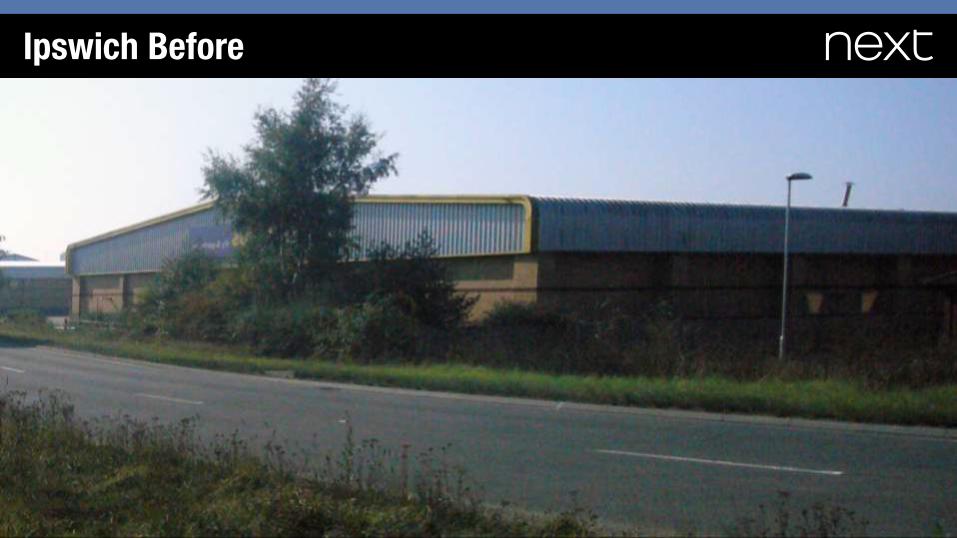
Ipswich Before

Ipswich After

?
?
?
? ? ?
?
?
?
?
?
?
?
?
‘Shoreham-style’ Roll Out 2013-2017
?
Ipswich
2
Camberley 4
Southampton Shoreham
1
Warrington 3
?
Open
Open

?
?
?
? ?
?
?
?
?
?
?
‘Shoreham-style’ Roll Out 2013-2017
Camberley 4
Southampton Shoreham
1
Warrington 3
?
Open
Ipswich
? ? ?
?
2
Open

Outlook for Full Year Sales and Profit

to £575m £620m Profit before tax
Variance to last year + 0.8% Buyback and tax enhancement + 6%
Growth in EPS + 7% Dividend yield + 3%
TSR (Assuming constant PE ratio) + 10%
+ 8.7%
+ 15%
+ 18%
to
to
to
Full Year Brand Sales to + 2.0% + 4.5%
Outlook for 2012/13 - Estimate

15%
9%
2012/13 2013/14 2014/15 0%
2010/11 2011/12
Long Term TSR Assuming dividend at 3% and constant PE ratio
Dividend Yield
EPS Enhancement
Profit Growth
21% 18%
10%
18%


