Housing Profile Mount Waddington Regional District
2012
RDMW
8/1/2012

Mount Waddington Regional District (RDMW)
Total number of private households by household size (2006) - 100% data 4700
1 person 1310 27.87%
2 persons 1675 35.64%
3 + 720 15.32%
Source: Census 2006 (2011 housing data from the census will hopefully be provided in 2013)
Total number of occupied private dwellings by housing tenure - 20% sample data 4685
Owned 3345
Rented 1225
Band housing 115
27.87%
35.64%
15.32%
1 person
2 persons
3 +
Total number of private households by household size 2006
Total number of private households by household size

Source: Census 2006
Total number of occupied private dwellings by condition of dwelling - 20% sample data 4695
Regular maintenance only 2325
Minor repairs 1615
Major repairs 755
Source: Census 2006
2.45%
26.15%
71.40%
Band housing
Rented
Owned
Total number of occupied private dwellings
Total number of occupied private dwellings
16.08%
34.40%
49.52%
Major repairs
Minor repairs
Regular maintenance only
Total number of occupied private dwellings by condition of dwelling
Total number of occupied private dwellings by condition of dwelling

Source: Census 2006
4.69%
6.93%
13.86%
38.81%
10.87%
7.89%
7.89%
5.97%
3.09%
Period of construction, before 1946
Period of construction, 1946 to 1960
Period of construction, 1961 to 1970
Period of construction, 1971 to 1980
Period of construction, 1981 to 1985
Period of construction, 1986 to 1990
Period of construction, 1991 to 1995
Period of construction, 1996 to 2000
Period of construction, 2001 to 2006
Total number of occupied private dwellings by period of construction
Total number of occupied private dwellings by period of construction
Source: Census 2006
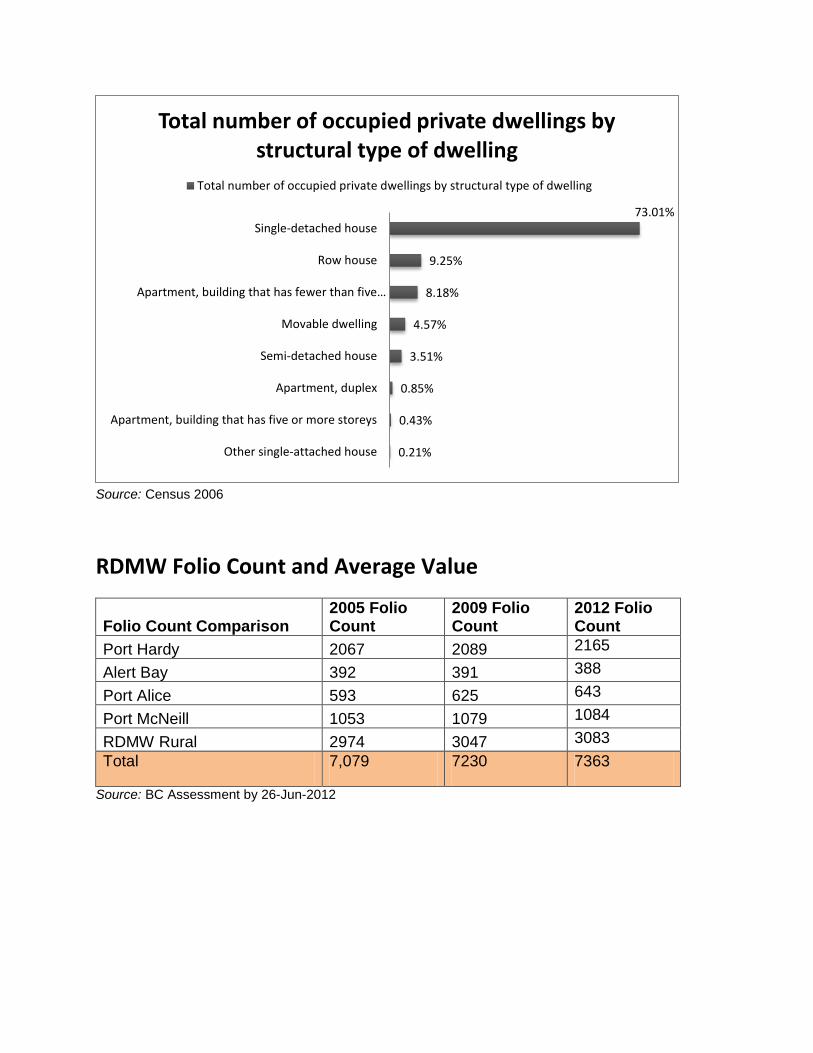
RDMW Folio Count and Average Value
Folio Count Comparison 2005 Folio Count
2009 Folio Count
2012 Folio Count
Port Hardy 2067 2089 2165
Alert Bay 392 391 388
Port Alice 593 625 643
Port McNeill 1053 1079 1084
RDMW Rural 2974 3047 3083
Total 7,079 7230 7363
Source: BC Assessment by 26-Jun-2012
0.21%
0.43%
0.85%
3.51%
4.57%
8.18%
9.25%
73.01%
Other single-attached house
Apartment, building that has five or more storeys
Apartment, duplex
Semi-detached house
Movable dwelling
Apartment, building that has fewer than five…
Row house
Single-detached house
Total number of occupied private dwellings by structural type of dwelling
Total number of occupied private dwellings by structural type of dwelling

2067
392 593
1053
2974
2089
391 625
1079
3047
2165
388 643
1084
3083
Port Hardy Alert Bay Port Alice Port McNeill RDMW Rural
RDMW Folio Count Comparison
2005 Folio Count 2009 Folio Count 2012 Folio Count
0
100000000
200000000
300000000
400000000
500000000
600000000
700000000
800000000
Port Hardy Alert Bay Port Alice Port McNeill RDMW Rural
2005 Total Value
2009 Total Value
2012 Total Value
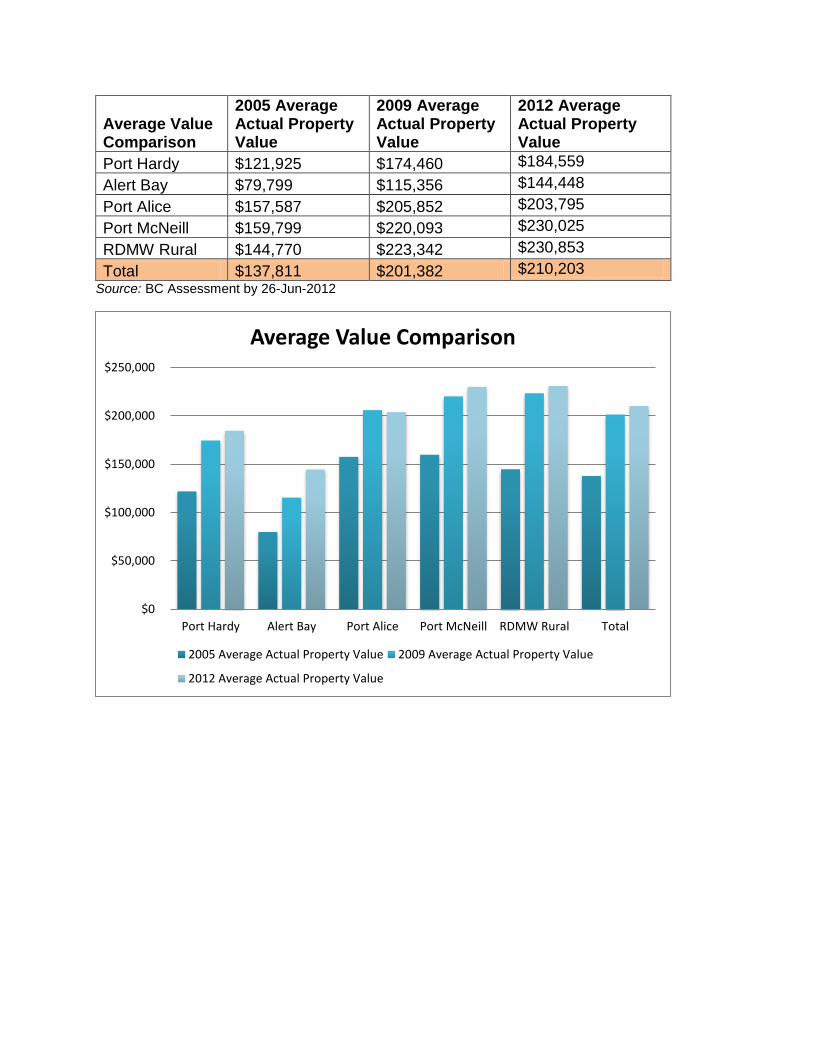
Average Value Comparison
2005 Average Actual Property Value
2009 Average Actual Property Value
2012 Average Actual Property Value
Port Hardy $121,925 $174,460 $184,559
Alert Bay $79,799 $115,356 $144,448
Port Alice $157,587 $205,852 $203,795
Port McNeill $159,799 $220,093 $230,025
RDMW Rural $144,770 $223,342 $230,853
Total $137,811 $201,382 $210,203
Source: BC Assessment by 26-Jun-2012
$0
$50,000
$100,000
$150,000
$200,000
$250,000
Port Hardy Alert Bay Port Alice Port McNeill RDMW Rural Total
Average Value Comparison
2005 Average Actual Property Value 2009 Average Actual Property Value
2012 Average Actual Property Value

51.37%
81.01%
29.32%
43.95%
59.46%
52.53%
Port Hardy
Alert Bay
Port Alice
Port McNeill
RDMW Rural
Total
Average Actual Value Percent Change 2005-2012
Percent Change 2005-2012
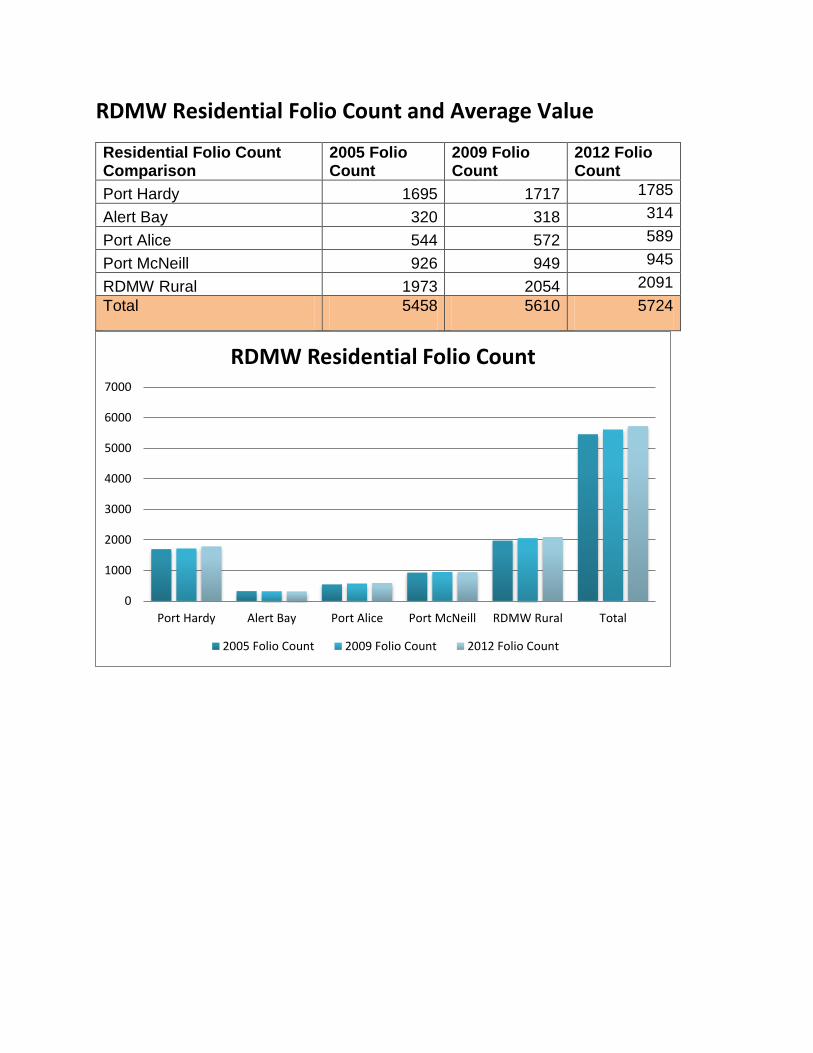
RDMW Residential Folio Count and Average Value
Residential Folio Count Comparison
2005 Folio Count
2009 Folio Count
2012 Folio Count
Port Hardy 1695 1717 1785
Alert Bay 320 318 314
Port Alice 544 572 589
Port McNeill 926 949 945
RDMW Rural 1973 2054 2091
Total 5458 5610 5724
0
1000
2000
3000
4000
5000
6000
7000
Port Hardy Alert Bay Port Alice Port McNeill RDMW Rural Total
RDMW Residential Folio Count
2005 Folio Count 2009 Folio Count 2012 Folio Count

Total Actual Residential Value Comparison
2005 Total Actual Residential Property Value
2009 Total Actual Residential Property Value
2012 Total Actual Residential Property Value
Port Hardy $135,773,300 $232,267,600 $264,032,400
Alert Bay $20,214,000 $31,776,600 $40,868,100
Port Alice $30,739,700 $59,820,700 $66,337,800
Port McNeill $105,413,800 $166,691,500 $168,794,800
RDMW Rural $214,432,279 $392,959,600 $421,484,800
Total $506,573,079 $883,516,000 $961,517,900
$0
$50,000,000
$100,000,000
$150,000,000
$200,000,000
$250,000,000
$300,000,000
$350,000,000
$400,000,000
$450,000,000
Port Hardy Alert Bay Port Alice Port McNeill RDMW Rural
RDMW Total Actual Residential Value
2005 Total Actual Residential Property Value 2009 Total Actual Residential Property Value
2012 Total Actual Residential Property Value
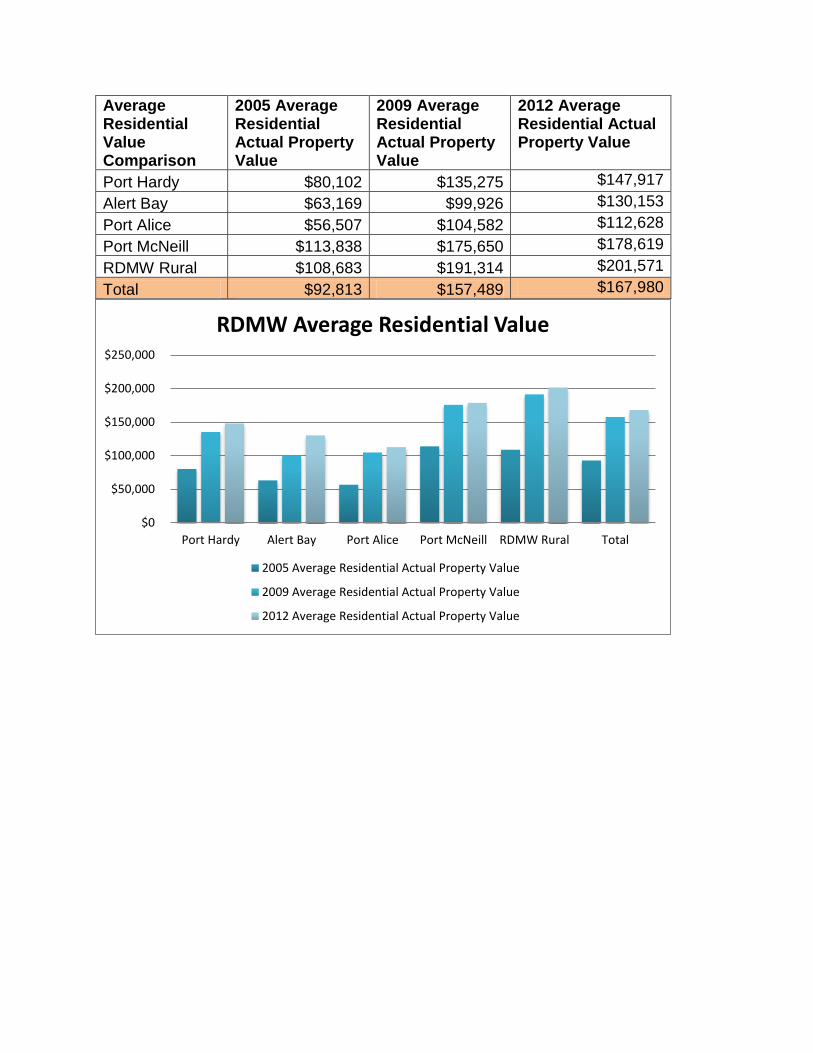
Average Residential Value Comparison
2005 Average Residential Actual Property Value
2009 Average Residential Actual Property Value
2012 Average Residential Actual Property Value
Port Hardy $80,102 $135,275 $147,917
Alert Bay $63,169 $99,926 $130,153
Port Alice $56,507 $104,582 $112,628
Port McNeill $113,838 $175,650 $178,619
RDMW Rural $108,683 $191,314 $201,571
Total $92,813 $157,489 $167,980
$0
$50,000
$100,000
$150,000
$200,000
$250,000
Port Hardy Alert Bay Port Alice Port McNeill RDMW Rural Total
RDMW Average Residential Value
2005 Average Residential Actual Property Value
2009 Average Residential Actual Property Value
2012 Average Residential Actual Property Value

RDMW Rural - Folio Count and Average Value
RDMW Rural Area Folio Count Comparison 2005 Folio Count 2009 Folio Count
2012 Folio Count
Hyde Creek/Nimpkish 529 572 581
Quatsino - North Island 995 1,006 1020
Woss 197 193 194
Coal Harbour 133 134 136
Sointula - Malcolm Island 590 611 621
Cormorant Isl Rural 39 40 39
Knight To Seymour Inlets 491 490 481
Total 2,974 3,046 3072 Source: Assessment BC by 26-Jun-2012
0
200
400
600
800
1000
1200
RDMW Rural Area Folio Count Comparison
2005 Folio Count
2009 Folio Count
2012 Folio Count

RDMW Rural Area Average Value Comparison
2005 Average Value
2009 Average Value
2012 Average Value
Hyde Creek/Nimpkish $214,977 $321,649 $324,284
Quatsino - North Island $145,267 $199,137 $218,448
Woss $63,552 $101,640 $101,297
Coal Harbour $110,638 $209,087 $199,389
Sointula - Malcolm Island $123,028 $224,506 $221,120
Cormorant Isl Rural $112,908 $139,145 $193,810
Knight To Seymour Inlets $138,607 $215,536 $218,226
Total $144,770 $223,342 $230,415 Source: Assessment BC by 26-Jun-2012
$0
$50,000
$100,000
$150,000
$200,000
$250,000
$300,000
$350,000
RDMW Rural Area Average Value Comparison
2005 Average Value
2009 Average Value
2012 Average Value

RDMW – Comparative Folio Count and Average Value
Assessment Area Folio Count Actual - Total Average Value
RD 01 - Alberni-Clayoquot 21,602 $5,372,031,880 $248,682
RD 02 - Bulkly-Nechako 33,066 $4,643,089,457 $140,419
RD 03 - Capital 143,479 $92,246,357,390 $642,926
RD 04 - Cariboo 46,175 $9,497,435,360 $205,683
RD 05 - Fraser Valley 104,536 $42,542,199,061 $406,962
RD 06 - Central Kootenay 50,356 $11,593,356,103 $230,228
RD 07 - Central Okanagan 78,128 $39,252,714,430 $502,415
RD 08 - Columbia-Shuswap 38,085 $1,460,909,752 $38,359
RD 09 - Comox Valley 32,188 $12,295,944,134 $382,004
RD 10 - Cowichan Valley 39,850 $14,912,898,750 $374,226
RD 12 - East Kootenay 49,782 $15,843,438,548 $318,256
RD 14 - Fraser-Fort George 53,178 $12,555,945,537 $236,112
RD 15 - Greater Vancouver 770,518 $681,092,242,779 $883,941
RD 16 - Kootenay-Boundary 30,105 $5,972,176,253 $198,378
RD 17 - Mount Waddington 7,356 $1,547,725,422 $210,403
RD 18 - Nanaimo 71,122 $28,467,608,881 $400,264
RD 19 - North Okanagan 40,354 $15,320,964,301 $379,664
RD 20 - Central Coast 2,059 $275,493,195 $133,800
RD 21 - Okanagan-Similkameen 47,800 $16,794,603,808 $351,352
RD 22 - Peace River 58,168 $13,511,621,686 $232,286
RD 23 - Powell River 12,290 $3,634,686,958 $295,743
RD 24 - Skeena-Queen Charlotte 12,482 $1,883,143,921 $150,869
RD 25 - Kitimat-Stikine 21,290 $3,379,732,766 $158,747
RD 26 - Squamish-Lillooet 32,196 $16,845,482,828 $523,217
RD 27 - Sunshine Coast 20,863 $9,443,372,752 $452,637
RD 28 - Thompson-Nicola 67,029 $21,722,434,425 $324,075
RD 29 - Stikine 1,365 $129,403,340 $94,801
RD 30 - Northern Rockies RM 9,337 $2,222,757,451 $238,059
RD 31 - Strathcona 23,053 $7,115,140,964 $308,643
RD 32 - Fort Nelson IR (Unincorporated) 6 $14,800 $2,467
RD XX - No Regional District 38 $28,688,200 $754,953
Provincial Roll Totals 1,917,856 $1,103,833,932,701 $575,556
Source: Assessment BC by 26-Jun-2009

Please Note: Greater Vancouver Regional District / Metro-Vancouver has been removed from the graph
in order to more accurately represent other regional districts.
0
20000
40000
60000
80000
100000
120000
140000
160000
RD
32
- F
ort
Nea
lso
n IR
(U
nic
orp
ora
ted
)
RD
XX
- N
o R
egio
nal
Dis
tric
t
RD
29
- S
tiki
ne
RD
20
- C
en
tral
Co
ast
RD
17
- M
ou
nt
Wad
din
gto
n
RD
30
- N
ort
her
n R
ock
ies
RM
RD
23
- P
ow
ell R
ive
r
RD
24
- S
keen
a-Q
ue
en C
har
lott
e
RD
27
- S
un
shin
e C
oas
t
RD
25
- K
itim
at-S
tiki
ne
RD
01
- A
lbe
rni-
Cla
yoq
uo
t
RD
31
- S
trat
hco
na
RD
16
- K
oo
ten
ay-B
ou
nd
ary
RD
09
- C
om
ox
Val
ley
RD
26
- S
qu
amis
h-L
illo
oet
RD
02
- B
ulk
ly-N
ech
ako
RD
08
- C
olu
mb
ia-S
hu
swap
RD
10
- C
ow
ich
an V
alle
y
RD
19
- N
ort
h O
kan
agan
RD
04
- C
arib
oo
RD
21
- O
kan
agan
-Sim
ilkam
een
RD
12
- E
ast
Ko
ote
nay
RD
06
- C
en
tral
Ko
ote
nay
RD
14
- F
rase
r-Fo
rt G
eo
rge
RD
22
- P
eac
e R
iver
RD
28
- T
ho
mp
son
-Nic
ola
RD
18
- N
anai
mo
RD
07
- C
en
tral
Oka
nag
an
RD
05
- F
rase
r V
alle
y
RD
03
- C
apit
al
Folio Count

$0
$100,000
$200,000
$300,000
$400,000
$500,000
$600,000
$700,000
$800,000
$900,000
$1,000,000
RD
32
- F
ort
Nea
lso
n IR
…
RD
08
- C
olu
mb
ia-S
hu
swap
RD
29
- S
tiki
ne
RD
20
- C
en
tral
Co
ast
RD
02
- B
ulk
ly-N
ech
ako
RD
24
- S
keen
a-Q
ue
en…
RD
25
- K
itim
at-S
tiki
ne
RD
16
- K
oo
ten
ay-B
ou
nd
ary
RD
04
- C
arib
oo
RD
17
- M
ou
nt
Wad
din
gto
n
RD
06
- C
en
tral
Ko
ote
nay
RD
22
- P
eac
e R
iver
RD
14
- F
rase
r-Fo
rt G
eo
rge
RD
30
- N
ort
her
n R
ock
ies
RM
RD
01
- A
lbe
rni-
Cla
yoq
uo
t
RD
23
- P
ow
ell R
ive
r
RD
31
- S
trat
hco
na
RD
12
- E
ast
Ko
ote
nay
RD
28
- T
ho
mp
son
-Nic
ola
RD
21
- O
kan
agan
-…
RD
10
- C
ow
ich
an V
alle
y
RD
19
- N
ort
h O
kan
agan
RD
09
- C
om
ox
Val
ley
RD
18
- N
anai
mo
RD
05
- F
rase
r V
alle
y
RD
27
- S
un
shin
e C
oas
t
RD
07
- C
en
tral
Oka
nag
an
RD
26
- S
qu
amis
h-L
illo
oet
Pro
vin
cial
Ro
ll To
tals
RD
03
- C
apit
al
RD
XX
- N
o R
egio
nal
Dis
tric
t
RD
15
- G
reat
er V
anco
uve
r
Average Value

Please Note: Greater Vancouver Regional District / Metro-Vancouver and Capital Regional District have
been removed from the graph in order to more accurately represent the other regional districts.
$0
$5,000,000,000
$10,000,000,000
$15,000,000,000
$20,000,000,000
$25,000,000,000
$30,000,000,000
$35,000,000,000
$40,000,000,000
$45,000,000,000
RD
32
- F
ort
Nea
lso
n IR
…
RD
XX
- N
o R
egio
nal
Dis
tric
t
RD
29
- S
tiki
ne
RD
20
- C
en
tral
Co
ast
RD
08
- C
olu
mb
ia-S
hu
swap
RD
17
- M
ou
nt
Wad
din
gto
n
RD
24
- S
keen
a-Q
ue
en C
har
lott
e
RD
30
- N
ort
her
n R
ock
ies
RM
RD
25
- K
itim
at-S
tiki
ne
RD
23
- P
ow
ell R
ive
r
RD
02
- B
ulk
ly-N
ech
ako
RD
01
- A
lbe
rni-
Cla
yoq
uo
t
RD
16
- K
oo
ten
ay-B
ou
nd
ary
RD
31
- S
trat
hco
na
RD
27
- S
un
shin
e C
oas
t
RD
04
- C
arib
oo
RD
06
- C
en
tral
Ko
ote
nay
RD
09
- C
om
ox
Val
ley
RD
14
- F
rase
r-Fo
rt G
eo
rge
RD
22
- P
eac
e R
iver
RD
10
- C
ow
ich
an V
alle
y
RD
19
- N
ort
h O
kan
agan
RD
12
- E
ast
Ko
ote
nay
RD
21
- O
kan
agan
-Sim
ilkam
een
RD
26
- S
qu
amis
h-L
illo
oet
RD
28
- T
ho
mp
son
-Nic
ola
RD
18
- N
anai
mo
RD
07
- C
en
tral
Oka
nag
an
RD
05
- F
rase
r V
alle
y
Actual - Total

RDMW – Building Permits
RDMW building permits issued has changed over time. This is the breakdown of the
different types of building permits.
(in $ 000) 2003 2004 2005 2006 2007 2008 2009 2010 2011
Residential 960 1,132 1,816 2,192 1,903 3,010 2,579 3,760 984
Industrial 50 45 329 - 55 612 550 1,822 325
Commercial 67 353 1,354 360 5,062 1,892 1,690 1,482 570
Institutional and Gov’t
17 25 55 86 2,407 13 2,393 - 1,215
Total 1,094 1,555 3,554 2,638 9,427 5,527 7,212 7,064 3,094
Please Note: The rural areas within the RDMW do not require building permits. As such, these numbers
only reflect the development of the municipalities. Also, the spike in permits in 2010 is due to
condominium conversions rather than the creation of new developments.
2003 2004 2005 2006 2007 2008 2009 2010 2011
Residential (total # of units)
5 2 10 9 7 4 7 17 6
Residential (# of single dwelling units)
4 2 10 8 2 4 7 4 3
Residential (# of row dwelling units)
1 - - - - - - 6 -
Residential (# of apartment units)
- - - - 5 - - 6 -
Source: BC Stats
0
1000
2000
3000
4000
5000
6000
7000
8000
9000
10000
2003 2004 2005 2006 2007 2008 2009 2010 2011
Building Permits 2003-2011
Residential Industrial Commercial Institutional and Gov’t

RDMW – Demographics and Housing
The demand for housing is influenced by a number of factors that are both demographic and economic in nature. On the demographic side, the changing age structure of the population and the composition of households will influence housing requirements. Type 2011
Population 2006 Population
Percent Growth 2006-2011
Occupied Private Dwelling
2006 Area Sq. km
Mount Waddington
RD 11,901 11651 4875 20,288.19
Alert Bay VL 445 556 214 1.78
Port Alice VL 805 821 412 7.65
Port Hardy DM1 4008 3,822 1752 40.81
Port McNeill T 2505 2,623 1005 7.74
Indian Reserves
IR 2,229 2,083 616 46.09
Mount Waddington A
RDA 2052 1,051 706 12,737.46
Mount Waddington B
RDA 96 150 56 2,593.54
Mount Waddington C
RDA 1718 736 606 1,509.91
Mount Waddington D
RDA 272 304 124 3,343.23
Source: BC Stats and RDMW
1DM- District Municipality, RD-Regional District, VL-Village, and T-Town
4,702
259
392
1,594
1,026
475
453
61
303
139
Mount Waddington
Alert Bay
Port Alice
Port Hardy
Port McNeill
Indian Reserves
Mount Waddington A
Mount Waddington B
Mount Waddington C
Mount Waddington D
Occupied Private Dwellings (2006)
RDMW

Source2: BC Stats
From 2006 to 2036, the percentage of people 65+ is projected to increase from 8.32%
to 28.92% in Mount Waddington Regional District. In 2006, there were 995 people 65
and more years old, by 2036, it becomes 2997.
2 Figures for 2006-2036 are based on projection data provided by Angelo Cocco, the Director of Demographic
Analysis at BC Stats.
Total Population, -13.38%
Households, 3.50%
Pop. 65+, 201.21%
Avg. Household Size, - 0.24%
-50.00%
0.00%
50.00%
100.00%
150.00%
200.00%
250.00%
20
07
20
08
20
09
20
10
20
11
20
12
20
13
20
14
20
15
20
16
20
17
20
18
20
19
20
20
20
21
20
22
20
23
20
24
20
25
20
26
20
27
20
28
20
29
20
30
20
31
20
32
20
33
20
34
20
35
20
36
Projected percentage Changes in Total Population, Population 65+, Household Size, and Number of
Households in Mount Waddington Regional District (2001-2036)

Projected Population Change by Age in Mount Waddington Regional
District
Source
3: BC Stats
3 same source as reference # 5, provided by Angelo Cocco
-7.86%
-11.31%
18.67%
-33.10%
-23.16%
25.48%
88.79%
63.28%
40.38%
-8.21%
-4.88%
-13.91%
20.79%
-32.71%
-21.48%
33.54%
111.96%
136.99%
-8.44%
-6.74%
-2.27%
-12.61%
27.13%
-30.37%
-18.30%
44.70%
205.20%
-100.00% -50.00% 0.00% 50.00% 100.00% 150.00% 200.00% 250.00%
0-14
15-24
25-34
35-44
45-54
55-64
65-74
75-84
85+
2026-2036 2016-2026 2006-2016

Estimated and Projected Percentages of Regional District Populations Consisting of People 65 and More Years Old (2001 - 2036)
2001 2036
Okanagan-Similkameen 25.29% 33.93%
Sunshine Coast 18.64% 32.87%
Powell River 16.50% 31.46%
Kootenay Boundary 18.31% 30.87%
Stikine 7.69% 29.59%
Capital 17.46% 28.60%
Columbia-Shuswap 16.70% 28.32%
Mount Waddington 5.70% 28.05%
East Kootenay 12.64% 27.99%
Nanaimo 19.29% 27.87%
Cowichan Valley 16.61% 27.05%
North Okanagan 17.21% 26.68%
Central Kootenay 15.90% 26.55%
Cariboo 10.46% 26.34%
Comox Valley 15.73% 25.96%
Skeena-Queen Charlotte 7.76% 25.64%
Strathcona 10.39% 25.41%
Alberni-Clayoquot 13.75% 25.34%
Kitimat-Stikine 7.46% 25.20%
Central Okanagan 18.07% 25.16%
Bulkley-Nechako 8.02% 24.87%
Thompson-Nicola 12.49% 24.18%
British Columbia 13.22% 23.70%
Fraser-Fort George 7.13% 23.49%
Greater Vancouver 11.72% 22.10%
Central Coast 7.31% 21.23%
Fraser Valley 13.77% 20.64%
Squamish-Lillooet 6.41% 18.48%
Peace River 7.74% 18.21%
Northern Rockies 3.00% 17.85%

25.29%
18.64%
16.50%
18.31%
7.69%
17.46%
16.70%
5.70%
12.64%
19.29%
16.61%
17.21%
15.90%
10.46%
15.73%
7.76%
10.39%
13.75%
7.46%
18.07%
8.02%
12.49%
13.22%
7.13%
11.72%
7.31%
13.77%
6.41%
7.74%
3.00%
33.93%
32.87%
31.46%
30.87%
29.59%
28.60%
28.32%
28.05%
27.99%
27.87%
27.05%
26.68%
26.55%
26.34%
25.96%
25.64%
25.41%
25.34%
25.20%
25.16%
24.87%
24.18%
23.70%
23.49%
22.10%
21.23%
20.64%
18.48%
18.21%
17.85%
Okanagan-Similkameen
Sunshine Coast
Powell River
Kootenay-Boundary
Stikine
Capital
Columbia-Shuswap
Mount Waddington
East Kootenay
Nanaimo
Cowichan Valley
North Okanagan
Central Kootenay
Cariboo
Comox Valley
Skeena-Queen Charlotte
Strathcona
Alberni-Clayoquot
Kitimat-Stikine
Central Okanagan
Bulkley-Nechako
Thompson-Nicola
British Columbia
Fraser-Fort George
Greater Vancouver
Central Coast
Fraser Valley
Squamish-Lillooet
Peace River
Northern Rockies
Estimated and Projected Percentages of Regional District Populations Consisting of
People 65 and More Years Old (2001 - 2036)
2001 2036
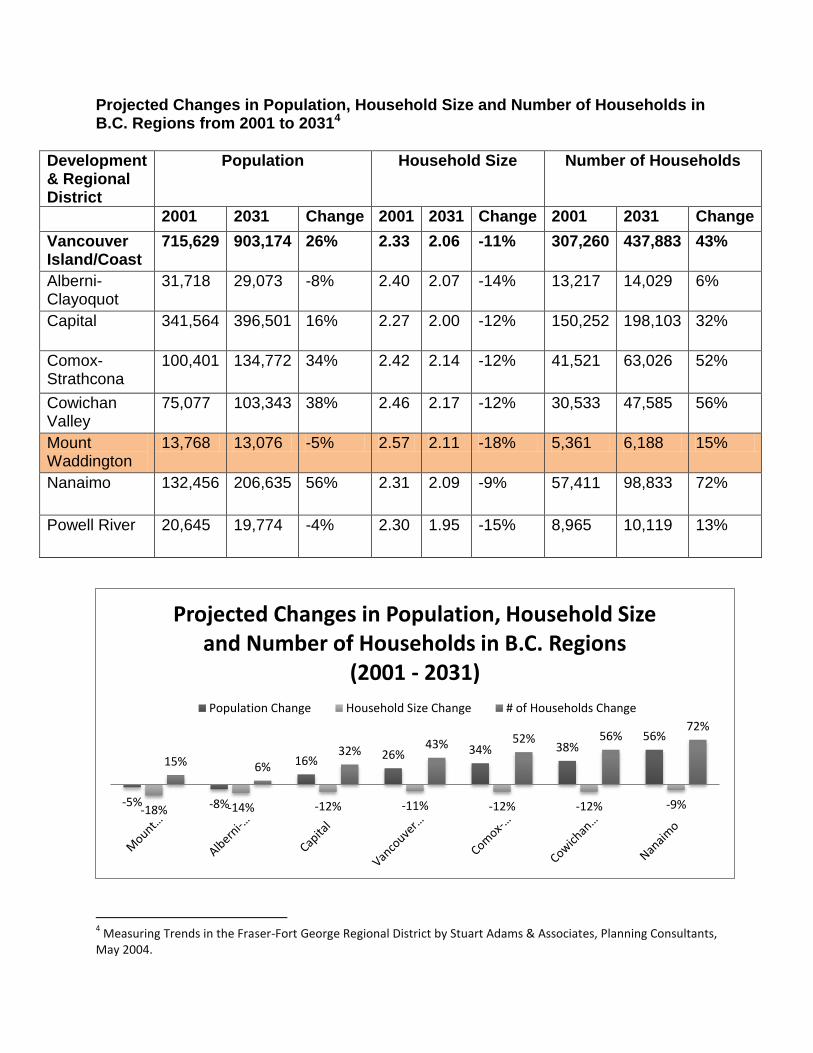
Projected Changes in Population, Household Size and Number of Households in B.C. Regions from 2001 to 20314
Development & Regional District
Population Household Size Number of Households
2001 2031 Change 2001 2031 Change 2001 2031 Change
Vancouver Island/Coast
715,629 903,174 26% 2.33 2.06 -11% 307,260 437,883 43%
Alberni-Clayoquot
31,718 29,073 -8% 2.40 2.07 -14% 13,217 14,029 6%
Capital 341,564 396,501 16% 2.27 2.00 -12% 150,252 198,103 32%
Comox-Strathcona
100,401 134,772 34% 2.42 2.14 -12% 41,521 63,026 52%
Cowichan Valley
75,077 103,343 38% 2.46 2.17 -12% 30,533 47,585 56%
Mount Waddington
13,768 13,076 -5% 2.57 2.11 -18% 5,361 6,188 15%
Nanaimo 132,456 206,635 56% 2.31 2.09 -9% 57,411 98,833 72%
Powell River 20,645 19,774 -4% 2.30 1.95 -15% 8,965 10,119 13%
4 Measuring Trends in the Fraser-Fort George Regional District by Stuart Adams & Associates, Planning Consultants,
May 2004.
-5% -8%
16% 26% 34% 38% 56%
-18% -14% -12% -11% -12% -12% -9%
15% 6% 32%
43% 52% 56% 72%
Projected Changes in Population, Household Size and Number of Households in B.C. Regions
(2001 - 2031)
Population Change Household Size Change # of Households Change
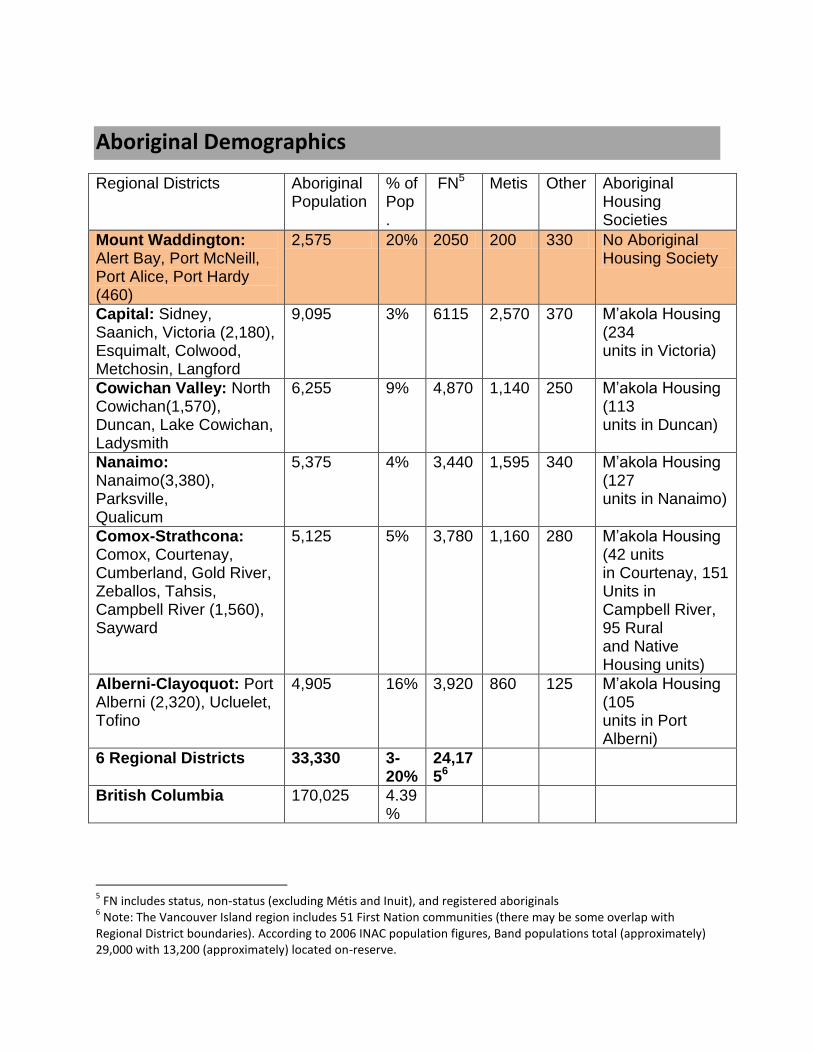
Aboriginal Demographics
Regional Districts Aboriginal Population
% of Pop.
FN5 Metis Other Aboriginal Housing Societies
Mount Waddington: Alert Bay, Port McNeill, Port Alice, Port Hardy (460)
2,575 20% 2050 200 330 No Aboriginal Housing Society
Capital: Sidney, Saanich, Victoria (2,180), Esquimalt, Colwood, Metchosin, Langford
9,095 3% 6115 2,570 370 M’akola Housing (234 units in Victoria)
Cowichan Valley: North Cowichan(1,570), Duncan, Lake Cowichan, Ladysmith
6,255 9% 4,870 1,140 250 M’akola Housing (113 units in Duncan)
Nanaimo: Nanaimo(3,380), Parksville, Qualicum
5,375 4% 3,440 1,595 340 M’akola Housing (127 units in Nanaimo)
Comox-Strathcona: Comox, Courtenay, Cumberland, Gold River, Zeballos, Tahsis, Campbell River (1,560), Sayward
5,125 5% 3,780 1,160 280 M’akola Housing (42 units in Courtenay, 151 Units in Campbell River, 95 Rural and Native Housing units)
Alberni-Clayoquot: Port Alberni (2,320), Ucluelet, Tofino
4,905 16% 3,920 860 125 M’akola Housing (105 units in Port Alberni)
6 Regional Districts 33,330 3-20%
24,1756
British Columbia 170,025 4.39%
5 FN includes status, non-status (excluding Métis and Inuit), and registered aboriginals
6 Note: The Vancouver Island region includes 51 First Nation communities (there may be some overlap with
Regional District boundaries). According to 2006 INAC population figures, Band populations total (approximately) 29,000 with 13,200 (approximately) located on-reserve.
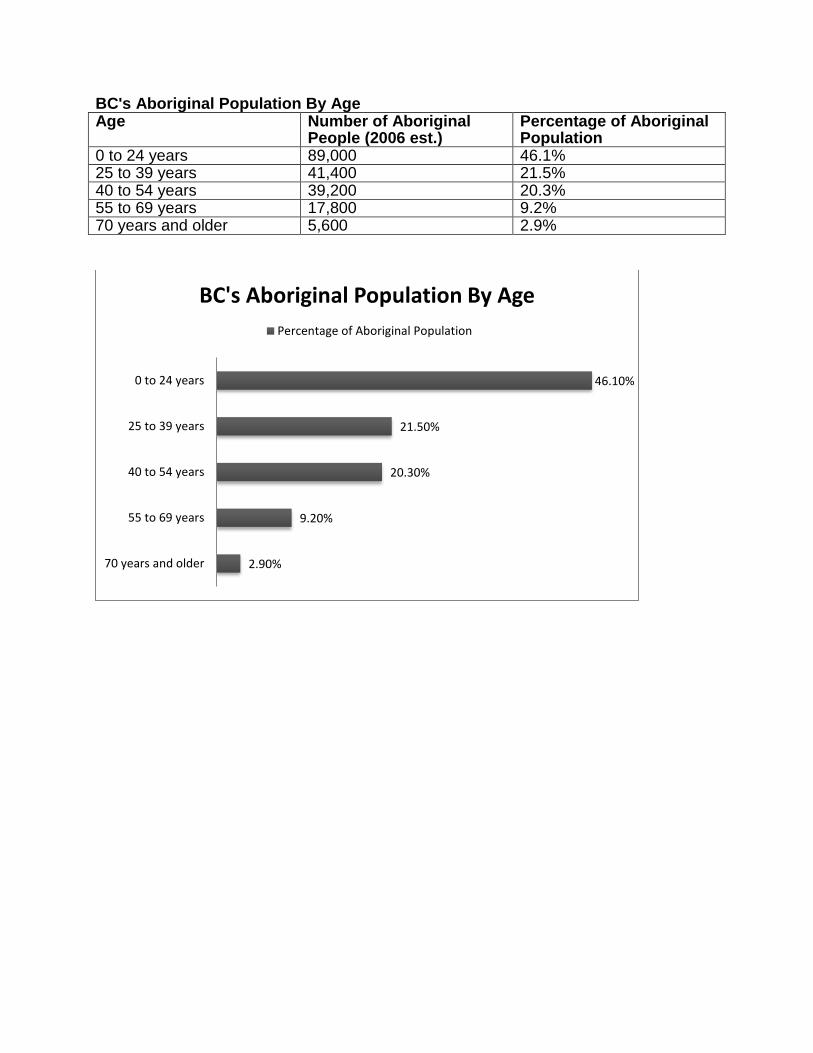
BC's Aboriginal Population By Age Age Number of Aboriginal
People (2006 est.) Percentage of Aboriginal Population
0 to 24 years 89,000 46.1% 25 to 39 years 41,400 21.5% 40 to 54 years 39,200 20.3% 55 to 69 years 17,800 9.2% 70 years and older 5,600 2.9%
2.90%
9.20%
20.30%
21.50%
46.10%
70 years and older
55 to 69 years
40 to 54 years
25 to 39 years
0 to 24 years
BC's Aboriginal Population By Age
Percentage of Aboriginal Population

North Island Area 7- Buyer Profile8 The closest the Mount Waddington Region can get to a real estate industry buyer profile is
through the use of Vancouver Island Real Estate Board (VIREB) data regions, but the volume
and geography of the data provided would not be considered statistically significant or wholly
representative of local sales year on year. It is, however, worthy of note and inclusion where
relevant for contextual purposes.
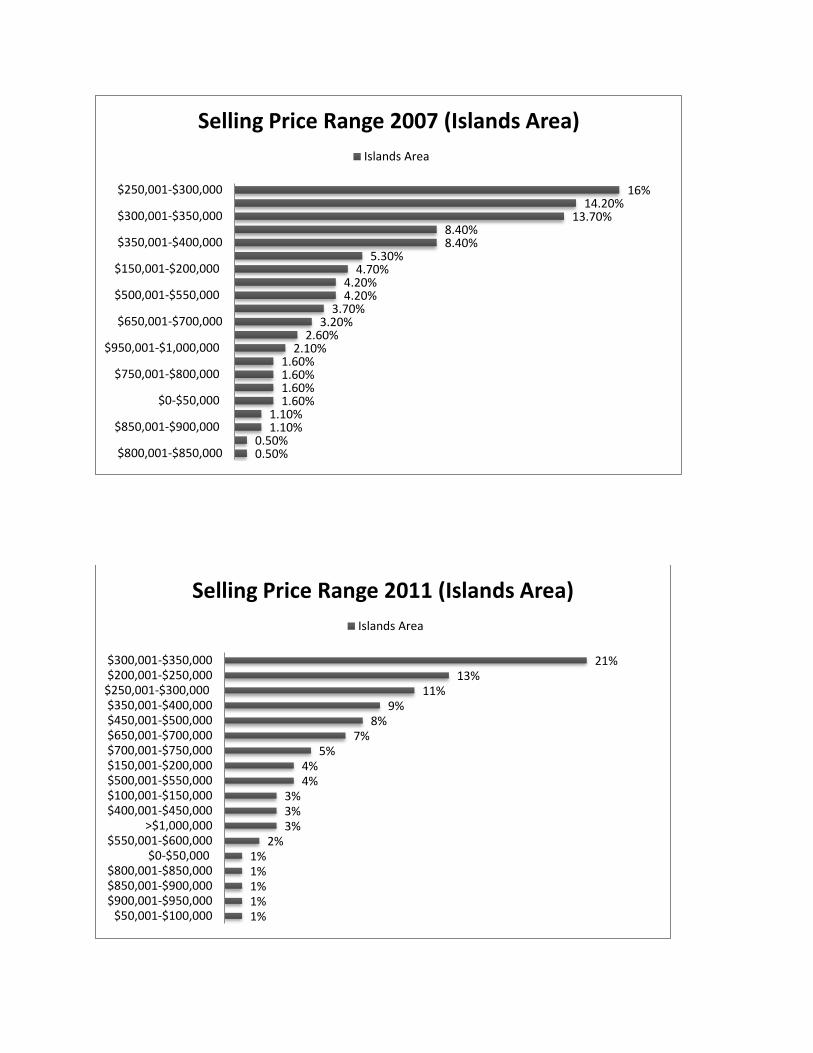
In 2011, The TOP THREE categories were $50,001-$100,000 (22%), followed by $150,001-
$200,000 (18%) and $200,001-$250,000 (15%). for North Island Area. The TOP THREE
categories for Islands Area were $300,001-$350,000 (21%), followed by $200,001-$250,000
(13%) and $250,001-$300,000 (11%).
Selling Price Range 2011
North Island Area Islands Area9
Frequency Percent Frequency Percent $50,001-$100,000 26 22% $300,001-$350,000 20 21%
$150,001-$200,000 21 18% $200,001-$250,000 12 13%
$200,001-$250,000 18 15% $250,001-$300,000 11 11% $100,001-$150,000 17 14% $350,001-$400,000 9 9% $0-$50,000 17 14% $450,001-$500,000 8 8% $250,001-$300,000 11 9% $650,001-$700,000 7 7% $300,001-$350,000 3 3% $700,001-$750,000 5 5% $350,001-$400,000 2 2% $150,001-$200,000 4 4%
$700,001-$750,000 1 1% $500,001-$550,000 4 4% $500,001-$550,000 1 1% $100,001-$150,000 3 3% $450,001-$500,000 1 1% $400,001-$450,000 3 3% $400,001-$450,000 1 1% >$1,000,000 3 3%
$550,001-$600,000 2 2% $0-$50,000 1 1% $800,001-$850,000 1 1% $850,001-$900,000 1 1% $900,001-$950,000 1 1% $50,001-$100,000 1 1% Total # of responses 119 96 Source: 2011 VIREB Buyer Profile
7 North Island Area in this profile refers to Port Hardy, Coal Harbour, Port McNeill, Hyde Creek, Port Alice, Sayward,
Zeballos, Tahsis and Gold River. 8 Source: 2007 VIREB Buyer Profile
9 Islands Area includes Cormorant Island, Malcolm Island, DeCourcey Island, Denman Island, Discovery Islands,
Quadra, Cortez, Hernando, Read, Maurelle, Sonora, East Thurlow, West Thurlow, Stuart, East Redonda, West Redonda, Rendezous, Gabriola Island, Galiano Island, Hornby Island, Jedediah Island, Kuper Island, Lasqueti Island, Mayne Island, Mudge Island, Newcastle Island, Pender Islands, North/South, Protection Island, Prevost Island, Ruxton Island, Saltspring Island, Saturna Island, Stubbs Island, Savary Island, Texada Island and Thetis Island.

0.50%
0.50%
1.10%
1.10%
3.70%
6.80%
8.90%
9.50%
17%
25%
26%
$500,001-$550,000
$450,001-$500,000
$400,001-$450,000
$350,001-$400,000
$300,001-$350,000
$250,001-$300,000
$0-$50,000
$200,001-$250,000
$100,001-$150,000
$50,001-$100,000
$150,001-$200,000
Selling Price Range 2007 (North Island Area)
North Island Area
22%
18%
15%
14%
14%
9%
3%
2%
1%
1%
1%
1%
$50,001-$100,000
$150,001-$200,000
$200,001-$250,000
$100,001-$150,000
$0-$50,000
$250,001-$300,000
$300,001-$350,000
$350,001-$400,000
$700,001-$750,000
$500,001-$550,000
$450,001-$500,000
$400,001-$450,000
Selling Price Range 2011 (North Island Area)
North Island Area
0.50% 0.50%
1.10% 1.10%
1.60% 1.60% 1.60% 1.60%
2.10% 2.60%
3.20% 3.70%
4.20% 4.20%
4.70% 5.30%
8.40% 8.40%
13.70% 14.20%
16%
$800,001-$850,000
$850,001-$900,000
$0-$50,000
$750,001-$800,000
$950,001-$1,000,000
$650,001-$700,000
$500,001-$550,000
$150,001-$200,000
$350,001-$400,000
$300,001-$350,000
$250,001-$300,000
Selling Price Range 2007 (Islands Area)
Islands Area
21% 13%
11% 9%
8% 7%
5% 4% 4%
3% 3% 3%
2% 1% 1% 1% 1% 1%
$300,001-$350,000$200,001-$250,000
$250,001-$300,000$350,001-$400,000$450,001-$500,000$650,001-$700,000$700,001-$750,000$150,001-$200,000$500,001-$550,000$100,001-$150,000$400,001-$450,000
>$1,000,000$550,001-$600,000
$0-$50,000$800,001-$850,000$850,001-$900,000$900,001-$950,000
$50,001-$100,000
Selling Price Range 2011 (Islands Area)
Islands Area

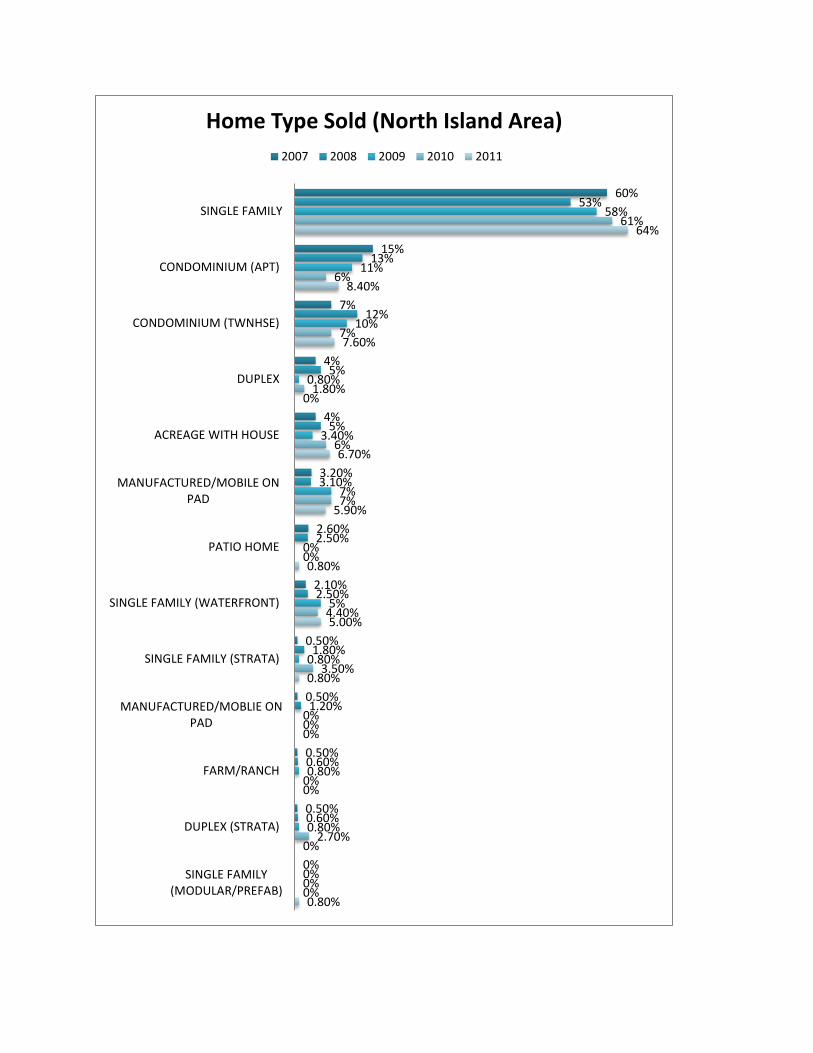
Home Type
The TOP THREE home types were SINGLE FAMILY (64%), CONDOMINIUM (APT) (8.4%),
and CONDOMINIUM (TWNHSE) (7.6%).
North Island Area 2007 2011
Home Type Frequency Percent Percent
SINGLE FAMILY 114 60% 64%
CONDOMINIUM (APT) 29 15% 8.4%
CONDOMINIUM
(TWNHSE) 14 7% 7.6%
DUPLEX 7 4% 0%
ACREAGE WITH
HOUSE 7 4% 6.7%
MANUFACTURED/MO
BILE ON PAD 6 3.2% 5.9%
PATIO HOME 5 2.6% 0.8%
SINGLE FAMILY
(WATERFRONT) 4 2.1% 5.0%
SINGLE FAMILY
(STRATA) 1 0.5% 0.8%
MANUFACTURED/MO
BLIE ON PAD 1 0.5% 0%
FARM/RANCH 1 0.5% 0%
DUPLEX (STRATA) 1 0.5% 0%
SINGLE FAMILY
(MODULAR/PREFAB) 0 0% 0.8%
Total number of
responses= 190 119
Islands Area 2007 2011
Home Type Frequency Percent Percent
SINGLE FAMILY 107 56% 50%
ACREAGE WITH HOUSE
49 26% 27%
SINGLE FAMILY (WATERFRONT)
23 12% 18%
CONDOMINIUM (APT) 8 4% 2%
SINGLE FAMILY (STRATA)
2 1.1% NA
DUPLEX 1 0.5% 1%
PATIO HOME NA NA 1%
MANUFACTURED/MOBILE ON PAD
NA NA 1%
Total number of responses=
190 96
Source: 2007 and 2011 VIREB Buyer Profile
60%
15%
7%
4%
4%
3.20%
2.60%
2.10%
0.50%
0.50%
0.50%
0.50%
0%
53%
13%
12%
5%
5%
3.10%
2.50%
2.50%
1.80%
1.20%
0.60%
0.60%
0%
58%
11%
10%
0.80%
3.40%
7%
0%
5%
0.80%
0%
0.80%
0.80%
0%
61%
6%
7%
1.80%
6%
7%
0%
4.40%
3.50%
0%
0%
2.70%
0%
64%
8.40%
7.60%
0%
6.70%
5.90%
0.80%
5.00%
0.80%
0%
0%
0%
0.80%
SINGLE FAMILY
CONDOMINIUM (APT)
CONDOMINIUM (TWNHSE)
DUPLEX
ACREAGE WITH HOUSE
MANUFACTURED/MOBILE ONPAD
PATIO HOME
SINGLE FAMILY (WATERFRONT)
SINGLE FAMILY (STRATA)
MANUFACTURED/MOBLIE ONPAD
FARM/RANCH
DUPLEX (STRATA)
SINGLE FAMILY(MODULAR/PREFAB)
Home Type Sold (North Island Area)
2007 2008 2009 2010 2011

56%
26%
12%
4%
1.10%
0.50%
0
0
51%
35%
12%
0
1%
0
0
0
53%
33%
13%
1%
0
0
0
0
86%
42%
24%
1%
0
0
0
0
50%
27%
18%
2%
0
1%
1%
1%
SINGLE FAMILY
ACREAGE WITH HOUSE
SINGLE FAMILY (WATERFRONT)
CONDOMINIUM (APT)
SINGLE FAMILY (STRATA)
DUPLEX
PATIO HOME
MANUFACTURED/MOBILE ON PAD
Home Type Sold (Islands Area)
2007 2008 2009 2010 2011

Site Characteristics
The TOP THREE site characteristics were VIEW - OCEAN (52%), VIEW - MOUNTAIN (27%), and WATERFRONT - OCEAN (5%).
North Island Area 2007 2008 2009 2010 2011
Site Characteristics Frequency Percent Percent Percent Percent Percent
VIEW - OCEAN 82 48% 48% 60% 54% 52%
VIEW - MOUNTAIN 63 37% 42% 31% 39% 27% WATERFRONT - OCEAN 12 7% 8% 7% 1% 5% VIEW - CITY 8 5% 0% 0% 0% 0%
WATERFRONT - RIVER/CREEK
3 2% 1% 1% 6% 2%
WATERFRONT - LAKE 1 0.6% 0% 0% 0% 0% VIEW - LAKE 1 0.6% 0% 0% 0% 0%
Total number of responses= 170 83 58 67 64 Source: 2007, 2008, 2009, 2010, and 2011 VIREB Buyer Profile
The TOP THREE site characteristics were WATERFRONT - OCEAN (55%), VIEW – OCEAN (38%), and WATERFRONT – LAKE (5%).
Islands Area 2007 2008 2009 2010 2011
Site Characteristics Frequency Percent Percent Percent Percent Percent
VIEW - OCEAN 57 35% 50% 43% 51% 38%
VIEW - MOUNTAIN 51 31% 3% 7% 3% 2% WATERFRONT - OCEAN 45 27% 47% 47% 42% 55% WATERFRONT - RIVER/CREEK
5 3% 0% 2% 0% 0%
VIEW - LAKE 3 2% 0% 0% 1% 0% VIEW - CITY 2 1% 0% 0% 0% 0% WATERFRONT - LAKE 1 0.6% 0% 2% 3% 5%
Total number of responses= 164 60 60 72 42
Source: 2007, 2008, 2009, 2010, and 2011 VIREB Buyer Profile

48%
37%
7%
5%
2%
0.60%
0.60%
48%
42%
8%
0%
1%
0%
0%
60%
31%
7%
0%
1%
0%
0%
54%
39%
1%
0%
6%
0%
0%
52%
27%
5%
0%
2%
0%
0%
VIEW - OCEAN
VIEW - MOUNTAIN
WATERFRONT - OCEAN
VIEW - CITY
WATERFRONT - RIVER/CREEK
WATERFRONT - LAKE
VIEW - LAKE
Site Characteristics (North Island Area)
2007 2008 2009 2010 2011
35%
31%
27%
3%
2%
1%
0.60%
50%
3%
47%
0%
0%
0%
0%
43%
7%
47%
2%
0%
0%
2%
51%
3%
42%
0%
1%
0%
3%
38%
2%
55%
0%
0%
0%
5%
VIEW - OCEAN
VIEW - MOUNTAIN
WATERFRONT - OCEAN
WATERFRONT - RIVER/CREEK
VIEW - LAKE
VIEW - CITY
WATERFRONT - LAKE
Site Characteristics (Islands Area)
2007 2008 2009 2010 2011
Source: 2007, 2008, 2009, 2010, and 2011 VIREB Buyer Profiles
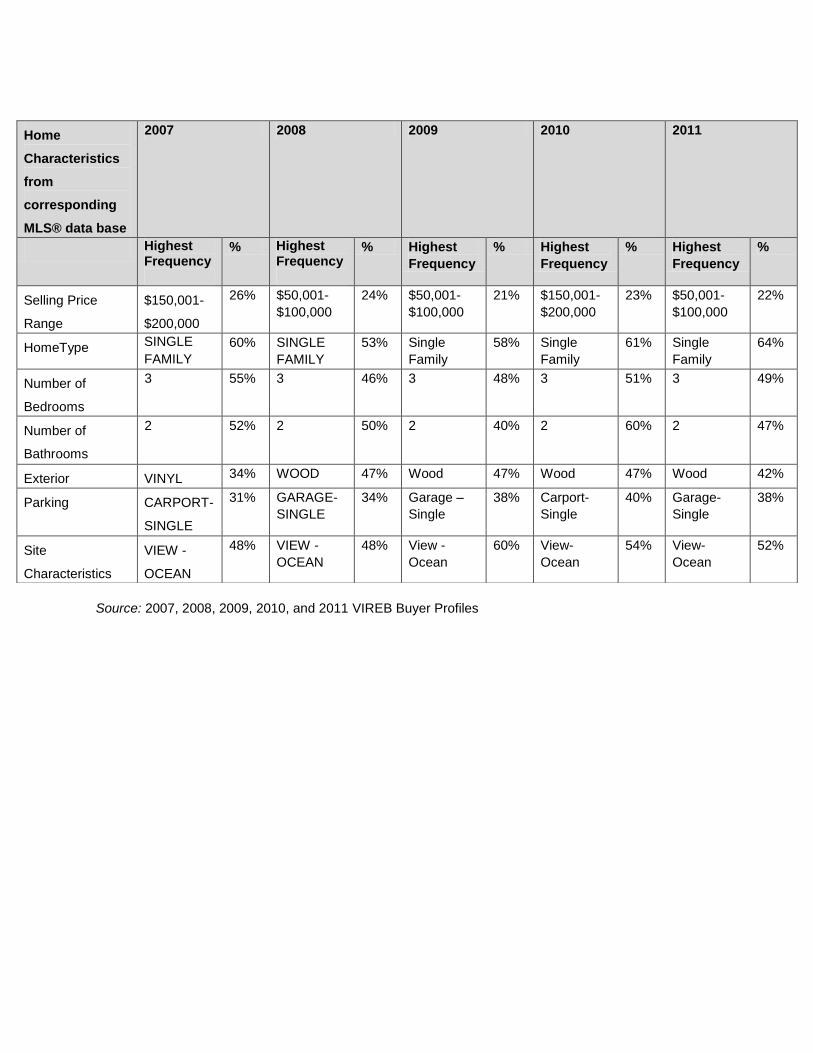
Home
Characteristics
from
corresponding
MLS® data base
2007 2008 2009 2010 2011
Highest Frequency
% Highest Frequency
% Highest
Frequency
% Highest
Frequency
% Highest
Frequency
%
Selling Price
Range
$150,001-
$200,000
26% $50,001-
$100,000
24% $50,001-
$100,000
21% $150,001-
$200,000
23% $50,001-
$100,000
22%
HomeType SINGLE
FAMILY
60% SINGLE
FAMILY
53% Single
Family
58% Single
Family
61% Single
Family
64%
Number of
Bedrooms
3 55% 3 46% 3 48% 3 51% 3 49%
Number of
Bathrooms
2 52% 2 50% 2 40% 2 60% 2 47%
Exterior VINYL 34% WOOD 47% Wood 47% Wood 47% Wood 42%
Parking CARPORT-
SINGLE
31% GARAGE-
SINGLE
34% Garage –
Single
38% Carport-
Single
40% Garage-
Single
38%
Site
Characteristics
VIEW -
OCEAN
48% VIEW -
OCEAN
48% View -
Ocean
60% View-
Ocean
54% View-
Ocean
52%

Islands Area– Buyer Profile10 Buyer Origin For purchasers of residential property, the most common origin, for the Islands area (determined from 20 responses), was Elsewhere on Vancouver Island with a frequency of 20%. When added together, all origins from within BC totalled 85% and from Vancouver Island totalled 45%, which implies BC residents are major consumers of North Island properties, investing in marketing these properties within BC might result in more buyers.
Buyer Origin 2007 2008 2009 2010 2011
Frequency Percent Percent Percent Percent Percent
Elsewhere on
Vancouver Island
4 20% 22% 8% 18% 13%
Within same area 3 15% 11% 28% 18% 25%
Vancouver 3 15% 6% 24% 14% 13% Fraser Valley 3 15% 6% 4% 4% 13% Victoria 2 10% NA 16% 7% NA Other BC 2 10% 11% 16% 14% 6%
Alberta 2 10% 11% NA 11% NA Rest of World 1 5% 11% 4% 4% 13% Ontario 4% 6% Gulf Islands 4% NA Other Canada 4% 13%
Total number of responses=
20 18 25 28 16
Source: 2007 & 2008 VIREB Buyer Profile
10
Survey statistics from VIREB regarding these questions may not have any statistical significance due to the extremely small sample of responses and are not included on this basis. Analysing these findings would therefore not yield responsible or accurate conclusions.

20%
15%
15%
15%
10%
10%
10%
5%
0
0
0
22%
11%
6%
6%
0
11%
11%
11%
0
0
0
8%
28%
24%
4%
16%
16%
0
4%
0
0
0
18%
18%
14%
4%
7%
14%
11%
4%
4%
4%
4%
13%
25%
13%
13%
0
6%
0
13%
6%
0
13%
Elsewhere on Vancouver Island
Within same area
Vancouver
Fraser Valley
Victoria
Other BC
Alberta
Rest of World
Ontario
Gulf Islands
Other Canada
Buyer Origin (Islands Area)
2007 2008 2009 2010 2011

Major Reason for Purchase
The major reason for residential property purchase was for PRINCIPAL RESIDENCE
with a frequency of 88%
Major Reason For Purchase
2007 2008 2009 2010 2011
Frequency Percent Percent Percent Percent Percent
Principal Residence 17 85% 89% 80% 93% 88%
Recreation/Vacation 3 15% 6% 12% 7% 6%
Investment/Rental NA NA 6% 8% NA NA
Other NA NA NA NA NA 6%
Total number of responses=
20 18 25 28 16
Source: 2007, 2008, 2009, 2010, and 2011 VIREB Buyer Profile
85%
15%
0
0
89%
6%
6%
0
80%
12%
8%
0
93%
7%
0
0
88%
6%
0
6%
Principle residence
Recreation/Vacation
Investment/Rental
Other
Major Reason for Purchase (Islands Area)
2007 2008 2009 2010 2011

Time Resident in Community Prior to Purchase
For the Islands area, the “<1 year” category totalled 69%. Hence, most Buyers were new to the community. Time Resident in Community Prior to Purchase
2007 2008 2009 2010 2011
Frequency Percent Percent Percent Percent Percent
<1 14 78% 69% 68% 76% 69%
5 to 10 2 11% 6% 18% 4% 19%
2 to 5 1 6% 6% 5% 8% 0%
10 to 15 1 6% 6% 0% 4% 0%
20+ 0 0% 13% 0% 8% 13%
15 to 20 0 0% 0% 5% 0% 0%
1 to 2 0 0% 0% 5% 0% 0%
Total number of responses 18 16 22 25 16
Source: 2007, 2008, 2009, 2010, 2011 VIREB Buyer Profile It might be tough to sell houses within the local area as most buyers are from other
communities or regions.
78%
11%
6%
6%
0%
0
0
69%
6%
6%
6%
13%
0
0
68%
18%
5%
0%
0%
5%
5%
76%
4%
8%
4%
8%
0
0
69%
19%
0%
0%
13%
0
0
<1
5 to 10
2 to 5
10 to 15
20+
15 to 20
1 to 2
Time Resident in Community Prior to Purchase (Islands Area)
2007 2008 2009 2010 2011

First Time Purchase of Principal Residence (Yes or No)
The majority of purchasers of North Island properties, over time, have not been buying their first home.
First Time Purchase of Principal Residence
2007 2008 2009 2010 2011
Frequency Percent Percent Percent Percent Percent
No 17 100% 94% 84% 96% 86% Yes 0 0% 6% 16% 4% 14%
Total number of
responses=
17 16 19 25 14
Source: 2007, 2008, 2009, 2010, and 2011 VIREB Buyer Profile
100%
94%
84%
96%
86%
0%
6%
16%
4%
14%
2007 2008 2009 2010 2011
First Time Purchase of Principal Residence? (Islands Area)
No Yes

Purchased as Retirement Home (Yes or No)
The frequency of purchasing residential property as a retirement home was 36%.
Purchased as Retirement Home
2007 2008 2009 2010 2011
Frequency Percent Percent Percent Percent Percent
Yes 10 59% 50% 8% 7% 36%
No 7 41% 50% 92% 93% 64%
Total number of
responses=
17 16 12 15 14
Source: 2007, 2008, 2009, 2010, and 2011 VIREB Buyer Profile
How Buyers First Became Aware of Property The TOP THREE ways that buyers became aware of the property in 2007 were Introduced by a REALTOR® (40%), while internet usage totalled 50%, with both Internet- other than mls.ca site and Internet- mls.ca site frequencies at 25%. How Buyers First Became Aware of Property
2007 2008 2009 2010 2011
Frequency Percent Percent Percent Percent Percent
Introduced by a REALTOR®
8 40% 39% 32% 32% 19%
Internet- other than mls.ca site
5 25% 17% NA NA NA
Internet- mls.ca site
5 25% 17% NA NA NA
59% 50%
8% 7%
36%
41% 50%
92% 93%
64%
2007 2008 2009 2010 2011
Purchased as Retirement Home (Islands Area)
Yes No

Newspaper advertisement: Classified Ad
1 5% NA NA NA NA
For Sale Sign 1 5% 11% 8% NA NA Relative or Friend NA NA 6% 4% 4% 13% Other NA NA 11% NA NA NA Internet- REALTOR.ca site
NA NA NA 24% 46% 38%
Internet- other than REALTOR.ca site
NA NA NA 24% 11% 6%
Newspaper advertisement: Real Estate Tabloid
NA NA NA 4% NA 6%
MLS® Catalogue NA NA NA 4% 7% 19%
Total number of responses=
20 18 25 28 16
Source: 2007, 2008, 2009, 2010, and 2011 VIREB Buyer Profile
40%
25%
25%
5%
5%
0
0
0
0
0
0
39%
17%
17%
0
11%
6%
11%
0
0
0
0
32%
0
0
0
8%
4%
0
24%
24%
4%
4%
32%
0
0
0
0
4%
0
46%
11%
0
7%
19%
0
0
0
0
13%
0
38%
6%
6%
19%
Introduced by a REALTOR®
Internet- other than mls.ca site
Internet- mls.ca site
Newspaper advertisement: Classified Ad
For Sale Sign
Relative or Friend
Other
Internet- REALTOR.ca site
Internet- other than REALTOR.ca site
Newspaper advertisement: Real Estate Tabloid
MLS® Catalogue
How Buyers First Became Aware of the Property (Islands Area)
2007 2008 2009 2010 2011
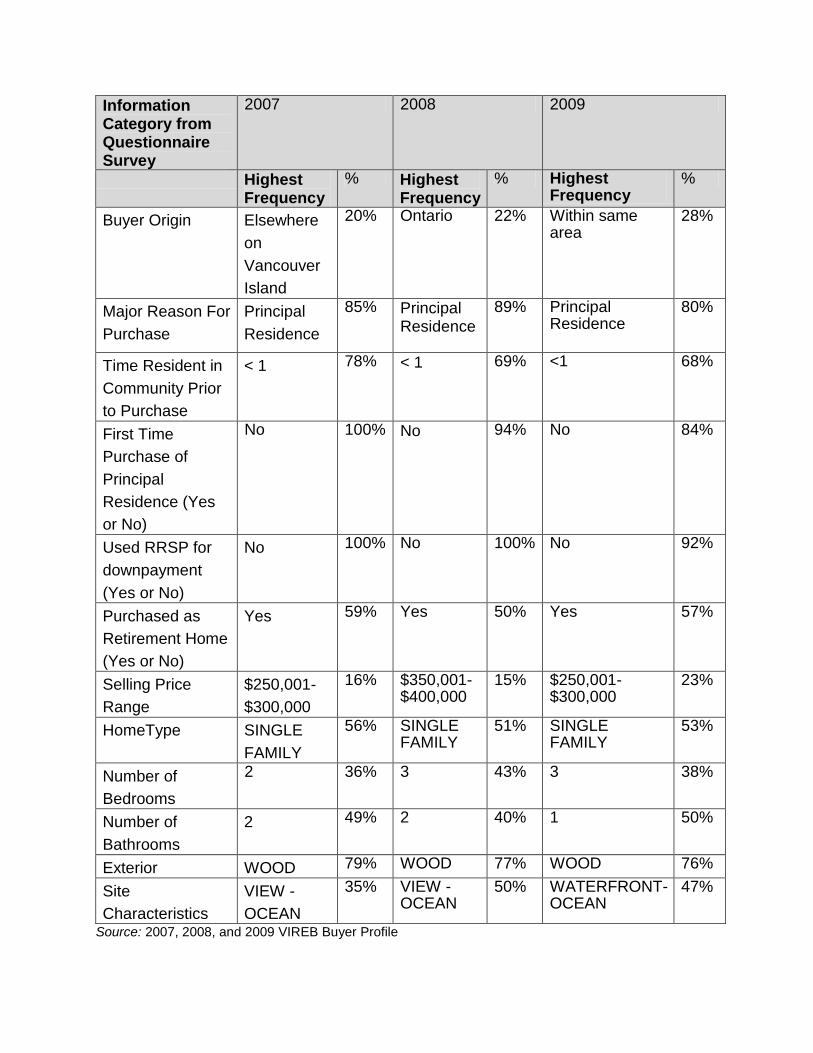
Information Category from Questionnaire Survey
2007 2008 2009
Highest Frequency
% Highest Frequency
% Highest Frequency
%
Buyer Origin Elsewhere
on
Vancouver
Island
20% Ontario 22% Within same area
28%
Major Reason For
Purchase
Principal
Residence
85% Principal Residence
89% Principal Residence
80%
Time Resident in
Community Prior
to Purchase
< 1
78% < 1
69% <1 68%
First Time
Purchase of
Principal
Residence (Yes
or No)
No 100% No
94% No 84%
Used RRSP for
downpayment
(Yes or No)
No 100% No 100% No 92%
Purchased as
Retirement Home
(Yes or No)
Yes 59% Yes 50% Yes 57%
Selling Price
Range
$250,001-
$300,000
16% $350,001-$400,000
15% $250,001-$300,000
23%
HomeType SINGLE
FAMILY
56% SINGLE FAMILY
51% SINGLE FAMILY
53%
Number of
Bedrooms
2 36% 3 43% 3 38%
Number of
Bathrooms
2 49% 2 40% 1 50%
Exterior WOOD 79% WOOD 77% WOOD 76%
Site
Characteristics
VIEW -
OCEAN
35% VIEW - OCEAN
50% WATERFRONT- OCEAN
47%
Source: 2007, 2008, and 2009 VIREB Buyer Profile

Information Category from Questionnaire Survey
2010 2011
Highest Frequency % Highest Frequency %
Buyer Origin Within same area 18% Within same area 25%
Major Reason For
Purchase
Principal Residence 93% Principal Residence 88%
Time Resident in
Community Prior to
Purchase
<1 76% <1 69%
First Time Purchase of
Principal Residence (Yes
or No)
No 96% No 86%
Used RRSP for
downpayment (Yes or No)
No 93% No 86%
Purchased as Retirement
Home (Yes or No)
Yes 56% No 64%
Selling Price Range $200,001-$250,000 14% $300,001-$350,000 21%
HomeType SINGLE FAMILY 56% SINGLE FAMILY 50%
Number of Bedrooms 3 42% 2 40%
Number of Bathrooms 2 40% 2 41%
Exterior WOOD 80% WOOD 74%
Site Characteristics VIEW - OCEAN 51% WATERFRONT - OCEAN
55%
Source: 2010 and 2011 VIREB Buyer Profile
2009 2010 2011
Selling Price Range
Board Area $250,001 - $300,000 17.5% $300,001 - $350,000 16.2% $300,001 - $350,000 16.4%
$300,001 - $350,000 16.3% $250,001 - $300,000 15.6% $250,001 - $300,000 15.2%
$200,001 - $250,000 14.3% $200,001 - $250,000 13.9% $200,001 - $250,000 13.8%
Campbell River
$200,001 - $250,000 27.7% $200,001 - $250,000 25.2% $200,001 - $250,000 27.9%
$250,001 - $300,000 21.3% $250,001 - $300,000 20.0% $250,001 - $300,000 19.3%
$150,001 - $200,000 13.8% $300,001 - $350,000 15.3% $300,001 - $350,000 13.6%
Comox Valley
$300,001 - $350,000 19.9% $300,001 - $350,000 19.2% $300,001 - $350,000 18.8%
$250,001 - $300,000 18.8% $250,001 - $300,000 17.0% $200,001 - $250,000 17.1%

$200,001 - $250,000 17.1% $200,001 - $250,000 16.4% $350,001-$400,000 14.2%
Cowichan Valley
$250,001 - $300,000 15.4% $300,001 - $350,000 17.0% $300,001 - $350,000 16.4%
$300,001 - $350,000 15.2% $250,001 - $300,000 14.4% $250,001 - $300,000 15.1%
$350,001-$400,000 14.4% $350,001-$400,000 13.9% $350,001-$400,000 13.4%
Nanaimo $250,001 - $300,000 18.6% $300,001-$350,000 17.4% $300,001-$350,000 17.1%
$300,001 - $350,000 17.8% $250,001-$300,000 16.5% $250,001-$300,000 15.5%
$200,001 - $250,000 13.2% $350,001-$400,000 14.8% $350,001-$400,000 15.3%
Parksville / Qualicum
$300,001-$350,000 18.6% $350,001-$400,000 16.6% $300,001-$350,000 17.9%
$250,001-$300,000 17.1% $300,001-$350,000 14.4% $250,001-$300,000 15.3%
$350,001-$400,000 14.3% $250,001-$300,000 13.4% $350,001-$400,000 12.6%
Port Alberni / West Coast
$150,001-$200,000 24.9% $150,001-$200,000 22.7% $200,001-$250,000 20.7%
$200,001-$250,000 19.2% $200,001-$250,000 21.5% $150,001-$200,000 20.4%
$100,001-$150,000 16.6% $250,001-$300,000 13.3% $250,001-$300,000 15.2%
North Island $50,001-$100,000 21.2% $150,001-$200,000 23.0% $50,001-$100,000 21.8%
$100,001-$150,000 20.3% $50,001-$100,000 17.7% $150,001-$200,000 17.6%
$200,001-$250,000 16.1% $100,001-$150,000 17.7% $200,001-$250,000 15.1%
Islands $250,001-$300,000 22.9% $200,001-$250,000 13.7% $300,001-$350,000 20.8%
$200,001-$250,000 14.6% $250,001-$300,000 12.4% $200,001-$250,000 12.5%
$350,001-$400,000 14.6% $300,001-$350,000 12.4% $250,001-$300,000 11.5%
Source: 2011 VIREB Buyer Profile


