How Costly is Diversity? Affirmative Action in
Light of Gender Differences in Competitiveness
Muriel Niederle Stanford University and NBER
Carmit Segal
University of Zurich
Lise Vesterlund University of Pittsburgh and NBER
May 23, 2012
Abstract
Affirmative action is often criticized for causing reverse discrimination and lowering the qualifications of those hired under the policy. However the magnitude of such adverse effects depends on whether the best suited candidate is hired absent the policy. Indeed affirmative action may compensate for the distortion discrimination imposes on the selection of candidates. This paper asks whether affirmative action can have a similar corrective impact when qualified individuals fail to apply for a job. We evaluate the effect of introducing a gender quota in an environment where high performing women fail to enter competitions they can win. We show that guaranteeing women equal representation among winners increases their entry. The response exceeds that predicted by the change in probability of winning, and is in part driven by women being more willing to compete against other women. The consequences are substantial as the boost in supply essentially eliminates the anticipated costs of the policy.
We are grateful to the NSF and the Harvard Business School for generous support. We thank Linda Babcock, Rachel Croson and Catherine Eckel for careful comments on earlier versions of this paper. We also thank the following institutions for their hospitality: Institute for Advanced Study at Princeton and the Department of Economics at Harvard (Niederle), Harvard Business School (Segal) and CEBR at Copenhagen Business School (Vesterlund).

1
I. INTRODUCTION
Affirmative action has been hotly debated since its introduction following the passage of the
landmark Civil Rights Act of 1964. These debates have resulted in some states banning the
policy. The main arguments against affirmative action are that it results in reverse discrimination
and lowers the qualifications of those selected under the policy. While the policy is costly when
it distorts the selection of the best qualified individual, this need not be the case when the initial
selection is suboptimal. If the best qualified candidates fail to be selected or fail to apply, then
the introduction of affirmative action may reduce if not eliminate these costs. Indeed the policy
has been used to reduce the distortion that discrimination has on the selection of candidates.1
This paper asks whether affirmative action can have a similar corrective effect when the decision
to apply for a position is not payoff-maximizing.
We examine whether affirmative action can encourage applications in an environment
where “minority” candidates otherwise fail to apply for positions they are qualified for. To
emphasize the supply side we ignore distortions that arise from those who select candidates.
Thus we study a setting where absent the policy the most qualified applicant is selected. This and
other abstractions imply that our study is not intended to measure the actual costs of the policy.
Rather the objective is to demonstrate that affirmative action can affect the application decision
and thereby mitigate the expected costs of the policy.
To study the decision to apply for a job or a promotion, we conduct a controlled
laboratory experiment where participants decide whether to enter a competition. Recent research
documents that individuals fail to make payoff-maximizing tournament-entry decisions and that
these decisions vary by gender.2 For example Niederle and Vesterlund (2007), henceforth NV,
study a case where participants perform under a non-competitive piece rate and a competitive
tournament. While they find no gender differences in performance they document substantial
differences in the choice of compensation scheme: the majority of men select the tournament and
the majority of women select the piece rate. Specifically, high performing women compete too
1 For a survey on the literature see Holzer and Neumark (2000). Biases in hiring can occur even when there are no fundamental differences between two groups, see e.g., Coate and Loury (1993) and Mailath, Samuelson and Shaked (2000). 2 See Croson and Gneezy (2009) and Niederle and Vesterlund (2011) for reviews of the literature on gender differences in willingness to compete. Closely related is the underperformance of women in competitive environments (Gneezy, Niederle and Rustichini, 2003).

2
little, causing few women to succeed in and win the tournament. Despite there being no gender
differences in performance, the decision to opt out of competitions places women in the minority
among the set of winners. It has been argued that this gender difference in willingness to
compete can help explain why men are disproportionately allocated to professional and
managerial occupations.3
Suboptimal entry by high performing women can be particularly costly for firms, as
reluctance to apply prevents them from hiring the best available candidates.4 The president of
University of Illinois, B. Joseph White, explains, “Getting more women into MBA programs
means better access to the total talent pool for business”.5 Furthermore the lower entry by women
reduces diversity which in and of itself may harm the firm (Page, 2007; Weber and Zulehner,
2010).
Our study asks whether affirmative action can encourage more high-performing women
to enter competitions. We focus not only on determining how the policy changes the decision to
compete but also on how it changes the gender composition of the pool of competitors.
Accounting for changes in entry we ask how costly it is to secure that women be equally
represented among those who win competitions. How much lower will the performance be for
winners under the policy? How many better performing men will have to be passed by to secure
equal representation of those hired?
We find that affirmative action changes tournament entry substantially. The entry of
women increases, that of men decreases, and the response exceeds that predicted by changes in
the probability of winning. This larger-than-expected response has important implications when
assessing the cost of the policy. Ignoring the change in entry, it is anticipated that equal
representation of women will decrease performance of winners and result in reverse
discrimination. However the change in tournament entry increases the number of high-
3 For example Bertrand and Hallock (2001) find that women only account for 2.5 percent of the five highest paid executives in a large sample of US firms. Women are also underrepresented among people who have the training frequently required for senior management. Only 30 percent of students at top tier business schools are women, and, relative to their male counterparts, female MBA’s are more likely to work in the non-profit sector, work part time, or drop out of the work force (E.g., Hewlett and Luce, 2005, and Blau and Kahn, 2004). While the competitive pressure of upper management may cause women to opt out, factors such as discrimination, preference differences for child rearing, and ability differences also play a role see e.g. Altonji and Blank (1999), Black and Strahan (2001), and Goldin and Rouse (2000). 4 This conclusion relies on the assumption that performance rather than competitiveness is the dominant trait necessary for job success. 5 The University Record, May 22, 2000, http://www.ur.umich.edu/9900/May22_00/8.htm.

3
performing women in the applicant pool, and as a result it is not difficult to secure equal
representation, in fact under the policy the performance requirement is found to be the same for
women and men. Our results suggest that when high performing women fail to enter
competitions they can win, then affirmative action can have a larger than expected effect on
applications and this response can reduce, if not eliminate, the anticipated cost of achieving a
more diverse set of winners.
To understand how affirmative action changes the tournament-entry decision, we focus
on the factors that have been found to cause the gender gap. Specifically, the study by NV found
that the gender gap in tournament entry was caused by men being more overconfident than
women and by women being more averse to performing in a mixed-sex competition. Affirmative
action has the potential to influence both of these factors.6 Consider for example a quota which
requires that out of two winners of a tournament at least one must be a woman. Such a quota will
not only change the probability of winning, but will also introduce a more gender-specific
competition. In particular the best performing woman is guaranteed to win the affirmative action
competition. Both confidence and attitudes toward competition may change in such a setting.
We find that indeed this larger-than-expected response to the policy is partially explained
by the competition becoming more gender specific. The gender gaps in confidence and in
willingness to perform in a competition are reduced under affirmative action.
In the next section we describe our experimental design and explain how it helps us
investigate the potential effects of affirmative action. We introduce our analysis by first showing
that we replicate the previous finding that many high-performing women fail to enter the
tournament. This suggests that a requirement of equal representation may have a significant
impact in our environment. We proceed by determining the effect of affirmative action on entry
and by examining how changes in tournament entry mitigate the anticipated costs of affirmative
6 Affirmative action programs in the US have historically been of two forms: preferential treatment and quota. Quotas have recently been used throughout Europe to improve the representation of women in both the corporate and political arena, see Fréchette, Maniquet and Morelli (2008) and Jones (2004). For a debate on quotas, see also Fryer and Loury (2005). A recent study by Balafoutas and Sutter (2012) copies our design and replicates the quota results we report here. They also examine affirmative action with preferential treatment. Niederle, Segal, and Vesterlund (2012) also examines preferential treatment and finds results similar to those shown here. Preferential treatment is also studied by Calsamiglia, Franke and Rey-Biel (2010) in the context of advantaged and disadvantaged students.

4
action. Finally, we conclude by asking whether the more gender-specific competition can
account for these changes.
II. EXPERIMENTAL DESIGN
The experiment was conducted at the Harvard Business School using students from the CLER
subject pool. While the design builds on that of NV, we had to make various changes to
implement the affirmative action treatment. Since these changes may alter the decision of
participants and because we want to compare behavior across environments, some tasks follow
closely the NV design.7 Groups of 6 participants, three women and three men, participated in
each session. The gender composition of the group was made clear to participants as they were
seated in the laboratory, and they were shown who the other 5 members of their group were.
Fourteen groups participated in the experiment for a total of 42 men and 42 women.8
Participants were asked to perform a real effort task under varying compensation
schemes. The task was to add up sets of five 2-digit numbers. Participants were not allowed to
use a calculator, but could use scratch paper. The numbers were randomly drawn and each
problem was presented in the following way:
21 35 48 29 83
For each problem participants were asked to fill in the sum in the blank box. Once the
participant submitted an answer on the computer, a new problem appeared jointly with
information on whether the former answer was correct.9 A record of the number of correct and
incorrect answers was kept on the screen. Participants had 5 minutes to solve as many problems
as they could. A stop watch was shown at the front of the room via a projector and a buzzer
7 Tasks 1, 2, 3 and 5 mimic NV with some modifications required to implement the affirmative action tournament. First, participants in this experiment were informed that groups were gender balanced. Second, we examine groups of 6 individuals with 2 winners, rather than groups of four with one winner. Third, our return from winning is $1.5 per problem, rather than $2. Fourth, we use students from the Harvard Business School CLER lab subject pool, rather than the PEEL subject pool at the University of Pittsburgh. Finally, show-up and completion fees vary between the two studies. 8 In one session (two groups) the stop watch malfunctioned for the fourth task. This session is excluded from our analysis. The behavior and performance prior to the fourth task resembles those of the other sessions. 9 For instructions see http://www.pitt.edu/~vester/AAInstructions.pdf. The program was written using the software zTree (Fischbacher 2007).

5
would go off at the end of the 5 minutes. The participant’s final score was determined by the
number of correctly solved problems.
Participants were told that they had to complete six tasks one of which was randomly
chosen for payment at the end of the experiment. In addition to their payment for performance
each participant also received a $10 show-up fee, and an additional $5 for completing the
experiment. Participants were informed of the nature of a task only immediately before
performing the task. While participants knew their absolute performance on a task, i.e., how
many problems they solved correctly, they were not informed of their relative performance until
the end of the experiment. The specific compensations and order of tasks were as follows.
Task 1 – Piece Rate: Participants are given the 5-minute addition task and receive 50 cents per
correct answer.
Task 2 – Tournament: Participants are given the 5-minute addition task. The two participants
among the three women and three men who provide the largest number of correct answers in the
group each receive $1.50 per correct answer. The other participants receive no payment.10
In the third task participants also perform the five-minute addition task, but this time they
select which of the first two compensation schemes they want to apply to their future
performance, piece rate or tournament. We refer to the tournament as a standard (ST)
tournament. A participant with a given performance has higher expected earnings in the
tournament when the probability of winning exceeds 33 percent. The first two tasks not only
familiarize subjects with the incentive schemes, but also provide performance measures which
we can use to determine whether men and women of equal performance make similar choices.11
10 In the event of ties in a competitive task the winner was chosen randomly among the high scorers. 11 There are a number of reasons women may enter competitions less. Both nurture and nature may cause men to be more competitive (e.g., Daly and Wilson, 1983, Campbell, 2002, Ruble, Martin, and Berenbaum, 2006, Gneezy, Leonard and List, 2009, Sutter and Rützler, 2010). If women anticipate a psychic cost from competing and men anticipate a psychic benefit then fewer women will compete. The same prediction results from the finding that men are more overconfident than women (e.g., Lichtenstein, Fischhoff and Phillips, 1982, Beyer, 1990, Beyer and Bowden, 1997, Niederle and Vesterlund, 2007, and Mobius et al 2011). Similarly the finding that women are more averse to risk (e.g., Eckel and Grossman, forthcoming, Croson and Gneezy, 2009, Byrnes, Miller and Shafer, 1999) and respond more to negative feedback (e.g., Roberts and Nolen-Hoeksema, 1989, Dweck 2000) suggest less

6
Task 3 – Choice: Before performing the 5-minute addition task, participants select whether they
want to be paid according to a piece rate, i.e., 50 cents per correct answer, or a tournament. A
participant who selects the tournament wins the tournament and receives $1.50 per correct
answer if the participant’s task-3 performance exceeds that of at least 4 of the other group
members in task 2, otherwise the participant receives no payment.
Winners of the task-3 tournament are determined by comparing their task-3 performance
to the task-2 performance of the other group members. Thus they compete against the past
performances of others, and the task-3 decision is effectively an individual-decision problem.12
Next we examine entry into an affirmative-action tournament (AA). In the AA
tournament at least one of the winners will be a woman.13 To avoid any effect due to simply
mentioning gender, we mentioned the group’s gender composition at the beginning of the
experiment.
Task 4 – Affirmative-Action Choice: Before performing the 5-minute addition task,
participants select whether they want to be paid according to a piece rate, i.e., 50 cents per
correct answer, or an AA tournament. A participant who selects the AA tournament receives
$1.50 per correct answer when winning the tournament, and $0 otherwise. The two winners are
the highest performing woman and the highest performer of the remaining 5 participants. That is,
a woman wins the AA tournament if her task-4 performance either exceeds the task-2
performance of the two other women in the group or exceeds that of at least four other group
members. A man wins the AA tournament if his task-4 performance both exceeds the task-2
willingness to compete. As noted in NV, the submit-piece-rate decisions (our tasks 5 and 6) help control for differences in risk and feedback aversion. 12 This has several advantages; participants are competing against competitive performances of others; the tournament-entry decision only depends on beliefs about one’s relative performance and not on the expected tournament-entry decisions of others; a participant’s choice does not impose any externalities on others. Thus gender differences in altruism cannot influence behavior (e.g., Andreoni and Vesterlund, 2001). 13 Sensitivity to gender composition is documented by Gneezy et al. (2003) and emphasized by advocates of single-sex schooling. It may be that girls do not dislike competition per se, but rather that they dislike competing against boys, i.e., girls in all-girl schools may be more competitive (e.g., Harwarth, Maline and DeBra, 1997, Booth and Nolen, 2012).
7
performance of the two other men in the group and exceeds that of at least four other group
members.14
To evaluate the extent to which gender differences in entry into the ST and AA
tournaments are caused by differences in willingness to perform in a competition we present
participants with two additional decisions which mimic the entry decisions in tasks 3 and 4,
without the choice resulting in a competitive performance. Specifically they are asked to select a
compensation scheme for their past non-competitive task-1 performance. First participants
choose between an ST tournament and a non-competitive piece-rate compensation. Second they
choose between an AA tournament and a non-competitive piece-rate compensation. As no
performance is required for these choices the potential thrill, anxiety or fear of performing in a
competition is absent. The difference in those final two choices, after controlling for the
probability of winning and subjective beliefs about winning the respective tournament is a
measure of the effect of mentioning affirmative action.15 Therefore, by controlling for these
decisions we can determine the extent to which the gender gap in entry is explained by an
aversion to performing in a competition and whether mentioning affirmative action gives rise to
an excessive response. Participants are reminded of their task-1 piece-rate performance prior to
their choice of compensation scheme.
Task 5 – Submit Piece Rate to a Tournament: Participants do not have to perform in this task.
They choose which compensation scheme they want to apply to their past task-1 piece-rate
performance: a 50-cent piece rate per correct answer or a tournament. A participant who enters
the tournament receives $1.50 per correct answer if the participant’s piece-rate performance is
among the two highest in the group of three women and men, otherwise no payment is received.
14 The probability of men and women winning the affirmative action tournament is sensitive to the performance distribution. If one man and one woman are the two highest performers in the group, then only these two will win the tournament by entering. 15 The tournaments in which women had favorable treatment were called: “affirmative action tournaments”, which allows us to identify the effect that arises from using these words. Had we just implemented a favorable treatment to women without mentioning the words affirmative action, some participants may have thought about affirmative action while others may not, and we could not separate the two effects. A response to the existence of affirmative action may not be restricted to the lab. It is possible that women (and men) respond to workplaces just having affirmative action policy in a similar manner to their reaction to mentioning affirmative action in the lab (i.e., women will be overly eager to apply).

8
Task 6 – Submit Piece Rate to AA Tournament: Participants do not have to perform in this
task. They choose which compensation scheme they want to apply to their past task-1 piece-rate
performance: a 50-cent piece rate per correct answer or an AA tournament. A participant who
selects the tournament receives $1.50 per correct answer when winning the tournament, and $0
otherwise. The two winners are the highest performing woman and the highest performer of the
remaining 5 participants.
Just like for tasks 3 and 4 a participant’s decision does not affect the earnings of any other
participant, nor does it depend on the entry decisions of others. Hence tasks 5 and 6 are also
individual-decision tasks.
Finally, at the end of the experiment participants were asked to guess their rank in the
task-1 piece rate and task-2 tournament both within the whole gender balanced group of 6
participants and within their own gender. Each participant picked a rank between 1 and 6 and
between 1 and 3, respectively, and was paid $1 for each correct guess.16 This allows us to
determine if beliefs on relative performance differ in single versus mixed gender groups, and
whether such differences affect tournament entry.
An attraction of the five-minute addition task is that performance does not appear to
respond to the incentives we consider.17 The focus of our analysis is therefore on the decisions to
enter a competition. Given the performances in tasks 1 and 2, the decision in task 3 will establish
whether high performing women avoid the competition. Suboptimal entry by women suggests
that affirmative action imposed after the entry decision would be very costly as there are only
few high performing women in the applicant pool. Task 4 allows us to assess the effect of
affirmative action on the supply side, and helps determine whether this potential increase in entry
causes the costs of affirmative action to be lower than anticipated.
16 In the event of ties in actual rank we counted every answer that could be correct as correct. For example, if the performance in the group was 10, 10, 11, 12, 13, 13 then an answer of sixth and fifth was correct for a score of 10, and an answer of first and second was correct for a score of 13. 17 While there is an initial learning effect, performance seems to stabilize quickly at or near the participants’ maximum capacity to perform.

9
III. TOURNAMENT ENTRY WITH AND WITHOUT AFFIRMATIVE ACTION
We start by characterizing the tournament-entry decisions prior to the introduction of affirmative
action. We then examine the effect of affirmative action on tournament entry.
III.A. Entry into the Standard Tournament
The average number of correctly solved problems in the piece rate is 10.3 for women and
12.9 for men, and in the tournament it is 12.3 for women and 14.8 for men. Two-sided Mann-
Whitney tests show that both of these gender differences are significant (p = 0.03 and p = 0.06,
respectively).18 To assess the probability of winning the tournament we randomly create six-
person groups from the observed performance distributions and determine the 2 winners. Table I
shows the probability of winning conditional on performance.19
TABLE I PROBABILITY OF WINNING TASK-2 TOURNAMENT CONDITIONAL ON TASK-2 PERFORMANCE 8 9 10 11 12 13 14 15 16 17 18 19 21 22 25 28 29 35Women 0 0.1 0.6 2.5 8.6 21.8 40.7 58.1 71.4 80.2 87.1 92.2 -- 96.2 -- -- -- --Men 0 0.1 0.7 2.8 11.0 28.2 48.7 65.8 77.8 85.6 91.1 -- 96.6 98.1 99.2 99.6 99.9 100
After the 50-cent piece rate and the $1.50 tournament, participants are asked which of the
two they want to apply to their task-3 performance. Table I shows that the probability of winning
is higher than one third for participants who solve 14 or more problems, thus this group has
higher expected earnings in the tournament. If their performance in task 3 is exactly as in task 2,
this corresponds to 28.6 percent of women and 50 percent of men benefitting from the
tournament. The observed gender gap in tournament entry is even greater: 31 percent of women
and 73.8 percent of men select the tournament. This gender gap is significant (p < 0.01) and
greater than expected (p = 0.04).20 While men enter significantly more than predicted (p =
18 As noted by NV the increase in performance from the piece rate to the tournament is most likely due to learning. In contrast to the results here, NV does not find a gender gap in performance; it is not surprising that this result may vary by population. Performance is controlled for throughout our analysis to account for any differences. 19 For any given performance level, say 15 for a woman, we draw 1,000,000 groups consisting of 3 men and 2 women, using the performance distribution of the 42 men and 42 women with replacement. We then calculate the woman’s frequency of wins in this set of simulated groups. 20 Unless otherwise noted the reported test statistics henceforth refer to a two-sided Fisher’s exact test. For the final comparison, we calculate the difference between expected and actual gender gaps in the tournament entry decision

10
0.042), women do not (p = 1.0). The gender gap in tournament entry is greatest among those who
have higher expected earnings in the tournament than in the piece rate; among these, 100 percent
of the men and only 33.3 percent of the women enter the tournament. Thus the entry by high
performing women is suboptimal in terms of maximizing earnings.
III.B. Entry into the Affirmative Action Tournament
The introduction of an affirmative action quota increases the probability of winning the
tournament for women while decreasing it for men. The probabilities of winning the AA
tournament conditional on gender and performance are reported in Table II. Participants with a
33 percent or higher chance of winning have higher expected earnings from the AA tournament
than the piece rate. This corresponds to women with a performance of 13 or more and men with
a performance of 15 or more.21 Thus affirmative action decreases the performance at which it
becomes profitable to enter the tournament by one for women while increasing it by one for men.
TABLE II
PROBABILITY OF WINNING TASK-4 TOURNAMENT CONDITIONAL ON TASK-2 PERFORMANCE: 9 10 11 12 13 14 15 16 17 18 19 21 22 25 28 29 35
Women 1.8 4.9 10.5 25.3 46.9 64.6 77.3 85.7 91.1 94.7 97.3 -- 99.3 -- -- -- --Men 0.1 0.4 1.6 5.5 14.2 26.8 39.6 50.6 58.6 66.8 -- 75.3 79.6 84.0 88.5 93.0 97.6
The payoff maximizing entries in the AA tournament correspond to 40.5 percent of
women and 38.1 percent of men if the participant’s task-4 performance is the same as in task 2.
In sharp contrast, 83.3 percent of women and 45.2 percent of men enter the AA tournament.
While the entry by women is greater than predicted, that by men is not (p < 0.01 and p = 0.66,
respectively). The resulting gender gap in entry into the AA tournament is significant (p < 0.01)
and differs from that predicted (p < 0.01).
Figure I panel A shows the proportion of men who enter the standard (ST) and AA
tournament conditional on their probability of winning each tournament. Panel B shows the
corresponding figure for women. Both figures use performance prior to the entry decision (i.e.,
for 1,000,000 simulations where we draw the 42 women and 42 men with replacement (using thresholds implied by Table II). The reported p-value is the percentage of strictly positive differences. 21 Using the task-2 performance, five more women and five fewer men have higher expected earnings from entering the AA tournament compared to the standard tournament.

11
task 2) to determine the probability of winning. The figures are similar if we instead use ex-post
performance (i.e., task 3 and 4).
Panel A: Men Panel B: Women
FIGURE I: Proportion of Participants Entering the Standard (ST) and the AA Tournament (AA) Conditional on the Probability of Winning it Given Their Task-2 Performance.22
Figure I shows that affirmative action reduces entry by men and increases it for women
beyond what is warranted by changes in the probability of winning. Otherwise, the proportion of
entrants would coincide for the ST and AA tournaments. The overreaction by women is
particularly large. Moreover, women who stood to gain from entering the standard tournament
(participants with a task-2 performance of at least 14) all chose to enter the AA tournament while
only a third of these women entered the standard tournament. This increase in female entry rates
is significant (p = 0.001).23
In Table III we present probit regressions of the decision to enter a tournament on the
probability of winning as well as an affirmative-action dummy. For each individual we use both
the decision to enter the ST tournament, and the decision to enter the AA tournament. We
22 The bin size was chosen to secure similar numbers of participants in each bin, and such that the earnings are maximized if the top two bins enter the tournament while the others do not. The number of individuals in each bin is as follows: In panel A, in the standard tournament the numbers are 13, 8, 8, and 13. In the AA tournament there are 13, 13, 7, and 9, with 13 in 0-0.05. In panel B, the numbers are 15, 15, 6, and 6, and 11, 14, 9, and 8, respectively. 23 Among women who gain from entering the AA tournament, i.e. those with a performance of 13 or higher, 88.2 percent entered the tournament. This is a significant increase in the entry rates of women compared to the case when there was no affirmative action (p = 0.01).
0
0.2
0.4
0.6
0.8
1
0 - 0.05 0.05 - 0.33 0.33 - 0.66 0.66 - 1
Pro
port
ion
of E
ntra
nts
Probability of Winning
STAA
0
0.2
0.4
0.6
0.8
1
0 - 0.05 0.05 - 0.33 0.33 - 0.66 0.66 - 1P
ropo
rtio
n of
Ent
rant
sProbability of Winning
STAA
12
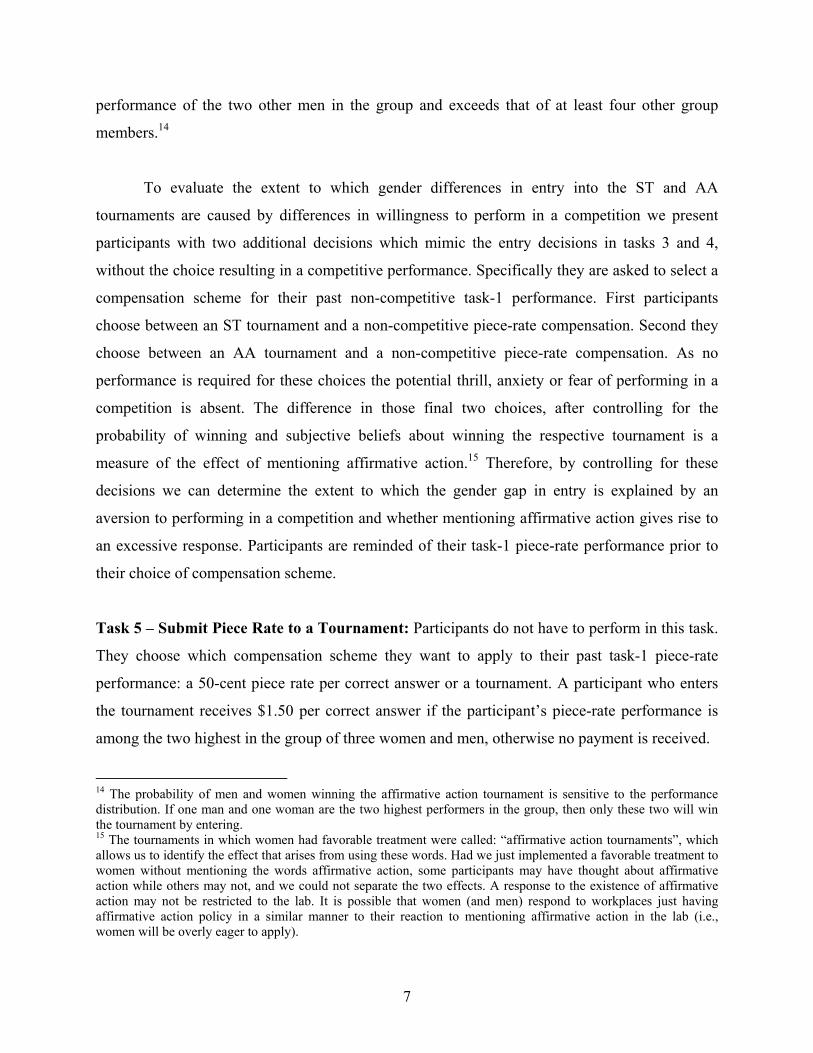
condition the entry decision on the probability associated with winning the tournament in
question (Tournament) and on the change in the probability of winning when using tournament
rather than piece rate performance (Tournament-piece rate). We cluster on the participant to
account for the lack of independence between the two individual observations. If entry decisions
depend solely on the probability of winning the tournament, then the marginal coefficient on the
affirmative action dummy (AA) should be zero. Consistent with Figure I we see that the effect of
the policy on entry is negative for men and positive for women.24 In the pooled regression the
significant female and affirmative-action interaction term demonstrates that changes in the
probability of winning do not fully account for the change in the gender gap induced by
affirmative action.
TABLE III
PROBIT OF TOURNAMENT CHOICE (TASK-2 PERFORMANCE) Men Women All
Female -0.37 (0.00) Female*AA 0.26 (0.00) AA -0.29 0.51 -0.27 (0.01) (0.00) (0.01) Tournament 0.90 0.28 0.64 (0.00) (0.28) (0.00) Tournament-piece rate -0.35 0.30 -0.09 (0.22) (0.25) (0.61) Observations 84 84 168
The table presents marginal effects evaluated at an individual (a man in the last column) in the standard tournament, with a probability of winning the tournament (Tournament) of 0.33 and a change in the probability of winning (Tournament-piece rate) of 0.16. We cluster on the participant to account for there being 2 observations for each of the 84 participants. p-values of the underlying coefficients are in parenthesis.
IV. HOW COSTLY IS AFFIRMATIVE ACTION
A concern when introducing affirmative action is how costly it will be to achieve a more diverse
set of winners. Looking directly at the performance of those who enter and win the tournaments
we do not see deterioration in performance. The average performance by actual winners of the
ST tournament is 19.2, while that of winners in the AA tournament is 18.7, this difference is not
24 The result is the same if we condition on the probability of winning after the entry decision, i.e., on tasks 3 and 4.

13
significant (p = 0.79) and suggests that in contrast to expectations affirmative action need not
decrease performance. While it is tempting to focus solely on the performance of actual winners
it is important to note that whether an individual is or is not identified as a winner depends on the
performance of the group she is randomly assigned to. Thus, examination of actual winners only
provides limited insight on the effect of affirmative action.
To assess the cost of the policy we view all the participants in the experiment as
(potential) candidates and those who enter competitions as applicants for jobs. We ask what the
minimum performance requirement would be if a firm wanted to hire a certain number of
applicants and wanted to secure that only the best available applicants were hired. We then ask
how much lower the requirement has to be if we want to hire the same number of applicants
under the equal representation rule. To evaluate the degree of reverse discrimination we
determine how many strictly better performing men will be passed by to secure that women are
at least equally represented among those hired. Passing by better performing applicants is
inequitable and costly for the firm who no longer can hire the best available applicants. Crucial
for assessing these two adverse effects is the performance and gender composition of those who
decide to enter the competition.
We measure the performance of entrants after their compensation choice. Since the
performance in task 4 is slightly higher than in task 3, we will throughout this section rely on the
task-3 performance to not bias the costs of affirmative action downward.25 Figure II Panel A
shows the proportion of participants with a given task-3 performance who choose to enter the ST
or AA tournament.
25 To understand the behavior of participants, we focus on task 2, the performance before they made choices. When considering the effect on outcomes, focusing on the performance after the choice seems more natural. However, the results are similar when we use performances in task 2 or 4, or if we use performance in task-3 for entrants in the standard tournament and in task-4 for entrants in the AA tournament. This is due to the fact that performance is largely not affected by the incentive scheme, just as in NV. However, given the higher task-4 performance this latter comparison would bias the results in favor of affirmative action.

14
Panel A
Proportion of Participants with a Given Performance Who Enter the Standard (ST) and Affirmative Action
(AA) Tournaments using Task-3 Performance.
Panel B Number of Entrants with a Performance above a Minimum Threshold in the Standard (ST) and
Affirmative Action (AA) Tournaments using Task-3 Performance.
FIGURE II: Performance of Entrants
While affirmative action increases entry for those who solve 13 problems or less, the
proportion of participants who enter is, while slightly higher, not affected for those with a
superior performance.26 This finding is confirmed by Panel B, which shows the number of
entrants who have performances at or above a certain level.27 At high performance levels we do
not see substantial changes in the number of entrants. In both the ST and AA tournaments we
have slightly more than 20 entrants who solved 15 or more problems in the task-3 tournament.
Affirmative action has however a large effect on the gender composition of the pool of
entrants. Figure III shows the proportion of women among entrants whose performance is at or
above a specified performance level. For example, among entrants with a performance of 15 and
higher only 26 percent are women in the ST tournament, in contrast 50 percent of these are
women in the AA tournament.
26 A two-sided Mann-Whitney test for the equality of the distribution of entrants in the two treatments yields p = 0.26 (when using tasks 3 and 4 or task 2 performances it yields p = 0.88 and p = 0.24, respectively). 27 Since less than ten percent of participants solve more than 20 problems, we focus the analysis on groups with minimum performances of 20 and lower.
0
0.2
0.4
0.6
0.8
1
-9 10-13 14-15 16+
Pro
port
ion
of E
ntra
nts
Minimum Performance
ST
AA0
10
20
30
40
50
60
6 8 10 12 14 16 18 20
Num
ber
of E
ntra
nts
Minimum Performance
ST
AA

15
FIGURE III: Gender Composition: Proportion of Tournament Entrants above a Minimum Performance Who are Women in the Standard (ST) and the AA tournament (AA)
The extent to which affirmative action lowers performance of the winners and results in
reverse discrimination can be assessed both ex-ante and ex-post. The ex-ante evaluation
considers the expected effect of affirmative action if it were implemented without women and
men changing their behavior. Hence the cost is assessed by employing affirmative action
guidelines to the entrant pool of the ST tournament. We will denote the outcome of this analysis
by ST w AA. The ex-post assessment instead evaluates realized costs of affirmative action,
which occur after affirmative action is announced and individuals have responded to the change
in policy. The ex-post effect can be assessed by imposing affirmative action restrictions on
participants who decided to enter the AA tournament. We denote the outcome of this exercise by
AA w AA.
Figure IV Panel A shows based on ex-ante entry, for each minimum performance
requirement, how many participants can be hired with and without affirmative action. Figure II
Panel B showed that the ST tournament has 23 applicants (entrants) who solve 15 problems or
more. Figure III documents that only 26 percent of them are female. Taken together, these
figures imply that if we maintain the performance requirement of 15 problems and require equal
representation then only 12 instead of 23 applicants can be hired. The number of applicants that a
firm can expect to hire under affirmative action (given its current applicant pool) is shown by the
ST w AA line in Figure IV Panel A. This figure also shows that ex-ante, firms who want to hire
the same number of participants (23) after introducing affirmative action would have to lower the
0
0.1
0.2
0.3
0.4
0.5
0.6
0.7
6 8 10 12 14 16 18 20
Pro
port
ion
who
are
Wom
en
Minimum Performance
ST
AA

16
minimum performance requirement from 15 to 10. Thus the expected effect of affirmative action
on qualifications is substantial when we ignore that women and men respond to the policy by
changing their entry decisions.
Panel A Number of Entrants above a Minimum Performance
who Entered the Standard Tournament (ST) and when the AA requirement is imposed (ST w AA).
Panel B Number of Entrants above a Minimum Performance who
Entered the AA Tournament (AA) and when the AA requirement is imposed (AA w AA).
FIGURE IV: Cost of Affirmative Action: Lowering Performance Standards
The assessment of performance costs is however quite different when we account for the
suboptimal initial entry and the greater than expected response to the policy. Figure IV Panel B
shows that when affirmative action is announced 22 participants with performance 15 and above
enter the affirmative action tournament (AA). As half of these entrants are women (see Figure
III) it will not be necessary to lower the performance requirement to secure that women are
equally represented among those hired. Under an AA requirement we can hire 22 participants
with a minimum performance of 15 (AA w AA). The number of candidates that a firm can
actually hire under affirmative action (given the changed applicant pool) is shown by the AA w
AA line in Figure IV Panel B. Thus the naively calculated expected performance costs greatly
exaggerate the actual realized cost of the policy.
0
10
20
30
40
50
60
6 8 10 12 14 16 18 20Minimum Performance
ST
ST w AA
0
10
20
30
40
50
60
6 8 10 12 14 16 18 20Minimum Performance
AA
AA w AA
17
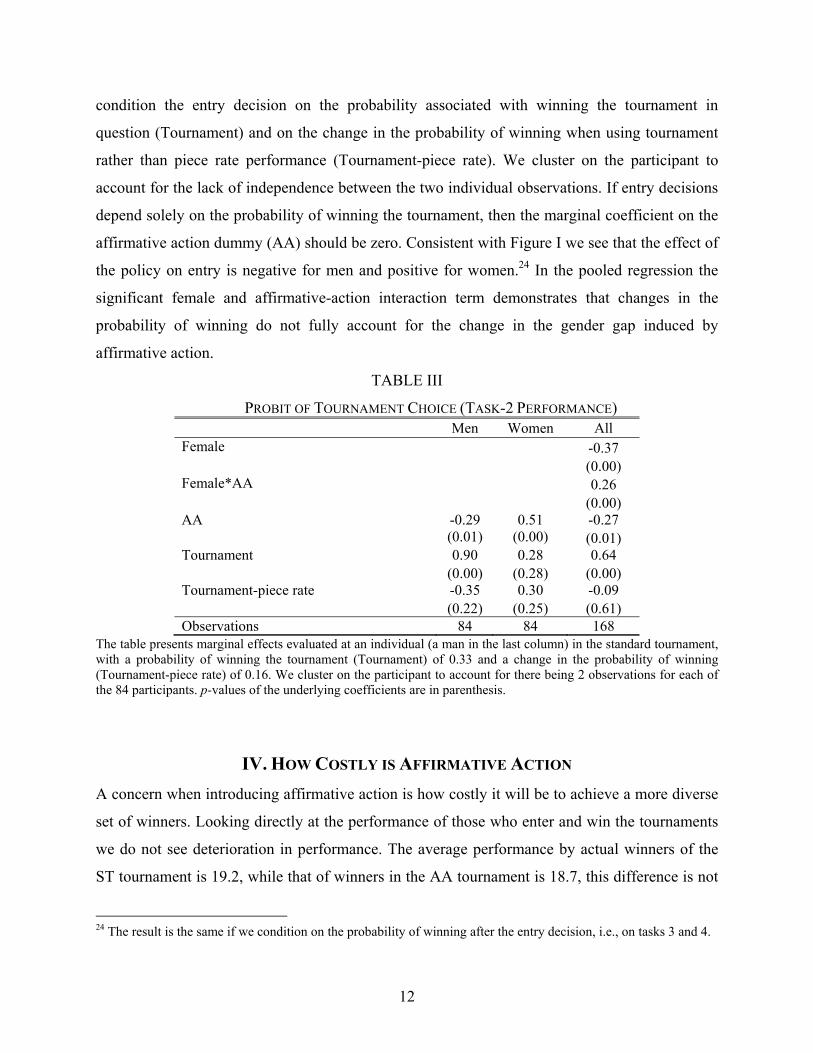
FIGURE V: Cost of Affirmative Action Number of Better Performing Men Passed by to Secure Equal Representation of Women Given the Entrants to the Standard Tournament (ST w AA) and
the Entrants to the AA Tournament (AA w AA).
Next we examine the extent to which the policy gives rise to reverse discrimination.
Figure V shows the number of strictly higher performing men that are passed by when hiring a
woman at a particular performance level, while satisfying the affirmative action requirement.
Once again we assess the costs both ex-ante and ex-post. The expected ex-ante costs do not take
into account the changes in entry that may result from the policy (ST w AA), while this response
is accounted for in the ex-post assessment (AA w AA). Entry into the ST tournament predicts
substantial reverse discrimination. For example, recall that under the equal representation
requirement we can only hire 12 of the 23 entrants who entered the standard tournament and
solved 15 and more problems. As shown by the ST w AA line in Figure V this implies passing
by 6 men who have a performance in excess of the required performance minimum of 15 for
women. The introduction of affirmative action, however, causes women to be better represented
among the set of entrants, and instead an equally representative pool of 22 people with a
minimum performance of 15 can be hired. Thus ex-post there is no reverse discrimination at this
performance level.
The substantial difference between ex-ante and ex-post costs of affirmative action implies
that it may be very expensive, in terms of performance loss and reverse discrimination, to apply
an affirmative action rule ‘secretly’ or to introduce affirmative action after individuals have
decided to enter a standard tournament. Furthermore, perceived inequity and performance costs
02468
101214161820
6 8 10 12 14 16 18 20
Num
ber
of M
en P
asse
d B
y
Minimum Performance
ST w AA
AA w AA
18
may be vastly overestimated, if we fail to take into account that the pool of entrants changes
along with a well-announced introduction of affirmative action. Since many more women, and in
particular many high performing women, enter the AA tournament the gender composition of
tournament entrants is very different under affirmative action. These changes in entry mitigate
the cost of the policy. Thus our results demonstrate that when high performing candidates
initially fail to apply then it need not be that costly to secure a more diverse set of winners
through affirmative action.
V. THE EFFECT OF AFFIRMATIVE ACTION ON TOURNAMENT ENTRY
In this section we ask why the observed response to affirmative action is greater than predicted.
We first examine the extent to which the initial gender gap is caused by gender differences in
confidence and attitudes toward competition, as in NV, and then whether affirmative action
influenced these gender differences.
V.A. Gender Differences in Tournament Entry
To analyze the gender gap in entry into the ST tournament we first examine the role played by
gender differences in beliefs. To assess the effect of confidence, we compare beliefs conditional
on the participant’s optimal guessed rank. This is the guessed rank that, conditional on gender
and performance, would maximize earnings.28 Figure VI panel A shows participants’ guessed
rank conditional on the optimal guessed rank. A perfectly calibrated participant would lie on the
45-degree line. Overconfidence is seen by guessed ranks below the 45-degree line. While men
are significantly overconfident, women are not, and the gender difference is significant.29
28 For a given performance level, say 15 for a woman, we draw 1,000,000 groups consisting of 3 men and 2 women, sampling with replacement from the performance distribution of the 42 men and 42 women. We then determine the woman’s rank in each of these groups and the optimal guessed rank is the mode of these ranks. 29 For men, testing if the distribution of guessed ranks is independent of that of optimal guessed ranks yields p = 0.04. For women, the comparisons of guessed ranks to optimal guessed ranks yields p = 0.37. An ordered probit regression of the guessed tournament rank yields coefficients of 0.39 on the optimal guessed rank (p < 0.01) and 0.66 on a female dummy (p = 0.01).

19
Panel A Panel B
FIGURE VI: Average Guessed Rank as a Function of Optimal Guessed Rank in the Group of 6 Participants (A), and among the 3 Group Members of One’s Gender (B).
A method for summarizing beliefs which will prove helpful in our affirmative-action
analysis is to determine whether the participant’s guessed rank is consistent with the belief that
he or she will win the tournament, we refer to this measure as GuessWin. The results on beliefs
are qualitatively the same when we use this binary belief measure.30 To examine the effect on
tournament entry in Table IV column (1) we first regress the compensation choice on the
probability of winning the task-2 tournament (Tournament) and on the change in the probability
of winning a task-2 tournament between using the individual’s task-2 performance and their
task-1 performance (Tournament-piece rate).31 Conditional on performance we find a significant
30 In the AA tournament, GuessWin is a gender neutral summary of beliefs while guessed rank is not. A probit regression of the guess of winning the ST tournament yields marginal coefficients of -0.3 on female (p = 0.01), and 0.45 on optimal GuessWin (p < 0.01), evaluated at a man whose optimal guess is winning. Testing if the distribution of GuessWin differs from that of optimal GuessWin yields p = 0.07 for men, and p = 0.48 for women. 31 The change in the probability of winning the tournament when using the task-2 rather than task-1 performance is given by pT(task 2)- pT(task 1), where pT(x) denotes the probability of winning the tournament with a performance of x (note that pT(x) may differ by gender). Prior to the affirmative action analysis it is largely inconsequential to condition on the probability of winning rather than actual performance, however this distinction is important when we study the AA tournament where pT(x) differs by gender.
0
1
2
3
4
5
6
0 1 2 3 4 5 6
Mea
n G
uess
ed R
ank
Optimal Guessed Rank
Men
Women
0
1
2
3
0 1 2 3
Mea
n G
uess
ed R
ank
Optimal Guessed Rank
Men
Women

20
gender gap of 36 percentage points.32 As seen in Column 2, this gap reduces to 25 percentage
points when we control for the participants’ imputed beliefs on winning the tournament. Thus the
overconfidence by men helps account for about one third of the gender difference in tournament
entry.
TABLE IV PROBIT OF TOURNAMENT-ENTRY DECISION (TASK 3)
(1) (2) (3) Female -0.36 -0.25 -0.17 (0.00) (0.03) (0.04) Tournament 0.79 0.45 0.22 (0.00) (0.02) (0.08) Tournament-piece rate -0.29 -0.31 -0.11 (0.27) (0.15) (0.45) GuessWin 0.35 0.25 (0.01) (0.01) Submit the Piece Rate 0.15 (0.10) Observations 84 84 84
Dependent variable: task-3 compensation choice (1-tournament and 0-piece rate). The table presents marginal effects evaluated at a man with a 33 percent chance of winning the tournament (Tournament), a 0.16 change in probability of winning (Tournament-piece rate), who submitted his piece rate to the tournament (column 3), and thinks (columns 2 and 3) that he wins the tournament (i.e., ranks first or second in his group of six). p -values of the underlying coefficients are in parenthesis.
To determine the importance of attitudes toward the active competitive performance we
control for the task-5 compensation choice where participants choose between a competitive and
a non-competitive compensation scheme for their past task-1 piece-rate performance. This
decision is similar to the decision to enter a tournament and perform in a competition (task 3).
The difference between the two is that only in task 3 do they subsequently have to compete. Thus
only in task 3 can differences in preferences for performing in a competition play a role.
As seen in Table IV the gender gap is further reduced to 17 percentage points when
controlling for the decision to submit the piece rate (Column 3). This decrease may in part be
explained by the submit-to-piece-rate decision serving as an additional measure of the
individual’s degree of confidence. The reduction in the GuessWin coefficient in Column 3 is
32 The marginal effect is evaluated at the point where a participant is indifferent towards entering the tournament, i.e., the probability of winning is 33 percent. This corresponds to having a performance between 13 and 14. For these participants pT(task 2)- pT(task 1) = 0.16 on average, thus we assess the marginal effect at this point.
21
consistent with this interpretation. We attribute the remaining gap to women being more averse
to choices that require a future performance in a competitive environment.
Although our design differs from that of NV the relevant findings are qualitatively and
quantitatively similar.33 High performing women fail to enter the competition, and the substantial
gender gap in tournament entry is explained by gender differences in beliefs and attitudes
towards performing in a competition.
V.B. The Effect of Affirmative Action on Tournament Entry
The affirmative action requirement was that at least one of two winners must be a woman. This
institution gives rise to a more gender-specific competition, which may influence the two factors
that reduced entry for women: the gender gap in confidence and attitudes towards competition.
In addition to these changes behavior may also be influenced by us mentioning affirmative
action.
The Effect of Beliefs
To assess the extent to which beliefs can account for changes in entry in the AA tournament, we
analyze beliefs on relative performance within-gender in the task-2 tournament. As before we
calculate the optimal guess, i.e., the money-maximizing guess given individual performance,
however neither women nor men are found to be overconfident. The distributions of guessed
ranks within gender are not significantly different from optimal guessed ranks (p = 0.21 for
women, and p = 0.45 for men, respectively). Ordered probit regressions show that the guessed
ranks in single-sex groups are correlated with optimal guesses, and women are as confident in
their relative performance among women, as men are among men.34 Figure VI shows for each
optimal guessed rank the average guessed rank of women and men. While Panel A showed the
guessed ranks among all 6 participants Panel B shows guessed ranks within one’s gender.
33 To conform to the procedures of the present study we reran the regression in NV including all participants and controlling for the probability of winning and participants’ GuessWin. The NV gender gap in tournament entry is 38 percentage points controlling only for performance. Controlling also for beliefs on winning this gap reduces to 26 percentage points, finally adding the decision to submit the piece rate reduces the gap to 14 percentage points. 34 An ordered probit regression of guessed rank on optimal guessed rank in single-sex groups yields coefficients of 0.99 (p < 0.01) for men, and 0.46 (p = 0.04) for women. Pooling all 42 women and 42 men yields coefficients of -0.04 on a female dummy (p = 0.87), and 0.70 on optimal guessed rank (p < 0.01).

22
Although men are significantly more confident than women when assessing relative ability in a
mixed-sex group, there is no gender difference in beliefs in single-sex groups.
To evaluate the impact of beliefs on the AA-entry decision we construct participants’
beliefs on whether they would have won the task-2 tournament under AA rules (GuessAAWin).
A woman wins the AA tournament if she is either the best performing woman or among the two
best performing participants in the group. A man, on the other hand, wins the AA tournament if
he is both the best performing man and among the top two performers overall. As expected we
find that relative to the standard tournament fewer men and more women think that they will win
the AA tournament.35 We compare GuessAAWin to the belief of winning that is consistent with
the participant’s optimal guessed rank (optimal GuessAAWin). Similar to our guessed-rank
results in single-sex groups, conditioning on the optimal guess, neither women nor men are
overconfident and there is no gender difference in GuessAAWin.36 This result contrasts that of
the standard tournament where conditional on the optimal GuessWin, men are significantly more
likely to believe that they will win.
To determine the impact of beliefs on changes in tournament entry induced by
affirmative action we condition on the relevant guesses-to-win measures, see Table V. For easy
comparison the first column in each category reports the results of Table III. Controlling for
performance the first four columns show that individuals who have beliefs consistent with
winning are more likely to enter the tournament, however in a two-sided test this effect is only
significant for women. Nonetheless, as seen by the coefficient on the AA dummy, for both men
and women, including beliefs on winning reduces the change in entry induced by AA by about
20 percent.
35 In the standard tournament 30 men (70%) report guesses consistent with winning the tournament, compared to 17 (40.5%) in the AA tournament. The numbers for women are 15 (35.7%) in the standard and 20 (47.6%) in the AA tournament. The expected change is -3 for men and +4 for women. 36 On average the GuessAAWin is not significantly different from the optimal GuessAAWin (p = 1.0 for men and p = 0.49 for women). A probit regression of GuessAAWin for the 84 participants delivers the following marginal effects evaluated at a man with an optimal guess of winning: 0.08 on female (p = 0.43); 0.40 on the optimal GuessAAWin (p < 0.01). Examining men and women separately yields coefficients on the optimal GuessAAWin of 0.53 (p < 0.01) for men, 0.27 (p = 0.12) for women.

23
TABLE V PROBIT OF TOURNAMENT CHOICE (TASK-2 PERFORMANCE)
Men Men Women Women All All Female -0.37 -0.29 (0.00) (0.01) Female*AA 0.26 0.18 (0.00) (0.00) AA -0.29 -0.23 0.51 0.40 -0.27 -0.18 (0.01) (0.04) (0.00) (0.00) (0.01) (0.07) Tournament 0.90 0.70 0.28 0.06 0.64 0.40 (0.00) (0.00) (0.28) (0.83) (0.00) (0.00) Tournament-piece rate -0.35 -0.38 0.30 0.23 -0.09 -0.15 (0.22) (0.15) (0.25) (0.41) (0.61) (0.31) GuessWin 0.19 0.38 0.27 (0.16) (0.00) (0.00) Observations 84 84 84 84 168 168
The table presents marginal effects evaluated at an individual (a man in the last two columns), in the standard tournament, with a 0.33 percent probability of winning the tournament (Tournament) and a change in the probability of winning (Tournament-piece rate) of 0.16, with a guess of winning (in columns 2, 4, and 6). We cluster on the participant to account for there being 2 observations for each of the 84 participants. p-values of the underlying coefficients are in parenthesis. Note that GuessWin refers to the relevant tournament (ST or AA).
GuessWin is significant in the pooled regression and reduces the change in the gender
gap induced by affirmative action.37 An explanation is that the gender gap in beliefs is
substantially smaller in the AA tournament. The change in beliefs results from women being
more likely to win the AA tournament, and from men being more overconfident in mixed- than
single-sex competitions. However, note that controlling for beliefs, the coefficient on the female
and affirmative-action interaction term remain significant. Hence changes in beliefs and in the
probability of winning cannot fully account for the change in the gender gap in tournament entry
induced by affirmative action.
37 The coefficient on the female-affirmative action interaction does not capture the change in the gender gap between the standard and AA tournament. The change in the gender gap is given by [Pr(AA=1, F=1, AA·F=1;X) - Pr(AA=1, F=0, AA·F=0;X)] – [Pr(AA=0, F=1, AA·F=0;X) - Pr(AA=0, F=0, AA·F=0;X)]. Conditioning only on the probability of winning the change in the gap equals 0.76. The additional control for beliefs reduces the gap to 0.59.
24
Mentioning Affirmative Action and Attitudes towards Competition
Next we examine whether mentioning affirmative action influences behavior. We use the
decisions to submit the piece rate performance to the ST or AA tournament to examine this
effect. We then determine the extent to which this accounts for the response to the policy, and
the extent to which changes in tournament entry can be attributed to attitudes towards
competition changing in more gender-specific groups.
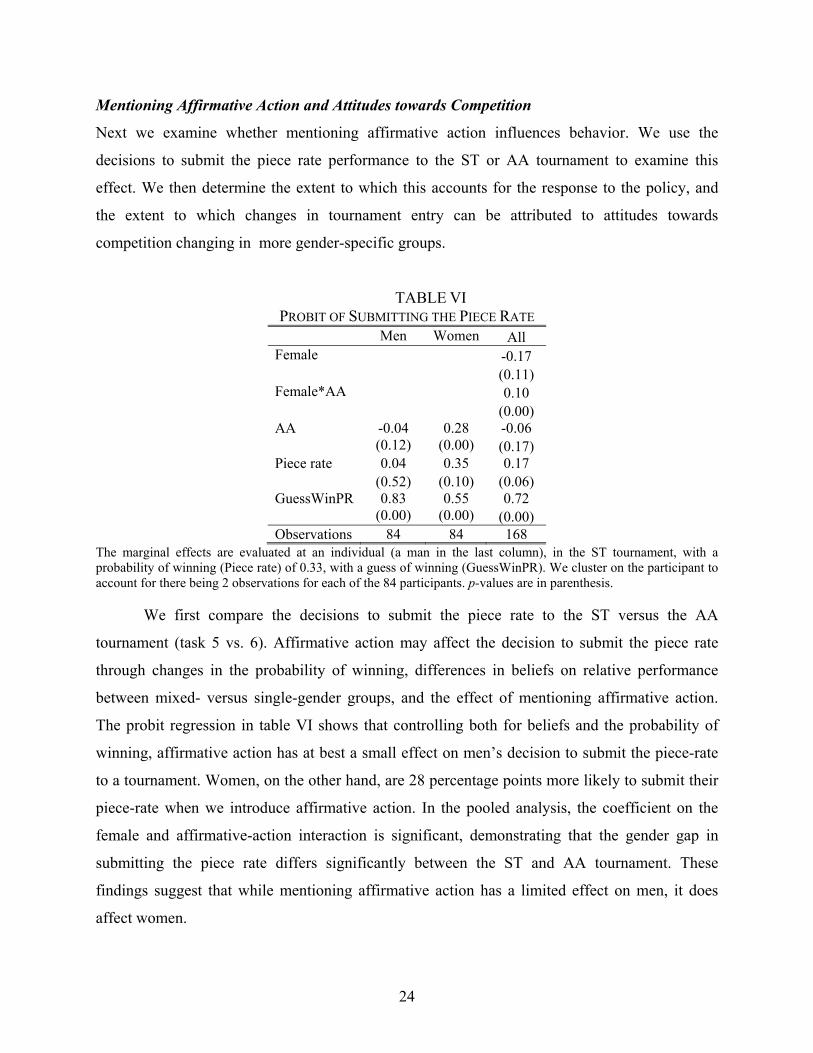
TABLE VI PROBIT OF SUBMITTING THE PIECE RATE
Men Women AllFemale -0.17 (0.11)Female*AA 0.10 (0.00)AA -0.04 0.28 -0.06 (0.12) (0.00) (0.17)Piece rate 0.04 0.35 0.17 (0.52) (0.10) (0.06)GuessWinPR 0.83 0.55 0.72 (0.00) (0.00) (0.00)Observations 84 84 168
The marginal effects are evaluated at an individual (a man in the last column), in the ST tournament, with a probability of winning (Piece rate) of 0.33, with a guess of winning (GuessWinPR). We cluster on the participant to account for there being 2 observations for each of the 84 participants. p-values are in parenthesis.
We first compare the decisions to submit the piece rate to the ST versus the AA
tournament (task 5 vs. 6). Affirmative action may affect the decision to submit the piece rate
through changes in the probability of winning, differences in beliefs on relative performance
between mixed- versus single-gender groups, and the effect of mentioning affirmative action.
The probit regression in table VI shows that controlling both for beliefs and the probability of
winning, affirmative action has at best a small effect on men’s decision to submit the piece-rate
to a tournament. Women, on the other hand, are 28 percentage points more likely to submit their
piece-rate when we introduce affirmative action. In the pooled analysis, the coefficient on the
female and affirmative-action interaction is significant, demonstrating that the gender gap in
submitting the piece rate differs significantly between the ST and AA tournament. These
findings suggest that while mentioning affirmative action has a limited effect on men, it does
affect women.

25
Note that the decisions in tasks 5 and 6 and differences in those decisions are not affected
by the eagerness to perform and compete in single- or mixed-gender groups. To isolate the effect
of a competitive performance we control for tasks 5 and 6 when examining changes in the
decision to enter a tournament induced by affirmative action.
TABLE VII
PROBIT OF TOURNAMENT CHOICE (TASK-2 PERFORMANCE) Men Women AllFemale -0.18 (0.02)Female*AA 0.07 (0.00)AA -0.09 0.25 -0.09 (0.09) (0.00) (0.11)Tournament 0.19 -0.09 0.13 (0.01) (0.71) (0.03)Tournament-piece rate 0.01 0.43 0.06 (0.92) (0.11) (0.42)GuessWin 0.05 0.35 0.12 (0.39) (0.01) (0.02)Submit Piece Rate 0.30 0.29 0.24 (0.00) (0.07) (0.00)Observations 84 84 168
The marginal effects are evaluated at an individual (a man in the last three columns) in the standard tournament, with a probability of winning the tournament (Tournament) of 0.33 and a change in the probability of winning (Tournament-piece-rate) of 0.16, who submitted the piece rate performance to the tournament with a guess of winning. We cluster on the participant to account for there being 2 observations for each of the 84 participants. p-values of the underlying coefficients are in parenthesis.
Table VII examines changes in tournament entry under affirmative action, when we
control for the probability of winning, beliefs, and the decision to submit the piece-rate to the
relevant tournament. Conditioning on these factors affirmative action decreases the probability
that a man enters a tournament by 9 percentage points. For women, the remaining effect of
affirmative action is a 25 percentage point increase in tournament entry. Pooling men and
women we see that the decision to submit the piece rate to the AA tournament helps explain the
change in the gender gap, however, the female and affirmative action interaction term remains
significant. Thus the gender gap in tournament entry differs between the AA and ST
26
tournament.38 We ascribe this remaining difference to the competition being more gender
specific under affirmative action. Men may feel more pressure to compete when the fraction of
male competitors increases, whereas the fear of competing may diminish when women are in all
female groups.
Our results suggest that the excessive response to affirmative action in part can be
attributed to the gender gap in beliefs and attitudes towards competition being smaller in the
more gender specific competition. Thus affirmative action influences both of the factors that
initially caused women to opt out of the competition.
VI. CONCLUSION
There is a substantial literature which aims to understand how costly it is to increase the
representation of minorities. Of recent concern has been whether it is possible to improve the
representation of women in high-profile and very competitive jobs. While discrimination and
gender differences in preferences and ability help explain the absence of women in these
positions, another explanation may be that men and women respond differently to competitive
environments, with high performing women shying away from competition. Our study
contributes to this literature by asking whether an affirmative action requirement of equal
representation of women can entice more women to compete, and thereby mitigate the expected
costs of such an institutional change.
We introduce an affirmative action quota into an environment where women fail to enter
competitions they can win. The quota requires that for every man at least one woman has to be a
winner. This affirmative action quota is expected to affect tournament entry through changes in
the probability of winning, however other factors could influence entry as well. In particular the
competition is more gender specific under the quota and this may affect the two factors that
caused women to avoid the competition in the first place. A more gender-specific competition
can affect tournament entry by reducing gender differences in beliefs about relative performance,
38 The change in the gender gap is given by [Pr(AA=1, F=1, AA·F=1;X) - Pr(AA=1, F=0, AA·F=0;X)] – [Pr(AA=0, F=1, AA·F=0;X) - Pr(AA=0, F=0, AA·F=0;X)]. Conditioning only on the probability of winning the change in the gap equals 0.76. The additional controls for beliefs and the decision to submit the piece rate reduces the gap to 0.31, thus 41 percent of the change in the gap is not accounted for.
27
and by reducing gender differences in the willingness to compete. Finally, merely mentioning
affirmative action may affect entry as well.
We find that affirmative action causes a large increase in the tournament entry by women
and a decrease in the entry by men. This change in behavior goes beyond changes warranted by
the different probability in winning and we find that the factors listed above all help explain the
excessive response to the policy.
Prior to affirmative action women, including high-performing women, fail to enter the
competition. Despite there being no discrimination very few women win the tournaments. Using
this initial applicant pool the requirement that at least one woman must be hired for every man
implies that in order to hire the same number of applicants, as without the quota restriction, the
minimum standard of performance has to be lowered for women and reverse discrimination is
predicted. The expected costs of affirmative action would be substantial even if individuals
responded to the change in the probability of winning under affirmative action. However, we
show that the response is greater than that predicted. While some high-performing men drop out
of the competition, many women come in, and the overall number of high-performing
participants in the entry pool is barely affected. This change in the gender composition of the
applicant pool causes the ex post performance costs to be substantially smaller than predicted ex
ante. In fact the performance requirements for men and women are essentially the same under
affirmative action and there is limited or no reverse discrimination. This difference in ex ante and
ex post costs of implementing an affirmative action quota implies that applying such a policy
secretly or without allowing for adjustment in behavior may be particularly expensive, as the
response to the policy helps adjust for existing inefficiencies.
In the presence of suboptimal entry it may be unlikely that the behavioral response
generally eliminates the anticipated costs of the affirmative action policy. However it seems very
likely that it can reduce the costs substantially.39 Our results demonstrate that the costs of
affirmative action are sensitive to the indirect effects that occur through self selection into
competitions. Specifically, the effects of affirmative action on the set of applicants may be large
when entry decisions are not payoff maximizing. If changes in behavior are not accounted for
39 The response to the policy is likely to be sensitive to both the policy and the initial distortion of the market. It is reassuring that the results documented here have been replicated in subsequent studies using both quota and preferential versions of affirmative action (Niederle, Segal, and Vesterlund, 2012; Balafoutas and Sutter, 2012).

28
then we will exaggerate the costs of the policy. It is important to note that we are demonstrating
the corrective feature of affirmative action in an environment where there is no discrimination,
this suggests that may be circumstances where affirmative action can be justified absent
discrimination.
Research on affirmative action has mostly examined the consequences of changing the
demand side of the market (see Holzer and Neumark, 2000, for an overview). That is, the focus
has been on determining the consequences for diversity, performance, and reverse discrimination
of altering the rules for admission and hiring. A small literature has focused on the effect of
affirmative action on the supply side, as we do. For theoretical papers, see for example Coate and
Loury (1993) and Mailath, Samuelson and Shaked (2000). They show that inequality can arise
endogenously as long as otherwise (ex ante) identical agents have some identifiable
characteristic. They also discuss the potential positive and corrective effects of affirmative
action. Coate and Loury (1993) emphasize that the success of affirmative action depends on the
extent to which the policy causes employers to update their assessment of the minority candidate.
Of particular concern is whether the policy lowers the performance requirement for minority
candidates. A lower performance requirement for minorities may cause them to acquire less
human capital and further strengthen the negative stereotype. In this light it is significant to note
that we find very limited reverse discrimination. For recent empirical work on a potential supply
effect of affirmative action, Long (2004) and Card and Krueger (2005) examine how the
elimination of the affirmative action policy in California and Texas influenced college
applications. Long (2004) finds that fewer minority students send their SAT scores to top tier
colleges, while Card and Krueger (2005) show that the policy does not influence the decisions of
highly qualified minorities. Since the UC and UT systems rely on percentage rules whereby the
top 4 and 10 percent, respectively, of any graduating high school class are guaranteed admission,
these analyses unfortunately do not enable us to determine if absent such programs we may
observe ‘sub-optimal’ application decisions from highly qualified applicants.40
While our study demonstrates substantial supply side effects from the introduction of
affirmative action, the long run effects may be even greater. Increasing the representation of 40 See also Fryer and Loury (2005) whose comment on Card and Krueger is: “A more persuasive test of this hypothesis would examine the impact of affirmative action on the grades and attendance patterns of high school students. These outcomes are elastic with respect to effort, and are likely to vary with changes in students’ perceptions of college opportunities.”

29
women may improve mentoring possibilities (see e.g., Allen, 1995 and Athey, Avery and
Zemsky 2000), and change the perception of a woman’s ability to hold a high ranking position.
Perceptions can be those of women about their own aspirations or abilities or those of others.41
For example Beaman, Chattopadhyay, Duflo, Pande, and Topalova (2009) examine the effect of
introducing affirmative action quotas in Indian village councils. They find that the quota system
reduces the stereotypes about gender roles and eliminates negative bias in the assessment of the
effectiveness of female leaders.42
41 Chung (2000) notes that merely increasing the representation of women through affirmative action will not enable subsequent minority candidates to update their belief on own ability in the profession. As emphasized by Coate and Loury (1993) affirmative action may have permanent effects when it causes employers to update their assessment of the candidate. 42 For a discussion about possible cultural changes, and how perceptions correlate with female performance in math, see Pope and Sydnor (2010) and Niederle and Vesterlund (2010).
30
References:
Allen, Anita L. “The Role Model Arument and Faculty Diversity,” in S. M. Cahn, ed, The affirmative action debate. New York: Routledge, 1995, p. 121-134
Altonji, Joseph G., and Rebecca Blank "Race and Gender in the Labor Market." Handbook of Labor Economics, eds. O. Ashenfelter and D. Card, eds., Volume 3c Elsevier Science B.V., 1999, 3144-3259.
Andreoni, James, and Lise Vesterlund, “Which is the Fair Sex: Gender Differences in Altruism,” Quarterly Journal of Economics, CXVI, 2001, 293 – 312.
Athey, Susan, Christopher Avery and Peter Zemsky (2000). “Mentoring and Diversity,”American Economic Review, 90(4): 765-786.
Balafoutas, Loukas and Matthias Sutter, “Affirmative Action Policies Promote Women and Do Not Harm Efficiency in the Laboratory,” Science, 3. Feb 2012, Vol 335, 579-582.
Beaman, Lori, Raghabendra Chattopadhyay, Esther Duflo, Rohini Pande, and Petia Topalova, “Powerful Women: Does Exposure Reduce Bias?” Quarterly Journal of Economics, November 2009, Vol 124 No 4, 1497-1540.
Black, Sandra, and Philip E. Strahan, “The Division of Spoils: Rent-Sharing and Discrimination in a Regulated Industry,” American Economic Review, XCI, 2001, 814–831.
Blau, Francine D., and Lawrence M. Kahn, “The US Gender Pay Gap in the 1990s: Slowing Convergence,” NBER working paper 10853, 2004.
Bertrand, Marianne and Kevin F. Hallock, “The Gender Gap in Top Corporate Jobs.” Industrial and Labor Relations Review, LV, 2001, 3-21.
Beyer, Sylvia, “Gender Differences in the Accuracy of Self-Evaluations of Performance,” Journal of Personality and Social Psychology, LIX, 1990, 960 – 970.
Beyer, Sylvia, and Edward M. Bowden, “Gender Differences in Self-Perceptions: Convergent Evidence From Three Measures of Accuracy and Bias,” Personality and Social Psychology Bulletin, XXIII, 1997, 157 - 172.
Booth, Alison L. and Patrick J. Nolen, “Choosing to Compete: How Different Are Girls and Boys?”, Journal of Economic Behavior and Organization, 2012, Vol 81, 542-555.
Byrnes, James P., David C. Miller, and William D. Schafer, “Gender Differences in Risk Taking: A Meta-Analysis,” Psychological Bulletin, LXXV, 1999, 367-383.
Calsamiglia, Caterina, Jorg Franke and Pedro Rey-Biel, 2010, “The Incentive Effects of Affirmative Action in a Real-Effort Tournament”, working paper.
Campbell, Anne, A Mind of Her Own: The Evolutionary Psychology of Women (Oxford, UK: Oxford University Press, 2002).
Card, David and Alan B. Krueger, “Would the Elimination of Affirmative Action Affect Highly Qualified Minority Applicants? Evidence from California and Texas.” Industrial and Labor Relations Review, 58(3), 2005, 416-434.
Coate, S. and Glenn C. Loury, “Will Affirmative-Action Policies Eliminate Negative Stereotypes?” American Economic Review, 83, 1993, 1220-1240.
Chung, Kim-Sau, “Role Models and Arguments for Affirmative Action,” American Economic Review, 90, 2000, 640-648.
Croson, Rachel and Uri Gneezy, “Gender differences in preferences,” Journal of Economic Literature, June 2009, 47:2, 448-74.
Daly, Martin, and Margo Wilson, Sex, Evolution, and Behavior, 2nd ed. (Belmont, CA, Wadsworth Publishing Company, 1983)

31
Dweck, Carol S., Self-Theories: Their Role in Motivation, Personality, and Development, 2000, Psychology Press, Philadelphia.
Eckel, Catherine C. and Philip J. Grossman, “Sex and Risk: Experimental Evidence,” forthcoming, Handbook of Experimental Economics Results, Amsterdam, Elsevier Science, North-Holland.
Eckel, Catherine, and Philip J. Grossman, “Differences in the Economic Decisions of Men and Women: Experimental Evidence.” Forthcoming in Handbook of Experimental Results, edited by C. Plott and V. Smith. New York, Elsevier.
Fischbacher, Urs (2007), “z-Tree: Zurich Toolbox for Ready-made Economic experiments,” Experimental Economics, 10(2), 171-178.
Fréchette, Guillaume R., Francois Maniquet and Massimo Morelli, “Incumbents’ Interests and Gender Quotas”, American Journal of Political Science, Vol. 52, No. 4, October 2008, 891–907.
Fryer, Roland G. Jr, and Glenn C. Loury, “Affirmative Action and Its Mythology”, The Journal of Economic Perspectives, Summer 2005, 19(3), 147-162.
Gneezy, Uri, Kenneth Leonard, and John List, “Gender Differences in Competition: Evidence from a Matrilineal and a Patriarchal Society”, Econometrica, September 2009, Vol 77 No. 3, 1637-1664.
Gneezy, Uri, Muriel Niederle, and Aldo Rustichini, “Performance in Competitive Environments: Gender Differences,” Quarterly Journal of Economics, August 2003, CXVIII, p. 1049-1074.
Goldin, Claudia, and Cecilia Rouse, “Orchestrating Impartiality: The Impact of “Blind” Auditions on Female Musicians,” American Economic Review, XL, 2000, 715–742.
Harwarth, Irene, Mindi Maline, and Elizabeth DeBra, “Women’s Colleges in the United States: History, Issues, and Challenges,” Office of Educational Research and Improvement at the U. S. Department of Education report, 1997.
Hewlett, Sylvia Ann and Carolyn Buck Luce “Off Ramps and On-Ramps, Keeping Talented Women on the Road to Success,” Harvard Business Review, March 2005.
Holzer, Harry, and David Neumark, “Assessing Affirmative Action,” Journal of Economic Literature, 2000, 483-568.
Jones, Mark P., “Quota Legislation and the Election of Women: Learning from the Costa Rican Experience” Journal of Politics 2004, 66(4): 1203–23.
Lichtenstein, Sarah, Baruch Fischhoff, and Lawrence Phillips, “Calibration and Probabilities: The State of the Art to 1980”, in Judgment Under Uncertainty: Heuristics and Biases, Daniel Kahneman, Paul Slovic and Amos Tversky, eds., (Cambridge University Press: 1982).
Long, Mark C., “College Applications and the Effect of Affirmative Action.” Journal of Econometrics, 121 (1-2), July-August 2004, 319-342.
Mailath, George, Larry Samuelson and Avner Shaked, “Endogenous Inequality in Integrated Labor Markets with Two-Sided Search”, American Economic Review, March 2000, Vol. 90, No 1, 46-72.
Mobius, Markus M., Muriel Niederle, Paul Niehaus and Tanya Rosenblat, “Managing Self-Confidence: Theory and Experimental Evidence”, working paper, April 2011.
Niederle, Muriel and Lise Vesterlund, “Do Women Shy Away From Competition? Do Men Compete Too Much?” Quarterly Journal of Economics, 2007, 122, 3, 1067-1101.
32
Niederle, Muriel and Lise Vesterlund, “Explaining the Gender Gap in Math Test Scores: The Role of Competition,” Journal of Economic Perspectives, Spring 2010.
Niederle, Muriel and Lise Vesterlund, “Gender and Competition”, Annual Review in Economics, 2011, 3, 601–30.
Niederle, Muriel, Carmit Segal, and Lise Vesterlund, “Can Changing the Prizes Affect Gender Gaps in Competitive Task Selection? An Experimental Approach” 2012.
Page, Scott E., The Difference: How the Power of Diversity Creates Better Groups, Firms, Schools, and Societies, Princeton University Press, 2007.
Pope, Devin and Justin Sydnor, “A New Perspective on Stereotypical Gender Differences in Test Scores”, Journal of Economic Perspectives, Spring 2010.
Roberts, Tomi-Ann and Susan Nolen-Hoeksama, “Sex Differences in Reactions to Evaluative Feedback”, Sex Roles, 1989, Vol.21, Nos11/12, 725-747.
Ruble, Diane N., Carol L. Martin, and Sheri A. Berenbaum, “Gender Development,” in Handbook of Child Psychology, 6th ed., William Damon and Richard M. Lerner, eds. (New York: Wiley, 2006), Vol. 3, Chapter 14, pp. 858–932.
Sutter, Matthias and Daniela Rützler, “Gender differences in competition emerge early in life: Three-year old girls compete as much as boys, but older girls don’t,” working paper 2010
Weber, Andrea and Christine Zulehner, “Female hires and the success of start-up firms,” American Economic Review, Papers and Proceedings, 2010, Vol. 100(2), 358-361.


