1
Chapter 18 Opening Figure
Mendenhall Glacier
SE Alaska
Glacial till and outwash in Tacoma, west of the NallyValley
Figure 18.36
N Polar view of Earth between 22 – 15 ka showing ice sheets and sea level reduce by ~120 m
Ka = kiloannum = 1000 yr
North American Ice SheetsLast Glacial Period (ca. 20,000 yrs ago)
H-1
Puget Sound Ice
(map D Molenaar, 1987)
Today’s Puget Lowland
Puget Lobe of the Vashon Glacier ~16,000 yr ago
How do we know that we have been in an Ice Age for ~2 Myrs?
Evidence of:1. Glacial Erosion2. Glacial Sediments3. Glacial Landforms

2
Climate Since the Cenozoic (65 Ma to today)
Tukwilla Fm
Blakeley FmOhanapecosh Fm
Vashon Fm
Ma = mega annum (1 my)
Glacial Cycles Within an Ice Age
Quaternary Ice Age2 Myrs
Glacial Period
Interglacial Period
1. Glacial ErosionSeattle Area Shows Evidence for 7? Glacial Advances
Drift = any deposit of a glacier
Glacial Sediments in Puget Sound
Interglacial = time between glaciations
Puget Sound During the Ice Age (A Modern Analogy - Columbia Glacier, AK)
Austin Post

3
Dee Molenaar painting
Harry Halverson photoGlacial drift veneer of the Puget Lowland
Cascade Range
Distribution of surficial deposits and extents of Pleistocene glaciers in the vicinity of Mount Rainier (after Crandell and Miller (1974) and Walsh and others,1987) and overlain on 30-meter DEM shaded relief.
Lidar image showing glacial landformsesker
Lidar image showing glacial landforms
esker
drumlins
kettles
Figure 18.1b

4
Figure 18.20b
Braided glacial outwash stream
GLACIER
• A body of ice • Formed on land• Recrystallization of snow• Evidence of movement• Theory of glacial ages
– at present ~10% of land surface glaciated– in past, ~32% of land surface glaciated
GLACIOLOGY
• Distribution of present glaciers– Alpine vs. Continental glaciers– Develop where all of annual snow doesn’t melt
away in warm seasons• Various climates
– Most glacial ice in Antarctica– Glaciers in US
GLACIERS
• Types of Glaciers– Valley glaciers- “ice streams”
• Move down valley
– Ice Sheets & Ice Caps• Flow from high part outward
Figure 18.3a (left)
Ice cap feeding valley glaciers, New Zealand
Fig. 12.10
Antarctica

5
GLACIERS
• Growth of glaciers– Snow => Firn => Glacier Ice
• Ablation (Wastage) of glaciers (“shrinkage”)– Melting
• more melting at lower elevations– Evaporation– Calving into Icebergs
• where a glacier flows onto a sea
GLACIER BUDGET
• Positive--Advancing Glacier– Terminus moves forward
• Negative--Receding Glacier– Terminus retreats
• Zone of accumulation– Where some snow remains after the melt season
• Zone of Wastage– Where all snow & some glacier melt
• Equilibrium line– Boundary between two zones
Figure 18.7a Movement of Valley Glaciers
• Gravity driving force• Faster above & in middle of glacier• Basal sliding• Plastic flow
– “flowage”• Internal flowage (plastic flow)• Rigid zone
– Crevasses may form here
Fig. 12.08 EROSION BY GLACIERS
• Under glacier– Polishing and rounding by tools (rocks) in ice
• Roche Moutonnee “Sheep Rocks”• Striations & flutes = scratches & grooves on rock
– Rock flour produced & washed out of glacier• Above glacier
– Frost wedging takes place– Erosion by glaciers steepen slopes– Angular & rugged landscapes created

6
Glacial striations, chatter marks, and crescentic gouges upslope of Paradise at Mount Rainier
Fig. 12.12
Figure 18.6a Figure 18.6b
Figure 18.11a Figure 18.11b

7
EROSION BY GLACIERS
• Alpine landscapes due to erosion– U-shaped valleys– Hanging valleys– Truncated spurs– Cirques- at heads of valley glaciers– Rock steps
• Rock basin lakes (tarns)
– Horns (saw tooth mountains)– Aretes
Fig. 12.14
Fig. 12.16 Fig. 12.19
DEPOSITION BY GLACIERS
• Till– Unsorted debris
• Erratic• Moraine- body of till
– Lateral Moraine– Medial Moraine- where tributary joins glacier– End moraine-
• Terminal• Recessional
– Ground moraine• Drumlins
DEPOSITION BY MELTED GLACIERS
• Outwash– Stream-deposited sediment
• Sorted sediments
Braided streams typical– Kettles
• Glacial Lakes– (Varves)

8
Figure 18.16a
http://www.uwsp.edu/geO/faculty/ritter/images/lithosphere/glacial/till_DDS21_Mt%20Ranier_WA_large.jpg
Figure 18.16b
http://www.ndsu.edu/nd_geology/nd_glacial/images_glacial/outwash_valley_city.jpg
Figure 18.17 Figure 18.21a
Figure 18.21b Figure 18.33d
9
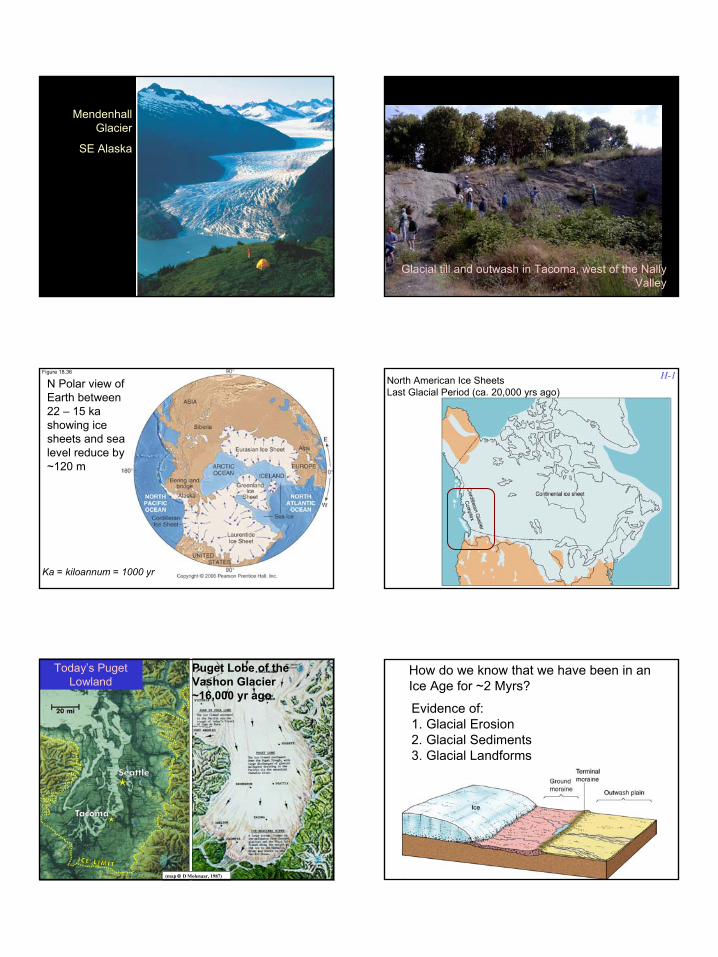
Figure 18.33e Figure 18.33f
Figure 18.33g
These visitors along the scenic corridor in 1914 had a closer look at the Nisqually Glacier’s terminus than we do today. This photo by Asahel Curtis shows the terminus just a hundred meters or so upstream of the Nisqually Bridge (the bridgewas rebuilt about 75 m farther downstream after a 1955 washout).
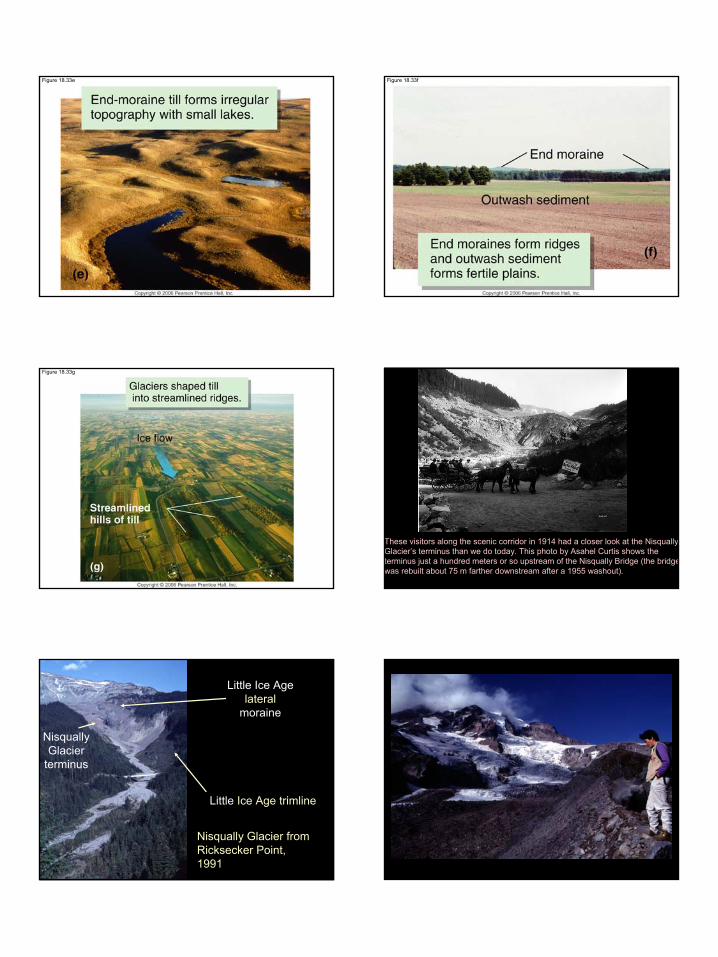
Nisqually Glacier from Ricksecker Point, 1991
Little Ice Age trimline
Little Ice Age lateral
moraine
Nisqually Glacier
terminus

10
Effects of Glacial Ages
• 4 major advances during past 2 million years (Pleistocene)– Latest peaked 20,000 years ago– Ended 10,000 years ago
• Direct effects– Scoured much of Canada & New England– Cut Great Lakes– Flattened Midwest– Ice extended into N. America– Alpine ice caps – Cascade Range, Rockies, Sierra, & other
mtns had larger valley glaciers
Effects of Glacial Ages
• Indirect effects– Lowered sea level 400 feet– Wetter climate– Pluvial Lakes
• Some were large lakes in west– Lake Bonneville– Death Valley a lake
– Crustal rebound
Figure 18.40a Figure 18.40b
“Ponding” of the FloodsH-9

11
Figure 18.20a Figure 18.22c
Figure 18.23b Figure 18.24a
Ross Ice Shelf

12
Figure 18.24b Figure 18.26
Figure 18.27a
Classic U-shaped glacial valley
Figure 18.34a
Moraines of the midwest and Great Lakes area – last Ice Age
Figure 18.35 Figure 18.34b

13
Figure 18.36
North Pole view of maximum glacial conditions about 20 ka
Ka = kiloannum = 1000 yr
Figure 18.39a
Loess deposits – wind blown glacial silts. Washington’s Palousealso contains loess.
Figure 18.39b
loess
Figure 18.41a
Figure 18.41b Figure 18.41c

14
Figure 18.41d Figure 18.41e
Figure 18.41f Figure 18.42
Pre-glacial (left) and post-glacial (right) drainage systems in North America
Figure 18.43a
(electron photomicrograph)
Figure 18.43b
How stable oxygen isotopes in microfossils record climate
The O18/O16 ratio

15
Figure 18.43c
How stable oxygen isotopes in microfossils record climate
The O18/O16 ratio
Figure 18.44
Oxygen Isotope ratio data below; glacial ice data above.
Figure 18.45 Figure 18.46a
Milankovitch cycles—what forces ice ages?
Figure 18.46b
Milankovitch cycles—what forces ice ages?
Figure 18.46c
Milankovitch cycles—what forces ice ages?

16
Figure 18.47 Table 18.1


![ba454d 458c fm cert - BEKA · FM Approvals 115] Boston Providence Turnpike P.o. Box 9102 Norwood, MA 02062 USA T: 781 762 4300 F: 781-762-9375 CERTIFICATE OF COMPLIANCE](https://cdn.vdocument.in/doc/165x107/5fc766556d057e38a600a65b/ba454d-458c-fm-cert-beka-fm-approvals-115-boston-providence-turnpike-po-box.jpg)
