
How Do We Study Sensation?How Do We Study Sensation?Psychophysics:
The study of the relationship between physical stimuli and the perception of them. Psychophysics also studies the physical characteristics of stimuli such as amp and loudness of sound.
Psychophysics:The study of the relationship between physical stimuli and the perception of them. Psychophysics also studies the physical characteristics of stimuli such as amp and loudness of sound.
Gustav FechnerGustav FechnerFather of Psychophysics
(and a lot of fun at parties)
Gustav FechnerGustav FechnerFather of Psychophysics
(and a lot of fun at parties)
Prepared by Dr. Gordon Vessels 2004

Sensation & Perception • Sensation - the process of transducing physical energy from the environment into electrical energy in neurons.
• Sensory Receptors• Transduction
• Perception – the selection, organization, & interpretation of input from sensory organs that takes place in the cerebral cortex. Prepared by Dr. Gordon Vessels 2004

Violet360nmIndigoBlueGreen500nm
YellowYellowOrangeOrange600nm600nmRed700nm
Violet360nmIndigoBlueGreen500nm
YellowYellowOrangeOrange600nm600nmRed700nm
Electromagnetic Spectrum
Electromagnetic Spectrum
Transduction - the process
of convertingstimulus energy to neural energy
Prepared by Dr. Gordon Vessels 2004

CORNEA
LENS
IRIS
SCLERA
CHOROID
RETINA
CILIARY MUSCLE
OPTIC NERVE
Picture modeled after one used by Hiohde at http://phys2.med.osaka-u.ac.jp/~hiohde/gannka/eyeball.html [email protected]

Macula
Optic Nerve
Ciliary Muscle (controls the Lens) Retina(Rods
and Cones
Eye Muscle
IrisSclera (white of the eye)
Lens
Cornea
Pupil
Fovea (point of central
focus
Blind Spot
Eye Muscle
Arranged Dr. Gordon Vessels 2004
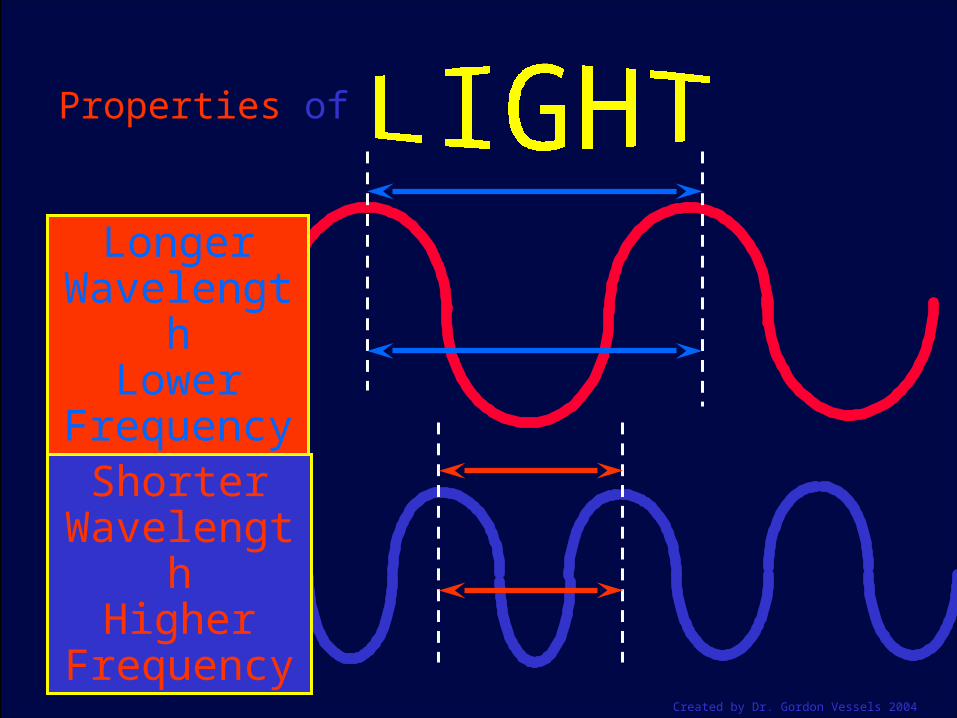
LongerWavelengt
hLower
FrequencyShorter
Wavelength
HigherFrequency
Properties of
Created by Dr. Gordon Vessels 2004

Properties of
Light
Properties of
Light
SmallerAmplitude
DullColors
SmallerAmplitude
DullColors
HigherAmplitude
BrightColors
HigherAmplitude
BrightColors
Created by Dr. Gordon Vessels 2004

Visible spectrum: 380-760 nm (nm is a billionth of a meter)
The Electromagnetic Spectrum
The Visible Spectrum
Radar Television & Radio Bands
AC Circuits
Infrared Rays
Ultraviolet Rays
X - RaysGamma Rays
Wavelength in Nanometers
Prepared by Dr. Gordon Vessels 2004

Retina (Rods & Cones)
Cones Rods Number 6 million 125 million Location in Retina Center Periphery Sensitivity to Light Low High Color Sensitive Yes No
RetinaRetinaRetinaRetina
Prepared by Dr. Gordon Vessels 2004

Photoreceptors
Rods• Light-sensitive• High sensitivity
– Perform in poor light
• Low acuity• High concentration
in periphery of retina
Cones• Color-sensitive• Low sensitivity
– Need bright light• High acuity• High concentration
at the fovea
Rods & cones connect to ganglion cells the axons of which comprise the optic
nervePrepared by Dr. Gordon Vessels 2004
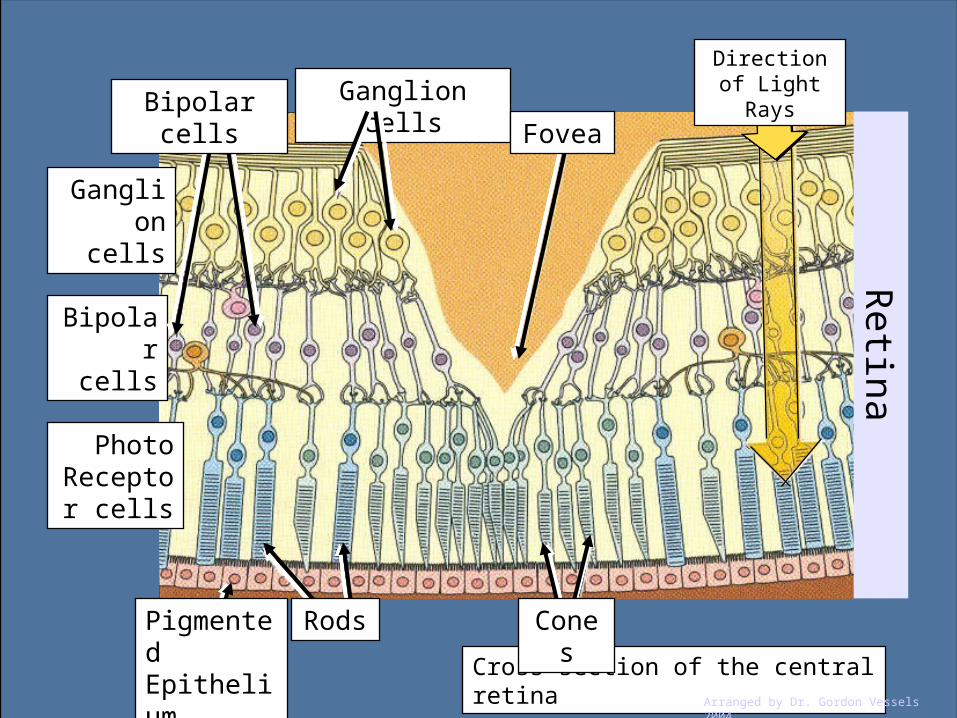
Cross section of the central retina
Ganglion cells
Ganglion cells
Bipolar cells
Photo Recepto
r cells
Retin
aBipolar
cells Fovea
Pigmented Epithelium
Rods Cones
Arranged by Dr. Gordon Vessels 2004
Direction of Light Rays

Cells in the RetinaCells in the Retina
LightLight
Ganglion CellsGanglion Cells
InterneuronsInterneurons
Bipolar CellsBipolar Cells
Prepared by Dr. Gordon Vessels 2004
ConeCone RodRod
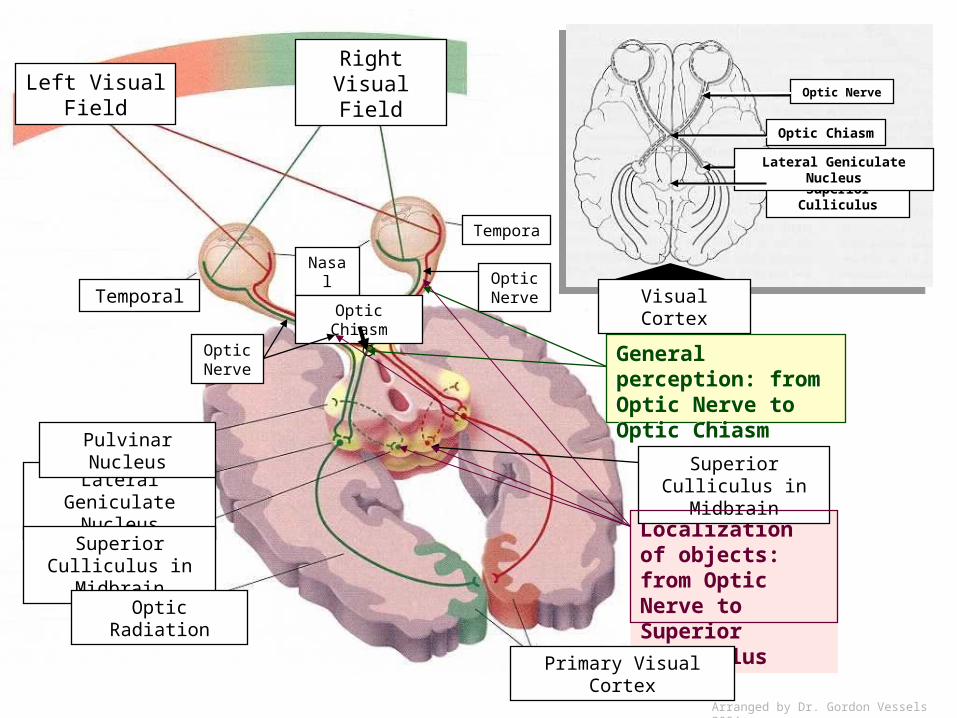
Lateral Geniculate Nucleus
Superior Culliculus in
MidbrainOptic Radiation
Pulvinar Nucleus
Temporal
Tempora
Visual Cortex
Nasal
Optic Chiasm
Right Visual FieldLeft Visual
Field
○
Optic Nerve
Optic Nerve
Localization of objects: from Optic Nerve to Superior Culliculus
Localization of objects: from Optic Nerve to Superior Culliculus
Superior Culliculus in
Midbrain
Primary Visual Cortex
Superior Culliculus
Lateral Geniculate Nucleus
Optic Chiasm
Optic Nerve
General perception: from Optic Nerve to Optic Chiasm
General perception: from Optic Nerve to Optic Chiasm
Arranged by Dr. Gordon Vessels 2004

Visual Information Processing
Retinal ProcessingRods & Cones Bipolar Cells Ganglion Cells
Feature DetectionDetector cells respond to elementary features
AbstractionHigh-level cells respond to combined information from feature-detector cells
RecognitionBrain matches the constructed
image with images stored in long-term memoryClick here to learn more
Prepared by Dr. Gordon Vessels 2004

Recap: How the Eye Works
• Light reflects off objects. Reflected light passes through pupil and lens to focus on the retina.
• Muscles change the shape of the lens to focus the image on the retina.
• Receptors in the retina (both rods & cones) change light into neural signals (transduction).
• Cones provide for visual acuity.• Rods offer night vision + brightness
information.• Daytime vision is best at the fovea where
cones are predominant.
Arranged by Dr. Gordon Vessels 2004
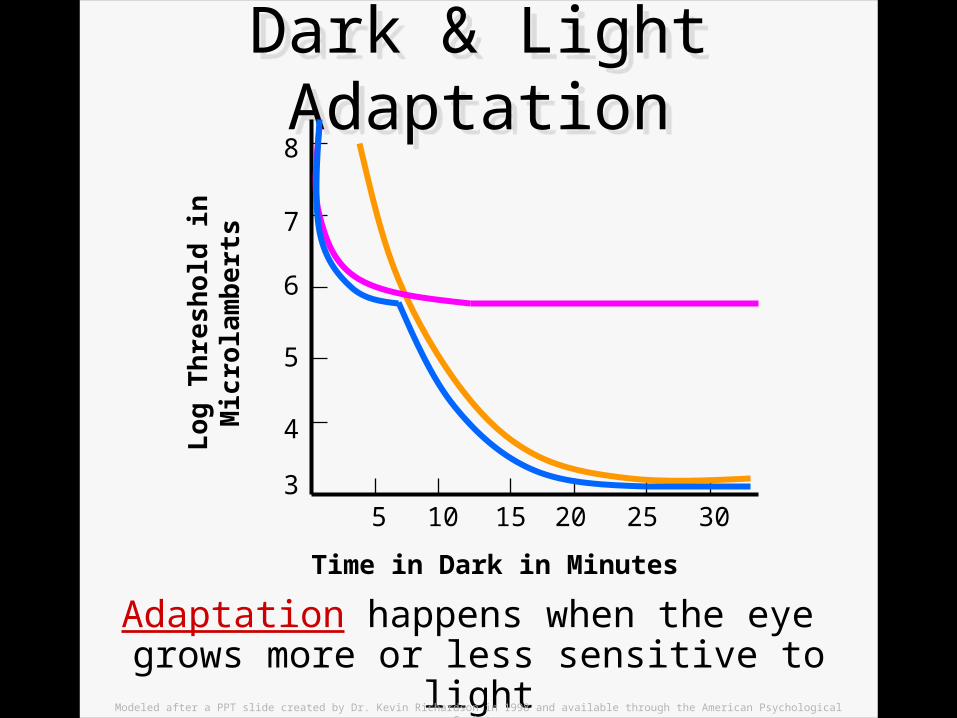
Dark & Light AdaptationDark & Light Adaptation
Adaptation happens when the eye grows more or less sensitive to light
Modeled after a PPT slide created by Dr. Kevin Richardson in 1998 and available through the American Psychological Society.
Time in Dark in Minutes
Lo
g T
hre
sho
ld in
M
icro
lam
ber
ts
8
7
6
5
4
35 10 15 20 25 30

Absolute ThresholdsAbsolute Thresholds
Vision:On a clear, dark night
you can see a candle from
30 miles away.
What is the minimum stimulation necessary to detect a stimulus 50% of the time?
Arranged by Dr. Gordon Vessels 2004

Detecting a weak signal from a stimulus depends on
Detecting a weak signal from a stimulus depends on1. The signal’s
strength and2. Your internal
mental state (experience, motivation, mood, fatigue, needs, adaptation, etc.
1. The signal’s strength and
2. Your internal mental state (experience, motivation, mood, fatigue, needs, adaptation, etc.
Do absolute
thresholds really exist?
Do absolute
thresholds really exist?
Arranged by Dr. Gordon Vessels 2004
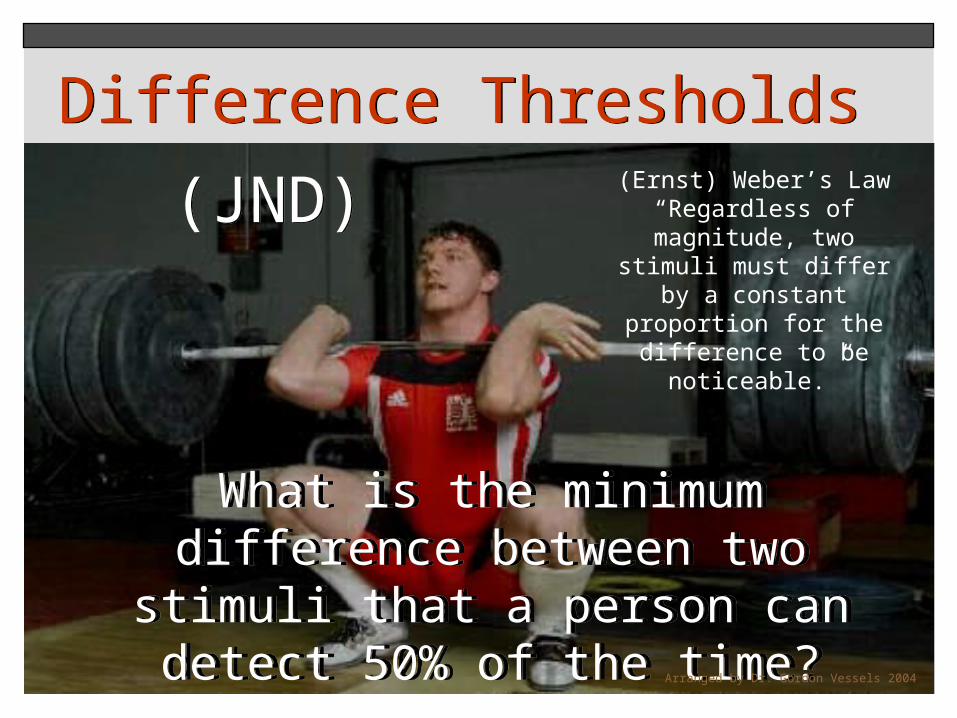
What is the minimum difference between two stimuli that a
person can detect 50% of the time?
What is the minimum difference between two stimuli that a
person can detect 50% of the time?
Difference Thresholds
(JND)
Difference Thresholds
(JND) (Ernst) Weber’s Law“Regardless of
magnitude, two stimuli must differ by a
constant proportion for the difference to be
noticeable.”
Arranged by Dr. Gordon Vessels 2004
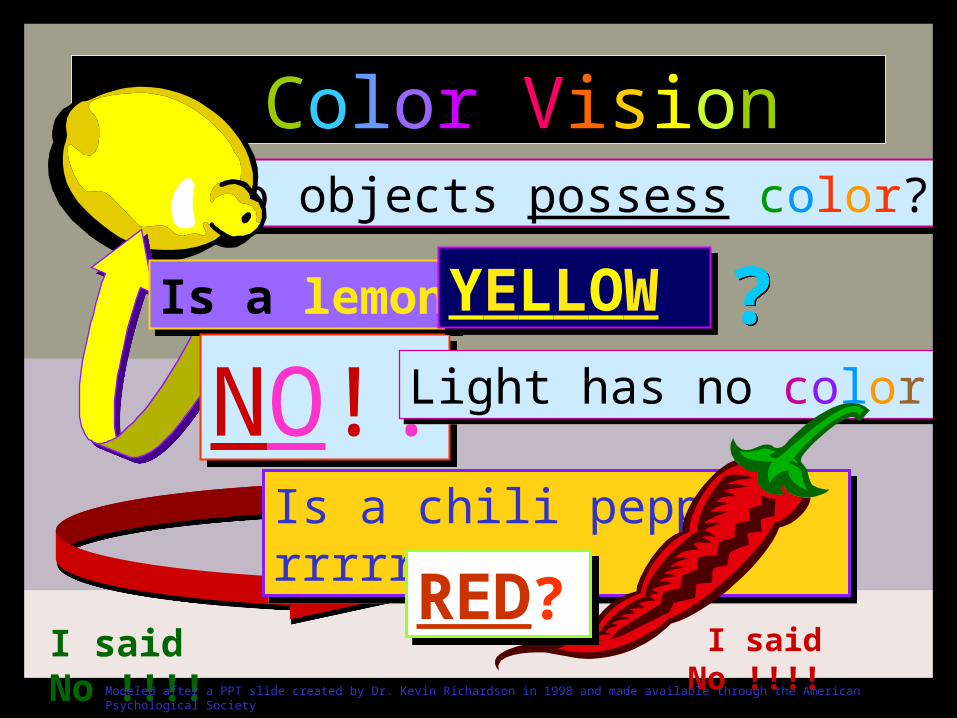
Color VisionDo objects possess color?Do objects possess color?
Is a lemonIs a lemon
NO!!NO!! Light has no color.Light has no color.
Is a chili pepper rrrrrrrrIs a chili pepper rrrrrrrr
RED?RED?
YELLOWYELLOW
??
I said No !!!!I said No !!!!Modeled after a PPT slide created by Dr. Kevin Richardson in 1998 and made available through the American Psychological Society
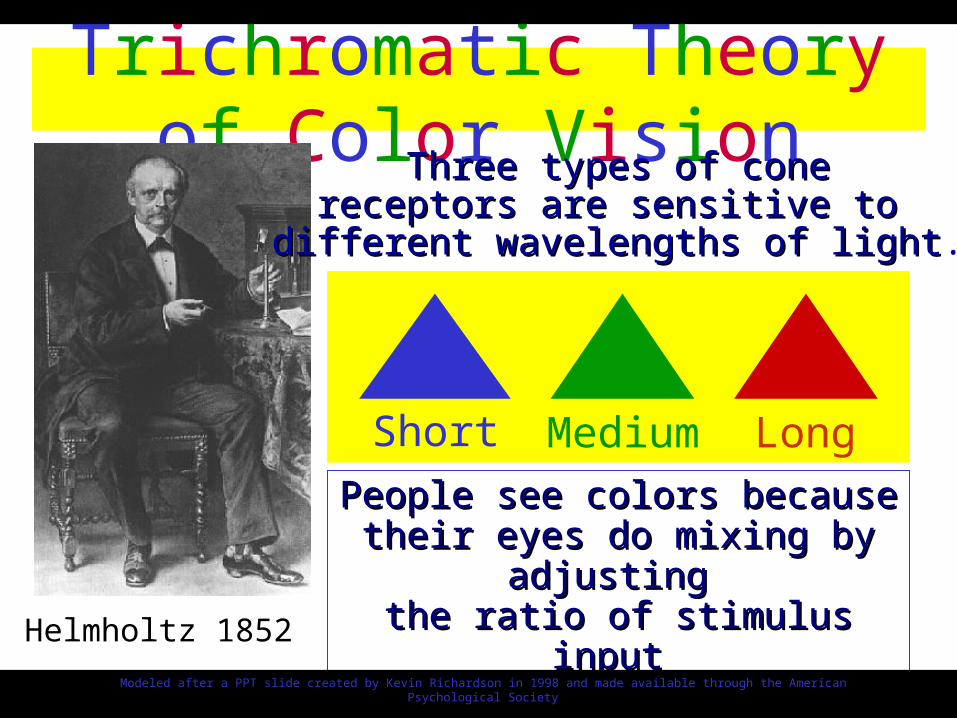
Trichromatic Theory of Color Vision
Helmholtz 1852
Three types of coneThree types of conereceptors are sensitive to receptors are sensitive to
different wavelengths of lightdifferent wavelengths of light.
Short Medium Long
People see colors because their People see colors because their eyes do mixing by adjusting eyes do mixing by adjusting
the ratio of stimulus input the ratio of stimulus input from these three types of cones.from these three types of cones.
Modeled after a PPT slide created by Kevin Richardson in 1998 and made available through the American Psychological Society

Opponent Process Theory
R
G
B
Y
B
W
Eye contains 3 Eye contains 3 mechanisms mechanisms that produce that produce antagonistic antagonistic responses to responses to
three pairs three pairs of colors.of colors.
Why?Why?Afterimages Afterimages
and color and color deficiencydeficiency
Click here for more
Click here for more
Click here for more
Arranged by Dr. Gordon Vessels 2004
Arranged by Dr. Gordon Vessels 2004
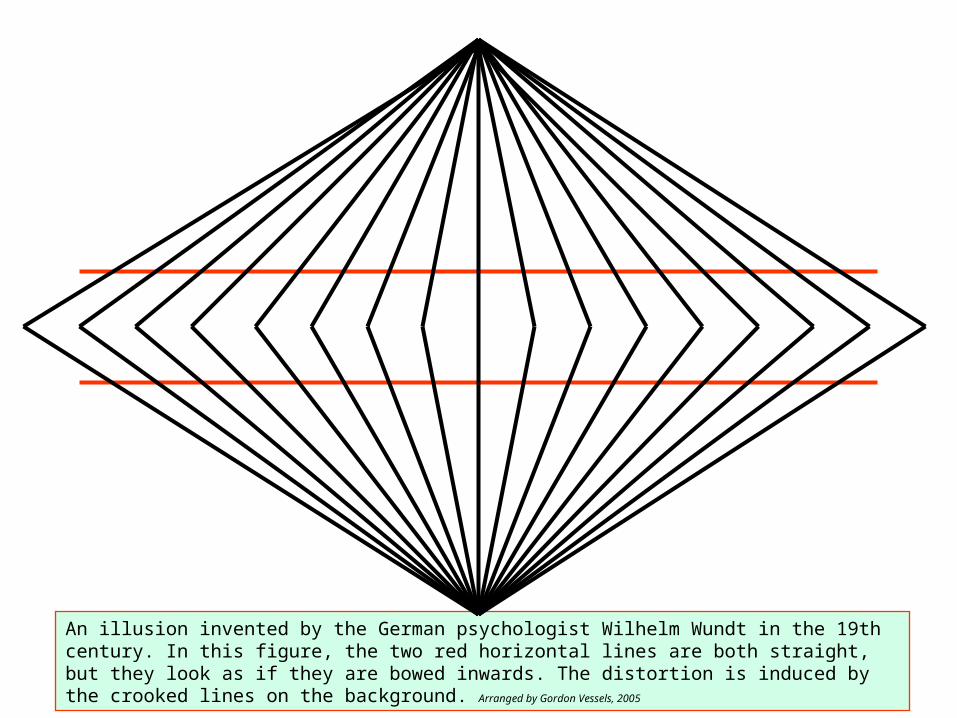
An illusion invented by the German psychologist Wilhelm Wundt in the 19th century. In this figure, the two red horizontal lines are both straight, but they look as if they are bowed inwards. The distortion is induced by the crooked lines on the background. Arranged by Gordon Vessels, 2005
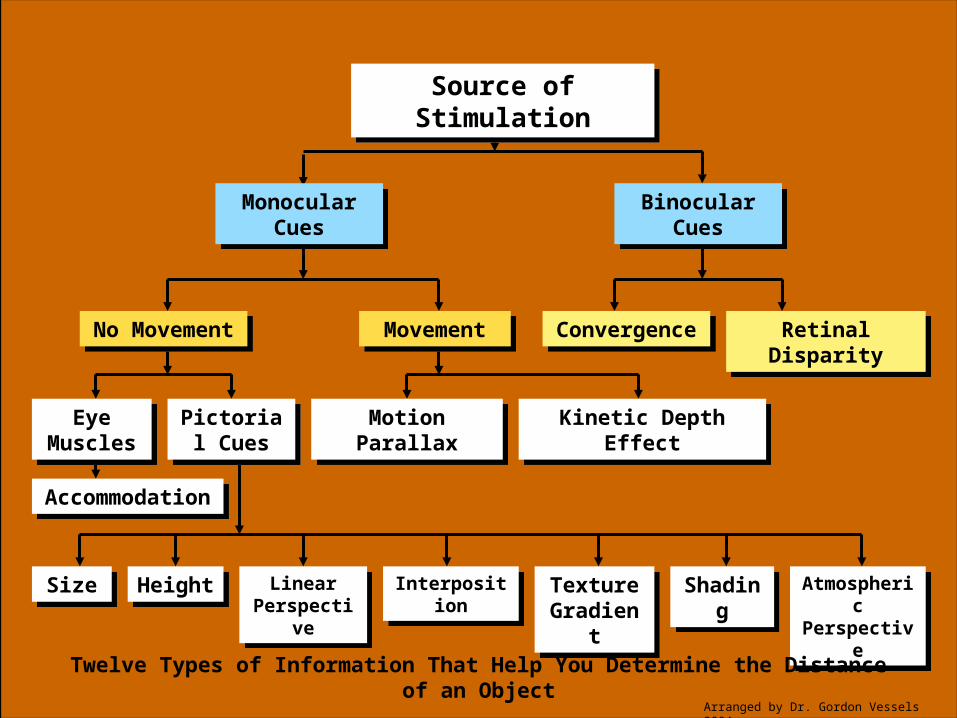
SizeSize HeightHeight Linear Perspective
Linear Perspective
InterpositionInterposition Texture Gradient
Texture Gradient
ShadingShading Atmospheric Perspective
Atmospheric Perspective
Pictorial Cues
Pictorial Cues
Eye Muscles
Eye Muscles
No MovementNo Movement MovementMovement
Motion ParallaxMotion Parallax Kinetic Depth EffectKinetic Depth Effect
AccommodationAccommodation
ConvergenceConvergence Retinal DisparityRetinal Disparity
Monocular Cues
Monocular Cues
Binocular Cues
Binocular Cues
Source of StimulationSource of Stimulation
Twelve Types of Information That Help You Determine the Distance of an Object
Arranged by Dr. Gordon Vessels 2004
Photographs combined by Dr. Gordon Vessels 2004
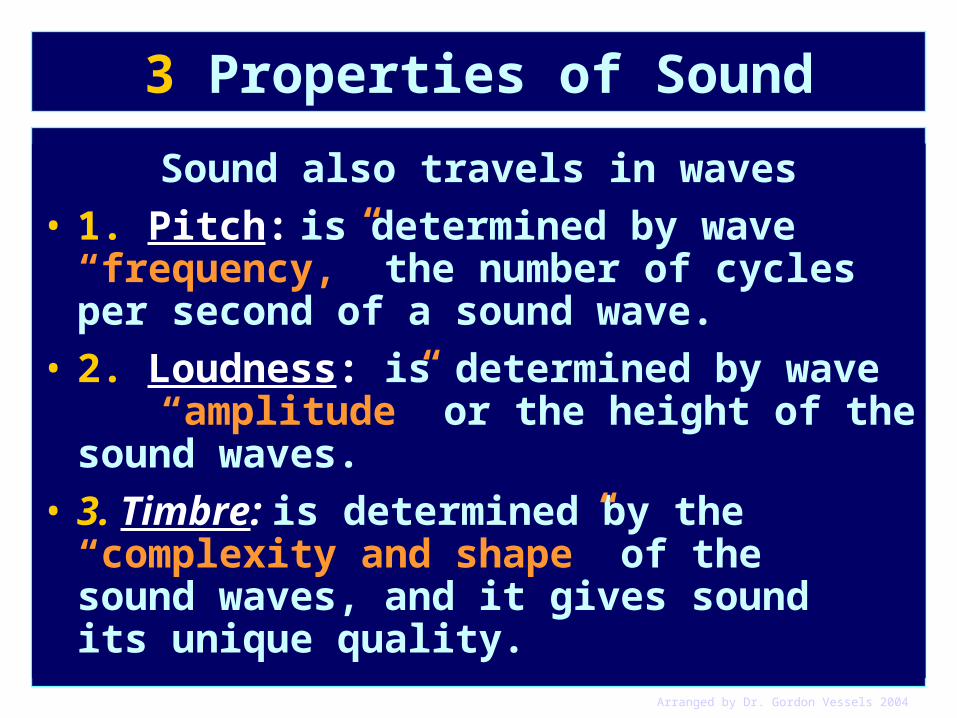
3 Properties of Sound
Sound also travels in waves• 1. Pitch: is determined by wave
“frequency,” the number of cycles per second of a sound wave.
• 2. Loudness: is determined by wave“amplitude” or the height of thesound waves.
• 3. Timbre: is determined by the “complexity and shape” of the sound waves, and it gives sound
its unique quality.Arranged by Dr. Gordon Vessels 2004

Units of Measurement for Sound
• hertz (Hz): used to measure pitch (frequency), the number of cycles per second of the sound waves
– a baby’s cry is at about 3,000 Hz
• decibel (db): reflects the loudness (amplitude) of the sound wave
– Speech is at about 70 db
Arranged by Dr. Gordon Vessels 2004
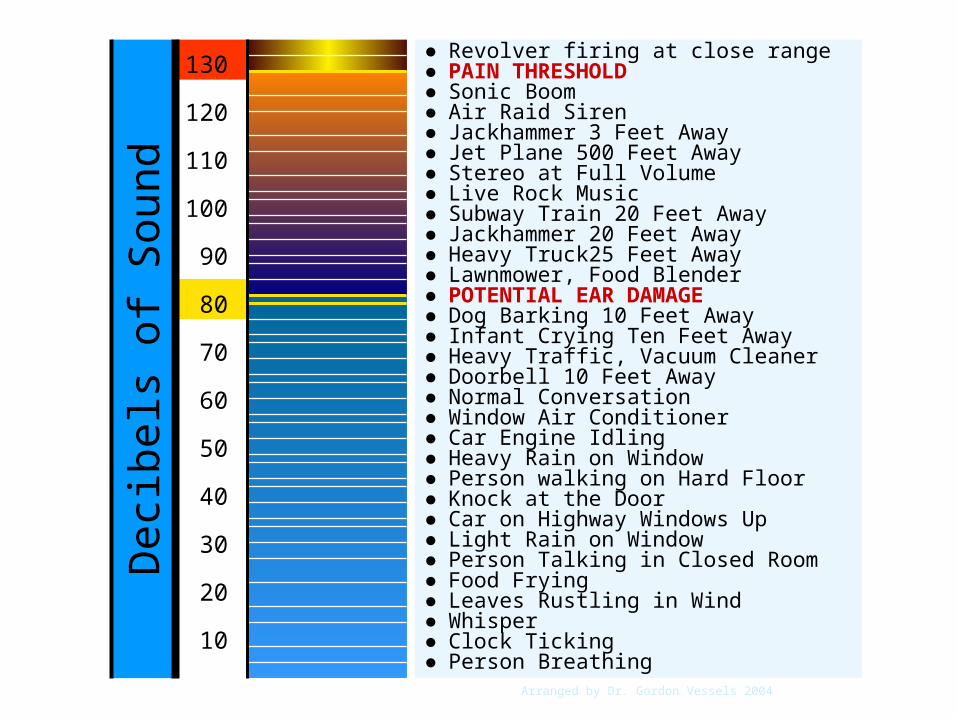
● Revolver firing at close range● PAIN THRESHOLD● Sonic Boom● Air Raid Siren● Jackhammer 3 Feet Away● Jet Plane 500 Feet Away● Stereo at Full Volume● Live Rock Music● Subway Train 20 Feet Away● Jackhammer 20 Feet Away● Heavy Truck25 Feet Away● Lawnmower, Food Blender● POTENTIAL EAR DAMAGE● Dog Barking 10 Feet Away● Infant Crying Ten Feet Away● Heavy Traffic, Vacuum Cleaner● Doorbell 10 Feet Away● Normal Conversation● Window Air Conditioner● Car Engine Idling● Heavy Rain on Window● Person walking on Hard Floor● Knock at the Door● Car on Highway Windows Up● Light Rain on Window● Person Talking in Closed Room● Food Frying● Leaves Rustling in Wind● Whisper● Clock Ticking● Person Breathing
Deci
bels
of
Sou
nd
130
120
110
100
90
80
70
60
50
40
30
20
10
Arranged by Dr. Gordon Vessels 2004

Sound WavesSound Waves
Amplitude (Loudness)Strength or height
of the wave
Frequency (Pitch)Distance between consecutive peaks
Mix (Timbre)Interaction of different
waves
1 Hertz = 1 Cycle/Sec1 Hertz = 1 Cycle/Sec Human HearingHuman Hearing20 - 20k Hz20 - 20k Hz
Arranged by Dr. Gordon Vessels 2004; modeled after a slide creared by Dr. Kevin Richardson (1998) and available through the American Psychological Society.
malleus
cochlea
incus
pinnapinna
tympanic membranetympanic membrane
auditory/8th nerve
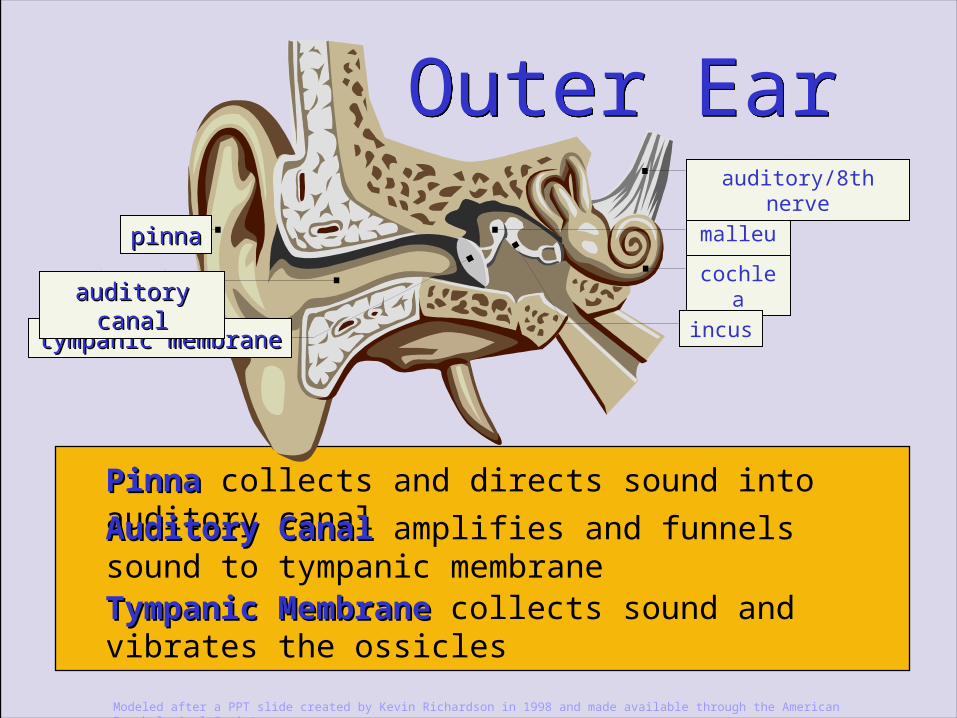
Outer EarOuter Ear
Tympanic MembraneTympanic Membrane collects sound and vibrates the ossicles
PinnaPinna collects and directs sound into auditory canalAuditory CanalAuditory Canal amplifies and funnels sound to tympanic membrane
auditory auditory canalcanal
Modeled after a PPT slide created by Kevin Richardson in 1998 and made available through the American Psychological Society
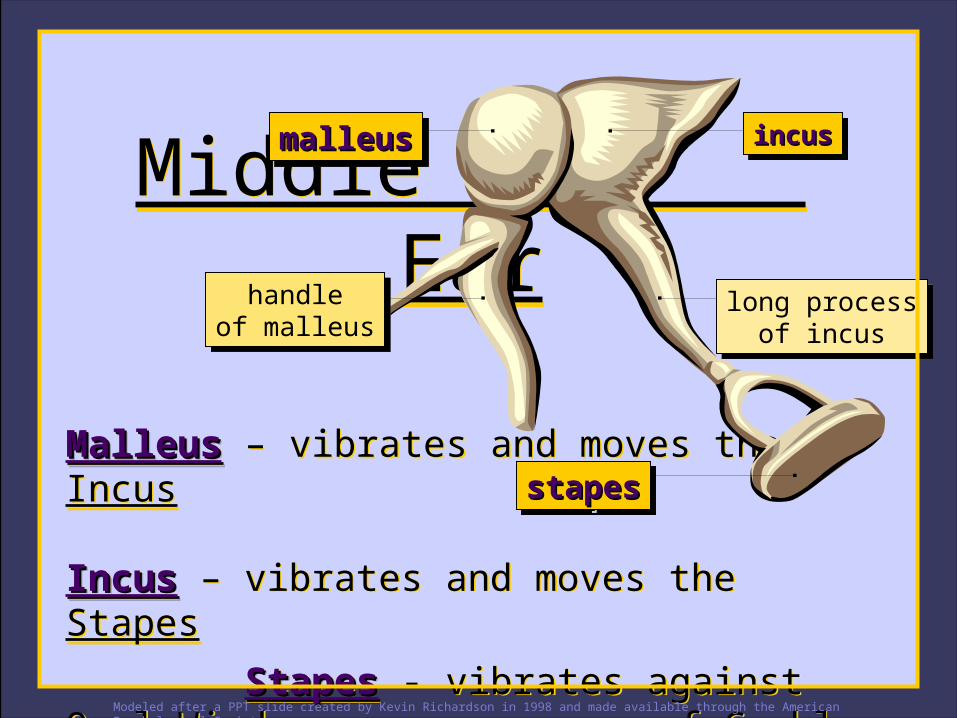
Middle EarMiddle Ear
MalleusMalleus – vibrates and moves the Incus
IncusIncus – vibrates and moves the Stapes
StapesStapes - vibrates against Oval Window of Cochlea
MalleusMalleus – vibrates and moves the Incus
IncusIncus – vibrates and moves the Stapes
StapesStapes - vibrates against Oval Window of Cochlea
malleusmalleusmalleusmalleus incusincusincusincus
handleof malleus
handleof malleus
long processof incus
long processof incus
stapesstapesstapesstapes
Modeled after a PPT slide created by Kevin Richardson in 1998 and made available through the American Psychological Society

Inner Ear
lateralsemicircular
canal
lateralsemicircular
canal
posteriorsemicircular
canal
posteriorsemicircular
canal
vestibulevestibule
anteriorsemicircular
canal
anteriorsemicircular
canal
cochleacochleacochleacochlea
CochleaCochlea is filled with fluid & contains Hair-cell receptors for hearing
Basilar MembraneBasilar Membrane divides length of cochlea and holds the hair cells
Modeled after a PPT slide created by Kevin Richardson in 1998 and made available through the American Psychological Society

3. The moving fluid sets the Basilar Membrane moving inside the Cochlea
3. The moving fluid sets the Basilar Membrane moving inside the Cochlea
2. The vibrating eardrum causes the bones of the middle ear to strike each other, amplifying and carrying the vibrations to the oval window and on the fluid in the coiled Cochlea of the Inner Ear.
2. The vibrating eardrum causes the bones of the middle ear to strike each other, amplifying and carrying the vibrations to the oval window and on the fluid in the coiled Cochlea of the Inner Ear.
1. The first stage of the hearing process is a series of vibrations. Sound waves enter the Outer Ear and travel to the Eardrum, causing it to vibrate.
1. The first stage of the hearing process is a series of vibrations. Sound waves enter the Outer Ear and travel to the Eardrum, causing it to vibrate.
5. The Auditory Nerve carries impulses to the brain.
5. The Auditory Nerve carries impulses to the brain.
6. When the nerve impulses reach the Temporal Lobe, they are interpreted as sounds.
6. When the nerve impulses reach the Temporal Lobe, they are interpreted as sounds.
Cross-section of Cochlea
Cochlear Nerve Basilar MembraneCochlear Nerve
Fibers
Organ of
Corti
Tectorial Membrane Hair Cells
Eardrum
Auditory Nerve
Vestibular OrganPinna
Ear Canal
Cochlea
Extracted from Davis & Palladino text entitled Psychology; re-arranged for PPT by Dr. Gordon Vessels
2004 ©
4. The Organ of Corti on top of the Basilar Membrane also moves. Inside the Organ of Corti, thousands of tiny receptor cells are topped by a bundle of hair-like fibers. As the Basilar Membrane vibrates, the fibers bend, stimulating the Receptor Cells to send a signal through afferent nerve endings, which join to form the Auditory Nerve
4. The Organ of Corti on top of the Basilar Membrane also moves. Inside the Organ of Corti, thousands of tiny receptor cells are topped by a bundle of hair-like fibers. As the Basilar Membrane vibrates, the fibers bend, stimulating the Receptor Cells to send a signal through afferent nerve endings, which join to form the Auditory Nerve

Hair Cell in the Organ of Corti
Supporting Cells
Hair Cells
Efferent Nerve Ending
Afferent Nerve Ending
Cell Nuleus
Hair Fibers
Basilar Membrane
Arranged by Dr. Gordon Vessels 2004
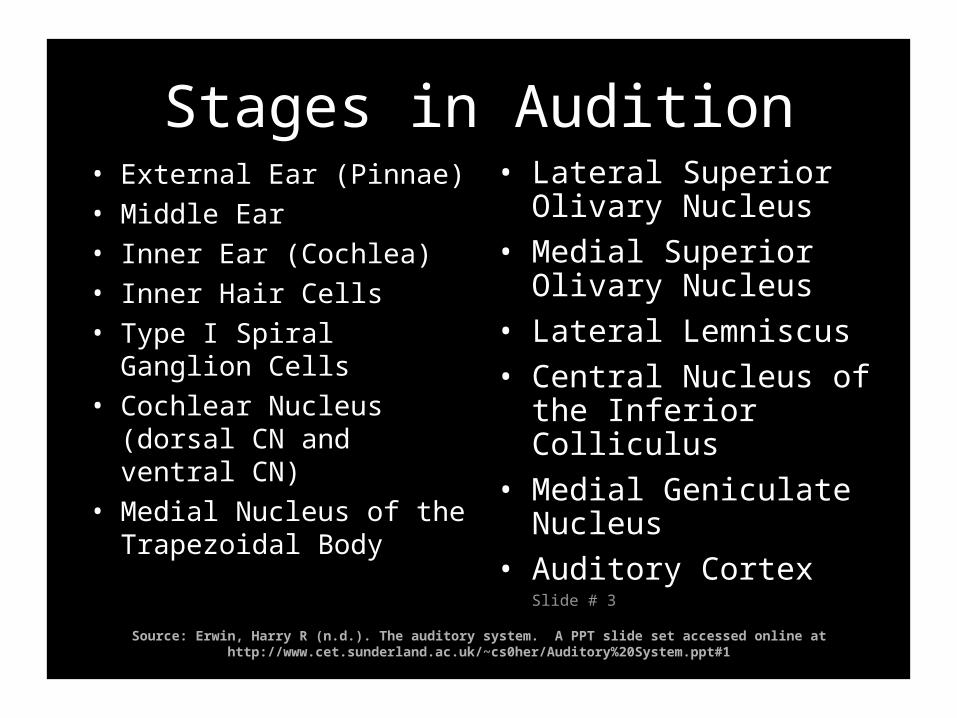
Stages in Audition• External Ear (Pinnae)
• Middle Ear
• Inner Ear (Cochlea)
• Inner Hair Cells
• Type I Spiral Ganglion Cells
• Cochlear Nucleus (dorsal CN and ventral CN)
• Medial Nucleus of the Trapezoidal Body
• Lateral Superior Olivary Nucleus
• Medial Superior Olivary Nucleus
• Lateral Lemniscus
• Central Nucleus of the Inferior Colliculus
• Medial Geniculate Nucleus
• Auditory CortexSlide # 3
Source: Erwin, Harry R (n.d.). The auditory system. A PPT slide set accessed online at http://www.cet.sunderland.ac.uk/~cs0her/Auditory%20System.ppt#1
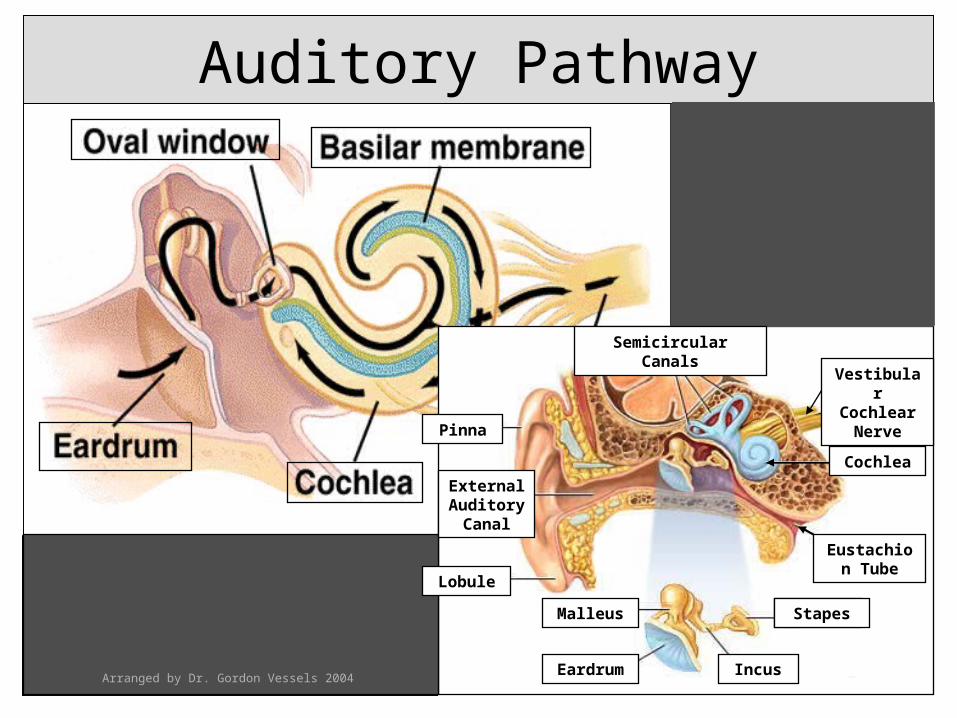
Auditory Pathway
Eustachion Tube
Vestibular Cochlear
Nerve
Semicircular Canals
Cochlea
Stapes
IncusEardrum
StapesMalleus
Pinna
Lobule
External Auditory
Canal
Arranged by Dr. Gordon Vessels 2004

Diana Deutsch is a Professor of Psychology at the University of California, San Diego who conducts research on perception and sound memory, including music. She discovered many musical illusions and paradoxes: the octave illusion, the scale illusion, the glissando illusion, the tritone paradox, and the cambiata
illusion. She studies the way we hold music in memory and how we relate the sounds of speech and music. Her ongoing
research focuses on the question of absolute pitch or why some rare individuals have it. Information retrieved from Dr. Deutsch at http://www-psy.ucsd.edu/%7Eddeutsch/
The pattern that produces the cambiata illusion, and a way it is often perceived.
Underlined words above are links to webpages
Arranged by Dr. Gordon Vessels 2004
Pictures are copied from Dr. Deutsch’s CDs available online at the address
above.

Exploring the Sense
of Smell
Olfactory Epithelium
Olfactory Receptor Cells
Olfactory Bulb
Nasal Chache
Bone
Olfactory Nerve
Olfactory Muccsa
A Sniff
Breathing In Normally
Breathing Out Normally
Olfactory Bulb
Olfactory Bulb
Olffactory Bulb
Arranged by Dr. Gordon Vessels 2005

Receptor Cilia
Olf
acto
ry
Ep
ith
eliu
mM
ucu
s
Layer
The Sense of Smell
NEUROBIOLOGYGary G. Matthews
Blackwell Science
Modified for PPT slide by Dr. Gordon Vessels
Bone at Base of
Skull
Support Cells}
}}
Arranged by Dr. Gordon Vessels 2005
Basal Cell To
Brain
Olfactory Receptor
Cell
To Brain

Membrane Depolarization
Odorant Receptor Protein
Cilium of Olfactory
Cell
Adenylyl cyclase
Ca 2+ Na+
Ca 2+Cl-
cAMP
Ca 2+ Na+
Cl-
Dendrite of Olfactory
Cell
cAMPATP
Ca2+
Membrane Depolarizatio
n
Arranged by Dr. Gordon Vessels 2005
Odorant Molecules
G-Protein

Epithelial Cells
Arranged by Dr. Gordon Vessels 2005
Sense of Smell
Bone
Olfactory Bulb
Nerve Axons
Cilia
Sensory Cells
Olfactory Nerve
Volatile Molecule
s
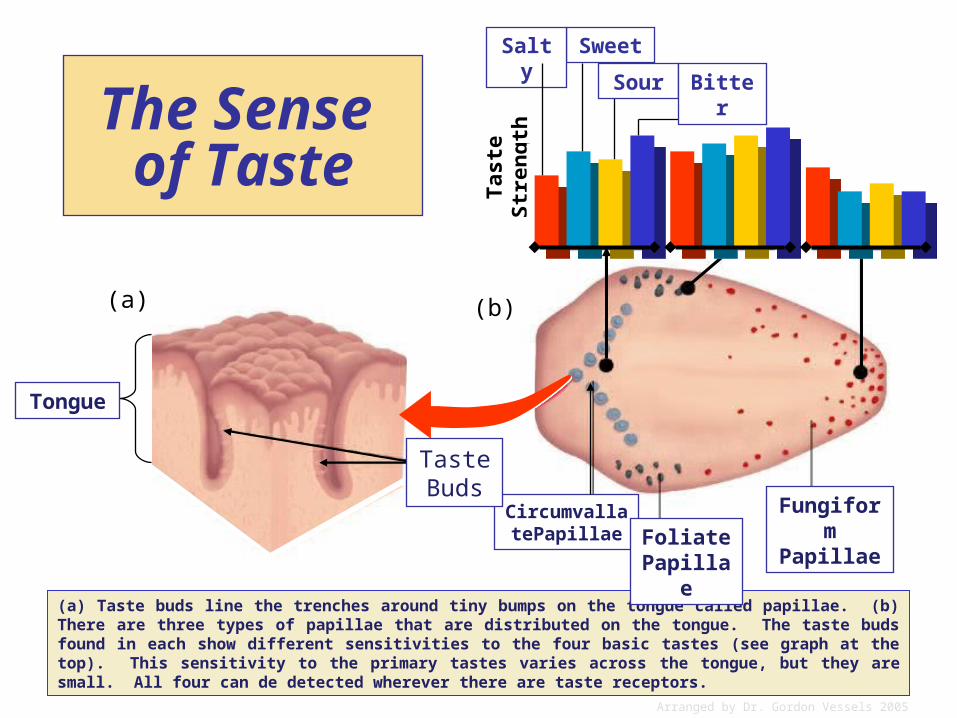
(a) Taste buds line the trenches around tiny bumps on the tongue called papillae. (b) There are three types of papillae that are distributed on the tongue. The taste buds found in each show different sensitivities to the four basic tastes (see graph at the top). This sensitivity to the primary tastes varies across the tongue, but they are small. All four can de detected wherever there are taste receptors.
(a) (b)
Fungiform Papillae
CircumvallatePapillae Foliate
Papillae
Tas
te S
tren
gth
SweetSalty
Sour Bitter
Taste Buds
Tongue
The Sense of Taste
Arranged by Dr. Gordon Vessels 2005

Top-Down versus Bottom-Up Perception
Top-Down versus Bottom-Up Perception
• Top-Down– Perceive the whole and then individual
parts as needed.– Experience-driven as opposed to
stimulus or input-data driven.– Quick and highly inferential but also a
source of misperception.
• Bottom-up– Perceive the individual parts and
organize them into a whole, if possible.– Information available in the stimulus
itself.
Arranged by Dr. Gordon Vessels 2005

Bottom-Up Processing
Prior Knowledge, Experience, etc.
Prior Knowledge, Experience, etc.
Stimuli ProcessingStimuli Processing
PerceptionPerception
Stimuli InputCreated by Dr. Gordon Vessels 2005
David Marr’s Computational Bottom-Up Approach
• Marr wanted to understand mechanisms of vision rather than just behaviors associated with it.
• …he wanted to link neurophysiology with psychology.
• He took an information processing view of the mind…
• …and aimed to describe perception in terms of computations on sense data…
• …to extract high level visual experience.Source: Bell, Vaughan (2004). Perception and perceptual distortion. A PPT presentation retrieved at
http://www.cardiff.ac.uk/psych/home/bellv1/ Used here with the author’s written permission. Slide arrangement by Vessels, 2005.

Marr’s Stages of Visual Processing
• Marr proposed there were distinct stages of processing in visual perception:
» Stage 1: Raw Primal Sketch
» Stage 2: Complete Primal Sketch
» Stage 3: 2½D Sketch
» Stage 4: Full 3D Representation
Source: Bell, Vaughan (2004). Perception and perceptual distortion. A PPT presentation retrieved at http://www.cardiff.ac.uk/psych/home/bellv1/ Used here with the author’s written permission. Slide arrangement by Vessels, 2005.

Stage 1: Raw Primal Sketch
This involves the extraction of information regarding edges and
intensity changes.Source: Bell, Vaughan (2004). Perception and perceptual distortion. A PPT presentation retrieved at http://www.cardiff.ac.uk/psych/home/bellv1/ Used here with the author’s written permission. Slide arrangement by Vessels, 2005.
Stage 2: Complete Primal Sketch• After the Raw Primal Sketch…
• Marr [proposed]… we create a Complete Primal Sketch by grouping surfaces and common areas.
• The Gestalt Psychologists of the early 19th Century demonstrated many different ways in which we can group objects.
Source: Bell, Vaughan (2004). Perception and perceptual distortion. A PPT presentation retrieved at http://www.cardiff.ac.uk/psych/home/bellv1/ Used here with the author’s written permission. Slide arrangement by Vessels, 2005.
Stage 3: 2½D Sketch
• After gaining information about groupings and surfaces, the viewer needs some spatial information.
• Marr called this stage the 2½D Sketch to emphasis that this stage does not give a full 3D representation.
• Rather, just an estimate of the spatial locations of objects and materials in relation to the viewer.
Source: Bell, Vaughan (2004). Perception and perceptual distortion. A PPT presentation retrieved at http://www.cardiff.ac.uk/psych/home/bellv1/ Used here with the author’s written permission. Slide arrangement by Vessels, 2005.

2½ D Sketch: Depth Cues2½ D Sketch: Depth Cues
• We perceive much information from which we infer depth:
» Binocular disparity
» Texture gradients
» Occlusion
» Convergence
» Relative Size
• We perceive much information from which we infer depth:
» Binocular disparity
» Texture gradients
» Occlusion
» Convergence
» Relative Size
Source: Bell, Vaughan (2004). Perception and perceptual distortion. A PPT presentation retrieved at http://www.cardiff.ac.uk/psych/home/bellv1/ Used here with the author’s written permission. Slide arrangement by Vessels, 2005.
Stage 4: 3D Representation
• The final stage of Marr’s theory.
• A full 3D description of our spatial environment involving the identification of the structure of objects and materials in our visual field.
• It allows us to work out the 3D environment from a non-egocentric point-of-view.
Source: Bell, Vaughan (2004). Perception and perceptual distortion. A PPT presentation retrieved at http://www.cardiff.ac.uk/psych/home/bellv1/ Used here with the author’s written permission. Slide arrangement by Vessels, 2005.

Gregory on Top-Down Perception • Gregory proposes that we use our prior
“experience of the world to shape how we perceive” stimuli we encounter in it.
• His theory of perception is called Top-Down,
• Which means we use activated conceptual schemas and memory networks (our stored knowledge), more or less automatically and subconsciously, to shape our perceptions or to interpret our sensory input ― sometimes correctly and sometimes not.
• He confirmed many of his theoretical propositions using visual illusion research.
Primary source Bell, Vaughan (2004). Perceptions and perceptual distortions, a PPT show accessed at http://www.cf.ac.uk/psych/home/bellv1/conf/VaughanPerceptionLecture2004.ppt#1. Written permission granted 5-5-05.

Top-Down Processing
Stimuli ProcessingStimuli Processing
PerceptionPerception
Stimuli Input
Prior Knowledge, Experience, etc. Prior Knowledge, Experience, etc.
Personality Temperament
Culture Social Class
Values Beliefs
Prejudices Attitudes
Immediate Mental Set
Presence of Authority
Present Fatigue Energy Level
Prior Stimuli Perceived
Occupation Education
Needs, Moods Mental Health
Knowledge Vocabulary
Specific Life Experiences
Long-term Memory Schemas
Created by Dr. Gordon Vessels 2005

If all of these people were at the same football game, who among them was most likely to have perceived what actually happened on a controversial play where the receiver may have fumbled the ball before his knees touched the ground? Whose perceptions were the most bottom up? Whose perceptions were the most top-down and thus influenced and quickened in terms of inference by their present needs, biases, and heightened emotion? Whose perception may have been the most accurate and objective based on his or her knowledge of the game? When the head referee reviewed the replays, did he use top-down or bottom-up perception primarily? What top-down influence may have made it possible for his perceptions to have been highly accurate? Did these people literally see something different? Do they really believe what they claimed to have seen?

What do you see? A face looking
down? The word Liar in script or cursive? Those who first read stories about deception were more inclined than others to see
the word Liar.
What do you see? The word liar in
script or cursive? A face looking down?
Those shown artwork with faces were
more inclined than others to see the
word liar.
Arranged by Dr. Gordon Vessels 2004

Top-Down & Bottom-Up Processing
Prior Knowledge, Experience, etc.
Prior Knowledge, Experience, etc.
Stimuli ProcessingStimuli Processing
PerceptionPerception
Stimuli InputCreated by Dr. Gordon Vessels 2005


