1/14/2017
1
How Does Artificial Intelligence Work with Remote Sensing Technologies for
Multi-scale Environmental Change Detection?
Prof. Ni-Bin ChangDirector, Stormwater Management Academy
University of Central FloridaOrlando, FL, USA
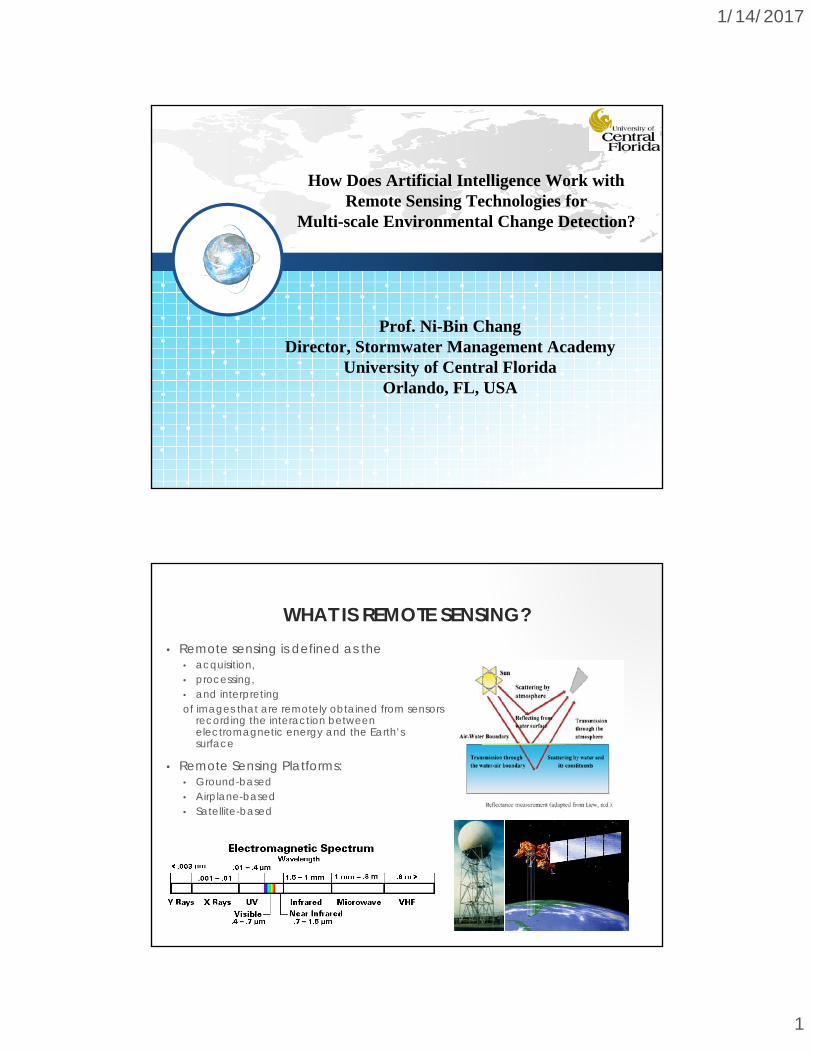
WHAT IS REMOTE SENSING?• Remote sensing is defined as the
• acquisition,• processing,• and interpretingof images that are remotely obtained from sensors
recording the interaction between electromagnetic energy and the Earth’s surface
• Remote Sensing Platforms:• Ground-based• Airplane-based• Satellite-based
2
1/14/2017
2
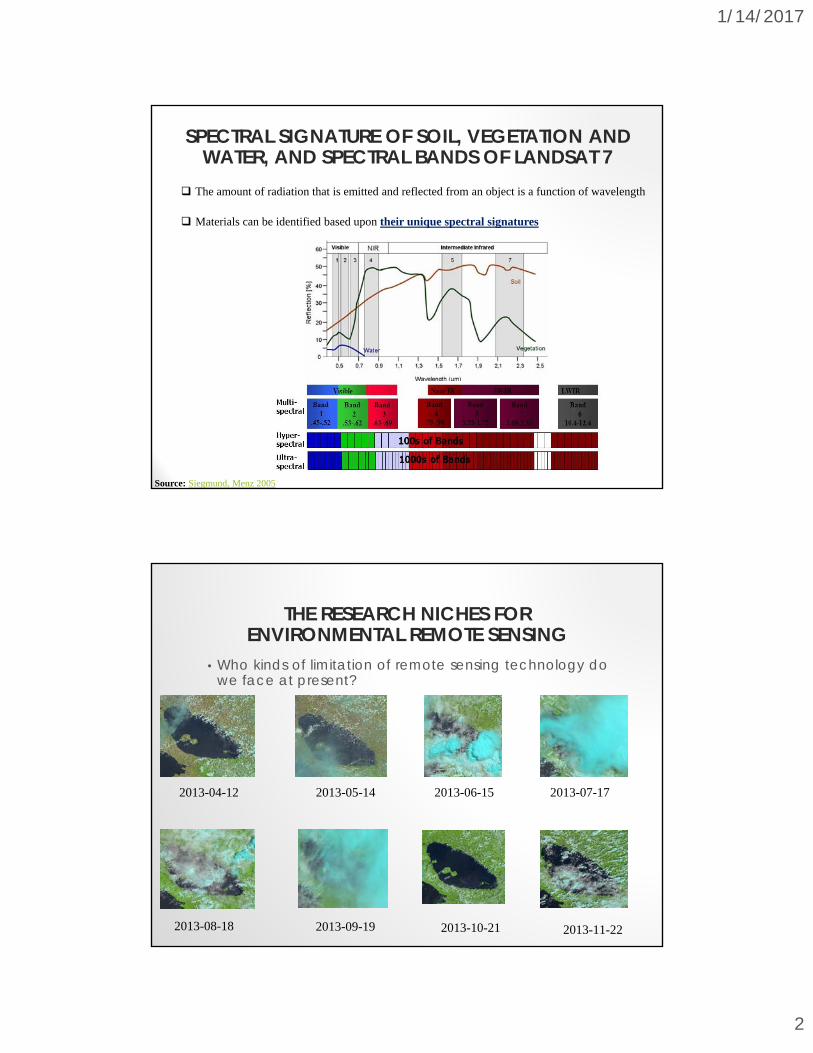
The amount of radiation that is emitted and reflected from an object is a function of wavelength
Materials can be identified based upon their unique spectral signatures
Source: Siegmund, Menz 2005
SPECTRAL SIGNATURE OF SOIL, VEGETATION AND WATER, AND SPECTRAL BANDS OF LANDSAT 7
THE RESEARCH NICHES FOR ENVIRONMENTAL REMOTE SENSING
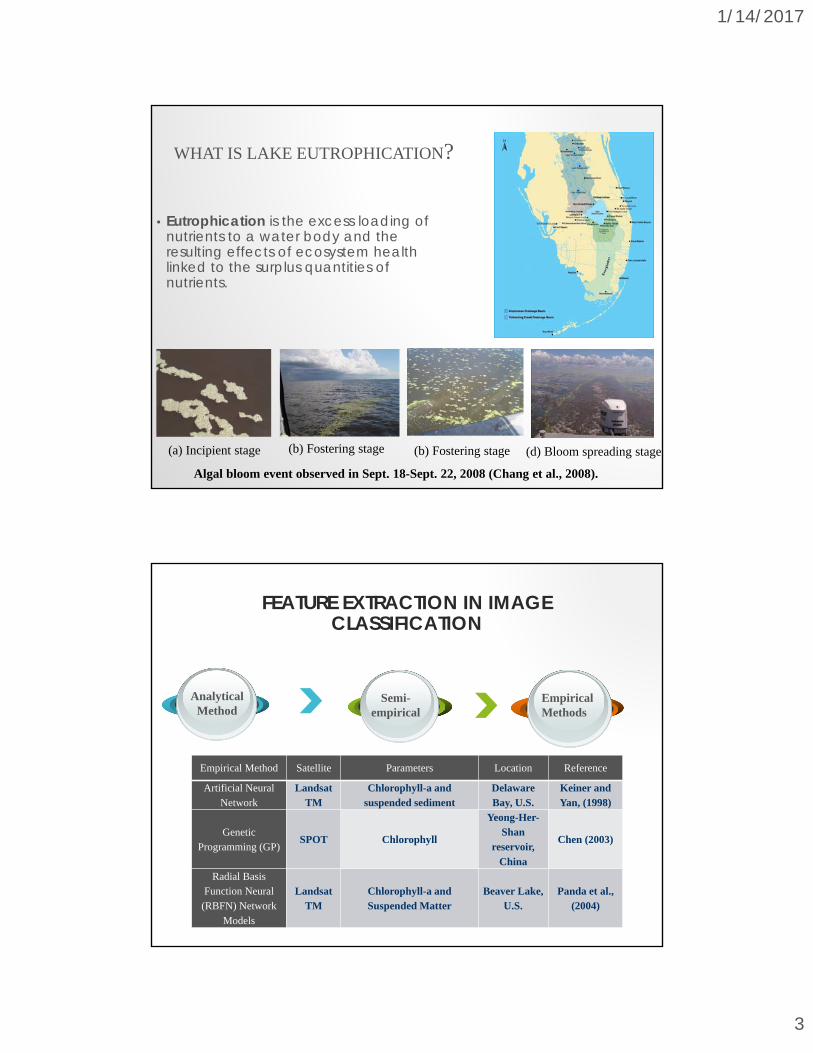
• Who kinds of limitation of remote sensing technology dowe face at present?
2013-04-12 2013-05-14 2013-06-15 2013-07-17
2013-08-18 2013-09-19 2013-10-21 2013-11-22
1/14/2017
3
WHAT IS LAKE EUTROPHICATION?
• Eutrophication is the excess loading of nutrients to a water body and the resulting effects of ecosystem health linked to the surplus quantities of nutrients.
(a) Incipient stage (b) Fostering stage (b) Fostering stage (d) Bloom spreading stage
Algal bloom event observed in Sept. 18-Sept. 22, 2008 (Chang et al., 2008).
Empirical Methods
Analytical Method
Semi-empirical
Empirical Method Satellite Parameters Location Reference
Artificial Neural Network
Landsat TM
Chlorophyll-a and suspended sediment
Delaware Bay, U.S.
Keiner and Yan, (1998)
Genetic Programming (GP)
SPOT Chlorophyll
Yeong-Her-Shan
reservoir,
China
Chen (2003)
Radial Basis Function Neural
(RBFN) Network Models
Landsat TM
Chlorophyll-a and Suspended Matter
Beaver Lake, U.S.
Panda et al., (2004)
FEATURE EXTRACTION IN IMAGE CLASSIFICATION
1/14/2017
4
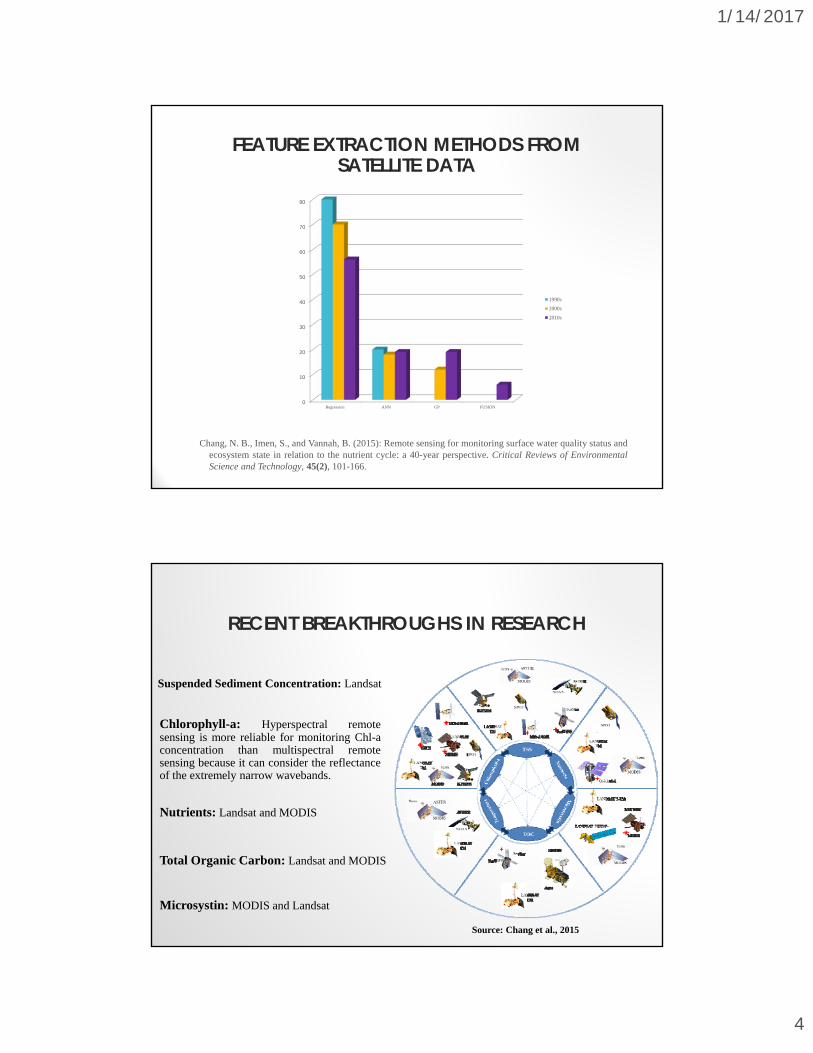
0
10
20
30
40
50
60
70
80
Regression ANN GP FUSION
1990s
2000s
2010s
FEATURE EXTRACTION METHODS FROM SATELLITE DATA
Chang, N. B., Imen, S., and Vannah, B. (2015): Remote sensing for monitoring surface water quality status andecosystem state in relation to the nutrient cycle: a 40-year perspective. Critical Reviews of EnvironmentalScience and Technology, 45(2), 101-166.
Source: Chang et al., 2015
Suspended Sediment Concentration: Landsat
Chlorophyll-a: Hyperspectral remotesensing is more reliable for monitoring Chl-aconcentration than multispectral remotesensing because it can consider the reflectanceof the extremely narrow wavebands.
Nutrients: Landsat and MODIS
Total Organic Carbon: Landsat and MODIS
Microsystin: MODIS and Landsat
RECENT BREAKTHROUGHS IN RESEARCH
1/14/2017
5
IEEE Systems Journal
Chang, N. B., Xuan, Z., and Yang, J. (2013): Exploring spatiotemporal patterns of nutrient concentrations in a coastal bay with MODIS images and machine learning models. Remote Sensing of Environment, 134, 100-110.
Source
1/14/2017
6
Chang et al., 2013
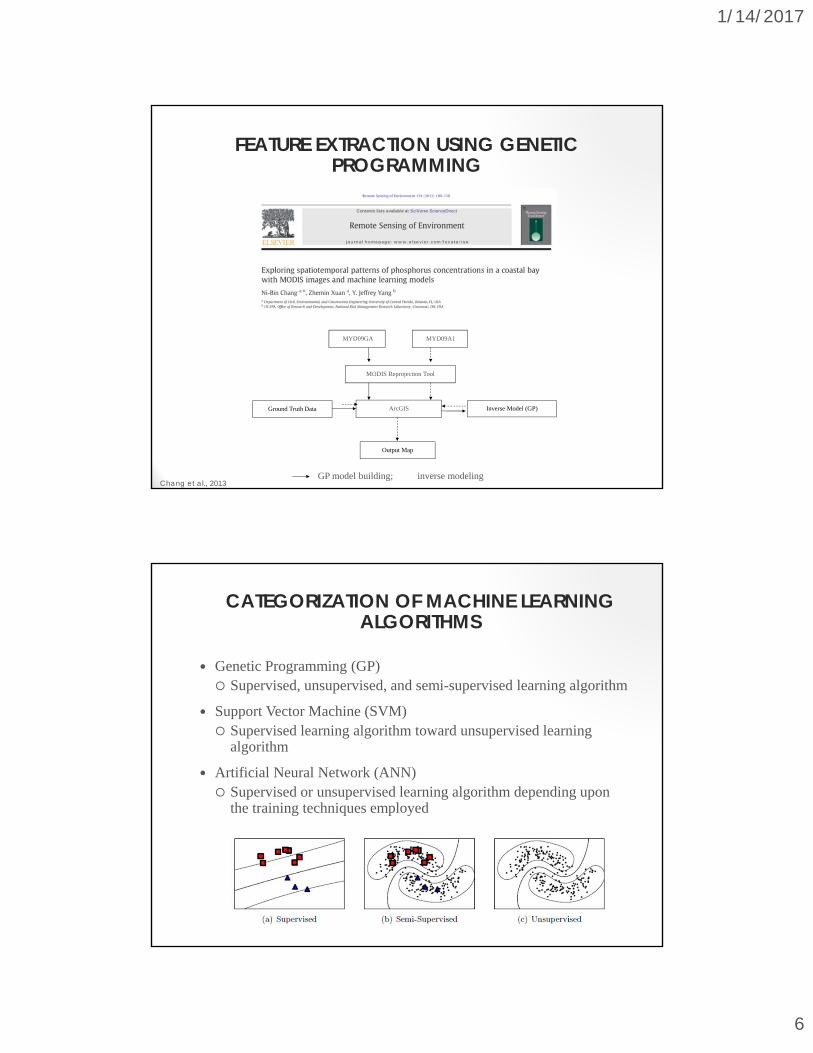
FEATURE EXTRACTION USING GENETIC PROGRAMMING
MYD09GA
MODIS Reprojection Tool
ArcGIS
Output Map
Ground Truth Data Inverse Model (GP)
MYD09A1
GP model building; inverse modeling
Genetic Programming (GP) Supervised, unsupervised, and semi-supervised learning algorithm
Support Vector Machine (SVM) Supervised learning algorithm toward unsupervised learning
algorithm
Artificial Neural Network (ANN) Supervised or unsupervised learning algorithm depending upon
the training techniques employed
CATEGORIZATION OF MACHINE LEARNING ALGORITHMS
1/14/2017
7
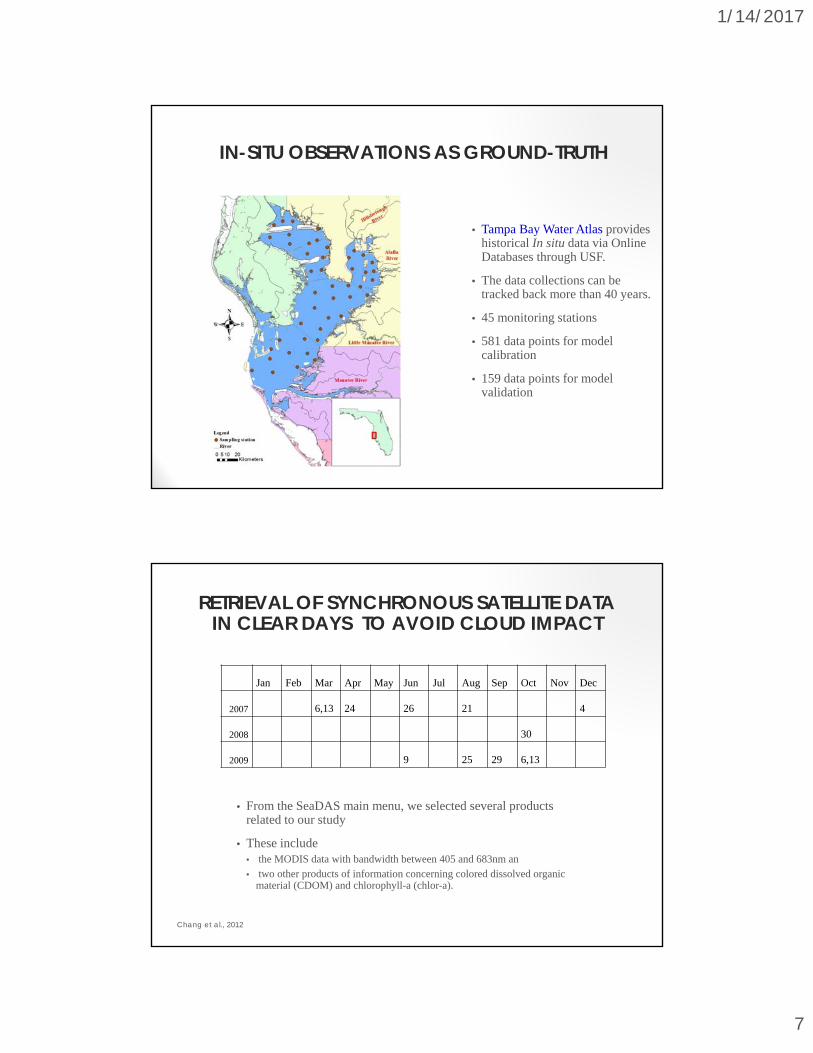
• Tampa Bay Water Atlas provides historical In situ data via Online Databases through USF.
• The data collections can be tracked back more than 40 years.
• 45 monitoring stations
• 581 data points for model calibration
• 159 data points for model validation
IN-SITU OBSERVATIONS AS GROUND-TRUTH
Jan Feb Mar Apr May Jun Jul Aug Sep Oct Nov Dec
2007 6,13 24 26 21 4
2008 30
2009 9 25 29 6,13
• From the SeaDAS main menu, we selected several products related to our study
• These include • the MODIS data with bandwidth between 405 and 683nm an• two other products of information concerning colored dissolved organic
material (CDOM) and chlorophyll-a (chlor-a).
Chang et al., 2012
RETRIEVAL OF SYNCHRONOUS SATELLITE DATA IN CLEAR DAYS TO AVOID CLOUD IMPACT
1/14/2017
8
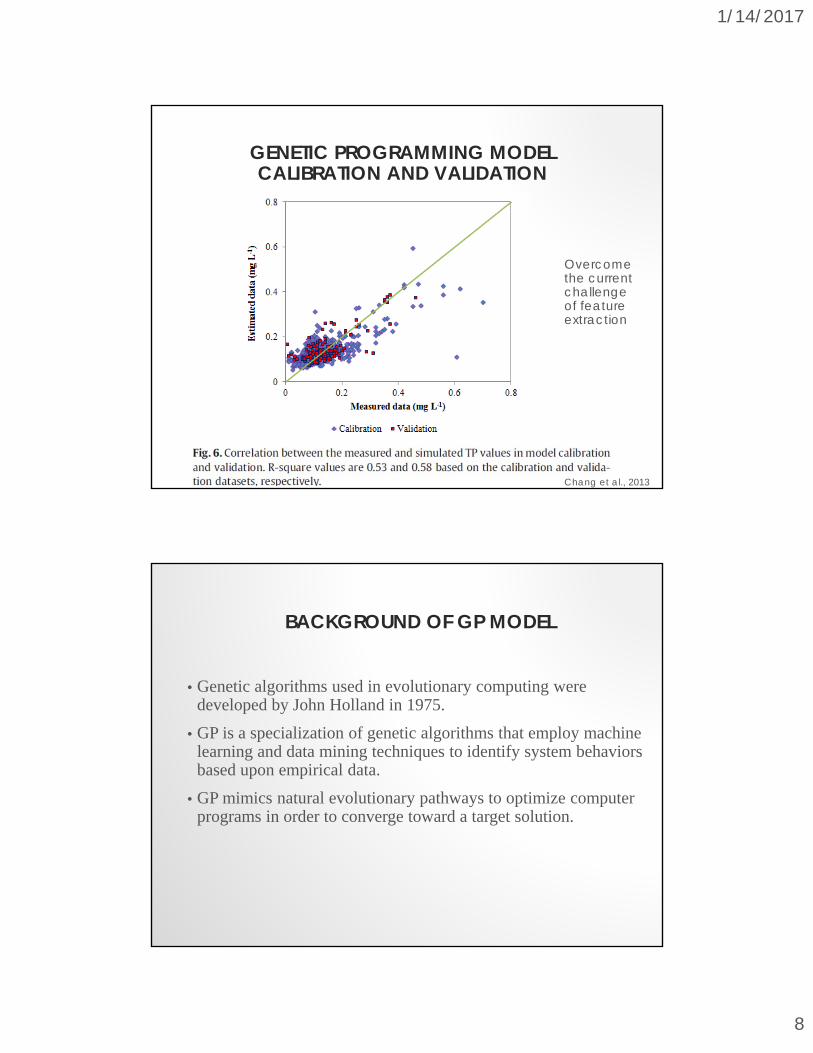
GENETIC PROGRAMMING MODEL CALIBRATION AND VALIDATION
Overcome the current challenge of feature extraction
Chang et al., 2013
• Genetic algorithms used in evolutionary computing were developed by John Holland in 1975.
• GP is a specialization of genetic algorithms that employ machine learning and data mining techniques to identify system behaviors based upon empirical data.
• GP mimics natural evolutionary pathways to optimize computer programs in order to converge toward a target solution.
BACKGROUND OF GP MODEL
1/14/2017
9
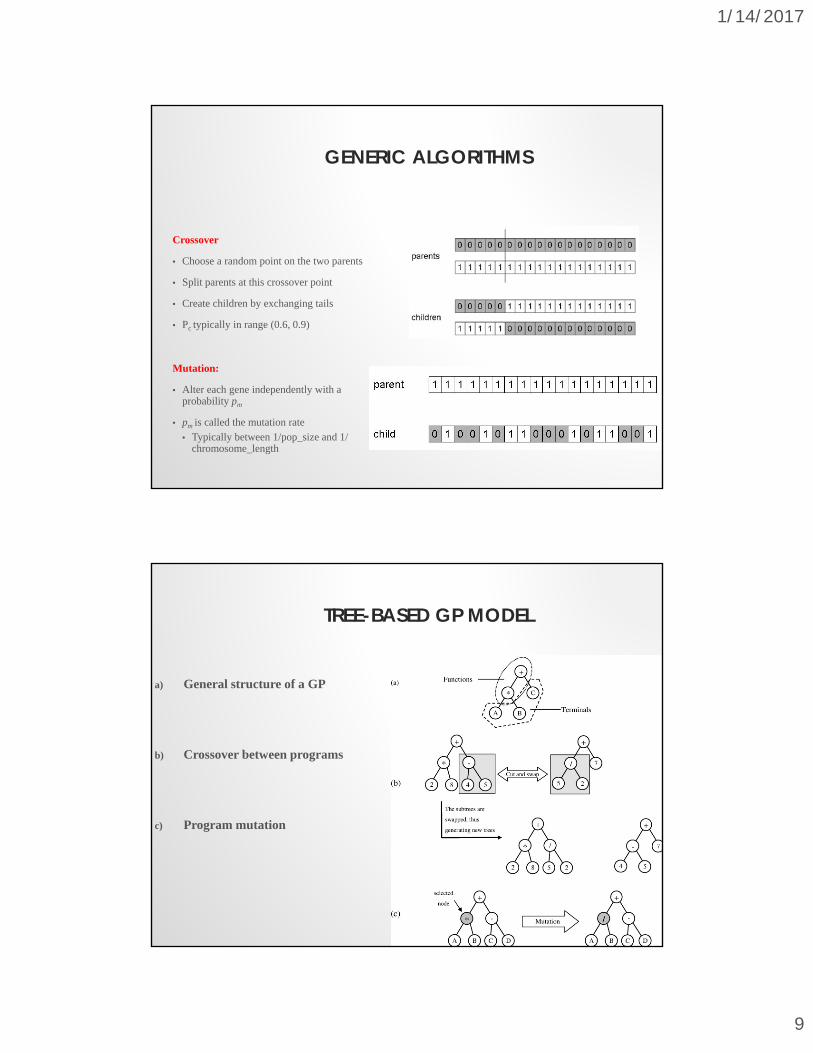
Crossover
• Choose a random point on the two parents
• Split parents at this crossover point
• Create children by exchanging tails
• Pc typically in range (0.6, 0.9)
Mutation:
• Alter each gene independently with a probability pm
• pm is called the mutation rate• Typically between 1/pop_size and 1/
chromosome_length
GENERIC ALGORITHMS
a) General structure of a GP
b) Crossover between programs
c) Program mutation
TREE-BASED GP MODEL
1/14/2017
10
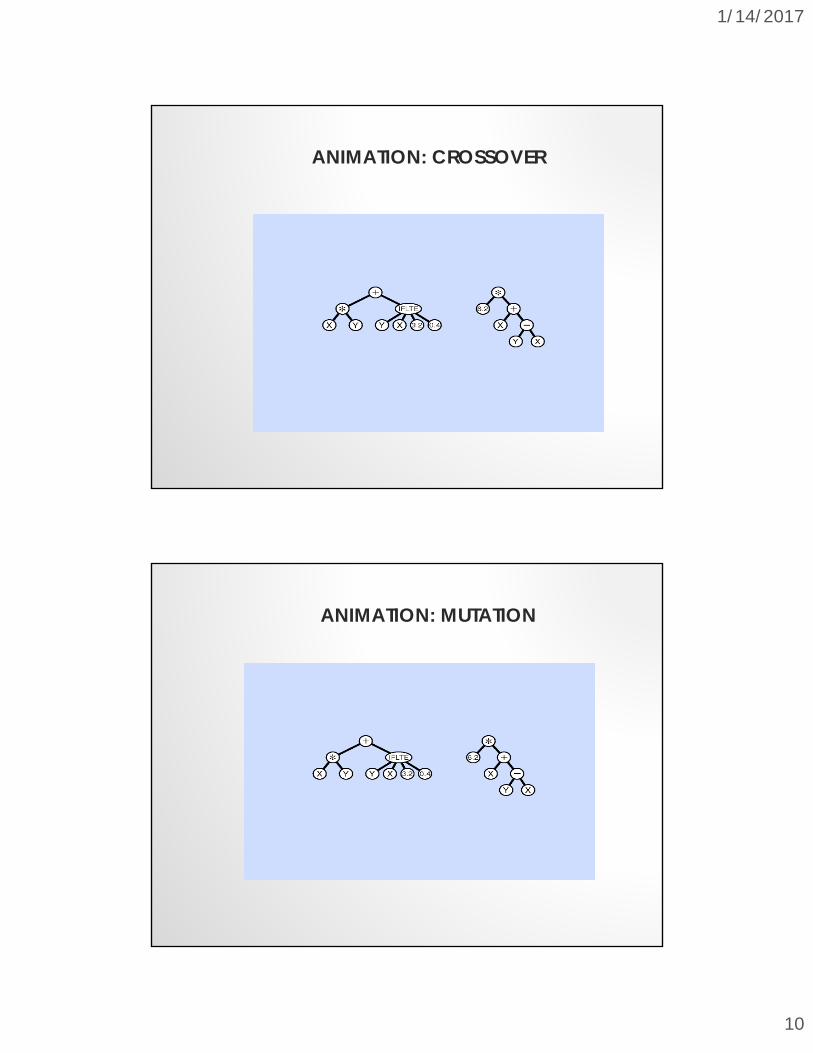
ANIMATION: CROSSOVER
ANIMATION: MUTATION
1/14/2017
11
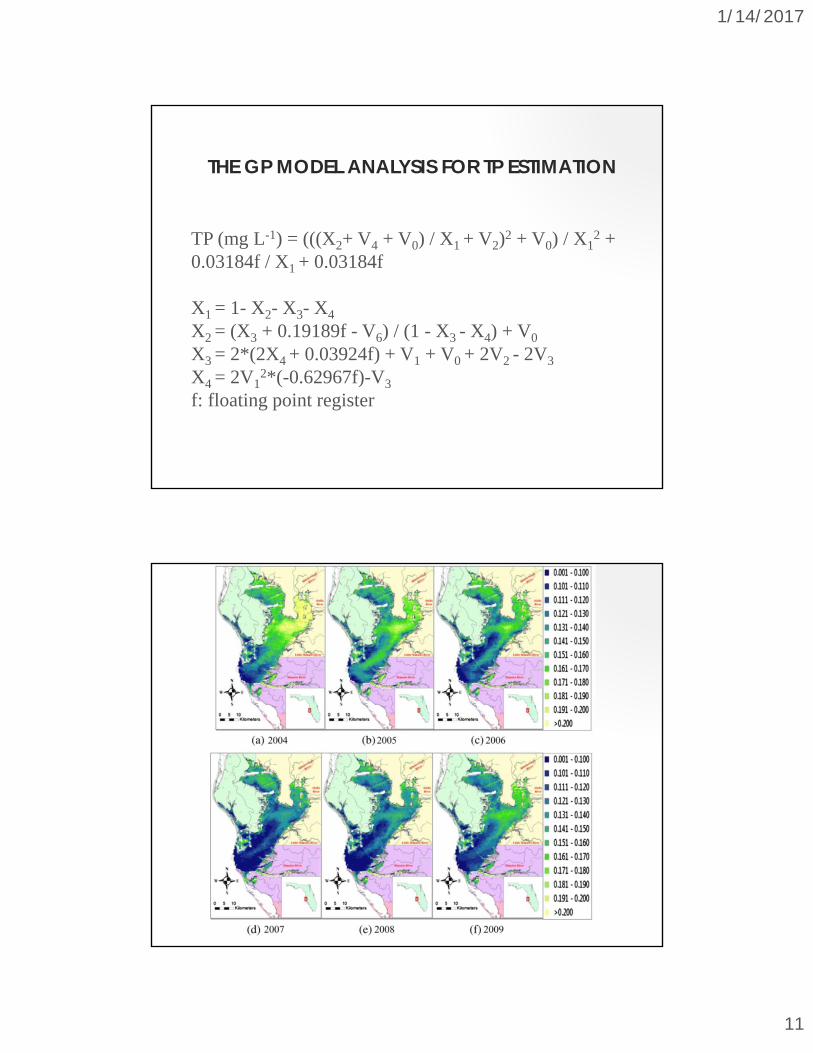
TP (mg L-1) = (((X2+ V4 + V0) / X1 + V2)2 + V0) / X12 +
0.03184f / X1 + 0.03184f
X1 = 1- X2- X3- X4
X2 = (X3 + 0.19189f - V6) / (1 - X3 - X4) + V0
X3 = 2*(2X4 + 0.03924f) + V1 + V0 + 2V2 - 2V3
X4 = 2V12*(-0.62967f)-V3
f: floating point register
THE GP MODEL ANALYSIS FOR TP ESTIMATION
1/14/2017
12
23
24
1/14/2017
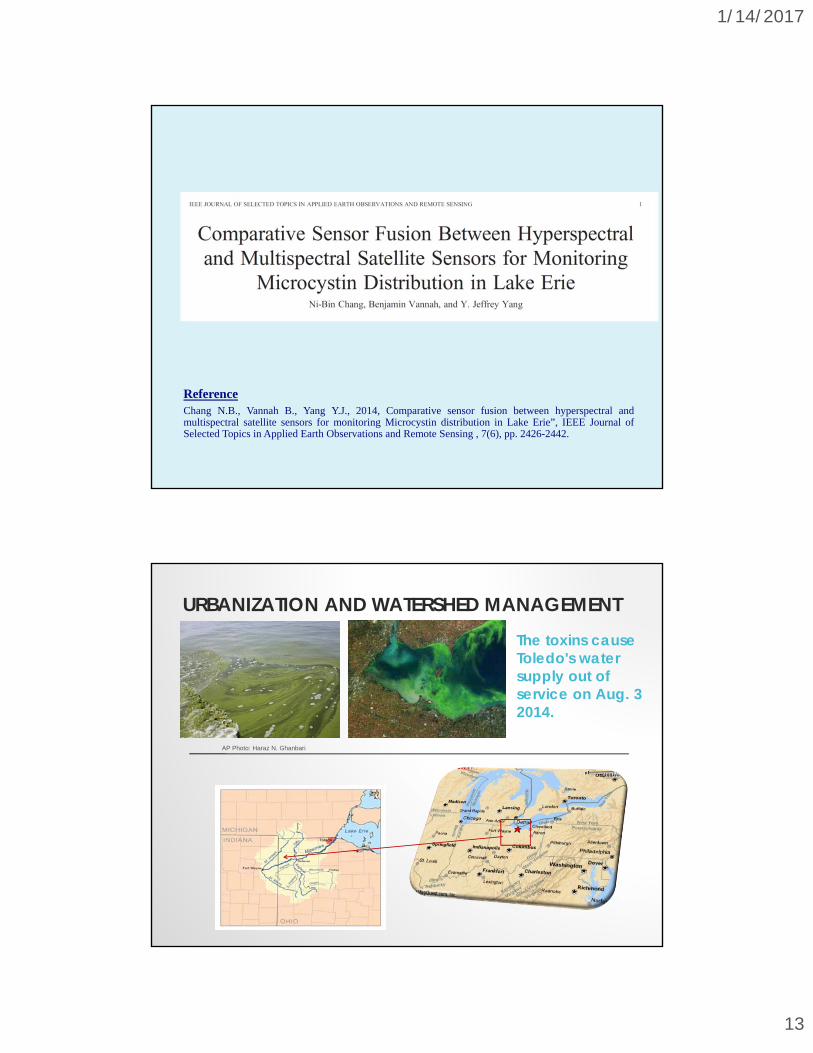
13
Chang N.B., Vannah B., Yang Y.J., 2014, Comparative sensor fusion between hyperspectral andmultispectral satellite sensors for monitoring Microcystin distribution in Lake Erie”, IEEE Journal ofSelected Topics in Applied Earth Observations and Remote Sensing , 7(6), pp. 2426-2442.
Reference
26
URBANIZATION AND WATERSHED MANAGEMENT
AP Photo: Haraz N. Ghanbari
The toxins cause Toledo's water supply out of service on Aug. 3 2014.
1/14/2017
14
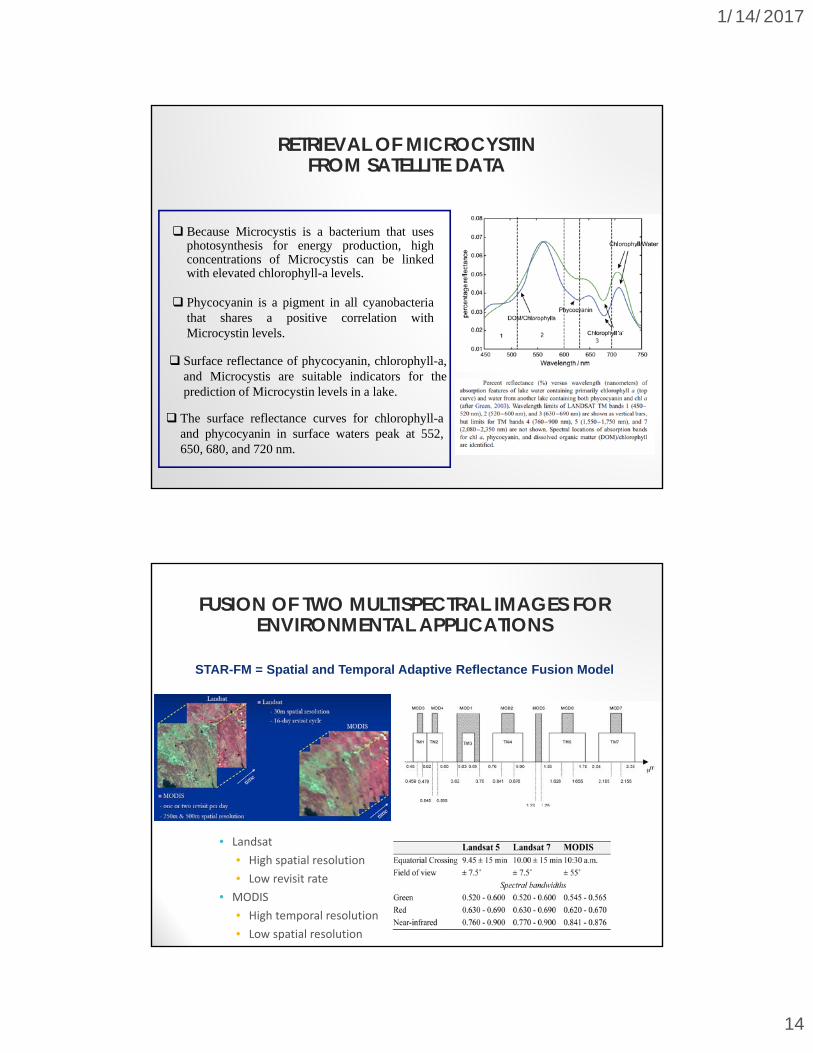
Because Microcystis is a bacterium that usesphotosynthesis for energy production, highconcentrations of Microcystis can be linkedwith elevated chlorophyll-a levels.
Phycocyanin is a pigment in all cyanobacteriathat shares a positive correlation withMicrocystin levels.
Surface reflectance of phycocyanin, chlorophyll-a,and Microcystis are suitable indicators for theprediction of Microcystin levels in a lake.
The surface reflectance curves for chlorophyll-aand phycocyanin in surface waters peak at 552,650, 680, and 720 nm.
RETRIEVAL OF MICROCYSTINFROM SATELLITE DATA
FUSION OF TWO MULTISPECTRAL IMAGES FOR ENVIRONMENTAL APPLICATIONS
STAR-FM = Spatial and Temporal Adaptive Reflectance Fusion Model
• Landsat
• High spatial resolution
• Low revisit rate
• MODIS
• High temporal resolution
• Low spatial resolution
1/14/2017
15
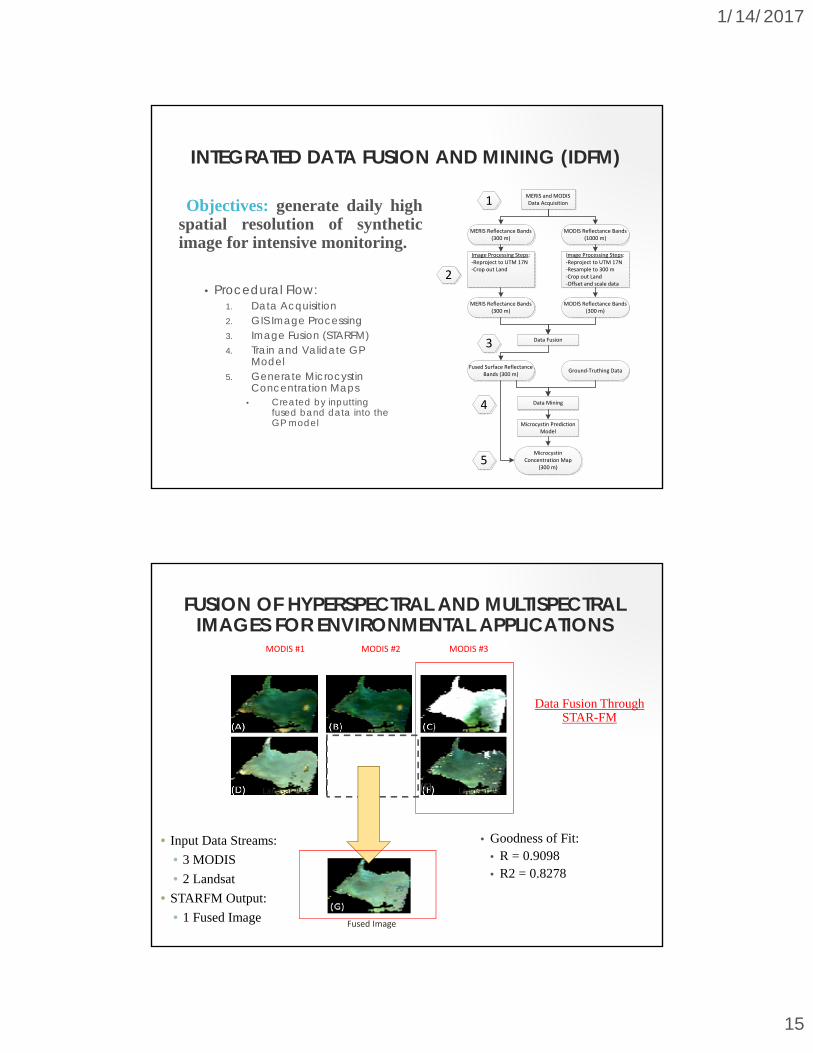
INTEGRATED DATA FUSION AND MINING (IDFM)
Objectives: generate daily highspatial resolution of syntheticimage for intensive monitoring.
1MERIS and MODIS Data Acquisition
MERIS Reflectance Bands (300 m)
MODIS Reflectance Bands (1000 m)
Image Processing Steps:-Reproject to UTM 17N-Crop out Land
Image Processing Steps:-Reproject to UTM 17N-Resample to 300 m-Crop out Land-Offset and scale data
MERIS Reflectance Bands (300 m)
MODIS Reflectance Bands (300 m)
2
Data Fusion3
Fused Surface Reflectance Bands (300 m)
Ground-Truthing Data
Microcystin Concentration Map
(300 m)
Data Mining
Microcystin Prediction Model
4
5
• Procedural Flow:1. Data Acquisition2. GIS Image Processing3. Image Fusion (STARFM)4. Train and Validate GP
Model5. Generate Microcystin
Concentration Maps• Created by inputting
fused band data into the GP model
30
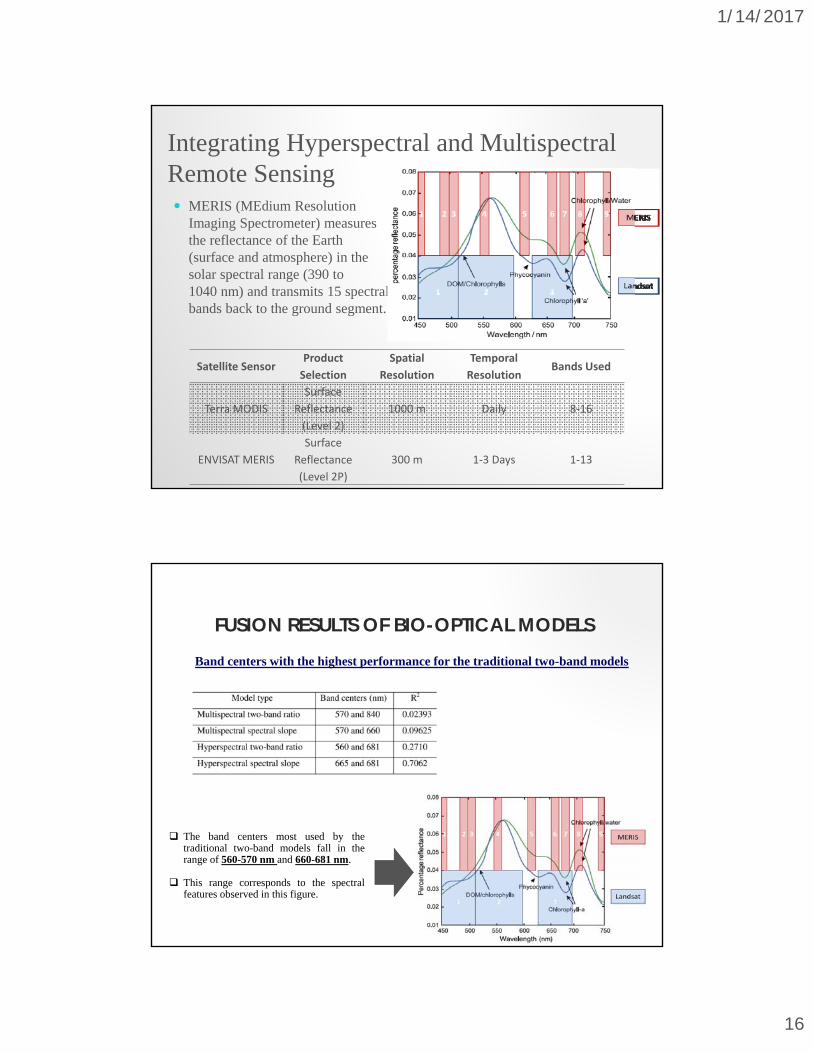
• Goodness of Fit:• R = 0.9098• R2 = 0.8278
MODIS #1
Landsat #1
MODIS #2 MODIS #3
Landsat #3
• Input Data Streams:
• 3 MODIS
• 2 Landsat
• STARFM Output:
• 1 Fused ImageFused Image
(F)
Data Fusion Through STAR-FM
FUSION OF HYPERSPECTRAL AND MULTISPECTRAL IMAGES FOR ENVIRONMENTAL APPLICATIONS
1/14/2017
16
Satellite SensorProduct
Selection
Spatial
Resolution
Temporal
ResolutionBands Used
Terra MODIS
Surface
Reflectance
(Level 2)
1000 m Daily 8-16
ENVISAT MERIS
Surface
Reflectance
(Level 2P)
300 m 1-3 Days 1-13
MERIS (MEdium Resolution Imaging Spectrometer) measures the reflectance of the Earth (surface and atmosphere) in the solar spectral range (390 to 1040 nm) and transmits 15 spectral bands back to the ground segment.
Integrating Hyperspectral and Multispectral Remote Sensing
Band centers with the highest performance for the traditional two-band models
The band centers most used by thetraditional two-band models fall in therange of 560-570 nm and 660-681 nm.
This range corresponds to the spectralfeatures observed in this figure.
FUSION RESULTS OF BIO-OPTICAL MODELS
1/14/2017
17
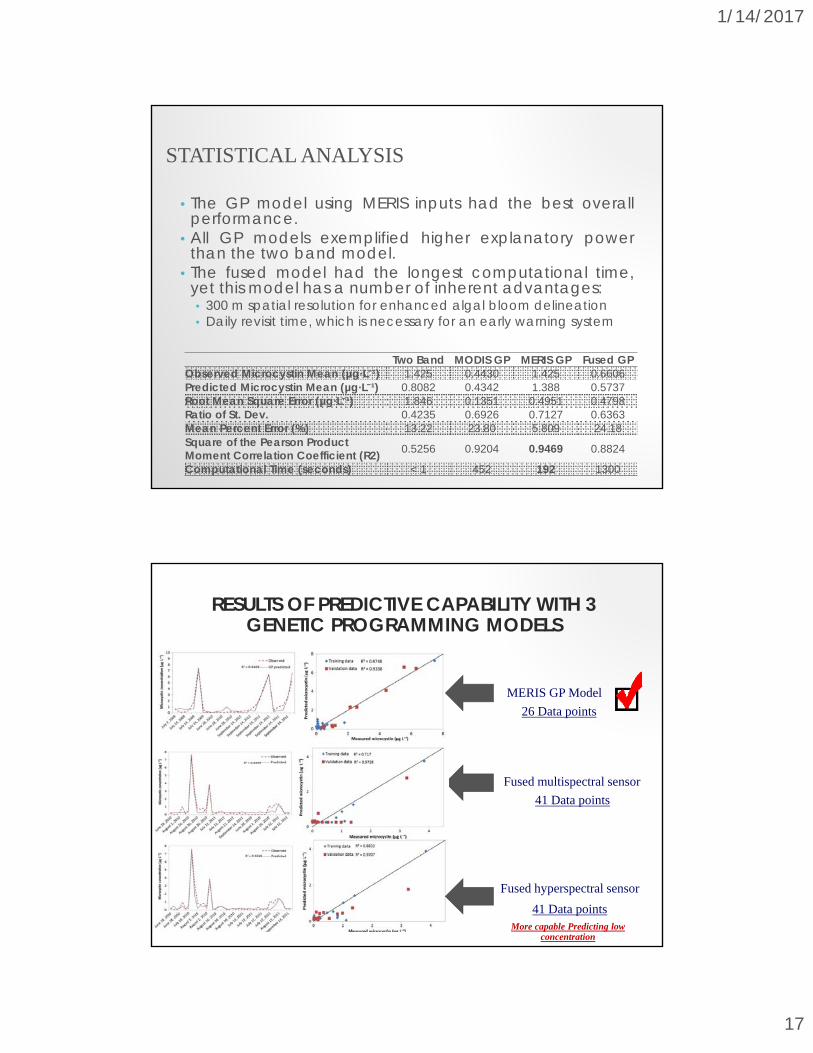
STATISTICAL ANALYSIS
• The GP model using MERIS inputs had the best overallperformance.
• All GP models exemplified higher explanatory powerthan the two band model.
• The fused model had the longest computational time,yet this model has a number of inherent advantages:• 300 m spatial resolution for enhanced algal bloom delineation• Daily revisit time, which is necessary for an early warning system
Two Band MODIS GP MERIS GP Fused GPObserved Microcystin Mean (µg·L⁻¹) 1.425 0.4430 1.425 0.6606Predicted Microcystin Mean (µg·L⁻¹) 0.8082 0.4342 1.388 0.5737Root Mean Square Error (µg·L⁻¹) 1.846 0.1351 0.4951 0.4798Ratio of St. Dev. 0.4235 0.6926 0.7127 0.6363Mean Percent Error (%) 13.22 23.80 5.809 24.18Square of the Pearson Product Moment Correlation Coefficient (R2) 0.5256 0.9204 0.9469 0.8824
Computational Time (seconds) < 1 452 192 1300
MERIS GP Model
Fused multispectral sensor
Fused hyperspectral sensor
26 Data points
41 Data points
41 Data pointsMore capable Predicting low
concentration
RESULTS OF PREDICTIVE CAPABILITY WITH 3 GENETIC PROGRAMMING MODELS
1/14/2017
18
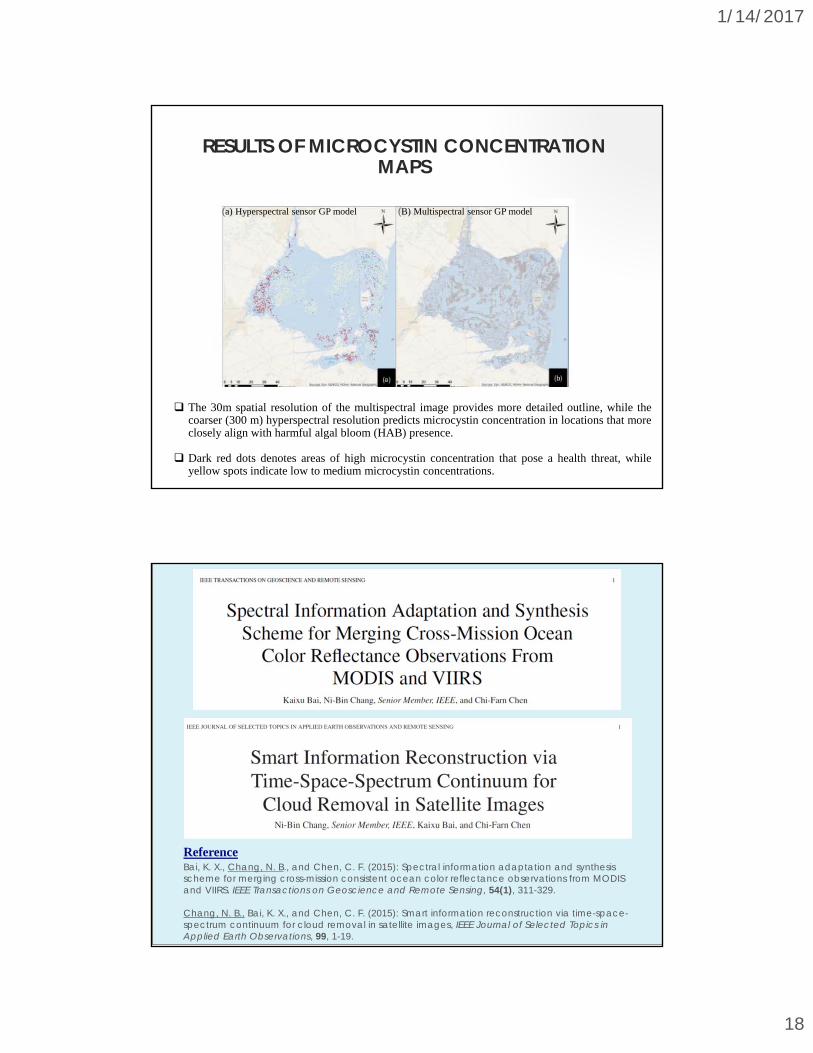
(a) Hyperspectral sensor GP model (B) Multispectral sensor GP model
The 30m spatial resolution of the multispectral image provides more detailed outline, while thecoarser (300 m) hyperspectral resolution predicts microcystin concentration in locations that moreclosely align with harmful algal bloom (HAB) presence.
Dark red dots denotes areas of high microcystin concentration that pose a health threat, whileyellow spots indicate low to medium microcystin concentrations.
RESULTS OF MICROCYSTIN CONCENTRATION MAPS
SMIR: Smart Memory for Image Reconstruction
SIASS: Spectral Information Adaptation and Synthesis Scheme
RECENT BREAKTHROUGHS IN MY RESEARCH
Chang, N. B., Bai, K. X., and Chen, C. F. (2015): Smart information reconstruction via time-space-spectrumcontinuum for cloud removal in satellite images, IEEE Journal of Selected Topics in Applied EarthObservations, 99, 1-19.
Bai, K. X., Chang, N. B., and Chen, C. F. (2015): Spectral information adaptation and synthesis scheme formerging cross-mission consistent ocean color reflectance observations from MODIS and VIIRS. IEEETransactions on Geoscience and Remote Sensing, 54(1), 311-329.
Bai, K. X., Chang, N. B., and Chen, C. F. (2015): Spectral information adaptation and synthesis scheme for merging cross-mission consistent ocean color reflectance observations from MODIS and VIIRS. IEEE Transactions on Geoscience and Remote Sensing, 54(1), 311-329.
Chang, N. B., Bai, K. X., and Chen, C. F. (2015): Smart information reconstruction via time-space-spectrum continuum for cloud removal in satellite images, IEEE Journal of Selected Topics in Applied Earth Observations, 99, 1-19.
Reference
1/14/2017
19
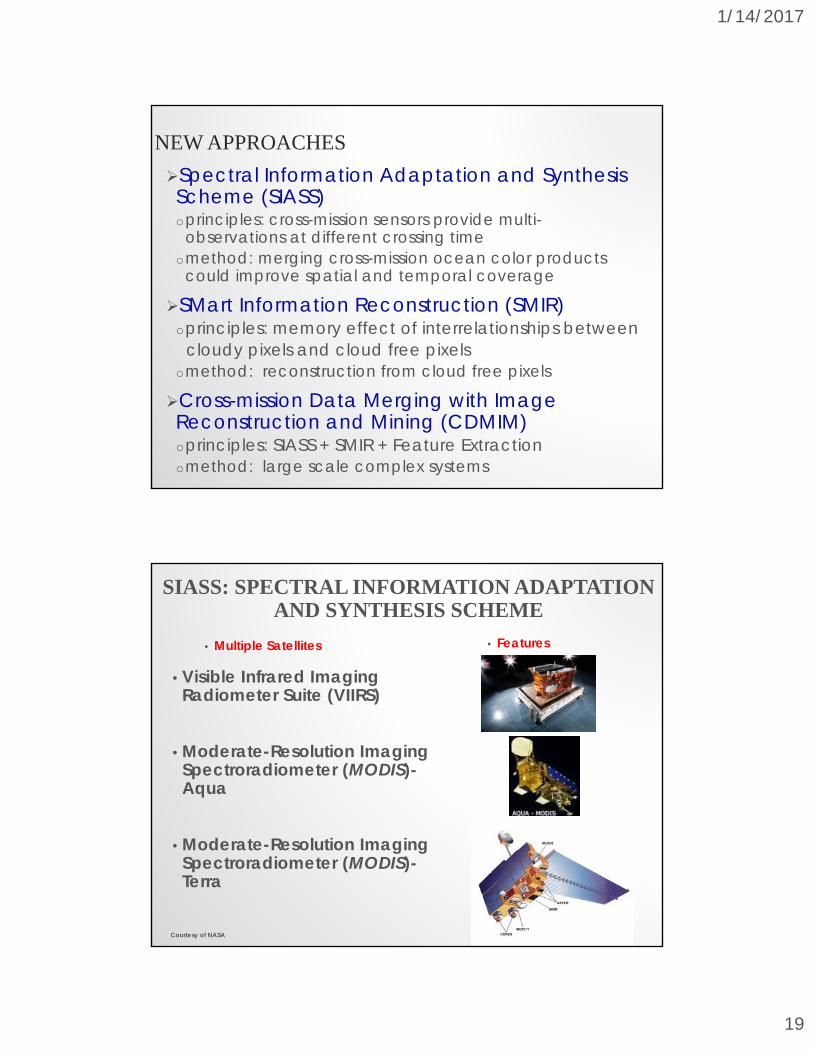
NEW APPROACHES
Spectral Information Adaptation and SynthesisScheme (SIASS)oprinciples: cross-mission sensors provide multi-
observations at different crossing timeomethod: merging cross-mission ocean color products
could improve spatial and temporal coverage
SMart Information Reconstruction (SMIR)oprinciples: memory effect of interrelationships between
cloudy pixels and cloud free pixelsomethod: reconstruction from cloud free pixels
Cross-mission Data Merging with Image Reconstruction and Mining (CDMIM) oprinciples: SIASS + SMIR + Feature Extractionomethod: large scale complex systems
SIASS: SPECTRAL INFORMATION ADAPTATION AND SYNTHESIS SCHEME
• Multiple Satellites
• Visible Infrared Imaging Radiometer Suite (VIIRS)
• Moderate-Resolution Imaging Spectroradiometer (MODIS)-Aqua
• Moderate-Resolution Imaging Spectroradiometer (MODIS)-Terra
• Features
Courtesy of NASA
1/14/2017
20
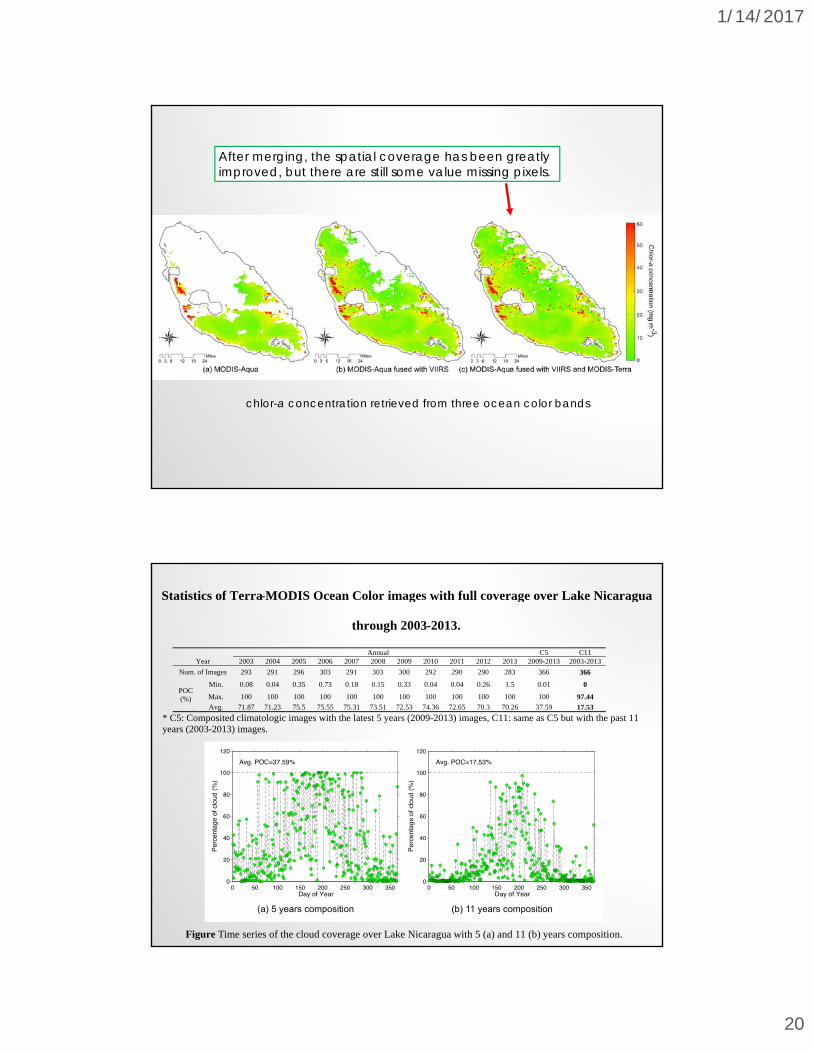
chlor-a concentration retrieved from three ocean color bands
After merging, the spatial coverage has been greatly improved, but there are still some value missing pixels.
Statistics of Terra-MODIS Ocean Color images with full coverage over Lake Nicaragua
through 2003-2013.
Annual C5 C11 Year 2003 2004 2005 2006 2007 2008 2009 2010 2011 2012 2013 2009-2013 2003-2013
Num. of Images 293 291 296 303 291 303 300 292 290 290 283 366 366
POC (%)
Min. 0.08 0.04 0.35 0.73 0.18 0.15 0.33 0.04 0.04 0.26 1.5 0.01 0
Max. 100 100 100 100 100 100 100 100 100 100 100 100 97.44
Avg. 71.87 71.23 75.5 75.55 75.31 73.51 72.53 74.36 72.65 70.3 70.26 37.59 17.53
* C5: Composited climatologic images with the latest 5 years (2009-2013) images, C11: same as C5 but with the past 11 years (2003-2013) images.
Figure Time series of the cloud coverage over Lake Nicaragua with 5 (a) and 11 (b) years composition.
1/14/2017
21
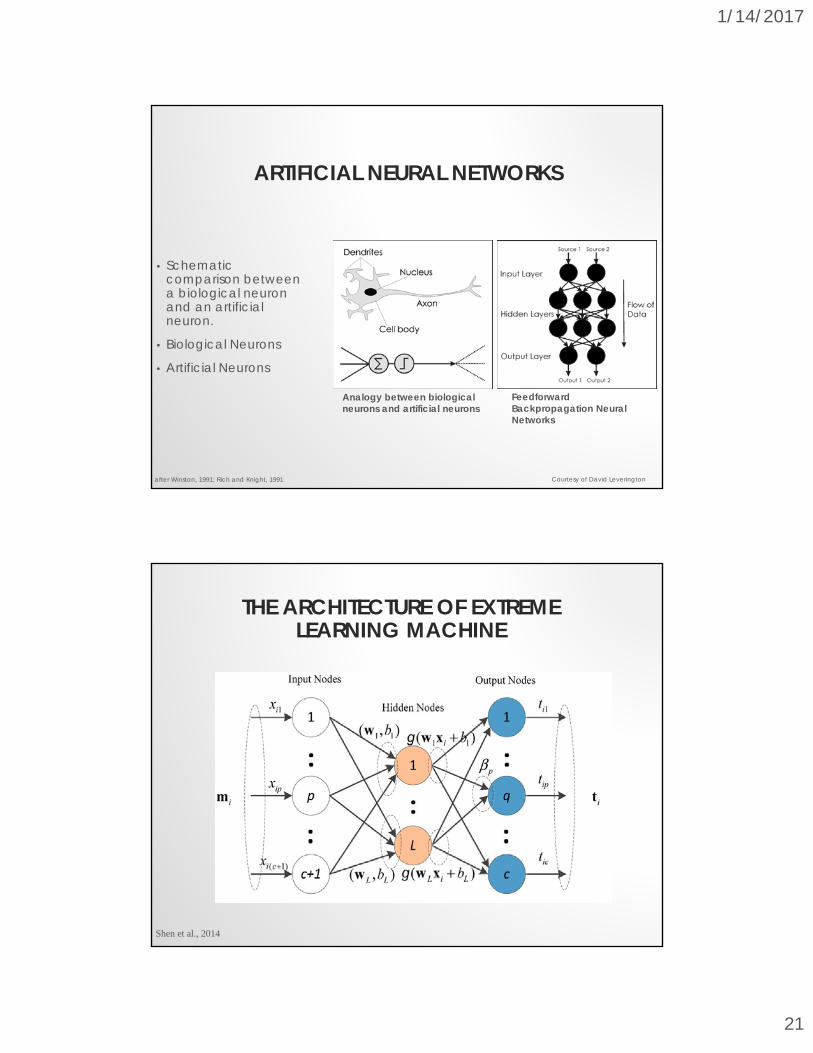
ARTIFICIAL NEURAL NETWORKS
• Schematic comparison between a biological neuron and an artificial neuron.
• Biological Neurons
• Artificial Neurons
after Winston, 1991; Rich and Knight, 1991
Feedforward Backpropagation Neural Networks
Analogy between biological neurons and artificial neurons
Courtesy of David Leverington
THE ARCHITECTURE OF EXTREME LEARNING MACHINE
Shen et al., 2014
1/14/2017
22
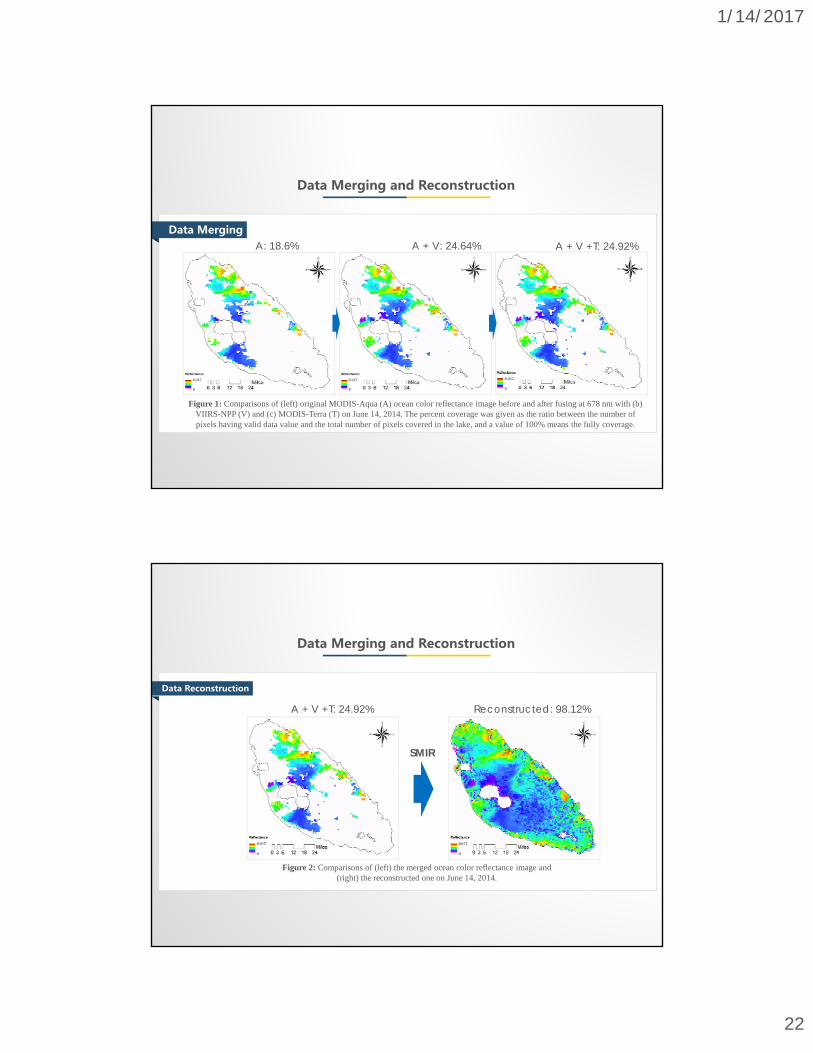
Data Merging
Data Merging and Reconstruction
A: 18.6% A + V: 24.64% A + V +T: 24.92%
Figure 1: Comparisons of (left) original MODIS-Aqua (A) ocean color reflectance image before and after fusing at 678 nm with (b) VIIRS-NPP (V) and (c) MODIS-Terra (T) on June 14, 2014. The percent coverage was given as the ratio between the number ofpixels having valid data value and the total number of pixels covered in the lake, and a value of 100% means the fully coverage.
Data Reconstruction
Data Merging and Reconstruction
A + V +T: 24.92% Reconstructed: 98.12%
SMIR
Figure 2: Comparisons of (left) the merged ocean color reflectance image and (right) the reconstructed one on June 14, 2014.
1/14/2017
23
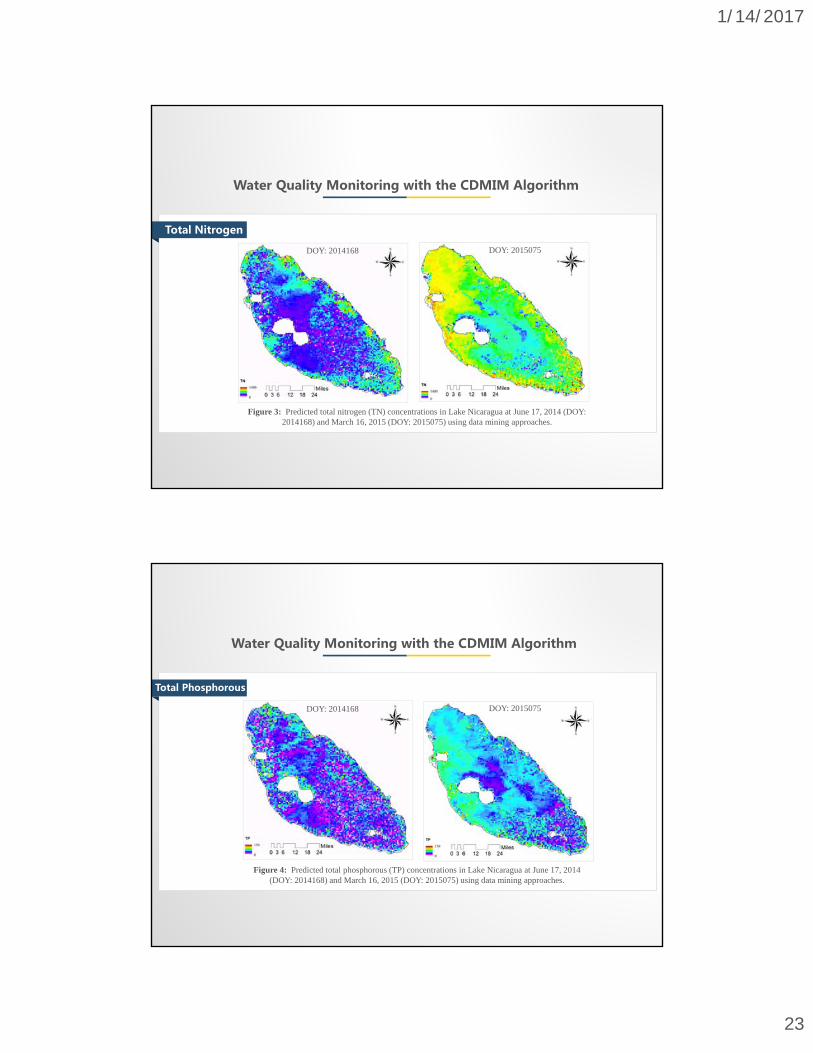
Water Quality Monitoring with the CDMIM Algorithm
Total Nitrogen
DOY: 2014168 DOY: 2015075
Figure 3: Predicted total nitrogen (TN) concentrations in Lake Nicaragua at June 17, 2014 (DOY: 2014168) and March 16, 2015 (DOY: 2015075) using data mining approaches.
Water Quality Monitoring with the CDMIM Algorithm
DOY: 2014168 DOY: 2015075
Figure 4: Predicted total phosphorous (TP) concentrations in Lake Nicaragua at June 17, 2014 (DOY: 2014168) and March 16, 2015 (DOY: 2015075) using data mining approaches.
Total Phosphorous
1/14/2017
24
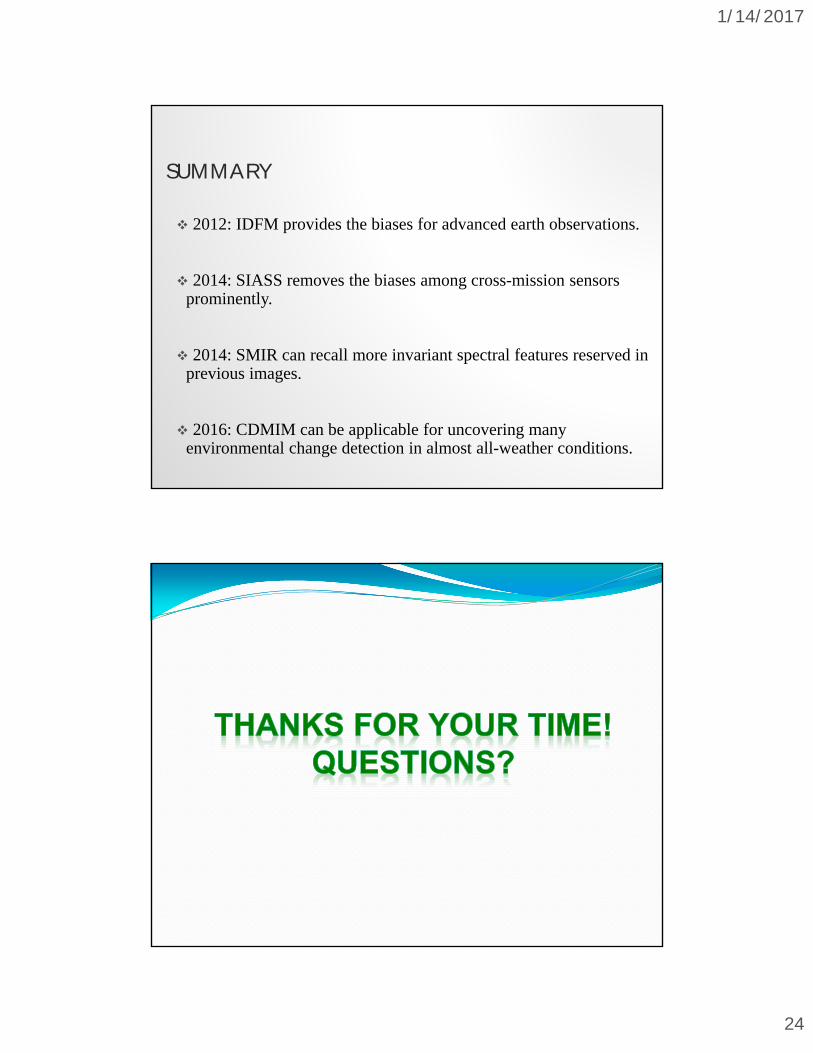
SUMMARY
2012: IDFM provides the biases for advanced earth observations.
2014: SIASS removes the biases among cross-mission sensors prominently.
2014: SMIR can recall more invariant spectral features reserved in previous images.
2016: CDMIM can be applicable for uncovering many environmental change detection in almost all-weather conditions.


