
SPECIAL ISSUE: IMPACT OF 2017 HURRICANES
Hurricane Harvey Storm Sedimentation in the San Bernard NationalWildlife Refuge, Texas: Fluvial Versus Storm Surge Deposition
Qiang Yao1& Kam-Biu Liu1
& Harry Williams2 & Sanjeev Joshi1 & Thomas A. Bianchette3& Junghyung Ryu1
&
Marianne Dietz1
Received: 18 March 2019 /Revised: 7 August 2019 /Accepted: 11 September 2019# Coastal and Estuarine Research Federation 2019
Abstract
Few studies have documented the characteristics of fluvial flooding-induced storm deposits associated with a modern hurricane.
Hurricane Harvey (2017) caused extensive flooding in coastal Texas due to a combination of storm surge and heavy precipitation.
This study investigates the depositional process associated with Hurricane Harvey by means of loss-on-ignition (LOI) and X-ray
fluorescence (XRF) analyses of 9 short cores and 17 surface samples collected from the San Bernard National Wildlife Refuge
(SBNWR), Texas. Hurricane Harvey caused the largest flood within SBNWR over the last 28 years, and freshwater flooding
from the San Bernard River was the predominant cause of this inundation. A distinct washover sand layer is lacking at all coring
sites, but the intrusion of seawater can still be detected by a peak in the chlorine/bromine (Cl/Br) ratio of most sediment cores. Our
study shows that Cl/Br ratios are higher in coastal environments than in terrestrial environments, thereby confirming that this
elemental ratio can be used as a salinity indicator and, as a corollary, evidence of marine intrusion into lower-salinity environ-
ments. The ensuing phase of freshwater flooding and fluvial sedimentation is represented by a distinct flood deposit in only three
cores, but is absent or indistinct in most cores. The elusiveness of the Harvey fluvial flood deposit can be explained by the
relatively low discharge and suspended sediment load of the San Bernard River, the uneven distribution of this event deposit, and
its indistinctiveness with the underlying deposits laid down by previous flood events.
Keywords Hurricane Harvey . Overbank flooding . Flood deposit . Storm surge . Storm sedimentation . Cl/Br ratio
Introduction
Hurricane Harvey, a category 4 hurricane that first made land-
fall on the Texas coast on August 25, 2017, is the second
costliest hurricane event on record (Blake and Zelinsky
2017). It is the first major hurricane that made landfall in the
continental U.S. since Hurricane Wilma in 2005 and the first
intense hurricane of the extremely active 2017 Atlantic hurri-
cane season. Hurricane Harvey not only caused a high storm
surge that impacted hundreds of kilometers of coastal zones but
also brought catastrophic rainfalls that flooded hundreds of
thousands of structures, especially in the Houston metropolitan
area (Blake and Zelinsky 2017). Empirical data of the coastal
flood event and its associated storm deposits will offer insights
to the depositional processes of major hurricane events (Liu
2004). Such information is vital for shoreline protection, coastal
wetland restoration, and societal response to hurricane impacts.
During the past two decades, the storm deposition of mod-
ern hurricanes has been documented throughout the Gulf of
Mexico and Central American coasts. Most of these studies
are concerned with storm deposition associated with storm
surge or overwash processes (e.g., Williams and Flanagan
2009, Williams 2010, Williams 2012; Lane et al. 2011; Liu
et al. 2011, 2014; McCloskey and Liu 2012, 2013; Yao et al.
2015, 2018). However, few studies have documented the strat-
igraphical and geochemical characteristics of storm deposits
caused by fluvial flooding, and even fewer records are
Communicated by Mead Allison
* Qiang [email protected]
1 Department of Oceanography and Coastal Sciences, Louisiana StateUniversity, Baton Rouge, LA 70803, USA
2 Department of Geography and the Environment, University of NorthTexas, Denton, TX 76203, USA
3 Department of Natural Sciences, College of Arts,Sciences, and Letters, University of Michigan—Dearborn,Dearborn, MI 48128, USA
Estuaries and Coasts
https://doi.org/10.1007/s12237-019-00639-6

available on the sedimentary mechanism of rainfall-triggered
flooding associated with a modern hurricane (Khan et al.
2013). Hurricane Harvey, a unique hurricane event that com-
bines heavy fluvial flooding and storm surge in Texas, pro-
vides an excellent opportunity to fill this data gap. In this
study, we present sedimentological and geochemical data
from a series of sediment cores and surface samples collected
from the San Bernard National Wildlife Refuge (SBNWR) on
the east-central coast of Texas, to document the storm deposi-
tion attributed to the storm surge and fluvial flooding process-
es associated with Hurricane Harvey. The sedimentary evi-
dence was interpreted in light of Harvey’s hydrological im-
pacts reconstructed by compiling a 28-year time-series of dai-
ly discharge data of the San Bernard River during 1990–2017,
coupled with the hourly discharge data associated with this
storm-triggered flooding event.
Effects of Recent Hurricanes
During the last two decades, the San Bernard National
Wildlife Refuge (SBNWR) has been repeatedly affected by
hurricanes and their associated flood and storm surge impacts
(NOAA 2018a). In 2003, Hurricane Claudette (category 1)
made landfall to the west of the SBNWR with an estimated
maximum wind speed of 148 km/h. It caused up to 3-m-high
storm surges along coastlines from central Texas to southwest-
ern Louisiana. In 2007, Hurricane Humberto (category 1)
made landfall to the east side of the SBNWR with a sustained
wind speed over 150 km/h. It caused up to 2-m-high storm
surge as well as very heavy rainfall (maximum total 360 mm)
in coastal zones from Galveston, Texas, to Lake Charles,
Louisiana. One year later, in 2008, Hurricane Ike (category
2) made landfall near Galveston, Texas, approximately
100 km to the east of SBNWR, with a sustained wind speed
over 176 km/h. It caused up to 5-m-high storm surges and
widespread coastal flooding along the coasts of Texas,
Louisiana, Mississippi, and Alabama.
Most recently, at midnight of August 25, 2017, Hurricane
Harvey (category 4) made landfall on San Jose Island near
Aransas Bay, Texas, approximately 150 km to the west of
SBNWR (Fig. 1) (Blake and Zelinsky 2017). Three hours later,
it made a second landfall at the Texasmainland. After the second
landfall, Harvey rapidly weakened to a tropical cyclone on
August 26. During the next two days, Harvey stalled inland,
dropping very heavy rainfall. It reemerged into the Gulf of
Mexico on August 28 and then traveled east close to the Texas
shoreline beforemaking a third landfall in Louisiana, resulting in
more record-breaking rainfall. Over a 4-day period, Harvey
brought over 1000 mm of rain to many areas in south-central
Texas, with a maximum precipitation of 1539 mm. Harvey was
Fig. 1 Map showing two focal areas of investigation (yellow boxes)within the San Bernard National Wildlife Refuge (SBNWR). Area A iswhere sediment cores were taken; area B is where surface samples were
collected. Inset map shows track of Hurricane Harvey (colors showingintensities) and location of SBNWR (red box)
Estuaries and Coasts

the rainiest storm ever to make landfall in the United States, and
it caused unprecedented flooding to east-central Texas. It caused
107 casualties in storm-related incidents and inflicted $125 bil-
lion in damages (Blake and Zelinsky 2017).
Methods
Study Site
The SBNWR, established in 1968, is a ~ 185 km2 wildlife
conservation area located along the coast of east-central
Texas. It is ~ 65 km west of Galveston, bordered to the east
by the San Bernard River, to the south by the Gulf of Mexico,
and to the west by Cedar Lake Creek, which forms the border
between Brazoria andMatagorda counties. Historically, coast-
al zones along the east-central Texas coast have a distinct
vegetation zonation consisting of the following three vegeta-
tion types: salt marsh along the shorelines, coastal prairies
behind the salt marsh, and bottomland hardwood forest further
inland (FWS 2010). Currently, because of the water manage-
ment effort started in the late 1980s (Rachel 2018), the
SBNWR maintains its historical zonation pattern. The refuge
consists of low sand barriers about 1 m above mean sea level
bordering bay estuaries that sustain massive oyster beds. At
the north side of the bay, salinity is diluted by rainfall and
freshwater runoff from the San Bernard River and the land-
scape slowly transforms from salt marsh into coastal prairie
with many shallow water ponds. The coastal prairies and bot-
tomland hardwood forests are in the floodplain of the Brazos
River, Colorado River, and, in particular, the San Bernard
River. The San Bernard River begins near Southwest Austin
County and flows southwesterly for ~ 190 km into the Gulf of
Mexico (TPWD 2018). Our main sampling site (28°53′02.4″
N, 95°28′37.9″W) is located in the coastal prairie near the San
Bernard River at approximately 10 km upstream from the
Gulf of Mexico (Fig. 1). The San Bernard River was one of
many rivers in the area that experienced overbank flooding in
the days following the landfall of Hurricane Harvey, when
record rainfalls occurred throughout the region (Fig. 2c).
Field Sampling
Two field trips were conducted to retrieve short cores from
SBNWR to study the distribution of the Hurricane Harvey
storm deposit in order to assess the mode of deposition in
relation to the contribution of fluvial versus marine processes
in coastal flooding. In the first trip conducted in October 2017,
about two months after the Harvey event, seven short cores,
each < 30 cm long, were collected along two transects to the
south of the “big bend” of the San Bernard River, where sat-
ellite images taken immediately after Harvey revealed exten-
sive overbank flooding by the meandering river (Fig. 2a).
Transect A (28°53′48.12″N, 95°29′44.99″W), about 100 m
long running away from State Highway 2918, consists of
three short cores (SBW 20, 21, 22) (Fig. 2c). Transect B
(28°53′44.63″N, 95°31′15.35″W), also about 100 m long
and consisting of four short cores (SBW 23, 24, 25, 26), was
situated about 2 km west of transect A (Fig. 2b). Both tran-
sects were about 7 km from the Gulf of Mexico coast but only
approximately 0.5 km from the nearest bank of the San
Bernard River, and the elevation of the area is ~ 0.7 m.
Cores were taken variously by means of a Russian peat borer
(SBW 20), 4-cm-diameter aluminum drainage pipe (SBW21–
24 and 26), and vibra-corer (core SBW 25). On another trip
conducted in December 2017, a short core (SBW 209) (28°53′
49.08″N, 95°29′44.52″W) was collected very close to SBW
20 along transect A (Fig. 2c). In addition, another short core
(SBW 202) (28°54′9.60″N, 95°30′17.76″W) was retrieved
from the natural levee only about 50m from the southern bank
of the San Bernard River. These cores were collected to rep-
licate and verify the results obtained from earlier cores.
To provide baseline data to document the spatial variations
of elemental chemistry in various coastal microenvironments,
we collected 17 surface samples (SBSS 1–17) along a ~ 300m
transect from the intertidal zone (SBSS 1–4) across sand
dunes (SBSS 5–8) to backbarrier mudflat (SBSS 9–12) and
saltmarshes (SBSS 13–17) in the coastal areas of the SBNWR
(Fig. 3). The surface samples were retrieved by collecting the
top 5 cm of sediments with a small shovel, and the chemical
elemental data were to be used as a reference for interpreting
the down-core variations in elemental chemistry measured by
the XRF technique. The location of each coring and surface-
sampling site was recorded by GPS.
Observations weremade during field work to determine the
depth of inundation during the Harvey-induced coastal
flooding. Based on the height of the water marks and flood
debris attached to plants, it was determined that the flood water
was ~ 85 cm deep along transect A (Fig. 4). All surface samples
and cores were photographed in the field and have been stored
in a cold room at 4 °C at the Global Change and Coastal
Paleoecology Laboratory at Louisiana State University.
Laboratory Analyses
In the laboratory, all cores were photographed again after
unwrapping or splitting open longitudinally with a table saw
and were described stratigraphically using the Munsell Color
Chart. Cores 20, 21, and 22 from transect A and all cores from
transect B were subjected to loss-on-ignition (LOI) and X-ray
fluorescence (XRF) analyses. Cores 202 and 209 were only
visually inspected, described, and photographed but were not
analyzed by these techniques because these supplementary
cores were only used to verify the sediment stratigraphies of
cores obtained from transect A. A handheld Olympus Innov-X
DELTA Premium XRF analyzer was used in this study. XRF
Estuaries and Coasts

is a non-destructive analytical technique used to determine the
elemental composition of materials. When a solid or liquid
sample is excited by a primary X-ray source, elements present
in a sample produce a fluorescent X-ray that is unique for that
specific element. An XRF analyzer measures this energy and
analyzes groups of elements simultaneously in order to rapidly
determine those elements present in the sample and their rel-
ative concentrations. A total of 15 elements were detected in
our samples, but 6 of them were present only in trace amounts
with no systematic changes. Therefore, only 9 common ele-
ments (S, Cl, Ca, Sr, Zr, Br, K, Ti, and Fe) and the chlorine/
bromine (Cl/Br) ratio are presented in this study. Previous
studies have successfully used XRF analysis to identify ma-
rine indicators in coastal sediments (e.g., Cl, Ca, Sr, and Zr)
(Ramrez-Herrera et al. 2012; Liu et al. 2014; McCloskey et al.
2018a, 2018b; Ercolani et al. 2015), as well as terrestrial
runoffs (e.g., Fe, Ti, and K) in sedimentary records (Haug
et al. 2001; You 2008; van Soelen et al. 2012). In particular,
the Cl/Br ratio has been used as a marine indicator in
sediment-stratigraphic studies in coastal and estuarine envi-
ronments (Liu et al. 2014; McCloskey et al. 2018a, 2018b;
Yao et al. 2018). The elemental concentrations are reported in
parts per million (ppm), and the Cl/Br ratio was generated
based on the concentration counts (ppm). Loss-on-ignition
(LOI) analyses were used to reveal the % wet weight for water
and % dry weight for organics and carbonates throughout the
cores and surface samples. The XRF and LOI analyses were
performed at 1 cm interval for these cores, and laboratory
procedures followed those described in Yao et al. (2015,
2018) and Yao and Liu (2017, 2018).
Hydrological Data
To put the magnitude of the Harvey flood event in the historical
context, we analyzed the hydrological data for the San Bernard
River for a 28-year period from 1990 to 2017. For daily dis-
charge (Qd in cm) and daily sediment load (DSL in ton/day)
records, we used the gauging station at Boling about 90 km
Fig. 2 (a) Focal area A by the side of the San Bernard River showing overbank flooding during the Harvey event. Red star shows location of core 202.Red lines denote transects A and B. (b) Location of cores 23–28 along transect B. (c) Location of cores 209 and 20–22 along transect A
Estuaries and Coasts

north of SBNWR (USGS ID 08117500) (USGS 2018). Twenty-
eight years of Qd data (1990–2017) were collected from Boling
to document the long-term discharge record of the San Bernard
River; in addition, hourly discharge records (Qhr) were compiled
from real-time discharge data (at 15-min intervals) at Boling,
from August 26 to September 7, 2017, to analyze the hourly
fluctuations in river flooding during the passage of Hurricane
Harvey. The daily sediment loads (DSL) in the San Bernard
River at Boling during Hurricane Harvey were calculated ac-
cording to the following formula: DSL=Qd × SSC × 0.0864.
Calculation for the daily suspended loads (SSLd) is described
in Joshi and Xu (Joshi and Xu 2015; Joshi and Xu 2017).
Storm surge data were retrieved from the SURGEDAT database
(http://surge.srcc.lsu.edu).
Results
Long-Term Flow Conditions in the San Bernard River
The average daily discharge (Qd) at Boling along the San
Bernard River is ~ 17 cm from 1990 to 2017 (Fig. 5a). Over
the 28-year period, Qd for the river exceeded 100 cm for only
390 days, remained between 10 and 100 cm for 2275 days, and
was less than 10 cm for the remaining 7563 days (calculated
based on Fig. 5a). Among those high discharge events (Qd >
100 cm), the highest level in Qd was recorded during Harvey,
whenQd increased from 289 cm (August 27, 2017) to 1405 cm
(September 1, 2017) and then decreased back to 125 cm
(September 7, 2017) (Fig. 5). The second highest level in Qd
over the 28-year period was in October 1998, whenQd reached
886 cm. A few other notable high discharge events for San
Bernard River at Boling occurred in June 1993 (431 cm),
October 1994 (the Great Flood of Houston, 549 cm),
September 2001 (357 cm), November 2002 (498 cm), and
November 2004 (442 cm). The hourly discharge (Qhr) at
Boling in the San Bernard River recorded two peaks during
the landfall of Hurricane Harvey. The first peak was 1184 cm
at 2 pm on August 30. The second and the highest recordedQhr
at Bolingwas 1511 cm at 12 am on September 1, 2017 (Fig. 5b).
Suspended Sediment Load in the San Bernard RiverDuring Harvey
The San Bernard River had an average daily suspended sedi-
ment load (SSLd) of 848 ton/day during August and
Fig. 3 Focal area B by the coast of San Bernard NWR showing location of the 17 surface samples
Estuaries and Coasts

September 2017 (USGS ID 08117500) (USGS 2018). The
SSLd for the San Bernard River varied between 0.42 and
104 ton/day from August 1 to 25, 2017 (before
Harvey); between 739 and 7575 ton/day from August
26 to September 7, 2017 (during Harvey); and between
11 and 579 ton/day from September 8 to 30, 2017 (post
Harvey) (Fig. 6). It should be noted that even during
the peak of the Harvey-induced flood event on
September 1, 2017, the maximum Qd (1405 cm) and
SSLd (7575 tons/day) for the San Bernard River were
only a tiny fraction of the corresponding maxima for
adjacent Trinity River (3510 cm; 128,657 tons/day)
and Brazos River (3360 cm; 1,146,725 tons/day)
(Sanjeev Joshi, unpublished data) (Fig. 6). This is due
to the fact that the drainage basin of the San Bernard
River covers a much smaller area than the latter two
neighboring rivers.
Storm Surge Data at SBNWR
Tidal gauge data from Sargeant, Freeport, and San Luis Pass,
the three nearest stations relative to our study area
(SURGEDAT 2018), show that the height of storm surges
reached up to ~ 1 m at Sargeant on August 29 (Fig. 7). All
three sites recorded two peak storm surges on August 26 and
29. The heights of the two peak storm surges are ~ 0.9 m and
~ 0.92 m at San Luis Pass, ~ 0.65 m and ~ 0.4 m at Freeport,
and ~ 0.7 m and ~ 1 m at Sargeant, respectively.
Storm Deposits
Of all 9 cores collected for this study, only three (SBW 202,
20, 209) contain a distinct storm deposit identifiable upon
visual inspection in the field or in the laboratory. Core SBW
202 was taken at the foot of the natural levee only 50 m from
the San Bernard River (Fig. 2). The flood deposit occurs in the
form of a 9-cm-thick light gray, rootless, inorganic mud rest-
ing on brownish-gray organic rooted mud representing the
pre-flood marsh surface (Fig. 8). The presence of this flood
deposit here is not surprising due to this site’s proximity to the
river. A similar light gray inorganic mud layer was found at
the top of core SBW209 in transect A, located about 50m into
the marsh fromHighway 2918. This 4-cm-thick rootless flood
deposit overlies an organic-rich marsh deposit containing
many plant roots (Fig. 8). Core SBW 20, located very close
to SBW 209, also contains a distinct storm deposit at the top.
This tilted layer, ranging from ~ 5 to 10 cm in thickness from
one side to the other, consists of two light-color inorganic
units separated by a thin organic detritus layer in the middle
(Fig. 8). The marsh surface in that part of transect A was
hummocky with a micro-topography of mounds and depres-
sions formed by clumps of bunch grasses, which may contrib-
ute to the uneven thickness of the storm deposit at the coring
site.
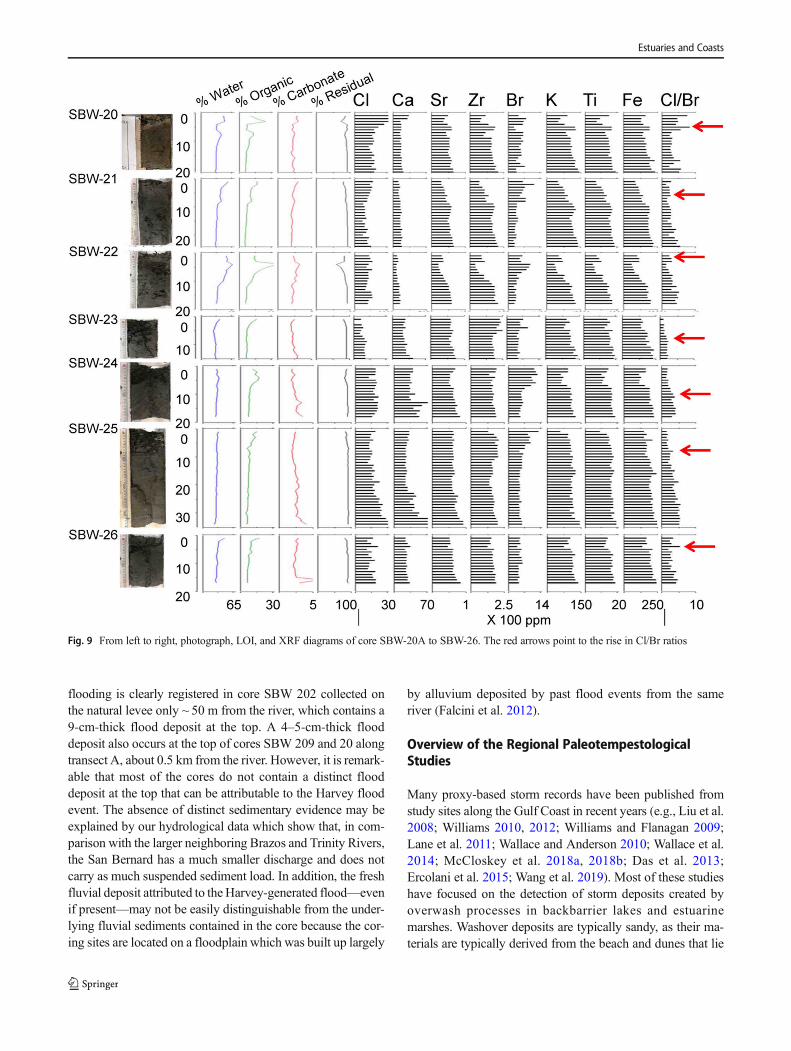
Lithology and Chemical Stratigraphy
The other cores taken from transect A (SBW 21–22) and tran-
sect B (SBW 23, 24, 25, 26) do not contain a distinct storm
deposit at the top, but they have similar stratigraphic profiles.
All cores consist of gray rooted sediment at the base. These
organic rooted sediments have relatively low water (< 30%)
and organic matter (< 5%) contents, and the elemental con-
centrations of all elements are relatively consistent in most
intervals throughout the rooted sediments (Fig. 9). Most cores
show a slight increase in organic matter content near the top,
while a few cores (SBW 20, 22, 24) contain a peak in organic
matter at 2–4 cm from the top (Fig. 9). XRF analysis detects a
rise in Cl/Br ratio at the ~ 3–10 cm level, followed by a decline
at the top (Fig. 9). This rise in Cl/Br ratio is more prominent in
some cores (SBW 20, 21, 22, 25, 26) but subtler or indistinct
in others (SBW 23, 24). In core SBW 20, a prominent peak in
Cl/Br ratio occurs at the base of the storm deposit, but, in other
cores (e.g., SBW 22, 25, 26), a peak seems to be present even
though no distinct storm deposit is present.
Despite their overall similarities, LOI and XRF profiles
also exhibit different characteristics between cores along tran-
sects A and B. The water (25–50% vs. < 20%) and organic
Fig. 4 Mud andwrack caught on the plants showing the maximum height(red arrow by the meter stick: ~ 0.85 m) of the flood water near core 20
Estuaries and Coasts

matter (10–20% vs. 5–10%) contents in cores from transect A
are generally higher than those in cores from transect B, par-
ticularly at the top portion of the cores, but the concentrations
of Ca are significantly lower in cores from transect A
(< 2000 ppm) than cores from transect B (3000–5000 ppm).
Surface Samples
The 17 surface samples taken from 4 different environmental
settings exhibit distinct sedimentological and chemical gradi-
ents (Fig. 10). Samples SBSS-1 to SBSS-4, taken from the
beach and intertidal zone, contain very low contents of
water, organics, and carbonates and high concentrations
of Ca, resembling typical marine-originated sediments
(Yao and Liu 2018; Yao et al. 2018). Moving inland,
sand dune samples SBSS-5 to SBSS-8 have sedimento-
logical and chemical characteristics broadly similar to
the intertidal group, except for higher Zr contents and
the exponentially high Cl/Br ratios due to the negligible
amounts of Br in these samples. Samples SBSS-9 to
SBSS-12, taken from the backbarrier mudflat, show
very different signals than the previous two groups.
Fig. 5 (a) Daily discharge (Qd) for the San Bernard at Boling from January 1, 1990, to December 31, 2017. (b) Hourly discharge (Qhr) for the SanBernard River at Boling during Hurricane Harvey from August 25 to September 7, 2017
Fig. 6 Daily suspended sedimentload (SSLd) for the San Bernard(Boling), Brazos (Richmond),and Trinity (Liberty) Riversduring August and September2017. Note: Hurricane Harveyoccurred from 8/25/2017 to 9/5/2017
Estuaries and Coasts

Contents of water, organics, and especially carbonates
increase significantly in this group. XRF results also
indicate a significant increase in both Cl and Br and
slight increase in K, Ti, and Fe, typical indicators for
terrestrial originated sediments (Yao et al. 2015; Yao
and Liu 2017). The Cl/Br ratio, however, is much lower
than that in the beach and dunes groups that are closer
to the marine environment. Samples SBSS-13 to SBSS-
17, taken from the saltmarsh behind the mudflat, are
marked by a significant increase in the water content,
decrease in marine indicators (Ca, Sr, and Zr), and grad-
ual increase in the terrestrial indicators (K, Ti, and Fe).
Most remarkably, the Cl/Br ratio is the lowest of the
four coastal groups as this saltmarsh group is located
farthest away from direct marine influence. To reveal
the differences between the coastal prairie/floodplain de-
posits at our coring sites and surface samples from the
coastal area, we included the LOI and XRF results of
the top layers of core SBW 20–26 at the bottom of
Fig. 10. In comparison, the core top samples contain
much higher contents of organic matter and terrestrial
elements (K, Ti, Fe), but the Cl/Br ratio is the lowest
among all the groups.
Discussion
Sedimentary Signature of Hurricane Harvey
Satellite images clearly show that our coring sites were inun-
dated by floodwaters after Hurricane Harvey’s landfall
(Fig. 2a). Field observations based on water marks and wrack
lines suggest that the floodwater was approximately 85 cm
deep near core SBW 20 along transect A (Fig. 4). The storm
surge data show two peaks on August 26 and 29, with the first
peak reaching 0.65–0.9 m and the second peak reaching
0.4–1.0 m in height (Fig. 7). Although there is no ev-
idence that the sand dunes were overtopped or breached
by the storm surge, it is likely that during the landfall
of Hurricane Harvey, a large quantity of seawater was
introduced into the bays and estuaries behind the sand
dunes at SBNWR (Fig. 1). The Intra-Coastal Waterway
may also serve as a conduit to allow the seawater to
spread onto the marshes and shallow ponds behind it.
Thus, it is likely that our coring sites along the two
transects, which were at ~ 0.7 m elevation, were affect-
ed by seawater during the first and perhaps also the
second storm surge during the landfall. However, the
Fig. 7 Maximum storm surge(MSS) at locations nearest to oursampling sites (red star) in theSBWR (August 25–September 1,2017)
Estuaries and Coasts

wave energy of the storm surge waters would probably
have been significantly attenuated due to the protection
by the coastal sand dunes, and the storm surge waters
probably did not carry much coarse marine sediments as
they would have been trapped or filtered by the shallow
ponds and marsh vegetation before they could reach our
coring sites. This explains the lack of a distinct layer of
storm surge or washover sediments at our coring sites.
Despite this lack of sedimentary evidence for storm
surge deposition, the inundation by seawater did leave
a geochemical signal at our study sites in the form of
an elevated Cl/Br ratio near the top of the sediment
cores (Fig. 9). Our surface sample study has shown that
the Cl/Br ratios are higher in intertidal and sand dune
environments that are closer to the Gulf of Mexico than
in mudflat and saltmarsh environments that are less ex-
posed to marine influences, whereas our coring sites
situated farthest away from the coast have the lowest
Cl/Br ratios (Fig. 10). Therefore, these surface sample
data confirm results from previous studies that the Cl/Br
ratio can be used as a salinity indicator and, as a cor-
ollary, evidence of marine intrusion into lower-salinity
environments (Alcalá and Custodio 2004; Liu et al.
2014; McCloskey et al. 2018a, 2018b; Yao et al.
2018). Stratigraphically, the peaks in Cl/Br ratio are
more prominent or thicker in some cores but are more
subtle or thinner in others, and it may occur near the
top in some cores and deeper (down to 5–12 cm) in
others. The deeper occurrence may be due to the down-
ward percolation of the storm surge seawater through
the root zone of the marsh plants.
Heavy precipitation brought on by Hurricane Harvey
caused extensive flooding of the San Bernard River. Our hy-
drological data show that the discharge and suspended load of
the San Bernard River peaked on September 1, three days after
the second storm surge peak (Fig. 5). The discharge peak also
lasted for nearly a week before it returned to normal level
(Fig. 5b). Thus, there is no doubt that freshwater flooding
from the San Bernard River is the predominant cause of the
inundation at the study sites. Evidence of the overbank
Fig. 8 Photos of distinct floodlayers (above the white dashlines) at the top of core SBW 202,20, and 209
Estuaries and Coasts
flooding is clearly registered in core SBW 202 collected on
the natural levee only ~ 50 m from the river, which contains a
9-cm-thick flood deposit at the top. A 4–5-cm-thick flood
deposit also occurs at the top of cores SBW 209 and 20 along
transect A, about 0.5 km from the river. However, it is remark-
able that most of the cores do not contain a distinct flood
deposit at the top that can be attributable to the Harvey flood
event. The absence of distinct sedimentary evidence may be
explained by our hydrological data which show that, in com-
parison with the larger neighboring Brazos and Trinity Rivers,
the San Bernard has a much smaller discharge and does not
carry as much suspended sediment load. In addition, the fresh
fluvial deposit attributed to the Harvey-generated flood—even
if present—may not be easily distinguishable from the under-
lying fluvial sediments contained in the core because the cor-
ing sites are located on a floodplain which was built up largely
by alluvium deposited by past flood events from the same
river (Falcini et al. 2012).
Overview of the Regional PaleotempestologicalStudies
Many proxy-based storm records have been published from
study sites along the Gulf Coast in recent years (e.g., Liu et al.
2008; Williams 2010, 2012; Williams and Flanagan 2009;
Lane et al. 2011; Wallace and Anderson 2010; Wallace et al.
2014; McCloskey et al. 2018a, 2018b; Das et al. 2013;
Ercolani et al. 2015; Wang et al. 2019). Most of these studies
have focused on the detection of storm deposits created by
overwash processes in backbarrier lakes and estuarine
marshes. Washover deposits are typically sandy, as their ma-
terials are typically derived from the beach and dunes that lie
Fig. 9 From left to right, photograph, LOI, and XRF diagrams of core SBW-20A to SBW-26. The red arrows point to the rise in Cl/Br ratios
Estuaries and Coasts

in front of the coring sites, as well as marine sediments
transported by waves and currents under high-energy condi-
tions (Liu and Fearn 1993, 2000; Liu 2004; Liu et al. 2008,
2011, 2014; Bregy et al. 2018). Thus, washover sediments can
be identified by a distinct drop in water and organic matter
contents in the LOI results and an increase in the Cl/Br ratio in
the XRF results (Liu 2004; Liu et al. 2014; Yao et al. 2018;
Ryu et al. 2018). However, the storm deposition generated by
Hurricane Harvey in SBNWR poses a special challenge to
paleotempestology, as it probably involves an initial phase
of seawater intrusion followed by an extended phase of fluvial
sedimentation due to freshwater flooding from an adjacent
river. Although a lack of overwash processes during the initial
storm surge phase caused the absence of a distinct sand layer
in all of the coring sites, the seawater intrusion can still be
detected by a peak in the Cl/Br ratio in the geochemical profile
of most sediment cores.
For paleotempestological study, it is clear that not all hurri-
canes that come near the study area will be recorded. Many
factors are required for the preservation of the storm deposits,
such as ideal beach barrier dimensions, short site-to-sea distance,
and stable sedimentary environment of the study site, among
others (Liu 2004). In addition, many paleotempestological stud-
ies have indicated that most sites are not sensitive enough to
record hurricane landfalls beyond the immediate vicinity, and
only intense hurricanes (category 3 and above) will be recorded
(Liu 2004; Donnelly and Webb III 2004; Elsner et al. 2008).
However, as some sites across the Gulf record different
threshold events as well as varying background sedimentation
rates, a careful consideration of these factors must occur for site
comparison (Wallace et al. 2014). The only way to bridge the
gaps between the existing hurricane records is to conduct
paleotempestological studies in more locations throughout the
western Atlantic Basin, so that we can put all the records in the
regional context to better determine the long-term hurricane dy-
namics. In this study, we demonstrated that XRF analysis, in
particular using the Cl/Br ratio as an indicator, can be used to
identify storm events in the sedimentary record in the absence of
overwash processes. Although site-sensitivity remains an issue,
this study shows the potential to obtain storm records in a wider
range of geomorphological conditions, in particular sand-limited
coastal systems where traditional sedimentological prox-
ies (i.e., washover sand layers) are absent or ineffective.
This methodological advancement allows more coastal
and estuarine locations across the North Atlantic to be-
come amenable to paleotempestological studies, thereby en-
abling more proxy records to be produced from otherwise sub-
optimal sites, such as the sand-limited coastal prairies along the
Texas coastlines. One question that warrants further investiga-
tion concerns the preservation potential of the geochemical sig-
nals in the sediment stratigraphy. The sediment coring and the
XRF analysis in this study were conducted within four months
after the Harvey storm event. A follow-up coring campaign
would be useful to determine if the geochemical signals espe-
cially the Cl/Br ratio are still preserved in the sediment profiles
at the same sites along the study transects after several years.
Fig. 10 LOI and XRF diagrams of surface samples SBSS-1 to SBSS-17 and top layer of core SBW20 to SBW26 (* Samples with exceptionally high Cl/Br ratios)
Estuaries and Coasts

Conclusions
This study investigated the depositional process associated
with Hurricane Harvey from wetland sites near the San
Bernard River at the SBNWR, Texas. Our hydrological data
indicate that Hurricane Harvey caused the largest flooding
within SBNWR over the last 28 years, and freshwater
flooding from the San Bernard River is the predominant cause
of the inundation at the study sites. Due to the lack of
overwash processes during the initial storm surge phase, a
distinct sand layer is lacking in all of the coring sites, but the
intrusion of seawater can still be detected by a peak in the Cl/
Br ratio in the chemical stratigraphy of most sediment cores.
The ensuing phase of freshwater flooding and fluvial sedimen-
tation is represented by a distinct flood deposit in only a few
sites, but absent or not clearly identifiable in most cores. The
elusiveness of the fluvial flood deposit in SBNWR suggests
that it is thin and not evenly distributed, even at our coring
sites that are only 0.5 km away from the San Bernard River.
The relatively low discharge and suspended sediment load of
the San Bernard River, which were spread out over a large
coastal prairie/marsh on a floodplain, probably account for the
thin and uneven distribution of the flood deposit. The similar-
ity between the fluvial deposit generated by Harvey’s flood
and the underlying sediment deposited by previous floods on
the floodplain may also contribute to the difficulty in the iden-
tification of Harvey’s flood deposit. More work needs to be
done to confirm the results from this pilot study of Hurricane
Harvey’s sedimentation patterns and processes.
Acknowledgments This research was supported by a grant from theNational Science Foundation (NSF RAPID Grant No. EAR-1803035).We are grateful to all the staff members of the San Bernard NationalWildlife Refuge for their logistical support. We also thank LanceRiedlinger and Gabrien Panteria for their assistance in the laboratory.
References
Alcalá, F. J. and Custodio, E., 2004. Use of the Cl/Br ratio as a tracer toidentify the origin of salinity in some coastal aquifers of Spain. In:Groundwater and saltwater intrusion: Selected papers from the 18th
saltwater intrusion meeting (ed. by Araguás, L., Custodio, E. &Manzano, M), 481–498. Publicaciones del Instituto Geológico yMinero de España.
Bianchette, T.A., T.A. McCloskey, and K.-B. Liu. 2016. Re-evaluatingthe geological evidence for Late Holocene marine incursion eventsalong the Guerrero Seismic Gap on the Pacific Coast of Mexico.
PLoS One 11 (8): e0161568. https://doi.org/10.1371/journal.pone.0161568.
Blake, E. S. and Zelinsky, D. A., 2017. National hurricane center tropicalcyclone report—Hurricane Harvey, website: https://www.nhc.noaa.gov/data/tcr/AL092017_Harvey.pdf
Bregy, J.C., D.J. Wallace, R.T. Minzoni, and V.J. Cruz. 2018. 2500-Yearpaleotempestological record of intense storms for the northern Gulf
of Mexico, United States. Marine Geology 396: 26–42.
Das, O., Y. Wang, J. Donoghue, X. Xu, J. Coor, J. Elsner, and Y. Xu.
2013. Reconstruction of paleostorms and paleoenvironment usinggeochemical proxies archived in the sediments of two coastal lakesin northwest Florida. Quaternary Science Reviews 68: 142–153.
Donnelly, J.P., and T. Webb III. 2004. Back-barrier sedimentary recordsof intense hurricane landfalls in the northeastern United States. In
Hurricanes and typhoons: Past, present and future, ed. R.J.Murnane and K.B. Liu, 58–95. New York: Columbia UniversityPress.
Donnelly, J.P., and J. Woodruff. 2007. Intense hurricane activity over the
past 5000 years controlled by El Nino and the West AfricanMonsoon. Nature 44: 465–468.
Duan, N. 1983. Smearing estimate: A nonparametric retransformationmethod. Journal of the American Statistical Association 78 (383):
605–610.
Elsner, J.B., T.H. Jagger, and K.B. Liu. 2008. Comparison of hurricanereturn levels using historical and geological records. Journal ofApplied Meteorology and Climatology 47 (2): 368–374.
Ercolani, C., J.Muller, J. Collins, M. Savarese, and L. Squiccimara. 2015.
Intense southwest Florida hurricane landfalls over the past 1000years. Quaternary Science Reviews 126: 17–25.
Falcini, F., N.S. Khan, L. Macelloni, B.P. Horton, C.B. Lutken, K.L.McKee, R. Santoleri, S. Colella, C. Li, G. Volpe, and M.
D’Emidio. 2012. Linking the historic 2011 Mississippi River floodto coastal wetland sedimentation. Nature Geoscience 5 (11): 803–807.
Gray, A.B., G.B. Pasternack, E.B. Watson, J.A. Warrick, and M.A. Goni.
2015. Effects of antecedent hydrologic conditions, time dependence,and climate cycles on the suspended sediment load of the SalinasRiver, California. Journal of Hydrology 525: 632–649.
Haug, G.H., K.A. Hughen, D.M. Sigman, L.C. Peterson, and U. Röhl.2001. Southward migration of the intertropical convergence zone
through the Holocene. Science 293 (5533): 1304–1308.
Joshi, S., and Y.J. Xu. 2015. Assessment of suspended sand availabilityunder different flow conditions of the lowermost Mississippi Riverat Tarbert landing during 1973–2013. Water 7 (12): 7022–7044.
Joshi, S., and Y.J. Xu. 2017. Bedload and suspended load transport in the140-km reach downstream of the Mississippi River avulsion to theAtchafalaya River. Water 9 (9): 716.
Khan, N.S., B.P. Horton, K.L. McKee, D. Jerolmack, F. Falcini, M.D.Enache, and C.H. Vane. 2013. Tracking sedimentation from the
historic AD 2011 Mississippi River flood in the deltaic wetlandsof Louisiana, USA. Geology 41 (4): 391–394.
Lane, P., J.P. Donnelly, J.D. Woodruff, and A.D. Hawkes. 2011. Adecadally resolved paleohurricane record archived in the late
Holocene sediments of a Florida sinkhole. Marine Geology 287(1-4): 14–30.
Liu, K.B. 2004. In Palaeotempestology: Principles, methods and exam-
ples from Gulf coast lake sediments, ed. R. Murnane and K.B. Liu ,
13–57. New York: Columbia University Press.Hurricanes and ty-phoons: Past, present and future
Liu, K.B., and M.L. Fearn. 1993. Lake-sediment record of late Holocenehurricane activities from coastal Alabama. Geology 21 (9): 793–
796.
Liu, K.B., and M.L. Fearn. 2000. Reconstruction of prehistoric landfallfrequencies of catastrophic hurricanes in northwestern Florida fromlake sediment records. Quaternary Research 54 (2): 238–245.
Liu, K.B., H.Y. Lu, and C.M. Shen. 2008. A 1,200-year proxy record of
hurricanes and fires from the Gulf of Mexico coast: Testing thehypothesis of hurricane-fire interactions. Quaternary Research 69(1): 29–41.
Liu, K.B., C. Li, T.A. Bianchette, T.A.McCloskey, Q. Yao, and E.Weeks.
2011. Storm deposition in a coastal backbarrier lake in Louisianacaused by Hurricanes Gustav and Ike. Journal of Coastal Research,SI 64: 1866–1870.
Estuaries and Coasts

Liu, K.B., T.A. McCloskey, S. Ortego, and K. Maiti. 2014. Sedimentary
signature of Hurricane Isaac in a Taxodium swamp on the westernmargin of Lake Pontchartrain, Louisiana, USA. In Proceedings of
the International Association of Hydrological Sciences, vol. 367,421–428.
McCloskey, T.A., and K-b. Liu. 2012. A sedimentary-based history ofhurricane strikes on the southern Caribbean coast of Nicaragua.Quaternary Research 78 (3): 454–464.
McCloskey, T.A., and K.-B. Liu. 2013. A 7000-year record of
paleohurricane activity from a coastal wetland in Belize. TheHolocene 23: 276–289.
McCloskey, T.A., T.A. Bianchette, and K.B. Liu. 2015. Geological andsedimentological evidence of a large tsunami occurring ~ 1100 year
BP from a small coastal lake along the Bay of La Paz in BajaCalifornia Sur, Mexico. Journal of Marine Science and
Engineering 3 (4): 1544–1567.McCloskey, T.A., C.G. Smith, K.B. Liu, M. Marot, and C. Haller. 2018a.
How could a freshwater swamp produce a chemical signature char-acteristic of a saltmarsh? ACS Earth and Space Chemistry 2 (1): 9–20.
McCloskey, T.A., C.G. Smith, K.B. Liu, and P.R. Nelson. 2018b. The
effects of tropical cyclone-generated deposition on the sustainabilityof the Pearl River Marsh, Louisiana: The importance of the geologicframework. Frontiers in Ecology and Evolution 6: 179.
National Oceanic and Atmospheric Administration (NOAA),2018a
website: https://coast.noaa.gov/hurricanes/. Date of retrieval:June 2018a
National Oceanic and Atmospheric Administration (NOAA),2018bHurricane Harvey imagery, website: https://storms.ngs.noaa.gov/
storms/harvey/index.html#15/28.8968/-95.5174. Date of retrieval:June 2018b
Rachel J.,2018 San Bernard National Wildlife Refuge handbook of Texasonline, accessed July 11, 2018: http://www.tshaonline.org/
handbook/online/articles/gks03.Ramírez-Herrera, M.T., M. Lagos, I. Hutchinson, V. Kostoglodov, M.L.
Machain,M. Caballero, A. Goguitchaichvili, B. Aguilar, C. Chagué-Goff, J. Goff, and A.C. Ruiz-Fernández. 2012. Extreme wave de-
posits on the Pacific coast of Mexico: tsunamis or storms?—Amulti-proxy approach. Geomorphology 139: 360–371.
Ryu, J., T.A. Bianchette, K.B. Liu, Q. Yao, and K.D. Maiti. 2018.Palynological and geochemical records of environmental changes
in a Taxodium swamp near Lake Pontchartrain in SouthernLouisiana (USA) during the last 150 years. Journal of CoastalResearch Special Issue 85: 381–385.
Texas Parks and Wildlife (TPWD),2018 website: https://tpwd.texas.gov/
publications/pwdpubs/pwd_rp_t3200_1059c/san_bernard_river.phtml. Date of retrieval: June 2018.
The United States Geological Survey (USGS),2018 website: https://waterdata.usgs.gov/usa/nwis/uv. Date of retrieval: June 2018.
The World’s Storm Surge Data Center (SURGEDAT),2018 website:http://surge.srcc.lsu.edu. Date of retrieval: June 2018.
U.S. Fish andWildlife Service (FWS). 2010 Annual report of lands under
control of the U.S. Fish and Wildlife Service. Website: https://www.fws.gov/refuges/land/LandReport.html. Date of retrieval: July 30,2019.
van Soelen, E.E., G.R. Brooks, R.A. Larson, J.S.S. Damsté, and G.J.
Reichart. 2012. Mid- to late-Holocene coastal environmental chang-es in southwest Florida, USA. The Holocene 22: 1–10.
Wallace, D.J., and J.B. Anderson. 2010. Evidence of similar probabilityof intense hurricane strikes for the Gulf of Mexico over the late
Holocene. Geology 38 (6): 511–514.Wallace, D.J., J.D. Woodruff, J.B. Anderson, and J.P. Donnelly. 2014.
Paleohurricane reconstructions from sedimentary archives along theGulf of Mexico, Caribbean Sea and western North Atlantic Ocean
margins. Geological Society, London, Special Publications 388 (1):481–501.
Wang, L., T.A. Bianchette, and K. Liu. 2019. Diatom evidence of apaleohurricane-induced coastal flooding event in Weeks Bay,
Alabama, USA. Journal of Coastal Research (in press).Westerhoff, P., P. Chao, and H. Mash. 2004. Reactivity of natural organic
matter with aqueous chlorine and bromine. Water Research 38 (6):1502–1513.
Williams, H.F. 2010. Storm surge deposition by Hurricane Ike on theMcFaddin National Wildlife Refuge, Texas: Implications forpaleotempestology studies. Journal of Foraminiferal Research 40:210–219.
Williams, H.F.L. 2012. Magnitude of Hurricane Ike storm surge sedimen-tation: Implications for coastal marsh aggradation. Earth Surface
Processes and Landforms 37: 901–906.Williams, H.F.L., and W.M. Flanagan. 2009. Contribution of Hurricane
Rita storm surge deposition to long-term sedimentation in Louisianacoastal woodlands and marshes. Journal of Coastal ResearchSpecial Issue 56: 1671–1675.
Yao, Q., andK.B. Liu. 2017. Dynamics ofmarsh-mangrove ecotone since
the mid-Holocene: A palynological study of mangrove encroach-ment and sea level rise in the Shark River Estuary, Florida. PLoSOne 12 (3): e0173670.
Yao, Q., and K.B. Liu. 2018. Changes in modern pollen assemblages and
soil geochemistry along coastal environmental gradients in theEverglades of south Florida. Frontiers in Ecology and Evolution 5:178.
Yao, Q., K.B. Liu, V.H. Rivera-Monroy, and W.J. Platt. 2015.
Palynological reconstruction of environmental changes in coastalwetlands of the Florida Everglades since the mid-Holocene.Quaternary Research 83: 449–458.
Yao, Q., K.B. Liu, and J. Ryu. 2018. Multi-proxy characterization of
Hurricane Rita and Ike storm deposits in a coastal marsh in theRockefeller Wildlife Refuge, Southwestern Louisiana. Journal ofCoastal Research Special Issue 85: 841–845.
You, A.Z. 2008. Comparative study of chemical composition of sedi-
ments from different water systems and estuaries of Fujian province.Geophysical and Geochemical Exploration 32: 28–30.
Estuaries and Coasts


