
HYDROLOGY OF THE NEWBERRY VOLCANO CALDERA, OREGON
by Edward A. Sammel and Robert W. Craig
U.S. GEOLOGICAL SURVEY
Water Resources Investigation Report 83-4091
Menlo Park, California
1983
11

CONTENTSPage
Abs t r ac t 1
Int roduc t ion 3
Scope and methods of the study 5
Description of the caldera 6
C1 ima t e 8
The hydrologic budget 9
E s t imat i on of t e rms 9
Precipitation 9
Surface-water out flow 10
Evaporation from lake surfaces 13
Ev apo transpirat ion 16
Budget calculation 16
Chemistry of surface and ground water 22
Major ionic constituents 22
Stable isotopes in surface and ground water 29
Temperatures of surface and ground water 33
Discussion of results 36
Re f er ence s 40
T ab 1 e s 4 2
ILLUSTRATIONSPage
Figure 1. Sketch map of the caldera at Newberry Volcano 5
2. Stiff diagrams of the major chemical constituents inground and surface water 22
3. Graphs showing relations between concentrations of selected chemical constituentsa. Chloride versus silica 27 b. Bicarbonate versus total major ions less bicarbonate 28
111

ILLUSTRATIONS (CONTINUED)Page
Figure 4. Graph showing concentrations of oxygen-18 versusdeuterium in ground and surface water 29
5. Map showing temperatures measured on the lake bottomin Paulina and East Lakes 33
TABLESPage
Table 1. National Weather Service stations in the vicinity ofNewberry Volcano 11
2. Precipitation recorded during selected periods at the NewberryVolcano, Chemult, and Wickiup Dam weather stations 42
3. Measured and estimated discharges, in cubic feet per second,from Paulina Lake to Paulina Creek 12
4. Estimated daily evaporation at Paulina Lake and EastLake for the period July 1 to September 30, 1981 44
5. Calculation of potential evapotranspiration at Newberrycaldera using the Hamon equation 17
6. Calculation of soil-moisture balance at Newberry caldera 18
7. Areas used in calculating the hydrologic budget 19
8. Average annual hydrologic budget, Newberry caldera 20
9. Data from wells in Newberry caldera 49
10. Data from springs and gas vents in Newberry caldera 52
11. Chemical analyses of ground and surface water 23
12. Concentrations of the isotopes oxygen-18 and deuteriumin ground and surface water 30
IV
CONVERSION FACTORS
For readers who prefer to use metric units, conversion factors
for terms used in this report are listed below:
Multiply
foot (ft)
cubic foot per second (ft /s)
inch (in)
mile (mi)
acre
acre-foot (acre-ft)
0.3048
0.02832
25.40
1.609
4,047
1,233
To obtain
meter (m)
cubic meter per second
(m3 /s)
millimeter (mm)
kilometer (km)
2 square meter (m )o
cubic meter (m )
Most temperatures are reported in degrees Celsius (°C); for conversion
to degrees Fahrenheit (°F), use the formula, °F = 9/5 °C + 32.

HYDROLOGY OF THE NEWBERRY VOLCANO CALDERA, OREGON
By
Edward A. Saramel and Robert W. Craig
ABSTRACT
Precipitation in the Newberry caldera is nearly in balance with evapora
tion, evapotranspiration, and streamflow. A small surplus of water, estimated
to be in the range 2,500 to 6,500 acre-feet, is available annually for recharge
to deep aquifers beneath the caldera floor.
Precipitation in the caldera is estimated to be about 35 inches annually
(31,900 acre-feet) on the basis of multiple-regression analyses of records from
5 weather stations in the region and intermittent records from a storage gage in
the caldera. Paulina Creek, the only surface outlet from the caldera, dis
charges at least 13,000 acre-feet per year (18 cubic feet per second) from
Paulina Lake. Annual evaporation from two lakes, Paulina and East, is about 19
inches and 28 inches (2,100 acre-feet and 2,300 acre-feet), respectively, and
annual evapotranspiration from vegetated areas in the caldera is about 13 inches
(8,000 acre-feet). Evaporation was estimated by means of an empirical expres
sion on the basis of measurements at the lakes during the summer of 1981 and by
correlation with annual records at high-altitude lakes in the western United
States.
Nonthermal ground and surface water in the caldera has small concen
trations of dissolved solids in which calcium, magnesium, and bicarbonate
ions predominate. Thermal waters from springs and wells have dissolved solids
concentrations of 900 milligrams per liter or more and are characterized
by high concentrations of sodium and sulfate.
Maximum temperatures measured in the Paulina and East Lake Hot Springs
are 52°C and 62°C, respectively. Attempts to account for the origin of the hot
springs on the basis of mixing relations and isotopic analyses were incon
clusive. The springs probably represent mixtures of thermal and nonthermal water
that are altered by hydrogen sulfide and carbon dioxide gases rising from
sources beneath the caldera floor.
Temperatures in the lakes are higher than normal in the vicinity of the hot
springs and at other places, apparently due to inflows of thermal water through

the lake bottoms. The contributions of thermal water probably amount to no more
than a few hundred acre-feet per year and are neglected in the hydrologic
budget.
East Lake loses water by seepage to the shallow ground-water system at
rates that vary seasonally in response to precipitation and ground-water inflow.
Lake levels are self-regulating within fairly narrow limits. Paulina Lake
probably loses little water by seepage and its surface outflow is maintained by
ground-water inflow from the East Lake sub-basin.
Observations in a Geological Survey drill hole in the caldera suggest that
part of the surplus water in the caldera flows to aquifers at depths as much as
1,900 feet beneath the caldera floor. Potential recharge from the caldera to a
deep geo thermal reservoir is likely to be small and is probably limited to
permeable flow paths in faults and ring fractures.
INTRODUCTION
Newberry Volcano is one of many large volcanic structures built during
Quaternary time in the Cascade Range of Oregon. Situated on the eastern margin
of the Range in west central Oregon, Newberry is impressive more for its areal
extent (about 500 square miles) than for its height (less than 4,000 feet above
adjacent terrain). Newberry is characterized by a large collapsed summit
caldera similiar to those of two other Cascade Range volcanos, the former
Mount Mazama in Oregon, and Medicine Lake Volcano in California. The caldera
contains two scenic lakes, Paulina and East, and has been set aside as a recrea
tional area within the Deschutes National Forest.
Newberry has been studied by geologists since the early years of this
century, and interest has increased during the past 10 years as a result of its
potential as a source of geothermal energy. This interest has led to the
drilling of two research core holes as a part of the Geothermal Studies Program
of the U.S. Geological Survey (USGS) and has been the impetus for the hydrologic
study described in this paper.
The discovery of. high temperature and heat flow in the caldera (Saramel,
1981; MacLeod and Sammel, 1982) has encouraged the belief that a high-temper
ature geothermal resource may exist at Newberry, but has left many unanswered
questions regarding the nature of the resource. One of these questions concerns
the possible recharge of meteoric water to an underlying hydrothermal reservoir.
This report gives tentative conclusions as to the magnitude and nature of
recharge beneath the caldera.
A previous study by Phillips (1968) of three lakes in the Cascade Range
of Oregon, including East Lake, provided valuable background information as
well as preliminary estimates of the hydrologic terms evaluated in the present
study. Phillips drew his conclusions largely on the basis of extrapola
tions of data from other areas, some of them distant from Newberry. Our esti
mate of possible ground-water recharge does not differ greatly from that of
Phillips, and we commend his hydrologic acumen which led to apparently valid
conclusions on the basis of minimal and uncertain evidence.
We also acknowledge the following agencies and individuals whose support
was essential to our work; George I. Chesley, District Ranger, Fort Rock Ranger
District, Deschutes National Forest, and his staff for friendly cooperation and
support of our test drilling and hydrologic studies over a period of 4 years;
J. E. Vaughn, Silviculturist of the Fort Rock Ranger District, for the estimate
of evapotranspiration; Robert Pennington of the Oregon Department of Fish and
Wildlife and Robert Main, Water Master, District 11, Oregon Water Resources
Department, for aid in interpreting streamflow records; and Joe Kipp, owner of
the Paulina Lake Resort, and Robert Baling and Al Nesbitt, former and present
owners, respectively, of the East Lake Resort for aid and helpful interest
during our work at Newberry.

SCOPE AND METHODS OF THE STUDY
The study was conducted during the summer and fall of 1981 and was confined
to the approximately 17 square miles within the caldera (fig. 1). Prior recon
naissance had showed that no springs exist on the flanks of Newberry, that only
a few wells are located on the lowermost flanks, and that surface discharge of
water from the mountain normally occurs only in Paulina Creek, a westward-flow
ing stream draining Paulina Lake.
WELL OR SPRING :~s HOT SPRING AREA
4* GEOTHERMAL TEST HOLE
O PRECIPITATION GAGE
A WEATHER.INSTRUMENT (TEMPORARY) v^ CALDERA RIM '~~^ RING FRACTURE
OREGON
Figure 1. Sketch map of the caldera at Newberry Volcano.
Information on ground water was collected from 22 water wells, two groups
of warm springs, and two USGS drill holes. The hydrologic budget was estimated
from data obtained both in the caldera and elsewhere in the region. The esti
mate of precipitation, based on multiple-regression analyses of records at
Newberry and nearby stations, is thought to be the most reliable of the several
estimates. All others involved a degree of subjective judgement that introduced
large uncertainties into the estimates. Because the largest uncertainties
pertain to the smallest terms in the budget equation, the results of the budget
analysis are believed to be qualitatively correct and sufficiently accurate to
justify the overall conclusions.
DESCRIPTION OF THE CALDERA
The physical characteristics of the caldera and its setting were described
in detail by Phillips (1968), and the geology of the volcano was described in
MacLeod and others (1981) and MacLeod and Samrael (1982). Only essential details
are repeated here.
Newberry Volcano is a composite structure, made up of basalt and basaltic-
andesite flows, andesitic to rhyolitic ash-flow and ash-fall tuffs and other
pyroclastic deposits, dacite to rhyolite domes and flows, and alluvial sediments
(MacLeod and others, 1981). The flows extend for tens of miles, principally
toward the north and south. Massive tuffaceous deposits crop out on the flanks
and probably underlie many of the younger basalt and basaltic-andesite flows.
The rim of the caldera lies at altitudes that range from 7,000 feet to
7,500 feet or more on the north, south, and east sides, but decrease to 6,330
feet on the west side at the outlet of Paulina Lake. The highest point on
the rim, Paulina Peak, has an altitude of 7,985 feet, and is part of a large
rhyolite dome.
The caldera is a steep-walled basin, about 5 miles long (east-west) and 4
miles wide. The rim of the caldera lies at altitudes that range from 6,330 feet
on the west side to 7,985 feet at Paulina Peak on the south. Two lakes occupy
much of the caldera floor. Paulina Lake has a surface altitude of about 6,333
feet, a maximum depth of 252 feet, and covers 1,345 acres. East Lake is smaller
(980 acres) and shallower (170 feet depth) than Paulina Lake and lies at a
higher altitude (about 6,375 feet). A large pumice cone and two obsidian flows
separate the two lakes (fig. 1).
The caldera floor is a highly irregular surface formed largely of rhyolitic
rocks, including domes, flows, and pumiceous tephra deposits. Basaltic-andesite
and andesite flows and palagonite tuff rings occur in several places (MacLeod
and others, 1981). Below these rocks, a few dacitic flows and thick sequences
of alluvial and lacustrine sediments form the caldera fill which extends to a
depth of at least 1,600 feet. Below the caldera fill are flow rocks that are
similar in appearance and composition to the flank flows (MacLeod and Sammel,
1982).

Most of the caldera is densely forested with lodgepole pine, some yellow
pine, fir, and alder, but nearly 20 percent of the land area is unvegetated
rock, ash, or pumice. Depressions in the surface are mostly covered by pumice
or other volcanic ejecta, fallen or washed in from adjacent slopes. Overland
runoff from precipitation is nearly absent, even during heavy rainfalls.
Ground-water flow probably occurs readily in the upper few tens of feet of
permeable sediments, breccias, and the fractured tops of volcanic flows.
Underlying flow rocks and tuffaceous deposits, exposed at the western end of the
caldera, appear to have lower permeabilities and probably act as barriers to
deep percolation.

CLIMATE
Summer daytime temperatures in the caldera reach 100°F at times, but nights
are normally cool. Winter temperatures normally are below freezing, and sub-
freezing temperatures can occur in any month. The mean annual temperature is
about 32*F. Prevailing windy conditions in the caldera cause high evapo-
transpiration during sunny periods and rapid cooling as storm fronts pass.
Precipitation patterns at Newberry are similar to those in most of the
semi-arid region east of the Cascade Range in central Oregon, where most pre
cipitation falls during the months of October through April. But orographic
effects are significant at Newberry, and the volcano creates its own micro
climate to a large degree. Rain or snow may fall in the caldera at times when
the lower slopes and the adjacent valleys are in sunshine. The contrast between
the climate at Newberry and that of the surrounding region is indicated by
differences in the average annual precipitation at the three nearest weather
stations. Annual precipitation at Newberry is about 35 inches, whereas that at
Bend, 24 miles north, is 11.7 inches; at Fremont, 26 miles south, 10.9 inches;
and at Wickiup Dam, 26 miles west, 20.5 inches. The nearby weather stations are
at altitudes that range from 1,900 to 2,900 feet lower than the caldera.

THE HYDROLOGIC BUDGET
Estimation of Terms
The basic equation for the hydrologic budget of the caldera at Newberry
Volcano is
(1)
where P = precipitation in the caldera
OF = outflow to Paulina Creek
E = evaporation from lake surfaces
ET = evapotranspiration from land surfaces
S = seepage out of the near-surface hydrologic system.
The first four terms of the equation can be measured or estimated. The fifth
term, S, is assumed to be equal to the residual needed to balance the equation.
In the absence of evidence for long-term trends in any of the terms,
the seepage term, S, is assumed to be a long-term average seepage rate. As S is
the residual in the equation, it contains all errors of measurement or
estimation in other terms of the equation.
Precipitation
Records of precipitation at Newberry are available from a snow course and a
precipitation storage gage. The snow course was maintained from 1955 to 1968
under the Cooperative Snow Surveys Program of the U.S. Department of Agricul
ture, Soil Conservation Service. Measurements were summarized in George and
Haglund (1973). The precipitation storage gage, installed in 1965, is located
south of Paulina Lake at an altitude of 6,400 feet (fig. 1). Records are
published annually by the Oregon Water Resources Department. The average annual
precipitation cannot be determined directly from the storage-gage data because
of the difficulty of obtaining reliable winter measurements.
In order to estimate the average annual precipitation at Newberry Volcano
the storage-gage measurements were supplemented by data from National Weather
Service records at five stations in the region (table 1). Multiple-regression
analysis of the data shows that two stations, Chemult and Wickiup Dam, have
a significant correlation with reliable periods of record at Newberry despite
being at lower altitudes (table 2, end of report).
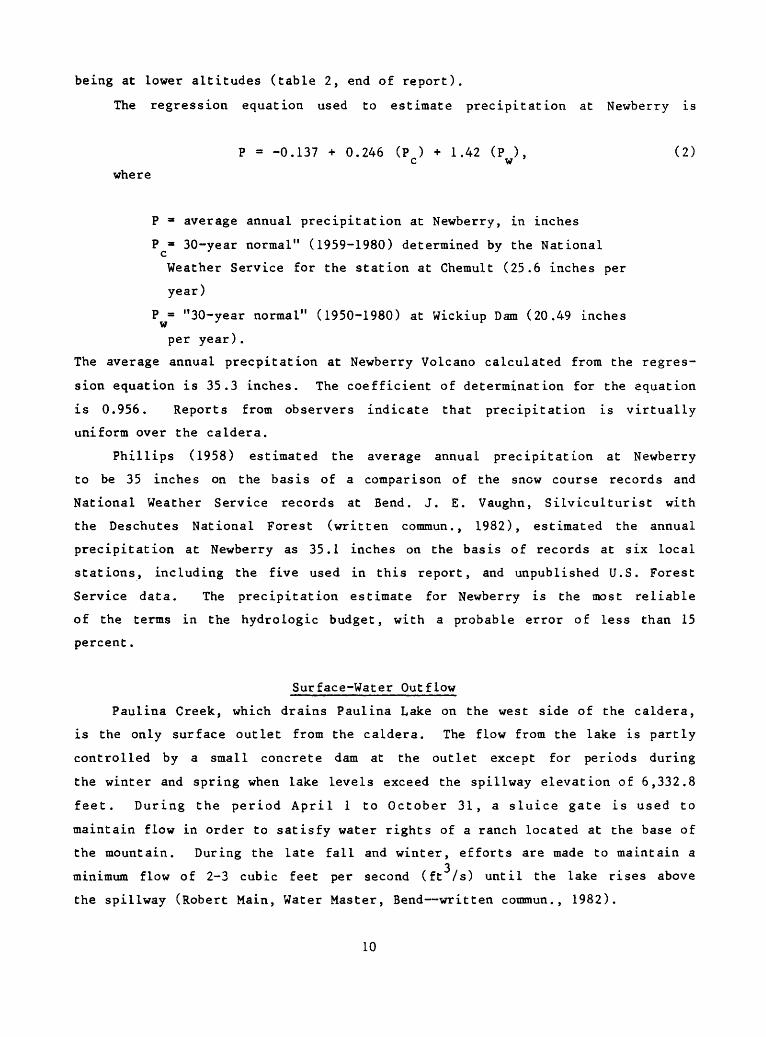
The regression equation used to estimate precipitation at Newberry is
-0.137 + 0.246 (P ) + 1.42 (P ), (2) c wwhere
P = average annual precipitation at Newberry, in inches
P * 30-year normal" (1959-1980) determined by the National
Weather Service for the station at Chemult (25.6 inches per
year)
P = "30-year normal" (1950-1980) at Wickiup Dam (20.49 inches
per year).
The average annual precpitation at Newberry Volcano calculated from the regres
sion equation is 35.3 inches. The coefficient of determination for the aquation
is 0.956. Reports from observers indicate that precipitation is virtually
uniform over the caldera.
Phillips (1958) estimated the average annual precipitation at Newberry
to be 35 inches on the basis of a comparison of the snow course records and
National Weather Service records at Bend. J. E. Vaughn, Silviculturist with
the Deschutes National Forest (written cotnmun., 1982), estimated the annual
precipitation at Newberry as 35.1 inches on the basis of records at six local
stations, including the five used in this report, and unpublished U.S. Forest
Service data. The precipitation estimate for Newberry is the most reliable
of the terms in the hydrologic budget, with a probable error of less than 15
percent.
Surface-Water Outflow
Paulina Creek, which drains Paulina Lake on the west side of the caldera,
is the only surface outlet from the caldera. The flow from the lake is partly
controlled by a small concrete dam at the outlet except for periods during
the winter and spring when lake levels exceed the spillway elevation of 6,332.8
feet. During the period April 1 to October 31, a sluice gate is used to
maintain flow in order to satisfy water rights of a ranch located at the base of
the mountain. During the late fall and winter, efforts are made to maintain a3 minimum flow of 2-3 cubic feet per second (ft /s) until the lake rises above
the spillway (Robert Main, Water Master, Bend written commun., 1982).
10

Table 1. National Weather Service stations in the vicinity of
Newberry Volcano
LocationStation
Bend
Chemult
Crater Lake
Fremont
Wickiup Dam
Latitude
44°
43°
42°
43°
43°
04'
14'
54'
20'
41'
Longitude
121° 19'
121° 47'
122° 08'
121° 10'
121° 41'
Distance, direction
from Newberry (miles)
24, N
44, SW
68, SW
26, S
26 ,W
Average annual precipita-
Altitude tion (feet) (inches)
3,599
4,760
6,475
4,512
4,358
11
25
67
10
20
.7
.6
.4
.9
.5
Unpublished stream-flow records are available from 1966 to the present.
Measurements were made by the Oregon Department of Fish and Wildlife between
1966 and 1974, and by the U.S. Forest Service from 1975 to the present. Flow
estimates based on the measurements are shown in table 3. Most of the measure
ments were made in the months May through September and the estimates for this
period given in table 3 are averages calculated after elimination of the high
and low values for each month. These estimates are considered fairly reliable.
The data available for the winter months may be unreliable and misleading.
A few lake-stage measurements indicate that flows during the winter can be as3 great as 30 or 35 ft /s, but reports from observers suggest that flows are
normally below these values. Calculations show that a discharge rate of 303 ft /s for 5 winter months would lower the lake level 6.7 feet unless replaced
by ground-water inflow. It is unlikely that winter ground-water discharge to
the lake could replace the approximately 9,000 acre-feet of water that would be
lost during so long a period of sustained high flow. Estimates for the period
October through April in table 3 represent the calculated distribution of3 discharge on the basis of an average annual flow of 18 /s.
11

Tabl
e 3.
Measured an
d es
tima
ted
discharges,
in cu
bic
feet pe
r se
cond
, from Paulina L
ake
Year
1967
1970
1971
1972
1973
1974
1976
1979
i Qfin
1981
Esti
mated
monthly
aver
ag
e
to Paulina Cr
eek
[Based on
measurements by th
e Oregon Department
and
the
U.S.
Forest Se
rvic
e (1975-1981).
See
mated
aver
ages
]
Jan.
Feb.
Mar.
Apr.
May
June
July
Aug.
11 L.f,
49
21
22
20
16
15
34
32
38
11
11Z J
f.J
34
10
13
34
35
36
24
_ _
_ _
_ _
10
An
in
11
Z7
'tU
JU
ZZ
1A
1 1
_________
___
___
^Q
I -J
11
1 A
11
11
~~
ZZ
J.H
1J
iJ
30
30
21
24
14
e\ £
e\f\
i r
26
20
16
11
22
22
15
16
20
30
25
22
21
17
of Fi
sh and
Wild
life
(1
967-
197^
text fo
r ex
planation
of es
ti-
Sept.
Oct.
No
v.
Dec.
15
25
15
22
Q
I Q
O
J. O
16
20?
15
12
4 30
?
11
11
1A ?
15
15
15
Uf\
3
14
5 2
Anni
15
10
10
15
11

oPhillips (1968) estimated the annual discharge as 20 ft /s on the basis
of seven measurements made in summer months between 1903 and 1962. His distri
bution of monthly averages is similar to that in table 3. Personnel of the U.S.
Forest Service and the Oregon Department of Fish and Wildlife who are familiar3 with the area agree that the annual figure probably is close to 20 ft /s,
3 with a probable lower limit of 18 ft /s (J. E. Vaughn and Robert Pennington,
personal commun., 1982).
Evaporation from Lake Surfaces
Evaporation from lake surfaces in the caldera has not been directly meas
ured. Evaporation from nearby lakes at altitudes of about 4,000 feet was esti
mated to be 33 inches annually (Farnsworth and others, 1982). As the lakes at
Newberry are at altitudes greater than 6,300 feet, they probably have lower
evaporation rates, primarily because of cooler temperatures and greater humidity
due to increased precipitation. Phillips (1968) estimated an annual evaporation
rate of 28 inches partly on the basis of a comparison with Crater Lake, Odell
Lake, Wickiup Dam, and Davis Lake, and partly by means of an adjustment for
altitude to a rate of 34 inches determined by Kohler and others (1959) for lakes
elsewhere in the western United States.
During July, August, and September, 1981, measurements of windspeed and
direction, temperature, and relative humidity were made at each lake in order
to estimate evaporation by means of a quasi-empirical mass-transfer expression
(Harbeck, 1962):
E = Nuz (eQ - ea ), (3)
where E * evaporation from lake surface, inches per day (in/d),
N = Mass-transfer coefficient, constant for a specific
lake (dimensionless),
u * windspeed at some height z above the water surface, z
miles per hour (mi/hr),
e = saturation vapor pressure in millibars (mb) calculated
from temperature of the water surface, and
e = vapor pressure of the incoming air mass (mb).Cft
Ideally N is calibrated by an energy budget sLudy over a period of one or more
years. If this is not possible, Harbeck suggests using the empirical
relationship
13
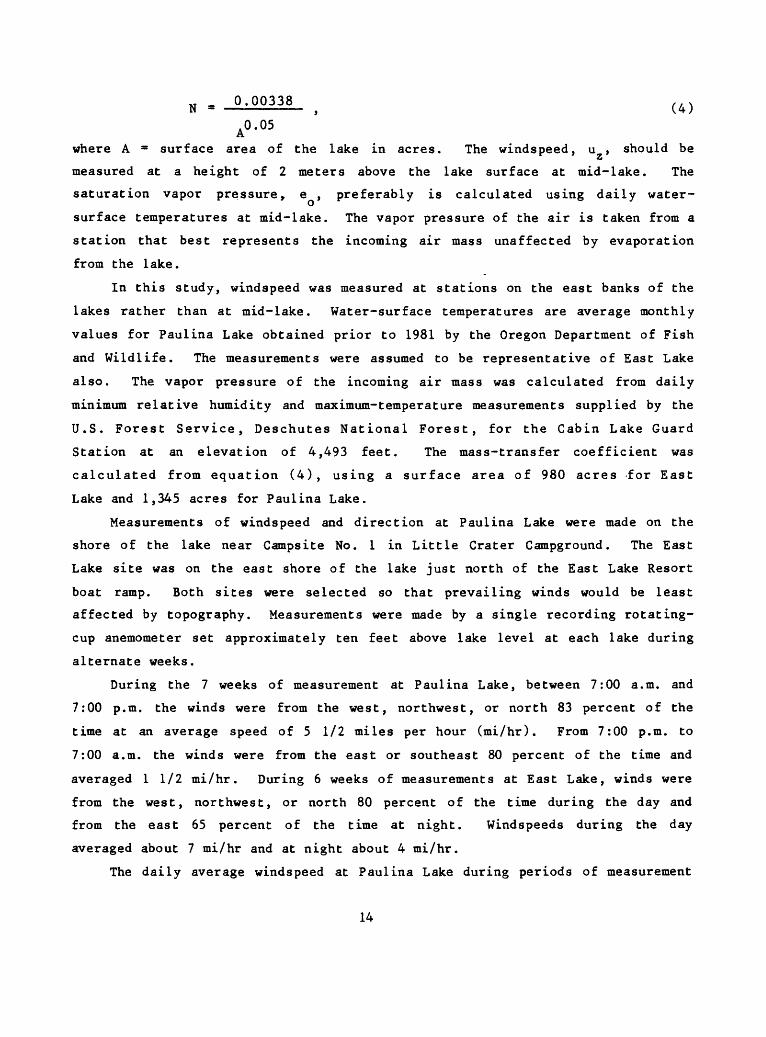
N = °- 00338 , (4)
A0 ' 05
where A - surface area of the lake in acres. The windspeed, u , should bezmeasured at a height of 2 meters above the lake surface at mid-lake. The
saturation vapor pressure, e , preferably is calculated using daily water-
surface temperatures at mid-lake. The vapor pressure of the air is taken from a
station that best represents the incoming air mass unaffected by evaporation
from the lake.
In this study, windspeed was measured at stations on the east banks of the
lakes rather than at mid-lake. Water-surface temperatures are average monthly
values for Paulina Lake obtained prior to 1981 by the Oregon Department of Fish
and Wildlife. The measurements were assumed to be representative of East Lake
also. The vapor pressure of the incoming air mass was calculated from daily
minimum relative humidity and maximum-temperature measurements supplied by the
U.S. Forest Service, Deschutes National Forest, for the Cabin Lake Guard
Station at an elevation of 4,493 feet. The mass-transfer coefficient was
calculated from equation (4), using a surface area of 980 acres for East
Lake and 1,345 acres for Paulina Lake.
Measurements of windspeed and direction at Paulina Lake were made on the
shore of the lake near Campsite No. 1 in Little Crater Campground. The East
Lake site was on the east shore of the lake just north of the East Lake Resort
boat ramp. Both sites were selected so that prevailing winds would be least
affected by topography. Measurements were made by a single recording rotating-
cup anemometer set approximately ten feet above lake level at each lake during
alternate weeks.
During the 7 weeks of measurement at Paulina Lake, between 7:00 a.m. and
7:00 p.m. the winds were from the west, northwest, or north 83 percent of the
time at an average speed of 5 1/2 miles per hour (mi/hr). From 7:00 p.m. to
7:00 a.m. the winds were from the east or southeast 80 percent of the time and
averaged 1 1/2 mi/hr. During 6 weeks of measurements at East Lake, winds were
from the west, northwest, or north 80 percent of the time during the day and
from the east 65 percent of the time at night. Windspeeds during the day
averaged about 7 mi/hr and at night about 4 mi/hr.
The daily average windspeed at Paulina Lake during periods of measurement
14
was 3.9 mi/hr and at East Lake was 5.6 mi/hr. The ratio of these values, 0.70,
was used to estimate average windspeed at each lake for weeks in which measure
ments were not obtained.
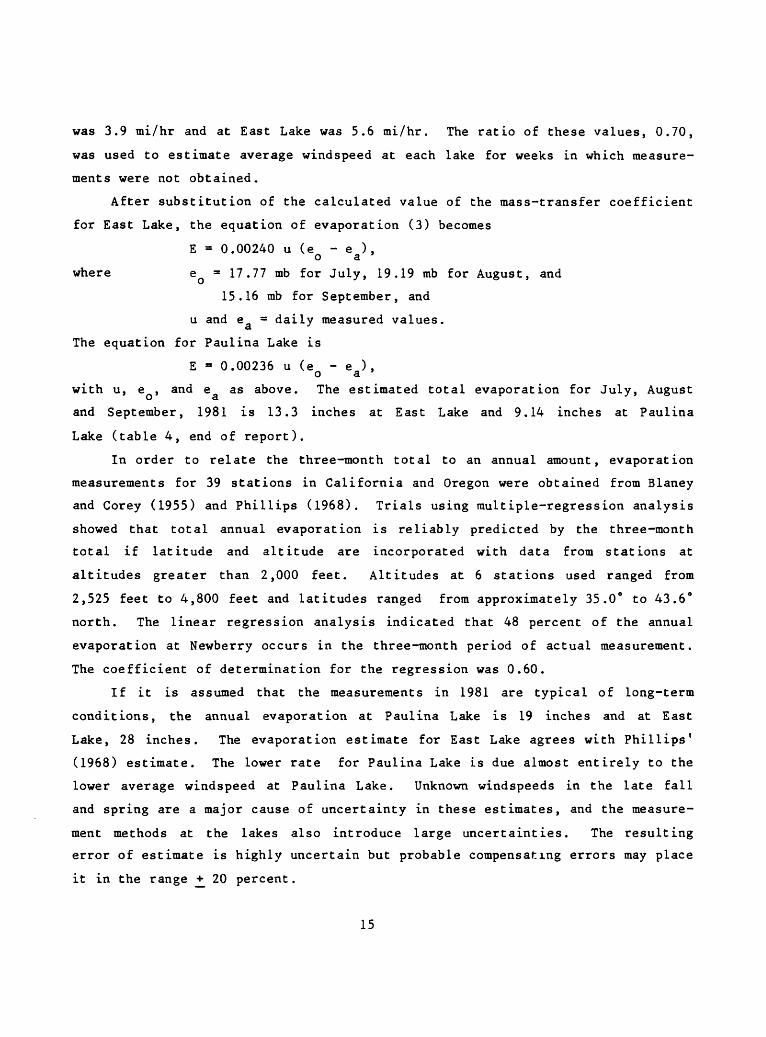
After substitution of the calculated value of the mass-transfer coefficient
for East Lake, the equation of evaporation (3) becomes
E = 0.00240 u (e - e ), o a 'where eQ = 17.77 mb for July, 19.19 mb for August, and
15.16 mb for September, and
u and e = daily measured values.
The equation for Paulina Lake is
E = 0.00236 u (e - e ),O 3.
with u, e , and e as above. The estimated total evaporation for July, AugustO 3.
and September, 1981 is 13.3 inches at East Lake and 9.14 inches at Paulina
Lake (table 4, end of report).
In order to relate the three-month total to an annual amount, evaporation
measurements for 39 stations in California and Oregon were obtained from Blaney
and Corey (1955) and Phillips (1968). Trials using multiple-regression analysis
showed that total annual evaporation is reliably predicted by the three-month
total if latitude and altitude are incorporated with data from stations at
altitudes greater than 2,000 feet. Altitudes at 6 stations used ranged from
2,525 feet to 4,800 feet and latitudes ranged from approximately 35.0° to 43.6°
north. The linear regression analysis indicated that 48 percent of the annual
evaporation at Newberry occurs in the three-month period of actual measurement.
The coefficient of determination for the regression was 0.60.
If it is assumed that the measurements in 1981 are typical of long-term
conditions, the annual evaporation at Paulina Lake is 19 inches and at East
Lake, 28 inches. The evaporation estimate for East Lake agrees with Phillips 1
(1968) estimate. The lower rate for Paulina Lake is due almost entirely to the
lower average windspeed at Paulina Lake. Unknown windspeeds in the late fall
and spring are a major cause of uncertainty in these estimates, and the measure
ment methods at the lakes also introduce large uncertainties. The resulting
error of estimate is highly uncertain but probable compensating errors may place
it in the range +_ 20 percent.
15

Evapotransplration
Evapotranspiration in the caldera was estimated J. E. Vaughn, U.S. Forest
Service, on the basis of potential evaporation (PET) calculated by means of
the equation (Hamon, 1961):
PET - 0.195 D P , (5)
where PET a potential evaporation (inches/month),
D = possible hours of daylight in units of 30 12-hour
days, and3 P = saturated absolute humidity (gm/m ) at the mean
monthly temperature.
Estimated annual PET is 13.6 inches (table 5). The actual evapotranspira-
tion (AET) will be less than PET at any time during the year when adequate soil
moisture is not available. The monthly soil-moisture balance calculated for the
caldera (table 6) indicates that an average deficit of 0.06 inches occurs during
August and 0.39 inches during September. Consequently, the annual evapotrans-
piration is estimated to be 13.1 inches.
Equation 5 is likely to underestimate evapotranspiration under the condi
tions that prevail at Newberry (Donald R. Satterlund, Washington State Uni
versity, personal commun., 1982). Because of consistently high wind speeds in
the caldera, evapotranspiration during summer months could be as much as 3
inches more than the estimate in table 6, and the budget term for evapotrans-
piration in table 8 may be low, therefore, by as much as 2,000 acre-feet.
Budget Calculation
In calculating the hydrologic budget, the value for precipitation was
applied to the total caldera area and the evapotranspiration rate was applied
only to the vegetated area (table 7). For the area without vegetation, all
precipitation is assumed to result in recharge to shallow ground water. The
calculations of the budget equation are shown in table 8 for each topographic
basin and the total caldera. The apparent residual, 6,500 acre-feet annually
for the caldera, is 20 percent of the total precipitation.
If the probable positive errors listed in table 8 were all additive,
about 12,000 acre-feet of water would be available for seepage to the deep
16

Table 5. Calculation of potential evapotranspiration at
Newberry caldera using th
e Ha
tnon
equation
(Ham
on,
1961)
[Calculated by J. E. Vaughn, Silviculturist, Deschutes National Forest.
P =
saturated absolute
humidity, in
grams per
cubi
c meter; D
= possible hours of
da
ylig
ht;
PET =
potential evapo
transpiration]
Jan.
Feb.
Mar.
Ap
r.
May
June
July
Aug.
Sept.
Oct.
Nov.
Dec.
Total
i *
Temperature, (°
C) -10.3
-6.6
-6.6
-1.6
+2.5
+5.4
+10.6
+9.5
+6
.9
0.8
-3.3
-6.7
P (gm/m3
) 2.
13
2.85
2.
86
4.30
5.72
6.
91
9.71
9.12
7.62
5.
10
3.71
2.81
D (1
=
30 12-hour
.81
.82
1.02
1.13
1.27
1.29
1.30
1.
20
1.04
.95
.80
.76
days
of
daylight)
PET
(inches)
.34
.46
.57
.95
1.42
1.74
2.46
2.
13
1.55
.94
.58
.42
13.5
6

00
Tabl
e 6. Calculation of so
il-m
oist
ure
balance
at Newberry ca
lder
a
[ For
coar
se so
il with assumed
maximum av
aila
ble
soil
moisture of
6
inches.
Calculated
by J. E. Vaughn,
Silv
icul
turi
st,
Deschutes
National Forest]
Jan.
Feb
. M
ar.
Ap
r.
May
Ju
ne
July
A
ug.
Pre
cip
itati
on
(inches)
- 6
.03
5
.20
4.2
4
2.2
7
2.2
3
1.1
8
0.2
4
0.2
1
PET
(inches)
- .3
4
.46
.5
7 .9
5 1.4
2
1.7
4
2.4
6
2.1
3
AET
(i
nches)
-/
.34
.46
.57
.95
1.4
2
1.7
4
2.4
6
2.0
7
Cha
nge
in so
ilm
ois
ture
(i
nches)
0
0 0
0 0
-.5
6-2.2
2-1.8
6
Soil
m
ois
ture
(in
ch
es)
6.0
0
6.0
0
6.0
0
6.0
0
6.0
0
5.4
4
3.2
2
1.3
6
Defi
cit
(i
nches)
0000000
.06
Runoff
(i
nch
es)
- 5
.69
4
.74
3.6
7
1.3
2
.81
0 0
0
Sep
t.
Oct
. N
ov.
Dec
. Y
ear
0.5
8
1.1
7
5.5
0
6.2
2
35.0
7
1.5
5
.94
.58
.42
13.5
6
1.1
6
.94
.58
.42
13.1
1
-.58
.23
4.9
2
.07
.78
1.0
1
5.9
3
6.0
0
.39
0 00
.45
00
0
5.7
3
21.9
6
Esti
mate
s by
U. S.
Fo
rest
Se
rvic
e ba
sed
on re
cord
s at 6 nearby we
athe
r st
atio
ns.
2/
Potential
evap
otra
nspi
rati
on from ta
ble
5.
3/
Esti
mate
d ac
tual
ev
apot
rans
pira
tion
.
4/
Wate
r av
aila
ble
for
grou
nd-w
ater
re
char
ge.

Table 7. Areas used in calculating the hydrologic budget
Area used
Total
Vegetated
Nonvegetated
Lake surface
Paulina Lake topographic
basin (acres)
6,368
4,108
915
1,345
East Lake topographic
basin (acres)
4,482
3,197
305
980
Total caldera (acres)
10,850
7,305
1,220
2,325
ground-water system. The summing of negative probable errors results in a
negative seepage term and implies that there is an annual decrease of about
1,700 acre-feet of water in the lakes and the shallow ground-water system.
The thorough study by Phillips (1968) of levels of East Lake during the
last 130 years shows rather conclusively that, although the lake has been at
least 7 feet higher than at present during two abnormally wet periods, its mean
level probably has not changed significantly in historic times. We assume,
therefore, that the entire caldera is in a state of hydrologic balance, and that
the long-term hydrologic budget must have at worst a zero net loss to deep
ground water percolation.
The apparent imbalance between the two basins probably is real, although it
could be greater or smaller than the estimated one. If probable errors in
estimates of evapotranspiration and the outflow to Paulina Creek are considered,
it is likely that the Paulina Lake sub-basin has an annual deficit even if
precipitation is 15 percent greater than the estimate. This deficit is pre
sumably made up by ground-water inflow from the East Lake sub-basin, where there
would be a surplus of water under almost any reasonable assumptions about
probable errors in its budget. Westward movement of surplus ground water is
virtually assured by the hydraulic gradient of at least 45 feet per mile between
the two basins.
19
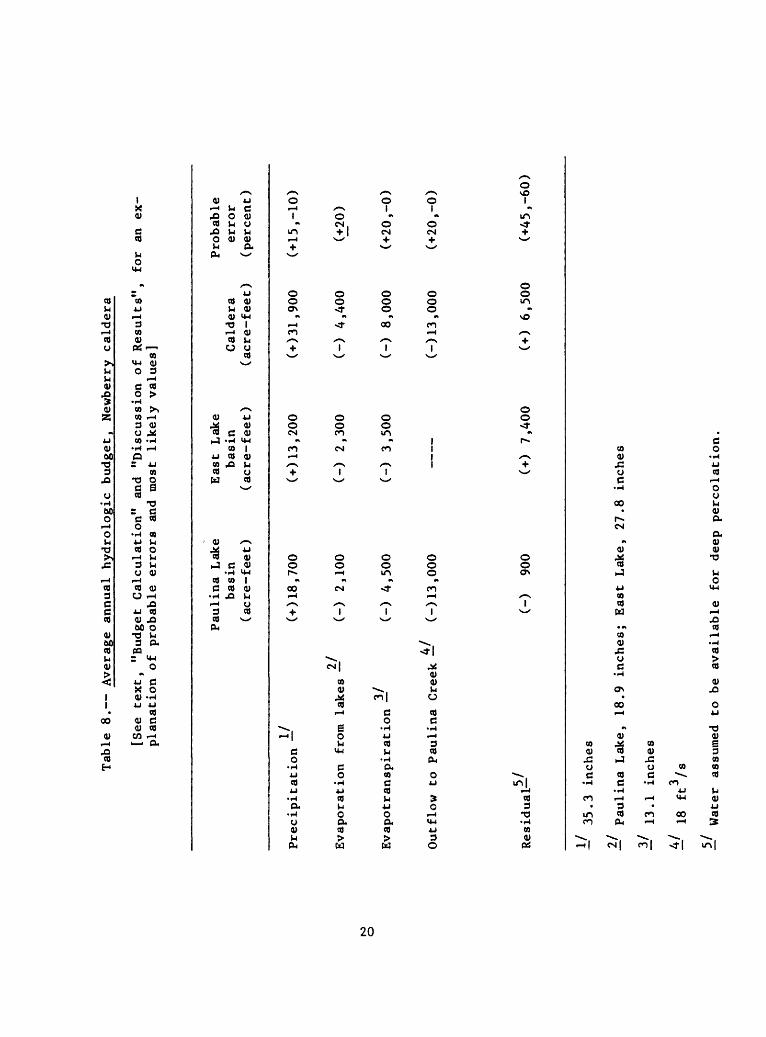
Tabl
e 8. Av
erag
e an
nual hy
drol
ogic
budget,
Newberry caldera
[See te
xt,
"Bud
get
Calculation" and
"Dis
cuss
ion
of Re
sult
s",
for
an ex
planation
of probable errors and
most
li
kely
va
lues
]
to o
Paulina
Lake
basi
n (acre-feet)
East Lake
Probable
basi
n Caldera
erro
r(a
cre-
feet
) (acre-feet)
(percent)
Precipitation
(+)18,700
2/Evaporation from lakes
(-)
2,10
0
3/
Evapotranspiration
(-)
4,5
00
Outflow to
Pa
ulin
a Cr
eek
(-)1
3,00
0
(I-)
13,
200
(-)
3,5
00
(+)3
1,90
0 (+
15,-
10)
(-)
2,3
00
(-
) 4,4
00
(
20
)
(-)
8,0
00
(-
1-20
,-0)
(-)1
3,00
0 (-1-20,-0)
Residual
(-)
900
(+)
7,40
0(+
) 6,
500
(+45,-60)
35.3 in
ches
2/ Paulina
Lake
, 18
.9 in
ches
; Ea
st Lake,
27.8
in
ches
/ 13
.1 in
ches
i' 18 ft3/8
Wa
ter
assumed
to be
available
for
deep pe
rcol
atio
n.

During its residence and movement, a fraction of the ground water infil
trates the volcanic rocks beneath the surficial deposits and is removed from
the shallow hydrologic system. Infiltration rates for the rhyolitic rocks in
the caldera are probably high; those for the tuffaceous rocks may be low. A
rate of 0.3 foot per year probably is a reasonable minimum value for the
caldera, and this results in a lowest probable seepage estimate of about 2,500
acre-feet. This amount is about 10 percent of the annual precipitation on land
surfaces.
An estimate of the highest probable value of the seepage term was calcu
lated by assuming 15 percent greater precipitation, 20 percent less lake
evaporation, 10 percent greater evapotranspiration, and 10 percent greater
stream flow. The probable maximum amount of water available for deep percola
tion on this basis is about 10,000 acre-feet. (See below, "Discussion of
Results", for a downward revision of this preliminary figure.)
21
CHEMISTRY OF SURFACE AND GROUND WATER
Major Ionic Constituents
Eleven of 22 wells in the caldera (table 9, end of report), three springs
and gas vents (table 10, end of report), and the two lakes were sampled for
chemical analysis. The results of the chemical analyses are shown in table 11.
The identifying sequence numbers given in tables 9, 10, and 11 are used in the
remainder of the report to refer either to the chemical analysis or to the well
or spring from which the sample came.
Total concentrations of dissolved solids in the waters sampled range from
79 to 907 milligrams per liter (mg/L). Predictably, warm waters from wells and
springs contain the higher concentrations. The lake waters are intermediate in
concentration between these waters and the more dilute cold ground waters.
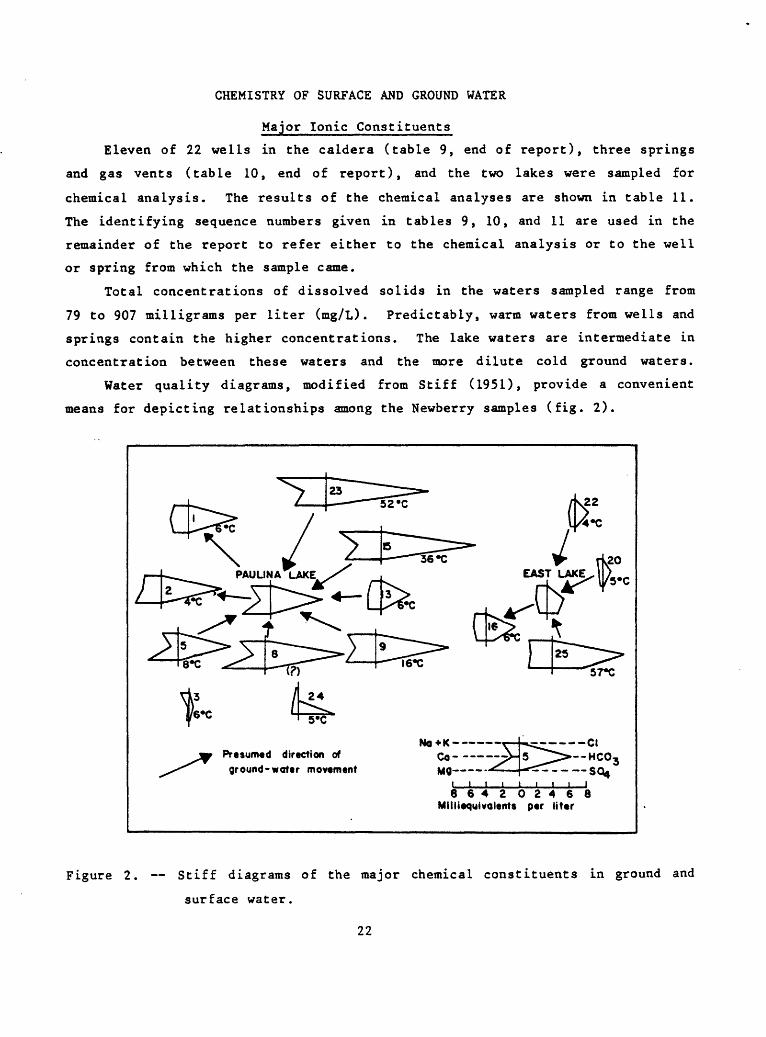
Water quality diagrams, modified from Stiff (1951), provide a convenient
means for depicting relationships among the Newberry samples (fig. 2).
57-C
Presumed direction of ground-voter movement
HCO,-so*
864202468 Milliequivolents per liter
Figure 2. Stiff diagrams of the major chemical constituents in ground and
surface water.
22

Tabl
e 11. Chemical analyaea of ground and
surf
ace
water
[Con
cent
rati
ons
in
Sequence./
Owner/
Number
name
Temp.
CO
1 2 3 5
N> to .
8 9 13 15 16 20
Paul
ina
Lakt
Reso
rt
Paul
ina
Lake
Reso
rt
Paul
ina
Guar
dSt
atio
n (U
SFS)
Mike
Ma
thew
s(summer
home
)
Jack
Ho
gg(summer
home)
Little Crater
Picnic Area
Little Crater
Camp
Site 27
Little Crater
Camp
Site 49
East Lake
Campground we
ll
Cinder Hill
5 6.7
4 6 8 16 6 33 35.5
36 6 5
mill
igra
ms
CaMg
per
liter
NaK
unle
ss ot
herw
ise
HC03
SOCl
indi
cate
d.
F Si02
/ig/L - micrograas per
liter; po
tto/
cm -
micromhoa
As sB
Fe
Li
Mn
/.._y«\
x
Dis
so
lved
, y
oli
da^'
35 39 44
3.3
18 30 42 28 59 54 56 33 7.1
24 35 39' 2.6
41 65 44 17 57 48 51 15 1.9
28 38 44 6 41 68 64 25 97 83 96 26 11
6.1
7.7
6.4
.5 1.
8
5.0
7.4
8.3
2.6
12 10 12 6.0
1.3
315
398
450 27 376
585
535
215
690
679
691
200 56
5.0
1.9
6.0
5.0
2 5.0
5.0
5.0
5.0
<12.
5
43
5.0
2.8
2.7
3.1 .2
2.6
5.2
4.6
1.7
6.8
5.1
4.5
2.8
2.5
0.3 .4 .5 .7 __
.8 .7 .3 .5 .6 .5 .2 .4
29 33 36 46 90 110 90 46 156
161
140 40 30
1 2 24 3 _ _ 39 32 16 <1 2 1 5
460
120
700
180
780
6700
20
23
__
__
1500
<1
0
1600
180
570
43
1800
36
025
00 4
000
1000
5000
210
19
10
27
13
11 1500
88 2300
17
<1
__
120
2
100
30i
29
10
140
270
120
250
35
0
9 3
8 5
286
356
410 79 .._
581
532
232
733
702
709
265 87
Spec
ific
cond
. pH
(j
onho
/cm)
400
565
600 65 '
^70
05/
900
710
360
900
900
880
390
110
6.95
6.9
7.15
6.65
) 6.97
6.15
6.80
7.10
6.21
6.46
6.3
6.80
6.70
per
cent
imet
er]
Date
am-
, 3/
pled
So
urce
10/0
7/81
10/2
7/74
10/0
7/81
09/0
6/81
06/3
0/82
09/0
6/81
10/0
7/81
10/0
7/81
09/0
6/81
08/ /75
10/17/74
09/0
6/81
09/0
6/81
A B A A B A
'
A A A C E A ACa
mpgr
ound
well

Tabl
e 11. Chemical analyses of
ground an
d su
rfac
e wa
ter
(Con
tinu
ed)
N5
[Concentrations
in
Sequence.<
Owner/
Number
name
Temp.
CO
22 23 24 25 tmmit
*» »
Cinder Hi
llCa
mp Site 34
Paul
ina
Hot
Spri
ngs
Lost
Lake
gas
vent
East
La
keHo
t Spri
ngs
4/
Paul
ina La
ke-
East
La
ke
4 .
50 52 5
49 55 57 _ _6 __ 10
mill
igra
ms pe
r li
ter
Ca 14 56 51 50 13 70 77 73 26 28 27 26 25
Mg 7
60 43 42
8 34 39 33 39 38 13 10 11
Na
.2
6
140
120
110
.2
7
53 59 56 47 47 27 23 24
K
.3 3.
5
17 16 13
.9 1.
1
9.7
9.7
5.2
5.0
4.5
3.7
3.7
unle
ss otherwise
HC03 88 856
699
689 0
547
581
413
352
402
120
125
123
-, 5.0
<! 4.0
2
200 28 20 120 3.
84 64 59 64
Cl <.l
6.0
4.7
5.0
1.1 .7
1.3
1.3
2.8
2.4 .3 .2 <l
indicated.
/Jg/L
" micrograms pe
r li
ter;
/jmho/cm
micromhos
F
.1 .6 .5
0.0 .2 .1 .6 .2 .1 __
SiO,
As
4
>
34
<1
205
19
0 16
184
31
1
199
120
1197
46
10 13
8.8
B 10
870
840 180
1100 260 _ 640 "
Pe
Li
Mn-(
yg/L
) <
120
<4
57
22
090
1700
1500
0
450
660
40
900
500
1400
__ __
__
20
Dis
solv
ed./
so
lids
^'
113
907
776 658
614 366 _..
206
197 __
Spec
ific
cond
. pH
(|ntho/cm)
140 960
400
767
840 566 334
323
7.20
6.82
6.9
7.26
3.4
6.42
6.7
6.10
8.8
8.38
7.8
8.1
8.07
per
cent
imet
er]
Date
sam-
.
. pl
ed
Sour
ce
10/06/81
07/00/77
10/2
6/74
06/3
0/82
10/2
7/74
08/00/75
10/2
6/74
06/30/82
09/1
0/60
06/30/82
00/0
0/73
09/1
1/60
06/30/82
A C B E B C B E D E E D E
Sequence No
. Identifying
number used in ta
bles
and
illu
stra
tion
s.
?/ '
Esti
mate
d by summation
of HCO. x
0.49
17 an
d other
ions li
sted
(Hem,
1970
).
1/
Source of da
ta or
collector
(USG
S):
A:
R. W.
Cr
aig;
B:
N. B.
Vo
egtl
y;
C: R. H. .Ma
rine
r, and
others (1
980)
; D:
K. N.
Ph
ilip
s (1
968)
; E:
R. H.
Ma
rine
r (u
npub
. data,
1981,
1982
).
!L'
sample (6/30/82)
obtained at a depth of
45
feet near th
e center of th
e lake.
I/
Estimated.

The diagrams are arranged in a pattern roughly corresponding to the locations of
wells and springs in relation to the two lakes. Waters with similar chemical
compositions have similar shapes, and the arrows connecting the diagrams indi
cate presumed flow relationships in the shallow hydrologic system.
As shown in the sketch map, figure 1, the wells in Newberry caldera are
clustered near the two lakes. The diagrams in figure 2 show that each lake water
is similar to adjacent ground water and that most samples obtained in the
Paulina Lake topographic sub-basin differ in character from waters in the East
Lake sub-basin. In ground waters sampled near Paulina Lake, dissolved sodium,
magnesium, and bicarbonate predominate. Concentrations of chloride and sulfate
are low and silica concentrations range from 29 mg/L in cold well water (No. 1)
to 205 mg/L in the Paulina Hot Spring (No. 23) (table 11).
In contrast to most samples from the western half of the caldera, samples
from the East Lake sub-basin are characterized as calcium bicarbonate waters.
Total concentrations of dissolved solids are lower than those in the western
sub-basin. Chloride concentrations also are lower, and even the hot-spring
water (No. 25) has a lower chloride concentration than most cold waters in the
Paulina Lake area. Silica concentrations in the eastern ground waters have a
range similar to that in the western waters (30 to 197 mg/L), but sulfate
concentrations in East Lake, the East Lake hot springs, and a cold well (No. 16)
are significantly higher than any concentrations in the Paulina Lake area.
Silica concentrations in both lakes are unusually low in relation to other con
stituents, probably as the result of diatom scavenging.
East Lake itself probably is a definitive indicator of the ground-water
character in its sub-basin because it has no surface outlet and it acts as a
sink for ground-water flow from a large proportion of the sub-basin. Relying on
East Lake as an indicator, therefore, we conclude that most ground water in the
eastern part of the caldera is more dilute than ground waters in the western
part. In East Lake itself, it might be expected that the higher evaporation
rate relative to Paulina Lake would lead to greater concentrations of dissolved
solids. The observed lower concentrations in East Lake probably result from
dilute ground water inflow that effectively balances the ground-water outflow
plus evaporation. This conclusion is discussed further in the final section of
this report.
25

Relations among major ions indicate that the water in East Lake could be
produced by mixing ground water similar to that in samples 20 or 22 with thermal
water similar to that in sample 25 (East Lake Hot Spring). The mixing ratios
range from 2.3 to about 9 to 1, depending on the sample and the ions used in the
mixing calculation. The relatively high chloride concentration in sample 20
does not fit this mixing model, however, and suggests that the hot-spring water
might be produced by mixing the ground water of sample 20 with lake water in a
ratio of 1.25 to 1. Evidence from isotope analyses, discussed below, casts
doubt on both of these simple mixing models, however, and further discussion of
the origin of the waters is deferred to the following section of this report.
Subsurface discharge may occur from both lakes. Evidence for subsurface
discharge from East Lake occurs in well 16, where both the water chemistry and
the water level suggest that ground water moves from the lake to this location.
In the Paulina Lake sub-basin, the chemistry of samples 1 and 2 show that these
well waters probably originate in the lake and are slightly altered by residence
in lake-shore sediments. Water levels in these wells are at least 5 feet below
lake levels, whereas levels on the north, south, and east shores of the lake
appear to be higher than lake levels.
Thermal water occurs in at least two wells in the Paulina Lake area.
Concentrations of both chloride and silica in samples 9 and 15 are greater than
those in other waters and the temperatures are higher. The temperature in
well 8 is unknown, but the concentrations of silica and chloride, as well as the
total concentration of dissolved solids, suggest a thermal component in this
water also. These three waters have compositions similar to that of the Paulina
Hot Spring water, possibly indicating that thermal waters occur widely near the
center of the caldera and perhaps beneath the lake. Measurements of temperature
in Paulina Lake, described in the next chapter, delineate several areas where
thermal waters probably enter through the lake bottom.
In the East Lake sub-basin, thermal water is known to discharge only in the
East Lake Hot Springs, although temperature measurements in the lake suggest
that small amounts of thermal discharge also occur elsewhere. The East Lake
Hot Spring water is similar to the Paulina Hot Spring water in many respects,
but has higher concentrations of calcium and sulfate. The higher sulfate
26

concentrations are probably caused by oxidation of hydrogen sulfide gas dis
solved in the ground water. The gas was not detected in the Paulina Hot Springs
(R. H. Mariner, USGS, unpublished data 1982), and sulfate concentrations
in the Paulina Lake sub-basin waters are uniformly low.
The apparent causal relationship between hydrogen sulfide gas and dissolved
sulfate in the ground water is supported by the analysis of water from the
Obsidian Flow gas vent (sample 24). The water is extremely dilute, but has the
highest concentration of sulfate known in- the caldera (table 11). The concen
tration of hydrogen sulfide in gas from this vent also 'is the highest measured
in the caldera (R. H. Mariner, USGS, unpublished data 1982).
Graphs of conservative constituents that are not related as dissociation
pairs may be useful as indicators of origins and mixing trends among ground
waters. (See, for example, Sammel, 1980; Sammel and Craig, 1981.) Figure 3a
shows the relations between chloride and silica in the waters of the caldera.
These constituents are expected to reflect, more or less independently, the
effects of water-rock interactions and exposure to heat in a geothermal en
vironment as well as the degree of mixing of differing waters.
7
6
J^ K^j
f 8.4e §
*=2
illu
o
-
8."* . 9_
2' *«'6 Poulino .5 20 Lake
e24 *"3
East Lake -? 3
15.
-
23 '^^
_
25« -
1 I II I
Silica concentration, in milligrams per liter
Figure 3a. Relations between concentrations of selected chemical
constituents: chloride versus silica.
Several possible trend lines are suggested by the data of figure 3a.
One such trend includes samples 9 and 15 from wells near Paulina Lake, together
with samples 1 and 2 from cold wells near the lake, and sample 8, a water
of unknown temperature which probably has a thermal component. However, two
other ground waters near the lake, 13 and 5, have chloride concentrations that
27

place them below the upper trend line, and the hot-spring water (23) has less
chloride than the low-temperature waters, 8, 9, and 15. The chloride concen
tration in East Lake Hot Spring (25) is exceptionally low but is in keeping with
that of well 22 near East Lake and with East Lake itself. Two cold waters near
East Lake, 16 and 20, have higher chloride concentrations than the East Lake Hot
Springs. The chloride-silica relations, therefore, do not consistently dis
tinguish thermal waters from nonthermal waters. The small number of samples,
the extremely small range of chloride concentrations, and differing times of
sampling contribute to uncertainties in the data that may be as great as the
differences between most of the samples.
12
10-
o£4
Concentration* in millltqulvaltflts p«r littr
23
PouKno Ldka
JEast Lok«
2 4 6 8 10 Total major ton*. te«9 HCOj
12
Figure 3b. Relations between concentrations of selected chemical
constituents: bicarbonate versus total major ions
less bicarbonate.
Graphs of relations among other ionic species indicate that both thermal
and nonthermal waters equilibrated in a low-temperature environment dominated by
CO^-HCO- reactions. One such graph is shown in figure 3b, where concentra
tions of bicarbonate, the dominant an ion, are plotted versus the sum of con
centrations of other major ionic species. The values occur in a nearly constant
28
ratio through the range of total dissolved-solids concentrations. Departures
from the linear trend occur only in well 16 and the Obsidian Flow gas vent (24),
both of which have exceptional high sulfate concentrations, and in the two
lakes, where carbonate reations probably differ from those in ground water.
Ground waters in the caldera showed similar linear trends for all major ions
except sulfate, thereby reinforcing the concept of a generally uniform chemical
environment in which sulfate concentrations are controlled by an anomalous
factor, presumably the contact with hydrogen sulfide gas.
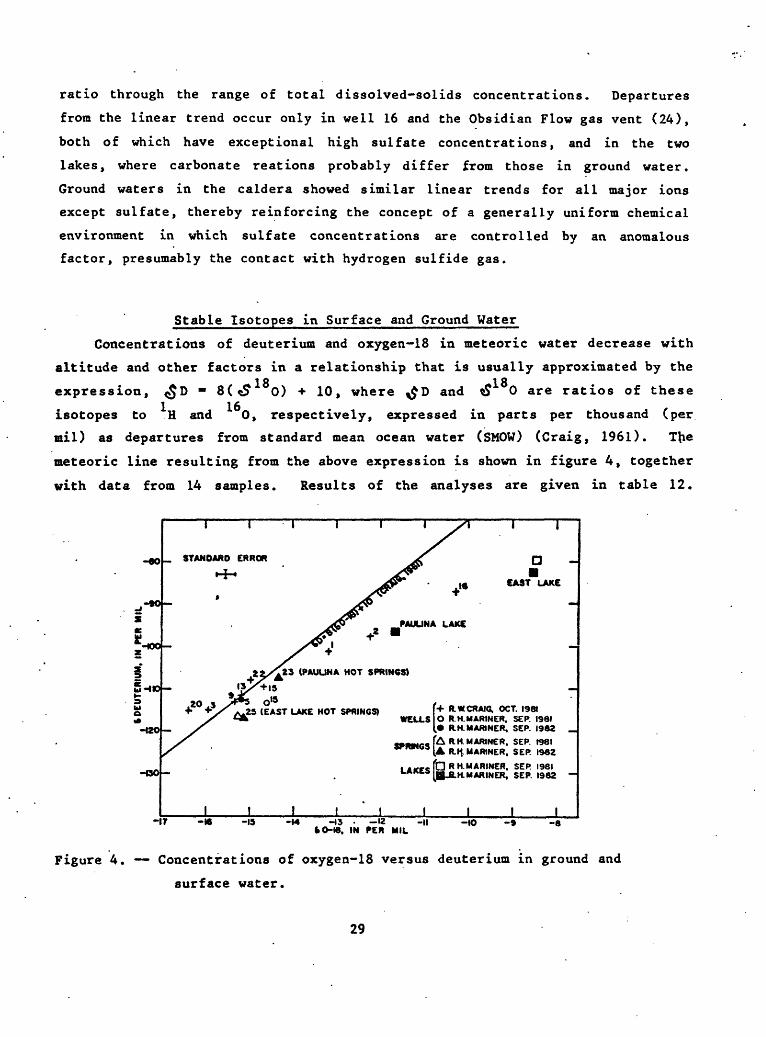
Stable Isotopes in Surface and Ground Water
Concentrations of deuterium and oxygen-18 in meteoric water decrease with
altitude and other factors in a relationship that is usually approximated by the18 18 expression, ^D « 8(<£ 0) * 10, where ^D and £ 0 are ratios of these
isotopes to H and 0, respectively, expressed in parts per thousand (per
mil) as departures from standard mean ocean water (SHOW) (Craig, 1961). The
meteoric line resulting from the above expression is shown in figure 4, together
with data from 14 samples. Results of the analyses are given in table 12.
-60
-OO-
STANOARO ERROR
H-
PAUUNA LAKE
I I
a
CAST LAKE
(PAUUNA HOT SPRINGS)
25 (EAST LAKE HOT SPRINGS) [+ RW CRAIG. OCT. 1981 WELLS IO RH. MARINER, SEP. 1991
(9 RH. MARINER, SEP. 1982
fARH. MARINER, SEP. 1981 ^ R^ MARINER, SEP. I9«2
LAKES RH.MARINER, SEP. 1981 H.MARINER, SEP. 1982
-IT -16 -15 H3 12 -II tOH8. IN PER MIL
-IO -8
Figure 4. Concentrations of oxygen-18 versus deuterium in ground and
surface water.
29

Table 12. Concentrations of the isotopes oxygen-18 and deuterium in ground
and surface water
[Concentrations of oxygen-18 and deuterium in parts per thousand as departures from standard mean ocean water (Craig, 1961)]
Sequence Name/
No. owner
1
2
3
5
9
13
15
16
20
22
23
25
Paulina Lake Resort
Paulina Lake Resort
Paulina Guard Station (USFS)
Mike Ma thews (summer home)
Little Crater picnic Area
Little Crater Camp Site 27
Little Crater Camp Site 49
East Lake Campground well
Cinder Hill campground well
Cinder Hill Camp Site 34
Paulina Lake Hot Springs
East Lake Hot Springs
Paulina Lake
East Lake
Date
sampled
10/07/81
10/07/81
10/07/81
06/30/82
10/07/81
10/07/81
10/07/81 08/00/75
10/07/81
10/06/81
10/06/81
06/30/82 07/00/77
06/30/82 08/00/75
06/30/82
06/30/82 00/00/73
Oxygen- 18
0+ 0.2)
-13.20
-12.25
-15.95
-15.18
-15.35
-15.20
-14.70 -14.60
-10.30
-16.40
-15.00
-14.33
-15.12 -15.26
-11.68
- 8.54 - 8.44
Deuterium
<± 1}
-101.0
- 97.5
-115.0
-112.7
-113.0
-111.5
-109.5 -113.4
- 87.0
-115.0
-108.0
-107.3 -108.9
-116.9 -116.4
- 96.8
- 82.8 - 79.7
Temper ature
CO
5
4
6
2
16
6
33 35.5
6
5
4
52
57 49
6
10
21 Source
A
A
A
C
A
A
A B
A
A
A
C B
C C
C
C C
Sequence number. Identifying number used in tables and illustrations.
2/ Source of data or collector: A: R. W. Craig (1981); B: R. H. Mariner andothers (1980); C: R. H. Mariner (unpub. data, 1982).
30

The isotope results generally reinforce the relationships shown by the
major-ion chemistry, but show additionally that both oxygen-18 and deuterium
are concentrated in the two lakes as the expected result of surface evapora
tion. A line constructed through the Paulina Lake and East Lake sample points
in figure 4 probably would represent this evaporative trend. Evaporation under
low-temperature, nonequilibrium conditions should result in a trend with a slope
of about 5 (Craig, 1961). The slope of the East Lake - Paulina Lake line is
4.6, which is reasonably close in view of the standard errors of estimate shown
in figure 4.
The position of sample 16, a well water from the East Lake Campground,
suggests that the sample contains a large proportion of evaporated water from
East Lake. Similarly, samples 1 and 2 appear to have large proportions of
Paulina Lake water. Both indications are in accord with the chemical analyses
and water levels.
The isotope shift observed in the Paulina Hot Spring water (23) sug
gests that the spring water could be a mixture of thermal water such as samples
9, 13, or 15 and Paulina Lake water. Temperatures of the waters as well as
the major-ion chemistry make this simple mixing model unlikely however. In the
East Lake Hot Spring water the isotope shift suggests that a mixing relation
involving East Lake water would require a dilute end member having an isotopic1 R
composition with^D < -127 and ^J 0 < -17 and a volume fraction of at least
75 percent of the mixture. A water of this isotopic composition would probably
have to originate at the high altitudes of the Cascades Range, if samples 20 and
3 represent the most nearly "meteoric" water in the caldera. It is unlikely
that ground water from the Cascades could move through the intervening rocks and
discharge from the Newberry geothermal system with the small concentrations of
chloride, silica, and major cations observed in the East Lake hot springs. The
small shift in oxygen-18 in the East Lake Hot Spring water seems most likely to
The difference in deuterium concentrations between the sample obtained by Mariner and that obtained by Craig in well 15 is unexplained except as a possible effect of differing laboratory methods. The same explanation might account for the possibly anomalous deuterium concentrations in all samples collected by Craig in 1981. A decrease in deuterium of 2 to 4 per mil would place these samples in positions more consistent with the remainder of the isotope data as well as with the chemical analyses.
31

be caused by the injection of steam beneath the caldera. (See, for example
Ellis and Mahon, 1977, for a discussion of this phenomenon.) The small chloride
concentration in the spring water is consistent with this origin. The isotopic
data are consistent with the major-ion chemistry in indicating that both thermal
and nonthertnal waters in the caldera are derived from local meteroic water and
that thermal alterations occur at fairly shallow depths. The distinction
between East Lake and Paulina Lake ground waters made on the basis of the
major ionic constituents probably relates mainly to near-surface low-temperature
phenomena rather than to deep-seated geothermal processes.
32

TEMPERATURES OF SURFACE AND GROUND WATER
Measured temperatures of shallow ground water in the caldera range from 4°C
to 62°C. The highest temperatures (52°C and 62°C) were measured in the Paulina
Lake and East Lake Hot Springs (Mariner and others, 1980; table 11, this re
port). Temperatures of well waters ranged from 2°C to 36°C; temperatures above
10*C occurred only near the east end of Paulina Lake. The range of seasonal
fluctuations in ground-water temperatures is not known in the caldera, but
because the average annual air temperature at Newberry is about 0*C, any ground-
water temperature above 10*C probably implies the presence of a thermal component
Temperatures of bottom water were measured in Paulina Lake and East Lake in
an attempt to identify areas of high heat flow and possible inflows of thermal
water (fig. 5). Additional measurements at a depth of 2 feet at each site in
dicated that near-surface temperatures were fairly uniform within each lake, but
varied somewhat with daily metrological conditions. They are not shown in
figure 5.
^M »v* » * * ~M -*
Lak9~#
*** 11 rw " *,nSi . »H£ *« a?
2000 4000 6000 ft«t_ Wottr ttmptroturt at bottom,
i£" in dtgrtt* Ctlsius 25-^Otpth to bottom, in fett
Figure 5. Temperatures measured on the lake bottom in Paulina and East Lakes.
33

Offshore from both hot springs, there are sizeable areas in which temper
atures are above normal and gas bubbles rise to the surface, indicating that
spring activity is not confined to the shore. Temperature measurements along
the east shore of Paulina Lake show that thermal water also enters the lake
adjacent to Little Crater Campground. The low temperatures in most shallow
wells in the Campground suggest that the thermal water does not flow laterally
from the adjacent ground-water body but rather ascends vertically through
the lake bottom.
Two additional areas, one in each lake, had temperatures that might
indicate thermal inflow. The strongest possibility is in the northwest corner
of Paulina Lake where temperatures of 11.0°C and 11.4°C were measured at depths
of 25 and 23 feet respectively. In East Lake, temperatures of 11.0°C and 11.4°C
were measured at a depth of 14 feet in the northwest part of the lake. In
both cases, a more detailed investigation would be required to confirm a thermal
influence.
The volume of thermal-water inflow to the lakes probably is small. Even if
the amount of inflow were much greater than estimated, however, a deep geother-
mal origin is unlikely for most of the thermal water. The chemical and isotopic
analyses indicate that a probable origin is the heating of meteoric water by
rising steam. Thus, there may be only small additions of thermal fluid to the
shallow ground-water system.
Two partly independent estimates of the inflow of warm water have been made6 3
as follows. Measurements in Paulina Lake show that about 25x10 ft of lake
water in the vicinity of the hot springs is warmed to an average 6°C above
ambient temperature by the influx of thermal water . The average temperature
of water contributed by hot springs and seeps on shore is about 40°C. Springs
in the lake also are assumed to have an average temperature of 40°C, Calcula
tions using a simple mixing model yield 0.23 as the fraction of thermal water in
the affected volume of lake water. If the lake is assumed to turn over annually3
with complete mixing as a result, the inflow rate is about 11 ft /min or 130
acre-ft/yr.
Estimate based on temperature measurements made in 1977 by N. E. Voegtly and E. A. Sammel.
34

Along the Little Crater shore, there is no evidence of temperatures com
parable to those near the Paulina Hot Springs, but the greater area involved
leads to an estimate of inflow similar to the hot-spring area. Thus, the
total thermal inflow in areas of Paulina Lake where temperatures have been
measured is probably no more than 300 acre-ft/yr.
A partly independent estimate begins with discharge from the springs on3 shore which probably is no greater than 2 1/2 ft /min. Observations of gas
vents offshore suggest that discharge in the lake could no more than double this
figure. If the flows near the shore at Little Crater are again assumed to be
comparable to those in the hot-spring area, the total inflow to the lake esti
mated in this way is similar to the previous estimate This amount would have
no detectable effect on the large-scale temperature distribution in the lake.
The known areas of thermal discharge in East Lake are less extensive than
those in Paulina Lake, and the total discharge is probably smaller. Even if a
significant fraction of East Lake thermal water rises directly from a geothermal
reservoir, the thermal water probably is a negligible addition to the ground-
water influx. The hot springs in Paulina and East Lakes are the only ones known
in the caldera and their apparently small contributions of thermal water have
been ignored in the hydrologic budget.
35

DISCUSSION OF RESULTS
The summation of terms in the hydrologic budget for the caldera at Newberry
Volcano shows an apparent annual surplus of water. The surplus, which is
estimated to be at least 2,500 acre-feet and possibly as much as 10,000 acre-
feet, is assumed to move downward to deep aquifers beneath the caldera floor.
Part of the recharge may move laterally out of the caldera and discharge
through the flanks of the mountain. However, the absence of springs or surface
flows other than Paulina Creek on the flanks of the volcano indicates that
little ground water moves outward to the surface of the mountain, even though
large amounts of recharge must occur on the upper flanks. Streamflow measure
ments by the Geological Survey in Paulina Creek in August, 1981, showed no gain
in the stream between Paulina Lake and Paulina Prairie at the base of the
mountain. Massive tuffaceous rocks exposed along Paulina Creek west of the
caldera rim show no evidence of ground-water seepage, and only one small seep
is known to occur below the outlet of Paulina Lake. A Geological Survey core
hole (Newberry 1), located about 2 miles northeast of the caldera rim, en
countered only minor flows of perched ground water at depths of about 200, 500,
and 900 feet, and a temperature profile in the hole indicated that ground water
recharge moves vertically downward through the upper 200 feet of rock at this
site.
Within the caldera, data obtained in the Geological Survey's 3,057-foot
core hole (Newberry 2) provide evidence of ground-water flow below the near-
surface hydrologic regime. Small flows of ground water were detected in the
core hole at depths ranging from 100 to 1,900 feet beneath the caldera floor
(Sammel, 1981; and MacLeod and Sammel, 1982).
The ground water observed at depth probably originates in the caldera, but
the present study does not indicate the areas from which it is derived. The
presence of a surplus of water in the East Lake sub-basin (table 8) suggests
that much recharge could occur there. However, the large hydraulic gradient
between the two sub-basins undoubtedly causes much of the surplus water to flow
from east to west across the caldera. Hydrologic studies in other volcanic
areas of Oregon indicate that the topographic features of the present caldera
36

floor would not be major obstacles to this near-surface ground-water flow
(Sammel, 1980; Sammel and Craig, 1981) Thus the surplus of water from the
East Lake sub-basin may be available for ground-water recharge anywhere in the
caldera.
Waters sampled in the two sub-basins differ in their chemical character
istics, but the differences probably do not indicate separate hydrologic re
gimes. The occurrence of dilute waters such as those in samples 3, 20, and 22
(tables 9 and 11) in both sub-basins suggests that the chemical data may be
biased by the preponderance of samples from the vicinity of the hot springs
and the central pumice cone, which may represent only local chemical and thermal
anomalies within the caldera.
A part of the ground-water contribution from the East Lake sub-basin to the
Paulina Lake sub-basin probably originates as seepage from East Lake itself.
Measurements of lake levels in East Lake during a 26-day period of no precip
itation between August 11 and September 6, 1981 showed a decrease in stage of
0.45 feet. Evaporation from the lake surface during this period was estimated
to be 0.32 feet. The seepage loss (ground-water inflow minus ground-water
outflow), therefore, is 0.13 feet, from which is calculated a seepage rate of2 2.5 ft /s, or about 5 acre-feet per day.
3 This figure is close to the estimate of 2.3 ft /s made by Phillips (1968,
table 9) on the basis of fragmentary records for the period 1931 to 1961.
Phillips concluded that annual seepage from East Lake is nearly constant and is
fairly independent of lake levels. We conclude that the lake, at its historic
and present levels, is largely self-regulating, and that seasonal or annual
changes of ground-water inflow probably are balanced by similar increases or
decreases in ground-water outflow. Thus, although our seepage estimate may be
too high as the result of underestimating evaporation, the average annual rate
should be higher than the figure obtained in the late summer at a time of low
lake levels.o
An average seepage rate from East Lake of 2.5 ft /s (1,800 acre-feet per
year), exceeds the flow required to balance the estimated deficit in Paulina
Lake (table 8). Observations of stages in Paulina Lake suggest, however, that
the deficit may be higher than estimated. During the 26-day period, August 11
to September 6, 1981, the level of Paulina Lake declined 0.86 foot; estimated
37

evaporation was 0.22 foot, and streamflow was equivalent to a decline of 0.84
foot. Therefore, if ground-water seepage out of the lake was small, about 0.2
foot of ground-water inflow entered the lake during this period. On the assump-3 tion that the estimated inflow rate for this period (5.2 ft /s) is close to
the annual average, the net annual ground-water contribution to Paulina Lake is
about 3,800 acre-feet.
An analysis of probable errors in these estimates leads to the following
conclusions: (1) The streamflow estimate for the 26-day period has a small
probable error due to the availability of precise flow measurements made by the
USGS on August 20 and the generally uniform flow rate observed during the
period; (2) estimated annual evaporation for Paulina Lake is extremely low, and
the actual evaporation is likely to be higher than the estimate rather than
lower; (3) ground-water inflow to the Paulina Lake sub-basin probably is several
times greater than the deficit shown in table 8, and both evaporation from
Paulina Lake and streamflow in Paulina Creek could be significantly greater than
the estimated values without causing an actual deficit in the sub-basin. The
subtraction of the required several thousand acre-feet per year from the budget
of the East Lake sub-basin would still allow a surplus to remain in this area
also. As a consequence of probable increases in evaporation and stream flow,
however, the probable maximum amount of ground water available for deep recharge
is reduced from 10,000 acre-feet to a figure close to the 6,500 acre-feet given
in table 8.
Partly as a means of testing the general conclusions of this study, esti
mates of mean monthly values were made for all terms in the hydrologic budget.
These estimates, and especially those for winter months, are not sufficiently
reliable to warrant inclusion as a table in this report. However, seasonal
aggregates of these figures seem to support the general conclusions and eluci
date some aspects of the hydrologic regime.
At the end of a normal winter, for example, ground-water storage in the
Paulina Lake sub-basin probably would have a deficit in the range 7,000 to
11,000 acre-feet, if not compensated by ground-water inflow from the East Lake
sub-basin. In contrast, gains and losses in the East Lake sub-basin remain
nearly in balance during winter months (assumed to be December through March).
38

During the period April through November, Paulina Lake sub-basin has an
apparent surplus of about 3,000 acre-feet, all in ground-water storage. This
surplus, carried over into the winter period, helps to support winter stream-
flows. However, observed lake levels and estimated streamflows could not be
maintained through the winter in the absence of continued ground-water inflow
from the East Lake sub-basin. The inflow probably reaches a peak in late spring
or early summer and continues during the winter. Soil moisture, ground-water
storage, and lake storage return to normal high levels during the winter and
spring of most years.
Manipulation of the data in tables 7 and 8 shows that, of the 35 inches
of precipitation that falls on land surfaces in the caldera, nearly 70 percent
(24 inches) percolates below the evapotranspiration zone to recharge the shallow
ground-water body. This percentage is exceptionally high when compared with
more common volcanic terranes, but it is reasonable in view of the highly
permeable land surface, which generally is either pumice- or ash-covered or
consists of blocky, fractured obsidian or basaltic lava. Overland runoff is
rarely observed except during brief periods of spring snowtnelt.
Water that leaves the shallow ground-water flow system by infiltration to
deeper zones beneath the caldera probably is in the range 0.3 to 0.7 foot
annually, or 10 to 25 percent of precipitation on land surfaces. If the actual
rate is near the upper end of the range, deep infiltration may occur uniformly
over fairly large areas of the caldera floor. A value near the low end of the
range, seemingly more likely in view of probable errors in the estimates, could
imply that the conduits for deep recharge are restricted to major ring fractures
and faults. The latter mode seems the more likely in view of the stratified
aquifers and low vertical permeabilities observed in the caldera drill hole.
These conclusions imply rather strongly that a deep hydrothermal convection
system at Newberry could not be effectively recharged by vertical flow of
meteoric water from the caldera. Sources of recharge for any such system
probably must be sought in deep regional aquifers that intersect permeable zones
beneath the mountain.
39

REFERENCES
Blaney, H. F. , and Corey, G. L., 1955, Evaporation from water surfaces in
California: California Department of Water Resources, Bulletin 54-8,
98 p.
Craig, Harmon, 1961, Standard for reporting concentrations of deuterium and
oxygen-18 in natural waters: Science, v. 133, p. 1833.
Ellis, A. J., and Mahon, W. A. J., 1977, Chemistry and geothermal systems,
Academe Press, 392 p.
Farnsworth, Richard, Thompson, Edwin, and Peck, Eugene, 1982, Evaporation atlas
for the contiguous 48 United States: National Oceanographic and Atmospheric
Administration Technical Report NWS-33, 27 p., 4 maps.
George, Tom, and Haglund, James, 1973, Summary of snow survey measurements for
Oregon: U.S. Soil Conservation Service, 564 p.
Hamon, W. Russel, 1961, Estimating potential evapotranspiration: American
Society of Civil Engineers, Journal of the Hydraulics Division, v. 87, HY
3, Pt.l, p. 107-120.
Harbeck, G. E., Jr., 1962, A practical field technique for measuring reservoir
evaporation utilizing mass-transfer theory: U.S. Geological Survey Pro
fessional Paper 272-E., p. 101-105.
Hem, J. D., 1970, Study and interpretation of the chemical characteristics of
natural water: U.S. Geological Survey Water Supply Paper 1473, p. 99.
Kohler, M. A., Nordenson, T. J., and Baker, D. R. , 1959, Evaporation maps for
the United States: U.S. Weather Bureau, Technical Paper B7, 12 p., 5 pi.
MacLeod, N. S., Sherrod, D. R., Chitwood, L. A., and McKee, E. H. , 1981, New-
berry Volcano, Oregon, in_ Johnston, D. A., and Donnelly-Nolan, Julie, eds.
Guides to some volcanic terranes in Washington, Idaho, Oregon, and northern
California: U.S. Geological Survey Circular 838, p. 85-103.
MacLeod, N. S., and Sammel, E. A., 1982, Newberry Volcano, Oregon: a Cascade
Range geothermal prospect: California Geology, v. 35, no. 11, p. 123-131,
and Oregon Geology, v. 44, no. 11, p. 123-131.
Mariner, R. H., Swanson, J. R., Orris, G. J., Presser, T. S., and Evans, W.
C., 1980, Chemical and isotopic data for water from thermal springs and
wells in Oregon: U.S. Geological Survey Open-File Report 80-737, 50 p.
40

Phillips, K. N., 1968, Hydrology of Crater, East, and Davis Lakes, Oregon:
U.S. Geological Survey Water-Supply Paper 1859-E, 60 p.
Sammel, E. A., 1980, Hydrogeologic appraisal of the Klamath Falls geothermal
area, Oregon: U.S. Geological Survey Professional Paper 1044-G, 45 p.
1981, Results of test drilling at Newberry Volcano, Oregon: Geothermal
Resources Council Bulletin, v. 10, no. 11, p. 3-8.
Sammel, E. A., and Craig, R. W., 1981, The geothermal hydrology of Warner Valley,
Oregon: U.S. Geological Survey Professional Paper 1044-1, 47 p.
Stiff, H. A., Jr., 1951, The interpretation of chemical water analysis by means
of patterns: Journal of Petroleum Technology v. 3, no. 10, p. 15-17.
41

Table 2. Precipitation recorded during selected periods at the Newberry
Volcano, Chemult, and Wickiup Dam weather stations
Period
11/23/65-05/31/66
06/01/66-07/26/66
08/12/66-11/14/66
11/15/66-06/18/67
06/19/67-10/15/67
10/16/67-01/31/68
02/01/68-04/14/68
04/15/68-06/17/68
06/18/68-10/06/68
10/07/68-01/07/69
01/08/69-04/08/69
09/08/69-10/09/69
10/10/69-01/21/70
04/07/70-06/04/70
06/05/70-07/15/70
10/10/70-03/09/71
03/10/71-09/28/71
09/29/71-10/19/71
10/20/71-05/04/72
11/02/72-02/22/73
02/23/73-06/13/73
07/17/75-09/01/75
11/21/75-07/01/76
Newberry Volcano (inches)
18.65
2.25
4.75
26.55
2.75
8.20
6.95
3.90
1.85
12.00
15.10
1.60
25.00
1.10
1.80
32.30
10.65
1.85
31.50
13.05
5.75
2.00
24.70
Chemult (inches)
14.63
2.04
5.17
21.04
2.73
7.89
4.96
2.02
2.91
11.50
7.71
0.87
14.53
0.66
1.71
25.78
9.36
0.68
28.02
13.48
3.43
0.75
14.75
Wickiup Dam (inches)
10.37
1.86
3.38
14.54
2.29
6.55
3.10
1.92
2.12
7.16
6.37
1.75
10.17
0.67
1.49
18.96
6.79
0.73
18.70
7.76
2.01
0.60
12.49
42

Table 2. Precipitation recorded during selected periods at the Newberry
Volcano, Chemult, and Wickiup Dam weather stations (Continued)
Period Newberry Volcano Chemult Wickiup Dam(inches) (inches) (inches)
07/02/76-10/11/76 6.80 3.84 4.27
10 /12/76-12/29/76 1.00 0.80 1.12
10/21/77-05/17/78 31.55 28.79 17.83
05/18/78-11/15/78 5.45 5.41 5.59
11/15/79-04/24/80 19.95 15.57 12.84
43
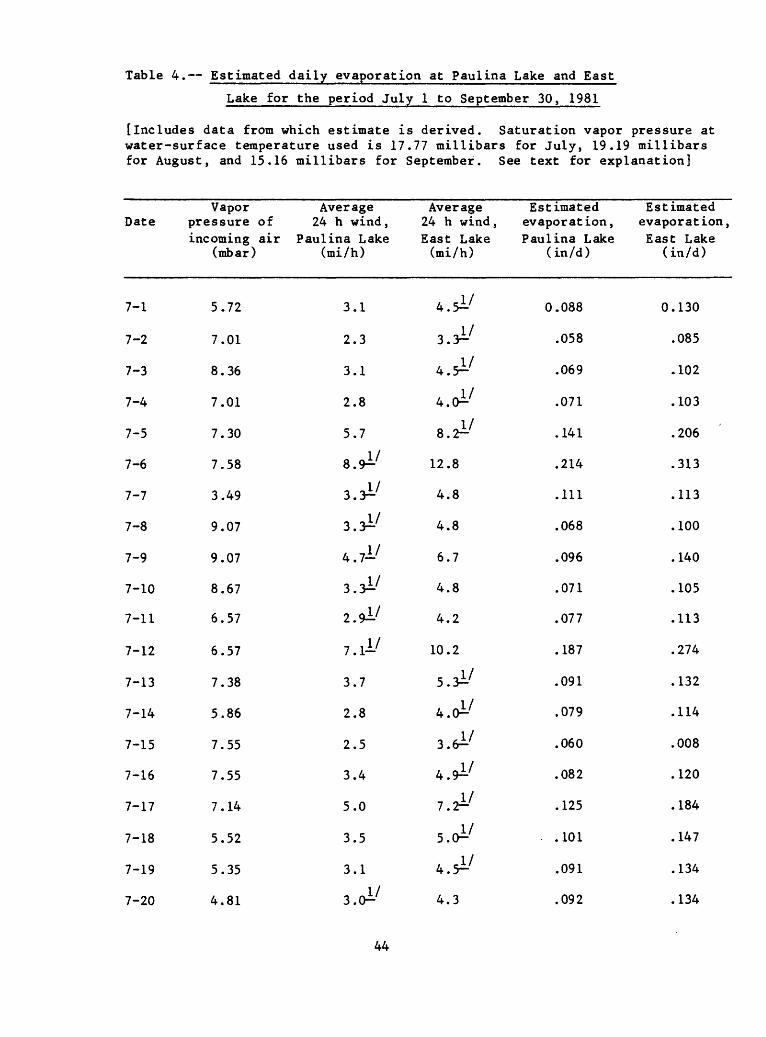
Table 4. Estimated daily evaporation at Paulina Lake and East
Lake for the period July 1 to September 30, 1981
[includes data from which estimate is derived. Saturation vapor pressure at water-surface temperature used is 17.77 millibars for July, 19.19 millibars for August, and 15.16 millibars for September. See text for explanation]
VaporDate pressure of
incoming air (mbar)
Average 24 h wind,
Paulina Lake (mi/h)
Average 24 h wind, East Lake(mi/h)
Estimated evaporation, Paulina Lake
(in/d)
Estimated evaporation.East Lake
(in/d)
7-1
7-2
7-3
7-4
7-5
7-6
7-7
7-8
7-9
7-10
7-11
7-12
7-13
7-14
7-15
7-16
7-17
7-18
7-19
7-20
5.72
7.01
8.36
7.01
7.30
7.58
3.49
9.07
9.07
8.67
6.57
6.57
7.38
5.86
7.55
7.55
7.14
5.52
5.35
4.81
3.1
2.3
3.1
2.8
5.7
4. si/
3.3i/
2.91'
7.0/
3.7
2.8
2.5
3.4
5.0
3.5
3.1
3.oi/
12.8
4.8
4.8
6.7
4.8
4.2
10.2
3. 3
4.o
3. 6
5 .oi/
4.5i/
4.3
0.088
.058
.069
.071
.141
.214
.111
.068
.096
.071
.077
.187
.091
.079
.060
.082
.125
.101
.091
.092
0.130
.085
.102
.103
.206
.313
.113
.100
.140
.105
.113
.274
.132
.114
.008
.120
.184
.147
.134
.134
44

Table 4. Estimated daily evaporation at Paulina Lake and East
Date
7-21
7-22
7-23
7-24
7-25
7-26
7-27
7-28
7-29
7-30
7-31
8-1
8-2
8-3
8-4
8-5
8-6
8-7
8-8
8-9
Lake for the
Vapor pressure of incoming air
(mbar)
4.64
5.18
3.93
3.93
5.82
6.57
7.82
6.94
4.98
4.67
3.69
5.72
6.80
6.47
6.47
6.37
6.26
6.70
9.71
7.79
period July 1 to
Average 24 h wind,
Paulina Lake (mi/h)
3.3
3.3
*.£!
4.5^
3.5i/
2.2-i7
2.9
7.5
4.2
2.7
3.6
3.0
5.6
3.5
3. 1-7
2.7^
2.4^
2.*i'
3.3i/
j O 1 '
September 30,
Average 24 h wind, East Lake
(mi/h)
4.8
4.8
5.1
6.4
5.0
4.6
4.2i/
10. S^
6.oi/
3.9I/
s.2i/
4.3
8.0^
5.0
4.4
3.9
3.5
3.8
4.7
5.5
1981 (Continued)
Estimated evaporation, Paulina Lake
(in/d)
0.102
.099
.117
.147
.099
.084
.064
.192
.127
.083
.120
.095
.164
.105
.093
.082
.073
.077
.074
.102
Estimated evaporation, East Lake
(in/d)
0.151
.145
.169
.213
.143
.124
.100
.281
.184
.123
.176
.139
.238
.153
.134
.120
.109
.114
.107
.150
45

Table 4. Estimated daily evaporation at Paulina Lake and East
Date
8-10
8-11
8-12
8-13
8-14
8-15
8-16
8-17
8-18
8-19
8-20
8-21
8-22
8-23
8-24
8-25
8-26
8-27
8-28
8-29
Lake for the
Vapor pressure of incoming air
(mbar)
4.33
6.87
7.92
11.44
7.16
6.30
4.20
4.77
5.82
6.30
3.01
4.85
6.50
7.56
13.28
7.04
5.16
4.69
5.72
5.88
period July 1 to
Average 24 h wind,
Paulina Lake (mi/h)
2.9
2.7
3.3
3.6
3.3
3.2
2.7
2.4^
3.6±7
, AJ 4 .6--
3. 8i/
3.ll7
2.9i7
3.6l7
3.4i7
4.1
4.6
2.4
3.8
6.5
September 30,
Average 24 h wind, East Lake (mi/h)
4. 2I/
3.<^7
4.T*/
5.2^
4.7^7
4.^
3.<^7
3.5
5.2
6.6
5.5
4.4
4.1
5.1
4.9
5.^7
6.fr±-7
3.4l7
5.5^7
9.3^-7
1981 (Continued)
Estimated evaporation, Paulina Lake
(in/d)
0.102
.078
.088
.066
.094
.097
.095
.076
.113
.140
.145
.105
.087
.099
.047
.117
.152
.082
.121
.204
Estimated evaporation, East Lake
(in/d)
0.150
.115
.127
.097
.136
.142
.140
.112
.167
.204
.214
.151
.125
.142
.070
.172
.222
.118
.178
.297
46

Table 4. Estimated daily evaporation at Paulina Lake and East
Date
8-30
8-31
9-1
9-2
9-3
9-4
9-5
9-6
9-7
9-8
9-9
9-10
9-11
9-12
9-13
9-14
9-15
9-16
9-17
Lake for the
Vapor pressure of incoming air
(mbar)
8.05
6.36
5.72
7.02
8.37
4.54
4.54
6.03
5.55
8.87
6.47
6.50
6.09
9.55
6.50
6.70
6.94
5.82
7.85
period July 1 to
Average 24 h wind,
Paulina Lake (mi/h)
5.3
3.3
5. a/2. si'
3 . 8
3.»i'
3.3
2.A'
2.*i/
2.1
2.2
2.3
2.2
3.6
5.7
4.4
3.oi/
2.6l/
2.4±7
September 30,
Average 24 h wind , East Lake (mi/h)
7.4'
4.i'
7.7
3.6
5.4
5.4
4.7
3.9
3.4
3.0^
3.2^
3.3^
3.21'
3.21'
8.2i/
6.31'
4.3
3.8
3.5
1981 (Continued)
Estimated evaporation, Paulina Lake
(in/d)
0.139
.100
.120
.048
.061
.095
.083
.058
.054
.031
.045
.047
.047
.048
.116
.088
.058
.057
.041
Estimated evaporation, East Lake
(in/d)
0.203
.145
.174
.070
.088
.138
.120
.085
.078
.045
.067
.069
.070
.070
.170
.128
.085
.085
.061
47
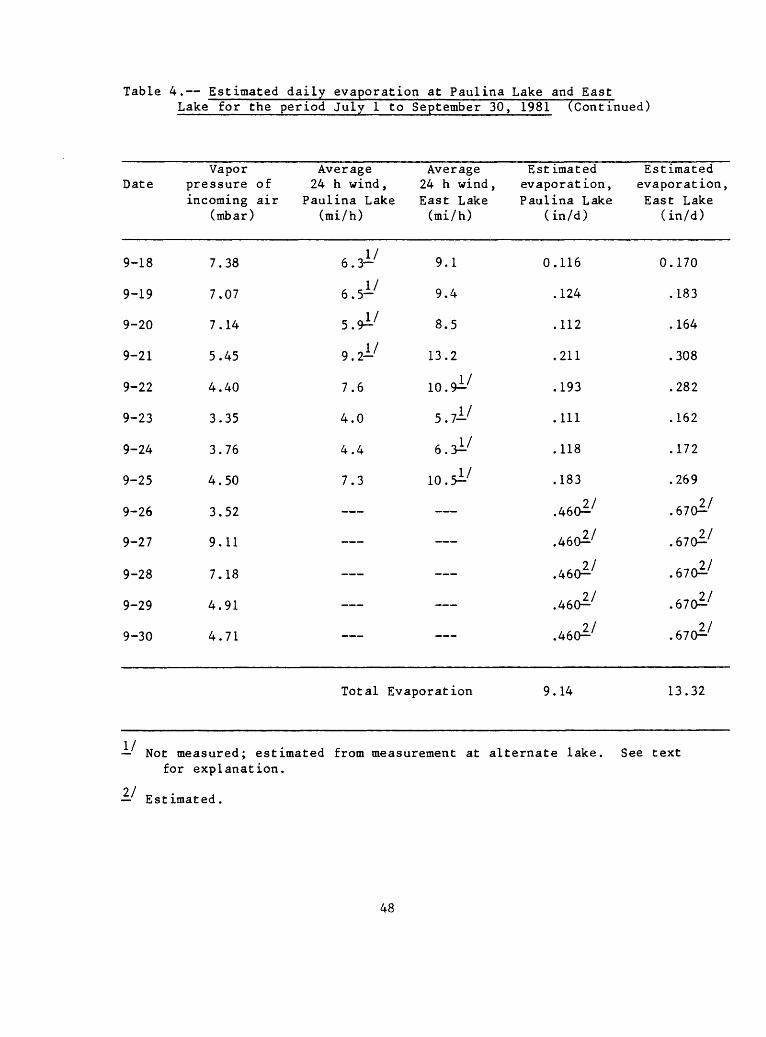
Table 4. Estimated daily evaporation at Paulina Lake and East
Date
9-18
9-19
9-20
9-21
9-22
9-23
9-24
9-25
9-26
9-27
9-28
9-29
9-30
Lake for the
Vapor pressure of incoming air
(mbar)
7.38
7.07
7.14
5.45
4.40
3.35
3.76
4.50
3.52
9.11
7.18
4.91
4.71
period July 1 to September 30,
Average Average 24 h wind , 24 h wind ,
Paulina Lake East Lake (mi/h) (mi/h)
6.3^ 9.1
6.5^ 9.4
5.9^ 8.5
9.2- 13.2
7.6 10.9-^
4.0 5.7-/
4.4 6.3^
7.3 10.5^
Total Evaporation
1981 (Continued)
Est imated evaporation, Paulina Lake
(in/d)
0.116
.124
.112
.211
.193
.111
.118
.183
.460*'
.460*'
.460*'
.460*'
.460*'
9.14
Estimated evaporation, East Lake
(in/d)
0.170
.183
.164
.308
.282
.162
.172
.269
.670^
.6701/
.670^
.670^
.670^
13.32
Not measured; estimated from measurement at alternate lake. See text for explanation.
2/ Estimated.
48

Table 9. Data fr
om we
lls
in Nevberry ca
lder
a
Sequence
No.
Owne
r /name
1 2 3 4 5 6 7 8 9 10 11
Paul
ina
Lake
- Re
sort
Paul
ina
Lake
Reso
rt
Paul
ina
Guard
Stat
ion
(USF
S)
ICOF
le
dge
Mike Ma
thew
s
Star (?)
Ulven
Jack
Hogg
Litt
le Crater
Picnic Area
Litt
le Crater
Camp
Si
te 4A
Little Crater
Camp S
ite
10
[umho/cm «
micromhos
per
cent
imet
er at
25
*C]
Lati
tude
Date
Dept
h2/
3/
Long
itud
e completed
Dept
h Diameter
Altitude
to water
(deg
Kmin
) (ft)
(in)
(f
t)
(ft)
43 4
2.90
1929
20
36
121
16.5
5
43 4
2.90
1980
65
8
121
16.5
5
43 42
.70
-
45
6 121
16.60
43 4
2.45
121
15.40
43 4
2.45
1969
22
30
121
14.9
0
43 4
2.45
5 24
12
1 14
.85
43 42.45
6 12
121
14.85
43 42.45
8 12
1 14
.80
43 4
2.50
12
6 121
14.7
0
43 4
2.70
12
6 121
14.5
5
43 4
2.75
08
/06/
71
23
6 121
14.5
5
6,34
1.4
14.9
12.2
6,34
0.1
,- 15
.1
/ 11. 0
6,35
6.3
. 30.7
'
28.3
6,34
6.0
12.1
6,33
6.7
4;. 7
3.
3
6,33
4.2
.6
6,334.1
.1
6,34
0 17
.6
6,34
2.1
10.5
8.8
6,34
3.2
11.2
9.5
6,34
3.3
11.8
9.9
Temp
er-
Spec
ific
ature
cond
ucta
nce
CO
(^mho/cm)
7 4 4 5 9 4 3 12 2 3 2 16
13 9.5
4
460
235
600
550 90
80 110
675
720
1,15
0
650
900
710
530
195
195
Date
meas
ured
08/14/81
06/2
8/82
10/07/81
06/2
8/82
09/03/81
06/3
0/82
06/2
7/82
09/05/81
06/2
7/82
06/2
7/82
06/2
7/82
09/05/81
10/0
7/81
06/28/62
10/0
7/81
09/06/74
10/0
7/81
06
/28/
82
4/
5/
Use-
1- Ot
her
data^-'
C,D
0,1(
10/0
7/81
)
C,D
0,1(10/07/81)
D,R
0(09/06/81)
1(10
/07/
81)
D D 0,
1(06
/30/
82)
D D D 0(09/06/81)
U 0,
1(10
/07/
81)
U U

Table 9. Data fr
om wel
ls in
Newberry ca
lder
a (Continued
)
[pmho/cm m
icromhos pe
r ce
ntim
eter
at
Sequ
ence
No.
. Owne
r /n
ame
12 13 14 15 16 17 18 19 20 21 22
Little
Crater
Camp
Site 20
Little Crater
Camp
Site 27
Little Crater
Camp
ground well
Little Crater
Camp
site 49
East
La
ke
Camp
grou
nd we
ll
Hot
Springs
Campground
East
La
ke
Reso
rt R
V pa
rk
East La
ke
Reso
rt
Cinder Hi
ll
Camp
grou
nd we
ll
Cind
er Hill
Camp Site 27
Cinder Hi
ll
Camp
Site 34
Lati
tude
Date
Dept
h2/
3/
Longitude
completed
Dept
h Diameter
Altitude
to water
(deg
Hmin
) (f
t)
(in)
(f
t)
(ft)
43 42.80
6 121
14.4
5
43 4Z.90
09/1
8/61
36
6 12
1 14
.40
43 43
.00
8 121
14.3
5
43 43.05
09/1
6/61
50
6 12
1 14
.35
43 4
3.05
10/1
2/62
50
6
121
12.5
0
43 43.10
6 121
11.9
0
43 43
.40
8 121
11.55
43 4
3.40
27.5
96
121
11.60
43 43.80
10/1
7/63
76
6 121
11.7
0
43 43.90
6 121
11.7
0
43 4
4.00
6 121
11.7
0
6,34
1.6
9.5
8.1
6,34
2.7
11.2
9.4
6,34
4.8
,
6,34
3.8
12.3
10.3
6,39
6.2
23.7
20
.9
6,38
9.8
14.4
11.0
6,40
7.2
27.4
24
.8
6,39
5 17.9
6,39
3.7
20,1
18.2
6,39
2.8
19.1
17.2
6,39
2.5
18.6
16.3
25*C
]
Temp
er-
Spec
ific
atur
e co
nduc
tanc
e (*C)
(jimho/cm)
9 7 6 5 30
32 6 3 6 10 3 3 5 5 4 3
430
330
360
240
240
220
900
960
'
390
325
120 85
90 105
110 90
140 93
Date
meas
ured
08/1
8/81
06/28/82
10/0
7/81
06
/28/
82
08/1
9/81
06/28/82
10/0
7/81
06/28/82
09/0
6/81
06/27/82
10/0
7/81
06/30/82
08/1
9/81
06/28/82
09/19/74
09/0
6/81
06/27/82
09/0
2/81
06/27/82
10/06/81
06/27/82
4/
5/
Use-
1-' Other da
ta^'
U U C. 1(1
0/07
/81)
R U 0(
09/0
6/81
) 1(
10/0
7/81
R 0(09/06/81
1(10
/07/
81)
U C C,D
R 0(
09/0
6/81
) 1(10/06/81)
U U C,
1(1
0/06
/81)
Tabl
e 9. Data fr
om wel
ls in
Newberry ca
lder
a (Continued)
[umho/cm
micr
omho
s per
centimeter at
25
*C]
Sequ
ence
No.I>
Latitude
Date
Depth
Temper-
Specific
Date
Owner/name
nl
*i
tl
fl
Longitude
comp
lete
d Depth
Diameter
Altitude '
to water
ature
cond
ucta
nce
measured
Use Oth
er data '
(degKmin)
(ft)
(in)
(ft)
(ft)
CO
(umho/cm)
Sequence No. Id
enti
fyin
g number used in
ta
bles
an
d il
lust
rati
ons.
2/
Altitude Land su
rfac
e at
well,
in feet above
National Geodetic Vertical Datum o
f 1929.
3/
Depth to water Feet below la
nd surface.
Use C,
commercial
(resort);
D, domestic;
R,
recreation;
U, un
used
.
Other
data C, ch
emic
al analysis,
table
11;
I, is
otop
e analysis,
table
12.

Table 10. Data fr
om ap
ring
a an
d gas
vents
in Nevberry caldera
[um
ho/c
m "
mic
rom
hos
per
ce
nti
met
er at
25*0
]
Seq
uenc
e L
ati
tud
e
No.
Ow
ner
Nam
e L
ongit
ude
(deg
)(m
in)
23 24 25 I/
1!
U.S
. F
ore
st
Ser
vic
e
U.S
. F
ore
st
Ser
vic
e
U.S
. F
ore
st
Ser
vic
e
Seq
uenc
e N
o.
Alt
itude L
andP
auli
na
Lak
e 43
h
ot
spri
ngs
121
Lost
L
ake
43
gas
ven
ts
121
Eas
t L
ake
43
ho
t sp
rings
121
Identi
fyin
g
num
ber
surf
ace
at
spri
ng
43.8
5
14
.95
42.2
5
13.6
5
43.2
0
11.9
5
used
in
, in
fe
et
Pro
bab
le
Specif
ic
wat
er-b
eari
ng
Occ
ur-
T
empe
r-
conduct
-2
/ 3
/ A
ltit
ude
mate
rials
re
nce
Y
ield
at
ure
an
ce
Dat
e O
ther
data
(f
t)
CO
O
mho
/cm
)
6,3
34
Volc
anic
T
herm
al
Man
y sm
all
52
960
bre
ccia
dif
fuse
fl
ow
s
6,3
90
Vo
lcan
ics
Gra
vit
y
Ver
y sm
all
5 40
0 (O
bsi
dia
n
to
none
fl
ow
?)
Fo
llo
ws
Pum
ice,
as
h,
The
rmal
M
any
smal
l 57
84
0 la
ke
and
lacust
- dif
fuse
fl
ows
level
rin
e
sed
imen
ts,
at
surf
ace
table
s an
d il
lustr
ati
ons.
abov
e N
atio
nal
G
eodet
ic V
ert
ical
Dat
um o
f 19
29.
Pau
lina
Lak
e H
ot
i
10
/26
/74
0,1
(06/3
0/8
2)
10
/27
/74
0(1
0/2
7/7
4
Ev
iden
t H
2S
gas
10
/26
/74
0,1
(06/3
0/8
2)
ipri
ng
and
Eas
t L
ake
Hot
Spri
ngs
referenced to
USGS benchmarks;
alti
tude
of Lost La
ke gas
vent
s es
tima
ted
from Geo
logi
cal
Survey topographic
quadrangle ma
p.
3/
Othe
r data C, ch
emic
al an
alys
is,
table
11;
I, Is
otop
e an
alys
is,
tabl
e 12
.


