
ID
EA
C
EL
LU
LA
R L
IM
IT
ED
A
NN
UA
L R
EP
OR
T 2
01
6-
20
17
CMYKCMYK
Th
om
so
n P
ress
Idea Cellular LimitedSuman Tower, Plot No. 18, Sector - 11,
Gandhinagar - 382 011, Gujarat
www.ideacellular.com
IDEA CELLULAR LIMITEDIDEA CELLULAR LIMITEDIDEA CELLULAR LIMITEDIDEA CELLULAR LIMITEDIDEA CELLULAR LIMITED

Mr. Aditya Vikram Birla
We live by his values.
Integrity, Commitment, Passion, Seamlessness and Speed.
CMYKCMYK

CMYK
The Chairman’s Letter to Shareholders
Dear Shareholder,
Global Economy
The global economy continued tobe subdued in 2016. The slowdownin the advanced economies of theWest adversely impacted growthlevels, resulting in the slowing ofthe world economic growth to 3.1%from 3.4% in the earlier year. Thegrowth in emerging markets anddeveloping economies wasencouraging. However, China andIndia experienced a deceleration.Financial markets reflected a broaduptrend, notwithstanding Brexitand the rate hikes by the US Fed.
Recent data reveals that the globaleconomy is gaining momentum.PMIs (Purchasing Managers’Indexes), accelerating trade flowsand better business and consumerconfidence are the key pointers.The IMF has projected globalgrowth to notch up to 3.5% in 2017from 3.1% last year. Growth in theadvanced economies is estimatedat 2%, with US growth at 2.3%, theEuro area at 1.7% and Japan at1.2%. Growth in the emergingmarkets is pegged at 4.5%, drivenlargely by China, India and theASEAN region. Latin America isexpected to grow only 1.1%,affected by the weak trend inBrazil.
Indian Economy
India is on a roll. There is a buzzabout India, as it blazes forth as thefastest growing economy in the

CMYK
Foreign investment
flows, which were at
over USD 60 billion in
FY-17 are scaling new
records. Markets are
buoyant. Stock index is
at a historic peak.
India’s global ranking
has jumped up in
competitiveness and on
the innovation index.
world at 7.1%. The trade deficit in 2016-17 wasUSD 106 billion, lower by 11% over the previous year. Thecurrent account deficit has been significantly pared. India’sforeign exchange reserves as at March end 2017 wereUSD 370 billion. Investors are bullish. Foreign investmentflows, which were at over USD 60 billion in FY-17 arescaling new records. Markets are buoyant. Stock index isat a historic peak. India’s global ranking has jumped upin competitiveness and on the innovation index.
The various initiatives and reforms of the ModiGovernment have built the platform for a quantum leapahead. High impact national projects, coming to grips withstructural issues, which were holding back the country’sprogress, innovative approaches in policy making – havecollectively contributed in driving India on a high growthtrajectory. Going forward the abiding sense is one ofimmense optimism and confidence in the future with thenation slated to grow at 7.5% to 8%. India’s narrative isunmatchable.
That said, if there is one subject that needs greater attentionon the government’s radar for the ensuing years, it is therevival of investment activity and creation of quality jobsin large measure. The Government is seized of these issues.The Government has taken many steps, including a sharpfocus on improving ease of doing business, speeding ofgreen clearances and stepping up public sector outlaysfor infrastructure. I believe, it is a matter of time beforethe private sector investments pick up – as NPAs areresolved and corporate balance sheets are deleveraged.
Your Company’s Performance
As you are all aware, the Indian wireless industrywitnessed an unprecedented disruption, given the lure offree offerings both voice and mobile data by a new entrant.It has been a ‘Period of Telecom Discontinuity’,permanently changing mobility business parameters.Consequently, the revenue KPIs and financial parametersfor all mobile operators have sharply declined. For the firsttime in its history, the flourishing Indian Mobility industry,is trending towards an annual revenue decline of ~2% inFY17 (vs FY16). With the new entrant starting to chargefor its services, albeit very slowly, the sector is expected toreturn to growth in the next financial year.

CMYK
The wireless
broadband population
under coverage now
expands beyond
500 million Indians in
21 service areas, while
GSM presence spreads
to nearly 1 billion
Indians.
On a consolidated basis, your Company for the first timesince its IPO, reported a total revenue decline of 0.8% at` 358,827 million for FY17 (` 361,625 million in FY16).While we remain optimistic on the India growth story andIdea continues to expand its scale of operations, thistumultuous phase subdued Idea’s EBITDA during thecurrent financial year by 13.1% to ` 105,832 million(vs ` 121,807 million in FY16). Further, last two years ofhigh Investment in Spectrum and Network Equipment hasincreased the ‘Depreciation and Amortisation’ charge to` 78,272 million and ‘Interest and Financing Cost’to ` 40,411 million. This has resulted into loss of` 3,997 million in FY17 – the first ever annual loss in last11 years since its IPO during Year 2007. The Cash Profitfor the Company stands at around ` 69,981 million.
Inspite of short term challenges, Idea remains committedto the process of building world class broadband services.With the slated launch of Mumbai 4G services by end ofMay 2017, the Company will be offering broadbandservices on its own spectrum across all 22 service areas,3G (15 service areas) and 4G (20 service areas). DuringFY 2017, Idea integrated highest ever network telecom sitecount of 50,004 sites (2G+3G+4G), expanding its networksites on GSM (2G), HSPA (3G) and LTE (4G) technologiesto an overall EoP of 241,540 sites, including 70% increasein its wireless broadband sites on 3G and 4G platform from64,703 sites as at end March, 2016 to 110,054 sites as at endMarch, 2017.
The wireless broadband population under coverage nowexpands beyond 500 million Indians in 21 service areas,while GSM presence spreads to nearly 1 billion Indians.The Company has also expanded its fibre backbonenetwork by 29,100 km from 115,500 km as at end March,2016 to 144,600 km as at end March, 2017. The Company’sgross investment in fixed assets has risen nearly to` 1,185 billion, an addition of ̀ 198 billion in last 12 months.Idea’s overall spectrum holding of 891.2 MHz acrossspectrum bands of 900, 1800, 2100, 2300 and 2500 MHzequips it with an ability to rollout wireless broadbandwhich can carry 15-20 times of its current mobile datatraffic. The monetization of this front loaded largeinvestment in spectrum and equipment is inevitable asDigital India mission gathers momentum.

CMYK
On 20th March, 2017,
we announced a
merger between
Vodafone India and
Idea Cellular. The two
companies will
combine their
operations in India
(excluding Vodafone’s
42% stake in Indus
Towers) to create
India’s largest telecom
operator.
On 20th March, 2017, we announced a merger between
Vodafone India and Idea Cellular. The two companies will
combine their operations in India (excluding Vodafone’s
42% stake in Indus Towers) to create India’s largest telecom
operator. The merger of Idea and Vodafone is founded on
the shared commitment to deliver substantial stakeholder
value, offer strong consumer choice to 1.3 billion Indians
and contribute towards realising the Prime Minister’s
vision of Digital India and financial inclusion goals. The
combined company would become the leading
communication provider in India with ~ 400 million
customers, 35% Customer Market Share and 41% Revenue
Market Share (based on Q3FY17 TRAI release). The merger
transaction is subject to approval from the relevant
regulatory authorities and Idea’s shareholders. Vodafone
and Idea have initiated necessary steps to obtain regulatory
approvals. A joint merger notification has been filed with
the ‘Competition Commission of India’ (CCI) and the
Scheme of Arrangement has been filled with SEBI and
Stock Exchanges for their approvals.
In the meantime, Idea will remain nimble, agile, adaptive
and focused on its execution capabilities. The company
remains confident to capitalise on the emerging
opportunities in mobile voice, digital content, mobile
banking and wireless data business as telecom market
invariably moves towards consolidation with 5 major
providers.
A big thank you to all of our employees
Organizational agility, excellence in execution, customer
centricity and cost optimization are a given. I believe to
drive business growth in a sustainable manner, the
criticality of our people – our intellectual capital, is beyond
expression. We deeply value our employees’ engagement
and their commitment to our culture of innovation and
performance accountability.
Aditya Birla Group: In perspective
At the Group level our performance both in terms of
revenue and earnings has been growing. In fact our
EBIDTA has been the highest ever. In line with our people
focus, we have strengthened the capacity of our leadership
CMYK
Our HR function has
collectively developed
and clearly articulated
the HR 2020 strategy
across the organization.
It has clear actionables
and review mechanisms,
focused on talent,
technology, productivity
and employer brand.
bench as well as employees across levels. Our Group’s HR
agenda is even more sharper and defining of our future.
Our HR function has collectively developed and clearly
articulated the HR 2020 strategy across the organization.
It has clear actionables and review mechanisms, focused
on talent, technology, productivity and employer brand.
On the people front it has truly been an exciting year of
development, building on the strong foundations of the
earlier years.
As I had shared with you earlier, we have 3 accelerated
leadership programs. First - The Turning Point, which
prepares high potential leaders for P&L roles. Second -
Step Up which infuses a ready pipeline for Functional
Head roles, and Third - Springboard designed especially
for high caliber women leaders. These have enabled us
set up the requisite bench strength of leaders.
We have prepared 123 leaders for higher responsibilities,
over the last one year. Of this 26 have already taken on
new roles. The Business leadership and I have personally
reviewed talent across the business, and am happy to see
the evolution of our structured succession plans.
The hiring freeze came into effect in January 2016. This,
coupled with our leadership development actions, has
resulted in extremely encouraging people moves. Over the
last year, we witnessed 5500+ career movements across
the Group. Of these, 600+ were inter-business movements,
150% higher than the previous year.
The Aditya Birla Group Leadership Program (ABGLP) is
another strong source of building leaders. It has gained
greater traction this year with 67% higher intake. From
the earlier batches, 95 participants, have over the last
2 years, been given cross business and function exposures
grooming them for a holistic perspective. I am happy to
share that we continue to be an employer of choice
amongst the top B schools in India. Our Group features
among the formidable Top-5 in the A C Nielsen – CRI
Campus Recruitment India Index 2016 as well.
Additionally to accelerate opportunities for our talent we
have set up Talent Councils led by Business Heads and
Directors at the business and Group levels. Up until now

CMYK
Project Vega is yet
another initiative
launched this year.
Its basic objective is to
review the agility of
decision making in the
organization, keeping
in view end-customer
impact.
more than a 100 Talent Councils meetings have happened
across the Group where the development plans of
approximately 3000 colleagues have been discussed and
actions taken.
Project Vega is yet another initiative launched this year.
Its basic objective is to review the agility of decision making
in the organization, keeping in view end-customer impact.
This has yielded significant changes to internal processes,
delegation of authority and speed of decision making, in
turn empowering teams and freeing up leadership
bandwidth. This, along with our focus on technology
enabled processes, I believe, will keep us sharp and nimble.
Furthermore, to hone and enhance our functional
expertise, Gyanodaya, the Aditya Birla Global Centre for
Leadership & Learning, launched Functional Academies
last year. The Sales, Marketing & Customer Centricity
Academy and HR Academy enabled 1150 leaders build
deeper expertise in their domain areas. Gyanodaya
continues to deliver superior learning programs with over
1583 managers enrolled last year.
Additionally, the Gyanodaya Virtual Campus hosts more
than 500 e-learning modules in multiple languages. During
the year, over 31664 employees accessed these e-learning
programs. I am happy to update you that we are doubling
our capacity in Gyanodaya, through upcoming expansion
plans.
In sum,
Our Group’s solid reputation, robust financials, the quality
and commitment of our talent, our leadership positions
in our businesses, our operational excellence and our CSR
engagement, are our strengths that I believe, will see us
ride the wave of success.
Yours sincerely,
Kumar Mangalam Birla

CMYK
1
Contents
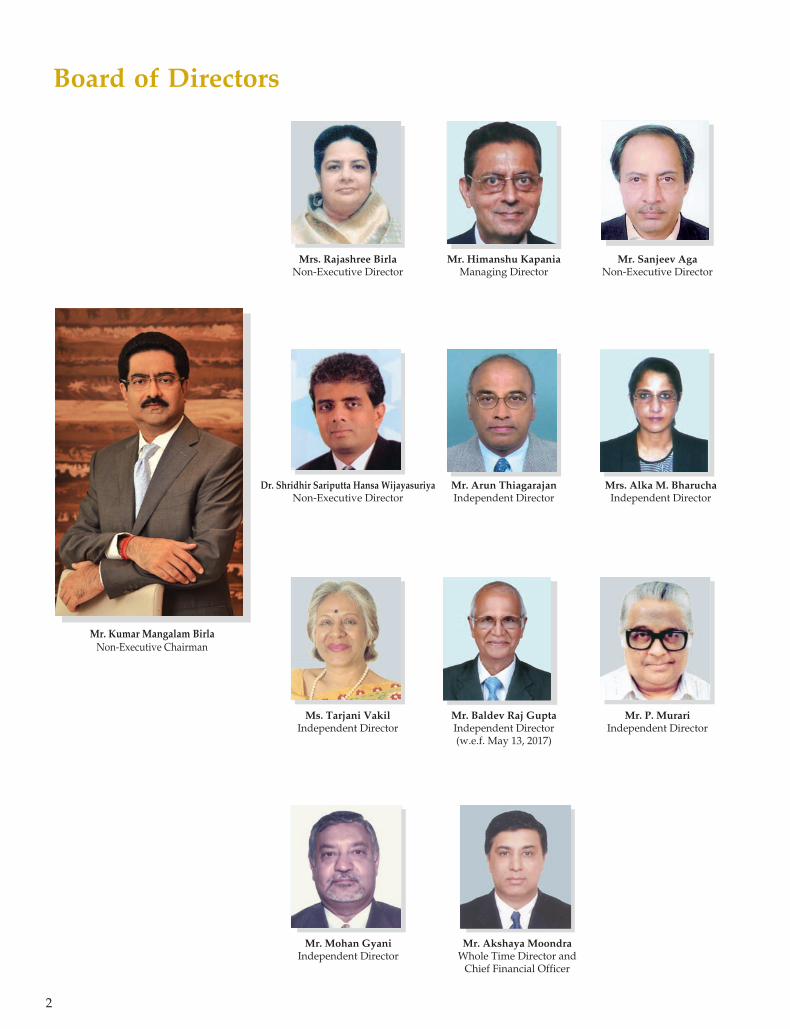
2 Board of Directors
3 Corporate Information
5 Performance Highlights
11 Directors’ Report
51 Management Discussion And Analysis Report
68 Corporate Governance Report
85 Business Responsibility Report
Standalone Financial Statements
100 Independent Auditors’ Report
108 Balance Sheet
110 Statement of Profit and Loss
112 Notes forming part of the Financial Statements
164 Statement of Cash Flows
Consolidated Financial Statements
166 Independent Auditors’ Report on Consolidated Financial Statements
170 Consolidated Balance Sheet
172 Consolidated Statement of Profit and Loss
174 Notes forming part of the Consolidated Financial Statements
233 Statement of Consolidated Cash Flows
CMYK
2
Board of Directors
Mrs. Rajashree BirlaNon-Executive Director
Mr. Kumar Mangalam BirlaNon-Executive Chairman
Mr. Akshaya MoondraWhole Time Director and
Chief Financial Officer
Mr. Himanshu KapaniaManaging Director
Mr. Sanjeev AgaNon-Executive Director
Dr. Shridhir Sariputta Hansa WijayasuriyaNon-Executive Director
Mr. Arun ThiagarajanIndependent Director
Mrs. Alka M. BharuchaIndependent Director
Ms. Tarjani VakilIndependent Director
Mr. Baldev Raj GuptaIndependent Director(w.e.f. May 13, 2017)
Mr. P. MurariIndependent Director
Mr. Mohan GyaniIndependent Director

CMYK
3
Corporate Information
Managing DirectorMr. Himanshu Kapania
Whole Time Director andChief Financial OfficerMr. Akshaya Moondra
Company SecretaryMr. Pankaj Kapdeo
Statutory AuditorsDeloitte Haskins & Sells LLPChartered Accountants706, B Wing,ICC Trade Tower,Senapati Bapat Road,Pune-411 016
Cost AuditorsSanjay Gupta & AssociatesCost AccountantsC-4E/135, JanakpuriNew Delhi-110 058
Registered OfficeSuman Tower,Plot No. 18, Sector–11,Gandhinagar-382 011Gujarat
Corporate OfficeBirla Centurion, 10th FloorCentury Mills Compound,Pandurang Budhkar Marg,Worli,Mumbai-400 030
Registrar and Share Transfer AgentsBigshare Services Pvt. Ltd.E-2&3, Ansa Industrial Estate,Saki-Vihar Road,Sakinaka,Andheri (East),Mumbai-400 072
Websitehttp://www.ideacellular.com
Corporate Identity Number (CIN)L32100GJ1996PLC030976

CMYK
4

CMYK
5
Performance Highlights (Consolidated)
Revenue
2013 2014 2015 2016 2017
224.6
265.2
315.7
359.5 355.8
Cash Profits
2013 2014 2015 2016 2017
49.8
70.4
86.2
103.2
70.0
Net Profits
2013 2014 2015 2016 2017
10.1
19.7
31.9
27.3
-4.0
Operating EBITDA
2013 2014 2015 2016 2017
59.8
82.9
108.1
119.7
102.8
` Bn
Note : FY 2016 and FY 2017 are based on Ind AS Financial Statements

CMYK
6

CMYK
7
Performance Highlights (Consolidated)
Operating EBIDTA (%)
2013 2014 2015 2016 2017
26.6%
31.3%
34.2% 33.3%
28.9%
ROCE (%)
2013 2014 2015 2016 2017
6.1%
7.9%
8.9%
7.1%
2.0%
2013 2014 2015 2016 2017
4.87
2.15 2.44
1.27
3.21
Net Debt to Operating EBITDA
Debt Equity
2013 2014 2015 2016 2017
0.98
1.251.17
1.72
2.23
Note : FY 2016 and FY 2017 are based on Ind AS Financial Statements

CMYK
8
CMYK
9
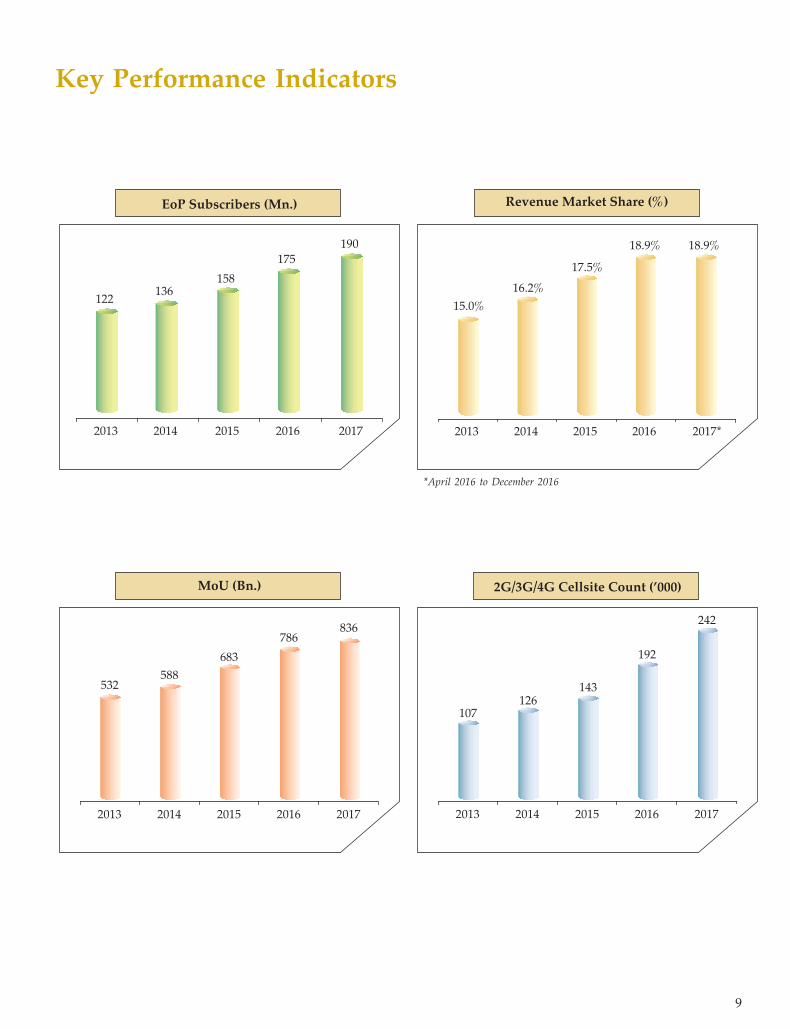
Key Performance Indicators
2013 2014 2015 2016 2017
122 136
158
175
190
EoP Subscribers (Mn.)
MoU (Bn.)
2013 2014 2015 2016 2017
532588
683
786836
2G/3G/4G Cellsite Count (’000)
2013 2014 2015 2016 2017
107126
143
192
242
2013 2014 2015 2016 2017*
15.0%
16.2%
17.5%
18.9% 18.9%
Revenue Market Share (%)
*April 2016 to December 2016

CMYK
10
C K
Annual Report 2016-17 11
Directors’ Report
Directors’ Report
Dear Shareholders,
We have pleasure in presenting the Twenty SecondAnnual Report, together with the audited financialstatements of the Company for the Financial Year endedMarch 31, 2017.
Company Overview
Your Company is the third largest mobile telecommunicationsoperator in the country, with Pan India operations offeringVoice, Broadband Data, Value Added Services (VAS), DigitalContent and Mobile Banking Services. The Revenue MarketShare (RMS) for your Company stands at 18.7% for the quarterended December 2016. As of February, 2017, the subscriberbase of your company stands at 196.1 Mn (on VLR), withsubscriber market share of 19.4%.
The GSM-based 2G services of your Company are availablein all 22 service areas of India, covering approximately 1 billionIndians, in nearly 400,000 towns and villages. In October 2016spectrum auction, your Company has acquired 349.2 MHz ofspectrum and completed its Pan India broadband spectrumfootprint. Your Company now owns 3G spectrum in 15 ServiceAreas and 4G spectrum in 20 Service Areas out of 22 ServiceAreas.
During the year your Company has launched 3G services in2 additional service areas of Bihar and Rajasthan on its ownspectrum, taking the total count to 15 from earlier 13. However,the 3G services of your Company are available in 21 ServiceAreas (excluding Odisha) including through intra-circleroaming arrangements with other mobile telecommunicationsservice providers. On 4G front, your Company has rolled out4G services in 9 new service areas during the year. The 4Glaunch in Mumbai service area is slated by end of May, 2017,post which the 4G services of your Company will be availablein 20 Service Areas (Except Kolkata and Delhi).
Your Company also holds licenses to offer NLD, ILD and ISPservices and registration for IP-1 services. While the NLD andISP services mainly cater to the captive needs of the Company,the ILD and IP-1 services cater to external customers as well.
Financial Results
The financial statements of the Company have been preparedin accordance with the Indian Accounting Standards (Ind AS)notified under section 133 of the Companies Act, 2013 readwith Companies (Accounts) Rules, 2014. The financialstatements for the Financial Year ended March 31, 2017 arethe Company’s first Ind AS compliant annual financialstatements with comparative figures for the year ended March31, 2016 also under Ind AS. The date of transition is April 1,2015. The disclosure and effects of first time adoption of IndAS are detailed in Note 5 of the standalone financial statementsand Note 6 of the consolidated financial statements for detaileddisclosure and effects on the first time adoption of Ind AS.
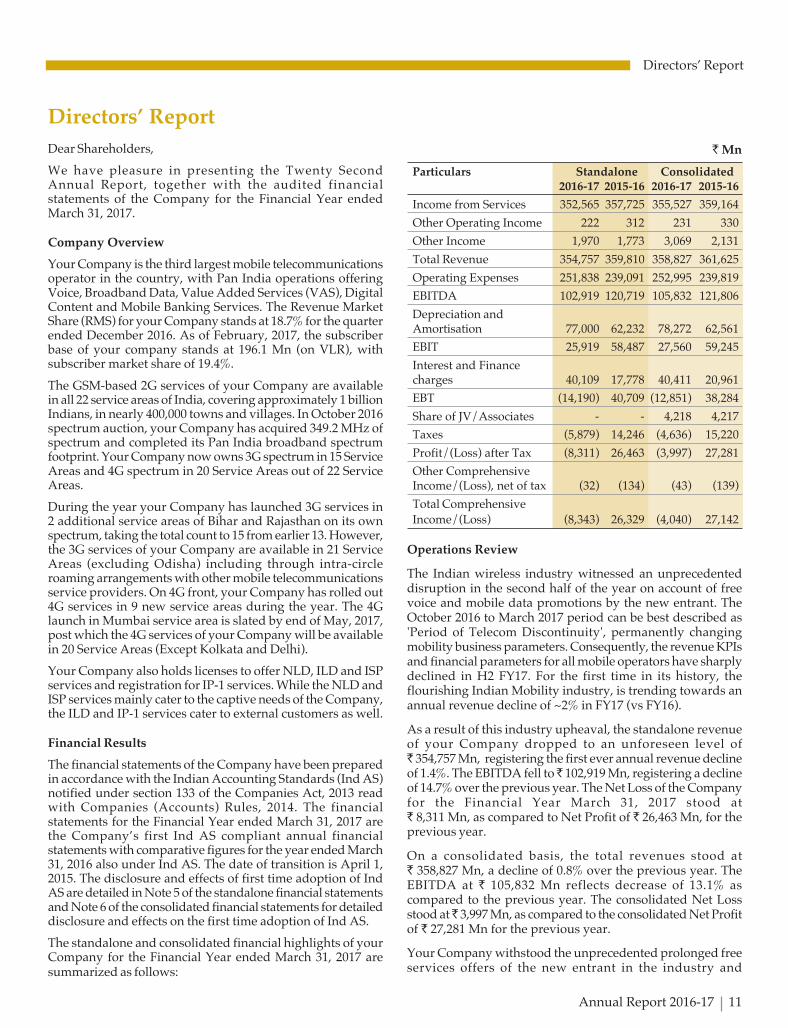
The standalone and consolidated financial highlights of yourCompany for the Financial Year ended March 31, 2017 aresummarized as follows:
` Mn
Particulars Standalone Consolidated2016-17 2015-16 2016-17 2015-16
Income from Services 352,565 357,725 355,527 359,164
Other Operating Income 222 312 231 330
Other Income 1,970 1,773 3,069 2,131
Total Revenue 354,757 359,810 358,827 361,625
Operating Expenses 251,838 239,091 252,995 239,819
EBITDA 102,919 120,719 105,832 121,806
Depreciation andAmortisation 77,000 62,232 78,272 62,561
EBIT 25,919 58,487 27,560 59,245
Interest and Financecharges 40,109 17,778 40,411 20,961
EBT (14,190) 40,709 (12,851) 38,284
Share of JV/Associates - - 4,218 4,217
Taxes (5,879) 14,246 (4,636) 15,220
Profit/(Loss) after Tax (8,311) 26,463 (3,997) 27,281
Other ComprehensiveIncome/(Loss), net of tax (32) (134) (43) (139)
Total ComprehensiveIncome/(Loss) (8,343) 26,329 (4,040) 27,142
Operations Review
The Indian wireless industry witnessed an unprecedenteddisruption in the second half of the year on account of freevoice and mobile data promotions by the new entrant. TheOctober 2016 to March 2017 period can be best described as'Period of Telecom Discontinuity', permanently changingmobility business parameters. Consequently, the revenue KPIsand financial parameters for all mobile operators have sharplydeclined in H2 FY17. For the first time in its history, theflourishing Indian Mobility industry, is trending towards anannual revenue decline of ~2% in FY17 (vs FY16).
As a result of this industry upheaval, the standalone revenueof your Company dropped to an unforeseen level of` 354,757 Mn, registering the first ever annual revenue declineof 1.4%. The EBITDA fell to ̀ 102,919 Mn, registering a declineof 14.7% over the previous year. The Net Loss of the Companyfor the Financial Year March 31, 2017 stood at` 8,311 Mn, as compared to Net Profit of ` 26,463 Mn, for theprevious year.
On a consolidated basis, the total revenues stood at` 358,827 Mn, a decline of 0.8% over the previous year. TheEBITDA at ` 105,832 Mn reflects decrease of 13.1% ascompared to the previous year. The consolidated Net Lossstood at ̀ 3,997 Mn, as compared to the consolidated Net Profitof ` 27,281 Mn for the previous year.
Your Company withstood the unprecedented prolonged freeservices offers of the new entrant in the industry and

C K
12 Idea Cellular Limited
Directors’ Report
maintained its tag of 'One among the Top Three' operators inIndia. Your Company continues to maintain and strengthenits market position both in terms of Revenue and Subscribers.
Despite the free voice and data services by new operator yourCompany continues to maintain its attractiveness forsubscribers. As on February 28, 2017, the reported subscriberbase of your Company was 193.3 Mn, an increase of 18.6 Mnsubscribers representing a growth of 10.7% over last 12 monthperiod. The VLR subscriber base of your Company grew by7.5% during same period and stands at 196.1 Mn representingmarket share of 19.4% as on February 28, 2017. Percentageof active subscriber base to total subscriber base for yourCompany stands at 101.4%. With over 198 Mn VLRsubscribers in March, 2017, the Company opens multiplevistas for growth in Broadband, Digital Content and PaymentServices etc.
As per latest published TRAI reports, your Company hasgained 29.3% incremental Revenue Market Share (RMS) ofthe Indian mobile telecommunication service industry duringnine months period from April, 2016 to December, 2016.Further, your Company maintained its leadership position inMobile Number Portability (MNP), based on the net subscriberadditions. The trends emerging from MNP are clearlydistinguishing the strong operators in terms of customerpreference for better quality of services and brand value. Ason March 31, 2017, your Company has net MNP gain of22.1 Mn subscribers, with one out of every four existing mobilecustomers, who ports out from their existing mobile operatorpreferring to shift and stay with world class Idea services.
Your Company carried 836 billion voice minutes on its networkduring Financial Year 2016-17, a growth of 6.4% compared to786 billion minutes in previous year. The total data usage of436 billion MB registered a growth of 46.5%, compared toprevious year.
Your Company continues to invest in the long term valuecreators and remains committed towards increasing itsgeographical coverage as well as improve the capacity ofnetwork to address the growing demand of both voice anddata. Over the last two financial years (2015-16 & 2016-17),your Company has expanded its telecom infrastructure by 69%adding 98,882 network sites (2G+3G+4G), including nearlyquadrupling its wireless broadband sites (3G+4G) from 30,291in March 2015 to 110,054 in March 2017.
During the year, your Company added a total of 50,004 sitesacross 2G, 3G and 4G, highest ever site addition by theCompany in a year. On the 2G front Company added 4,6532G sites, expanding the 2G site count to 131,486 as of March31, 2017. 2G services are now available in nearly 400,000 townsand villages covering around 1 billion Indians, representingapproximately 82% of Indian population. On 3G front, yourCompany added 19,142 sites, expanding the 3G site count to69,202. 3G services of your Company are now available in morethan 92,000 towns and villages covering more than 45% ofpopulation in 15 service areas where it is providing 3G serviceswith own spectrum.
Further, your Company after launch of its 4G services onDecember 23, 2015 has rapidly expanded its presence and ason March 31, 2017, offers 4G Services in 19 service areas on itsown spectrum and is slated to introduce 4G services in 20thservice area of Mumbai telecom service area in May, 2017.Idea added 26,209 4G sites across these 19 service areas duringthe year, taking the total 4G site count to 40,852. The 4Gservices are now available in more than 23,000 towns andvillages covering 23% of population in these 19 service areas.
Your Company is rapidly working in expanding its Optical FibreCable (OFC) backbone network, to support growth forbroadband data services. During the year your Companyexpanded its OFC transmission network to 144,600 km comparedto 115,500 km a year ago, an expansion of 29,100 km.
Dividend
As your Company has incurred a net loss during theyear, your Directors have not recommended any dividend forthe year.
Changes in Share Capital
During the year under review, your Company issued andallotted 4,818,853 Equity Shares of ̀ 10/- each, fully paid-up,to the Option/ RSU grantees pursuant to the exercise of StockOptions/Restricted Stock Units (RSU’s) by the eligibleemployees under the Employee Stock Options Scheme, 2006(ESOS-2006) and Employee Stock Option Scheme, 2013(ESOS-2013).
Consequent to the above, the issued, subscribed and paid-upEquity Share capital of your Company as on March 31, 2017stood at ̀ 36,05,32,82,310/- comprising of 3,60,53,28,231 EquityShares of ` 10/- each.
Borrowings
During the year under review, your Company raised` 70,000 Mn through issuance of Non-Convertible Debentures(NCDs) at face value of ` 1 Mn each on private placementbasis. NCDs issued by the Company carry a coupon rangingfrom 7.57% to 8.12%. Further, the said NCDs have tenure of5 years to 7 years and all the NCDs are listed on the WDMSegment of National Stock Exchange of India Limited.
The details of repayments / pre-payments of loans anddeferred payment obligations towards Department ofTelecommunications during the year are as under:
Scheduled Repayments:
(i) Rupee Loans of ` 5,225 Mn;
(ii) External Commercial Borrowing of USD 127 Mn; and
(iii) Deferred Payment Liability amounting to ` 16,919 Mn.
Pre-payments:
(i) Rupee Loans of ` 1,800 Mn; and
(ii) Deferred Payment Liability amounting to ` 17,530 Mn.
In addition to this, an amount of USD 64 Mn ExternalCommercial Borrowing was primarily refinanced for loweringthe cost of borrowing and an amount of ` 11,100 Mn wasborrowed and repaid in the form of Inter Corporate Depositfrom Aditya Birla Telecom Ltd., a wholly owned subsidiary.
C K
Annual Report 2016-17 13
Directors’ Report
Capital Expenditure
Your Company continues to expand its telecommunicationinfrastructure on 2G, 3G and 4G technology and Optical FibreCable (OFC) transmission backbone network (own andthrough IRU arrangements with other companies) along withbuilding core subscriber and traffic capacities as required. YourCompany's telecom network now offers its GSM servicescovering over 1 billion Indians in nearly 4,00,000 towns andvillages. Further, your Company's mobile broadband servicesare now available to approximately 500 million Indians acrossnearly 1,00,000 towns and villages in 21 service areas.
During the Financial Year 2016-17, in addition to` 130,569 Mn incurred for fresh spectrum procurement, thecapital expenditure (including capital advances) incurredduring the year was ̀ 77,653 Mn and ̀ 78,407 Mn at standaloneand consolidated levels respectively.
Deposits
Your Company has not accepted any fixed deposits and, assuch, no amount of principal or interest was outstanding, ason the date of the Balance Sheet.
Credit Rating
Your Company enjoys credit rating of ‘CARE AA+’ for its LongTerm borrowings and Non-Convertible Debentures and CAREA1+ for its short term debt program. On the outlook front,CARE has assigned the outlook of ‘Credit Watch withdeveloping implications’. Additionally, BrickworkRatings has assigned credit rating of “BWR AA+” with StableOutlook for Non-Convertible Debentures amounting to` 1,000 crore.
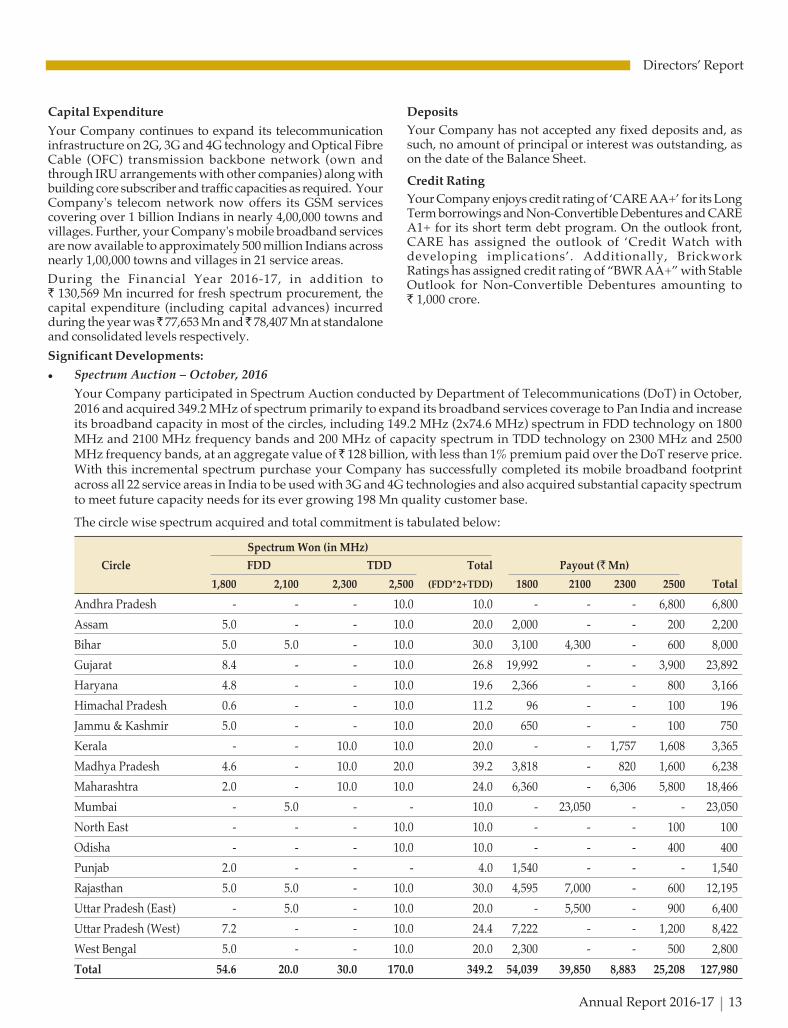
Spectrum Won (in MHz)
Circle FDD TDD Total Payout (` Mn)
1,800 2,100 2,300 2,500 (FDD*2+TDD) 1800 2100 2300 2500 Total
Andhra Pradesh - - - 10.0 10.0 - - - 6,800 6,800
Assam 5.0 - - 10.0 20.0 2,000 - - 200 2,200
Bihar 5.0 5.0 - 10.0 30.0 3,100 4,300 - 600 8,000
Gujarat 8.4 - - 10.0 26.8 19,992 - - 3,900 23,892
Haryana 4.8 - - 10.0 19.6 2,366 - - 800 3,166
Himachal Pradesh 0.6 - - 10.0 11.2 96 - - 100 196
Jammu & Kashmir 5.0 - - 10.0 20.0 650 - - 100 750
Kerala - - 10.0 10.0 20.0 - - 1,757 1,608 3,365
Madhya Pradesh 4.6 - 10.0 20.0 39.2 3,818 - 820 1,600 6,238
Maharashtra 2.0 - 10.0 10.0 24.0 6,360 - 6,306 5,800 18,466
Mumbai - 5.0 - - 10.0 - 23,050 - - 23,050
North East - - - 10.0 10.0 - - - 100 100
Odisha - - - 10.0 10.0 - - - 400 400
Punjab 2.0 - - - 4.0 1,540 - - - 1,540
Rajasthan 5.0 5.0 - 10.0 30.0 4,595 7,000 - 600 12,195
Uttar Pradesh (East) - 5.0 - 10.0 20.0 - 5,500 - 900 6,400
Uttar Pradesh (West) 7.2 - - 10.0 24.4 7,222 - - 1,200 8,422
West Bengal 5.0 - - 10.0 20.0 2,300 - - 500 2,800
Total 54.6 20.0 30.0 170.0 349.2 54,039 39,850 8,883 25,208 127,980
Significant Developments:
l Spectrum Auction – October, 2016
Your Company participated in Spectrum Auction conducted by Department of Telecommunications (DoT) in October,2016 and acquired 349.2 MHz of spectrum primarily to expand its broadband services coverage to Pan India and increaseits broadband capacity in most of the circles, including 149.2 MHz (2x74.6 MHz) spectrum in FDD technology on 1800MHz and 2100 MHz frequency bands and 200 MHz of capacity spectrum in TDD technology on 2300 MHz and 2500MHz frequency bands, at an aggregate value of ̀ 128 billion, with less than 1% premium paid over the DoT reserve price.With this incremental spectrum purchase your Company has successfully completed its mobile broadband footprintacross all 22 service areas in India to be used with 3G and 4G technologies and also acquired substantial capacity spectrumto meet future capacity needs for its ever growing 198 Mn quality customer base.
The circle wise spectrum acquired and total commitment is tabulated below:

C K
14 Idea Cellular Limited
Directors’ Report
Idea Spectrum Holding
Service Areas FDD TDD FDD GSM Broadband Carrier
900 1800 2100 Total 2300 2500 Total (2x)* (2G) 3G 4G+TDD services
Maharashtra 9.0 11.0 5.0 25.0 10.0 10.0 20.0 70.0 P 2 5
Kerala 6.0 10.0 5.0 21.0 10.0 10.0 20.0 62.0 P 1 5
Madhya Pradesh 7.4 11.6 5.0 24.0 10.0 20.0 30.0 78.0 P 2 7
Uttar Pradesh (West) 5.0 9.4 5.0 19.4 10.0 10.0 48.8 P 1 4
Gujarat 5.0 10.0 5.0 20.0 10.0 10.0 50.0 P 1 4
Andhra Pradesh 5.0 6.0 5.0 16.0 10.0 10.0 42.0 P 1 3
Punjab 5.6 10.0 5.0 20.6 41.2 P 1 2
Haryana 6.0 10.8 5.0 21.8 10.0 10.0 53.6 P 1 4
8 Leadership Circle(Sub Total) 49.0 78.8 40.0 167.8 30.0 80.0 110.0 445.6 10 32
Uttar Pradesh (East) 6.2 10.0 16.2 10.0 10.0 42.4 P 1 3
Rajasthan 11.2 5.0 16.2 10.0 10.0 42.4 P 1 3
Bihar 10.80 5.0 15.8 10.0 10.0 41.6 P 1 3
Himachal Pradesh 9.8 5.0 14.8 10.0 10.0 39.6 P 1 3
Delhi 5.0 8.6 13.6 27.2 P 1 0
Mumbai 6.4 5.0 11.4 22.8 P 1
Karnataka 5.0 6.0 11.0 22.0 P 1
7 Emerging Circle(Sub Total) 10.0 59.0 30.0 99.0 40.0 40.0 238.0 5 12
Tamil Nadu 11.4 11.4 22.8 P 1
Kolkata 5.0 5.0 10.0 20.0 P 1
West Bengal 11.4 11.4 10.0 10.0 32.8 P 3
Odisha 10.0 10.0 10.0 10.0 30.0 P 3
Assam 10.0 10.0 10.0 10.0 30.0 P 3
North East 11.0 11.0 10.0 10.0 32.0 P 3
Jammu & Kashmir 10.0 5.0 15.0 10.0 10.0 40.0 P 1 3
7 New Circle(Sub Total) 68.8 10.0 78.8 50.0 50.0 207.6 2 14
Total 22 Circle 59.0 206.6 80.0 345.6 30.0 170.0 200.0 891.2 22 17 57
*FDD spectrum consisting of uplink and downlink
5 MHz of paired FDD spectrum = 1 carrier, 10 MHz of unpaired TDD spectrum =1.5 carrier.
Post October, 2016 spectrum auction, your Company's overall spectrum holding has expanded to 891.2 MHz including 108MHz on 900 MHz, 413.2 MHz on 1800 MHz, 160 MHz on 2100 MHz, 30 MHz on 2300 MHz and 170 MHz on 2500 MHzto be used for expanding coverage and capacity for Idea on 2G, 3G & 4G services using GSM, HSPA and LTE technologiesrespectively. The below table provides circle-wise and band-wise spectrum holding for your Company.

C K
Annual Report 2016-17 15
Directors’ Report
l Launch of Digital Idea
On January 30, 2017 your Company announced its arrivalinto the digital world with launch of 3 new exciting MobileApps - Idea Music Lounge, Idea Movie Club and IdeaGame Spark - giving birth to a "Digital Idea". The newsuite of integrated Digital Apps provides one of the bestranges of entertainment content to your Company's192 Million plus customer base. These Apps deliver worldclass user experience in domains that are 'telecomadjacencies' viz. Music, Movies, Live TV and Gaming. TheDigital Idea movement will not only digitize our existingprocesses and strengthen them, but will also build theCompany's capability for future marking first entry ofIdea into internet based economy. Within first 60 days ofintroduction of digital entertainment applications around1.5 million customers started to enjoy Idea's digital contentservices including approximately 5,50,000 customers onIdea Music App, around 2,75,000 customers on IdeaMovie Club App and around 5,00,000 customers on IdeaGame Spark App.
A growing percentage of Idea's existing customers preferprepaid recharges, postpaid payments and productactivations on the Company's digital channels and yourCompany remains committed to push online adoptioneven further, in line with our Prime Minister's Digital Indiavision. Your Company has been constantly driving DigitalEnablement by augmenting the capabilities on its Websiteand simplifying 'My Idea' mobile application. As onMarch 31, 2017, over 10 Mn Idea subscribers haveinstalled 'My Idea' mobile application for self-care andproduct purchases.
Similarly to keep pace with changing customerexpectations and ensuring seamless customer experienceat all times, your Company has embarked on 'Customer
Experience Management' and advanced analytics journeyduring the year. This enables delivery of a superiorcustomer experience for mobile broadband and dataservices and proactive customer care practices throughaccurate diagnostics leading to higher up-time and aneven higher satisfaction for its customers.
l 4G Launch
Your Company now provides 4G services in 19 serviceareas, with 7 new service areas launched through1800 MHz spectrum in Gujarat, Uttar Pradesh (West),Bihar, Rajasthan, West Bengal, Assam and Jammu &Kashmir and 1 service area of Uttar Pradesh (East)launched on 2100 MHz integrating spectrum acquired inOctober, 2016. Launch of 4G services in Mumbai servicearea is scheduled in Q1 FY18 through 2100 MHzfrequency band. In the October, 2016 Spectrum Auction,your Company won 2*54.6 MHz spectrum block in 1800frequency band and 20 MHz in 2100 MHz frequencyband including 4G LTE compatible contiguous blocks of5 MHz in 9 service areas and 3G spectrum in 2 service
areas. Further in October 2016 auctions, your Companywon additional capacity of 30 MHz in three service areasin 2300 MHz band and 170 MHz in 16 service areas in2500 MHz band. As at end of March 2017, your Companyprovides 4G coverage to 272 million Indian populationwith 40,852 sites across 23,000 towns and villages. Postlaunch of 4G services in 9 new service areas and 3G in2 new service areas, the broadband service offerings(3G / 4G) of your Company now covers 21 service areason its own broadband spectrum, ~96.5% of Idea revenueand ~93.5% of Industry revenue (As per Q3 TRAIreported revenue) and more than 500 million Indians.
l Paperless E-KYC Activations
Taking the digital dream of our Honorable Prime Ministerforward, your Company has enabled Aadhar BasedBiometric new subscriber activations which not onlybenefit the customer with instant and paperless activationbut also helps the economy by reducing carbon footprint.As on year end your Company had moved 85% prepaidactivations to E-KYC activations and is targeting to reach95% at the earliest.
l Launch of FTTH services
Your Company has ventured into Wireline broadbandservices to provide ultra-high speed broadband servicesat customers' home through FTTH (Fiber-to-the-home)technology. In the month of March, 2017, FTTH servicewas launched in select premium housing societies in thecity of Pune with speeds ranging from 20 Mbps to200 Mbps. This FTTH service is capable of delivering upto1 Gbps speeds in near future. The new service is fullyscalable to deliver multi-play product and services. Thisend-to-end fully underground OFC network in Pune, isalso scalable to deliver multi-play product and services,as Idea’s FTTH is integrated on its own. The expansionof FTTH services will be linked to business performanceand experience from Pune. With this initiative, yourCompany endeavors to stay ahead and provide highspeed internet access in the connected world with relevantproducts and services to cater to emerging marketopportunities.
l Merger of Idea Mobile Commerce Services Limited with
Aditya Birla Idea Payments Bank Limited
To comply with the Reserve Bank of India (RBI) guidelineson Payments Bank, Idea Mobile Commerce ServicesLimited (IMCSL), wholly owned subsidiary of theCompany had filed a petition under section 391 to 394 ofthe Companies Act, 1956 with Hon’ble High Court ofDelhi at New Delhi for its amalgamation with Aditya BirlaIdea Payments Bank Limited (ABIPBL) an associateCompany, which had also filed similar petition in theHon’ble Bombay High Court. The Hon’ble High Courtof Bombay and the Hon’ble High Court of Delhi at NewDelhi have sanctioned the Scheme of Amalgamation vide

C K
16 Idea Cellular Limited
Directors’ Report
their orders dated December 9, 2016 and January 3, 2017respectively. The said scheme of amalgamation isconditional to be effective upon receipt of certainapprovals/authorization from RBI. ABIPBL has receivedlicense from RBI to carry on Payments Bank business andhas also received authorization to carry on PPI business.The business of IMCSL shall be folded into ABIPBL asand when ABIPBL is ready to commence its operations,for which permission is yet to be received from RBI.
l Distribution of assets with consequent reduction in share
capital of Aditya Birla Telecom Limited, a wholly-
owned subsidiary
During the year, Aditya Birla Telecom Limited (ABTL), awholly owned subsidiary of the Company, receivedapproval of the Hon’ble High Court of Bombay for itsapplication under section 100 of the Companies Act, 1956,for distribution of assets with consequent reduction inshare capital held by P5 Asia. Pursuant to this, P5 Asiaholds direct equity stake of 4.85% in Indus Towers Ltd.and their stake in ABTL is extinguished.
l Merger of Vodafone India Limited and Vodafone Mobile
Services Limited with the Company
The Board of Directors of your Company had at itsMeeting held on March 20, 2017, approved merger ofVodafone India Limited (VIL) and Vodafone MobileServices Limited (VMSL) with your Company (Idea). Thesaid merger shall be subject to receipt of necessaryapprovals of shareholders and creditors, SEBI, StockExchanges, National Company Law Tribunal, theCompetition Commission of India, Department ofTelecommunications, Foreign Investment PromotionBoard, Reserve Bank of India and other governmentalauthorities as may be required.
Key Highlights of the Merger of VIL and VMSL with Idea areas under:
– Entire business of VIL and VMSL (excluding VIL’sinvestment in Indus Towers Ltd., and their certaininternational network assets and informationtechnology platforms which will be disposed of priorto the merger being effective) will vest in theCompany.
– Merged company shall be governed by theshareholders agreement. Both Vodafone Group andexisting promoters of Idea shall exercise joint controlin the merged company. Share exchange ratioconsidered for the purpose of merger scheme isconsistent with recommendations of jointindependent valuers.
– Post implementation of the composite scheme ofamalgamation and arrangement under the
applicable provisions of the Companies Act, 2013,Vodafone Group and existing Promoters of Idea(i.e. Aditya Birla Group and its affiliates) will hold45.1% and 26% of the equity share capital of themerged company, respectively and the balance28.9% will be held by the public shareholders. Witha view to equalizing the shareholdings of theVodafone Group and existing Promoters of Idea overa period of time, the existing Promoters of Idea havethe right to acquire upto 9.5% additional stake fromVodafone Group under an agreed mechanism. IfVodafone Group and the existing Promoters of Ideado not have equal shareholding by the expiry of the4th year from completion of the amalgamation,Vodafone Group is obliged to reduce its holding inorder to equalise its shareholding with that of theexisting Promoters of Idea over the following 5 yearperiod.
– Until equalization is achieved the additional sharesheld by Vodafone Group will be restricted and voteswill be exercised jointly under the terms of theshareholder’s agreement.
– Existing Promoters of Idea and Vodafone Groupshall have the right to nominate 3 directors each. TheBoard will include Independent Directors as requiredunder law;
– Existing Promoters of Idea have the sole right toappoint the Chairman. The appointment of the ChiefExecutive Officer and the Chief Operation Officerwill require the approval of both the existingPromoters of Idea and the Vodafone Group.Vodafone Group has the right to appoint the ChiefFinancial Officer of the merged company;
– Certain critical matters of the merged company suchas the issue of shares otherwise than on a rights basis,consolidation, subdivision or reclassification of sharecapital, liquidation, amendments to the constitutionaldocuments, entry into related party transactions,change to the name or key brands or brandingstrategy of the company, etc. are subject to theaffirmative consent of the existing Promoters of Ideaand Vodafone Group; and
– The Combination of Idea and Vodafone will createthe scale to meet customer’s rapidly acceleratingdemand for data consumption and enable significantefficiencies. Run rate operating cost and capexsynergies are expected to reach INR 140 billion onannual basis by the fourth full year post completion.
The Board of Directors of your Company believes thatthe proposed amalgamation will result in, amongst others,the following:
– Creation of largest Indian telecom operator withwidest mobile network in the country and Pan India3G /4G footprint;

C K
Annual Report 2016-17 17
Directors’ Report
– Sufficient spectrum to compete in the market whileoffering innovative and attractively priced mobileservice to customers;
– Acceleration of expansion of wireless broadbandnetworks across India to deliver the Government ofIndia’s ‘Digital India’ mission;
– Substantial operating cost and capex synergiescreating value for shareholders; and
– Leveraging the customer’s affinity for both theexisting brands.
Awards and Recognitions
Some key awards and recognitions received by your Companyare:
l Idea was voted by investors as one of the Top 10 Asia’sBest Companies in 2017 in a poll conducted by FinanceAsia magazine, in the categories of (i) Best CEO (ii) BestCFO (iii) Most Committed to Corporate Governance(iv) Best at CSR and (v) Best at Investor Relations.
l Idea won the ET Telecom Award 2017 for the ‘BestEnterprise Mobility Service Provider’ for LogisticsTracking Solution.
l Idea won the ‘Golden Peacock Award’ for CorporateSocial Responsibility for being the best in CSR, amongIndian Telecom Companies.
l Idea won Voice & Data Telecom Leadership Awards 2016in the following categories: (i) CTO of the Year Awardfor the company’s record breaking network rollout in 2016(ii) Highest Subscriber Additions in 2016 in Maharashtra& Goa and Madhya Pradesh & Chhattisgarh circles(iii) Enterprise Business Award for Workforce TrackingManagement Solution (iv) Customer Service Award forCentre Management System (v) VAS Award for USSD*191# portal (vi) Marketing Award for Pooling product(vii) Internet & Broadband Award for Internet for Allinitiative Infrastructure Innovation Award for Telematicsproduct on IOT by ICISL.
l Idea bagged the Business world Golden Cart Summit andAwards 2016 for India’s most preferred brand in thecategory of ‘Telecommunication Services’.
l Idea was recognized among ‘Top 25 Best Companies toWork’ in 2016 by Business Today.
l Idea won GSMA Chairman’s Award for collectivelyenabling ‘Mobile Connect’ in India.
l Idea was ranked amongst the ‘Buzziest Brands of theYear’ in 2016 and rated among Top 3 Brands in ‘Telecom’category by afaqs.
New Initiatives
During the year under review, your Company together withits subsidiaries made extensive progress on the marketing andcustomer care front by entering into various alliances,
introducing various innovative products and services. Someof these are:-
l To announce launch of 4G services, your Companylaunched the “Biggest Small Change” campaign with afocus on upgrading customers from 2G/3G to 4G. Thecampaign leveraged the insight that for those who liveonline, a small change in technology could make a bigimpact on their online experience. 4G revolutionized thedigital experience for consumers who could now makeseamless video calls, stream videos on the go, playmultiplayer games, watch movies in HD and stream alltheir favourite music on their mobile. This was a highdecibel campaign across all mediums including TV, Radio,Outdoor and Digital, amongst others.
l Your Company has always been the pioneer in terms ofpropagating the use of mobile internet. Therefore, to getmore customers online, your Company had to tackle theissue of internet relevance. The ‘Get India Online’campaign encouraged existing Internet users to share freeInternet benefits with non-Internet users and get morepeople into the data fold and share the advantages ofbeing online. The campaign was truly innovative as itcreated a new currency for sharing. To support thisproduct initiative, your company launched acommunication campaign `Internet for all’. BesidesTelevision, this campaign was amplified via mediaintegrations on Radio & Digital.
l After launching Idea 4G with the Biggest Small Changecampaign, your Company democratized 4G in the“Reverse Migration” campaign to focus on the fact that4G transcends all boundaries and is truly for everyone.One of the biggest issues India faces today is lack ofopportunities in Rural and small town India. People leavethe comfort of their homes and find shelter in alreadyovercrowded cities impacting the lives of both themigrants & the residents, breaking up families, increasingthe gap between the developments of the cities versusthe development of the villages. Idea 4G was positionedas the new-age infrastructure that would bringopportunities to every Indian across the country andcould bridge the gap between urban and rural India. WithIdea 4G creating opportunities in villages, every villagewould now prosper like a city, thus creating a movementof “Reverse Migration” from urban to rural India.
l Your Company launched digital services with the launchof three unique apps, Music Lounge, Game Spark andMovie Club. Idea customers can now enjoy a host ofentertainment services with these apps. As of March 31,2017, around 1.5 million subscribers enjoy the new digitalcontent services.
l Your Company launched Long term plans for subscribersthat not only made Internet more affordable but alsoensured long term engagement of customers. These packscame with the commitment of offering data at the rate ofjust ` 50/GB.

C K
18 Idea Cellular Limited
Directors’ Report
l Your Company introduced data pack offering 1GB/dayfor postpaid 4G handset users. This was a first of its kindoffer with such a huge benefit to a large base of postpaidcustomers in India. The package was designed to catalysedata usage amongst existing customers and to attractmore postpaid customers to the Idea network.
l For increased usage and adoption of 4G technology, yourCompany encouraged its customers to upgrade to a 4GHandset and 4G SIM with innovative offers. Uponupgrading to a 4G handset, customers got 10 GB data forthe price of 1GB. Upon upgrading to a 4G SIM, 4G handsetcustomers could get up to 4GB data free.
l Your Company initiated an engagement drive for MyIdeaApp; for checking the pack status and doing rechargeData users were incentivized through better benefits onrecharge through MyIdea App. Subscribers were notifiedabout offers that were tailor made for each subscriber.As a result of this initiatives within 3 months, Appdownloads increased by 9%, App recharge revenueincreased by 6%, App active users increased by 18%.
l Your Company launched industry first offers with themost prominent and leading e-commerce players Flipkartand Amazon. Also Idea’s website now partners withAmazon & Flipkart and offers handpicked popularhandsets with propositions that bring significant valueto customers and enhance 4G penetration.
l For Data users your Company launched 4G netsetter(dongle), Smart Wi-Fi hub and Home Wi-Fi, which areavailable at competitive price with compelling data plansat select Idea stores across the country.
l While working towards strengthening the digitaleconomy, your Company became the first operator inIndia to introduce carrier billing on Google Play Store.Idea customers can now buy various apps, e-books,movies, music etc. available on Google Play Store bypaying through their prepaid balance or postpaid bill.
l Your Company worked with GSMA and 5 other Indianoperators for launching Mobile Connect - a secured wayof authentication. Your Company became the first Indianoperator to have a working customer facing app, byenabling mobile connect login in the MyIdea App.
l Your Company launched Opera games club service withOpera. Idea Games Club is a subscription based appdistribution model. Once the user has subscribed to theservice, user can download Games Spark app and getaccess to unlimited downloads of exceptional gamingcontent. The store contains premium content which has4+ rating in Google play store.
l Idea now allows its net savvy customers to interact withcustomer care professionals online. Targeted to serveselect high end Prepaid & Postpaid Customers, the LiveChat Solution is currently positioned to assist our “onlineusers” during their Recharge, Bill Payment & Self Carethrough Idea Cellular website.
l Delivering superior customer experience is a key pillar ofsustainable growth and profitability. To consistentlydeliver a high quality customer experience requires anyorganization to be completely Customer Centric. YourCompany is committed to the philosophy of designingit’s product and service offerings from the point of viewof the customer. Your Company has been doing thisthrough understanding and meeting customerexpectations with help of various Feedback programs,direct VOC listening programs and in this year, launcheda company-wide Hello Bosstomer program, aimed atharnessing the collective employee knowledge andideation capabilities to devise actions towards improvingcustomer experience and thereby, creating a trueCustomer-Centric culture across the company.
l Your Company also scaled up digital governance at MyIdea stores. An app-based governance system waslaunched which can be used by field staff to track thestores and customer interactions leading to more activeand real-time training need identification.
Subsidiaries, Joint Ventures and Associates
As on March 31, 2017, your Company has five subsidiarycompanies, one joint venture company and one Associatecompany, details whereof are as under:
Subsidiaries
l Aditya Birla Telecom Limited, is engaged in the tradingof mobility devices and holds 11.15% shareholding inIndus Towers Limited (Indus) as on March 31, 2017.
l Idea Cellular Services Limited, provides manpowerservices to the Company.
l Idea Cellular Infrastructure Services Limited, is a towerCompany owning telecom towers of your Company inall the 22 service areas.
l Idea Telesystems Limited, is engaged in the trading ofmobility devices.
l Idea Mobile Commerce Services Limited (IMCSL) isengaged in operating Prepaid Payment Instruments inIndia. IMCSL is in the process of being amalgamated withABIPBL. Business of IMCSL shall be folded into ABIPBLas and when ABIPBL is ready to commence its operations,for which permission is yet to be received from RBI.
Joint Venture Company
l Indus Towers Limited, in which Aditya Birla TelecomLimited (ABTL - a wholly-owned subsidiary of theCompany) holds 11.15% stake, continues to be a jointventure with the Bharti Group and Vodafone Group andprovides passive infrastructure services in 15 serviceareas. Following the direct stake by P5 Asia of 4.85%, thestake of ABTL in Indus stands at 11.15% from 16% heldat the beginning of the year.

C K
Annual Report 2016-17 19
Directors’ Report
Associate Company
l Aditya Birla Idea Payments Bank Limited (ABIPBL), isan Associate Company wherein your Company currentlyholds 9.84% of the equity capital and the balance is heldby Aditya Birla Nuvo Limited. Upon merger of IMCSLwith ABIPBL, your Company will ultimately hold 49% ofthe equity capital and balance 51% of the equity capitalwill be held by Aditya Birla Nuvo Limited. ABIPBL hasreceived banking license for carrying on the business ofPayments Bank from Reserve Bank of India (RBI) on 3rd
April, 2017 and has also received an authorisation to carryon the business of Prepaid Payments Instrument business.ABIPBL is in the process of launching its operationscommercially.
In accordance with the provisions contained in section 136(1)of the Companies Act, 2013 (Act), the Annual Report of theCompany, containing therein its standalone and theconsolidated financial statements are available on theCompany’s website www.ideacellular.com.
Further, pursuant to the said requirement, the financialstatements of each of the aforesaid subsidiary companies areavailable on the Company’s website www.ideacellular.comand shall be available for inspection during business hours atthe Registered Office of the Company. Any member who isinterested in obtaining a copy of the financial statements maywrite to the Company Secretary at the Registered Office ofthe Company.
In terms of provisions contained in Section 129(3) of the Act,read with Rule 5 of the Companies (Accounts) Rules, 2014, areport on the performance and financial position of each ofthe subsidiaries and joint venture companies is provided as‘Annexure A’ to this report.
Consolidated Financial Statements
In accordance with the provisions of Section 129(3) of theCompanies Act, 2013 and Regulation 34 of the SEBI (ListingObligations & Disclosure Requirements) Regulations, 2015, theConsolidated Financial Statements forms part of this AnnualReport and shall also be laid before the ensuing Annual GeneralMeeting of the Company. The Consolidated FinancialStatements have been prepared in accordance with the IndianAccounting Standards (IND AS) notified under section 133 ofthe Companies Act, 2013 read with Companies (Accounts)Rules, 2014. The consolidated financial statements for thefinancial year ended March 31, 2017 are the Company's firstIND-AS compliant annual consolidated financial statementswith comparative figures for the year ended March 31, 2016also under IND-AS. The date of transition is April 1, 2015.
Risk Management
In compliance with the requirements of regulations containedin the SEBI (Listing Obligations and Disclosure Requirements)Regulations, 2015 and the provisions of the Companies Act,2013, your Company has constituted a Risk Management
Committee, details whereof are set out in the CorporateGovernance Report forming part of the Annual Report.Further, your Company has formally adopted a RiskManagement Policy to identify and assess the key risk areas,monitor and report compliance and effectiveness of the policyand procedure.
Your Company has a well-established Enterprise-wide RiskManagement (ERM) framework in place for identification,evaluating and management of risks, including the risks whichmay threaten the existence of the Company. In line with yourCompany’s commitment to deliver sustainable value, thisframework aims to provide an integrated and organizedapproach for evaluating and managing risks.
A detailed exercise is carried out to identify, evaluate, manageand monitor the risks. The Committee / Board periodicallyreviews the risks and suggest steps to be taken to control andmitigate the same through a properly defined framework.
Employee Stock Option Schemes
Your Company values its employees and is committed to adoptthe best HR practices for rewarding them suitably. In thisdirection your Company had implemented the Employee StockOption Scheme, 2006 (ESOS-2006) and Employee Stock OptionScheme, 2013 (ESOS-2013) and made grants to eligibleemployees under ESOS-2006 and ESOS-2013 from time to time.
During the year under review, in terms of ESOS-2013, theNomination and Remuneration Committee has granted4,16,033 Options at an exercise price of ` 110.45 per optionand 1,61,869 Restricted Stock Units (RSU) at an exercise priceof ̀ 10/- per RSU. Each Option is convertible into one EquityShare of the Company upon vesting and would vest in 4 equalannual installments after one year of the grant (subject tomeeting performance targets) and shall be exercisable withina period of 5 years from the date of vesting. Further each RSUis convertible into one Equity Share of the Company uponvesting and all RSUs would vest at the end of 3 years from thedate of grant and shall be exercisable within a period of 5 yearsfrom the date of vesting.
In terms of the provisions of the SEBI (Share Based EmployeeBenefits) Regulations, 2014, the details of the Stock Optionsand Restricted Stock Units granted under the above mentionedSchemes are available on your Company’s websitewww.ideacellular.com.
A certificate from M/s. Deloitte Haskins & Sells LLP, StatutoryAuditors, with respect to the implementation of the Company’sEmployee Stock Option Scheme(s), would be placed at theensuing Annual General Meeting for inspection by theMembers and a copy will also be available for inspection atthe Registered Office of the Company.
Internal Control Systems
Your Company’s internal control systems are commensuratewith the nature of its business and the size and complexity ofits operations. The internal controls cover operations, financial
C K
20 Idea Cellular Limited
Directors’ Report
reporting, compliance with applicable laws and regulations,safeguarding assets from unauthorised use and ensurecompliance of corporate policies. Internal controls are reviewedperiodically by the internal auditors, and are subject tomanagement reviews with significant audit observations andfollow up actions reported to the Audit Committee. The AuditCommittee actively reviews the adequacy and effectivenessof internal control systems and suggests improvements forstrengthening them in accordance with the changes in thebusiness dynamics, if required.
Human Resources
Your Company continues to be an Employer of Choice withrobust hiring of high quality talent, high engagement scores,focus on development and effective retention of high potentialemployees.
Value based HR programs have enabled your company’s HRteam to be Strategic Partners for the Business. To keep pacewith the evolving demands of the Mobility Business and theNew Business Lines like Digital, HR has shifted focus tobuilding capability in newer areas to be able to predict,diagnose, and take actions that will improve businessperformance. The Employee Engagement Scores continue tobe high despite a great deal of volatility and disruption in themacro environment. This has resulted in your Company’sability to retain best talent.
Your Company has had continuous focus on Diversity andInclusivity. Being an employer of choice your company hashired some of the best talent from premier Management andEngineering Colleges. In addition your company has laid stressto build a women friendly workplace by introducing variousinitiatives around hiring, development and progression ofwomen employees in the organization.
Your Company has focused on identifying internal talent andnurture them through the culture of continuous learning anddevelopment, thereby building capabilities for creating futureleaders. The efforts in efficient and effective talent developmentthrough internal capability deployment was recognized acrossindustries when your company was awarded theGold Category Award for the “Best Program for SalesEnablement” at the 5th edition of the Tata Institute ofSocial Sciences Leapvault CLO Awards- India inSeptember 2016.
Your Company has also focused on continual processimprovement through driving Six Sigma and Leanmethodologies. These HR strategies have continued to havestrong alignment with your Company’s vision to successfullybuild and sustain Company’s standing as one of India’s mostadmired and valuable corporations despite unrelentingcompetitive pressures.
Your Company has demonstrated the qualities of a goodCorporate citizen by investing in the area of Corporate SocialResponsibility. Various innovative projects through whichsocio-economic challenges of under privileged community are
addressed were rolled out. In terms of outreach these havebeen extended to 14 states. Idea Cellular has been ranked 3rdamongst 271 companies for blending CSR with responsiblegrowth by Economic Times. Your Company has also beenbestowed the prestigious Golden Peacock Award by Instituteof Directors for the year 2016.
Management Discussion and Analysis
The Management Discussion and Analysis Report for the yearunder review, as stipulated under Regulation 34 of the SEBI(Listing Obligations and Disclosure Requirements)Regulations, 2015, is presented in a separate section formingpart of the Annual Report.
Corporate Governance
Your Company is committed to maintain the highest standardsof Corporate Governance. Your Company continues to becompliant with the requirements of Corporate Governance asenshrined in SEBI (Listing Obligations and DisclosureRequirements) Regulations, 2015 (‘Listing Regulations’).A Report on Corporate Governance as stipulated under theListing Regulations forms part of the Annual Report.A certificate from the Statutory Auditors of the Company,confirming compliance with the conditions of CorporateGovernance, as stipulated in the Listing Regulations forms partof the Annual Report.
Business Responsibility Report
As stipulated under SEBI (Listing Obligations and DisclosureRequirements) Regulations, 2015, the Business ResponsibilityReport, describing the initiatives taken by the Company fromenvironmental, social and governance perspective is presentedin a separate section forming part of the Annual Report.
Corporate Social Responsibility
In terms of the provisions of section 135 of the CompaniesAct, 2013, read with Companies (Corporate SocialResponsibility Policy) Rules, 2014, the Board of Directors ofyour Company has constituted a Corporate SocialResponsibility (“CSR”) Committee. The compositionand terms of reference of the CSR Committee is provided inthe Corporate Governance report, which forms part of thisreport.
Your Company has also in place a CSR Policy andthe same is available on your Company’s websitehttp://www.ideacellular.com/investor-relations/corporate governance.
During Financial Year 2016-17, the Company has spent` 369.6 Mn towards CSR activities as against ` 731.9 Mnrequired to be spent during the financial year 2016-17. TheCompany during the year has gradually increased the CSRexpense and the number of CSR projects being undertaken.The expense and the number of projects undertaken duringthe current financial year was around two times the amount

C K
Annual Report 2016-17 21
Directors’ Report
spent and projects undertaken during the previous year. TheCompany’s key objective is to make a difference to the lives ofthe underprivileged and help bring them to a self-sustaininglevel and is committed to CSR engagement. We are increasingcapacity of CSR team to take up more projects. As a sociallyresponsible Company, we are committed to play larger role inIndia’s sustainable development. The implementation has beenacknowledged and awarded.
The particulars required to be disclosed pursuant to theCompanies (Corporate Social Responsibility Policy) Rules, 2014are given in ‘Annexure B’ forming part of this Report.
Directors’ Responsibility Statement
Pursuant to Section 134 of the Companies Act, 2013 (‘Act’)the Directors, to the best of their knowledge and belief, confirmthat:
(a) in the preparation of the annual accounts, the applicableaccounting standards have been followed;
(b) the Directors had selected such accounting policies andapplied them consistently and made judgements andestimates that are reasonable and prudent, so as to give atrue and fair view of the financial position of the Companyat the end of the financial year and of the financialperformance and cash flows the Company for that period;
(c) the Directors had taken proper and sufficient care for themaintenance of adequate accounting records inaccordance with the provisions of this Act forsafeguarding the assets of the Company and forpreventing and detecting fraud and other irregularities;
(d) the annual accounts were prepared on a going concernbasis;
(e) the Directors, had laid down internal financial controls tobe followed by the Company and that such internalfinancial controls are adequate and were operatingeffectively;
(f) the Directors had devised proper systems to ensurecompliance with the provisions of all applicable laws andthat such systems were adequate and operatingeffectively.
Directors
In accordance with the provisions of the Companies Act, 2013,Mrs. Rajashree Birla and Dr. Shridhir Sariputta HansaWijayasuriya, retire from office by rotation, and being eligible,offer themselves for re-appointment at the ensuing AnnualGeneral Meeting of the Company.
During the year under review, Mr. R.C. Bhargava, anIndependent Director resigned from the Board of yourCompany with effect from October 1, 2016 citing personalreasons for his resignation. Further, Mrs. Madhabi Puri Buch,an Independent Director, has also resigned from the Board ofyour Company with effect from April 3, 2017 citing her inabilityto continue to hold any directorships pursuant to her taking
up the position as Whole Time Member of SEBI. The Boardplaces on record its sincere appreciation for the valuableguidance and contribution made by Mr. Bhargava andMrs. Buch in the deliberations of the Board during their tenureas Independent Directors on the Board of Directors of theCompany.
Further, based on recommendation of Nomination andRemuneration Committee, Mrs. Alka M. Bharucha(DIN: 00114067) was appointed as an Additional(Independent) Director, on the Board of your Company witheffect from December 26, 2016. As per the provisions ofCompanies Act, 2013 she holds office upto the date of ensuingAnnual General Meeting of the Company.
Additionally, based on recommendation of Nomination andRemuneration Committee, Mr. Baldev Raj Gupta(DIN: 00020066) was appointed as an Additional(Independent) Director, on the Board of your Company witheffect from May 13, 2017. As per the provisions of CompaniesAct, 2013 he holds office upto the date of ensuing AnnualGeneral Meeting of the Company.
Your Company has received Notice under Section 160 of theCompanies Act, 2013 together with requisite deposit from amember proposing appointment of Mrs. Alka Bharucha andMr. Baldev Raj Gupta as Director(s) on the Board of yourCompany. Necessary resolution seeking approval of themembers for appointment of Mrs. Alka Bharucha andMr. Baldev Raj Gupta as director(s) has been incorporated inthe Notice of the ensuing Annual General Meeting.
The Independent Directors have given the declarations thatthey meet the criteria of independence as laid down underSection 149(6) of the Companies Act, 2013.
Brief profile of the directors proposed to be appointed/re-appointed are annexed to the Notice convening AnnualGeneral Meeting forming part of this Annual Report.
Board Evaluation and Familiarization Programme
The Board has carried out the annual performance evaluationof its own performance, Board Committees and IndividualDirectors pursuant to the provisions of the Companies Act,2013 and Regulation 17 of SEBI (Listing Obligations andDisclosure Requirements) Regulations, 2015. The manner inwhich the evaluation has been carried out has been providedin the Corporate Governance Report.
The details of programme for familiarization of IndependentDirectors of your Company is available on your Company’swebsite www.ideacellular.com.
Remuneration Policy
The Board has, on the recommendation of the Nomination &Remuneration Committee framed a policy on remunerationof Directors and Senior Management Employees.The remuneration policy is attached as ‘Annexure C’ to thisreport.

C K
22 Idea Cellular Limited
Directors’ Report
Dividend Distribution Policy
The Board has in compliance with SEBI (Listing Obligationsand Disclosure Requirements) Regulations, 2015, formulatedDividend Distribution Policy. This policy will provide clarityto the stakeholders on the dividend distribution frameworkof the Company. The Policy sets out various internal andexternal factors which shall be considered by the Board indetermining the dividend payout. The dividend distributionpolicy is attached as ‘Annexure I’ to this report and is alsoavailable on the website of the Company www.ideacellular.com.
Board Meetings
During the year, seven meetings of the Board of Directors wereheld. The details of the meetings and the attendanceof the Directors are provided in the Corporate GovernanceReport.
Board Committees
Your Company has in place the Committee(s) as mandatedunder the provisions of the Companies Act, 2013 and SEBI(Listing Obligations and Disclosure Requirements)Regulations, 2015. There are currently seven committees ofthe Board, namely:
– Audit Committee
– Nomination & Remuneration Committee
– Stakeholders’ Relationship Committee
– Risk Management Committee
– Corporate Social Responsibility Committee
– Finance Committee
– Securities Allotment Committee
Details of the Committees along with their charter, compositionand meetings held during the year, are provided in theCorporate Governance Report, which forms part of this report.
Audit Committee
Audit Committee currently comprises of Mr. Arun Thiagarajanas Chairman of the Audit Committee with other membersbeing Ms. Tarjani Vakil, Dr. Shridhir Sariputta HansaWijayasuriya and Mrs. Alka M. Bharucha. Further detailsrelating to the Audit Committee are provided in the CorporateGovernance Report, which forms part of this report.Mrs. Madhabi Puri Buch ceased to be the member of theCommittee with effect from April 3, 2017. Mrs. Alka M.Bharucha was inducted as a member of the Committee witheffect from April 21, 2017.
Key Managerial Personnel
In terms of the provisions of Section 203 of the CompaniesAct, 2013, read with the Companies (Appointment andRemuneration of Managerial Personnel) Rules, 2014,Mr. Himanshu Kapania, Managing Director; Mr. AkshayaMoondra, Whole-time Director and Chief Financial Officer;and Mr. Pankaj Kapdeo, Company Secretary are the KeyManagerial Personnel of the Company. They continue to holdthe respective offices.
Contract and Arrangements with Related Parties
During the year under review, the Company acquired 10,000Equity Shares of face value of ` 10 each of Idea CellularInfrastructure Services Limited (ICISL), a wholly ownedsubsidiary of the Company at an issue price of ~ ` 4,96,297per Equity Share each, for consideration other than cash,against transfer of tower infrastructure undertaking by theCompany to ICISL with approval granted by the AuditCommittee and the board of directors at their respectivemeetings. All contracts/ arrangements/transactions enteredby the Company during the financial year with the relatedparties as detailed in Note no. 59 of the Standalone FinancialStatements were in ordinary course of business and at an arm’slength basis.
The related party transaction which can be considered materialduring the year is the existing arrangement with Indus TowersLimited (Indus), a joint venture of the wholly owned subsidiaryof your Company which provides Passive Infrastructureservices and related operations and maintenance services tovarious telecom operators in India, including your Company.Indus is currently one of the world’s largest independentpassive infrastructure providers. Your Company had enteredinto a Master Service Agreement (MSA) with Indus in 2008for availing passive infrastructure services provided by themin certain service areas. The MSA requires individual tenancyservice contracts to be executed for each passive infrastructuresite, the terms of which vary depending on the location, typeof site, number of existing tenants, etc. and contain lock inperiod for ensuring continuity. Such terms are similarlyapplicable to all other telecom providers having arrangementwith Indus. The details of the material related party transactionwith Indus for the Financial Year ended March 31, 2017 isprovided in Form AOC-2, which is attached as ‘Annexure D’to this report.
None of the related party transactions entered into by theCompany were in conflict with the Company’s interest. Thereare no materially significant related party transactions madeby the Company with Promoters, Directors or Key ManagerialPersonnel etc. which may have potential conflict with theinterest of the Company at large. Member’s approval formaterial Related Party Transaction, as defined under theListing Regulations shall be obtained at the ensuing AnnualGeneral Meeting.
All Related Party Transactions are placed before the AuditCommittee/Board, as applicable, for their approval. Omnibusapprovals are taken for the transactions which are repetitivein nature. The Company has implemented a Related PartyTransaction manual and Standard Operating Procedures forthe purpose of identification and monitoring of suchtransactions. The details of the transactions with RelatedParties are provided in the accompanying financial statementsas required under Ind AS 24.
The policy on Related Party Transactions is uploaded on theCompany’s website www.ideacellular.com.

C K
Annual Report 2016-17 23
Directors’ Report
Particulars of Loans, Guarantees and Investments
As your Company is engaged in the business of providinginfrastructural facilities, the provisions of Section 186 of theCompanies Act, 2013 relating to loans made, guarantees givenor securities provided are not applicable to the Company. Thedetails of such loans made and guarantees given are providedin the standalone financial statements at Note no. 59.Particulars of investments made by the Company are providedin the standalone financial statements at Note nos. 9 and 13.
Vigil Mechanism
Your Company has in place a vigil mechanism for directorsand employees to report concerns about unethical behaviour,actual or suspected fraud or violation of your Company’s Codeof Conduct. Adequate safeguards are provided againstvictimization to those who avail of the mechanism and directaccess to the Chairman of the Audit Committee in exceptionalcases.
The Vigil Mechanism is available on your Company’s websitewww.ideacellular.com.
Conservation of Energy, Technology Absorption andForeign Exchange Earnings and Outgo
The information on conservation of energy, technologyabsorption and foreign exchange earnings and outgo asrequired to be disclosed pursuant to Section 134(3)(m) of theCompanies Act, 2013, read with Rule 8 of the Companies(Accounts) Rules, 2014, are given to the extent applicable in‘Annexure E’ forming part of this report.
Particulars of Employees
Disclosures pertaining to remuneration and other details asrequired under section 197(12) read with Companies(Appointment and Remuneration of ManagerialPersonnel) Rules, 2014 is annexed herewith as ‘Annexure F’to this report.
In accordance with the provisions of Section 197(12) of theAct read with the Companies (Appointment andRemuneration of Managerial Personnel) Rules, 2014, the namesand other particulars of employees drawing remuneration inexcess of the limits set out in the aforesaid Rules, forms part ofthis Report. However, in line with the provisions of Section136(1) of the Act, the Report and Accounts as set out therein,are being sent to all Members of your Company excluding theaforesaid information about the employees. Any Member, whois interested in obtaining these particulars about employees,may write to the Company Secretary at the Registered Officeof your Company.
Statutory Auditors
In terms of the provisions of Section 139 of the Act read withthe Companies (Audit and Auditors) Rules, 2014, an audit firmcan hold office as statutory auditor for two terms of fiveconsecutive years i.e. for a maximum period of ten years.
Further, as per the provisions of the Act, Company is requiredto comply with these provisions within three years from thecommencement of the Act.
M/s. Deloitte Haskins & Sells LLP, Chartered Accountants,Mumbai were appointed as the Statutory Auditors of theCompany in September, 2005 and were re-appointed at everyAnnual General Meeting (AGM) thereafter. As they have beenin office for more than 10 years, in compliance with theprovisions of the Act, the Company had to appoint a newauditor in their place by March 31, 2017. In terms of theshareholder’s resolution passed at the 19th Annual GeneralMeeting of the Company held on 26th September, 2014,M/s Deloitte Haskins & Sells LLP shall hold office until theconclusion of the ensuing 22nd AGM.
The Board of Directors has at its Meeting held on February11, 2017 recommended appointment of M/s. S.R. Batliboi &Associates LLP, Chartered Accountants, Firm RegistrationNo. 101049W/E300004, as the new statutory auditors of theCompany to hold office for one term of 5 years commencingfrom conclusion of the ensuing 22nd Annual General Meetingupto the Annual General Meeting of the Company to be heldin calendar year 2022.
The Company has received a certificate from the StatutoryAuditors to the effect that their appointment, if made, shall bein compliance with the provisions of Section 139 and 141 ofthe Companies Act, 2013. Accordingly, the Board proposesappointment of M/s. S.R. Batliboi & Associates LLP, CharteredAccountants as the statutory auditors of the Company in placeof M/s. Deloitte Haskins & Sells LLP, to hold office from theconclusion of this AGM until the conclusion of the 27th AGMof your Company. Necessary resolution seeking approval ofthe members for appointment of new statutory auditors hasbeen incorporated in the Notice convening the Annual GeneralMeeting forming part of this Annual Report.
Auditors’ Report and Notes to Financial Statements
The Board has duly reviewed the Statutory Auditors’ Reporton the Financial Statements including the emphasis of matterrelating to the one-time spectrum fee demand raised by theDepartment of Telecommunications in January, 2013. Asexplained in the Notes to the Financial Statements, the matterremains sub-judice and does not call for any furtherexplanation/clarification under Section 134(3)(f) of theCompanies Act, 2013.
Cost Auditors
In conformity with the provisions of Section 148 of theCompanies Act, 2013, read with the Companies (Cost Recordsand Audit) Amendment Rules, 2014, the Board on therecommendation of the Audit Committee has appointedM/s. Sanjay Gupta & Associates, Cost Accountants, as theCost Auditors, to conduct the Cost Audit of your Companyfor the Financial Year ended March 31, 2017, at a remunerationas specified in the notice convening the Annual General

C K
24 Idea Cellular Limited
Directors’ Report
Meeting. The Cost Audit Report for the Financial Year2016-17 will be placed before the Board at the next Meeting ofBoard of Directors.
As required under the Companies Act, 2013, the remunerationpayable to the Cost Auditors is required to be ratified by theshareholders. Accordingly, the Board recommends the samefor ratification by the shareholders at the ensuing AnnualGeneral Meeting.
Secretarial Auditor
In terms of the provision of the Section 204 of the Act readwith Companies (Appointment and Remuneration ofManagerial Personnel) Rules, 2014, the Board had appointedM/s. Umesh Ved & Associates, Company Secretaries,Ahmedabad, as the Secretarial Auditor for conducting theSecretarial Audit of your Company for the financial year endedMarch 31, 2017.
The report of the Secretarial Auditor is annexed to this reportas ‘Annexure G’. The secretarial audit report does not containany qualification, reservation or adverse remark.
Extract of Annual Return
In terms of the provisions of Section 92 (3) of the CompaniesAct, 2013 read with the Companies (Management andAdministration) Rules, 2014, an extract of the Annual Returnin Form MGT 9 for the Financial Year ended March 31, 2017 isannexed herewith as ‘Annexure H’ to this report.
Other Disclosures
– There are no material changes and commitments affectingthe financial position of your Company between end offinancial year and the date of report.
– Your Company has not issued any shares with differentialvoting.
– There was no revision in the financial statements.
– Your Company has not issued any sweat equityshares.
– There are no significant and material orders passed bythe regulators or courts or tribunals impacting the goingconcern status and the Company’s operations in future.
– The number of complaints received during the FinancialYear 2016-17, under the Sexual Harassment of Womenat Workplace (Prevention, Prohibition and Redressal) Act,2013, are available in the Business Responsibility Reportwhich is part of this Annual Report.
Acknowledgement
Your Directors place on record their sincere appreciation tothe Department of Telecommunications, Telecom RegulatoryAuthority of India, the Central Government, the StateGovernments, all its investors & stakeholders, bankers,technology providers, equipment suppliers, value addedservice partners, all the business associates and above all oursubscribers for the co-operation and support extended to theCompany. Your Directors also wish to place on record theirdeep appreciation to the employees for their hard work,dedication and commitment. The perseverance andunstinting efforts of the employees has enabled the Companyto retain the ‘Fastest Growing Indian Telecom Brand’ withinthe sector.
For and on behalf of the Board
Place: Mumbai Kumar Mangalam BirlaDate : May 13, 2017 Chairman

C K
Annual Report 2016-17 25
Directors’ Report
Form AOC-1(Pursuant to first proviso to sub- section (3) of Section 129 read with Rule 5 of Companies (Accounts) Rules, 2014)
Statement containing salient features of the financial statement of subsidiaries / associate companies/joint ventures
Part “A”: Subsidiaries` Mn
Sr. ParticularsNo. Idea Cellular Idea Cellular Idea Telesystems Idea Mobile Aditya Birla
Services Infrastructure Limited Commerce TelecomLimited Services Limited Services Limited Limited
1. The date since when subsidiarywas acquired 3.10.2007 3.10.2007 9.07.2002 1.03.2010 28.02.2007
2. Reporting period April - March April - March April - March April - March April - March
3. Reporting Currency INR INR INR INR INR
4. Equity Share Capital 0.50 0.60 0.50 900.00 100.00
5. Other Equity 8.43 6,622.76 191.01 (875.83) 63,430.48
6. Total Assets 146.06 8,896.69 61.84 440.39 23.69
7. Total Liabilities 137.13 3,071.83 45.61 521.15 16,390.17
8. Investments other thaninvestments in Subsidiary - 798.50 175.28 104.93 79,896.96 #
9. Turnover (Total Revenue) 1,571.60 7,635.18 358.21 113.15 4,963.03
10. Profit / (Loss) Before Taxation 10.78 1,167.78 (47.41) (590.25) 4,662.04
11. Provision for Taxation 3.57 405.43 (0.14) - 382.61
12. Profit / (Loss) After Taxation 7.21 762.35 (47.27) (590.25) 4,279.43
13. Other ComprehensiveIncome / (Loss) (1.73) (2.46) - (0.98) 10,616.64
14. Total ComprehensiveIncome / (Loss) 5.48 759.89 (47.27) (591.23) 14,896.07
15. Proposed Dividend - - - - -
16. % of Shareholding 100% 100% 100% 100% 100%
Notes:
1. There were no subsidiaries which are yet to commence operations.
2. There were no subsidiaries liquidated during the Financial year 2016-17. However, Idea Mobile Commerce Services Limited (IMCSL), is in the process of being
amalgamated with Aditya Birla Idea Payments Bank Limited (ABIPBL), an Associate Company. The business of IMCSL shall be folded into ABIPBL, upon receipt of
authorization to carry on the business of Prepaid Payments Instruments in India (PPI) by ABIPBL from RBI.
# Includes amount of Investment in Joint Venture as on March 31, 2017.
Annexure ‘A’ to the Directors’ Report
Name of the Subsidiary
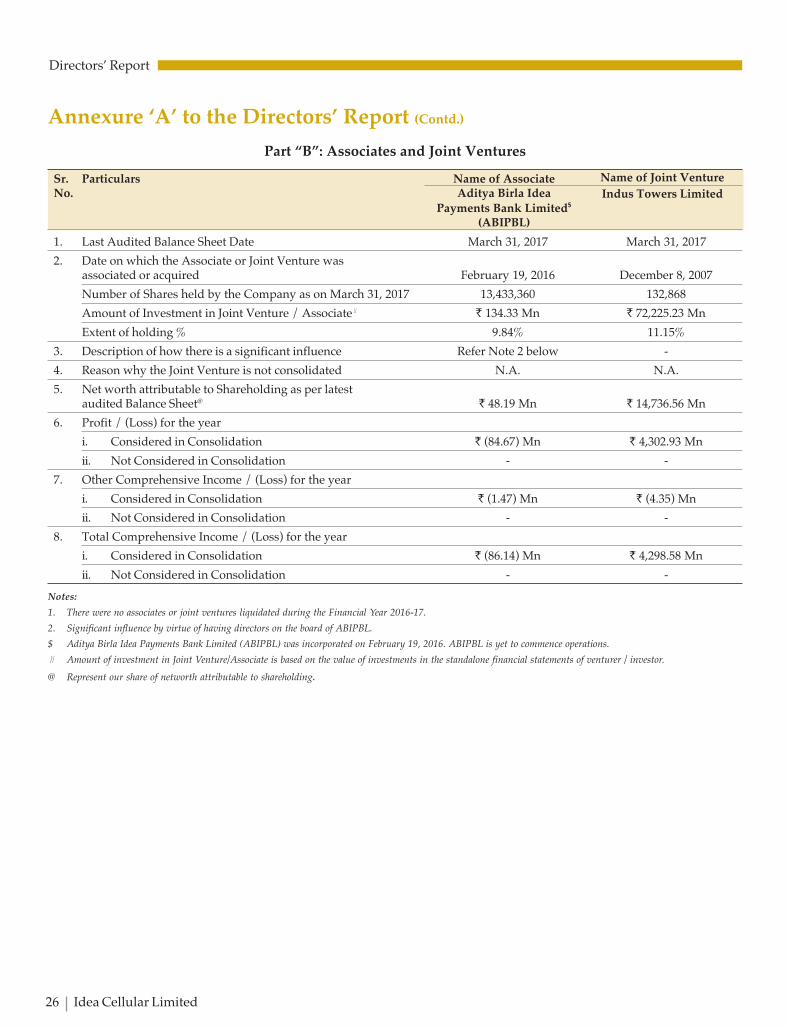
C K
26 Idea Cellular Limited
Directors’ Report
Part “B”: Associates and Joint Ventures
Sr. Particulars Name of Associate Name of Joint Venture
No. Aditya Birla Idea Indus Towers LimitedPayments Bank Limited$
(ABIPBL)
1. Last Audited Balance Sheet Date March 31, 2017 March 31, 2017
2. Date on which the Associate or Joint Venture wasassociated or acquired February 19, 2016 December 8, 2007
Number of Shares held by the Company as on March 31, 2017 13,433,360 132,868
Amount of Investment in Joint Venture / Associate# ` 134.33 Mn ` 72,225.23 Mn
Extent of holding % 9.84% 11.15%
3. Description of how there is a significant influence Refer Note 2 below -
4. Reason why the Joint Venture is not consolidated N.A. N.A.
5. Net worth attributable to Shareholding as per latestaudited Balance Sheet@ ` 48.19 Mn ` 14,736.56 Mn
6. Profit / (Loss) for the year
i. Considered in Consolidation ` (84.67) Mn ` 4,302.93 Mn
ii. Not Considered in Consolidation - -
7. Other Comprehensive Income / (Loss) for the year
i. Considered in Consolidation ` (1.47) Mn ` (4.35) Mn
ii. Not Considered in Consolidation - -
8. Total Comprehensive Income / (Loss) for the year
i. Considered in Consolidation ` (86.14) Mn ` 4,298.58 Mn
ii. Not Considered in Consolidation - -
Notes:
1. There were no associates or joint ventures liquidated during the Financial Year 2016-17.
2. Significant influence by virtue of having directors on the board of ABIPBL.
$ Aditya Birla Idea Payments Bank Limited (ABIPBL) was incorporated on February 19, 2016. ABIPBL is yet to commence operations.
# Amount of investment in Joint Venture/Associate is based on the value of investments in the standalone financial statements of venturer / investor.
@ Represent our share of networth attributable to shareholding.
Annexure ‘A’ to the Directors’ Report (Contd.)

C K
Annual Report 2016-17 27
Directors’ Report
Annexure ‘B’ to the Directors’ Report
Annual Report on Corporate Social Responsibility (CSR) Activities
1. A brief outline of the Company’s CSR Policy, includingoverview of projects or programes proposed to beundertaken and a reference to the web-link to the CSRpolicy and projects or programs
2. The composition of CSR Committee
3. Average Net Profits of the Company for last threefinancial years
4. Prescribed CSR Expenditure(two percent of the amount as in Item 3 above)
5. Details of CSR Spent during the financial year
- Total Amount to be spent for the financial year
- Amount unspent, if any
- Manner in which the amount spent during thefinancial year
To actively contribute to the social and economic developmentof the communities and build a better sustainable way of lifefor the weaker sections of society, through our meaningfulengagement in the areas of Education, Health Care, SustainableLivelihood, Infrastructure Development and Social Change. TheCompany’s CSR policy can be accessed on the Company’swebsite: http://www.ideacellular.com/corporate-governance.
(i) Mrs. Rajashree Birla, Chairperson
(ii) Mr. P. Murari, Member
(iii) Mr. Himanshu Kapania, Member
(iv) Dr. Pragnya Ram, Group Executive President,Corporate Communications & CSR,Permanent Invitee
` 36,596.92 Mn
` 731.94 Mn
` 731.94 Mn
` 362.28 Mn
Details specified as under:
(1) (2) (3) (4) (5) (6) (7) (8)
Sr. CSR Projects/ Sector in Projects/ Amount Amount Cumulative Amount
No. Activity Identified which the Programs: Outlay spent on the expenditure spent:
project is 1) Local Area/ (budget) Project/ upto Direct /
covered others Project/ Programs the through
2) Specify the Program Subheads: reporting implementation
State/District wise (1) Direct period agency
where the Project expenditure
was Undertaken on project/
programs
(2) Overheads
(` Mn) (` Mn) (` Mn)
1. Million Solar Urja Lamp Education i) Rajasthan 38.00 26.60 26.60 IIT, BombayProviding support to assemble ii) Biharand distribute 1 lakh lamps iii) Uttar Pradeshacross 3 states. The key activitiesinclude facilitating educationby providing solar lamps toschool children, capacity buildingof rural youth including womenon solar technology, creatingawareness on the importanceof learning and capacity buildingthrough this project.

C K
28 Idea Cellular Limited
Directors’ Report
(1) (2) (3) (4) (5) (6) (7) (8)
Sr. CSR Projects/ Sector in Projects/ Amount Amount Cumulative AmountNo. Activity Identified which the Programs: Outlay spent on the expenditure spent:
project is 1) Local Area/ (budget) Project/ upto Direct /covered others Project/ Programs the through
2) Specify the Program Subheads: reporting implementationState/District wise (1) Direct period agency
where the Project expenditurewas Undertaken on project/
programs(2) Overheads
(` Mn) (` Mn) (` Mn)
2. Mid-Day Meal Programme Education i) Gujarat (Ahmedabad, 20.00 20.00 20.00 Akshaya Patra
for School Children Vadodara, Surat) Foundation
In the villages nutritional meals ii) Odisha (Cuttack,
for children is a major area of Bhubaneshwar, Puri)
concern. Given the poverty levels, iii) Rajasthan (Jaipur)
children are not sent to schools. iv) Uttar Pradesh
To ensure that parents educate (Lucknow)
children, we contributed to the v) Karnataka
mid-day meal programme. This (Bengaluru, Mysore)
ensures one nutritional meal to
the school going children. More
children attend school and the
dropout rate has been significantly
reduced. The project reaches out
to 39,075 children in 9 locations
spanning five states. Alongside,
we create awareness among
parents and children regarding
nutritional food and sensitize
school teachers and the
administration as well on its
benefits both on health and
development of the brain.
3 KHEL- Knowledge Hub for Education i) Maharashtra 10.0 9.00 9.00 IIT Bombay &
E-Learning ii) Madhya Pradesh IIT Kanpur
KHEL is a project that fosters iii) Uttar Pradesh
the development of multi-media
lessons in the form of interactive
games. These addresses
curricular objectives and helps
enhance learning capabilities of
children. The learning is on a
narrative pattern for primary and
secondary classes. The project
reaches out to 50 schools in three
States impacting 7000 children.
4. Restoring Vision / Eye sight Health i) Andhra Pradesh 10.00 10.00 10.00 Vision Foundation
of 6666 Treatable partial Blind ii) Assam of India
Persons iii) Gujarat
This project is being implemented iv) Karnataka
by the Vision Foundation and it v) Maharashtra
aims at restoring eyesight of over vi) Odisha
6666 visually impaired persons vii) Rajasthan
in remote areas in 8 States. viii) West Bengal
The activities entail organizing
eye camps, pre-examination, eye
surgery and rehabilitation as well.
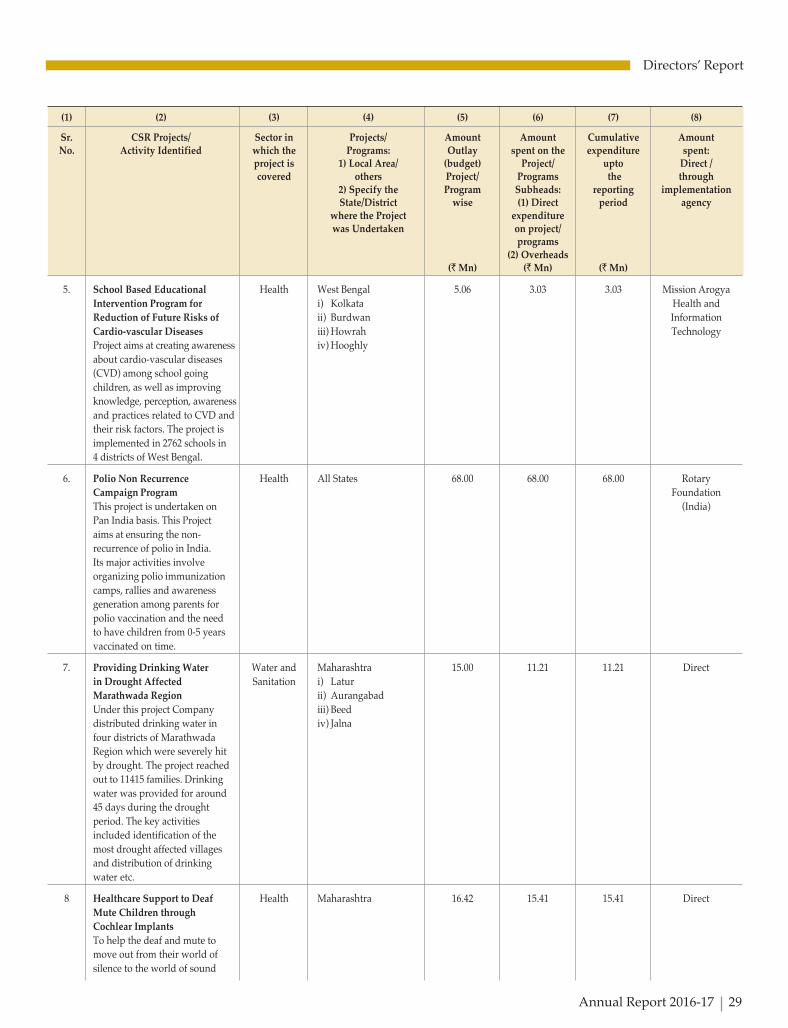
C K
Annual Report 2016-17 29
Directors’ Report
(1) (2) (3) (4) (5) (6) (7) (8)
Sr. CSR Projects/ Sector in Projects/ Amount Amount Cumulative AmountNo. Activity Identified which the Programs: Outlay spent on the expenditure spent:
project is 1) Local Area/ (budget) Project/ upto Direct /covered others Project/ Programs the through
2) Specify the Program Subheads: reporting implementationState/District wise (1) Direct period agency
where the Project expenditurewas Undertaken on project/
programs(2) Overheads
(` Mn) (` Mn) (` Mn)
5. School Based Educational Health West Bengal 5.06 3.03 3.03 Mission ArogyaIntervention Program for i) Kolkata Health andReduction of Future Risks of ii) Burdwan InformationCardio-vascular Diseases iii) Howrah TechnologyProject aims at creating awareness iv) Hooghlyabout cardio-vascular diseases(CVD) among school goingchildren, as well as improvingknowledge, perception, awarenessand practices related to CVD andtheir risk factors. The project isimplemented in 2762 schools in4 districts of West Bengal.
6. Polio Non Recurrence Health All States 68.00 68.00 68.00 RotaryCampaign Program FoundationThis project is undertaken on (India)Pan India basis. This Projectaims at ensuring the non-recurrence of polio in India.Its major activities involveorganizing polio immunizationcamps, rallies and awarenessgeneration among parents forpolio vaccination and the needto have children from 0-5 yearsvaccinated on time.
7. Providing Drinking Water Water and Maharashtra 15.00 11.21 11.21 Directin Drought Affected Sanitation i) LaturMarathwada Region ii) AurangabadUnder this project Company iii) Beeddistributed drinking water in iv) Jalnafour districts of MarathwadaRegion which were severely hitby drought. The project reachedout to 11415 families. Drinkingwater was provided for around45 days during the droughtperiod. The key activitiesincluded identification of themost drought affected villagesand distribution of drinkingwater etc.
8 Healthcare Support to Deaf Health Maharashtra 16.42 15.41 15.41 DirectMute Children through
Cochlear Implants
To help the deaf and mute tomove out from their world ofsilence to the world of sound

C K
30 Idea Cellular Limited
Directors’ Report
(1) (2) (3) (4) (5) (6) (7) (8)
Sr. CSR Projects/ Sector in Projects/ Amount Amount Cumulative AmountNo. Activity Identified which the Programs: Outlay spent on the expenditure spent:
project is 1) Local Area/ (budget) Project/ upto Direct /covered others Project/ Programs the through
2) Specify the Program Subheads: reporting implementationState/District wise (1) Direct period agency
where the Project expenditurewas Undertaken on project/
programs(2) Overheads
(` Mn) (` Mn) (` Mn)
Company engaged with leadingENT surgeons for carrying thesurgery on deaf mute children.Through surgery, doctors implantthe cochlear device whichrestores sound and speech in thedeaf and mute children after theoperation through counsellingand speech therapy. The projectreached out to 21 deaf and mutechildren. The key activitiesincluded pre-operationcounselling, pre-operativevaccines, MRI, surgery,rehabilitation etc.
9 MPOWER Health Maharashtra 10.00 10.00 10.00 Aditya BirlaThis project aims at creating (Mumbai) Education Trustawareness about mental healthamong children and adolescents.The project reaches out to 1000students and adolescents inMumbai. The key activitiesinclude psychiatric support,counselling, guidance andorganization of camps in schools,educational institutes, colleges etc.
10 Village Social Entrepreneurs Health i) Andhra Pradesh 21.00 14.70 14.70 Public Healthin Healthcare ii) Haryana TechnologiesSocial health entrepreneurs, iii) Kerala Trustfostered by us provide iv) Uttar Pradesheconomical diagnostic health testat one centre. The projectoutreach is in 100 locations in20 districts in 4 States. The keyactivities include training ofsocial entrepreneurs, conductingdiagnostic test etc.
11 Set up Vocational Education Skill i) Chhattisgarh 160.00 160.00 160.00 GD Birlaand Training (VET) Centers development (Raipur) MedicalThe VET centers operating in and ii) Maharashtra Research &6 States imparts training to livelihood (Nagpur) Educationyoungsters in the age group of iii) Gujarat Foundation18 to 30 years, who have (Vadodara)dropped out from college or iv) Rajasthancompleted their Board level (Udaipur)education. They are trained in v) Madhya Pradeshsustainable and marketable skills (Bhopal)for securing employment. The

C K
Annual Report 2016-17 31
Directors’ Report
(1) (2) (3) (4) (5) (6) (7) (8)
Sr. CSR Projects/ Sector in Projects/ Amount Amount Cumulative AmountNo. Activity Identified which the Programs: Outlay spent on the expenditure spent:
project is 1) Local Area/ (budget) Project/ upto Direct /covered others Project/ Programs the through
2) Specify the Program Subheads: reporting implementationState/District wise (1) Direct period agency
where the Project expenditurewas Undertaken on project/
programs(2) Overheads
(` Mn) (` Mn) (` Mn)
project reaches out to 1800 vi) Uttar Pradesh
youngsters in 6 locations (Kanpur)
spanning in 6 States. The key
activities include setting up
vocational centre, identification
of youth, imparting training,
placement etc.
12 Roshini: Digital &Economic Skill i) Bihar (Samastipur) 3.57 1.86 1.86 Direct
Empowerment of women Development ii) Madhya Pradesh
Under this project women are & Livelihood (Dhar)
trained to use of internet on iii) Rajasthan (Newai)
mobile phone for services like
healthcare, banking, education etc.
They are being taught how to
access key services and establish
linkages with their economic
activity. This project covers 300
rural women at 3 locations in
3 States. The key activities
include identification of women,
preparation of training modules,
imparting training on topics
related to day to day life etc.
Project carried forward from previous Financial Year 2015-16
13. Construction of Household Sanitation Jammu & Kashmir 14.40 14.40 14.40 Rural
Toilets in Jammu & Development
Kashmir region Department,
The construction of 2010 Govt. of
household toilets and sensitizing Jammu &
the community on the use of Kashmir
toilets in Jammu & Kashmir
has now been completed.
14. Rebuilding School Education Tamil Nadu (Chennai) 0.17 0.17 0.17 Direct
Infrastructure for Flood
affected Chennai Schools
Restoring 19 flood affected
schools in Chennai, through
rebuilding and supporting the
school infrastructure, providing
books and computers have been
completed in July 2016.
15. Solar Urja Lamp for School Education i) Madhya Pradesh 3.80 3.80 3.80 IIT, Bombay
Children to enhance learning (Mandla, Shahadol,
Providing support to assemble Betul)
and distribute 3.25 lakhs in 25
rural blocks across 4 States.
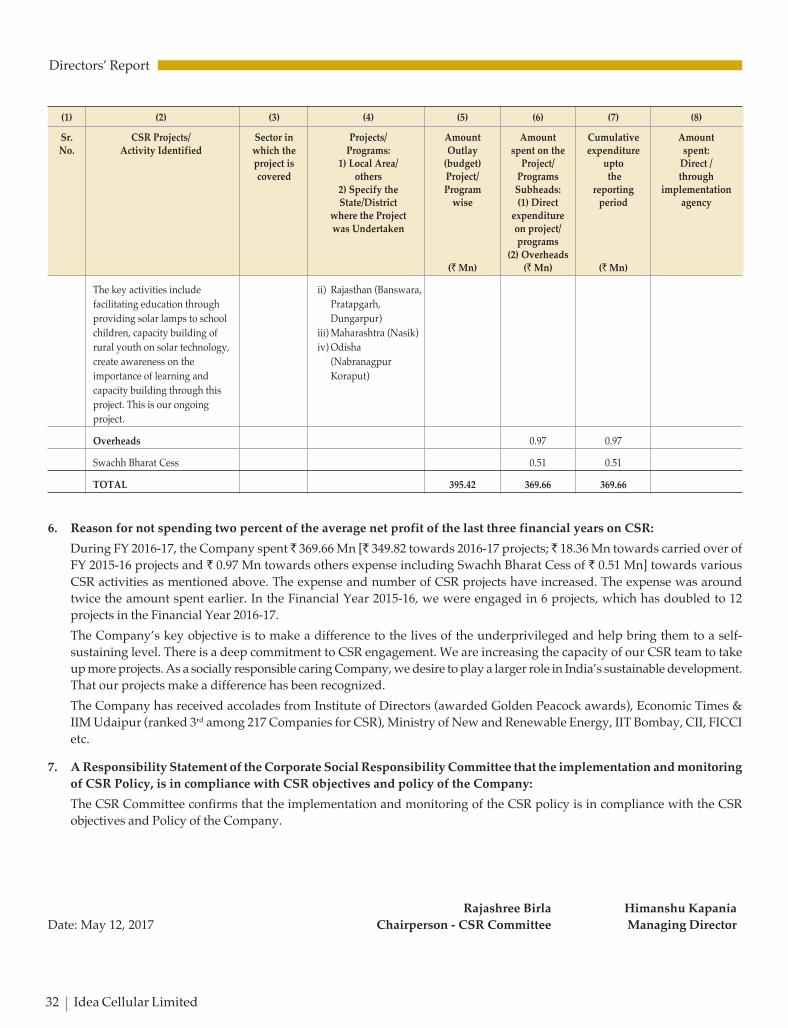
C K
32 Idea Cellular Limited
Directors’ Report
(1) (2) (3) (4) (5) (6) (7) (8)
Sr. CSR Projects/ Sector in Projects/ Amount Amount Cumulative AmountNo. Activity Identified which the Programs: Outlay spent on the expenditure spent:
project is 1) Local Area/ (budget) Project/ upto Direct /covered others Project/ Programs the through
2) Specify the Program Subheads: reporting implementationState/District wise (1) Direct period agency
where the Project expenditurewas Undertaken on project/
programs(2) Overheads
(` Mn) (` Mn) (` Mn)
The key activities include ii) Rajasthan (Banswara,
facilitating education through Pratapgarh,
providing solar lamps to school Dungarpur)
children, capacity building of iii) Maharashtra (Nasik)
rural youth on solar technology, iv) Odisha
create awareness on the (Nabranagpur
importance of learning and Koraput)
capacity building through this
project. This is our ongoing
project.
Overheads 0.97 0.97
Swachh Bharat Cess 0.51 0.51
TOTAL 395.42 369.66 369.66
6. Reason for not spending two percent of the average net profit of the last three financial years on CSR:
During FY 2016-17, the Company spent ̀ 369.66 Mn [` 349.82 towards 2016-17 projects; ̀ 18.36 Mn towards carried over ofFY 2015-16 projects and ` 0.97 Mn towards others expense including Swachh Bharat Cess of ` 0.51 Mn] towards various
CSR activities as mentioned above. The expense and number of CSR projects have increased. The expense was aroundtwice the amount spent earlier. In the Financial Year 2015-16, we were engaged in 6 projects, which has doubled to 12projects in the Financial Year 2016-17.
The Company’s key objective is to make a difference to the lives of the underprivileged and help bring them to a self-sustaining level. There is a deep commitment to CSR engagement. We are increasing the capacity of our CSR team to takeup more projects. As a socially responsible caring Company, we desire to play a larger role in India’s sustainable development.That our projects make a difference has been recognized.
The Company has received accolades from Institute of Directors (awarded Golden Peacock awards), Economic Times &IIM Udaipur (ranked 3rd among 217 Companies for CSR), Ministry of New and Renewable Energy, IIT Bombay, CII, FICCI
etc.
7. A Responsibility Statement of the Corporate Social Responsibility Committee that the implementation and monitoring
of CSR Policy, is in compliance with CSR objectives and policy of the Company:
The CSR Committee confirms that the implementation and monitoring of the CSR policy is in compliance with the CSRobjectives and Policy of the Company.
Rajashree Birla Himanshu Kapania
Date: May 12, 2017 Chairperson - CSR Committee Managing Director

C K
Annual Report 2016-17 33
Directors’ Report
Annexure ‘C’ to the Directors’ Report
Remuneration Philosophy/Policy
At the Aditya Birla Group, we expect our executive team tofoster a culture of growth and entrepreneurial risk-taking.Our Executive Remuneration Philosophy/Policy supports thedesign of programs that align executive rewards – includingincentive programs, retirement benefit programs, promotionand advancement opportunities – with the long-termsuccess of our stakeholders. This Philosophy/Policy is outlinedbelow:
Our business and organizational model
Our Group is a conglomerate and organized in a manner suchthat there is sharing of resources and infrastructure. This resultsin uniformity of business processes and systems therebypromoting synergies and exemplary customer experiences.
I. Objectives of the Executive Remuneration Program
Our executive remuneration program is designed toattract, retain and reward talented executives who willcontribute to our long-term success and thereby buildvalue for our shareholders. Our executive remunerationprogram is intended to:
1. Provide for monetary and non-monetaryremuneration elements to our executives on a holisticbasis.
2. Emphasize “Pay for Performance” by aligningincentives with business strategies to rewardexecutives who achieve or exceed Group, businessand individual goals.
II. Executives
Our Executive Remuneration Philosophy/Policy appliesto the following:
1. Directors of the Company.
2. Key Managerial Personnel: Chief Executive Officerand equivalent (eg: Deputy Managing Director),Chief Financial Officer and Company Secretary.
3. Senior Management.
III. Business and Talent Competitors
We benchmark our executive pay practices and levelsagainst peer companies in similar industries, geographiesand of similar size. In addition, we look at secondaryreference (internal and external) benchmarks in order toensure that pay policies and levels across the Group arebroadly equitable and support the Group’s global mobilityobjectives for executive talent. Secondary reference pointsbring to the table, the executive pay practices and paylevels in other markets and industries, to appreciate the
differences in levels and medium of pay and build in asappropriate for decision making.
IV. Executive Pay Positioning
We aim to provide competitive remunerationopportunities to our executives by positioning target totalremuneration (including perks and benefits, annualincentive pay-outs, long term incentive pay-outs at targetperformance) and target total cash compensation(including annual incentive pay-outs) at targetperformance directionally between median and topquartile of the primary talent market. We recognize thesize and scope of the role and the market standing, skillsand experience of incumbents while positioning ourexecutives.
We use secondary market data only as a reference pointfor determining the types and amount of remunerationwhile principally believing that target total remunerationpackages should reflect the typical cost of comparableexecutive talent available in the sector.
V. Executive Pay-Mix
Our executive pay-mix aims to strike the appropriatebalance between key components: (i) Fixed Cashcompensation (Basic Salary + Allowances) (ii) AnnualIncentive Plan (iii) Long-Term Incentives (iv) Perks andBenefits
Annual Incentive Plan:
We tie annual incentive plan pay-outs of our executivesto relevant financial and operational metrics achievementand their individual performance. We annually align thefinancial and operational metrics with priorities/focusareas for the business.
Long-Term Incentive:
Our Long-term incentive plans incentivize stretchperformance, link executive remuneration to sustainedlong term growth and act as a retention and rewardtool. We use stock options as the primary long-termincentive vehicles for our executives as we believe thatthey best align executive incentives with stockholderinterests.
We grant restricted stock units as a secondary long termincentive vehicles, to motivate and retain our executives.
VI. Performance Goal Setting
We aim to ensure that for both annual incentive plansand long term incentive plans, the target performancegoals shall be achievable and realistic.

C K
34 Idea Cellular Limited
Directors’ Report
Threshold performance (the point at which incentiveplans are paid out at their minimum, but non-zero level)shall reflect a base-line level of performance, reflectingan estimated 90% probability of achievement.
Target performance is the expected level of performanceat the beginning of the performance cycle, taking intoaccount all known relevant facts likely to impact measuredperformance.
Maximum performance (the point at which the maximumplan payout is made) shall be based on an exceptionallevel of achievement, reflecting no more than an estimated10% probability of achievement.
VII. Executive Benefits and Perquisites
Our executives are eligible to participate in ourbroadbased retirement, health and welfare and otheremployee benefit plans. In addition to these broadbasedplans, they are eligible for perquisites and benefits planscommensurate with their roles. These benefits aredesigned to encourage long-term careers with the Group.
Other Remuneration Elements
Each of our executives is subject to an employment agreement.Each such agreement generally provides for a totalremuneration package for our executives including continuityof service across the Group Companies.
We limit other remuneration elements, for e.g. Change inControl (CIC) agreements, severance agreements, to instances
of compelling business need or competitive rationale andgenerally do not provide for any tax gross-ups for ourexecutives.
Risk and Compliance
We aim to ensure that the Group’s remuneration programsdo not encourage excessive risk taking. We review ourremuneration programs for factors such as, remuneration mixoverly weighted towards annual incentives, uncapped pay-outs, unreasonable goals or thresholds, steep pay-out cliffs atcertain performance levels that may encourage short-termdecisions to meet pay-out thresholds.
Claw back Clause
In an incident of restatement of financial statements, due tofraud or non-compliance with any requirement of theCompanies Act, 2013 and the rules made thereafter, we shallrecover from our executives, the remuneration received inexcess, of what would be payable to him / her as perrestatement of financial statements, pertaining to the relevantperformance year.
Implementation
The Group and Business Centre of Expertise teams will assistthe Nomination & Remuneration Committee in adopting,interpreting and implementing the Executive RemunerationPhilosophy/Policy. These services will be established through“arm’s length”, agreements entered into as needs arise in thenormal course of business.
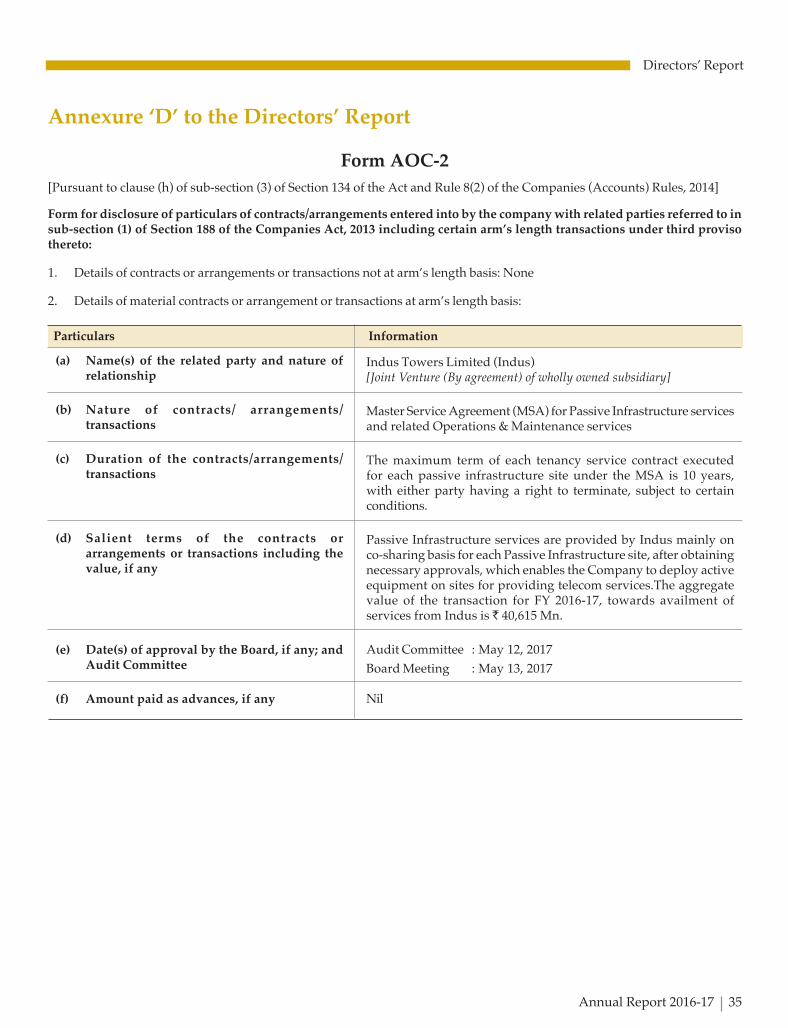
C K
Annual Report 2016-17 35
Directors’ Report
Annexure ‘D’ to the Directors’ Report
Form AOC-2
[Pursuant to clause (h) of sub-section (3) of Section 134 of the Act and Rule 8(2) of the Companies (Accounts) Rules, 2014]
Form for disclosure of particulars of contracts/arrangements entered into by the company with related parties referred to insub-section (1) of Section 188 of the Companies Act, 2013 including certain arm’s length transactions under third provisothereto:
1. Details of contracts or arrangements or transactions not at arm’s length basis: None
2. Details of material contracts or arrangement or transactions at arm’s length basis:
Particulars Information
Indus Towers Limited (Indus)[Joint Venture (By agreement) of wholly owned subsidiary]
Master Service Agreement (MSA) for Passive Infrastructure servicesand related Operations & Maintenance services
The maximum term of each tenancy service contract executedfor each passive infrastructure site under the MSA is 10 years,with either party having a right to terminate, subject to certainconditions.
Passive Infrastructure services are provided by Indus mainly onco-sharing basis for each Passive Infrastructure site, after obtainingnecessary approvals, which enables the Company to deploy activeequipment on sites for providing telecom services.The aggregatevalue of the transaction for FY 2016-17, towards availment ofservices from Indus is ` 40,615 Mn.
Audit Committee : May 12, 2017
Board Meeting : May 13, 2017
Nil
(a) Name(s) of the related party and nature ofrelationship
(b) Nature of contracts/ arrangements/transactions
(c) Duration of the contracts/arrangements/transactions
(d) Salient terms of the contracts orarrangements or transactions including thevalue, if any
(e) Date(s) of approval by the Board, if any; andAudit Committee
(f) Amount paid as advances, if any
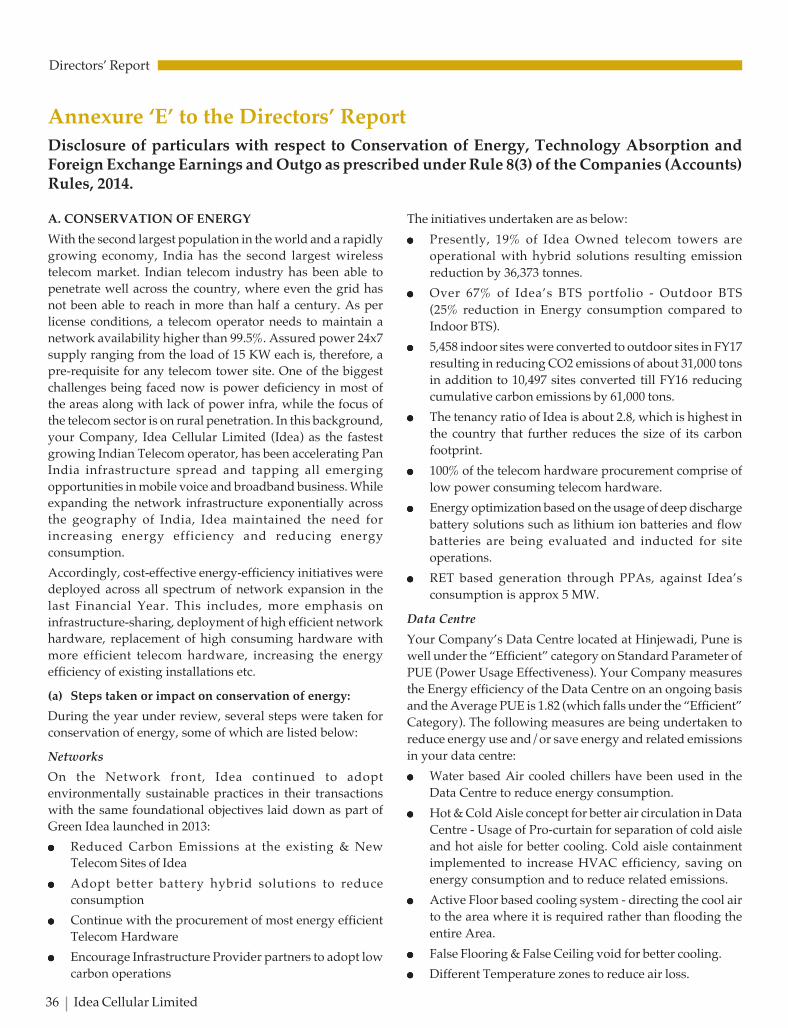
C K
36 Idea Cellular Limited
Directors’ Report
Annexure ‘E’ to the Directors’ ReportDisclosure of particulars with respect to Conservation of Energy, Technology Absorption andForeign Exchange Earnings and Outgo as prescribed under Rule 8(3) of the Companies (Accounts)Rules, 2014.
A. CONSERVATION OF ENERGY
With the second largest population in the world and a rapidlygrowing economy, India has the second largest wirelesstelecom market. Indian telecom industry has been able topenetrate well across the country, where even the grid hasnot been able to reach in more than half a century. As perlicense conditions, a telecom operator needs to maintain anetwork availability higher than 99.5%. Assured power 24x7supply ranging from the load of 15 KW each is, therefore, apre-requisite for any telecom tower site. One of the biggestchallenges being faced now is power deficiency in most ofthe areas along with lack of power infra, while the focus ofthe telecom sector is on rural penetration. In this background,your Company, Idea Cellular Limited (Idea) as the fastestgrowing Indian Telecom operator, has been accelerating PanIndia infrastructure spread and tapping all emergingopportunities in mobile voice and broadband business. Whileexpanding the network infrastructure exponentially acrossthe geography of India, Idea maintained the need forincreasing energy efficiency and reducing energyconsumption.
Accordingly, cost-effective energy-efficiency initiatives weredeployed across all spectrum of network expansion in thelast Financial Year. This includes, more emphasis oninfrastructure-sharing, deployment of high efficient networkhardware, replacement of high consuming hardware withmore efficient telecom hardware, increasing the energyefficiency of existing installations etc.
(a) Steps taken or impact on conservation of energy:
During the year under review, several steps were taken forconservation of energy, some of which are listed below:
Networks
On the Network front, Idea continued to adoptenvironmentally sustainable practices in their transactionswith the same foundational objectives laid down as part ofGreen Idea launched in 2013:
lllll Reduced Carbon Emissions at the existing & NewTelecom Sites of Idea
lllll Adopt better battery hybrid solutions to reduceconsumption
lllll Continue with the procurement of most energy efficientTelecom Hardware
lllll Encourage Infrastructure Provider partners to adopt lowcarbon operations
The initiatives undertaken are as below:
lllll Presently, 19% of Idea Owned telecom towers areoperational with hybrid solutions resulting emission
reduction by 36,373 tonnes.
lllll Over 67% of Idea’s BTS portfolio - Outdoor BTS
(25% reduction in Energy consumption compared toIndoor BTS).
lllll 5,458 indoor sites were converted to outdoor sites in FY17resulting in reducing CO2 emissions of about 31,000 tonsin addition to 10,497 sites converted till FY16 reducingcumulative carbon emissions by 61,000 tons.
lllll The tenancy ratio of Idea is about 2.8, which is highest inthe country that further reduces the size of its carbonfootprint.
lllll 100% of the telecom hardware procurement comprise of
low power consuming telecom hardware.
lllll Energy optimization based on the usage of deep discharge
battery solutions such as lithium ion batteries and flowbatteries are being evaluated and inducted for siteoperations.
lllll RET based generation through PPAs, against Idea’sconsumption is approx 5 MW.
Data Centre
Your Company’s Data Centre located at Hinjewadi, Pune iswell under the “Efficient” category on Standard Parameter ofPUE (Power Usage Effectiveness). Your Company measuresthe Energy efficiency of the Data Centre on an ongoing basisand the Average PUE is 1.82 (which falls under the “Efficient”Category). The following measures are being undertaken to
reduce energy use and/or save energy and related emissionsin your data centre:
lllll Water based Air cooled chillers have been used in theData Centre to reduce energy consumption.
lllll Hot & Cold Aisle concept for better air circulation in DataCentre - Usage of Pro-curtain for separation of cold aisleand hot aisle for better cooling. Cold aisle containmentimplemented to increase HVAC efficiency, saving onenergy consumption and to reduce related emissions.
lllll Active Floor based cooling system - directing the cool airto the area where it is required rather than flooding the
entire Area.
lllll False Flooring & False Ceiling void for better cooling.
lllll Different Temperature zones to reduce air loss.
C K
Annual Report 2016-17 37
Directors’ Report
lllll Thermal Insulation along the flooring/ceiling to reduce
heat dissipation.
lllll Usage of Blanking panel in empty space of server Racks
to reduce short cycling of cold air and hence for improved
HVAC efficiency.
lllll Usage of APFC to improve Power Factor in electrical
distribution system and to reduce the energy consumption
& Harmonics.
lllll Usage of PAC (Precision Air Conditioner) - Non DX units
(without compressor and HVAC gases).
lllll Variable Frequency Drives (VFDs) have been installed in
the data center’s HVAC systems to automatically reduce
the speed and power consumption of motors when there
is lower system load.
lllll Based on power audits and an extensive study of energy
usage, various initiatives have been undertaken over the
years to optimize the usage of electricity, such as:
– Identification and rectification of hot spots
– Optimization of lighting and AC usage
lllll DAPC (Digital Active Power Conditioning) has been
installed for Harmonic Distortion to avoid Power Losses,
Protection of non-linear load and to improve Power
Quality.
lllll During Winter Season Chiller Optimization obtained by
operating 3 Circuits of 2 Chillers in the night. By practicing
this the data centre has achieved 140 KWH savings per
hour while maintaining the desired DC Temp.
lllll In PAC (Precision Air Conditioner), Blower FAN operates
as per the Set Point Temp. Blower Fan’s Maximum Rated
Load is 3.2 KW on 100% Fan speed. It is running Blower
Fan at 70% Speed which consume 1.6 KW without
affecting the Cooling Requirement of the Data Centre.
lllll VRV (Variable Refrigerant Volume) System are installed
in office areas for office cooling. The VRV Systems are set
to 24°C set point & scheduled for all office areas between
8:30 a.m. to 6:00 p.m. Apart from Workstation Area, the
VRV System operates on need basis in Meeting Rooms
and Cabins. Also on weekends VRV System operates on
need basis only in areas where the actual staff is present.
lllll Implemented LED lighting system in DC and some of the
office floors and also office area lighting is scheduled from
8:30 a.m. to 7:00 p.m. and will be switched on need basis
in areas where the actual staff is present after the office
hours. By practicing this we are achieving power saving
without compromising lux level in required office areas.
Facilities
lllll Your Company is working to reduce its Carbon footprint
by adoption of newer technologies and changing the
consumption mix to include more renewable energy
generators. The company’s new Projects are
conceptualized giving high priority to the energy efficient
design. The company operates with lux levels below 300
and keeps a good mix of natural and artificial illumination
for conserving energy.
lllll Your Company’s office facilities have lighter surface
colours and patterns which absorb less and contribute to
better lighting. The company uses a combination of
energy efficient CFL and LED lighting for illumination at
our facilities. However new projects have all LED fittings.
lllll In Air-conditioning space, your Company uses star rated
BEE (Bureau of Energy Efficiency) certified air
conditioners in our facilities. The company also uses VRV
systems apart from the energy efficient chillier plants in
your facilities.
lllll Idea’s Energy Management includes regular monitoring
of energy consumption of different types of loads on a
daily basis and helps the company to take corrective
measures on an immediate basis. The company’s average
square feet consumptions have reduced over a period and
match the benchmarks for office space.
lllll Some of the other measures in the Company’s office
premises include:
– Usage of Electronic ballasts instead of Copper ballasts
for improved efficiency and reduction in energy
consumption and emissions.
– Usage of logic controlling for emergency lights.
Automatically is set on during power failure.
– VRV based Air conditioning is being used in office
area instead of a centralized system.
– Switching off all non- critical loads (office AC, lights,
unused meeting rooms/cabins etc.) after working
hours.
– Switching off all FACADE lights near to outer glass
of premises.
lllll Your Company is replacing existing CFL based lighting
fixtures to LED based fixtures on OPEX model for older
facilities to achieve 100 percent conversion to lesser
consumption loads.
lllll All new facilities are being designed to conform to LEED
certification standards. This will ensure lesser energy
consumption per sq. ft. basis and also reduce the
company’s carbon footprint.
(b) Steps taken by the Company for utilizing alternate
sources of energy:
The following initiatives have been undertaken by the
Company, to utilize alternate sources of energy:
C K
38 Idea Cellular Limited
Directors’ Report
lllll Exclusive Solar solutions at over 1,200 sites: Cumulative
solar deployment is presently about 5.4 MW. Idea uses a
unique vendor engagement model known as Energy
Management Service (EMS) Provisioning where RET-
based generation (Solar Energy) and site operation
management is combined under one Master Services
Agreement.
lllll On-Site Solar implementation: This project was initiated
in FY15. A 25 KW Solar Plant was constructed on the roof
of Idea Delhi MSC. Its operating smoothly delivering the
objectives.
lllll Off-Site Renewable Energy (RE) Deployment: This
concept was also initiated in FY15 based on Carbon
abatement principle. In FY17-
- 4 MW Solar PPAs signed in Andhra Pradesh (AP)
Circle and Madhya Pradesh (MP) Circle with
combined 4.9 Mn Solar Units generated neutralizing
CO2 emission of 3,975 tons.
- 1 MW Wind PPS signed in Tamil Nadu Circle (TNC)
with 1.7 million Wind units generated and neutralized
Co2 emissions of 1,398 tons.
There are plans underway in three other Circles to deploy
a similar model where power from will be generated from
a solar at a remote place and fed to grid. The credit
generated from the solar plant will be used to offset the
cost of energy elsewhere.
Some of the tangible outcome of above activities / initiatives
include:
lllll Reduction in Carbon Emission:
Co2 emission reduction of about 36,373 tons have been
achieved through Power Purchase Agreements and indoor
to outdoor conversions.
lllll Contributing to Greener Economy:
The DG running has been reduced by 4 hours per BTS, on
an average, saving approximately 2 Million litres of diesel
in FY17. Reduction in diesel consumption is contributing
not only to greener economy but also to the national
economy by reducing the use of subsidized diesel.
(c) The capital investment on energy conservation
equipment:
The capital investment on energy conservation equipment
was not material during the Financial Year ended March
31, 2017.
B. TECHNOLOGY ABSORPTION
a) Efforts made towards technology absorption
The Company owns and operates its telecom network
Adaptation and Innovation using its own resources.
The focus of the company has been to enhance its 3G
and 4G data broadband connectivity across the
country.
b) Benefits derived like product improvement, cost
reduction, product development or import
substitution
The cost of implementation of operations network is
most optimal due to in-house handling of planning
and designing. The speed to market was much better
in terms of rural rollout and rollout of 3G and 4G
sites due to strong in-house competency.
The Company owns and operates its telecom network
Adaptation and Innovation using its own resources.
Structured internal trainings are imparted to the team
of engineers for their skill development and
grooming.
c) In case of imported technology (imported during
the last three years reckoned from the beginning of
the financial year)
No technology has been imported. However, telecom
equipments are imported on an ongoing basis.
d) Expenditure incurred on Research and
Development (R&D)
None
C. FOREIGN EXCHANGE EARNINGS AND OUTGO
Total foreign exchange used and earned for the year:
(a) Total Foreign Exchange Earnings : ` 6,738 Mn
(b) Total Foreign Exchange Outgo : ` 35,338 Mn
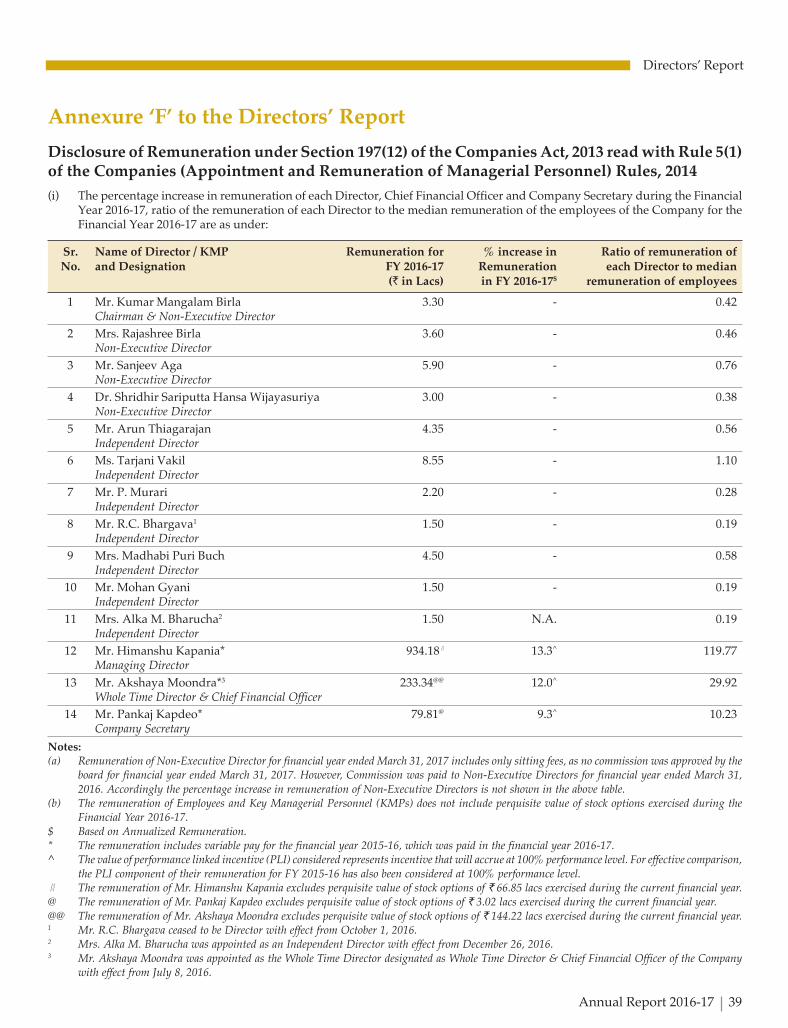
C K
Annual Report 2016-17 39
Directors’ Report
Annexure ‘F’ to the Directors’ Report
Disclosure of Remuneration under Section 197(12) of the Companies Act, 2013 read with Rule 5(1)of the Companies (Appointment and Remuneration of Managerial Personnel) Rules, 2014
(i) The percentage increase in remuneration of each Director, Chief Financial Officer and Company Secretary during the FinancialYear 2016-17, ratio of the remuneration of each Director to the median remuneration of the employees of the Company for theFinancial Year 2016-17 are as under:
Sr. Name of Director / KMP Remuneration for % increase in Ratio of remuneration ofNo. and Designation FY 2016-17 Remuneration each Director to median
(` in Lacs) in FY 2016-17$ remuneration of employees
1 Mr. Kumar Mangalam Birla 3.30 - 0.42Chairman & Non-Executive Director
2 Mrs. Rajashree Birla 3.60 - 0.46Non-Executive Director
3 Mr. Sanjeev Aga 5.90 - 0.76Non-Executive Director
4 Dr. Shridhir Sariputta Hansa Wijayasuriya 3.00 - 0.38Non-Executive Director
5 Mr. Arun Thiagarajan 4.35 - 0.56Independent Director
6 Ms. Tarjani Vakil 8.55 - 1.10Independent Director
7 Mr. P. Murari 2.20 - 0.28Independent Director
8 Mr. R.C. Bhargava1 1.50 - 0.19Independent Director
9 Mrs. Madhabi Puri Buch 4.50 - 0.58Independent Director
10 Mr. Mohan Gyani 1.50 - 0.19Independent Director
11 Mrs. Alka M. Bharucha2 1.50 N.A. 0.19Independent Director
12 Mr. Himanshu Kapania* 934.18# 13.3^ 119.77Managing Director
13 Mr. Akshaya Moondra*3 233.34@@ 12.0^ 29.92Whole Time Director & Chief Financial Officer
14 Mr. Pankaj Kapdeo* 79.81@ 9.3^ 10.23Company Secretary
Notes:(a) Remuneration of Non-Executive Director for financial year ended March 31, 2017 includes only sitting fees, as no commission was approved by the
board for financial year ended March 31, 2017. However, Commission was paid to Non-Executive Directors for financial year ended March 31,2016. Accordingly the percentage increase in remuneration of Non-Executive Directors is not shown in the above table.
(b) The remuneration of Employees and Key Managerial Personnel (KMPs) does not include perquisite value of stock options exercised during theFinancial Year 2016-17.
$ Based on Annualized Remuneration.* The remuneration includes variable pay for the financial year 2015-16, which was paid in the financial year 2016-17.^ The value of performance linked incentive (PLI) considered represents incentive that will accrue at 100% performance level. For effective comparison,
the PLI component of their remuneration for FY 2015-16 has also been considered at 100% performance level.# The remuneration of Mr. Himanshu Kapania excludes perquisite value of stock options of ` 66.85 lacs exercised during the current financial year.@ The remuneration of Mr. Pankaj Kapdeo excludes perquisite value of stock options of ` 3.02 lacs exercised during the current financial year.@@ The remuneration of Mr. Akshaya Moondra excludes perquisite value of stock options of ` 144.22 lacs exercised during the current financial year.1 Mr. R.C. Bhargava ceased to be Director with effect from October 1, 2016.2 Mrs. Alka M. Bharucha was appointed as an Independent Director with effect from December 26, 2016.3 Mr. Akshaya Moondra was appointed as the Whole Time Director designated as Whole Time Director & Chief Financial Officer of the Company
with effect from July 8, 2016.

C K
40 Idea Cellular Limited
Directors’ Report
(ii) The percentage increase in the median remuneration of
the employees of the Company for the Financial Year
2016-17:
The median remuneration of the employees in the Financial
Year 2016-17 was increased by 8%, as compared to the
financial year 2015-16.
The Median Remuneration of Employees of the Company
during the Financial Year 2016-17 was ` 7.80 Lacs.
(iii) The number of permanent employees on the rolls of the
Company:
There were 11,784 permanent employees on the rolls of
Company as on March 31, 2017.
(iv) The explanation on the relationship between average
increase in remuneration and company performance:
Inspite of the hyper-competitive scenario and availability
of large scale free services from a new entrant, the mobile
industry had witnessed unprecedented disruption in the
second half of the financial year. As a result, the overall
revenue of the Company for the Financial Year 2016-17
declined by 1%, as compared to the financial year 2015-16
and the EBIDTA registered a de-growth of 14%. However,
the company responded to the changing market dynamics
and improved its revenue market share from 18.6%
(calendar year 2015) to 19.0% (calendar year 2016) and
maintained its subscriber market share (on VLR) at 19.4%.
The average increase in the median remuneration of
employees for the Financial Year 2016-17 is 8%. The average
increase in median remuneration is in line with industry
benchmark and performance of the Company.
(v) Comparison of the remuneration of the Key Managerial
Personnel(s) against the performance of the Company:
The total remuneration of Key Managerial Personnel
increased by 12.8%. The overall revenue of the Company
for the financial year 2016-17 declined by 1%, as compared
to the financial year 2015-16 and the EBIDTA registered a
de-growth of 14%. However, the company responded to
the changing market dynamics and improved its revenue
market share from 18.6% (calendar year 2015) to 19.0%
(calendar year 2016) and maintained its subscriber market
share (on VLR) at 19.4%.
(vi) (a) Variations in the market capitalization of the
Company:
The market capitalization of the Company as on
31st March, 2017 was approx. ` 30,951 Crore as
compared to approx. ` 39,677 Crore as on March 31,
2016, representing a decline of 22%.
(b) Price Earnings Ratio:
The Earnings Per Share for the current Financial Year
2016-17 is negative. However, the price earnings ratio
of the Company as at March 31, 2016 was 15.2.
(c) Percent increase over / decrease in the market
quotations of the shares of the company as
compared to the rate at which the company came
out with the last public offer:
The closing price of the Company’s Equity Shares on
NSE and BSE as of March 31, 2017 was ` 85.85 and
` 85.70 respectively, representing an increase of over
14% over IPO price (NSE).
(vii) Average percentage increase already made in the salaries
of employees other than the managerial personnel in the
last Financial Year i.e. 2016-17 with the percentage
increase in the managerial remuneration:
The average increase in the remuneration of employees
excluding KMPs during FY 2016-17 was 7.6% and the
average increase in the remuneration of Key Managerial
Personnel was 12.8%.
(viii) The key parameters for the variable component of
remuneration availed by the directors:
Based on the recommendations of the Nomination and
Remuneration Committee and as per the Remuneration
Philosophy / Policy of the Company.
(ix) The ratio of the remuneration of the highest paid director
to that of the employees who are not directors but receive
remuneration in excess of the highest paid director during
the year:
None of the employees has remuneration more than the
highest paid directors.
(x) Affirmation that the remuneration is as per the
remuneration policy of the Company:
The remuneration of Directors was as per the Remuneration
Policy of the Company.

C K
Annual Report 2016-17 41
Directors’ Report
To,
The Members,Idea Cellular Limited
We have conducted the secretarial audit of the compliance ofapplicable statutory provisions and the adherence to goodcorporate practices by Idea Cellular Limited (hereinafter calledthe Company). Secretarial Audit was conducted in a manner thatprovided us a reasonable basis for evaluating the corporateconducts/statutory compliances and expressing our opinionthereon.
Based on our verification of the Company’s books, papers, minutebooks, forms and returns filed and other records maintained bythe company and also the information provided by the Company,its officers, agents and authorized representatives during theconduct of secretarial audit. We hereby report that in our opinion,the company has, during the audit period covering the financialyear ended on 31st March, 2017 complied with the statutoryprovisions listed hereunder and also that the Company has properBoard-processes and compliance-mechanism in place to theextent, in the manner and subject to the reporting madehereinafter:
We have examined the books, papers, minute books, forms andreturns filed and other records maintained by the Company forthe financial year ended on 31st March, 2017 according to theprovisions of:
(i) The Companies Act, 2013 (the Act) and the rules madethereunder;
(ii) The Securities Contracts (Regulation) Act, 1956 (‘SCRA’) andthe rules made thereunder;
(iii) The Depositories Act, 1996 and the Regulations and Bye-laws framed thereunder;
(iv) Foreign Exchange Management Act, 1999 and the rules andregulations made thereunder to the extent of Foreign DirectInvestment, Overseas Direct Investment and ExternalCommercial Borrowings;
(v) The following Regulations and Guidelines prescribed underthe Securities and Exchange Board of India Act, 1992 (‘SEBIAct’):-
(a) The Securities and Exchange Board of India (SubstantialAcquisition of Shares and Takeovers) Regulations, 2011;
(b) The Securities and Exchange Board of India (Prohibitionof Insider Trading) Regulations, 2015;
(c) The Securities and Exchange Board of India (Issue of
Secretarial Audit ReportFor the Financial Year ended on March 31, 2017
[Pursuant to section 204(1) of the Companies Act, 2013 and Rule No.9 of the Companies (Appointment and RemunerationPersonnel) Rules, 2014]
Annexure ‘G’ to the Directors’ Report
Capital and Disclosure Requirements) Regulations,2009;
(d) The Securities and Exchange Board of India (ShareBased Employee Benefits) Regulations, 2014;
(e) The Securities and Exchange Board of India (Issue andListing of Debt Securities) Regulations, 2008;
(f) The Securities and Exchange Board of India (Registrarsto an Issue and Share Transfer Agents) Regulations,1993 regarding the Companies Act and dealing withclient;
(g) The Securities and Exchange Board of India (Delistingof Equity Shares) Regulations, 2009; (Not Applicableto the Company during the Audit Period); and
(h) The Securities and Exchange Board of India (Buybackof Securities) Regulations, 1998; (Not Applicable to theCompany during the Audit Period).
(vi) We have relied on the representation made by the Company,its Officers and on the reports given by designatedprofessionals for systems and processes formed by theCompany to monitor and ensure compliances under otherapplicable Acts, Laws and Regulations to the Company.
The list of major head / groups of Acts, Laws and Regulations asapplicable to the Company is as under:
1. Telecom Regulatory Authority of India Act, 1997 and therules and regulations made thereunder.
2. Department of Telecommunication guidelines and LicenseAgreements.
We have also examined compliance with the applicable clausesof the following:
(i) Secretarial Standards issued by The Institute of CompanySecretaries of India.
(ii) The Listing Agreements entered into by the Company withStock Exchanges read with Securities and Exchange Boardof India (Listing Obligations and Disclosure Requirements)Regulations, 2015.
During the period under review, the Company has complied withthe provisions of the Act, Rules, Regulations, Guidelines,Standards etc. mentioned above.

C K
42 Idea Cellular Limited
Directors’ Report
We further Report That,
The Company has not appointed Small shareholders’ director as given
under section 151 of the Companies Act, 2013 read with Rule 7 of the
Companies (Appointment and Qualification of Directors) Rules 2014,
since the same is not mandatory.
CSR Expenditure during the year was below the limits as specified
under provisions of Companies Act, 2013.
The Company has paid remuneration to its Managing Director,
Mr. Himanshu Kapania in excess of limits specified in Section 197 of
the Companies Act, 2013, read with Schedule V therein.
We further report that:
Board of Directors of the Company is duly constituted with proper
balance of Executive Directors, Non-Executive Directors and
Independent Directors. The changes in the composition of the
Board of Directors that took place during the period under review
were carried out in compliance with the provisions of the Act.
Adequate notice is given to all directors to schedule the Board
Meetings, agenda and detailed notes on agenda were sent at least
seven days in advance except in one instance wherein the shorter
notice was consented by the Directors and a system exists for
seeking and obtaining further information and clarifications on
the agenda items before the meeting and for meaningful
participation at the meeting.
All decisions in the Board is carried through, while the dissenting
members’ views, if any, are captured and recorded as part of the
minutes.
We further report that there are adequate systems and processes
in the company commensurate with the size and operations of
the company to monitor and ensure compliance with applicable
laws, rules, regulations and guidelines.
We further report that during the year under report, the
Company has not undertaken event/ action having a major
bearing in the company’s affairs in pursuance of the above
referred laws, rules, regulations, guidelines, standards, etc.
referred to above.
Umesh Ved
Umesh Ved & Associates
Place: Ahmedabad Company Secretaries
Date : May 12, 2017 C.P. No.: 2924
Note : This report to be read with our letter of even date which is
annexed as Annexure-A and forms part of this report.
Annexure A to the Secretarial Audit Report
To,
The Members,Idea Cellular Limited
Our report of even date is to be read along with this letter.
1. Maintenance of secretarial record is the responsibilityof the management of the company. Our responsibility is toexpress an opinion on these secretarial records based onour audit.
2. We have followed the audit practices and processes as wereappropriate to obtain reasonable assurance about thecorrectness of the contents of the Secretarial records. Theverification was done on test basis to ensure that correctfacts are reflected in secretarial records. We believe that theprocesses and practices, we followed provide a reasonablebasis for our opinion.
3. We have not verified the correctness and appropriatenessof financial records and Books of Accounts of theCompany.
4. Wherever required, we have obtained the Managementrepresentation about the compliance of laws, rules andregulations and happenings of events etc.
5. The compliance of the provisions of Corporate and otherapplicable laws, rules, regulations, standards is theresponsibility of management. Our examination was limitedto the verification of procedures on test basis.
6. The secretarial Audit report is neither an assurance as to thefuture viability of the Company nor of the efficiency oreffectiveness with which the management has conductedthe affairs of the Company.
Umesh VedUmesh Ved & Associates
Place: Ahmedabad Company SecretariesDate : May 12, 2017 C.P. No.: 2924
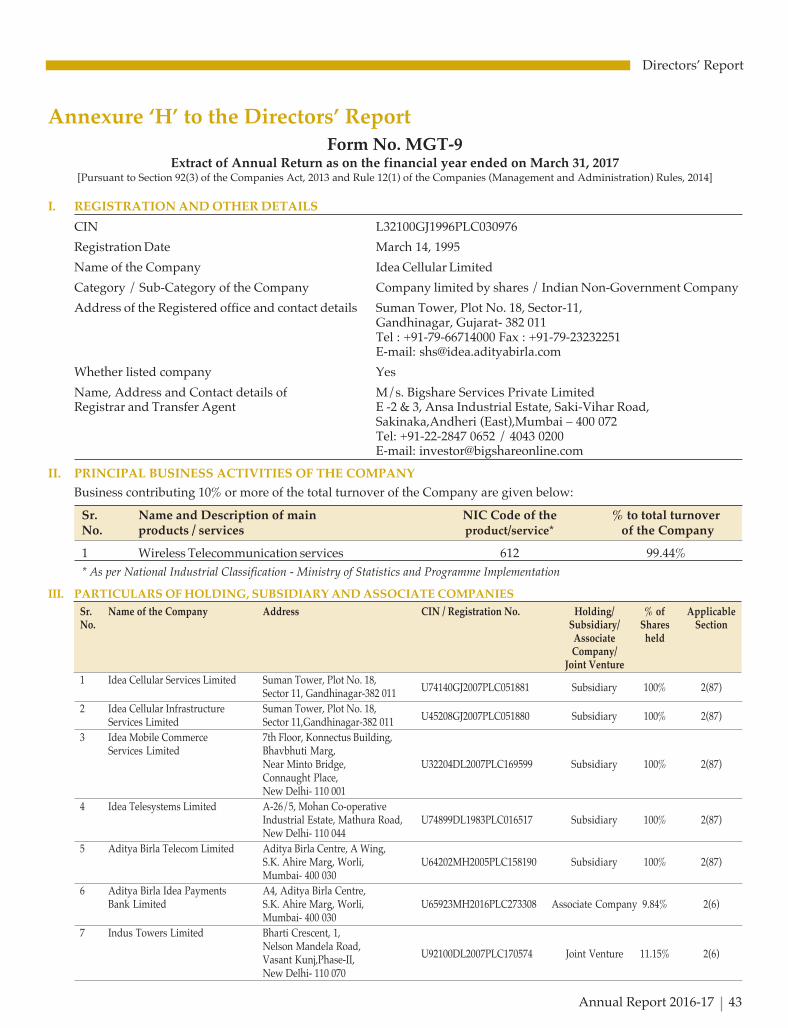
C K
Annual Report 2016-17 43
Directors’ Report
Form No. MGT-9Extract of Annual Return as on the financial year ended on March 31, 2017
[Pursuant to Section 92(3) of the Companies Act, 2013 and Rule 12(1) of the Companies (Management and Administration) Rules, 2014]
I. REGISTRATION AND OTHER DETAILS
CIN L32100GJ1996PLC030976
Registration Date March 14, 1995
Name of the Company Idea Cellular Limited
Category / Sub-Category of the Company Company limited by shares / Indian Non-Government Company
Address of the Registered office and contact details Suman Tower, Plot No. 18, Sector-11,Gandhinagar, Gujarat- 382 011Tel : +91-79-66714000 Fax : +91-79-23232251E-mail: [email protected]
Whether listed company Yes
Name, Address and Contact details of M/s. Bigshare Services Private LimitedRegistrar and Transfer Agent E -2 & 3, Ansa Industrial Estate, Saki-Vihar Road,
Sakinaka,Andheri (East),Mumbai – 400 072Tel: +91-22-2847 0652 / 4043 0200E-mail: [email protected]
II. PRINCIPAL BUSINESS ACTIVITIES OF THE COMPANY
Business contributing 10% or more of the total turnover of the Company are given below:
Sr. Name and Description of main NIC Code of the % to total turnoverNo. products / services product/service* of the Company
1 Wireless Telecommunication services 612 99.44%
* As per National Industrial Classification - Ministry of Statistics and Programme Implementation
III. PARTICULARS OF HOLDING, SUBSIDIARY AND ASSOCIATE COMPANIES
Sr. Name of the Company Address CIN / Registration No. Holding/ % of ApplicableNo. Subsidiary/ Shares Section
Associate heldCompany/
Joint Venture
1 Idea Cellular Services Limited Suman Tower, Plot No. 18,U74140GJ2007PLC051881 Subsidiary 100% 2(87)Sector 11, Gandhinagar-382 011
2 Idea Cellular Infrastructure Suman Tower, Plot No. 18,U45208GJ2007PLC051880 Subsidiary 100% 2(87)Services Limited Sector 11,Gandhinagar-382 011
3 Idea Mobile Commerce 7th Floor, Konnectus Building,Services Limited Bhavbhuti Marg,
Near Minto Bridge, U32204DL2007PLC169599 Subsidiary 100% 2(87)Connaught Place,New Delhi- 110 001
4 Idea Telesystems Limited A-26/5, Mohan Co-operativeIndustrial Estate, Mathura Road, U74899DL1983PLC016517 Subsidiary 100% 2(87)New Delhi- 110 044
5 Aditya Birla Telecom Limited Aditya Birla Centre, A Wing,S.K. Ahire Marg, Worli, U64202MH2005PLC158190 Subsidiary 100% 2(87)Mumbai- 400 030
6 Aditya Birla Idea Payments A4, Aditya Birla Centre,Bank Limited S.K. Ahire Marg, Worli, U65923MH2016PLC273308 Associate Company 9.84% 2(6)
Mumbai- 400 030
7 Indus Towers Limited Bharti Crescent, 1,Nelson Mandela Road,
U92100DL2007PLC170574 Joint Venture 11.15% 2(6)Vasant Kunj,Phase-II,New Delhi- 110 070
Annexure ‘H’ to the Directors’ Report

C K
44 Idea Cellular Limited
Directors’ Report
IV. SHARE HOLDING PATTERN (Equity Share Capital Breakup as percentage of Total Equity)
i) Category-wise Share Holding
Category of No. of Shares held at the beginning No. of Shares held at the end % Changeshareholders of the year (As on 01-04-2016) of the year (As on 31-03-2017) during
the year
Demat Physical Total % of Demat Physical Total % ofTotal Total
shares shares
A. Promoters
1 Indian
(a) Individual/HUF 233,333 - 233,333 0.01 233,333 - 233,333 0.01 0.00
(b) Central Government - - - - - - - - -
(c) State Government - - - - - - - - -
(d) Bodies Corporate 1,520,445,714 - 1,520,445,714 42.23 1,528,614,214 - 1,528,614,214 42.40 0.17
(e) Banks / FI - - - - - - - - -
(f) Any Other - - - - - - - - -
Sub-total (A)(1) 1,520,679,047 - 1,520,679,047 42.24 1,528,847,547 - 1,528,847,547 42.41 0.17
2 Foreign
(a) NRIs- Individuals - - - - - - - - -
(b) Other-Individuals - - - - - - - - -
(c) Bodies corp - - - - - - - - -
(d) Banks/FI - - - - - - - - -
(e) Any Other - - - - - - - - -
Sub-total (A)(2) - - - - - - - - -
Total Shareholdingof Promoter (A) =(A)(1) + (A)(2) 1,520,679,047 - 1,520,679,047 42.24 1,528,847,547 - 1,528,847,547 42.41 0.17
B. Public Shareholding
1 Institutions
(a) Mutual Funds 56,995,828 - 56,995,828 1.58 66,654,990 - 66,654,990 1.85 0.27
(b) Banks/FI 4,518,072 - 4,518,072 0.13 6,316,855 - 6,316,855 0.18 0.05
(c) Central Government - - - - - - - - -
(d) State Government - - - - - - - - -
(e) Venture Capital Funds 3,350,000 - 3,350,000 0.09 3,350,000 - 3,350,000 0.09 0.00
(f) Insurance Companies 120,745,671 - 120,745,671 3.35 166,436,193 - 166,436,193 4.62 1.27
(g) FIIs 871,165,995 - 871,165,995 24.20 972,347,141 - 972,347,141 26.97 2.77
(h) Alternate InvestmentFunds- - - - - 3,527,022 - 3,527,022 0.10 0.10
(i) Foreign VentureCapital Funds - - - - - - - - -
Any Other - - - - - - - - -
Sub-total (B)(1) 1,056,775,566 - 1,056,775,566 29.35 1,218,632,201 - 1,218,632,201 33.81 4.46
2 Non-Institutions
(a) Bodies Corporate
i) Indian 4,836,543 - 4,836,543 0.13 21,866,058 - 21,866,058 0.61 0.48
ii) Overseas - - - - - - - - -
(b) Individuals
i) Individual shareholdersholding nominal sharecapital upto ̀ 1 lakh 45,754,800 3,959 45,758,759 1.27 65,982,066 3694 65,985,760 1.83 0.56
ii) Individual shareholdersholding nominal sharecapital in excess of` 1 lakh 9,077,472 - 9,077,472 0.25 17,486,998 - 17,486,998 0.49 0.24

C K
Annual Report 2016-17 45
Directors’ Report
i) Category-wise Shareholding (Continued)
Category of No. of Shares held at the beginning No. of Shares held at the end % Changeshareholders of the year (As on 01-04-2016) of the year (As on 31-03-2017) during
the year
Demat Physical Total % of Demat Physical Total % ofTotal Total
shares shares
c) Others
Qualified ForeignInvestor - - - - - - - - -
Foreign Companies 957,000,543 - 957,000,543 26.58 712,000,543 - 712,000,543 19.75 -6.83
Non-resident Indians 2,176,897 5,000 2,181,897 0.06 2,729,571 5,000 2,734,571 0.08 0.02
Trust 978,856 - 978,856 0.03 8,150,967 - 8,150,967 0.23 0.20
Clearing Members 3,220,695 - 3,220,695 0.09 29,623,586 - 29,623,586 0.79 0.70
Sub-total (B)(2) 1,023,045,806 8,959 1,023,054,765 28.41 857,839,789 8,694 857,848,483 23.78 -4.63
Total PublicShareholding (B)=(B)(1)+(B)(2) 2,079,821,372 8,959 2,079,830,331 57.76 2,076,471,990 8,694 2,076,480,684 57.59 -0.17
C. Shares held byCustodian forGDRs & ADRs - - - - - - - - -
Grand Total (A+B+C) 3,600,500,419 8,959 3,600,509,378 100.00 3,605,319,537 8,694 3,605,328,231 100.00
ii) Shareholding of Promoters
Sr. Shareholder's Name Shareholding at the beginning of the year Shareholding at the end of the year % Change in No. No. of % of total % of shares No. of % of total % of shares Shareholding
shares shares pledged / shares shares pledged / during theof the encumbered of the encumbered year (#)
company to total shares company to total shares
1 Aditya Birla Nuvo Limited 837,526,221 23.26% - 837,526,221 23.23% - -0.03%
2 Birla TMT Holdings Pvt. Ltd. 283,565,373 7.88% - 283,565,373 7.87% - -0.01%
3 Hindalco Industries Limited 228,340,226 6.34% - 228,340,226 6.33% - -0.01%
4 Grasim Industries Limited 171,013,894 4.75% - 171,013,894 4.74% - -0.01%
5 Pilani Investment and IndustriesCorporation Limited - 0.00% - 8,168,500 0.23% - 0.23%
6 Mr. Kumar Mangalam Birla 233,333 0.01% - 233,333 0.01% - 0.00%
Total 1,520,679,047 42.24% - 1,528,847,547 42.41% - 0.17%
Note: # During the year under review, M/s. Pilani Investment and Industries Corporation Limited, a part of the Promoter Group, acquired 8,168,500 equity shares of ` 10 each through openmarket puchases. There is no change in the actual number of shares held by the other promoters. Change in percentage of total promoter shareholding from 42.24% to 42.41% is due to acqusitionof shares by Pilani Investment and Industries Corporation Limited and also due to ESOS allotment of 4,818,853 Equity Shares.
iii) Change in Promoters’ Sharehlding
Particulars Shareholding at the Cumulative Shareholdingbeginning of the year during the year
No. of % of total No. of % of totalshares shares of the shares shares of the
company company
At the beginning of the year 1,520,679,047 42.24% 1,520,679,047 42.24%
Date wise Increase / Decrease in Promoters Share During the year under review, M/s.Pilani Investment and Industries Corporation Limited, a part of theholding during the year specifying the reasons for Promoter Group, acquired 8,168,500 equity shares of ` 10 each through open market puchases. There is noincrease / decrease change in the actual number of shares held by the other promoters. Change in percentage of total promoter
shareholding from 42.24% to 42.41% is due to acqusition of shares by Pilani Investment andIndustries Corporation Limited and also due to ESOS allotment of 2,489,133 Equity Shares.
At the end of the year 1,528,847,547 42.41% 1,528,847,547 42.41%

C K
46 Idea Cellular Limited
Directors’ Report
iv) Shareholding Pattern of top ten Shareholders (other than Directors, Promoters and Holders of GDRs and ADRs)
Sr. Name of Shareholder Shareholding at the Change in shareholding Shareholding at theNo. beginning of the year (No.of shares) end of year
No. of % of total Bought Sold No. of % of totalshares shares of during during shares shares of
the company the year the year the company
1 Axiata Investments 1 (India) Limited 464,734,670 12.91 - - 464,734,670 12.89
2 Axiata Investments 2 (India) Limited 247,265,873 6.87 - - 247,265,873 6.85
3 P5 Asia Investments (Mauritius) Ltd.@ 245,000,000 6.80 - 245,000,000 - 0.00
4 First State Investments ICVC -Stewart 112,515,369 3.13 120,828,617 116,671,993 116,671,993 3.23Investor (Formerly National WestminsterBank Plc As Depositary Of First State AsiaPacific Leaders Fund A Sub Fund Of FirstState Investments ICVC)
5 Europacific Growth Fund@ 78,737,011 2.19 102,284,373 177,204,278 3,817,106 0.11
6 ICICI Prudential Life Insurance Company Ltd. 69,345,936 1.93 274,840,913 231,542,439 112,644,410 3.12
7 Vanguard International Growth Fund 53,399,872 1.48 52,437,143 62,614,377 43,222,638 1.20
8 Parvest Equity India@ 51,500,000 1.43 40,547,688 86,452,688 55,95,000 0.15
9 First State Investments ICVC -Stewart Investor 41,094,757 1.14 48,426,054 43,902,026 45,618,785 1.27(Formerly National Westminster Bank PlcAs Depositary Of First State Global EmergingMarkets Leaders Fund A Sub Fund Of FirstState Investments I)
10 Goldman Sachs India Limited$ - 0.00 45,425,515 - 45,425,515 1.26
11 Morgan Stanley Mauritius Company Limited$ 694,753 0.02 42,176,354 11,013,368 31,857,739 0.88
12 Franklin Templeton Investment Funds$ - 0.00 40,980,796 12,980,796 28,000,000 0.77
13 Citigroup Global Markets MauritiusPrivate Limited$ 1,827,668 0.05 33,874,523 11,689,440 24,012,751 0.67
14 International Finance Corporation@ 23,240,873 0.65 23,240,873 34,860,873 11,620,873 0.32
Notes:
1 The above information is based on the weekly beneficiary position received from Depositories. As it is not feasible to provide daily changes in shareholding,consolidated changes during the financial year 2016-17 has been provided.
2 Date wise increase / decrease in shareholding of the top ten shareholders is available on the Compnay’s website www. ideacellular.com.
@ Not there in the list of top ten shareholders as on March 31, 2017. Same has been reflected above as the respective shareholder was one of the top tenshareholder as on April 1, 2016.
$ Not there in the list of top ten shareholders as on April 1, 2016. Same has been reflected above as the respective shareholder was one of the top tenshareholder as on March 31, 2017.
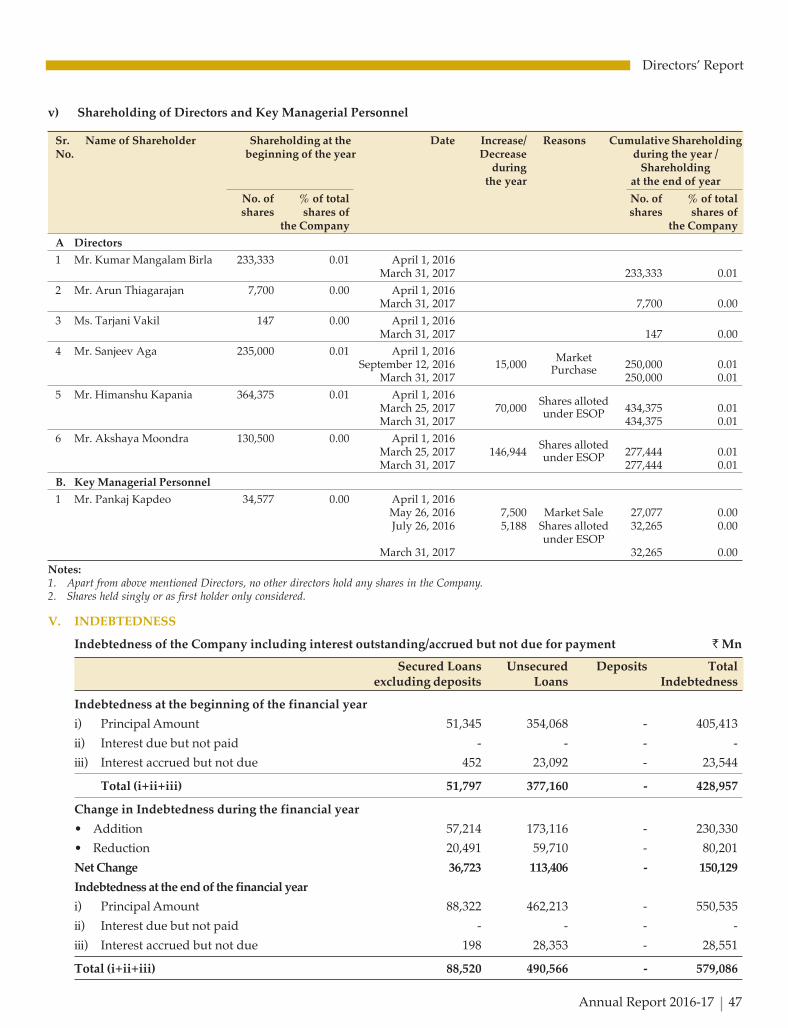
C K
Annual Report 2016-17 47
Directors’ Report
v) Shareholding of Directors and Key Managerial Personnel
Sr. Name of Shareholder Shareholding at the Date Increase/ Reasons Cumulative ShareholdingNo. beginning of the year Decrease during the year /
during Shareholdingthe year at the end of year
No. of % of total No. of % of totalshares shares of shares shares of
the Company the Company
A Directors
1 Mr. Kumar Mangalam Birla 233,333 0.01 April 1, 2016March 31, 2017 233,333 0.01
2 Mr. Arun Thiagarajan 7,700 0.00 April 1, 2016March 31, 2017 7,700 0.00
3 Ms. Tarjani Vakil 147 0.00 April 1, 2016March 31, 2017 147 0.00
4 Mr. Sanjeev Aga 235,000 0.01 April 1, 2016Market
September 12, 2016 15,000 Purchase 250,000 0.01March 31, 2017 250,000 0.01
5 Mr. Himanshu Kapania 364,375 0.01 April 1, 2016Shares alloted
March 25, 2017 70,000 under ESOP 434,375 0.01March 31, 2017 434,375 0.01
6 Mr. Akshaya Moondra 130,500 0.00 April 1, 2016Shares alloted
March 25, 2017 146,944 under ESOP 277,444 0.01March 31, 2017 277,444 0.01
B. Key Managerial Personnel
1 Mr. Pankaj Kapdeo 34,577 0.00 April 1, 2016May 26, 2016 7,500 Market Sale 27,077 0.00July 26, 2016 5,188 Shares alloted 32,265 0.00
under ESOPMarch 31, 2017 32,265 0.00
Notes:1. Apart from above mentioned Directors, no other directors hold any shares in the Company.2. Shares held singly or as first holder only considered.
V. INDEBTEDNESS
Indebtedness of the Company including interest outstanding/accrued but not due for payment ` Mn
Secured Loans Unsecured Deposits Totalexcluding deposits Loans Indebtedness
Indebtedness at the beginning of the financial year
i) Principal Amount 51,345 354,068 - 405,413
ii) Interest due but not paid - - - -
iii) Interest accrued but not due 452 23,092 - 23,544
Total (i+ii+iii) 51,797 377,160 - 428,957
Change in Indebtedness during the financial year
• Addition 57,214 173,116 - 230,330
• Reduction 20,491 59,710 - 80,201
Net Change 36,723 113,406 - 150,129
Indebtedness at the end of the financial year
i) Principal Amount 88,322 462,213 - 550,535
ii) Interest due but not paid - - - -
iii) Interest accrued but not due 198 28,353 - 28,551
Total (i+ii+iii) 88,520 490,566 - 579,086
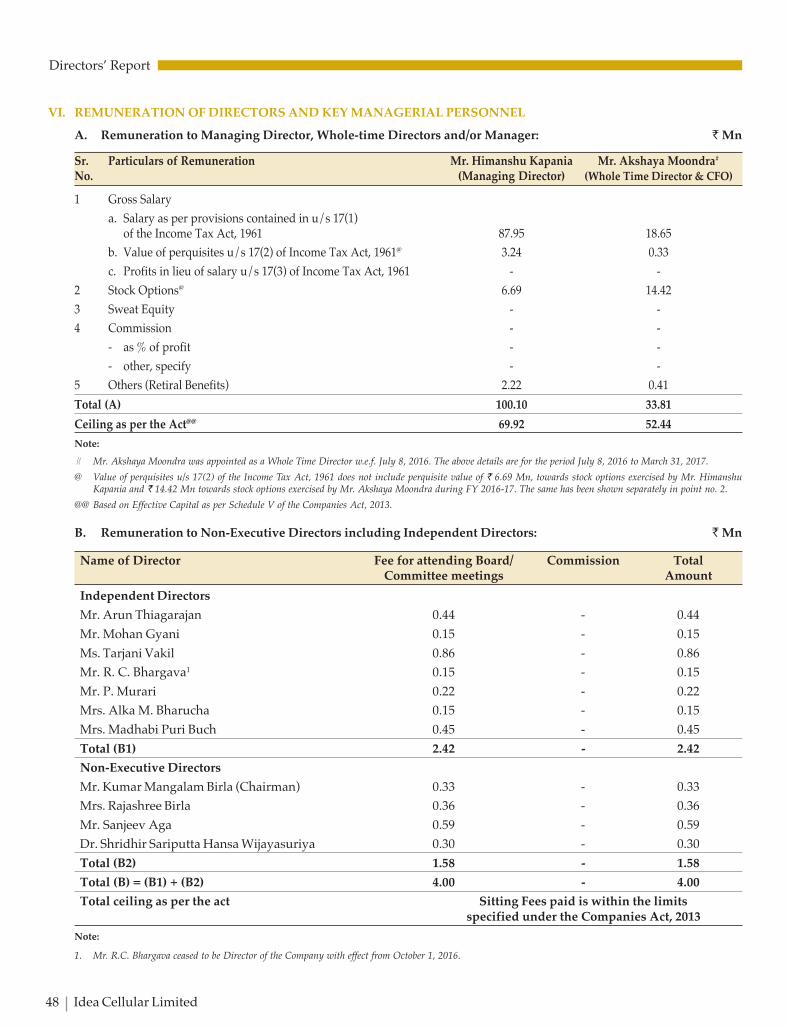
C K
48 Idea Cellular Limited
Directors’ Report
B. Remuneration to Non-Executive Directors including Independent Directors: ` Mn
Name of Director Fee for attending Board/ Commission TotalCommittee meetings Amount
Independent Directors
Mr. Arun Thiagarajan 0.44 - 0.44
Mr. Mohan Gyani 0.15 - 0.15
Ms. Tarjani Vakil 0.86 - 0.86
Mr. R. C. Bhargava1 0.15 - 0.15
Mr. P. Murari 0.22 - 0.22
Mrs. Alka M. Bharucha 0.15 - 0.15
Mrs. Madhabi Puri Buch 0.45 - 0.45
Total (B1) 2.42 - 2.42
Non-Executive Directors
Mr. Kumar Mangalam Birla (Chairman) 0.33 - 0.33
Mrs. Rajashree Birla 0.36 - 0.36
Mr. Sanjeev Aga 0.59 - 0.59
Dr. Shridhir Sariputta Hansa Wijayasuriya 0.30 - 0.30
Total (B2) 1.58 - 1.58
Total (B) = (B1) + (B2) 4.00 - 4.00
Total ceiling as per the act Sitting Fees paid is within the limitsspecified under the Companies Act, 2013
Note:
1. Mr. R.C. Bhargava ceased to be Director of the Company with effect from October 1, 2016.
VI. REMUNERATION OF DIRECTORS AND KEY MANAGERIAL PERSONNEL
A. Remuneration to Managing Director, Whole-time Directors and/or Manager: ` Mn
Sr. Particulars of Remuneration Mr. Himanshu Kapania Mr. Akshaya Moondra#
No. (Managing Director) (Whole Time Director & CFO)
1 Gross Salary
a. Salary as per provisions contained in u/s 17(1)of the Income Tax Act, 1961 87.95 18.65
b. Value of perquisites u/s 17(2) of Income Tax Act, 1961@ 3.24 0.33
c. Profits in lieu of salary u/s 17(3) of Income Tax Act, 1961 - -
2 Stock Options@ 6.69 14.42
3 Sweat Equity - -
4 Commission - -
- as % of profit - -
- other, specify - -
5 Others (Retiral Benefits) 2.22 0.41
Total (A) 100.10 33.81
Ceiling as per the Act@@ 69.92 52.44
Note:
# Mr. Akshaya Moondra was appointed as a Whole Time Director w.e.f. July 8, 2016. The above details are for the period July 8, 2016 to March 31, 2017.
@ Value of perquisites u/s 17(2) of the Income Tax Act, 1961 does not include perquisite value of ` 6.69 Mn, towards stock options exercised by Mr. HimanshuKapania and ` 14.42 Mn towards stock options exercised by Mr. Akshaya Moondra during FY 2016-17. The same has been shown separately in point no. 2.
@@ Based on Effective Capital as per Schedule V of the Companies Act, 2013.

C K
Annual Report 2016-17 49
Directors’ Report
C. Remuneration to Key Managerial Personnel other than Managing Director / Whole-time Directors / Manager:
` Mn
Sr. Particulars of Remuneration Key Managerial Personnel Total
No. Mr. Akshaya Mr. Pankaj Amount
Moondra KapdeoChief Financial Company
Officer# Secretary
1 Gross Salary
a. Salary as per provisions contained inSection 17(1) of the Income Tax Act, 1961 3.74 7.53 11.27
b. Value of perquisites u/s 17(2) of Income Tax Act, 1961@ 0.09 0.04 0.13
c. Profits in lieu of salary under section 17(3) of Income Tax Act, 1961 - - -
2 Stock Options@ - 0.30 0.30
3 Sweat Equity - - -
4 Commission - - -
- as % of profit - - -
- other, specify - - -
5 Others (Retiral Benefits) 0.12 0.40 0.52
Total 3.95 8.27 12.22
Note:
# Mr. Akshaya Moondra was appointed as a Whole Time Director w.e.f. July 8, 2016. The above details are for the period April 1, 2016 to July 7, 2016.
@ Value of perquisites u/s 17(2) of the Income Tax Act, 1961 does not include perquisite value of ` 0.30 Mn, towards stock options exercised by Mr. Pankaj Kapdeoduring FY 2016-17. The same has been shown separately in point no. 2.
VII. PENALTIES / PUNISHMENT/ COMPOUNDING OF OFFENCES
There were no penalties / punishment / compounding of offences for breach of any section of Companies Act against theCompany or its Directors or other officers in default, if any, during the year.

C K
50 Idea Cellular Limited
Directors’ Report
Dividend Distribution Policy
This policy applies to the distribution of dividend by Idea Cellular Limited (‘the Company’) in accordance with the provisions of theCompanies Act, 2013 and the SEBI (Listing Obligations and Disclosure Requirements) Regulations, 2015.
1.0 Introduction
1.1 As per the SEBI (Listing Obligations and Disclosure Requirements) Regulations, 2015, as amended, the Company is required toformulate and disclose its Dividend Distribution Policy. Accordingly, the Board of Directors of the Company (‘the Board’) hasapproved this Dividend Distribution Policy.
1.2 The objective of this policy is to provide clarity to stakeholders on the dividend distribution framework to be adopted by theCompany. The Board of Directors shall recommend dividend in compliance with this policy, the provisions of the CompaniesAct, 2013 and Rules made thereunder and other applicable legal provisions.
2.0 Target Dividend Payout
2.1 As per the SEBI (Listing Obligations and Disclosure Requirements) Regulations, 2015, as amended, the Company is required toformulate and disclose its Dividend Distribution Policy. Accordingly, the Board of Directors of the Company (‘the Board’) hasapproved this Dividend Distribution Policy.
2.2 Dividend will be declared out of the current year’s Profit after Tax of the Company.
2.3 Only in exceptional circumstances including but not limited to loss after tax in any particular financial year, the Board mayconsider utilising retained earnings for declaration of dividends, subject to applicable legal provisions.
2.4 ‘Other Comprehensive Income’ (as per applicable Accounting Standards) which mainly comprises of unrealized gains / losses,will not be considered for the purpose of declaration of dividend.
2.5 The Board will endeavor to achieve a dividend payout ratio (gross of dividend distribution tax) in the range of 5% to 25% of theStandalone Profit after Tax, net of dividend payout to preference shareholders, if any.
3.0 Factors to be considered for Dividend Payout
The Board will consider various internal and external factors, including but not limited to the following before making anyrecommendation for dividend:
- Stability of earnings
- Cash flow position from operations
- Future capital expenditure, inorganic growth plans and reinvestment opportunities
- Industry outlook and stage of business cycle for underlying businesses
- Leverage profile and capital adequacy metrics
- Overall economic/regulatory environment
- Contingent liabilities
- Past dividend trends
- Buyback of shares or any such alternate profit distribution measure
- Any other contingency plans
4.0 General
Retained earnings will be used for the Company’s growth plans, working capital requirements, debt repayments and othercontingencies.
5.0 Review
This policy would be subject to revision / amendment on a periodic basis, as may be necessary.
6.0 Disclosure
This policy (as amended from time to time) will be available on the Company’s website and in the annual report.
Annexure ‘I’ to the Directors’ Report

C K
Management Discussion And Analysis Report
Annual Report 2016-17 51
Management Discussion And Analysis Report
112.0 40.0
67.9 71.8
73.8 74.2
56.5%59.0%
63.8%
68.7%
73.7%
78.7%
30%
45%
60%
75%
90%
-
100
200
300
400
500
600
700
800
900
1,000
1,100
FY12 FY13 FY14 FY15 FY16 Feb'17
VLR EoP VLR Adds VLR Penetration
596525 533 556 589
672
323 343 372414 445
493
35.2%
39.5%41.1%
42.7% 43.0% 42.3%
20.0%
25.0%
30.0%
35.0%
40.0%
45.0%
100
200
300
400
500
600
700
FY12 FY13 FY14 FY15 FY16 Feb'17
Urban Subs Rural Subs Rural Subs % to total
Indian Wireless Sector
The financial year 2016-17 (FY17) was a period marked with theseveral challenges emanating from introduction of large scale freeservices by a new entrant, creating unforeseen disruption in thesector and resulted in, for the first time, in the history of the sector,a year on year revenue decline. These free services on one handtransformed the sector with data traffic volumes growingsignificantly, forcing operators to commit significant investments,both in spectrum and networks, in order to remain competitive.However, on other hand, declining revenues and profitability hadseverely impacted the ability of most of the operators to commitlarge investments towards long term value creators. Thisparadoxical scenario of large investment requirement coupledwith negative return forced operators to combine their operationsor exit from the market, as evident from announcement of variousdeals among operators.
On subscriber front, India, the second largest wireless marketacross globe, continued its leadership position, in terms of newsubscriber additions, for the third year in a row. The Indianwireless Industry added ~131 million subscriber during the 11months period from April 2016 to February 2017, surpassing thenet subscriber addition in world’s largest wireless market ofChina. The total reported subscriber base reached to 1.16 billionas of February 2017.
The VLR subscriber addition during the period from April, 2016to February, 2017 stands at 74.16 million, taking the VLRsubscriber base to 1.01 billion as of February 2017 and VLR toReported subscriber ratio to 86.8%.
Industry Subscriber Additions (on VLR)
The VLR subscriber penetration is still at around 78.7%, againstpenetration of around 90.7% based on reported subscribers, far belowglobal average, indicating new subscriber growth will continue for fewmore years.
The large proportion of the new subscriber continue to be addedfrom rural India, natural strength of Idea Cellular. Over the periodof last five years (from March 2012 to Feb 2017), the rural subscriberbase has expanded exponentially, from 323 million in FY12 to 493million as of February 2017, an addition of 169 million customers,in comparison to an addition of 76 million urban subscribers takingthe Urban subscriber base to 672 million as on February 2017 incomparison to 596 million subscribers in FY 2012.
Inspite of rapid expansion in rural subscriber base, the ruralpenetration is still at a relative low level of 55.9% indicating thestrong new subscriber growth potential from the rural market,which is the stronghold of Idea Cellular. On an overall basis forIdea 55.4% of the company EoP subscriber base of 193 million isfrom rural and deep hinter land markets, highest % across allindustry operators as per TRAI release.
Industry Subscriber - Rural Urban split (on EoP)
The low rural subscriber penetration augurs well for the expected robustsubscriber growth in future.
The Indian wireless broadband industry (>512 kbps) subscriberbase has increased to 243.13 Mn as of February, 2017, an additionof 110.36 Mn subscribers in one year; reflecting a solid growth of83.1%. The wireless broadband subscriber penetration (of reportedIndustry overall subscribers) improved from 12.8% as of March,2016 to 20.9% as of February, 2017, which is among the lowestwireless broadband penetration in the world. With massive rolloutof high speed broadband services on 3G and 4G, falling entryprices for smartphone, affordable mobile data rates and range ofDigital Applications, Content and Services, India is on the cuspof a major wireless broadband adoption cycle across alldemographic segments of population.
The wireless internet penetration still remains low at 32.8% evenpost addition of 58 Mn internet subscribers between December2015 to December 2016 (TRAI performance indicator report).
Given a very low fixed line penetration of 1.9% in India, internetadoption through wireless remains the only option for thesubscriber to experience the world of internet.
The foundation of a Pan India ‘Digital India’ is being laid withUbiquitous 3G & 4G coverage and World’s lowest Mobile Datatariffs after lowest Mobile Voice Tariffs which catapulted Indiato the 2nd largest Mobile Market in the world. It is inevitablethus Internet Access will be democratized in India. WirelessBroadband usage is slowly but surely moving from ‘Elite’ and‘Knowledge Worker’ represented by Urban Youth to massmarket attracting all socio economic segments like smallbusinesses, housewives, senior citizens and shopkeepers etcand all geographical segments across Metro, Small towns andRural areas.
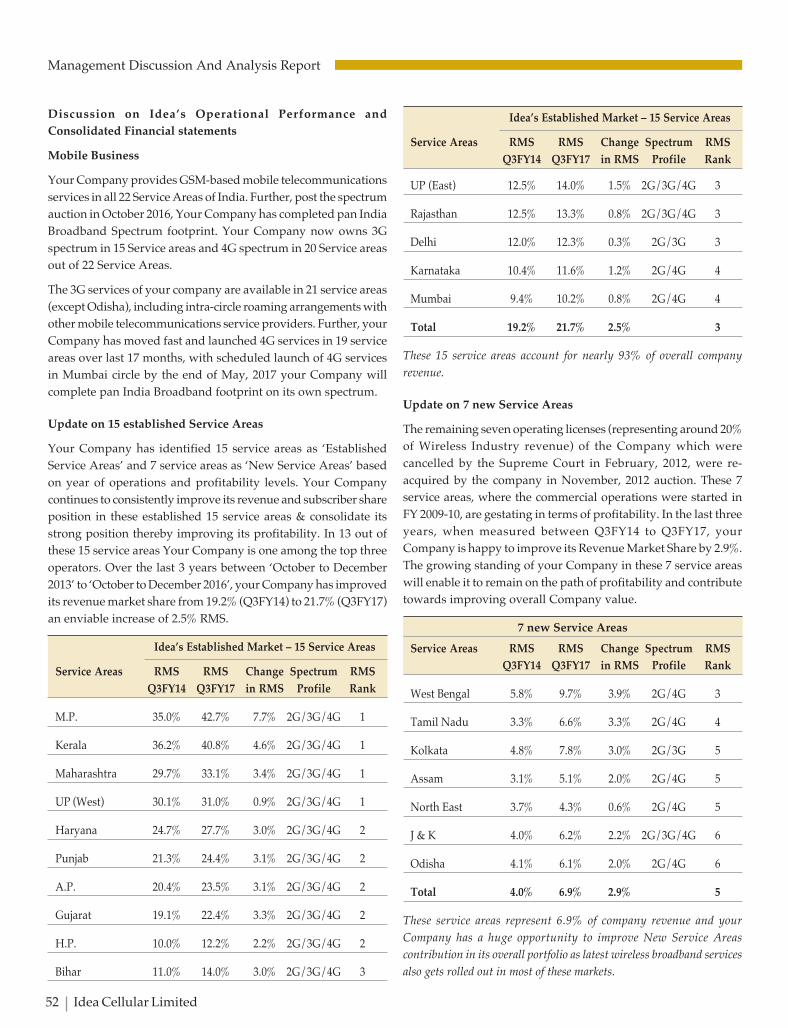
C K
Management Discussion And Analysis Report
52 Idea Cellular Limited
Discussion on Idea’s Operational Performance and
Consolidated Financial statements
Mobile Business
Your Company provides GSM-based mobile telecommunications
services in all 22 Service Areas of India. Further, post the spectrum
auction in October 2016, Your Company has completed pan India
Broadband Spectrum footprint. Your Company now owns 3G
spectrum in 15 Service areas and 4G spectrum in 20 Service areas
out of 22 Service Areas.
The 3G services of your company are available in 21 service areas
(except Odisha), including intra-circle roaming arrangements with
other mobile telecommunications service providers. Further, your
Company has moved fast and launched 4G services in 19 service
areas over last 17 months, with scheduled launch of 4G services
in Mumbai circle by the end of May, 2017 your Company will
complete pan India Broadband footprint on its own spectrum.
Update on 15 established Service Areas
Your Company has identified 15 service areas as ‘Established
Service Areas’ and 7 service areas as ‘New Service Areas’ based
on year of operations and profitability levels. Your Company
continues to consistently improve its revenue and subscriber share
position in these established 15 service areas & consolidate its
strong position thereby improving its profitability. In 13 out of
these 15 service areas Your Company is one among the top three
operators. Over the last 3 years between ‘October to December
2013’ to ‘October to December 2016’, your Company has improved
its revenue market share from 19.2% (Q3FY14) to 21.7% (Q3FY17)
an enviable increase of 2.5% RMS.
Idea’s Established Market – 15 Service Areas
Service Areas RMS RMS Change Spectrum RMS
Q3FY14 Q3FY17 in RMS Profile Rank
M.P. 35.0% 42.7% 7.7% 2G/3G/4G 1
Kerala 36.2% 40.8% 4.6% 2G/3G/4G 1
Maharashtra 29.7% 33.1% 3.4% 2G/3G/4G 1
UP (West) 30.1% 31.0% 0.9% 2G/3G/4G 1
Haryana 24.7% 27.7% 3.0% 2G/3G/4G 2
Punjab 21.3% 24.4% 3.1% 2G/3G/4G 2
A.P. 20.4% 23.5% 3.1% 2G/3G/4G 2
Gujarat 19.1% 22.4% 3.3% 2G/3G/4G 2
H.P. 10.0% 12.2% 2.2% 2G/3G/4G 2
Bihar 11.0% 14.0% 3.0% 2G/3G/4G 3
UP (East) 12.5% 14.0% 1.5% 2G/3G/4G 3
Rajasthan 12.5% 13.3% 0.8% 2G/3G/4G 3
Delhi 12.0% 12.3% 0.3% 2G/3G 3
Karnataka 10.4% 11.6% 1.2% 2G/4G 4
Mumbai 9.4% 10.2% 0.8% 2G/4G 4
Total 19.2% 21.7% 2.5% 3
These 15 service areas account for nearly 93% of overall company
revenue.
Update on 7 new Service Areas
The remaining seven operating licenses (representing around 20%
of Wireless Industry revenue) of the Company which were
cancelled by the Supreme Court in February, 2012, were re-
acquired by the company in November, 2012 auction. These 7
service areas, where the commercial operations were started in
FY 2009-10, are gestating in terms of profitability. In the last three
years, when measured between Q3FY14 to Q3FY17, your
Company is happy to improve its Revenue Market Share by 2.9%.
The growing standing of your Company in these 7 service areas
will enable it to remain on the path of profitability and contribute
towards improving overall Company value.
7 new Service Areas
Service Areas RMS RMS Change Spectrum RMS
Q3FY14 Q3FY17 in RMS Profile Rank
West Bengal 5.8% 9.7% 3.9% 2G/4G 3
Tamil Nadu 3.3% 6.6% 3.3% 2G/4G 4
Kolkata 4.8% 7.8% 3.0% 2G/3G 5
Assam 3.1% 5.1% 2.0% 2G/4G 5
North East 3.7% 4.3% 0.6% 2G/4G 5
J & K 4.0% 6.2% 2.2% 2G/3G/4G 6
Odisha 4.1% 6.1% 2.0% 2G/4G 6
Total 4.0% 6.9% 2.9% 5
These service areas represent 6.9% of company revenue and your
Company has a huge opportunity to improve New Service Areas
contribution in its overall portfolio as latest wireless broadband services
also gets rolled out in most of these markets.
Idea’s Established Market – 15 Service Areas
Service Areas RMS RMS Change Spectrum RMS
Q3FY14 Q3FY17 in RMS Profile Rank

C K
Management Discussion And Analysis Report
Annual Report 2016-17 53
Idea Spectrum Holding
Service Areas FDD TDD FDD GSM Broadband Carrier
900 1800 2100 Total 2300 2500 Total (2x)* (2G) 3G 4G
+TDD services
Maharashtra 9.0 11.0 5.0 25.0 10.0 10.0 20.0 70.0 P 2 5
Kerala 6.0 10.0 5.0 21.0 10.0 10.0 20.0 62.0 P 1 5
Madhya Pradesh 7.4 11.6 5.0 24.0 10.0 20.0 30.0 78.0 P 2 7
Uttar Pradesh (West) 5.0 9.4 5.0 19.4 10.0 10.0 48.8 P 1 4
Gujarat 5.0 10.0 5.0 20.0 10.0 10.0 50.0 P 1 4
Andhra Pradesh 5.0 6.0 5.0 16.0 10.0 10.0 42.0 P 1 3
Punjab 5.6 10.0 5.0 20.6 41.2 P 1 2
Haryana 6.0 10.8 5.0 21.8 10.0 10.0 53.6 P 1 4
8 Leadership Circle
(Sub Total) 49.0 78.8 40.0 167.8 30.0 80.0 110.0 445.6 10 32
Uttar Pradesh (East) 6.2 10.0 16.2 10.0 10.0 42.4 P 1 3
Rajasthan 11.2 5.0 16.2 10.0 10.0 42.4 P 1 3
Bihar 10.80 5.0 15.8 10.0 10.0 41.6 P 1 3
Himachal Pradesh 9.8 5.0 14.8 10.0 10.0 39.6 P 1 3
Delhi 5.0 8.6 13.6 27.2 P 1 0
Mumbai 6.4 5.0 11.4 22.8 P 1
Karnataka 5.0 6.0 11.0 22.0 P 1
7 Emerging Circle
(Sub Total) 10.0 59.0 30.0 99.0 40.0 40.0 238.0 5 12
Tamil Nadu 11.4 11.4 22.8 P 1
Kolkata 5.0 5.0 10.0 20.0 P 1
West Bengal 11.40 11.4 10.0 10.0 32.8 P 3
Odisha 10.0 10.0 10.0 10.0 30.0 P 3
Assam 10.0 10.0 10.0 10.0 30.0 P 3
North East 11.0 11.0 10.0 10.0 32.0 P 3
Jammu & Kashmir 10.0 5.0 15.0 10.0 10.0 40.0 P 1 3
7 New Circle
(Sub Total) 68.8 10.0 78.8 50.0 50.0 207.6 2 14
Total 22 Circle 59.0 206.6 80.0 345.6 30.0 170.0 200.0 891.2 22 17 57
*FDD spectrum consisting of uplink and downlink
5 MHz of paired FDD spectrum = 1 carrier, 10 MHz of unpaired TDD spectrum =1.5 carrier.
Competitive Spectrum Profile
Below table provides the spectrum held by the company across all service areas and the spectrum split over use across various
technologies of GSM (2G), HSPA+(3G) and LTE (4G):

C K
Management Discussion And Analysis Report
54 Idea Cellular Limited
17.2
36.5
60.4
78.1
7.2 14.5
23.6 24.7
-
10.0
20.0
30.0
40.0
50.0
60.0
70.0
80.0
90.0
March'14 March'15 March'16 March'17
Number of 3G or/and 4G handsets on Network (Mn)
Number of Broadband(3G and 4G) Subscribers (Mn)
19.3
23.9
17.7
Broadband Services
4G Services
In October 2016 spectrum auction your Company had acquired
2x64.6 MHz (FDD) spectrum in frequency bands of 1800 MHz
and 2100 MHz to expand its 4G spectrum ownership from 11 to
20 service areas (excluding Delhi and Kolkata), covering 9 new
service areas of Gujarat, Uttar Pradesh (West), Uttar Pradesh
(East), Bihar & Jharkhand, Rajasthan, Mumbai, West Bengal,
Assam and Jammu & Kashmir. Further, with acquisition of 200
MHz (TDD) spectrum in frequency band of 2300 MHz and 2500
MHz, Idea has spectrum to address the future requirement of
capacity as it now holds 57 4G carriers (across 20 service areas) in
comparison to 12 carrier before October 2016 auction. The 4G
spectrum profile of the company covers ~94% of its own revenue
and ~90% of industry revenue in these 20 service areas.
Company remained on track of expanding its broadband coverage
on the spectrum acquired in October 2016 auction. The company
has launched 4G services in 19 service areas and is scheduled to
launch 4G services in Mumbai service area by end of May, 2017.
With this company will complete its 4G footprint in all the 20
Service areas where it has got 4G Spectrum. As on 31st March,
2017 Company’s 4G services expands in 3,400 towns and 19,800
villages in 19 service areas, covering 272 million Indians, 23.6%
of population in these 19 circles.
3G Services
Your Company provides 3G services in 21 service areas of India
(except Odisha), including through Intra-Circle Roaming (ICR)
arrangements with other operators. In October, 2016 spectrum
auction Idea Cellular prudently acquired 5 MHz spectrum in 2100
MHz frequency band in high population service areas of Bihar
and Rajasthan to offer 3G services. The company owns 17 carriers
(15 on 2100 MHz and 2 on 900 MHz), to offer 3G services in 15
service areas. These 15 service areas covers ~86% of its revenue,
~84% of its subscribers and ~69% of national mobile industry
revenue. Idea launched its 3G services in Bihar & Rajasthan during
the last quarter of the financial year.
The high speed broadband offerings (3G and/or 4G) of your
Company is currently available in all 22 service areas.
Idea’s Wireless Broadband (3G+4G) Users and Device Base
The number of devices supporting broadband data on Idea
network has increased from 60.4 million as of March 31, 2016 to
78.1 million as of March 31, 2017, a growth of 29.3%. Out of these
78.1 million devices, 24.3 million devices are 4G compatible. The
subscribers who are actively using data on 3G/4G platform and
enjoying high speed wireless broadband services reached to 24.7
million as of March, 2017, compared to 23.6 Mn subscribers as of
March, 2016, a growth of 4.7%.
Long Distance and Other Services
Your Company holds licenses for NLD, ILD and ISP services. Idea
NLD currently carries 98.3% of its captive NLD minutes. Your
Company ILD services now handle almost 100% of captive ILD
outgoing minutes, besides bringing large volume of incoming
minutes from top international carriers across the globe. Company
launched its ISP services in FY 2012 to cater to the captive
requirement of its mobile business, which also offer ISP services
to external customers like small ISP and enterprise customers for
their wholesale Internet backhaul needs. Idea ISP currently
handles all captive subscriber traffic requirements.
Your Company is consistently investing in optical fibre cable
(OFC) transmission network to tap the future potential of wireless
broadband and currently has laid and energized over 144,600 km
OFC, in comparison to over 93,400 km two years back (Q4FY15).
In FY 2017, your Company did annual fibre rollout of 29,100 KM
against 22,100 KM in FY 2016, gearing itself to tap emerging
wireless broadband demand. Your Company has over 9,846 OFC
PoPs (4G, 3G & 2G) in all service areas. The fibre backhaul network
of the company optimally serves our 2G / 3G / NLD / ILD / ISP
/ Wireless Broadband needs. Your Company has also introduced
worlds’ latest high capacity 100G DWDM network technology to
cater to rising data demand. Details with reference to long distance
business is as follows:
For the YearUnit
FY17 FY16 FY15 FY14
Total NLD Minutes Mn 67,005 65,041 60,497 53,638
Total ILD Minutes Mn 10,219 11,242 8,246 5,544
ISP Capacity* Gbps 325 184.2 124 54.7
Optical Fibre
Cable (OFC)* KM 1,44,600 1,15,500 93,400 82,000
*approximate
Digital Services
On January 30, 2017, the company announced its arrival into the
digital world with the launch of 3 new exciting Mobile Apps –
Idea Music Lounge, Idea Movie Club and Idea Game Spark –
giving birth to a “Digital Idea”. These digital content applications
will serve as a one-stop entertainment destination initially for Idea

C K
Management Discussion And Analysis Report
Annual Report 2016-17 55
subscribers, providing access on the fingertips to a large collection
of popular and premium content, including a rich assortment of
Hindi, Vernacular and International content. Idea Music Lounge,
Idea Movie Club and Idea Game Spark offer a complete suite of
digital entertainment services.
l Idea Music Lounge offers a rich library of nearly 3 million
Indian and international music tracks initially, which will be
expanding to nearly 20 million tracks soon and is available on
Google Play Store and iOS store. Idea Music Lounge hosts
diverse content not only across 13 Indian languages, including
Bollywood, South Indian Cinema etc, but also across
International artists, albums and tracks from several major
Music labels. As of March 31, 2017 over 550,000 customers
are using Idea Music app.
l Idea Movie Club caters to the ever-growing video content
needs of consumers, offering thousands of blockbuster
movies, Live TV, 7 days catch-up TV, along with a series of
original content and Short Videos across all genres and several
languages. The rich content of videos and movies from
Bollywood, South Indian & Regional Cinema will appeal to
people across all age groups, including kids, for whom there
are a host of animation and learning videos. Live and Catch
up TV including premium channels, is offered in collaboration
with Ditto TV. The app is available on Google Play Store and
iOS store. As of March 31, 2017 nearly 275,000 customers are
using Idea Movies Club app.
l Idea Game Spark is the ultimate gaming destination with a
collection of over 1,600 games across all genres. Targeted at
the gaming aficionado and the casual gamer, the games can
be played both in the online and offline mode. As of March
31, 2017 over 500,000 customers are using Idea Game Spark.
These apps are competitively priced. With the launch of these apps
the company has taken one more step towards transformation
from a pure play mobile operator to an integrated digital services
and solutions provider.
Network Infrastructure and Coverage
Your Company has rolled out 4G network in 19 service area at
breakneck speed since the launch of latest 4G services at the end
of Q3FY16. Apart from laying 4G network, your Company
continues to expand its 2G and 3G network aggressively during
the year. It has added 4,653 2G sites on its network, taking the 2G
site count to 131,486 as on March 31, 2017. On 3G front company
added 19,142 3G cell sites in the 15 service areas where it provides
3G services with its own spectrum. The company ended the
financial year with 69,202 3G sites. Further, after launching 4G
services in December 2015, your Company has rolled out total
40,852 4G sites till March 2017, as compared to 14,643 sites as of
March 2016. During current financial year your Company added
a total 50,004 sites on overall basis (2G+3G+4G), highest ever
rollout in a year by the company.
Company has expanded its GSM coverage to nearly 400,000 towns
and villages as of March, 2017 from around 391,000 towns and
villages as of March, 2016. The 2G network of your Company
covers nearly 82% of Indian Population (around 1.21 Bn Indians).
In the 15 service areas where company own 3G spectrum the
population coverage is expanded to 45.6%, reaching 409 Mn
Indians across 92,000 towns and villages. In terms of 4G, your
Company covers more than 23% of Indian over 23,000 towns and
villages in 19 Service Areas and aggressively expanding its
coverage further.
Tower Portfolio
Own Towers
Your Company along with its subsidiary Idea Cellular
Infrastructure Services Limited (ICISL), owns 9,977 towers as on
March 31, 2017. There are 17,210 tenants on these towers, with an
overall tenancy ratio of 1.72. During the last one year the company
has added 233 towers and over 1000 new tenancies as it
reorganized itself to improve its tower tenancy ratio. With this
tower team reorganization there is now complete focus on tower
operations as an independent entity which will result in combined
optimization and growth of tower portfolio. During the year your
Company has completed transfer of its own towers to ICISL (a
wholly owned subsidiary) and almost all towers are under a single
legal entity since of August 1, 2016.
Indus Towers
Besides the tower portfolio your Company has also invested in
Indus Towers Ltd. (Indus), which is a joint venture between Bharti
Infratel Ltd., Vodafone India Ltd. and Idea Cellular Ltd. through
its subsidiary Aditya Birla Telecom Ltd. (ABTL). It is one of the
world’s leading tower company with 122,730 towers and tenancy
ratio of 2.35 as of March 31, 2017. ABTL held 16% equity stake in
Indus till January 31, 2017. Pursuant to receipt of the approval
of the Hon’ble High Court of Bombay for its application under
section 100 of the Companies Act, 1956, for distribution of assets
with consequent reduction in share capital held by P5 Asia Holding
Investments (Mauritius) Limited (P5 Asia) [earlier beneficially
holding ~30.3% of the total equity share capital of ABTL], P5 Asia
holds direct equity stake of 4.85% of Indus. Consequently ABTL
now holds only 11.15% in Indus Towers Limited.
Revenue Market Share
Your Company remains focused on Revenue Market Share (RMS)
improvement and gaining higher Incremental Revenue Market
Share (IRMS). While the former reflect the positioning of the
company in the league tables, later reflects the current market
power of the company. Your Company has improved its Revenue
Market Share by around 0.4% to 19.0% for calendar year 2016
from 18.6% in calendar year 2015. During the same period your
Company gained incremental market share of 34.7%.

C K
Management Discussion And Analysis Report
56 Idea Cellular Limited
21.7%
30.1%28.0%
40.6%
34.7%
14.7%16.0%
17.1%18.6% 19.0%
CY12 CY13 CY14 CY15 CY16
Idea IRMS (YoY) Idea RMS (EoP)
Growing Revenue of Idea in Indian Mobility Sector
Your Company has consistently improved its revenue market share and
constantly gaining higher Incremental Revenue Market Share than its
current market share over last 5 years.
Quality Subscriber Base
Your Company is the sixth largest mobile telecommunications
company (counted on operations in a single country) in the world
based on number of subscribers (GSMA Intelligence, as of
December, 2016) servicing about 198 Mn active subscribers on
VLR as of March 31, 2017. This large base of subscribers provides
a great platform to your Company for upgrading the pure voice
customers to Wireless Data Services, Digital content & Payment
services in future. Your Company has always been vigilant in
monitoring the quality of its subscriber base. The latest (February,
2017) data released by the TRAI for active subscribers (VLR
subscribers) reaffirms quality of Company’s subscriber base as
among the best in terms of percentage of active subscribers. As
of February 2017, Your Company has 101.4% of reported
subscribers on VLR, which is highest in the industry. The End of
Period (EoP) subscriber market share (on VLR) as on February,
2017 stands at 19.4%. During the 12 months from February, 2016
to February, 2017 Industry added 85.4 million subscriber on VLR
primarily led by addition of 75.7 million subscribers by new
entrant. Despite the prolonged period of free offering Idea added
a healthy 13.7 million VLR subscribers during this 12 month
period. With over 198 million VLR subscribers the company
opens multiple vistas for growth in Broadband, Digital Content
and Payment Services etc.
Mobile Number Portability
The Mobile Number Portability (MNP) was implemented nation-
wide on 20th January, 2011 and nearly 223.1 million customers
have availed of the MNP facility offered by Indian Mobile Industry.
Also government has introduced National MNP (NMNP) from
July 3, 2015. The trends emerging from MNP and NMNP are
clearly distinguishing the strong operators in terms of customers’
preference for better quality of services and brand value. Over
the last 72 months in the MNP space, your Company has
maintained leadership position on overall MNP Net Adds. As on
March 31, 2017, your Company has a net MNP gain of
22.1 million customers from other telecom operators with ‘one
out of every four’ existing mobile customers, who chooses to port
out from their existing mobile operator preferring to shift and stay
with world class Idea services.
Your Company’s success on the MNP front clearly demonstrate
the success of your Company’s ‘Customer Centricity’ program
and re-affirms your Company strength of its seamless network
coverage, low call drop rate, better voice & mobile data quality,
advanced and precise billing systems on pre-paid and post-paid,
customer responsive call centers and innovative/ competitive
product offerings.
Idea Mobile Banking Services
Prepaid Payment Instrument (PPI)
PPI is commonly known as semi closed wallet. RBI granted
Certificate of Authorisation for PPI to your Company in November
2013. Your Company commenced PPI services in July 2014 and
currently operates through retailer service points in 17 service
areas. Your Company is also acquiring new mobile wallet
customers digitally through Idea Web and Idea App across Pan
India. Idea Money wallet is available on Android Platform and
iOS Platform. The company offers both cash and web loading
(through net banking) into the wallets. With PPI wallet balance
one can recharge prepaid accounts for Idea and other operator’s,
recharge DTH accounts, pay bills and make mobile wallet to
mobile wallet transfers (only Idea Money to Idea Money). Idea
Money has tie ups with online and offline merchants like Book
My show, Dominos, Bajaj Allianz, LIC etc. Idea Money wallet also
caters to Domestic Money Remittance (DMR) through retailer
assisted model. Total throughput for DMR during FY17 stands at
` 11,860 million. These wallet accounts can be opened with
minimum KYC for balance up to ` 20,000/-.
The above Services are available to non-data users through our
retailer assisted touch points. During the year ended March 31,
2017 it added 9 million new wallet customers. Idea Money as of
31st March, 2017 has EOP base of more than 11 million PPI mobile
wallet customers & efforts are on to exponentially increase the
number of active PPI digital wallet users.
Details with reference to PPI business is as follows:
For the QuarterUnit
Q4FY17 Q3FY17 Q2FY17 Q1FY17 Q4FY16
EoP Wallets Mn 11,012 7,006 5,012 3,407 2,053
Transaction Value INR Mn 2,961 1,400 1,055 779 405
Transaction Count ‘000 6,891 4,139 3,321 2,747 3,502
Average Transaction
Value INR 424 338 317 334 221
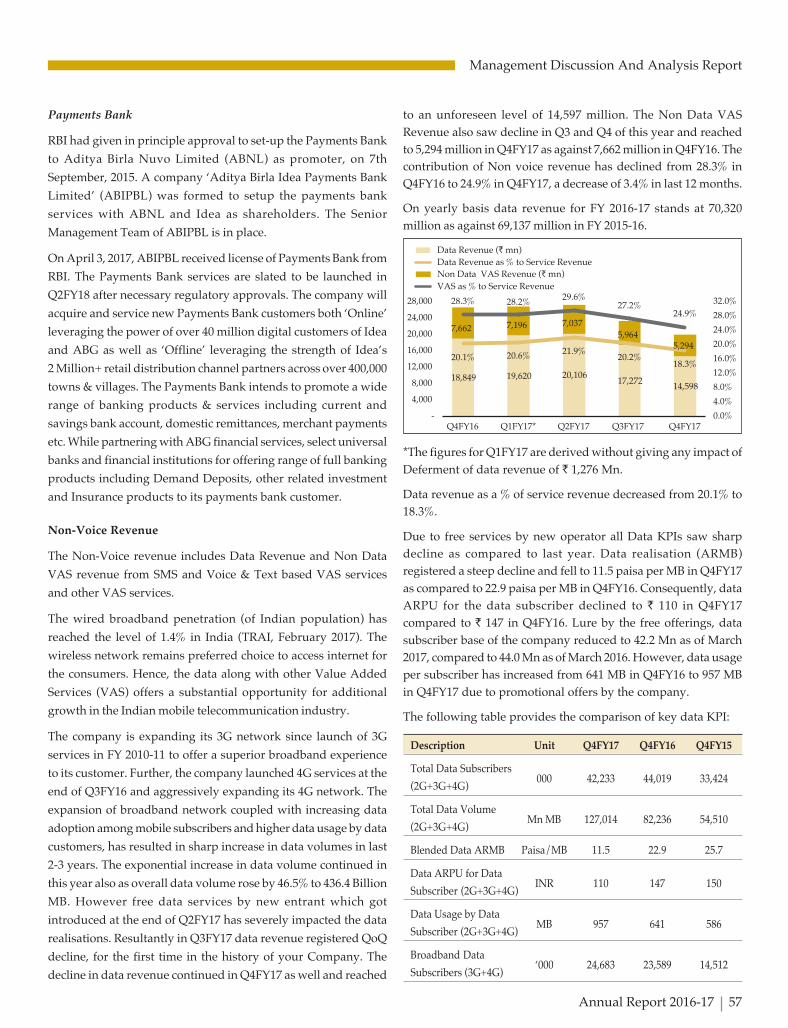
C K
Management Discussion And Analysis Report
Annual Report 2016-17 57
Payments Bank
RBI had given in principle approval to set-up the Payments Bank
to Aditya Birla Nuvo Limited (ABNL) as promoter, on 7th
September, 2015. A company ‘Aditya Birla Idea Payments Bank
Limited’ (ABIPBL) was formed to setup the payments bank
services with ABNL and Idea as shareholders. The Senior
Management Team of ABIPBL is in place.
On April 3, 2017, ABIPBL received license of Payments Bank from
RBI. The Payments Bank services are slated to be launched in
Q2FY18 after necessary regulatory approvals. The company will
acquire and service new Payments Bank customers both ‘Online’
leveraging the power of over 40 million digital customers of Idea
and ABG as well as ‘Offline’ leveraging the strength of Idea’s
2 Million+ retail distribution channel partners across over 400,000
towns & villages. The Payments Bank intends to promote a wide
range of banking products & services including current and
savings bank account, domestic remittances, merchant payments
etc. While partnering with ABG financial services, select universal
banks and financial institutions for offering range of full banking
products including Demand Deposits, other related investment
and Insurance products to its payments bank customer.
Non-Voice Revenue
The Non-Voice revenue includes Data Revenue and Non Data
VAS revenue from SMS and Voice & Text based VAS services
and other VAS services.
The wired broadband penetration (of Indian population) has
reached the level of 1.4% in India (TRAI, February 2017). The
wireless network remains preferred choice to access internet for
the consumers. Hence, the data along with other Value Added
Services (VAS) offers a substantial opportunity for additional
growth in the Indian mobile telecommunication industry.
The company is expanding its 3G network since launch of 3G
services in FY 2010-11 to offer a superior broadband experience
to its customer. Further, the company launched 4G services at the
end of Q3FY16 and aggressively expanding its 4G network. The
expansion of broadband network coupled with increasing data
adoption among mobile subscribers and higher data usage by data
customers, has resulted in sharp increase in data volumes in last
2-3 years. The exponential increase in data volume continued in
this year also as overall data volume rose by 46.5% to 436.4 Billion
MB. However free data services by new entrant which got
introduced at the end of Q2FY17 has severely impacted the data
realisations. Resultantly in Q3FY17 data revenue registered QoQ
decline, for the first time in the history of your Company. The
decline in data revenue continued in Q4FY17 as well and reached
18,849 19,620 20,106 17,272
14,598
7,662 7,196 7,037
5,964
5,294
20.1% 20.6%21.9%
20.2%18.3%
28.3% 28.2%29.6%
27.2%24.9%
0.0%
4.0%
8.0%
12.0%
16.0%
20.0%
24.0%
28.0%
32.0%
-
4,000
8,000
12,000
16,000
20,000
24,000
28,000
Q4FY16 Q1FY17* Q2FY17 Q3FY17 Q4FY17
Data Revenue (` mn)
Non Data VAS Revenue (` mn)
Data Revenue as % to Service Revenue
VAS as % to Service Revenue
to an unforeseen level of 14,597 million. The Non Data VAS
Revenue also saw decline in Q3 and Q4 of this year and reached
to 5,294 million in Q4FY17 as against 7,662 million in Q4FY16. The
contribution of Non voice revenue has declined from 28.3% in
Q4FY16 to 24.9% in Q4FY17, a decrease of 3.4% in last 12 months.
On yearly basis data revenue for FY 2016-17 stands at 70,320
million as against 69,137 million in FY 2015-16.
*The figures for Q1FY17 are derived without giving any impact of
Deferment of data revenue of ` 1,276 Mn.
Data revenue as a % of service revenue decreased from 20.1% to
18.3%.
Due to free services by new operator all Data KPIs saw sharp
decline as compared to last year. Data realisation (ARMB)
registered a steep decline and fell to 11.5 paisa per MB in Q4FY17
as compared to 22.9 paisa per MB in Q4FY16. Consequently, data
ARPU for the data subscriber declined to ` 110 in Q4FY17
compared to ` 147 in Q4FY16. Lure by the free offerings, data
subscriber base of the company reduced to 42.2 Mn as of March
2017, compared to 44.0 Mn as of March 2016. However, data usage
per subscriber has increased from 641 MB in Q4FY16 to 957 MB
in Q4FY17 due to promotional offers by the company.
The following table provides the comparison of key data KPI:
Description Unit Q4FY17 Q4FY16 Q4FY15
Total Data Subscribers
(2G+3G+4G)000 42,233 44,019 33,424
Total Data Volume
(2G+3G+4G)Mn MB 127,014 82,236 54,510
Blended Data ARMB Paisa/MB 11.5 22.9 25.7
Data ARPU for Data
Subscriber (2G+3G+4G)INR 110 147 150
Data Usage by Data
Subscriber (2G+3G+4G)MB 957 641 586
Broadband Data
Subscribers (3G+4G)‘000 24,683 23,589 14,512

C K
Management Discussion And Analysis Report
58 Idea Cellular Limited
Broadband Data
Volume (3G+4G)Mn MB 104,223 57,603 30,680
Data ARPU for
Broadband Data INR 138 191 209
Subscriber (3G+4G)
Broadband Data Usages
by Broadband Data MB 1381 857 777
Subscribers (3G+4G)
Large Scale of Operations
Your Company is the sixth largest mobile operator across globe
based on number of subscribers (GSMA Intelligence, as of
December 2016). Company carried more than 2.57 Billion minutes
on a daily basis during Q4FY17. Company carried 836 Billion
minutes on its network during FY 2017, compared to 786 Billion
minutes in FY 2016, a growth of 6.4%. Further, the Total data
volume carried by your Company on its network in Financial Year
2016-17 increased to 436.4 Billion MB in comparison to 297.9 Billion
MB in Financial Year 2015-16, registering a solid growth of 46.5%.
Power Brand
To take 4G one step forward in FY 2016-17, the “Biggest Small
Change” campaign was launched with a focus on updating
customers from 2G/3G to 4G. The campaign leveraged the insight
that for those who live online, a small change in technology could
make a big impact on their online experience. 4G revolutionized
the digital experience for consumers who could now make
seamless video calls, stream videos on the go, play multiplayer
games, watch movies in HD and stream all their favorite music on
their mobile.
Despite nearly a billion mobile connections, mobile internet
penetration is just about 20% in India. Therefore, to get more
customers online, we had to tackle the issue of internet relevance.
The insight for our “Internet For All” campaign was that
consumers are most likely to adopt the internet if it makes a
substantial difference to their lives and if it is recommended by a
trusted source, such as friends or family.
Towards the end of the year, we democratized 4G in our
“Reverse Migration” campaign to focus on the fact that 4G
transcends all boundaries and is truly for everyone. Millions of
Indians in rural and small town India leave their homes and move
to metros and big cities in search of opportunities for a better
future. In this pursuit of economic development, they leave the
comfort of their homes and find shelter in already overcrowded
cities impacting the lives of both the migrants & the residents,
breaking up families, increasing the gap between the
development of cities versus villages. Idea 4G was positioned as
the new-age infrastructure that would bring opportunities to
every Indian across the country and every village would now
prosper like a city, thus creating a movement of “Reverse
Migration” from urban to rural India.
Your brand has also been extremely competitive in the market
place advertising the latest promotions to be top of mind with the
consumer.
Q4 FY 17 saw Idea expand its broadband footprint by launching
4G in 19 service areas. Given the fact that Idea has a special bond
with its customers, with a Pan India Broadband presence and
quality experience your Brand is well set to create consumer
preference and advocacy in FY 18.
STANDALONE FINANCIAL RESULTS
Revenues
Revenue from operations for the financial year ended March 31,
2017 decreased by 1.5% and stood at ` 352,786 Mn as compared
to ` 358,037 Mn for the financial year ended March 31, 2016,
primarily due to decrease in service revenues. The realised rates
for Voice and Data have declined primarily due to hyper
competition including free services offered by the new entrant in
the second half of the year. This has led to the decrease in service
revenues although the minutes of usage has increased by 6.4%.
Revenue Market Share of the Company improved by 0.4% from
18.6% to 19.0% during calendar year 2016.
The voice revenues of ̀ 255,059 Mn were almost similar compared
to the previous year level of ` 256,750 Mn. Non voice revenues
declined by 3.1% to ` 95,811 Mn in current year as against
` 98,858 Mn in the previous year primarily due to a decline of
14.2% in Non-Data VAS revenue. However, Data revenue
registered marginal growth and stood at ̀ 70,320 Mn in the current
year as against ` 69,137 Mn in the previous year.
Other Income comprising of Interest Income and Gain on Current
Investments increased by 11.1% from ` 1,773 Mn in the previous
year to ` 1,970 Mn in the current year. The increase is mainly on
account of short term deployment of surplus funds from fresh
borrowings pending utilisation for prepayment of deferred
payment liabilities.
Operating Expenses
Total operating expenditure for the financial year ended March
31, 2017 increased by 5.3% to ` 251,838 Mn from ` 239,091 Mn
incurred in the previous year, primarily reflecting the volume
growth in the company’s operations.
Description Unit Q4FY17 Q4FY16 Q4FY15

C K
Management Discussion And Analysis Report
Annual Report 2016-17 59
106,649
42%
42,754
17%
40,515
16%
31,442
12%
16,256
6%
4,554
2%
9,668
5%
Composition of Operating Expenses
Network Expenses and IT
outsourcing cost
Roaming & Access Charges
License Fees and WPC
Charges
Subscriber Acquisition &
Servicing Expenditure
Personnel Expenditure
Advertisement and Business
Promotion Expenditure
Other Expenses
Personnel Expenditure: Personnel Expenditure increased by
10.3% from ̀ 14,735 Mn in the previous year to ̀ 16,256 Mn in the
current year, primarily as a result of annual increments.
Network Expense and IT Outsourcing Cost: Network Expense
and IT Outsourcing Cost increased by 15.1% from ` 92,656 Mn in
the previous year to ` 106,649 Mn in the current year, primarily
as a result of the expansion of our network coverage and capacity.
The increase in count of cell sites is as follows:
Particulars As on As on Increase
March 31, 2017 March 31, 2016
2G cell sites 131,486 126,833 4,653
3G cell sites 69,202 50,060 19,142
4G cell sites 40,852 14,643 26,209
Total cell sites 241,540 191,536 50,004
During the year Idea consolidated its network infrastructure with
highest ever cell site additions on 2G (GSM), 3G (HSPA), 4G (LTE)
technologies collectively. The GSM coverage has expanded to
nearly 1 billion Indians spread across 400,000 towns and villages.
Idea broadband services has expanded to over 100,000 towns and
villages covering over 500 million Indians.
Licence Fees and Spectrum Usage Charges: Licence Fees and
Spectrum Usage charges decreased by 2.4% from ` 41,508 Mn in
the previous year to ̀ 40,515 Mn in the current year, corresponding
to decrease in revenue.
Roaming and Access Charges: Roaming and Access Charges
decreased from ` 46,653 Mn in the previous year to ` 42,754 Mn
in the current year. The decrease is primarily attributable to the
cost towards intra circle roaming arrangements which have
decreased by 29.9% as the Company has expanded its own
network coverage.
Subscriber Acquisition and Servicing Expenditure: Subscriber
Acquisition and Servicing Expenditure, increased by 4.7% from ̀
30,019 Mn in the previous year to ̀ 31,442 Mn in the current year,
primarily as a result of increase in gross subscriber additions.
Advertisement and Business Promotion Expenditure:
Advertisement and Business Promotion Expenditure decreased
by 5.8% from ` 4,833 Mn in the previous year to ̀ 4,554 Mn in the
current year.
Administration and Other Expenses: Administration and Other
Expenses increased by 11.3% from ` 8,686 Mn in the previous
year to ̀ 9,668 Mn in the current year primarily due to an increase
in rent, rates & taxes, CSR expenses, provision for doubtful debts
partially offset by gain on foreign exchange fluctuation.
The composition of total operating expenses (amount and %age
to total operating expenses) is as follows:
Profit before Finance charges, Depreciation, Amortisation and
Taxes (EBITDA)
The decrease in service revenues coupled with increase in
operating expenditure has resulted in decrease of EBITDA by
14.7% from ` 120,719 Mn for the previous year to ` 102,919 Mn
for the current year. EBITDA as a %age of Total Income decreased
to 29.0% in the current year as compared to 33.6% in the previous
year.
Depreciation, Amortisation and Finance Charges
Depreciation and Amortisation expenses increased by 23.7% from
` 62,232 Mn in the previous year to ` 77,000 Mn in the current
year. The depreciation charge for the year has increased by 1.9%
from ̀ 47,717 Mn in the previous year to ̀ 48,643 Mn in the current
year, primarily due to gross block additions. The amortisation
charge for the year has increased by 95.4% from ` 14,516 Mn in
the previous year to ` 28,357 Mn in the current year. The increase
is primarily on account of a full year amortization charge for
spectrum acquired in auctions for 3G services, 4G services and in
the nine service areas where its original CMTS licenses along with
bundled spectrum expired and licenses were taken afresh during
the current and previous financial year.
Finance Charges for the current year increased from ` 17,779 Mn
in the previous year to ` 40,109 Mn in the current year, largely
due to higher average net debt on account of acquisition of
spectrum in various bands in previous year and October 2016
auctions.
Profits and Taxes
The loss before tax for the year stood at ` 14,190 Mn as compared
to a profit of ` 40,709 Mn in the previous year. The loss after tax
for the year stood at ` 8,311 Mn. Cash Profit for the year stood at
` 64,091 Mn, a decrease of 36.8% over the previous year.
C K
Management Discussion And Analysis Report
60 Idea Cellular Limited
Capital Expenditure
The Company incurred capital expenditure consisting mostly of
network equipment (including capital advances) of ` 77,653 Mn
in addition to the amount of ` 130,569 Mn paid accrued for
spectrum, most of which pertains to the fresh acquisition in the
October 2016 auctions.
Balance Sheet
The Gross Block and Net Block (including Capital Work in Progress
and Intangible assets under development) stood at ` 972,141 Mn
and ` 836,542 Mn respectively as at March 31, 2017. Investment
in subsidiaries and associates stood at ̀ 22,266 Mn. Other financial
assets increased by ` 21,337 Mn from ` 37,332 Mn to ` 58,669 Mn
primarily due to increase in Investment in Units of Liquid Mutual
Funds. Other assets increased by ` 17,697 Mn from ` 22,450 Mn
to ` 40,147 Mn primarily due to increase in capital advance and
cenvat credit towards spectrum.
The paid-up equity share capital of the Company increased by
` 48 Mn, pursuant to issuance of 4,818,853 equity shares to the
employees on exercise of stock options granted under Employee
Stock Option Scheme, 2006 and Employee Stock Option Scheme,
2013. Other equity of the Company decreased from ` 211,647 Mn
to ̀ 201,184 Mn primarily due to current year’s losses and dividend
distribution (including tax) in the current financial year. As on
March 31, 2017, the total equity stood at ` 237,238 Mn.
Total borrowings increased by ̀ 145,122 Mn and stood at ̀ 550,535
Mn as on March 31, 2017. The increase is, mainly due to additional
borrowings and deferred payment liability (DPL) for spectrum
acquired in October 2016 auctions. Deferred Tax liability as at
March 31, 2017 stood at ` 16,791 Mn. Other financial liabilities
increased by ` 38,996 Mn and stood at ` 118,430 Mn primarily
due to increase in payables for capital expenditure. Other Liabilities
and Provisions increased by ` 2,935 Mn from ` 31,696 Mn to `
34,631 Mn as on March 31, 2017.
Cash Flow Statement
The cash generated from operating activities of ̀ 101,728 Mn and
net proceeds from borrowings ` 84,297 Mn along with opening
cash and cash equivalents of ` 6,060 Mn was primarily used for
capital expenditure ` 126,166 Mn (including payment towards
spectrum and licenses ` 73,389 Mn), payment of interest and
finance charges ` 33,054 Mn and investment in Mutual funds
` 30,073 Mn. Consequently cash and cash equivalents decreased
by ` 6,128 Mn. during the current year.
CONSOLIDATED FINANCIAL RESULTS
Revenues
Revenue from operations for the financial year ended March 31,
2017 decreased by 1.0% and stood at ` 355,757 Mn as compared
to ̀ 359,494 Mn for financial year ended March 31, 2016, primarily
due to decrease in service revenues. The decrease in the mobility
and ILD service revenue of the company as explained above in
the standalone results section is partially offset by increase in
revenue from Passive Infrastructure services by 150.1% from
` 1,089 Mn to ` 2,724 Mn. Sale of Trading Goods decreased by
30.8% from ` 330 Mn in the previous year to ` 228 Mn in the
current year, primarily due to reduction in volume.
Other Income comprising of Interest Income and Profit on Sale of
Current Investments increased by 44.0% from ` 2,131 Mn in the
previous year to ` 3,069 Mn in the current year. The increase is on
account of deployment of surplus funds from fresh borrowings
pending utilisation / prepayment of deferred payment liability.
Operating Expenses
Total operating expenditure for the financial year ended March
31, 2017 increased by 5.5% to ` 252,995 Mn in the current year
from ` 239,819 Mn incurred in the previous year, primarily as a
result of growth in the company’s operations.
Cost of Trading Goods: Cost of Trading Goods decreased by 3.4%
to ` 279 Mn in the current year from ` 289 Mn incurred in the
previous year primarily due to reduction in volume.
Personnel Expenditure: Personnel Expenditure for the financial
year ended March 31, 2017 increased by 11.5% to ` 17,976 Mn
from ̀ 16,119 Mn incurred during the previous year, primarily as
a result of annual increments.
Network Expense and IT Outsourcing Cost: Network Expense
and IT Outsourcing Cost increased by 15.0% from ` 92,778 Mn in
the previous year to ` 106,653 Mn in current year, primarily as a
result of the expansion of our network.
Licence Fees and Spectrum Usage Charges & Roaming and
Access Charges: The decrease in these expenses pertains only to
the company covered above under the Standalone Financial
Results section.
Subscriber Acquisition and Servicing Expenditure: Subscriber
Acquisition and Servicing Expenditure, increased by 5.6% from ̀
28,668 Mn in the previous year to ̀ 30,282 Mn in the current year,
primarily as a result of increase in gross subscriber additions.
Advertisement and Business Promotion Expenditure:
Advertisement and Business Promotion Expenditure decreased
by 5.9% from ` 4,864 Mn in the previous year to ̀ 4,577 Mn in the
current year.
Administration and Other Expenses: Administration and Other
Expenses increased by 11.4% from ` 8,940 Mn in the previous
year to ̀ 9,958 Mn in the current year, primarily due to the increase
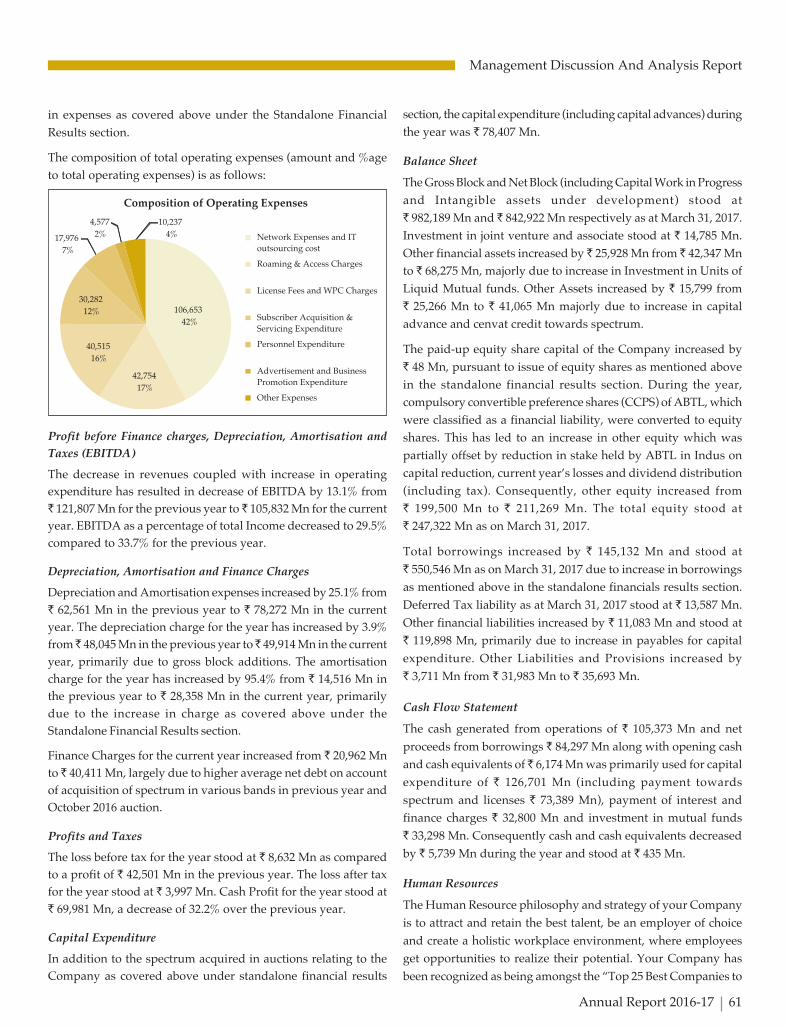
C K
Management Discussion And Analysis Report
Annual Report 2016-17 61
106,653
42%
42,754
17%
40,515
16%
30,282
12%
17,976
7%
4,577
2%
10,237
4%
Composition of Operating Expenses
Network Expenses and IT
outsourcing cost
Roaming & Access Charges
License Fees and WPC Charges
Subscriber Acquisition &
Servicing Expenditure
Personnel Expenditure
Advertisement and Business
Promotion Expenditure
Other Expenses
in expenses as covered above under the Standalone Financial
Results section.
The composition of total operating expenses (amount and %age
to total operating expenses) is as follows:
Profit before Finance charges, Depreciation, Amortisation and
Taxes (EBITDA)
The decrease in revenues coupled with increase in operating
expenditure has resulted in decrease of EBITDA by 13.1% from
` 121,807 Mn for the previous year to ̀ 105,832 Mn for the current
year. EBITDA as a percentage of total Income decreased to 29.5%
compared to 33.7% for the previous year.
Depreciation, Amortisation and Finance Charges
Depreciation and Amortisation expenses increased by 25.1% from
` 62,561 Mn in the previous year to ` 78,272 Mn in the current
year. The depreciation charge for the year has increased by 3.9%
from ̀ 48,045 Mn in the previous year to ̀ 49,914 Mn in the current
year, primarily due to gross block additions. The amortisation
charge for the year has increased by 95.4% from ` 14,516 Mn in
the previous year to ` 28,358 Mn in the current year, primarily
due to the increase in charge as covered above under the
Standalone Financial Results section.
Finance Charges for the current year increased from ` 20,962 Mn
to ̀ 40,411 Mn, largely due to higher average net debt on account
of acquisition of spectrum in various bands in previous year and
October 2016 auction.
Profits and Taxes
The loss before tax for the year stood at ` 8,632 Mn as compared
to a profit of ` 42,501 Mn in the previous year. The loss after tax
for the year stood at ` 3,997 Mn. Cash Profit for the year stood at
` 69,981 Mn, a decrease of 32.2% over the previous year.
Capital Expenditure
In addition to the spectrum acquired in auctions relating to the
Company as covered above under standalone financial results
section, the capital expenditure (including capital advances) during
the year was ` 78,407 Mn.
Balance Sheet
The Gross Block and Net Block (including Capital Work in Progress
and Intangible assets under development) stood at
` 982,189 Mn and ` 842,922 Mn respectively as at March 31, 2017.
Investment in joint venture and associate stood at ` 14,785 Mn.
Other financial assets increased by ` 25,928 Mn from ̀ 42,347 Mn
to ` 68,275 Mn, majorly due to increase in Investment in Units of
Liquid Mutual funds. Other Assets increased by ` 15,799 from
` 25,266 Mn to ` 41,065 Mn majorly due to increase in capital
advance and cenvat credit towards spectrum.
The paid-up equity share capital of the Company increased by
` 48 Mn, pursuant to issue of equity shares as mentioned above
in the standalone financial results section. During the year,
compulsory convertible preference shares (CCPS) of ABTL, which
were classified as a financial liability, were converted to equity
shares. This has led to an increase in other equity which was
partially offset by reduction in stake held by ABTL in Indus on
capital reduction, current year’s losses and dividend distribution
(including tax). Consequently, other equity increased from
` 199,500 Mn to ` 211,269 Mn. The total equity stood at
` 247,322 Mn as on March 31, 2017.
Total borrowings increased by ` 145,132 Mn and stood at
` 550,546 Mn as on March 31, 2017 due to increase in borrowings
as mentioned above in the standalone financials results section.
Deferred Tax liability as at March 31, 2017 stood at ` 13,587 Mn.
Other financial liabilities increased by ` 11,083 Mn and stood at
` 119,898 Mn, primarily due to increase in payables for capital
expenditure. Other Liabilities and Provisions increased by
` 3,711 Mn from ` 31,983 Mn to ` 35,693 Mn.
Cash Flow Statement
The cash generated from operations of ` 105,373 Mn and net
proceeds from borrowings ` 84,297 Mn along with opening cash
and cash equivalents of ̀ 6,174 Mn was primarily used for capital
expenditure of ` 126,701 Mn (including payment towards
spectrum and licenses ` 73,389 Mn), payment of interest and
finance charges ` 32,800 Mn and investment in mutual funds
` 33,298 Mn. Consequently cash and cash equivalents decreased
by ` 5,739 Mn during the year and stood at ` 435 Mn.
Human Resources
The Human Resource philosophy and strategy of your Company
is to attract and retain the best talent, be an employer of choice
and create a holistic workplace environment, where employees
get opportunities to realize their potential. Your Company has
been recognized as being amongst the “Top 25 Best Companies to
C K
Management Discussion And Analysis Report
62 Idea Cellular Limited
Work For” conducted by Business Today. Companies are judged
on career growth prospects, rewards, work life balance,
performance evaluation and stability. Our standing here is a
reflection of not just our employee’s view but also of the larger
Indian workforce which responded.
Considering the long term business goals, your Company has
ensured that the Human Resources strategy is in line with and
complementary to the business strategy. During the financial year,
your Company has continued to maintain already high employee
engagement scores overall and re-kindled its focus on diversity,
by taking various steps to make Idea a more women friendly
workplace. All these efforts have resulted in increasing women
net additions by more than 5 times compared to last year.
Your Company has fostered a culture of continuous learning and
development, creating future leaders, building capability in digital
space and ensuring continued high employee engagement along
with effective and efficient talent development and deployment.
This strategy has strong alignment with your Company’s vision
to successfully build and sustain Company’s standing as one of
India’s most admired and valuable corporations despite
unrelenting competitive pressures.
Risk Management
The Risk Management framework of your Company ensures
regular review by management to proactively identify the
emerging risks, to do risk evaluation and risk prioritization along
with development of risk mitigation plans and action taken to
minimize the impact of the risk. The framework requires that the
Risk Management Committee be periodically informed about risk
minimization procedures adopted by your Company. These
processes are also periodically reviewed by management. The
various risks, including the risks related to the economy,
regulation, competition, technology etc., are documented,
monitored and managed efficiently.
Internal Control Systems
Your Company’s internal control systems are commensurate with
the nature of its business and the size and complexity of its
operations. The internal controls cover operations, financial
reporting, compliance with applicable laws and regulations,
safeguarding assets from unauthorised use and ensure compliance
of corporate policies. Internal controls are reviewed periodically
by the internal auditors, and are subject to management reviews
with significant audit observations and follow up actions reported
to the Audit Committee. The Audit Committee actively reviews
the adequacy and effectiveness of internal control systems and
suggests improvements for strengthening them in accordance
with the changes in the business dynamics, if required.
Regulatory
Major regulatory developments for the period are:
1. DoT license amendments:
DoT amends the license agreement from time to time. Some
key amendments that were made to the License Agreement
this year, were as under :
l Vide amendment dated 19.04.2016, the DoT amended the
license agreements to facilitate IP based interconnection.
l Vide amendment dated 03.08.2016, licensees were
permitted to commence their services by giving
intimation to the licensor. The licenses are now required
to demonstrate compliance of monitoring facilities within
90 days of intimation to licensor.
l Vide amendment dated 26.09.2016, the DoT amended the
provision regarding spectrum caps. Vide this
amendment, the existing provision of CAP of 25% of the
total spectrum assigned in 700/800/900/1800/2100/
2300/2500 MHz band and 50% within a given band in
each LSA shall apply for the total spectrum holding by
each telecom service provider. The cap shall be calculated
as detailed below:
- The spectrum which may become available to DoT
for commercial use after its re-framing from other
users such as Defense at different point of time shall
not be counted for determining the spectrum caps
until it is put up to auction by the DoT.
- All spectrum assigned to TSPs including any
spectrum which was put to an auction but remained
unsold, spectrum which was assigned but
subsequently surrendered by the TSPs or taken back
by the licensor and spectrum put to auction shall be
counted for the purpose of spectrum cap.
In case a situation arises where due to any subsequent
assignment of spectrum to Defense/non-commercial
usage, spectrum cap is affected adversely, no TSP shall
be asked to surrender any spectrum which it already
holds. The same spectrum cap shall be made applicable
for all Telecom Service Providers in that service area.
l Vide amendment & orders dated 02.11.2016, the
requirement of obtaining Wireless Operating
License (WOL) by the Access Service Providers under
UASL, CMTS License and Unified License for Access
Service authorization has been dispensed with. The
requirement to obtain WOL as mentioned in the
frequency assignment, frequency allotment, or frequency
earmarking letters already issued to Access Service

C K
Management Discussion And Analysis Report
Annual Report 2016-17 63
Providers under UASL, CMTS License and Unified
License for Access Service authorization stands deleted
accordingly.
2. Harmonization of 1800 MHz spectrum:
The complete 55 MHz of commercially usable spectrum in
1800 MHz was not available in each service area. The WPC
had initiated the harmonization for 1800 MHz spectrum on
May 29, 2015 and this activity was finally completed by all
operators for all service areas (except TNC) on June 30, 2016.
This has had following impact:
l Your company on 30.09.2016 got complete allocation for
spectrum won in February 2014 and March 2015 auction,
where initially partial allocation was done. The Circles
were Maharashtra (Pune, Nasik), Punjab (Amritsar,
Ludhiana), Haryana (Sirsa), North East (East Khasi Hills,
Meghalaya, Tawang), Uttar Pradesh–West (All districts
except for Bijnor, Firozabad, Meerut, Muzaffarnagar,
Saharanpur) and Himachal Pradesh (Chamba, Kangra,
Kinnaur, Shimla, Siramaur, Solan).
l As a result of harmonization activity, total of 221.4 MHz
of 1800 MHz spectrum was been made available for
October, 2016 auction.
l Subsequent to completion of 2016 auctions, the spectrum
was again harmonized prior to allocation. This resulted
in your company getting allocation of contiguous
spectrum in Himachal Pradesh, Assam, Bihar, Gujarat,
Haryana, Jammu & Kashmir, Madhya Pradesh, Uttar
Pradesh (West) and West Bengal in 1800 MHz band and
for Uttar Pradesh (East) in 2100 MHz band.
l Also, vide separate order dated 30.09.2016, DoT specified
the policy for allotment of fractional spectrum subject to
payment of necessary charges, for spectrum allocated in
2012 auction. This resulted in allocation of 0.15 MHz for
our Bihar and West Bengal service area.
3. DoT / WPC orders on Spectrum Usage Charge (SUC) for
spectrum in 700/ 800/ 900/ 1800/ 2100/ 2300/ 2500 MHz:
The DoT vide their order dated 12.08.2016, specified the SUC
for spectrum in 700/ 800/ 900/ 1800/ 2100/ 2300/ 2500 MHz.
Key highlights as under :
l For spectrum acquired through October 2016 auction,
SUC shall be charged at 3% of AGR.
l The weighted average of SUC rates across all spectrum
assigned to an operator (whether assigned
administratively or through auction or through trading)
in all access spectrum bands including BWA spectrum
obtained in 2010 auction shall be applied for charging SUC
subject to a minimum of 3% of AGR excluding revenues
from wireline services.
l The weighted average is to be derived by sum of product
of spectrum holdings and applicable SUC rate divided
by total spectrum holding. The weighted average rate
should be determined operator wise for each service area.
l The amount of SUC payable by the operators during
2015-16 at weighted average derived after taking in to
consideration the spectrum acquired through
forthcoming auction (and excluding the spectrum in
2300/2500 MHz band acquired/allocated prior to
2015-16) , be treated as the floor amount of the SUC to be
paid by the operators.
l Further, in case there is a reduction in AGR of the service
provider, the floor amount of SUC shall be reduced
proportionately.
l The order comes into force wef 12.08.2016.
4. DoT orders on use of Aadhar E-KYC service of UIDAI for
issuing mobile connections to subscribers:
Vide orders dated 16.08.2016, the DoT allowed use of Aadhar
E-KYC service of UIDAI for issuing mobile connections to
subscribers. The E-KYC process is completely paperless and
does not require any tele-verification. As per the orders, the
audit process for E-KYC customers would be specified
separately. Further vide orders dated 27.01.2017, the DoT
specified the following:
l TSPs are required to submit complete subscriber database
(including activations done through both E-KYC and
current paper based process) to TERM cell.
l TERM cell would generate quarterly audit sample (for
Jammu & Kashmir, North-East and Assam at 0.2%)/ monthly
audit sample (for rest of India at 0.1%) from complete
subscriber database (which would include activations
done through both E-KYC and current paper based
process)
l On the audit samples :
- For connections activated through the current paper
based process, TSPs to submit physical CAFs and
TERM cell would audit these CAFs as per existing
DoT instructions.
- For connections activated through E-KYC process,
TSPs to submit soft copies (in pdf format) of these
CAFs in DVDs to respective TERM cells.
- TERM cell may issue penalty/ demand notices to
TSPs based on the compliance percentage achieved
for the audits of paper based CAFs, as mentioned
above.
C K
Management Discussion And Analysis Report
64 Idea Cellular Limited
5. TRAI 10th Amendment to the Telecom Consumer Preference
Regulation:
The TRAI issued the TCPR amendment on 19.08.2016 which
permits the maximum validity of 365 days for data only STVs
instead of prevailing maximum validity of 90 days. The TRAI
amendment also stated that STVs providing “data only”
benefits must satisfy all conditions of a STV as specified in
TCPR, 2012 including that these shall not be offered in
denominations of ` 10 or multiples thereof.
6. DoT approval for name change of Bihar UAS License from
Aditya Birla Telecom Limited (ABTL) to Idea Cellular
Limited:
The DoT has on 22.08.2016, provided its consent to name
change of Bihar license held by erstwhile ABTL to Idea
Cellular Limited. This request had been pending since 2010.
7. DoT guidelines on liberalization of 900 MHz spectrum:
DoT had issued guidelines dated 05.11.2015 and amendment
dated 21.04.2016 on liberalization of administratively allotted
spectrum in 800 MHz and 1800 MHz frequency bands. DoT
vide its letter of 06.09.2016, incorporated the 900 MHz band
in para 1, 2 and 3 of earlier guidelines. In view of the same the
amended paras read as under:
l Existing CMTS/UAS/UL with Access service
authorization licensee may liberalized their entire
administratively allotted spectrum holding in 800 MHz,
900 MHz and 1800 MHz band in a service area for the
balance validity period of right to use spectrum.
l Administratively allotted spectrum in 800 MHz, 900 MHz
and 1800 MHz bands refers to the spectrum allotted prior
to auction of right to use spectrum in November 2012.
l Liberalization of spectrum in 800 MHz, 900 MHz and 1800
MHz frequency bands will be considered only after a
written request for liberalizing the entire spectrum,
pertaining to a frequency band and LSA, accompanied
by a non-refundable processing fee amounting to
` 50000/- per service area from TSP.
8. Guidelines for signing of Tripartite Agreement (TPA):
The DoT on 30.09.2016 issued Guidelines for signing of
Tripartite Agreement (TPA). Some of the key points are as
follows:
l The TSP shall apply to DoT for signing of the TPA with
non-refundable processing fee of ` 50,000/- along with
the prescribed Application Form in duplicate with duly
signed on each page.
l The TSP shall provide details of the securitisation pledged
to DoT (i.e. in the form of Bank Guarantees etc.) by the
Applicant Company against its dues.
l As per extant guidelines, rights, licenses, authorizations,
etc. are treated as tangible securities.
9. TRAI Direction regarding Fixed broadband service and
Mobile Broadband services:
TRAI issued the above Direction on 31.10.2016. Key highlights
are as under:
l The Directive requires all TSPs to provide over their
website and all advertisements published through any
media, information regarding following:-
For fixed broadband:-
- Data usage limit with specified speed;
- Speed of broadband connection upto specified data
usage limit; and
- Speed of broadband connection beyond data usage
limit.
For Mobile broadband:-
- Data usage limit with specified primary technology
(3G/4G) for data services; and
- Speed offered for data services beyond data usage
limit.
l For the above mentioned requirements, information has
to be given to both existing/new subscribers on their
registered emails/SMS on registered mobile numbers.
l Ensure that download speed of fixed broadband
subscriber is not reduced below minimum download
speed as defined by DoT form time to time in any fair
usage tariff plan post expiry of assigned quota.
l Provide SMS/email alert to subscriber when his data
usage reaches 50% - 90% - 100% of data usage under the
plan.
l TSP to also maintain a portal/website for subscriber to
check usage at any point of time.
10. Earmarking of spectrum for all the spectrum won by Idea
Cellular in September 2016 auction
Your company on 12.11.2016 received the spectrum and
requisite license endorsement for spectrum won in September
2016 auctions in 1800/2100/2300/2500 MHz bands in
authorization of access services in the LSAs of Andhra
Pradesh, Himachal Pradesh, Assam, Bihar, Gujarat, Haryana,
Jammu and Kashmir, Kerala, Madhya Pradesh, Maharashtra,
C K
Management Discussion And Analysis Report
Annual Report 2016-17 65
Mumbai, North East, Odisha, Punjab, Rajasthan, Uttar Pradesh
(East), Uttar Pradesh (West) and West Bengal service areas.
11. Right of Way Rules in the form of a Gazette Notification
This Gazette notification was issued on 15.11.2016. Salient
features of the same are as follows:
l These rules may be called the Indian Telegraph Right of
Way Rules, 2016.
l The appropriate authority shall exercise the powers
under these rules on an application for establishment and
maintenance of underground or overground telegraph
infrastructure by any licensee on whom the powers of
the telegraph authority have been conferred.
l Every appropriate authority shall designate a nodal
officer for the purposes of these rules.
l The appropriate authority shall develop an electronic
application process within a period of one year from the
date of coming into force of these rules for submission of
applications, provided that the State Government may
at its discretion establish a single electronic application
process for all appropriate authorities under its control.
l A licensee shall, for the purposes of establishment of
telegraph infrastructure under any immovable property
vested in or under the control or management of any
appropriate authority, make an application, supported
by such documents, to that authority in such form and
manner as may be specified by that appropriate
authority.
l Every application shall be accompanied with such fee to
meet administrative expenses for examination of the
application and the proposed work as the appropriate
authority may, by general order, deem fit.
l Provided that such fee to meet administrative expenses
shall not exceed one thousand rupees per kilometer (ten
thousand rupees in case of over ground structure).
l The appropriate authority shall within a period not
exceeding sixty days from the date of application made
under rule 5:-
- grant permission on such conditions including, but
not limited to, the time, mode of execution, measures
to mitigate public inconvenience or enhance public
safety and payment of restoration charge, as may be
specified, subject to the provisions of the Act and
these rules; or
- reject the application for reasons to be recorded in
writing.
l Provided that no application shall be rejected unless the
applicant licensee has been given an opportunity of being
heard on the reasons for such rejection.
l Provided further that the permission shall be deemed to
have been granted if the appropriate authority fails to
either grant permission under (a) or reject the application
under (b); and the same shall be communicated in writing
to the applicant not later than five working days after
permission is deemed to have been granted.
l The appropriate authority shall not charge any fee other
than those prescribed under sub-rule (3) of rule 5
(administrative expenses for examination of the application and
the proposed work ) and clause (a) of sub-rule (2) from the
licensee (Restoration charge) for establishing underground
telegraph infrastructure.
l The Central Government shall, within a period of sixty
days from the date of coming into force of these rules,
designate, by notification, officers with such jurisdiction
as may be mentioned in the notification, for the purpose
to referring disputes.
l The officer designated by the Central Government shall
determine the disputes within a period not exceeding sixty
days in such manner as may be specified by the Central
Government from time to time.
12. Telecommunication Tariff (sixty first amendment) Order
for USSD based mobile banking and payment services:
TRAI issued this amendment on 22.11.2016. Key highlights
are as under:
l Reduction of ceiling tariff for the use of USSD for USSD
based mobile banking and payment services from the
current ` 1.50 to ` 0.50 (50 paise).
l Increase in number of stages from the existing 5 to 8 per
USSD session – within above ceiling.
l No USSD push sessions.
l Current regulatory regime of customer paying for the
USSD session charges (B2C) shall continue.
In view of Government demonetization efforts and Digital
push, the Company had waived off the ` 0.50
(50 paise) charge till December 31, 2016.
13. DoT orders on re-verification of subscribers through Aadhar
E-KYC process
In view of the orders of Hon’ble Supreme Court in WPC No.
607 of 2016, the DoT has issued the instructions for
C K
Management Discussion And Analysis Report
66 Idea Cellular Limited
re-verification of subscribers on 23.03.2017. Key highlights are
as under:
l Re-verification for both prepaid as well postpaid existing
subscribers.
l TSP to send “verification code” to subscriber. Before
E-KYC, TSP to check verification code to ascertain that
SIM is physically available with subscriber.
l After E-KYC, and before updating details/ overwriting
details, TSP to seek confirmation about re-verification
through SMS. If no response received within 3 hours,
verification to be taken as positive and data to be
overwritten.
l Multiple connections (not bulk) of a subscriber can be
done through single E-KYC. All mobile nos. to be
mentioned on the CAF. However verification code and
confirmation sms as above to be followed for all mobile
nos. For data dongle etc., verification code to be sent to
alternate nos.
l Once process followed, old CFA can be destroyed if no
specific instructions by DoT/ LEA/ Courts.
l E-KYC not required for pre-paid to postpaid conversion
and vice versa.
l Employee verification after E-KYC may not be required.
l Database of re-verified database to be shared with TERM
cell on weekly basis. Re-verified subscribers to also be
flagged in monthly subscriber base. Total subscribers and
no. of re-verified subscribers to also be reported to DoT
HQ on weekly basis.
l No penalty to be imposed for changes in subscriber data
base.
l E-KYC for bulk & outstation to be clarified separately.
l Re-verification to be completed by 06.02.2018.
l Subscribers taken through normal process (non-E-KYC
process) in this period, to also be re-verified and
subscriber to be informed about the same.
Opportunities, Risks, Concerns and Threats
With the rising rate of literacy, high smartphone penetration and
pursuit of being ‘online’ on social media platforms - the Indian
across all ethnicity, all class of Income and all generation have
started demanding for High speeds of wireless Internet. The
demand for high speed internet seems to grow by leaps and
bounds in next few years. To monetise this opportunity all large
Mobile operators have deployed Broadband Services across
country and further expanding the coverage to provide Mobile
Broadband in deep hinterland of country.
During Financial Year 2016-17, the introduction of unprecedented
large scale free services severely impacted the realisation for both,
voice and data. This has impacted the industry revenue growth
negatively at a time when large investments have been made in
expectation of significant revenue growth, as volumes are less than
sufficient to compensate for the rate decline. The financials of the
industry are stretched as all the telecom operators are highly
leveraged due to high commitment in spectrum auctions and
extensive network roll out in past 2-3 years.
The negative revenue growth coupled with the need for large
capital investments has driven focus towards cooperation by way
of spectrum trading, spectrum sharing or combining operations.
The state of many operators is clearly drawing to an end and
wireless Industry in India is moving towards global norms of
consolidating to around 5 large operators. The telecom operators
in long run are expected to see a return to growth in revenue and
hence an uplift in profitability, while providing world class mobility
services to more than 1.3 billion Indians spread across vast
geography of India. Your company is fully equipped to reap
benefits out of these changing trends as it has pan India Broadband
Spectrum and is aggressively expanding its Broadband network
across the length and breadth of country.
The telecom sector is characterized by technological changes and
competition from new technologies is an inherent threat. However,
till date, the Indian telecom sector has not faced any disruptive
phase arising out of any technological changes. Your Company,
with a portfolio of spectrum in 900/1800/2100/2300/2500 MHz
has an attractive spectrum footprint to adapt to any future
technological changes.
Your Company has several ongoing litigations and any adverse
determination of these remains a risk. Your Company believes in
sound Corporate Governance Practices and believes that these
litigations would be settled in due course in the best interest of all
stakeholders. Your Company works with various local, state and
central government agencies for specific permissions to operate
its mobile licenses and is required to meet various regulatory/
policy guidelines of the DoT and may be subjected to various
regulatory demands, penalties/fines or increased cost of
compliance. Your Company makes best effort to adhere to all such
requirements.
The Company’s business is dependent on key Network and IT
equipment suppliers for management and continuity of its
Network, IT and business processes. Further, these networks may
be vulnerable to technical failures or any natural calamity. Your

C K
Management Discussion And Analysis Report
Annual Report 2016-17 67
Cautionary Statement
Statements in the Management Discussion and Analysis describing the Company’s objectives, projections, estimates, expectations may constitute
a “forward-looking statement” within the meaning of applicable securities laws and regulations. Actual results could differ materially from those
expressed or implied. Important factors that could make a difference to the Company’s operations include economic conditions affecting demand/
supply and price conditions in the domestic markets in which the Company operates, changes in the Government Regulations, tax laws and other
statutes and other incidental factors.
Company is in partnership with global leaders in Network
equipment and IT services and enjoys very long standing healthy
relations with all its suppliers. The Company has a robust network
& IT security processes and disaster recovery plans.
Outlook
After outperforming the industry for 8 years, your Company for
the first time since its inception saw a decline in its revenue.
However, the decline in your company’s revenue is lesser than
expected decline in Industry revenue for FY17. The industry is
expected to come back on growth trajectory once the free services
by the new entrant comes to an end.
Your company has received pan India Broadband spectrum and
has rolled out Broadband Services (3G or/and 4G) in all the
22 service areas of India. Further, your Company is working at
breakneck speed to expand its Broadband presence further in deep
hinterland of the country with a vision to cover maximum
population of the country.
As the hyper competition phase of Industry is getting over,
profitability of industry is poised to improve.
Your company is working towards getting the requisite approval
to conclude its merger with Vodafone India. In the meantime,
your company will remain nimble, agile, adaptive and focused
on its execution capabilities. The company remains confident to
capitalise on the emerging opportunities in mobile voice, digital
content, mobile banking and wireless data business as telecom
market invariably moves towards consolidation with 5 major
providers.

C K
68 Idea Cellular Limited
Corporate Governance Report
Corporate Governance Report
Company’s Philosophy on Corporate Governance
Corporate Governance in simple words means the way acorporation is governed. Corporate governance refers tomechanisms, processes and relations by which corporationsare controlled and directed. Corporate Governance is asystematic process driven by the ethical conduct of thebusiness and affairs of an organisation aimed at promotingsustainable business and enhancing shareholders value in longterm. The essence of Corporate Governance lies in promotingand maintaining integrity, transparency and accountabilityacross all business practices. Corporate governance essentiallyinvolves balancing the interests of a company’s stakeholders,such as shareholders, management, customers, suppliers,financiers, government and the community. We believe thatCorporate Governance is a continuous journey for sustainablevalue creation for all the stakeholders driven by our values ofIntegrity, Commitment, Passion, Seamlessness and Speed.
The Aditya Birla Group has been one of the front runners inIndia to adopt and implement best governance practices. Ourgovernance practices are a product of self-desire, reflectingthe culture of trusteeship that is deeply ingrained in our valuesystem and reflected in our strategic thought process.
Our governance philosophy rests on five basic tenets:
• Board accountability to the Company and shareholders;
• Strategic guidance and effective monitoring by the Board;
• Protection of minority interests and rights;
• Equitable treatment of all shareholders; and
• Superior transparency and timely disclosure.
In line with this philosophy, Idea Cellular Limited, an AdityaBirla Group Company, continuously strives for excellencethrough adoption of best governance and disclosure practices.Corporate Governance has always been intrinsic to themanagement of the business and affairs of our Company.Corporate Governance in Idea is a reflection of principlesentrenched in our values and policies, leading to value drivengrowth. At Idea ensuring fairness, transparency andaccountability across all business processes is of utmostimportance. We believe that good governance practices stemfrom the culture and mindset of the organisation. Whilemaking business decisions our objective is to meetstakeholders’ interest and societal expectations. We at Ideaare committed in fostering and sustaining a culture thatintegrates all components of good governance anddemonstrates highest standard of ethical and responsiblebusiness conduct. Your Company confirms compliance to theCorporate Governance requirements as enshrined in the SEBI(Listing Obligations and Disclosure Requirements)Regulations, 2015 [hereinafter referred to as ‘ListingRegulations’], the details of which for the Financial Year endedMarch 31, 2017 is as set out hereunder:
1. BOARD OF DIRECTORS
An active, informed and independent Board is a pre-requisitefor strong and effective corporate governance. The Board playsa crucial role in overseeing how the management safeguardsthe interests of all the stakeholders. The Board ensures thatthe Company has clear goals aligned to the shareholders’ valueand growth. The Board critically evaluates strategic directionof the Company and exercises appropriate control to ensurethat the business of the Company is conducted in the bestinterests of the shareholders and society at large. The Board isduly supported by the Managing Director and SeniorManagement Personnel in ensuring effective functioning ofthe Company.
Composition of the Board
The Company has a balanced and diverse Board, whichincludes independent professionals and confirms to theprovisions of the Companies Act, 2013 and the ListingRegulations. Your Company’s Board represents a confluenceof experience and expertise from diverse areas of technology,banking, telecommunication, general management andentrepreneurship. As on March 31, 2017, the Board comprisesof twelve members comprising of a Non- Executive Chairman,a Managing Director, a Whole Time Director, Six IndependentDirectors and three Non-Executive Directors. There are 4women directors on the Board of the Company. Thecomposition of the Board reflects the judicious mix ofprofessionalism, competence and sound knowledge whichenables the Board to provide effective leadership to theCompany. The positions of Chairman and Managing Directorare held by different individuals where the Chairman of theBoard is a Non-Executive Director.
The Board periodically evaluates the need for change in itssize and composition to ensure that it remains aligned withstatutory and business requirements.
None of the Director is a Director on the Board of more thanten Public Limited Companies or acts as an IndependentDirector in more than seven Listed Companies. Further, noneof the Director is a Member of more than ten Committees orChairman of more than five Committees, across all theCompanies in which he/she is a Director. Except Mr. KumarMangalam Birla and Mrs. Rajashree Birla, who are related toeach other as son and mother, no other Directors are relatedto each other. The Company has issued the formal letter ofappointment to all the Independent Directors as prescribedunder the provisions of the Companies Act, 2013 and theterms and conditions of their appointment has been uploadedon the website of the Company. The Company has receiveddeclarations from all the Independent Directors confirmingthat they meet the criteria of independence as specified underSection 149 (6) of the Companies Act, 2013 and they arequalified to act as Independent Directors.

C K
Annual Report 2016-17 69
Corporate Governance Report
the Directors well in advance, usually a week before theMeeting. In case of sensitive agenda matters, where it is notpractical to circulate the relevant information as part of theagenda papers, the same is tabled at the meeting. In specialand exceptional circumstances, additional or supplementaryagenda items are taken-up for discussion with the permissionof the Chairman. The members of the Board or Committeesare free to suggest any item to be included in the agenda, inaddition to exercising their right to bring up matters fordiscussion at the meeting with permission of the Chairman.The Senior Management Personnel are invited to the Board/Committee Meetings to apprise and update the members onthe items being discussed at the meeting. All the relevantinformation as enumerated in Part A of Schedule II of theListing Regulations is placed before the Board and the Boardin particular reviews and approves corporate strategies,business plan, annual budget, capital expenditure etc. TheBoard periodically reviews the compliance status of all theapplicable laws and is regularly updated on various legal andregulatory developments involving the Company. ActionTaken Report in respect of the decisions arising out of the
The Composition of the Board of Directors and the number of Directorships and Committee positions held by them as onMarch 31, 2017 are as under:
Name of Director Category No. of outside Outside CommitteeDirectorship(s) held1 Positions Held2
Public Member Chairman/Chairperson
Mr. Kumar Mangalam Birla Non-Executive 8 - -
Mrs. Rajashree Birla Non-Executive 7 - -
Dr. Shridhir Sariputta Hansa Wijayasuriya Non-Executive - - -
Mr. Sanjeev Aga Non-Executive 7 2 2
Mr. R. C. Bhargava3 Independent 6 2 3
Mr. Arun Thiagarajan Independent 5 2 4
Mr. Mohan Gyani Independent - - -
Ms. Tarjani Vakil Independent 8 4 4
Mr. P. Murari Independent 7 4 2
Mrs. Madhabi Puri Buch Independent 3 1 -
Mrs. Alka M. Bharucha4 Independent 5 1 1
Mr. Himanshu Kapania Managing Director 7 1 -
Mr. Akshaya Moondra5 Whole Time Director &Chief Financial Officer 7 5 -
1. Directorships held by the Directors as mentioned above, excludes directorships held in private companies, foreign companies and companiesregistered under Section 8 of the Companies Act, 2013.
2. In accordance with Regulation 26 of the Listing Regulations, Memberships/Chairmanships of two Committees viz. Audit Committee andStakeholders’ Relationship Committee of all Public Limited Companies have been considered.
3. Mr. R. C. Bhargava ceased to be a Director with effect from October 1, 2016.
4. Mrs. Alka M. Bharucha was appointed as an Independent Director with effect from December 26, 2016.
5. Mr. Akshaya Moondra was appointed as the Whole Time Director designated as Whole Time Director & Chief Financial Officer of theCompany with effect from July 8, 2016.
Board Meetings and Procedure
The annual calendar of meetings is broadly determined at thebeginning of each year. The Board meets atleast once in aquarter to review the quarterly financial results and operationsof the Company. Apart from the above, additional BoardMeetings are convened to address the specific needs of theCompany. In case of urgent business exigencies someresolutions are also passed by circulation, as permitted by law,which is confirmed in the subsequent Board Meeting. Timegap between two consecutive meetings does not exceed 120days. Video Conferencing / teleconferencing facilities are alsomade available to enable participation of Directors, in case theyare unable to attend the meeting physically. There is astructured manner in which the agenda items are preparedand presented. The Company Secretary in consultation withthe Chairman and the Managing Director prepares the detailedagenda for the meetings. All the agenda items are backed bycomprehensive agenda notes and relevant supporting paperscontaining all the vital information, so as to enable the Directorsto have focused discussion at the meeting and take informeddecisions. The agenda and agenda notes are circulated to all
C K
70 Idea Cellular Limited
Corporate Governance Report
previous meetings is placed at the succeeding meeting of theBoard/Committee. The Members of the Board have completefreedom to express their opinion and have unfettered andcomplete access to information in the Company. All thedecisions are taken after detailed deliberations by the BoardMembers at the meetings.
The draft minutes of each Board/Committee meetings arecirculated to all Directors for their comments within 15 daysof the meeting. The Company Secretary, after incorporatingcomments, received if any, from the Directors, records theminutes of each Board/Committee meeting within 30 daysfrom conclusion of the meeting. The important decisions takenat the Board/Committee meetings are communicated to theconcerned departments promptly. During the Financial Year2016-17, the Board met seven times i.e. on April 28, 2016, July8, 2016, August 8, 2016, October 24, 2016, February 4, 2017,February 11, 2017 and March 20, 2017. The intervening gapbetween two board meetings did not exceed 120 days.
The details of attendance of Directors at the Board Meetingsand at the Last Annual General Meeting are as under:
Name of Director No. of Board Meetings Attended
held during the tenure Last AGM1
Held Attended (Yes/No)
Mr. Kumar Mangalam Birla 7 5 Yes
Mrs. Rajashree Birla 7 6 No
Dr. Shridhir Sariputta Hansa 7 5 NoWijayasuriya
Mr. Arun Thiagarajan 7 5 Yes
Mr. Mohan Gyani 7 3 No
Ms. Tarjani Vakil 7 7 No
Mr. R.C. Bhargava2 3 3 No
Mr. P. Murari 7 4 No
Mr. Sanjeev Aga 7 7 No
Mr. Himanshu Kapania 7 6 Yes
Mrs. Madhabi Puri Buch 7 6 No
Mrs. Alka M. Bharucha3 3 3 NA
Mr. Akshaya Moondra4 5 5 Yes
1. AGM held on 29th September, 2016 at Cambay Sapphire (formerlyCambay Spa and Resort), Plot No. X-22-24, Near GIDC, OppositeHillwoods School, Sector 25, Gandhinagar-382 044, Gujarat.
2. Mr. R.C. Bhargava ceased to be Director with effect from October 1, 2016.
3. Mrs. Alka M. Bharucha was appointed as an Independent Director witheffect from December 26, 2016.
4. Mr. Akshaya Moondra was appointed as the Whole Time Directordesignated as Whole Time Director & Chief Financial Officer of the
Company with effect from July 8, 2016.
Induction and Familiarization program for Board Members
A formal letter of appointment together with the Induction kitis provided to the Independent Directors, at the time of theirappointment, setting out their role, functions, duties andresponsibilities. The directors are familiarized with yourCompany’s business and operations and interactions are heldbetween the directors and senior management of yourCompany. Directors are familiarized with the organizationalset-up, functioning of various departments, internal controlprocesses and relevant information pertaining to the Company.Apart from the above, periodic presentations are also made atthe Board / Committee meetings to familiarize the Directorswith the Company’s strategy, business performance, businessenvironment, regulatory framework, operations review, riskmanagement and other related matters.
The details of familiarization programs are posted on thewebsite of the Company viz. www.ideacellular.com.
Meeting of Independent Directors
The Independent Directors met informally without thepresence of Non-Independent Directors and the management,and discussed, inter-alia, on matters pertaining to evaluationof the performance of the Board as a whole, evaluation of theperformance of the Chairman and Executive Directors. Theyalso assessed the quality, quantity and timeliness of flow ofinformation between the management and the Board ofDirectors, which is necessary for the Board to effectively andreasonably perform their duties etc.
The Independent Directors expressed satisfaction on theoverall performance of the Directors and the Board as a whole.Inputs and suggestions received from the Directors wereconsidered at the Board Meeting and are being implemented.
Performance Evaluation of Board
A formal evaluation mechanism is in place for evaluating theperformance of the Board, the Committees thereof, individualDirectors and the Chairman of the Board. The evaluation wasdone based on the criteria which includes, among others,providing strategic perspective, Chairmanship of Board andCommittees, attendance and preparedness for the meetings,contribution at meetings, effective decision making ability, roleof the Committees etc. The Directors expressed theirsatisfaction with the evaluation process.
Code of Conduct
The Board of Directors have laid down the Code of Conductfor all the Board Members (incorporating, inter-alia, duties ofIndependent Directors) and Senior Management Personnel ofthe Company, which is also uploaded on the website of theCompany www.ideacellular.com. The Code is derived fromthree inter-linked fundamental principles, viz. good corporategovernance, good corporate citizenship and exemplarypersonal conduct. Code of conduct provides guidance andsupport for ethical conduct of the business. All Board Membersand Senior Management Personnel have affirmed complianceto the Code of Conduct. A declaration signed by the Managing

C K
Annual Report 2016-17 71
Corporate Governance Report
Director affirming the compliance with the Code of Conductby the Board Members and Senior Management Personnel ofthe Company for the Financial Year ended March 31, 2017 isattached and forms part of this Report.
2. COMMITTEES OF THE BOARD
The Board Committees play a vital role in improving Boardeffectiveness in areas where more focused and extensivediscussions are required. Some of the Board functions areperformed through specially constituted Board Committeescomprising of Executive and Non-Executive / IndependentDirectors. Board Committee’s ensures focussed discussion andexpedient resolution of diverse matters. The Board Committeesinclude Audit Committee, Stakeholders’ RelationshipCommittee, Nomination and Remuneration Committee,Finance Committee, CSR Committee, Risk ManagementCommittee and Securities Allotment Committee. All theCommittees have formally established terms of references /Charter. The Minutes of the Committee Meetings are notedby the Board.
The role and composition of the aforesaid Committees,including the number of meetings held and the relatedattendance of the members are given below:
A. Audit Committee
The Company has an Audit Committee at the Board levelwith power and role that are in accordance with the ListingRegulations and the Companies Act, 2013. The AuditCommittee oversees the accounting, auditing and overallfinancial reporting process of the Company. The AuditCommittee acts as a link between the Management, theStatutory Auditors, Internal Auditors and the Board ofDirectors to oversee the financial reporting process of theCompany.
The Committee is governed by a Charter which is in linewith the regulatory requirements mandated by theCompanies Act, 2013 and Regulation 18 of the ListingRegulations.
Powers of Audit Committee
The powers of Audit Committee include the following:
i. To investigate any activity within its terms ofreference;
ii. To seek information from any employee;
iii. To obtain outside legal or other professional advice;
iv. To secure attendance of outsiders with relevantexpertise, if it considers necessary;
v. To call for a separate meeting with statutory and internalauditors with or without the Management team;
vi. To call for a separate meeting with the MD/CEO andas appropriate, other members of the managementteam to get an independent feedback and also to givefeedback received from the auditors;
vii. Appoint any external firm to conduct special reviewsof the Company (financial or legal) subject to theapproval of the Board;
viii. Perform other activities related to the Charter asrequested by the Board of Directors; and
ix. Carry out additional functions as contained in the SEBI(Listing Obligations and Disclosure Requirements)Regulations, 2015 or other regulatory requirementsapplicable to the Company or in the terms of referenceof the Audit Committee.
Terms of reference
The broad terms of reference of Audit Committee includesthe following:
1. Oversight of the company’s financial reporting processand the disclosure of its financial information to ensurethat the financial statement is correct, sufficient andcredible.
2. Recommendation for appointment, remuneration andterms of appointment of auditors of the company.
3. Approval of payment to statutory auditors for any otherservices rendered by statutory auditors.
4. Reviewing with the management, the annual financialstatements and auditor’s report thereon before submissionto the board for approval, with particular reference to:
a. Matters required to be included in the Director’sResponsibility Statement to be included in the Board’sreport in terms of Clause (c) of sub-section 3 of section134 of the Companies Act, 2013;
b. Changes, if any, in accounting policies and practicesand reasons for the same;
c. Major accounting entries involving estimates basedon the exercise of judgment by management;
d. Significant adjustments made in the financialstatements arising out of audit findings;
e. Compliance with listing and other legal requirementsrelating to financial statements;
f. Disclosure of any related party transactions;
g. Qualifications in the draft audit report;
5. Reviewing, with the management, the quarterly financialstatements before submission to the board for approval.
6. Reviewing, with the management, the statement of uses/application of funds raised through an issue (public issue,rights issue, preferential issue, etc.), the statement of fundsutilized for purposes other than those stated in the offerdocument / prospectus / notice and the report submittedby the monitoring agency monitoring the utilisation ofproceeds of a public or rights issue and makingappropriate recommendations to the Board to take upsteps in this matter.

C K
72 Idea Cellular Limited
Corporate Governance Report
7. Review and monitor the auditor’s independence andperformance and effectiveness of audit process.
8. Approval or any subsequent modification of transactionsof the company with related parties.
9. Scrutiny of inter-corporate loans and investments.
10. Valuation of undertakings or assets of the company,wherever it is necessary.
11. Evaluation of internal financial controls and riskmanagement systems.
12. Reviewing, with the management, performance ofstatutory and internal auditors, adequacy of the internalcontrol systems.
13. Reviewing the adequacy of internal audit function, if any,including the structure of the internal audit department,staffing and seniority of the official heading thedepartment, reporting structure coverage and frequencyof internal audit.
14. Discussion with internal auditors of any significantfindings and follow-up thereon.
15. Reviewing the findings of any internal investigations bythe internal auditors into matters where there is suspectedfraud or irregularity or a failure of internal control systemsof a material nature and reporting the matter to the board.
16. Discussion with statutory auditors before the auditcommences, about the nature and scope of audit as wellas post-audit discussion to ascertain any area of concern.
17. To look into the reasons for substantial defaults in thepayment to the depositors, debenture holders,shareholders (in case of non-payment of declareddividends) and creditors.
18. To review the functioning of the Whistle Blowermechanism.
19. Approval of appointment of Chief Financial Officer(i.e., the whole-time Finance Director or any other personheading the finance function or discharging that function)after assessing the qualifications, experience andbackground, etc. of the candidate.
20. Carrying out any other function as is mentioned in theterms of reference of the Audit Committee.
21. To review:
a. Management Discussion and Analysis of financialcondition and results of operations;
b. Statement of significant related party transactions (asdefined by the Audit Committee), submitted bymanagement;
c. Management letters / letters of internal controlweaknesses issued by the Statutory Auditors, if any;
d. Internal audit reports relating to internal controlweaknesses; and
e. The appointment, removal and terms of remunerationof the Chief Internal Auditor.
In addition to reviewing financial results on quarterly basis,Audit Committee Meetings are also convened for reviewingInternal Audit reports pertaining to various functions andalso for reviewing the implementation of Internal FinancialControl framework. The Company has appropriate internalcontrol systems for business processes, covering operations,financial reporting and compliance with applicable laws andregulations. Regular internal audits and management reviewsensure that the responsibilities are executed effectively. TheAudit Committee actively reviews the adequacy andeffectiveness of internal control systems and suggestsimprovements for strengthening them, as appropriate.
The Committee also oversees the performance of the internaland statutory auditors and also recommends theirappointment and remuneration to the Board. Information asdetailed in Part C of Schedule II of the Listing Regulations ismandatorily being reviewed by the Audit Committee. Theminutes of the Audit Committee Meetings forms part of theBoard Agenda. The Chairman of the Audit CommitteeMeeting briefs the Board on the discussions held during AuditCommittee Meeting.
Composition, Meetings and Attendance
The composition of the Audit Committee meets therequirements of Section 177 of the Companies Act, 2013 andRegulation 18 of the Listing Regulations. As on March 31, 2017,the Audit Committee comprises of four members, of whichthree members, including the Chairman, are IndependentDirectors and one Member is a Non-Executive Director. Themajority of the Audit Committee members possess accountingand financial management expertise. The Company Secretaryacts as the Secretary to the Committee. The Chairman of theAudit Committee was present at the last Annual GeneralMeeting of the Company held on September 29, 2016.
The Managing Director and the Whole Time Director & ChiefFinancial Officer of the Company are permanent invitees tothe Audit Committee Meetings. Representatives of theStatutory Auditors and Internal Auditors of the Company arealso invited to the Audit Committee Meetings. In addition,other Senior Management Personnel are also invited to theCommittee Meetings to present reports on the respectivefunctions that are discussed at the meetings from time to time.The Cost Auditors attend the meeting when Cost Audit Reportis discussed.
During the Financial Year 2016-17, six meetings of the AuditCommittee were held on April 28, 2016, August 8, 2016,August 18, 2016, October 24, 2016, February 11, 2017 andMarch 19, 2017. The intervening gap between two Meetingsdid not exceed 120 days.
The composition of the Audit Committee and the attendanceof the members at the meetings held during the year are asunder:

C K
Annual Report 2016-17 73
Corporate Governance Report
Name of Director Category No. of No. ofMeetings Meetings
held during attendedthe tenure
Mr. Arun Thiagarajan Independent 6 5(Chairman)
Ms. Tarjani Vakil Independent 6 5
Dr. Shridhir Sariputta Non- 6 2Hansa Wijayasuriya Executive
Mrs. Madhabi Independent 6 6Puri Buch
All the recommendations made by the Audit Committee wereaccepted by the Board. Audit Committee met separately withthe Statutory Auditors to get their inputs on important mattersrelating to their areas of audit.
B. Nomination and Remuneration Committee
The Nomination and Remuneration Committee has beenentrusted with role of formulating criteria for determiningthe qualifications, positive attributes and independence of theDirectors as well as identifying persons who may beappointed at senior management levels and also devising apolicy on remuneration of Directors, Key ManagerialPersonnel and other senior employees. The Committee alsomonitors and administers the Employee Stock OptionScheme(s).
Terms of reference
The broad terms of reference of Nomination andRemuneration Committee includes the following:
• set the level and composition of remuneration which isreasonable and sufficient to attract, retain and motivateDirectors and Senior Management of the quality requiredto run your Company successfully;
• set the relationship of remuneration to performance;
• check whether the remuneration provided to Directorsand Senior Management includes a balance between fixedand incentive pay reflecting short and long-termperformance objectives appropriate to the working of yourCompany and its goals;
• formulate appropriate policies, institute processes whichenable the identification of individuals who are qualifiedto become Directors and who may be appointed in SeniorManagement and recommend the same to the Board;
• review and implement succession and development plansfor Managing Director, Executive Directors and SeniorManagement;
• devise a policy on Board diversity;
• formulate the criteria for determining qualifications,positive attributes and independence of Directors; and
• to supervise and monitor the process of issuance/ grant/vesting/ cancellation of ESOPs and such other instruments
as may be decided to be granted to the employees of theCompany/ Subsidiary Company, from time to time, asper the provisions of the applicable laws, more particularlyin terms of Securities and Exchange Board of India (ShareBased Employee Benefits) Regulations, 2014.
Composition, Meetings and Attendance
The composition of the Committee meets the requirementsof Section 178 of the Companies Act, 2013 and Regulation 19of the Listing Regulations. As on March 31, 2017, Committeecomprises of three Non-Executive Directors, majority ofwhom including the Chairperson are Independent Directors.The Company Secretary acts as a secretary to the Committee.
During the Financial Year 2016-17, five meetings of theNomination and Remuneration Committee were held on April28, 2016, July 8, 2016, August 8, 2016, October 24, 2016 andFebruary 11, 2017.
The composition of the Nomination and RemunerationCommittee and the attendance of the members at the meetingsheld during the Financial Year 2016-17 are as under:
Name of Director Category No. of No. ofMeetings Meetings
held during attendedthe tenure
Ms. Tarjani Vakil Independent 5 5(Chairperson)
Mr. Arun Independent 5 3Thiagarajan
Mr. Kumar Non-Executive 5 4Mangalam Birla
Remuneration Policy
The Board has, on the recommendation of the Nominationand Remuneration Committee framed a policy onremuneration of Directors and Senior ManagementEmployees. The Company’s remuneration policy is directedtowards rewarding performance based on periodic review ofthe achievements. The remuneration policy has been disclosedin the Annual Report.
Remuneration of Directors
(i) Remuneration to the Executive Directors
The remuneration package of the Executive Directors isdetermined by the Nomination and RemunerationCommittee in accordance with the Remuneration policyof your Company. The recommendations of theCommittee are considered and approved by the Board,subject to the approval of the members of the Company.The remuneration package of the Managing Director andWhole Time Director comprises of a fixed salarycomponent and a performance linked bonus. A fair portionof the remuneration of the Executive Directors are linkedto the Company’s performance, thereby creating a strongalignment of interest with shareholders.

C K
74 Idea Cellular Limited
Corporate Governance Report
I. Details of the Managerial Remuneration paid to the Executive Directors during Financial Year 2016-17 is as under:
Executive Relationship Business Remuneration during 2016-17Director with other relationship with All elements of Fixed component Service Contract, Stock Option
Directors the Company, remuneration & performance notice period, details, if anyif any package i.e. salary, linked incentives, severance fee
allowances and along withother benefits performance
etc. criteria
Mr. Himanshu None Managing 60.78 Mn 39.32 Mn See Note (c) See TableKapania Director See Note (a) & (d) See Note (b) II below
Mr. Akshaya None Whole Time Director & 27.86 Mn 5.95 Mn See Note (c) See TableMoondra Chief Financial Officer See Note (a) See Note (b) II below
(a) The amount includes perquisite value of ` 6.69 Mn, towards stock options exercised by Mr. Himanshu Kapania and perquisite value of ` 14.42 Mn exercisedby Mr. Akshaya Moondra during FY 2016-17.
(b) Mr. Himanshu Kapania was paid a sum of ` 39.32 Mn towards performance incentive, linked to achievement of targets over and above ` 60.78 Mn paid asremuneration and Mr. Akshaya Moondra was paid a sum of ` 5.95 Mn towards performance incentive, linked to achievement of targets over and above` 27.86 Mn paid as remuneration. The Performance Linked Incentive (PLI) is disclosed on actual pay-out basis.
(c) The tenure of Managing Director and Whole Time Director is for 5 years from their respective dates of appointment and can be terminated by three months’notice on either side. No severance fees is payable to the Managing Director or Whole Time Director.
(d) As the Company did not have profits for the year ended March 31, 2017, an amount of ` 30.54 Mn has been paid / accrued to the Managing Director, in excessof the limits specified under Section 197 of the Companies Act, 2013, read with Schedule V of the Act. The Company is in the process of complying with thestatutory requirements prescribed to regularise such excess payments, including seeking approval of shareholders / central government, as necessary.
(ii) Remuneration to Non-Executive/ Independent Directors
Non-Executive Directors are paid remuneration by wayof sitting fees for the meetings attended by them andCommission which is well within the limits prescribedunder Companies Act, 2013 (‘the Act’). The Commission/Remuneration payable to Non-Executive Directors isdecided by the Board of Directors on the basis ofrecommendation of the Nomination and RemunerationCommittee, subject to the overall approval by the membersof the Company. In view of Net loss incurred by the
Company for Financial Year ended March 31, 2017, noCommission has been approved by the Board forFY 2016-17.
The sitting fees payable to the Directors is ̀ 50,000/- for eachmeeting of the Board, ̀ 25,000/- for each meeting of the AuditCommittee and ̀ 20,000/- for each other Committee Meetings.
The Non-Executive Directors are also entitled toreimbursement of expenses incurred in performance of theduties as Directors and Members of the Committees.
II. Details of Stock Options (Options) and Restricted Stock Units (RSU) granted/exercised to/by the Executive Directors:
Executive Director ESOS -2006 ESOS-2013
No. of Options Exercise Options No. of Options/ Exercise Options/Granted price Exercised RSU granted Price RSU
(in `̀̀̀̀) (in `̀̀̀̀) Exercised
267,500 Options 39.30 2,67,500 1,893,740 Options 126.45 80,000(Tranche I) 533,333 RSU’s 10/- 70,000
Mr. Himanshu Kapania(Tranche I)
66,875 Options 45.55 66,875 1,57,812 Options 110.45 NA(Tranche II) 44,444 RSU’s 10/- (See note c)
(Tranche IV)
1,07,000 Options 45.55 1,07,000 297,885 Options 126.45 NIL(Tranche II) 146,944 RSU’s 10/- 146,944
Mr. Akshaya Moondra (Tranche I)
53,500 Options 57.55 53,500(Tranche III)
(a) In terms of your Company’s Employee Stock Option Scheme, 2006 (ESOS-2006), each Option is convertible into one equity share of the Company uponvesting. These Options vest in 4 equal annual instalments after one year of the grant and are exercisable within a period of 5 years from the date of vesting.
(b) In terms of Employee Stock Option Scheme, 2013 (ESOS-2013), each Option and each Restricted Stock Units (RSU) when exercised is convertible into oneequity share of the Company. These Options would vest in 4 equal annual instalments after one year of the grant and the RSUs will vest after 3 years fromthe date of grant. The Options and RSUs shall be exercisable within a period of 5 years from the date of vesting.
(c) During the year under review, Mr. Himanshu Kapania was granted 1,57,812 stock options and 44,444 RSU’s under Tranche IV of ESOS- 2013. In termsof ESOS-2013, these Options would vest in 4 equal annual instalments after one year of the grant and the RSUs will vest after 3 years from the date ofgrant. The Options and RSUs shall be exercisable within a period of 5 years from the date of vesting.

C K
Annual Report 2016-17 75
Corporate Governance Report
The details of the sitting fees paid to Non-Executive Directorsfor the Financial Year ended March 31, 2017 are as under:
Name of Non-Executive Sitting Fees paid forDirector FY 2016-17 (`)
Mr. Kumar Mangalam Birla 3,30,000
Mrs. Rajashree Birla 3,60,000
Dr. Shridhir Sariputta Hansa Wijayasuriya 3,00,000
Mr. Arun Thiagarajan 4,35,000
Mr. Mohan Gyani 1,50,000
Ms. Tarjani Vakil 8,55,000
Mr. R.C. Bhargava1 1,50,000
Mr. P. Murari 2,20,000
Mrs. Madhabi Puri Buch 4,50,000
Mrs. Alka M. Bharucha2 1,50,000
Mr. Sanjeev Aga 5,90,000
Total 39,90,000
1. Mr. R.C. Bhargava ceased to be Director w.e.f. from October 1, 2016.
2. Mrs. Alka M. Bharucha was appointed as an Independent Directorw.e.f. December 26, 2016.
(iii) Details of Shareholding of Directors
The details of shareholding of Directors as on March 31, 2017are as under:
Name of Director No. of Equity Shares#
Mr. Kumar Mangalam Birla 2,33,333
Mr. Arun Thiagarajan 7,700
Ms. Tarjani Vakil 147
Mr. Sanjeev Aga 2,50,000
Mr. Himanshu Kapania 4,34,375
Mr. Akshaya Moondra 2,77,444
#Shares held singly or as a first shareholder are only considered.
During the year under review, the Company has paid` 36.87 Mn as professional fees to M/s. Bharucha & Partners,a firm in which the Company’s Director Mrs. Alka M.Bharucha is a partner. There were no other pecuniaryrelationships or transactions of Non-Executive Directors vis-a-vis the Company.
C. Stakeholders’ Relationship Committee
Stakeholders’ Relationship Committee ensures quick redressalof the complaints of the stakeholders and oversees the processof share transfer. The Committee also monitors redressal ofShareholders’/Investors’ complaints/ grievances viz. non-receipt of annual report, dividend payment, issue of duplicateshare certificates, transmission of shares and other related
complaints. In addition, the Committee also monitors otherissues including status of Dematerialisation/ Rematerialisationof shares issued by the Company.
Composition, Meetings and Attendance
The composition of Stakeholders’ Relationship Committee isin conformity with the provisions of Companies Act, 2013 andRegulation 20 of the Listing Regulations. As on March 31, 2017,the Committee comprises of three members namely,Ms. Tarjani Vakil (Chairperson), Mr. Sanjeev Aga andMr. Himanshu Kapania. The Company Secretary acts as aSecretary to the Committee. During the Financial Year2016-17, the Stakeholders’ Relationship Committee met onceon February 11, 2017 and the said meeting was attended byall the members.
Compliance Officer
Mr. Pankaj Kapdeo, Company Secretary, acts as theCompliance Officer of the Company. The Compliance Officerbriefs the Committee on the grievances/queries of theinvestors and the steps taken by the Company for redressingtheir grievances. He is responsible for complying with theprovisions of the Listing Regulations, requirements of securitieslaws and SEBI Insider Trading Regulations. The ComplianceOfficer can be contacted at:
Idea Cellular Limited
Birla Centurion, 10th Floor,Century Mills Compound,Pandurang Budhkar Marg,Worli, Mumbai – 400 030Tel: +91-9594003434Fax: +91-22-26527080Email: [email protected]
Investor Grievances Redressal Status
During the financial year 2016-17, the complaints and queriesreceived from the shareholders were general in nature andwere mainly pertaining to non-receipt of Dividend, non-receiptof annual reports, request for subsidiary annual accounts etc.All the complaints were resolved to the satisfaction of theinvestors.
The status of Investors’ Complaints as on March 31, 2017, isas follows:
No. of complaints as on April 1, 2016 0
No. of complaints received during theFinancial Year 2016-17 134
No. of complaints resolved upto March 31, 2017 134
No. of complaints pending as on March 31, 2017 0
To redress investor grievances, the Company has a dedicatedE-mail ID [email protected] to which investors maysend complaints.

C K
76 Idea Cellular Limited
Corporate Governance Report
D. Finance Committee
The Company has constituted a Finance Committee to approvematters relating to availing of financial/banking facilities andother related treasury and banking activities. FinanceCommittee looks into matters pertaining to borrowings,working capital management, foreign currency contracts,besides other powers granted to it by the Board.
Composition, Meetings and Attendance
As on March 31, 2017, the Committee comprises of threemembers namely, Ms. Tarjani Vakil, Mr. Sanjeev Aga and Mr.Himanshu Kapania. The Company Secretary acts as theSecretary to the Committee. During the Financial Year 16-17,four meetings of the Finance Committee were held on May12, 2016, August 18, 2016, September 1, 2016 and September23, 2016.
The composition of the Finance Committee and the attendanceof the members at the meetings held during the year are asunder:
Name of Director Category No. of No. of
Meetings Meetings
held during attended
the tenure
Mr. Sanjeev Aga Non-Executive 4 3
Ms. Tarjani Vakil Independent 4 4
Mr. Himanshu Kapania Managing Director 4 4
E. Securities Allotment Committee
The Securities Allotment Committee is empowered to makeallotment of all kinds of securities that may be issued by theCompany, from time to time. The Committee comprises ofthree members including one Independent Director. As onMarch 31, 2017 the Committee comprises of Mr. HimanshuKapania, Mr. Sanjeev Aga and Ms. Tarjani Vakil. TheCompany Secretary acts as a Secretary to the Committee.During the Financial Year 16-17, nine meetings of the SecuritiesAllotment Committee were held on December 13, 2016,January 4, 2017, January 17, 2017, January 27, 2017, January31, 2017, February 8, 2017, February 14, 2017, February 20,2017 and March 20, 2017, primarily to allot theNon-Convertible Debentures raised by the Company.
The composition of the Finance Committee and the attendanceof the members at the meetings held during the year are asunder:
Name of Director Category No. of No. ofMeetings Meetings
held during attendedthe tenure
Mr. Sanjeev Aga Non-Executive 9 8
Ms. Tarjani Vakil Independent 9 9
Mr. Himanshu Kapania Managing Director 9 6
F. Corporate Social Responsibility (CSR) Committee
In compliance with the requirements of the Companies Act,2013, the Company has constituted the Corporate SocialResponsibility Committee (CSR Committee). The CSRCommittee evaluates and recommends to the Board the CSRactivities to be undertaken during the year and amount to bespent on CSR activities. The CSR Committee monitors the CSRpolicy from time to time.
As on March 31, 2017, the Committee comprises of threemembers, including one Independent Director. Mrs. RajashreeBirla, Non-Executive Director is the Chairperson of theCommittee, Mr. P. Murari and Mr. Himanshu Kapania areother members of the Committee. Dr. Pragnya Ram, GroupExecutive President, Corporate Communications & CSR is thepermanent invitee to all the meetings of the Committee. TheCompany Secretary acts as the Secretary to the Committee.During the Financial Year 2016-17, three meetings of theCommittee were held on April 28, 2016, August 8, 2016 andOctober 24, 2016.
The composition of the CSR Committee and the attendance ofthe members at the meetings held during the year are as under:
Name of Director Category No. of No. ofMeetings Meetings
held during attendedthe tenure
Mrs. Rajshree Birla Non-Executive 3 3(Chairperson)
Mr. P. Murari Independent 3 1
Mr. Himanshu Kapania Managing Director 3 3
During the year under review, your Company has undertakenvarious CSR activities details whereof are provided in theDirectors’ Report. The focus areas for Company’s CSR activitieswere health care, education, sustainable livelihood,infrastructure development and social change. The CSR Reportfor the Financial Year ended March 31, 2017 is attached as‘Annexure B’ to the Board’s Report. Corporate SocialResponsibility Policy of the Company is available on theCompany’s website www.ideacellular.com.
G. Risk Management Committee
In compliance with the requirements of Regulation 21 of theListing Regulations, the Board has duly constituted the RiskManagement Committee. The Committee’s prime responsibilityis to frame, implement and monitor the Enterprise RiskManagement framework for the Company. The Committeereviews and monitors the risk management plan and ensuresits effectiveness. As on March 31, 2017 the Committee comprisesof Mr. Arun Thiagarajan, Ms. Tarjani Vakil and Mr. HimanshuKapania as its members. Mr. Akshaya Moondra, Whole TimeDirector and Chief Financial Officer is the permanent inviteeto all the meetings of the Committee. The Company Secretaryacts as the Secretary to the Committee.
During the year under review no meeting of the Committeewas held.

C K
Annual Report 2016-17 77
Corporate Governance Report
3. SUBSIDIARY COMPANIES
The subsidiary companies are managed by their individualBoard of Directors. The Company monitors the performanceof subsidiary companies on periodic basis. The statementcontaining details of all significant transactions entered intoby subsidiary companies is tabled before the Boardperiodically. Minutes of the Board Meetings of unlistedsubsidiary companies are placed before the Board. TheCompany does not have any material non-listed IndianSubsidiary Company. The policy for determining materialsubsidiary is available on the Company’s websitewww.ideacellular.com.
4. DISCLOSURES
a. Related Party Transactions
During the year under review, the Company acquired10,000 Equity Shares of face value of ` 10 each of IdeaCellular Infrastructure Services Limited (ICISL), a wholly-owned subsidiary of the Company at an issue price of~ ̀ 4,96,297 per Equity Share each, for consideration otherthan cash, against transfer of tower infrastructureundertaking by the Company to ICISL with approvalgranted by the Audit Committee and the Board ofDirectors at their respective meetings. All contracts/arrangements/transactions entered by the Companyduring the financial year with the related parties asdetailed in Note no. 59 of the Standalone FinancialStatements were in ordinary course of business and at anarm’s length basis. None of the related party transactionsentered into by the Company were in conflict with theCompany’s interest. There are no materially significantRelated Party Transactions made by the Company withPromoters, Directors or Key Managerial Personnel etc.which may have potential conflict with the interest of theCompany at large. Member’s approval for MaterialRelated Party Transaction, as defined under the ListingRegulations shall be obtained at the ensuing AnnualGeneral Meeting.
All Related Party Transactions are placed before the AuditCommittee for their approval. Omnibus approvals aretaken for the transactions which are repetitive in nature.In compliance with Listing Regulations, the necessarystatements/disclosures with respect to the Related PartyTransactions, are tabled before the Audit Committee andthe Board of Directors on quarterly basis. Company hasimplemented a Related Party Transaction manual andStandard Operating Procedures for the purpose ofidentification and monitoring of such transactions. Thedetails of the transactions with Related Parties areprovided in the accompanying financial statements asrequired under Ind AS 24. In line with requirement of theCompanies Act, 2013 and Regulation 23 of the ListingRegulations, your Company has adopted a Policy onRelated Party Transactions which is available atCompany’s website www.ideacellular.com.
b. Disclosure of Accounting Treatment
In the preparation of standalone and consolidated financialstatements, your Company has followed all the applicableAccounting Standards and the generally acceptedaccounting principles in India.
c. Details of non-compliance with regard to the CapitalMarkets
There has been no instances of non-compliance by yourCompany and no penalties or strictures have beenimposed by Stock Exchanges or SEBI or any statutoryauthority on any matter related to capital markets duringthe last three years.
d. Proceeds from public issues, rights issues, preferentialissues etc.
During the year under review, no proceeds were raisedby the Company from public issues, rights issue,preferential issue etc.
e. Insider Trading
In order to regulate trading in securities of the Companyby the Directors and designated employees, yourCompany has adopted a Code of Conduct for trading inlisted or proposed to be listed securities of your Company.Insider Trading Code prevents misuse of unpublishedprice sensitive information and it also provides forperiodical disclosures and obtaining pre-clearance fortrading in securities of your Company by the Directors,Designated Employees and Connected Persons of yourCompany.
f. Whistle Blower Policy
Your Company has established a Vigil Mechanism/Whistle Blower Policy for Directors and Employeespursuant to which a Committee has been constituted foraddressing complaints received from Directors andEmployees concerning unethical behaviour, actual orsuspected fraud and violation of Code of Conduct or ethicspolicy of your Company. The Policy provides adequatesafeguards against victimisation of Director(s)/Employee(s) and direct access to the Chairman of theAudit Committee in exceptional cases. Your Companyhereby affirms that no Director/Employee has beendenied access to the Chairman of the Audit Committee.
g. Compliance with the Mandatory Corporate GovernanceRequirements as prescribed under the ListingRegulations
The Board of Directors periodically review the complianceof all applicable laws. The Company is in full compliancewith all the mandatory requirements of CorporateGovernance as specified in Regulation 17 to 27 and Clauses(b) to (i) of sub-regulation (2) of Regulation 46 of the ListingRegulations. The Company has obtained a certificateaffirming the compliances from M/s. Deloitte Haskins &Sells LLP, Chartered Accountants, the Company’sStatutory Auditors and the same is appended as anAnnexure to this Report.

C K
78 Idea Cellular Limited
Corporate Governance Report
h. Details of Compliances with the Non-mandatoryCorporate Governance as prescribed under the ListingRegulations
In addition to the mandatory requirements, the Companyhas also adopted the following non-mandatoryrequirements as prescribed in Regulation 27 of the ListingRegulations:
• Position of the Chairman and the Managing Directorare held by separate individuals.
• Your Company maintains a separate office for theNon-Executive Chairman. All necessary infrastructureand assistance is made available to enable him todischarge his responsibilities effectively.
• The statutory financial statements of your Companyare unqualified.
• The quarterly results along with the press release, asapproved by the Board are first submitted to the StockExchanges. The same are then uploaded on thewebsite of the Company www.ideacellular.com/investor-relations/results. On the next day of theannouncement of the quarterly results, an earningscall is organised, where the management responds tothe queries of the investors/analysts. These calls arewebcast live and transcripts thereof are posted on thewebsite.
5. MANAGEMENT DISCUSSION AND ANALYSIS
A detailed report on Management Discussion and Analysisforms part of the Director’s Report.
6. SHAREHOLDERS’ INFORMATION
i) Disclosure regarding appointment or re-appointment ofDirectors
Brief profile of the Directors seeking appointment orre-appointment is annexed to the Notice convening the22nd Annual General Meeting forming part of this AnnualReport.
ii) Communication to Shareholders
The Company’s quarterly financial results, presentationmade to Institutional Investors/Analysts, quarterlyreports, official news releases and other generalinformation about the Company are uploaded on theCompany’s website (www.ideacellular.com).
Quarterly financial results, presentation made to Analysts,Quarterly reports, official news releases and official mediareleases are also sent to the Stock Exchanges.
The quarterly financial results of the Company aregenerally published in The Economic Times/ BusinessStandard (all editions) and Western Times (a regional dailypublished in Gujarat).
At the end of each quarter, the Company organizesearnings call with the analysts and investors and thetranscripts of the same are thereafter uploaded on thewebsite of the Company.
iii) General Body Meetings:
The last three Annual General Meetings were held as under:
Financial Date Time Venue Particulars of SpecialYear Resolution(s)
2015-16 September 29, 2016 12.30 pm Cambay Sapphire (Formerly 1. Issue of Non-Convertible SecuritiesCambay Spa and Resort), on private placement basisPlot No.22-24, Near GIDC,Opposite Hillwoods School,Sector 25, Gandhinagar-382 044,Gujarat.
2014-2015 September 28, 2015 12.30 p.m. Cambay Sapphire (Formerly 1. Issue of Non-Convertible SecuritiesCambay Spa and Resort), on Private Placement Basis.Plot No.22-24, Near GIDC, 2. Approval of Material Related PartyOpposite Hillwoods School, Transactions with Indus TowersSector 25, Gandhinagar-382 044, Limited.Gujarat.
2013-2014 September 26, 2014 12.30 p.m. Cambay Spa and Resort, 1. Adoption of new Articles ofPlot No. X-22/23, GIDC Association.Electronic Estate, Sector 25, 2. Borrowing powers of theGandhinagar-382 044, Company.Gujarat. 3. Creation of security on the
properties of the Company,both present and future.
4. Approval for the payment ofcommission to the Non-ExecutiveDirectors.

C K
Annual Report 2016-17 79
Corporate Governance Report
Extra-ordinary General Meeting
During the Financial Year 2016-17, no Extra-ordinary GeneralMeeting was held.
Postal Ballot
There was no Special Resolution passed through Postal Ballotduring the financial year 2016- 2017. None of the businessproposed to be transacted at the ensuing Annual GeneralMeeting require passing a resolution through Postal Ballot.
7. CEO/CFO CERTIFICATION
As required under Regulation 17(8) of the Listing
Regulations, certificate duly signed by the CEO/ CFO of
the Company is appended as an Annexure to this Report.
8. REPORT ON CORPORATE GOVERNANCE
This Corporate Governance Report forms part of the Annual
Report. The Company is in full compliance with all the
mandatory requirements of Corporate Governance as
specified in Regulation 17 to 27 and clauses (b) to (i) of sub-
regulation (2) of Regulation 46 of the Listing Regulations.
9. AUDITORS’ CERTIFICATION
As required under Regulation 34 of the Listing
Regulations, the certificate from the Company Auditor’s
M/s. Deloitte Haskins & Sells LLP, Chartered
Accountants, affirming compliance with the conditions of
Corporate Governance as stipulated in the aforesaid
Regulations is appended as an Annexure to this Report.
GENERAL SHAREHOLDERS’ INFORMATION
1. Annual General Meeting
Day and Date : Friday, June 30, 2017
Time : 4:00 P.M.
Venue : Cambay Sapphire(Formerly Cambay Spa and Resort),Plot No. 22-24, Near GIDC,Opposite Hillwoods School, Sector 25,Gandhinagar – 382 044, Gujarat
2. Financial Calendar for 2017-18 (Tentative)
Financial reporting for thequarter ending June 30, 2017 : End July, 2017
Financial reporting for thequarter endingSeptember 30, 2017 : End October, 2017
Financial reporting for thequarter endingDecember 31, 2017 : End January, 2018
Financial reporting for theyear ending March 31, 2018 : End April, 2018
Annual General Meeting forthe financial year 2017-18 : August/
September, 2018
iv) Details of unclaimed shares in terms of Regulation 39 of the Listing Regulations
In terms of regulation 39 (4) of the Listing Regulations, the details in respect of equity shares lying in the suspense accountswhich were issued in Demat form pursuant to the Initial Public Offer (IPO) of the Company in the year 2007 are as givenbelow:
Particulars No. of No. of
Cases Shares
Aggregate number of shareholders and the outstanding shares lying in the suspenseaccount at the beginning of the year i.e. as on April 1, 2016 77 17944
Number of shareholders who approached to the Issuer / Registrar for transfer of sharesfrom suspense account during the Financial Year 2016-17 2 688
Number of shareholders to whom shares were transferred from suspense account duringthe Financial Year 2016-17 2 688
Aggregate number of shareholders and the outstanding shares lying in the suspenseaccount at the end of the year i.e. as on March 31, 2017 75 17256
The voting rights on the shares in the suspense account as on March 31, 2017 shall remain frozen till the rightful owners of suchshares claim the shares. The Company sends periodic reminders to the concerned shareholders advising them to lodge their claimswith respect to unclaimed shares.
C K
80 Idea Cellular Limited
Corporate Governance Report
3. Book Closure Date : June 24, 2017 to June 30, 2017(both days inclusive)
4. Dividend : Nil
5. Dividend Payment : Not ApplicableDate (Since no Dividend is
recommended forFY 2016-17)
6. Registered Office : Suman Tower,Plot No. 18, Sector - 11,Gandhinagar – 382 011,GujaratTel: +91-79-66714000Fax: +91-79-23232251
7. Plant Locations : The Company being aService provider, has noplant locations.
8. Unclaimed Dividend
Section 124 of the Companies Act, 2013, mandates theCompany to transfer entire amount of dividend remainingunclaimed for a period of seven years to the InvestorEducation and Protection Fund (IEPF). Since, theCompany declared its maiden dividend in September 2013for FY 2012-13, no unclaimed dividend is due for transferto IEPF. The Company sends periodic reminders to theconcerned shareholders advising them to lodge theirclaims with respect to unclaimed dividend.
9. Listing Details
The Equity Shares of the Company are listed on thefollowing Stock Exchanges:
Name of Stock Exchanges
National Stock BSE LimitedExchange of India Limited Phiroze Jeejeebhoy“Exchange Plaza”, Towers, Dalal Street,Bandra-Kurla Complex, Mumbai – 400 001Bandra (East),Mumbai – 400 051
The Annual Listing Fees for the Financial Year 2017-18 has been paid tothe above Stock Exchanges.
10. Debt Securities
Listing Details:
The Non-Convertible Debentures of the Company arelisted on the Wholesale Debt Market (WDM) Segment ofthe National Stock Exchange of India Limited.
11. Stock Codes
Stock Code Reuters Bloomberg
Bombay StockExchange 532822 IDEA.BO IDEA IN
National StockExchange IDEA IDEA.NS NIDEA IN
ISIN No. of EquityShares INE669E01016
CIN L32100GJ1996PLC030976
12. Stock Price Data
The monthly high and low prices and volume of shares of the Company at the Bombay Stock Exchange Limited (BSE) andthe National Stock Exchange of India Limited (NSE) for the Financial Year 2016-17 are as under:
Month Bombay Stock Exchange Limited National Stock Exchange of India Limited
High Low Close Avg. Vol. High Low Close Avg. Vol.
(in `) (in `) (in `) (in Nos.) (in `) (in `) (in `) (in Nos.)
April, 2016 128.05 106.45 118.30 6,75,386 128.35 106.40 118.55 53,11,849
May, 2016 121.10 104.50 114.70 4,01,946 121.25 105.30 114.95 49,60,676
June, 2016 121.70 96.65 106.55 22,96,608 121.80 96.55 106.60 1,78,05,786
July, 2016 112.70 100.55 104.50 5,86,388 112.65 100.50 104.70 53,99,316
August, 2016 106.85 92.55 93.50 7,68,465 107.00 92.50 93.45 91,55,888
September, 2016 93.70 78.05 79.25 13,91,407 93.70 78.00 79.10 13,723,186
October, 2016 82.50 71.25 76.90 8,69,234 82.60 71.10 76.80 97,04,711
November, 2016 79.60 66.00 77.55 8,21,124 79.90 65.80 77.45 71,23,775
December, 2016 78.00 68.20 73.95 4,96,728 77.85 68.15 74.15 68,32,211
January, 2017 118.90 66.60 110.20 26,51,792 119.00 66.30 110.10 3,07,62,816
February, 2017 122.40 102.00 115.45 1,11,97,311 122.40 101.65 115.85 3,02,27,508
March, 2017 123.75 85.30 85.70 46,05,807 123.50 85.30 85.85 3,66,20,570
Source: BSE and NSE Website

C K
Annual Report 2016-17 81
Corporate Governance Report
13. Stock Performance
The performance of the Company’s share price vis-à-vis the broad based BSE and NSE indices during the Financial Year2016-17 is as under:
(a) Comparison of the Company’s share price with BSE Sensex
(b) Comparison of the Company’s share price with NSE Nifty
20,000
23,000
26,000
29,000
32,000
35,000
60
80
100
120
140
Ap
r 2016
May
2016
Jun
2016
Jul 2016
Au
g 2
016
Sep
2016
Oct 2016
No
v 2
016
Dec 2
016
Jan
2017
Feb
2017
Mar
2017
Idea Share Price BSE Sensex
6,000
7,000
8,000
9,000
10,000
11,000
60
80
100
120
140
Ap
r 2016
May
2016
Jun
2016
Jul 2016
Au
g 2
016
Sep
2016
Oct 2016
No
v 2
016
Dec 2
016
Jan
2017
Feb
2017
Mar
2017
Idea Share Price NSE Nifty

C K
82 Idea Cellular Limited
Corporate Governance Report
14. Share Transfer System
Transfer of shares in dematerialized form is done throughthe depositories without any involvement of theCompany. Transfer of shares in physical form is normallyprocessed within a period of 12 working days from thedate of the lodgement, subject to documents being validand complete in all respects. All transfers are firstprocessed by the Registrar and Share Transfer Agent andare submitted to the Company for approval thereafter.During the year under review, no request for physicaltransfer was received. Company also obtains half yearlycertificate from a Practicing Company Secretaryconfirming compliance with the share transfer formalitiesas required under Regulation 40(9) of the ListingRegulations and same is filed with the Stock Exchanges.
15. Distribution of Shareholding
The distribution of shareholding of the Company as onMarch 31, 2017 is as follows:
Number of Number % to total No. of % to
Equity Shares of Share- Share- Shares total
held holders holders held Share-
holding
Upto 5000 2,80,970 92.0996 3,53,16,843 0.9796
5000 – 10000 13,290 4.3563 1,05,65,455 0.2931
10001– 20000 5,478 1.7956 82,91,233 0.2300
20001 – 30000 1,648 0.5402 42,53,183 0.1180
30001 – 40000 717 0.2350 25,80,818 0.0716
40001 – 50000 641 0.2101 30,53,575 0.0847
50001 – 100000 932 0.3055 68,57,915 0.1902
100001 & above 1,396 0.4577 3,53,44,09,209 98.0328
Total 3,05,072 100.00 3,60,53,28,231 100.00
16. Shareholding Pattern
The shareholding pattern of the Company as on March31, 2017 is as follows:
Category No. of % Share-
Shares holding
Promoter and Promoter Group 1,52,88,47,547 42.41
Foreign Institutional Investors 97,23,47,141 26.97
Non-Resident Indians / OverseasCorporate Bodies 71,47,35,114 19.82
Mutual Funds, Financial Institutions,Banks, Insurance Companies, VentureCapital Funds and Alternate InvestmentFunds 246,285,060 6.83
Domestic Bodies Corporate 2,18,66,058 0.61
Resident Indians and Others 121,247,311 3.36
Total 360,53,28,231 100.00
17. Dematerialisation of Shares and Liquidity
The Shares of the Company are compulsorily tradable indematerialized form through both the Depository Systemsin India viz. National Securities Depository Limited(NSDL) and Central Depository Services (India) Limited(CDSL). A total number of 3,60,53,19,537 Equity Sharesof the Company constituting over 99.99% of the issued,subscribed and paid-up share capital were held indematerialised form as on March 31, 2017.
18. Outstanding GDRs/ADRs etc.
The Company has not issued any GDRs/ADRs/Warrantsand hence no amount is outstanding as at the year end.
19. Registrar and Share Transfer Agents
M/s. Bigshare Services Private LimitedE -2 & 3, Ansa Industrial Estate,Saki-Vihar Road,Sakinaka,Andheri (East),Mumbai – 400 072Tel: +91-22-2847 0652 / 4043 0200Fax: +91-22-2847 5207E-mail: [email protected]
20. Debenture Trustees
M/s IDBI Trusteeship Services LimitedAsian Building, Ground Floor,17, R. Kamani Building,Ballard Estate,Mumbai – 400 001Tel: +91-22-4080 7000Fax: +91-22-6631 1776
21. Investor Correspondence
In order to facilitate quick redressal of the grievances/queries, the Investors and Shareholders may contact theCompany Secretary at the under mentioned new corporateoffice address for any assistance:
Mr. Pankaj KapdeoCompany SecretaryIdea Cellular LimitedBirla Centurion, 10th FloorCentury Mills Compound,Pandurang Budhkar Marg,Worli,Mumbai – 400 030Tel: +91-9594003434Fax: +91-22-26527080E-mail: [email protected]

C K
Annual Report 2016-17 83
Corporate Governance Report
Declaration
As provided under the Securities and Exchange Board of India (Listing Obligation and Disclosure Requirements) Regulations,
2015, the Board of Directors and the Senior Management Personnel of Idea Cellular Limited have confirmed compliance with
the Code of Conduct for the year ended March 31, 2017.
Place : Mumbai Himanshu Kapania
Date : May 13, 2017 Managing Director
CEO/CFO Certification
To,
The Board of Directors
Idea Cellular Limited
Mumbai
We, Himanshu Kapania, Managing Director and Akshaya Moondra, Whole Time Director and Chief Financial Officer, of IdeaCellular Limited (‘the Company’), to the best of our knowledge and belief, hereby certify that:
a) We have reviewed the financial statements and cash flow statements of the Company for the year ended March 31, 2017and:
i) these statements do not contain any materially untrue statement or omit any material fact or contain statements thatmight be misleading;
ii) these statements together present a true and fair view of the Company’s affairs and are in compliance with existingAccounting Standards, applicable laws and regulations.
b) There are no transactions entered into by the Company during the year ended March 31, 2017, which are fraudulent, illegalor violative of the Company’s code of conduct.
c) We accept responsibility for establishing and maintaining internal controls for financial reporting and we have evaluatedthe effectiveness of internal control systems of the Company pertaining to financial reporting. We have disclosed to theAuditors and the Audit Committee, deficiencies in the design and operations of such internal controls, if any, of which weare aware and steps that have been taken to rectify these deficiencies.
d) We have indicated to the Auditors and the Audit Committee, wherever applicable:
i) Significant changes in the internal control over financial reporting during the year;
ii) Significant changes in the accounting policies during the year and that the same has been disclosed in the notes to thefinancial statements; and
iii) Instances of significant fraud of which we have become aware and the involvement therein, if any, of the managementor any employee having a significant role in the Company’s internal control system over financial reporting.
Place : Mumbai Himanshu Kapania Akshaya MoondraDate : May 13, 2017 Managing Director Whole Time Director & Chief Financial Officer

C K
84 Idea Cellular Limited
Corporate Governance Report
Independent Auditor’s Certificate on Corporate Governance
To the Members of
Idea Cellular Limited
1. This certificate is issued in accordance with the terms of our engagement letter dated November 22, 2016.
2. We, Deloitte Haskins & Sells LLP, Chartered Accountants, the Statutory Auditors of IDEA Cellular Limited (“theCompany”), have examined the compliance of conditions of Corporate Governance by the Company, for the year endedon 31 March 2017, as stipulated in regulations 17 to 27 and clauses (b) to (i) of regulation 46(2) and para C and D ofSchedule V of the SEBI (Listing Obligations and Disclosure Requirements) Regulations, 2015 (the Listing Regulations).
Managements’ Responsibility
3. The compliance of conditions of Corporate Governance is the responsibility of the Management. This responsibility includesthe design, implementation and maintenance of internal control and procedures to ensure the compliance with the conditionsof the Corporate Governance stipulated in Listing Regulations.
Auditor’s Responsibility
4. Our responsibility is limited to examining the procedures and implementation thereof, adopted by the Company for ensuringcompliance with the conditions of the Corporate Governance. It is neither an audit nor an expression of opinion on thefinancial statements of the Company.
5. We have examined the books of account and other relevant records and documents maintained by the Company for thepurposes of providing reasonable assurance on the compliance with Corporate Governance requirements by the Company.
6. We have carried out an examination of the relevant records of the Company in accordance with the Guidance Note onCertification of Corporate Governance issued by the Institute of the Chartered Accountants of India (the ICAI), the Standardson Auditing specified under Section 143(10) of the Companies Act 2013, in so far as applicable for the purpose of thiscertificate and as per the Guidance Note on Reports or Certificates for Special Purposes issued by the ICAI which requiresthat we comply with the ethical requirements of the Code of Ethics issued by the ICAI.
7. We have complied with the relevant applicable requirements of the Standard on Quality Control (SQC) 1, Quality Controlfor Firms that Perform Audits and Reviews of Historical Financial Information, and Other Assurance and Related ServicesEngagements.
Opinion
8. Based on our examination of the relevant records and according to the information and explanations provided to us and
the representations provided by the Management, we certify that the Company has complied with the conditions ofCorporate Governance as stipulated in regulations 17 to 27 and clauses (b) to (i) of regulation 46(2) and para C and D ofSchedule V of the Listing Regulations during the year ended March 31, 2017.
9. We state that such compliance is neither an assurance as to the future viability of the Company nor the efficiency oreffectiveness with which the Management has conducted the affairs of the Company.
For Deloitte Haskins & Sells LLP
Chartered AccountantsFirm‘s Registration No. 117366W / W-100018
Hemant M. Joshi
PartnerMembership No. 38019
Place : MumbaiDate : May 13, 2017

C K
Annual Report 2016-17 85
Business Responsibility Report
Business Responsibility Report
Section A: General Information about the Company
Sr. No. Description Information
1 Corporate Identity Number L32100GJ1996PLC030976
2 Name of the Company Idea Cellular Limited
3 Registered address Suman Tower, Plot No. 18, Sector 11,Gandhinagar - 382 011, Gujarat
4 Website www.ideacellular.com
5 Email Id [email protected]
6 Financial year reported 2016 -17
7 Sector(s) that the Company is engaged in Telecommunications services(industrial activity code-wise) Group: 9984
Class: 99841Sub-class: 998413
8 List three key products/services that the Idea Cellular Limited is one of the leading nationalCompany manufactures/provides telecommunications services providers in India.(as in balance sheet) The Company is engaged in the business of mobility
and long distance services.
9 Total number of locations where businessactivity is undertaken by the Company
i. Number of International Locations None(provide details of major 5)
ii. Number of National Locations Company has its business activities and operations spreadacross the country
10 Markets served by the Company – The Company serves the Indian marketsLocal/State/National/International
Section B: Financial Details of the Company
Sr. No. Description Information
1 Paid up capital (INR) The paid-up equity capital of the Company as on March 31, 2017is ` 36,053,282,310/- comprising of 3,605,328,231 Equity Sharesof ` 10/- each.
2 Total turnover (INR) ` 354,757 Mn
3 Total profit / (Loss) after taxes (INR) ` (8,311) Mn
4 Total spending on corporate social responsibility For the year 2016-17, Idea’s CSR spent was around INR 369.66(CSR) as percentage of profit after tax (%) Mn (INR 349.82 Mn for FY 2016-17 year projects and INR 18.37
Mn for FY 2015-16 carried over projects and INR 0.91Mn forCSR Audit)
In addition, the Company mobilized resources from The Ministryof New & Renewable Energy (MNRE) and State Governmentfor Midday Meals and Ministry of Health and Family Welfarefor Polio Programme.
About this Report
The SEBI (Listing Obligations and Disclosure Requirements) Regulations, 2015, mandates the top 100 listed entities based on marketcapitalization on the BSE and NSE, to include Business Responsibility Report as part of the Annual Report describing the initiativestaken by the Companies from Environmental, Social and Governance perspectives.
This Business Responsibility Report, is as per Regulations 34 of the SEBI (Listing Obligations and Disclosure Requirements) Regulations,2015, which provides general information about the Company and its business responsibility as required by SEBI.
The following five sections cover disclosures as per the SEBI suggested BRR framework.

C K
86 Idea Cellular Limited
Business Responsibility Report
5 List of activities in which expenditure in The projects implemented during FY 2016-17 are:4 above has been incurred 1. Solar Urja Lamp Project for school children with IIT Bombay.
2. Mid-Day Meal Project for Govt School Children withAkshaya Patra Foundation.
3. Polio Non-Recurrence Project with Rotary Foundation India.
4. Provide Health Care Support to Deaf-Mute Children throughCochlear Implant direct implementation.
5. Providing Drinking Water in Drought Affected MarathwadaRegion Direct implementation.
6. Restoring Vision/Eyesight with Vision Foundation of India.
7. Roshini: Digital & Economic Empowerment of Women directimplementation.
8. Village Social Entrepreneurs in Healthcare with Public HealthTechnologies Trust (PHTT).
9. KHEL: Knowledge Hub for E-Learning with IIT Bombay andIIT Kanpur.
10. MPOWER with Aditya Birla Education Trust.
11. School-based Educational Intervention Program forReduction of Future Risks of Cardio Vascular Diseases withMission Arogya Health and Information Technology.
12. Setting up Vocational Education & Training Centre withG D Birla Foundation.
During the year 2016-17 the company’s CSR initiatives madeimpact on the lives of around 10 lakh people (1.5 lakh studentsthrough educational support programmes; 8 lakh childrenthrough health support programmes (excluding Polio non-reoccurrence under which 17 crore children are covered in eachround) , 2100 through skill development and 11415 households(57075 individual) through drinking water distribution projects.
Section C: Other Details
Sr. No. Description Information
Sr. No. Description Information
Yes. The Company has 5 Subsidiaries, the details of which havebeen provided in the Director’s Report.
The Company engages and positively encourages its subsidiarycompanies to participate in its Business Responsibility initiatives.Its “Aditya Birla Policy on Code of Conduct & Redressal Policy”guides all its subsidiaries and makes sure that they adhere to thehighest levels of ethical and transparent business practices. Yes,three of the subsidiaries participate in BR activities.
The Company while onboarding its suppliers/ distributorsensure they are aligned and comply with business responsibility(BR) expectations of Idea. Further, they are encouraged to followthe concept of being a responsible business.Currently, more than60% of existing and 100% of all new entities participate in theCompany’s BR initiatives. Idea strives to encourage more andmore entities to participate in future.
1 Does the Company have any Subsidiary Company/Companies?
2 Do the Subsidiary Company/Companies participatein the BR initiatives of the parent company? If yes,then indicate the number of such subsidiarycompany(s)
3 Do any other entity/entities (e.g. suppliers,distributors etc.) that the Company does business withparticipate in the BR initiatives of the Company? Ifyes, then indicate the percentage of such entity/entities? [Less than 30%, 30-60%, More than 60%]

C K
Annual Report 2016-17 87
Business Responsibility Report
Section D: BR Information
1. Details of Director/Directors responsible for BR
a) Details of the Director/Director responsible for implementation of the BR policy/policies
DIN Number 03387441
Name Mr. Himanshu Kapania
Designation Managing Director
b) Details of BR head
Sr. No. Description Information
1 DIN Number (if applicable) Not Applicable
2 Name Mr. Pankaj Kapdeo
3 Designation Company Secretary
4 Telephone number 9594003434
5 Email-id [email protected]
The National Voluntary Guidelines on Social, Environmental and Economic Responsibilities of Business (NVGs) released by theMinistry of Corporate Affairs has adopted nine areas of Business Responsibility, as listed below:
P1 — Businesses should conduct and govern themselves with Ethics, Transparency and Accountability.
P2 — Businesses should provide goods and services that are safe and contribute to sustainability throughout their life cycle.
P3 — Businesses should promote the well-being of all employees.
P4 — Businesses should respect the interests of and be responsive towards all stakeholders, especially those who aredisadvantaged, vulnerable and marginalized.
P5 — Businesses should respect and promote human rights.
P6 — Businesses should respect, protect and make efforts to restore the environment.
P7 — Businesses, when engaged in influencing public and regulatory policy, should do so in a responsible manner.
P8 — Businesses should support inclusive growth and equitable development.
P9 — Businesses should engage with and provide value to their customers and consumers in a responsible manner.
Sr. No. Questions
P1 P2 P3 P4 P5 P6 P7 P8 P9
1 Do you have policy/policies for Y1 Y2 Y3 4 Y3 Y5 Y2 - Y6 Y3
2 Has the policy being formulated inconsultation with the relevant stakeholders? Y Y Y Y Y Y - Y Y
3 Does the policy conform to any national / Yes, the policies conform to aspects of the nine principles of theinternational standards? If yes, specify? National Voluntary Guidelines for Business Responsibilities (NVGs)(50 words)
4 Has the policy being approved by the Board?Is yes, has it been signed by MD/ Owner/ Y Y Y Y Y Y - Y YCEO/ appropriate Board Director?
5 Does the company have a specified committee Executive Committee comprising of the Managing Director andof the Board / Director / Official to oversee the other CXOs - Deliberate and drive sustainability governance of theimplementation of the policy? company; ensure efficient adoption of new sustainability processes and
accelerate its progress.
Bu
sin
ess
Eth
ics
Pro
du
ct L
ife
Res
po
nsi
bil
ity
Em
plo
yee
Wel
l-b
ein
g
Sta
keh
old
erE
ng
ag
em
en
t
Hu
man
Rig
hts
En
vir
on
men
t
Po
licy
Ad
vo
cacy
Incl
usi
ve
Gro
wth
Cu
sto
me
rV
alu
e
2. Principle-wise (as per NVGs) BR policy/policies (Reply in Y/N)

C K
88 Idea Cellular Limited
Business Responsibility Report
Chief Technical Officer (CTO) is the designate Chief SustainabilityOfficer (CSO) who represents Idea Cellular at the Aditya BirlaGroup Apex Sustainability Committee, which reports to theChairman through the Business Review Council (BRC) QuarterlyReviews.
6 Indicate the link for the policy to beviewed online? # - - - - - - - -
7 Has the policy been formally communicated to Yes, the policies have been communicated to all relevantall relevant internal and external stakeholders? stakeholders of Idea. Idea’s communication with internal and
external stakeholders on such matters is a continuous process.
8 Does the company have in-house structure to There are defined management structures in place to overseeimplement the policy/policies? effective implementation of all policies.
l Executive Committee (EC) chaired by MD comprising of all CXOsleading from the front
l Chief Technical Officer (CTO) is the designate Chief SustainabilityOfficer (CSO) with Senior VP (Networks) is the SustainabilityChampion. They represent the company in the Group level ApexSustainability Committee.
l Sustainability Officer/ Subject Matter Expert (SME) drives allcompanywide initiatives with HoD level SPOCs nominated fromall Functions. This structure sets the sustainability framework inmotion and implements the agreed policy and strategy across thecompany.
l Thematic Cross Functional Teams (CFT) in place to measure andmanage sustainability focus areas across the company.
9 Does the Company have a grievance redressalmechanism related to the policy/policies to Y - Y - Y - - - -address stakeholders’ grievances related to thepolicy/policies?
10 Has the company carried out independentaudit/evaluation of the working of this policyby an internal or external agency?
Idea has a robust internal review mechanism for its key policies. TheCompany is working hard to develop and improve its managementsystems and performance by making sure that they conform to AdityaBirla Group’s Sustainability Framework of Policies, Technical Standardsand Guidance Notes by giving employees the chance to train, learn,understand and apply improvement techniques to reach higherstandards of performance.
Sustainability Dashboard created and reviewed quarterly with Grouplevel Central Sustainability Cell Office & Reporting to Business ReviewCouncil continuing from Q3 FY14.
The Company recently developed its first dedicated SustainabilityReport (FY 2015-16) aligned to GRI G4 international guidelinesand has put it in public domain. For details please refer tohttp://www.ideacellular.com/aboutus/sustainability
1 Code of Conduct: #http:www.ideacellular.com/wps/wcm/connect/home/idea/investor_relation/code+of+conduct.2 Safety Health and Environment Policy*3 Policy on Mission, Vision, Values4 Policy on prevention of Sexual Harassment5 Human Rights Policy*6 Corporate Social Responsibility Policy*
* Safety, Health and Environment Policy, Human Rights Policy and Corporate Social Responsibility Policy were formally adopted in April2013.

C K
Annual Report 2016-17 89
Business Responsibility Report
2a. If answer to S.No. Against any Principle is ‘No’, please explain why?
Sr. No. Principle Response
1 Principle 7 – Businesses, when engaged in influencingpublic and regulatory policy, should do so in aresponsible manner
The Company plays a key role in advocating issues of thetelecom sector. The senior management of the Company activelyparticipates in various industry forums and is involved withvarious stakeholders for discussions regarding formulating newpolicies, reviewing and modifying relevant policies (describedlater in the report). The Company currently does not have astated policy on policy advocacy, however, it continues tomonitor and follow the business and regulatory environment.
Section E: Principle-wise Performance
Principle 1: Businesses should conduct and govern themselveswith Ethics, Transparency and Accountability
The Vision, Mission and Values adopted by the Aditya BirlaGroup (ABG) governs and guides all business activities andstakeholder interactions at Idea Cellular.
As a company with an all India presence and operating in diversemarkets and cultures, the five core values that bind all employeesof Idea are – Integrity, Commitment, Passion, Seamlessness andSpeed. The employees of the Company and its subsidiaries areguided by the senior management along these values.
Idea is committed to taking fair and honest decisions followingthe highest standards of professionalism and business ethics.Integrity is the basis for all its dealings and interactions with itscustomers, employees, suppliers, partners, shareholders,communities and the government. Idea has a sound consequencemanagement process in place to maintain checks and balanceson these very values and policies.
Along with the core values, all Board Members and seniormanagement personnel affirm their compliance to the Code ofConduct (Code) it has adopted with the provisions of SEBI(Listing Obligation and Disclosure Requirement), 2015. The Codeis derived from three inter-linked fundamental principles of goodcorporate governance, good corporate citizenship and exemplarypersonal conduct.
The Company also has in place a Code which requires allemployees to transact with each other in a fair and dignifiedmanner and respect diversity. Integrity in personal conduct,conduct at work, conflict of interest and interface with the externalworld are all covered under the code.
From its vendors, Idea demands ethical business conduct. Aspart of its Health Safety and Environment Policy, vendors mustnot engage in unethical practices such as bribery, corruption orother malpractices to gain competitive advantage.
Idea Cellular is sensitive about transparent and timelycommunication in order to yield positive results and takefaster decisions thereby enhancing the credibility of themanagement.
SEBI – BRR Questionnaire Responses for Principle 1:
1. Does the policy relating to ethics, bribery and corruptioncover only the Company? Yes/No.
Ans: No
2. Does it extend to group/joint ventures/suppliers/contractors/NGOs/ Others
Ans: Based on the Aditya Birla Group Code, which addressesthe aspects of ethics, bribery and corruption, Idea Cellularhas adopted its own Code. The five core values Integrity,Commitment, Passion, Seamlessness and Speed – have beenadopted across the Aditya Birla Group including theemployees of Idea and its subsidiaries. In addition, theCompany’s vendor/supplier contracts include clauses onethical behavior, bribery and corruption.
3. How many stakeholder complaints have been received inthe past financial year and what percentage wassatisfactorily resolved by the management? If so, providedetails thereof, in about 50 words or so.
Ans: There are no outstanding complaints for FY 2016-17.
Principle 2: Businesses should provide goods and services thatare safe and contribute to sustainability throughout their lifecycle
Idea Cellular is committed to optimal efficiency in supply chainwhile focusing on the 3R’s- “Reduce, Reuse and Recycle” toensure that it is constantly working towards the greater cause ofenvironmental stability. The increase in E- waste generation is amatter of grave concern and Idea has developed a guidelineadhering to the guidelines of Department of Telecommunication(DoT), Government of India (GoI). The Company understandsthe impact of business operations and recognize its responsibilitytowards bringing green initiatives into practice. In its constantendeavor towards sustainability, major initiatives have beenreported with a focus on safeguarding the environment andmaking its supply chain robust.
Compliance on EMF radiation related regulation is anotherbusiness priority at Idea. The Company has made significantfinancial investment in the purchase of EMF monitoringequipment and is compliant with existing instructions/ ordersof the Department of Telecommunications (DoT). The Companyis proactively engaged in public education initiatives led by theCellular Operators Association of India (COAI) on the subject ofEMF. Idea continues to strengthen its internal systems andprocesses to be EMF compliant. Resources for meeting compliancehave been appointed in all the Circles. Idea has a dedicated teamof senior officials who engage with external and internalstakeholders for awareness and education on EMF. As specifiedby DoT, the Company has been working with COAI on the EMFportal.

C K
90 Idea Cellular Limited
Business Responsibility Report
SEBI – BRR Questionnaire Responses for Principle 2:
1. List up to 3 of your products or services whose design hasincorporated social or environmental concerns, risks and/or opportunities.
Ans: Following are examples of the Company’s product / servicefeatures that incorporate the aspect of environmentalconservation:
l Activation of SIMs by biometric device (E- KYC) -More than 70% activations are based on use of Aadharcard and E- KYC platform (Know Your Customer,biometric device). This has reduced use of paper tothe tune of 25 billion no. in FY 16-17, which isequivalent to saving 3000 trees.
l Reuse of foam banners - Idea product plans areprinted on Foam Banners and which are placed inmarket for promotions. In Punjab circle, over 15000such foam banners were reprinted and reused forpromotion, reducing waste generation andcommercial viability also.
l Replacement of CFL bulbs with LED - Due to lowerenergy consumption and elimination of risk of toxicsubstances and UV radiation, CFL bulbs werereplaced in 3 circles by LED lights. This not onlyresulted in higher illumination but we also reducedenergy consumption to the tune of 40.5 KW.
l E-billing over printed bills - The abatement of cuttingtrees by substituting printed bills with e-bills has savedtrees to the tune of up to 1670 trees, while taking astep towards reducing deforestation.
l Starter kits/ SIM jackets size change - We haveminimized the size of the starter kits/SIM jackets,thereby significantly reducing use of paper. Thecitizen’s charter is also printed on the inside of theenvelope rather than inserting a separate sheet ofpaper.
Apart from the mentioned new initiatives, we haveencouraged use of recycled paper, bio-degradablepacking of Recharge Vouchers, alternate energy(renewable) implementation in MSC’s, eco-friendlypre-paid SUK (Start-up kit) jacket and more.
2. For each such product, provide the following details inrespect of resource use (energy, water, raw material etc.)per unit of product (optional). (i) Reduction duringsourcing / production / distribution achieved since previousyear throughout the value chain; (ii) Reduction duringusage by consumers (energy, water) has been achieved sincethe previous year:
Ans:
l The activation of SIMs by biometric device (E-KYC)reduced the use of paper to the tune of 25 billion no.in FY 2016-17 which is equivalent to saving 3,000 trees.
l Replacing CFL bulbs with LED has reduced theenergy consumption by 40.5 KW, this is equivalentto abatement of 0.4 mn liters of water and 3 MT Co2emission.
l The abatement of cutting trees by substituting printedbills with e-bills has saved trees to the tune of up to1670 trees, while taking a step towards reducingdeforestation
3. Does the company have procedures in place for sustainablesourcing (including transportation)? If yes, whatpercentage of your inputs was sourced sustainably? Also,provide details thereof, in about 50 words or so.
Ans: The Company has already adopted several environmentallyconscious transportation practices, including routeoptimization, vehicle optimization and co- loading ofshipment. Further, the Company has been seeking vendorcommitments to good sustainability practices beforeregistering them on board. In this regard, the Companyhas revised the Code of Conduct (CoC) for Idea Suppliersto address sustainable sourcing covering wastemanagement, health and safety, child labor andenvironment. A copy of the same is also available on theIdea Supplier Portal.
4. Has the company taken any steps to procure goods andservices from local and small producers, includingcommunities surrounding their place of work? If yes, whatsteps have been taken to improve their capacity andcapability of local and small vendors?
Ans: Idea is always been committed to provide skill developmentand employment to local businesses in rural areas throughcommissioning of call centers in non-metro towns andrecruitment of rural youth for local sales operations.A major portion of the procured goods and services arede-centralized to local offices in all states.
5. Does the company have a mechanism to recycleproducts and waste? If yes, what is the percentage ofrecycling of products and waste (separately as <5%, 5-10%,>10%). Also, provide details thereof, in about 50 wordsor so.
Ans: Recycling and environmentally safe disposal of waste is anon-negotiable and intrinsic aspect of Idea’s environmentalcommitment. In this regard, as per the Company’s policyon scrap and waste, it is ensured that waste generated ischannelized to authorized collection centers or registereddismantler(s) or recycler(s) or is returned to the pick up ortake back services provided by the producers (originalmanufacturers). Also with constant upgrades in technologythe newer products replace old ones which instead of beingscrapped are relocated and reused in rural areas. TheCompany therefore extends the useful life of all equipmentand minimize scrap.
Principle 3: Businesses should promote the wellbeing of allemployees
The importance of welfare and the interest of its human resourcesform the very basis of the Company. This is evident in theChairman’s belief: “Without ‘people power’ even the best ofoperational and strategic thinking will come to naught”-Chairman, Idea.
C K
Annual Report 2016-17 91
Business Responsibility Report
In order to ensure employee well-being and development, theCompany has adopted the following specific policies:
1. Whistleblower Policy
2. Human Rights Policy
3. Policy to Prevent Sexual Harassment at the Workplace
4. Training Policy
5. Continuing Education Policy
6. Grievance Redressal mechanism
7. Employee Recognition Policy
8. Pre-Employment & Executive Health Check Up Policy etc.
The Company has also participated in events like the Stepathlon-Walk for Fitness which has resulted in continued awareness andaction on fitness and health regime. In the first year of the event,all HODs and above population participated. The second yearsaw participation from female employees and non HODemployees aged above 50 years.
Idea with its strong focus on human resources developmentenjoys high levels of employee satisfaction and retention. It hasconsistently maintained a high level of employee motivation andsustained growth in an extremely challenging businessenvironment. Employee engagement and internal communicationscores at Idea have improved steadily over the years. The rate ofparticipation of employees in various surveys as well as thesatisfaction levels have also improved significantly.
Idea recognizes that a safe workplace and safety consciouspersonnel is the core of sustainable development. The Companyis committed to continually improve its safety practices,performance and to protect employees including contractoremployees, business partners, service providers, visitors andsociety at large from any harm. Three pronged approach havebeen formulated for improving Occupational Health & Safety(OH&S) performance. They are:
1. Organization Safety Culture;
2. Systems & Processes;
3. Equipment’s and Facilities.
OH&S Strategy have been supported by an implementation roadmap to include initiatives in each of the above three elements.Initiatives have been scheduled in a way so that equal emphasisis given to all the above three elements.
Several internal and external engagement programs have beenorganized covering own and contractor employees pan India toensure awareness and involvement of employees on health andsafety.
Regular internal and external training programs are held atvarious Circle and zonal locations on specific safety subjects foremployees managing Warehouses, Tower sites, Offices, etc.Competency based trainings were organized to enhancepersonnel capabilities for working at heights particularly oncellular towers.
Safety communications through frequent E-mailers being sent toall the employees to create awareness on Health & Safety.Campaigns organized on Road Safety Week, “Zero Harm” &“Life Saving Rules” and celebrated at all locations to raiseemployee awareness on these subjects. Ground rules made onroad safety and enforced for the use of crash helmets by all two
wheeler riders. ABG OH&S Vision of “Zero Harm”communicated during Safety Week campaign 2016. Mandatory10 Life Saving Rules were communicated to all employees forstrict adherence and compliance. Safety competition organizedduring Q3 FY17 for Warehouse Community to capture bestpractices on OH&S for horizontal implementation across Circles.
A process of reviewing the OH&S Competencies of prospectvendors/suppliers established. Generic OH&S clauses framedfor inclusion in the service contracts as a part of Contractor SafetyManagement. Safety clauses included in New Built Guidelinesfor acquisition of new tower sites.
3rd party Safety audits are conducted to cover all Warehousesacross all Circles. OH&S inspections are being conducted atWarehouses, Offices & Facilities including MSC locations. Designfor Safety aspects have been considered for modification in newtower designs to include state of the art fall protection systemsto prevent falls and other features included for safe materialhandling on the towers.
Emergency Organization including Emergency Response Teams(ERT) have been constituted at all Circle Offices to addresspotential emergency situations. Fire and Evacuation drills areconducted across all Circle locations on a half yearly basisinvolving all employees.
Idea has implemented ABG Code Red Programme as part of theAditya Birla Group (ABG). A week long national campaign onABG Code Red was organized at Idea during Q3 FY17 to spreadawareness on emergency services to Idea employees. Theprogramme has a tie-up with:
- International SOS: It provides integrated medical, clinicaland security services to organizations with internationaloperations. Services include planning and preventativeprograms, in-country expertise, and emergency response.
- Apollo Hospitals - Emergency Medical Services
- The Company has Code Red volunteers across the Group
The Company’s policies and practices are based on Respect foremployee rights and genuine needs, which include non-discrimination, work-life balance, safety and dignity. Allapplicable legal requirements are followed in this regard. Ideacontinuously works on monetary and non-monetary ways torecognize employees’ achievements.
To make its employees more effective in their current and futureroles, Idea has adopted the Aditya Birla Group’s ContinuingEducation Policy encouraging mid-career education andprofessional development.
Idea has instituted various initiatives in order to develop andbuild an environment that facilitates employee development,encourages open and transparent communication. Some suchinitiatives are outlined below:
l Aspire - Framework of internal development centers forhigh potential and high performing employees
l Evolve - ‘Competency based grid’ training framework todevelop people through different interventions oncompetencies
l i-Mitra - Employee query / request management tool
l Pragya initiative - Building a culture of inclusion based ongender diversity
C K
92 Idea Cellular Limited
Business Responsibility Report
Further, Idea actively engages with its employees through variousforums like ‘Samvaad’, ‘MD’s chat’, ‘Team Meets/Town Halls’and ‘Idea Connect’.
In an effort to enhance employee satisfaction, the Company hasdeveloped a formal process (‘VOICE’) which provides theemployees across the organization a platform to voice anyunresolved workplace concerns and seek resolution in a fair andtransparent manner. Under this initiative, Employee SatisfactionChampions and Employee Satisfaction Teams have beenentrusted with the task of addressing employee concerns as pera defined process.
SEBI – BRR Questionnaire Responses for Principle 3:
1. Please indicate the total number of employees:
Ans: The Company has 11,735 regular employees as on March31, 2017
2. Please indicate the total number of employees hired ontemporary/contractual/casual basis:
Ans: The Company has 7,372 employees on temporary/contractual/casual basis as on March 31, 2017
3. Please indicate the number of permanent womenemployees:
Ans: Idea has 1,188 permanent women employees as on March31, 2017
4. Please indicate the number of permanent employees withdisabilities
Ans: One permanent employee with disability in Maharashtra& Goa Circle.
5. Do you have an employee association that is recognizedby management?
Ans: The Company has no employee association.
6. What percentage of your permanent employees is membersof this recognized employee association?
Ans: The Company has no employee association.
7. Please indicate the Number of complaints relating to childlabour, forced labour, involuntary labour, sexualharassment in the last financial year and pending, as onthe end of the financial year.
Ans: There have been no cases reported, relating to child labour,forced labour, involuntary labour. However five case ofsexual harassment has been reported and appropriateaction have been taken in the last financial year.
8. What percentage of your under mentioned employees weregiven safety and skill up-gradation training in the lastyear? - Permanent Employees, Permanent WomenEmployees, Casual/Temporary/Contractual Employees,Employees with Disabilities
Ans:
- Total training man days for the company inFY 2016-17 = 65,211
- Average training man-days per employee = 6.0 forFY 2016-17
- Total training man-days given to sales team inFY 2016-17 = 3, 22, 863
- Safety drills and evacuation are conducted across alloffices on an annual basis.
Principle 4: Businesses should respect the interests of and beresponsive towards all stakeholders, especially those who aredisadvantaged, vulnerable and marginalized.
Idea formally engages with its stakeholders to identify and worktowards meeting their expectations. The company recognizes thecritical role played by internal (employees) and external(adjudicators, courts, licensors, industry associations, regulators,network operators and subscribers) stakeholders in itssustainability agenda and strives to align its social, environmentand economic performance with stakeholder needs andexpectations.
Idea’s inclusive growth plan encourages its partners to employdifferently abled people at its call centers. Currently Idea employs211 differently abled people at its call centers. Idea is also an equalopportunities employer.
Idea is focused on expanding its services in rural areas andpromotes schemes such as minimum top up of INR 10 in orderto provide affordable access to communication to theeconomically disadvantaged population.
Idea has set up its rural distribution network to cater to customersfar away from the urban centers with its vast variety of services.As of March 31, 2017 the company’s total service center presenceis in 8,913 population centers of which 6,474 are in rural areas.Products with starting prices as low as INR 4 or 5 ensure thateveryone can experience these products while ensuring valuefor their money.
In order to cater to remote communities, Idea organizes campsin rural areas where customers are unable to easily access itsservice centers. The Company has also set up call centers in Tier2 and Tier 3 cities employing 15,389 call centre agents in thesetowns so as to reach out to the rural customers. Idea also providesInteractive Voice Response (IVR) in 17 regional languages so thatcustomers are able to understand and avail of various services.Other than the usual applications, Idea has launched severalmobile applications aimed at improving information access andquality of life for non-urban communities across the country,which are often economically disadvantaged. These initiativespertain to education and learning, agricultural information, healthand safety, government schemes and employment generation.Details of such initiatives are provided under Principle 8 of thisBRR.
SEBI – BRR Questionnaire Responses for Principle 4:
1. Has the company mapped its internal and externalstakeholders?
Ans: Yes, Idea Cellular has mapped its key internal and externalstakeholders, which include employees, adjudicators,courts, licensors, industry associations, regulators, networkoperators and subscribers.
2. Out of the above, has the company identified thedisadvantaged, vulnerable and marginalized stakeholders?
C K
Annual Report 2016-17 93
Business Responsibility Report
Ans: In fact, Idea is a pan-India integrated GSM operator offering2G, 3G and 4G services and has achieved deep ruralpenetration. Idea has succeeded in reaching out to 74% ofthe village population in India corresponding to 60% ofvillages in India. Under the project “Idea Care”, thecompany is running over 8,913 Company Stores, My IdeaService centres, Idea Points and Idea Service Points. Thesevariant service centers models are spread over approx.6,474 rural population centers, catering to the sales andservice requirements of the Idea rural and peri-urbansubscribers.
3. Are there any special initiatives taken by the company toengage with the disadvantaged, vulnerable andmarginalized stakeholders? If so, provide details thereof,in about 50 words or so.
Ans: Idea Cellular recognizes its responsibility for the rural,geographically remote and the economically challengedpopulation of the country and has generated localemployment and deployed various rural-focused mobilesolutions. The Company’s efforts towards job creation forwomen and rural youth are described above, while itsunique mobile-based applications for health, education andfinancial inclusion are described under Principle 8.
Principle 5: Businesses should respect and promote humanrights:
Idea sincerely supports a culture of respect and promotes humanrights. The Company is of the firm belief that every employeeshould be able to live with social and economic dignity and withfreedom, irrespective of his nationality, gender or religion. TheCompany complies with all applicable local, state and nationallaws regarding human rights and worker’s rights where ever itdoes business.
Reinforcing its dedication to human rights issues, Idea hasadopted a Human Rights Policy that outlines the Company’scommitment to developing a culture of respect and support forhuman rights - including diversity in workplace, provision ofsecure environment for all personnel, proactive communicationsand contribution to socio-economic development of communitieswhere the Company operates.
As covered under the Human Rights Policy, the key suppliers ofthe Company are encouraged to uphold and create awarenessabout human rights in their operations and communities. TheCompany’s key vendor contracts mandate including clausesagainst use of forced and child labour, worker safety and hygieneand the absence of abuse and intimidation etc.
SEBI – BRR Questionnaire Responses for Principle 5:
1. Does the policy of the company on human rights cover onlythe company or extend to the Group/ Joint Ventures/Suppliers/ Contractors/ NGOs/ Others?
Ans: The Company’s Human Rights Policy is applicable to allemployees of Idea and its subsidiaries and suppliers.
2. How many stakeholder complaints have been received inthe past financial year and what percent was satisfactorilyresolved by the management?
Ans: No complaints related to human rights were received inthe past financial year.
Principle 6: Business should respect, protect and make effortsto restore the environment
As the global telecom industry grows increasingly cognizant ofthe fact that it needs to lighten its carbon footprint, Idea is one ofthe leaders in the search for green energy options in India.Efficient power management, infrastructure sharing, use of eco-friendly renewable energy sources, leveraging the latesttechnology to reach out to a large audience in the most energyefficient manner such as video and teleconferencing, smartlogistics, etc. are some of the best practices in Idea’s networkinfrastructure and day-to-day business operations. The primaryfocus of the energy conservation drive has been on reducingenergy cost and minimizing environmental impact of thecompany’s operations. The Company is constantly asking itsvendors to focus on highest energy efficient category equipment.Based on this principle, 100% of all new telecom hardwareprocurement in FY 2016-17 comprise of low power consumingtelecom hardware. At the same time, modernizing large chunkof old equipment into new and most energy efficient telecomhardware continues to be a key focus.
In FY 2016-17, Idea continued to adopt environmentallysustainable practices in their transactions with the samefoundational objectives laid down as part of Green Idea Projectlaunched in 2013:
1. Reduce Carbon Emissions at the existing & new TelecomSites of Idea
2. Adopt better battery hybrid solutions to reduceconsumption
3. Continue with the procurement of most energy efficientTelecom Hardware
4. Encourage Infrastructure Provider partners to adopt lowcarbon operations
The track record of FY 2016-17 stands as below:
l Presently, 19% of Idea Owned telecom towers areoperational with hybrid solutions resulting emissionreduction by 36,373 tonnes.
l Over 67% of Idea’s BTS portfolio - Outdoor BTS (25%reduction in Energy consumption compared to Indoor BTS)
l 5,458 indoor sites were converted to outdoor sites in FY2016-17 resulting in reducing CO2 emissions of about 31,000tonnes in addition to 10,497 sites converted till FY 2015-16reducing cumulative carbon emissions by 61,000 tons.
l The tenancy ratio of Idea is about 2.8, which is highest inthe country that further reduces the size of its carbonfootprint.
l 100% of the telecom hardware procurement comprise oflow power consuming telecom hardware.
l Energy optimization based on the usage of deep dischargebattery solutions such as lithium ion batteries and flowbatteries are being evaluated and inducted for siteoperations.
l RET based generation through PPAs, against Idea’sconsumption is approx 5 MW.

C K
94 Idea Cellular Limited
Business Responsibility Report
Following initiatives undertaken by the Company in the pastcontinued to run smoothly delivering the intended objectives toutilize alternate sources of energy:
l Exclusive Solar solutions at over 1,200 sites: Cumulativesolar deployment is presently about 5.4 MW. Idea uses aunique vendor engagement model known as EnergyManagement Service (EMS) Provisioning where RET- basedgeneration (Solar Energy) and site operation managementis combined under one Master Services Agreement.
l On-Site Solar implementation: This project was initiatedin FY15. A 25 KW Solar Plant was constructed on the roofof Idea Delhi MSC. It is operating smoothly delivering theobjectives.
l Off-Site Renewable Energy (RE) Deployment: Thisconcept was also initiated in FY15 based on Carbonabatement principle in FY 2016-17,
l 4 MW Solar PPAs signed in Andhra Pradesh (AP) Circleand Madhya Pradesh (MP) Circle with combined 4.9 MnSolar Units generated neutralizing CO2 emission of 3,975Tonnes.
l 1 MW Wind PPS signed in Tamil Nadu Circle (TNC) with1.7 million Wind units generated and neutralized Co2emissions of 1,398 tonnes.
There are plans underway in three other Circles to deploya similar model where power will be generated from a solarat a remote place and fed to grid. The credit generated fromthe solar plant will be used to offset the cost of energyelsewhere.
Some of the tangible outcome of above activities/initiatives inFY 2016-17 include:
l Reduction in Carbon emission: CO2 emission reductionof about 36,373 Tons have been achieved through PowerPurchase Agreements and indoor to outdoor conversions.
l Contributing to Greener Economy: The DG running hasbeen reduced by 4 hrs per BTS, on an average, savingapproximately 2 Million Litres of diesel in FY 2016-17.Reduction in diesel consumption is contributing not onlyto greener economy but also to the national economy byreducing the use of subsidized diesel.
SEBI – BRR Questionnaire Responses for Principle 6:
1. Does the policy related to Principle 6 cover only thecompany or extends to the Group/Joint Ventures/Suppliers/Contractors/NGOs/others?
Ans: The Safety, Health and Environment Policy extends to theCompany and its subsidiaries, as well as to its third partyvendors/suppliers.
2. Does the company have strategies / initiatives to addressglobal environmental issues such as climate change, globalwarming, etc? Y/N. If yes, please give hyperlink forwebpage etc.
Ans: Yes.
Idea is continuing its sustainability journey with specialfocus on energy efficiency and emission reduction. Thisultimately furthers the company’s commitment to
addressing global environmental issues such as climatechange and global warming. The emission levels of theNetwork is base lined as of FY 2012 and being tracked halfyearly. Under this initiative, more than 1,200 plus telecomsites are operational with solar hybrid energy solutions, 25sites are operational with hydrogen fuel cell hybrid solutionsand more than 800 sites are operational with fast chargingbattery hybrid solutions. More Examples of key initiativesare described under Principle 2, 6 and 8 in this section ofthe business responsibility report.
3. Does the company identify and assess potentialenvironmental risks? Y/N
Ans: Idea has always been sensitive to the environmental impactof Telecom Network operations and has proactivelyadopted environmental sustainable practices wheneversuch opportunities were/ are available. This veryendeavour led to the Green Idea Program towards Carbonemission reduction by way of:
- Using renewable energy technologies (RET) forpowering towers during grid failure.
- Using highly energy efficient hardware.
- Reducing Diesel Generator (DG) running by use ofDeep discharge batteries thereby reducing dieselconsumption.
- Optimizing Air Conditioner operations.
In all such cases Idea adopted only commercially viablemodels which offered business benefits to all stakeholdersinvolved. Reduction in CO2 emission and reduction inOperating costs were the driving forces in all its initiatives.
Further, Sustainability issues are being added to theBusiness Risk Register. A dedicated Enterprise RiskManagement (ERM) structure is in place and the same isquarterly reviewed by Idea Cellular Executive Committee(EC). Further, a comprehensive crisis plan is in place andschedule established. Under this, the company has an ITdisaster recovery plan in place.
4. Does the company have any project related to CleanDevelopment Mechanism? If so, provide details thereof,in about 50 words or so. Also, if Yes, whether anyenvironmental compliance report is filed?
Ans: Idea does not have any project related to CleanDevelopment Mechanism.
5. Has the company undertaken any other initiatives on –clean technology, energy efficiency, renewable energy, etc.Y/N. If yes, please give hyperlink for web page etc
Ans: Apart from installation of energy efficient hardware, Ideahas adopted cleaner and non-conventional energy sourcessuch as fuel cell hybrid and solar hybrid technology acrossseveral of its BTS sites. Details of these initiatives areprovided above in Section 6.
6. Are the emissions / waste generated by the company withinthe permissible limits given by CPCB/SPCB for thefinancial year being reported?
Ans: Idea gives greatest importance to the issue of GHGemissions and waste generated from its operations and

C K
Annual Report 2016-17 95
Business Responsibility Report
follows all pertinent Govt. guidelines to be environmentfriendly. EMF radiation and its commitment in this regardis evident from the Company’s stringent monitoringsystems and financial investment in Emissions testingequipment. All of the Company’s network sites are incompliance with the relevant radiation limits prescribed bythe regulatory agency.
7. Number of show cause/ legal notices received from CPCB/SPCB which are pending (i.e. not resolved to satisfaction)as on end of Financial Year.
There is one legal notice received from CPCB/SPCB, whichare pending as at the end of Financial Year.
Principle 7: Businesses, when engaged in influencing publicand regulatory policy, should do so in a responsible manner
As one of the largest mobile operators in the country, Ideaadvocates policies that will spurt socio economic growth includingthe role of the telecom sector promoting development, inclusivegrowth and access to information. Idea is an active player in thefollowing national and international industry associations (eitherdirectly or through its subsidiaries):
1. Confederation of Indian Industry (CII)
2. The Associated Chambers of Commerce and Industry ofIndia (ASSOCHAM)
3. Federation of Indian Chambers of Commerce and Industry(FICCI)
4. Cellular Operators Association of India (COAI)
5. GSM Association (GSMA)
6. Telecom Sector Skill Council
7. IIMA Idea Telecom Centre of Excellence (IIT-CoE) at theIndian Institute of Management Ahmedabad (IIM-A)
Through its participation in the above bodies, Idea activelyparticipates in discussions relating to policy development onseveral issues pertaining to the telecom industry, including EMFdirectives of DoT and other regulations. In addition, Idea is amember of the CII National Committee on Telecom andBroadband, which actively advocates on telecom industry issuessuch as inclusive growth, rural telecom, driving higher qualityof service and security for customers and industry challengesand opportunities. Idea is co-Chair of the FICCI Communicationand Digital Economy Committee.
The company through the Managing Director is on the governingbody of Telecom Sector Skill Council.
The company is represented through the COAI in TSDSI, whichis a not for profit legal entity in a PPP mode with participationfrom stakeholders including Governments, service providers,vendors, manufacturers, academic institutes and researchlaboratories.
Idea is also the principal sponsor of the IIMA Idea Telecom Centreof Excellence (IIT-CoE) at the Indian Institute of ManagementAhmedabad (IIM-A). The Centre came into existence in 2007 asa result of a tripartite Memorandum of Understanding (MoU)between the Company, the DoT and IIM-A. The Idea TelecomCentre of Excellence, along with other TCoEs, is playing an
instrumental role in capacity building and all round growth ofthe Indian telecom industry (including manufacturing throughApplication Research). It also serves as a think tank to theGovernment and industry decision makers.
The Company’s Managing Director was the Chairman of COAItill July, 2016. He had also been elected to the Board of GSMA fora period of two years starting January, 2015.
SEBI – BRR Questionnaire Responses for Principle 7:
1. Is your company a member of any trade and chamber orassociation? If Yes, Name only those major ones that yourbusiness deals with.
Ans: Yes.
Idea is a member of several key Indian and global industryassociations. Some of these are (as mentioned in theparagraph above):
- Confederation of Indian Industry (CII)
- The Associated Chambers of Commerce and Industryof India (ASSOCHAM)
- Federation of Indian Chambers of Commerce andIndustry (FICCI)
- Cellular Operators Association of India (COAI)
- GSM Association (GSMA)
- Telecom Sector Skill Council
2. Have you advocated/lobbied through above associationsfor the advancement or improvement of public good? Yes/No; if yes specify the broad areas ( drop box: Governanceand Administration, Economic Reforms, InclusiveDevelopment Policies, Energy security, Water, FoodSecurity, Sustainable Business Principles, Others).
Ans: Idea is a core member of the COAI. The industry body isthe lead interlocutor between the policymaker (DoT), theRegulator (TRAI) and the ecosystem at large. Theassociation has been involved in facilitating a smooth andproductive dialogue on behalf of the operators in thecountry, on various public policy matters such as drivingrural penetration of telecom, creation of digital ecosystem,higher quality of service and security for customers,environmental and EMF issues in telecom, innovation andtechnology etc. Idea is also part of the IIMA Idea TelecomCentre of Excellence (IIT-CoE) which is actively involvedin creating better telecom standards and technologicalexcellence in this field.
Principle 8: Businesses should support inclusive growth andequitable development
Idea’s, roadmap for Social Inclusion and Equitable Developmentaims at ensuring maximum people are included and empoweredby connecting them to sustainable economic growth. Thisobjective is guided by its four Social Pillars:
1. Bringing Digital Divide and Bringing all underprivilegedinto digital presence.
2. Ensuring Gender Equity and Equal Opportunity to all levelat Idea.

C K
96 Idea Cellular Limited
Business Responsibility Report
3. Harnessing the transformational potential of mobiletelephone and information technology to develop a betterapplication to the universe of financial inclusion, educationand Health for the weaker section of the society.
4. Community development and nation building throughsustainable development.
Idea’s objective and contribution towards achievinginclusive growth and equitable development areaccomplished by:
l Reaching to unreached people through robustnetwork and far reaching distribution - Idea is a fullyintegrated telecom services provider offering its 195.4million mobile subscribers a choice of national,international and internet services. The Company’sservices are available in remote towns and villagesacross India. Moreover, the Company’s ruralpenetration is 55.7%.
l Gender Equity Policy at Idea: The Companymaintains gender equality at all levels. Companyconstantly endeavours to inspire participation ofwomen through constant support, coach, motivationand by creating opportunities to realize their potential.The gender equality policy at Idea are organic innature and evolve through the work and involvementof employees engaged within them. Company hasnumber of female centric policies. Company pridesitself for its women centric initiatives such asproviding creche facility at work place, differentialreferral payment, mobility support etc. Company alsoprovides a best in class Maternity Support programto ensure women enjoy the precious moments withno professionals pressure.
l Consistently innovating new business models likemobile money, Payment bank, which are focusedintervention for overcoming the sustainabilitybarriers.
l Creating human interface “Son of Soil” to enhancethe access and opportunities gap though mobilenetwork for underprivileged rural community.
SEBI – BRR Questionnaire Responses for Principle 8:
1. Does the company have specified programmes/initiatives/projects in pursuit of the policy related to Principle 8? Ifyes details thereof.
Ans: Yes.
The Roadmap and miles stones for inclusive growth andequitable development are implemented through theCompany’s own initiatives and some are through itspartners. Key specified programmes/initiatives in pursuitof above policy are as follows:
EDUCATION:
One of Company’s primary CSR initiatives. The Companyworks with children of all ages and helps to improve schoolinfrastructure and provide educational aid to students. Theprojects focus on better access to education and to ensurethat underprivileged children in rural India get thenecessary support to continue their schooling:
l Solar Lamp to School Children: The Company underits Solar Lamps initiative in partnership with IITBombay is providing a clean source of light to studentsfor studying during the night. It also fosters skilldevelopment through learning, assembling,distribution and repair of the lamps. During FY 2016-17, 100,000 students are being benefitted. The projectextends to three States viz., Bihar, Rajasthan and UP.This project was undertaken in the previous year also.This year another component was added to theproject, empowerment of rural women. Self HelpGroups (SHG) have been trained to assemble, repair,maintain and sell the lamps. This has led to theeconomic empowerment of women.
l Mid-Day Meals to School Children: Idea Cellular inpartnership with Akshaya Patra Foundation providesmid-day meals to children in schools. During FY 2016-17, 39075 school children were provided mid daymeals in the five States viz., Gujarat, Odisha,Karnataka, Rajasthan and UP.
l KHEL - A Knowledge hub for E-learning: Topromote E-learning in schools, Idea Cellular inpartnership with IIT Bombay and IIT Kanpur hasdeveloped game pedagogy for school children. Theinitiative is being implemented across 50 schools atthree locations viz., Mumbai, Kanpur and MadhyaPradesh. Over 7500 school children will gain moreknowledge through it.
HEALTHCARE:
The Company is also focusing on another important humandevelopment indicator - health and sanitation. Itspreventive healthcare programme addresses need ofchildren and adults.
l Polio non-reoccurrence: To ensure the non-reocurrence of polio, Idea Cellular in collaborationwith Rotary Foundation (India) organises healthcamps, awareness rallies, administers pulse poliovaccination to children upto 5 years of age under thePolio Non-reoccurrence CSR project. It’s a pan Indiainitiative and 17 crore children are covered in eachround. The initiative is tied up with the National PulsePolio Programme.
l Healthcare Support to Deaf and Mute Childrenthrough Cochlear Implant: In India 3 in 1000 babiesborn, suffer from Severe to Profound Hearing Loss,i.e. born deaf. The incidence of hearing loss inMaharashtra is 6000 babies every year. Themagnitude of the problem is grave. Company issupporting 21 deaf-mute children to speak and hearthrough the Cochlear implant. It is life changingexperience for deaf and mute children. It has enabledchildren to move out of their world of silence to aworld of sound.
l Restoring vision / eyesight of treatable blindpersons: The Company in partnership with VisionFoundation of India organizes eye camps andconducts eye surgery. Under the project 6666 personswere covered. The objective of the project is to reducetreatable blindness from the lower socioeconomicstrata of the society.

C K
Annual Report 2016-17 97
Business Responsibility Report
l M-POWER: Under this initiative, awareness aboutmental health among children and adolescents isbeing generated through counselling and guidanceand organization of camps through voluntaryorganization. The project location is Mumbai and theoutreach of the project is 1000 children andadolescents.
l School Based Educational Intervention Program forReduction of Future Risks of Cardio-VascularDiseases: The Company in partnership with MissionArogya Health and Information Technology raisesawareness about cardio vascular diseases (CVD)among school going children, improve knowledge,perception, awareness and practices related to CVDand their risk factors. The project is implemented in2762 schools in 4 districts of West Bengal.
l Village Social Health Entrepreneurs: Under thisinitiative, Company in partnership with Public HealthTechnologies Trust create social health entrepreneurswho provide economical diagnostic health test at onecentre. The project outreach is in 100 locations in 20districts in 4 States.
l Water Supply:Marathwada region known for itsroutine and severe droughts witnessed a severedrought in 2016. Given the context of the problem itwas essential to take measures which address theimmediate needs of the people. The Company in linewith ABG philosophy, provided drinking water infour districts namely, Latur, Aurangabad, Jalna andBeed which were most affected and reeling under anacute shortage of water. Overall 49,45,080 liters’ ofdrinking water was distributed to 11,415 families.
SKILL DEVELOPMENT AND LIVELIHOODS
l Under the project Roshini: Digital and EconomicEmpowerment of Women, 300 women are beingtrained to use internet on mobile phone forcomprehensive services like healthcare, bankingeducation etc. in Rajasthan, Madhya Pradesh andBihar.
l The Company in partnership with G D BirlaFoundation is addressing skill deficits amongst theyouth by training youngsters in the 18 to 30 yearsage group. Six Aditya Birla Vocational Education andTraining Centres are being set up at six locations viz.,Raipur, Nagpur, Vadodara, Udaipur, Bhopal andKanpur. Over 1800 youths will be provided trainingin different trades.
Note: In addition to above-mentioned projects number of social activitieslike blood donation camp, plantation, SwacchtaAbhiyan, donation ofbooks, computers and other times to schools and NGOs etc. wereorganized at the circle level.
2. Are the programmes / projects undertaken through in-houseteam / own foundation / external NGO / governmentstructures / any other organization?
Ans: The Company has a separate CSR function at Corporatelevel and also has Single Point of Contact (SPOC) in all 22Circles. Some of the project are implemented by in house
team and some project by NGO/Institution andGovernment department. The Company’s key Partners/Collaborators are:-
- IIT Bombay and IIT Kanpur
- Ministry of New and Renewable Energy
- Pratham Educational Trust
- Akshaya Patra Foundation
- Rotary Foundation India
- Department of Rural Development, Govt. of Jammu& Kashmir
- Public Health Technologies Trust
- Mission Arogya Health and Information TechnologyResearch Foundation
- Vision Foundation of India
- ENT World LLP
- G.D. Birla Medical Research & Education Foundation
- Aditya Birla Educational Trust
The Company from time to time associates with differentNGOs to cater to various needs of the less privileged andspecific causes. Circle Teams of Idea does several activitieslike blood donation camps, tree plantation, visits to localNGOs etc. Idea Cellular employees participate in CSRevents / programs / meetings organized in his / herrespective areas. The Company also conducts employeesurveys to understand the perception of employees onsocial issues. The Company provides opportunities toemployees to contribute towards the worthy cause and bea part of the CSR drives. Employees participate in thenation-wide ‘Joy of Giving Week’ initiative. Idea Cellularengages with this cause and drives the Joy of Giving Weekunder the banner ‘DaanUtsav Week’
The Company encourages high performing employees towork for two days in a year for CSR activity and it alsoencourages employees to carry out different initiatives forsocial cause in the areas where they operate.
The Company also engages with well-established andrecognized programs and national platforms such as theCII, FICCI, ASSOCHAM etc. given their commitment toinclusive growth. Number of initiatives are undertaken atthe unit level to participate in supporting various causesfor underprivileged in our society.
3. Have you done any impact assessment of your initiative?
Ans: In order to measure the impact of its CSR projects, all projectpartners conduct baseline and impact study of their projectoutcomes. Theme-wise details are as below:
Education
l Around 10% improvement in children schoolattendance, pass percentage, reading and writing ofthe children in the school.
l Around one Lakh children provided with solar lampshave been able to study during night. Around 40,000school children were provided Mid-day meal whichhas significantly reduced the dropout rate.

C K
98 Idea Cellular Limited
Business Responsibility Report
Healthcare
l 17 crore children between 0-5 years under Polio Non-reocurrence campaign Program were administeredpolio drop.
l 21 children between 1-10 years have been able tomove from world of silence to world of sound throughCochlear implant.
l Around 3 lakh people of all age group under villagesocial entrepreneurs in healthcare has been benefitted.
l 6,666 people vision were restored of partial blind.
l Around 5.5 lakh school children from 2762 schoolswere made aware about cardio vascular diseases
Skill Development & Livelihood
l Assembly, distribution and repair training of solarlamp has provided skill development and livelihoodenhancement for 700 youth including women. Ruralhouseholds have received additional income of` 2.66 crore through assembly, distribution and repairof solar lamps.
l Around 2100 youths are being imparted vocationaleducation training under skill center initiative.
l Around 300 rural women are being provided digitalliteracy training.
Water Supply and Sanitation
l 9 lakh litres of drinking water was provided to 11,415families in Marathwada region during the droughtperiod.
l 2010 toilets are being constructed in 10 GramPanchayats of Jammu and Kashmir.
Environmental Benefits
Solar lamp project has helped in reduction of keroseneconsumption by 23.4 lakh litres’ in a year. The net savingdue to reduction in use of kerosene is ` 3.5 crore[23,40,000 x 15 (rate of kerosene per litre at PDS)]. It hasalso helped in saving of 58.50 lakh Kg of carbon, whichcould have been emitted.
In addition concurrent impact assessment includingperformance was conducted by KPMG.
4. What is your company’s direct contribution to communitydevelopment projects - Amount in INR and the details ofthe projects undertaken?
Ans: For FY 2016-17, Company’s CSR spend was around INR369.1 Mn (349.8 Mn for 2016-17 year projects and 18.4 Mnfor 2015-16 carried over projects and 0.91 Mn for CSR audit).In addition, the Company mobilized resources from TheMinistry of New & Renewable Energy (MNRE),Government of India and select State Governments forMidday Meals and The Ministry of Health and FamilyWelfare for Polio Programme of Government of India.
5. Have you taken steps to ensure that this communitydevelopment initiative is successfully adopted by thecommunity? Please explain in 50 words, or so.
Ans: All CSR projects focus on community participation,
empowerment and community development. TheCompany undertakes projects in rural areas and cater theneed of underprivileged section of the society.
Under the projects one of the focused criteria is to empowerthe locals so that the initiative could sustain and takenforward. For example under solar lamp project local youthsand women are provided training on assembling anddistribution of solar lamps. Locals are able to earn theirlivelihood through the repair and maintenance work ofsolar lamps. Importantly women from SHGs who weretrained under the project have opened solar shops. It hasfoster women empowerment process and raised theirstandard of life.
Similarly under Roshini digital training project, women arebeing trained and who in turn impart training to otherwomen of their locality. This has created cascading impactsof the project.
Apart from community development work Idea hasdeveloped mobile applications for the rural population andprovides employment opportunities to rural youth throughinitiatives such as ‘Son of Soil’. Providing affordabletelecommunication access to rural population is Idea’scontribution to sustainable and equitable development inIndia.
Principle 9: Businesses should engage with and provide valueto their customers and consumers in a responsible manner
Idea believes that Customers form the foundation of its businesssuccess. The company’s focus on Customers is based on its ValueBook, which highlights the need for timely response to its internaland external customers; strive to finish before a deadline and tochoose the best rhythm to optimize organizational efficiencies.
To fulfill the Company’s mission “We will delight our customerswhile meeting their individual communication needs anytimeanywhere”, it constantly endeavors to meeting customer needs,adding value and exceeding their expectations. The Companystrongly believes in being ethical about its operations withcustomers. Hence, it engages with its customers in a transparentmanner by displaying all the tariff plans on the web in anunambiguous manner. This information is easily accessible tocustomers either by telecom circle or by package. Idea addressesits customers’ need to be constantly updated about their usagethrough instantaneous pop-up messages informing them abouttheir data consumption and balance left. The Company alsoinstalls its network devices in a way that maintains data integrity,confidentiality and availability while preventing unauthorizeduse of confidential data.
Idea always focuses on meeting and exceeding customer needs.Some innovative initiatives in this regard include a quick andeasy way of ‘Electronic top-up’ for recharging accounts, campsin rural areas for providing education on mobile, and provisionof customer care services in vernacular languages. Idea has alsointroduced several value-added services (VAS) focusing oneducation, health and family care for rural population. At urbanlocations, kiosks are set up at select Service Centers to createawareness about data (2G, 3G & 4G) services that the Companyoffers.
C K
Annual Report 2016-17 99
Business Responsibility Report
In order to service customers better and to bring in strongergovernance in Store operations, concept of company ownedcompany operated neighborhood stores was introduced. In 2015,a revamped model for these Company Retail Stores was put inplace. Currently, the Company has over 88 company operatedlarge format stores across the country.
Customer satisfaction is of prime importance to the Company. Acustomer satisfaction (C-SAT) study is conducted thrice a yearin order to track the quality of customer experience withcompany’s product and services and to benchmark thecompany’s performance with respect to its competitors. Ideaattained first rank in customer satisfaction in FY 2014. In March,2015 survey results, Idea retained its first rank, jointly. Over thepast one year, focused activities were taken up to retain andstrengthen Idea’s customer relationships which have resulted inIdea retaining its first rank in CSAT & NPS, jointly, as on March,2016, a position that has been retained for a major part of year2017.
Idea acknowledges the needs of data customers throughconducting focused diagnostic study amongst these customersto understand and address their specific network, product,communication and service expectations. Idea’s Loyalty segmentcustomers too are covered through a similar program.
Idea also conducts other consumer satisfaction surveys such as‘Customer Life Cycle Experience Audits’, ‘Mystery Audits atService Centers’, ‘National Enterprise Business (NEB) SatisfactionStudy’ and ‘Franchisee Satisfaction Survey’ during the course ofthe year to get customer feedback and undertake correctiveactions and initiatives. With increasing footprint in the Enterprisebusiness, Idea carries out focused studies amongst decisionmakers and users of all Enterprise segments, to address theirneeds.
With a view to inculcate high velocity feedback programs, Ideahas also started an in-house call centre experience feedbackprogram amongst its select Service+ segment customers, aimedat driving continuous and systemic improvements throughregular feedback loops.
To reinforce customer centricity as a culture within theorganization, the customer immersion program ‘iConnect’ wasfurther strengthened to include participation from all functionsacross all circles.
In addition to this “Hello BOSSTOMER” - the Group wide‘Ideation’ program for employees to improve customerexperience was launched with great success. This program hasseen Idea open-up the collective power of employee-ledinnovation to set the path for new customer centric thinkingacross the company. With the program generating more than10,000 (91%+) employee registrations and over 1,000 ideas, IdeaCellular has been the torch-bearer of this program across theGroup.
Idea has an additional feedback taken from customers on a dailybasis is Instant Customer Feedback (ICF) wherein, an SMS is sentto customers seeking feedback on the quality of service providedto him after he / she has contacted any of the company’s touchpoints. This on-going Instant feedback from customers helps inimproving the company’s processes. After the surveys arecompleted, the results are presented to the senior managementteam and detailed action plans are prepared specific to all theconcerned functions. The same are tracked at periodic intervalsto ensure that the execution meets the planning requirementsleading to higher customer satisfaction.
SEBI – BRR Questionnaire Responses for Principle 9:
1. What percentage of customer complaints/ consumer casesis pending as on the end of financial year?
Ans: Out of the total calls received by the company fromcustomers, approximately 0.9% are related to complaints.0.3% of the total complaints received during FY 2016-17were in an open stage as on March 31, 2017. The rest wereclosed satisfactorily.
2. Does the company display product information on theproduct label, over and above what is mandated as perlocal laws? Yes/No/N.A /Remarks
Ans: The Company adheres to all product labeling and productinformation requirements as per the law of the land.Transparency in tariff through detailed plans beingavailable on the website for consumers and focus onresponsible advertising is the hallmark of Idea.
3. Is there any case filed by any stakeholder against thecompany regarding unfair trade practices, irresponsibleadvertising and/or anti-competitive behaviour during thelast five years and pending as on end of financial year. Ifso, provide details thereof, in about 50 words or so.
Ans: There are no cases pending in relation to unfair tradepractices, irresponsible advertising and/or anti- competitivebehavior. However, dissatisfied subscribers of theCompany generally file their cases in consumer protectionforums for alleged deficiency in expected level of serviceby the Company, in the normal course of business, whichthe Company defends appropriately.
4. Did your company carry out any consumer survey/consumer satisfaction trends?
Ans: Idea conducts a C-SAT/NPS survey thrice a yearas well as other assessment surveys such as ‘4G Studies’,‘Customer Life Cycle Journey Experiential Mapping’,‘Mystery Audits at Service Centers’, ‘National EnterpriseBusiness (NEB) Satisfaction Study’ and ‘FranchiseeSatisfaction Survey’.

C K
100 Idea Cellular Limited
Standalone Financial Statements
Independent Auditors’ ReportTo the Members of
Idea Cellular Limited
Report on the Standalone Ind AS Financial Statements
We have audited the accompanying standalone Ind AS financialstatements of IDEA CELLULAR LIMITED (“the Company”),which comprise the Balance Sheet as at March 31, 2017, and theStatement of Profit and Loss (including Other ComprehensiveIncome), the Statement of Cash Flows and the Statement ofChanges in Equity for the year then ended, and a summary ofthe significant accounting policies and other explanatoryinformation.
Management’s Responsibility for the Standalone Ind ASFinancial Statements
The Company’s Board of Directors is responsible for the mattersstated in Section 134(5) of the Companies Act, 2013 (“the Act”)with respect to the preparation of these standalone Ind ASfinancial statements that give a true and fair view of the financialposition, financial performance including other comprehensiveincome, cash flows and changes in equity of the Company inaccordance with the accounting principles generally accepted inIndia, including the Indian Accounting Standards (Ind AS)prescribed under section 133 of the Act.
This responsibility also includes maintenance of adequateaccounting records in accordance with the provisions of the Actfor safeguarding the assets of the Company and for preventingand detecting frauds and other irregularities; selection andapplication of appropriate accounting policies; making judgmentsand estimates that are reasonable and prudent; and design,implementation and maintenance of adequate internal financialcontrols, that were operating effectively for ensuring the accuracyand completeness of the accounting records, relevant to thepreparation and presentation of the standalone Ind AS financialstatements that give a true and fair view and are free from materialmisstatement, whether due to fraud or error.
Auditors’ Responsibility
Our responsibility is to express an opinion on these standaloneInd AS financial statements based on our audit.
In conducting our audit, we have taken into account theprovisions of the Act, the accounting and auditing standards andmatters which are required to be included in the audit reportunder the provisions of the Act and the Rules made thereunder.
We conducted our audit of the standalone Ind AS financialstatements in accordance with the Standards on Auditingspecified under Section 143(10) of the Act. Those Standardsrequire that we comply with ethical requirements and plan andperform the audit to obtain reasonable assurance about whetherthe standalone Ind AS financial statements are free from materialmisstatement.
An audit involves performing procedures to obtain audit evidenceabout the amounts and the disclosures in the standalone Ind ASfinancial statements. The procedures selected depend on theauditor’s judgment, including the assessment of the risks ofmaterial misstatement of the standalone Ind AS financialstatements, whether due to fraud or error. In making those risk
assessments, the auditor considers internal financial controlrelevant to the Company’s preparation of the standalone Ind ASfinancial statements that give a true and fair view in order todesign audit procedures that are appropriate in the circumstances.An audit also includes evaluating the appropriateness of theaccounting policies used and the reasonableness of the accountingestimates made by the Company’s Directors, as well as evaluatingthe overall presentation of the standalone Ind AS financialstatements.
We believe that the audit evidence obtained by us is sufficientand appropriate to provide a basis for our audit opinion on thestandalone Ind AS financial statements.
Opinion
In our opinion and to the best of our information and accordingto the explanations given to us, the aforesaid standalone Ind ASfinancial statements give the information required by the Act inthe manner so required and give a true and fair view in conformitywith the accounting principles generally accepted in India, of thestate of affairs of the Company as at March 31, 2017, and its loss,total comprehensive loss, its cash flows and the changes in equityfor the year ended on that date.
Emphasis of Matters
We draw attention to the Note 43A(i) to the standalone Ind ASfinancial statements which describes the uncertainties related tothe legal outcome in respect of the Department ofTelecommunications (DoT) demand notices for one time spectrumcharges.
Our opinion is not modified in respect of this matter.
Report on Other Legal and Regulatory Requirements
1. As required by Section 143(3) of the Act, based on our auditwe report, to the extent applicable that:
a) We have sought and obtained all the information andexplanations which to the best of our knowledge andbelief were necessary for the purposes of our audit.
b) In our opinion, proper books of account as required bylaw have been kept by the Company so far as it appearsfrom our examination of those books.
c) The Balance Sheet, the Statement of Profit and Lossincluding Other Comprehensive Income, theStatement of Cash Flows and Statement of Changesin Equity dealt with by this Report are in agreementwith the books of account.
d) In our opinion, the aforesaid standalone Ind ASfinancial statements comply with the Indian AccountingStandards prescribed under section 133 of the Act.
e) On the basis of the written representations received fromthe directors as on March 31, 2017 taken on record bythe Board of Directors, none of the directors isdisqualified as on March 31, 2017 from being appointedas a director in terms of Section 164(2) of the Act.
Independent Auditors’ Report
C K
Annual Report 2016-17 101
Standalone Financial StatementsIndependent Auditors’ Report
f) With respect to the adequacy of the internal financialcontrols over financial reporting of the Company andthe operating effectiveness of such controls, refer to ourseparate Report in “Annexure A”. Our report expressesan unmodified opinion on the adequacy and operatingeffectiveness of the Company’s internal financialcontrols over financial reporting.
g) With respect to the other matters to be included in theAuditor’s Report in accordance with Rule 11 of theCompanies (Audit and Auditors) Rules, 2014, asamended, in our opinion and to the best of ourinformation and according to the explanations givento us:
i. The Company has disclosed the impact of pendinglitigations on its financial position in its standaloneInd AS financial statements – Refer Note 43 A and43 C to the Standalone Ind AS financial statements;
ii. The Company did not have any long-termcontracts including derivative contracts for whichthere were any material foreseeable losses;
iii. There were no amounts which were required tobe transferred to the Investor Education andProtection Fund by the Company;
iv. The Company has provided requisite disclosuresin the standalone Ind AS financial statements asregards its holding and dealings in Specified BankNotes as defined in the Notification S.O. 3407(E)
dated November 8, 2016 of the Ministry ofFinance, during the period from November 8, 2016to December 30, 2016. Based on audit proceduresperformed and the representations provided tous by the management we report that thedisclosures are in accordance with the books ofaccount maintained by the Company and asproduced to us by the Management.
2. As required by the Companies (Auditor’s Report) Order,2016 (“the Order”) issued by the Central Government interms of Section 143(11) of the Act, we give in “AnnexureB” a statement on the matters specified in paragraphs 3 and4 of the Order.
For Deloitte Haskins & Sells LLPChartered AccountantsFirm’s Registration No. 117366W / W-100018
Hemant M. JoshiPartnerMembership No: 38019
Place : Mumbai
Date : May 13, 2017

C K
102 Idea Cellular Limited
Standalone Financial Statements
Annexure “A” to the Independent Auditor’s Report(Referred to in paragraph 1(f) under ‘Report on Other Legal and Regulatory Requirements’ section of our report of even date)
Report on the Internal Financial Controls Over FinancialReporting under Clause (i) of Sub-section 3 of Section 143 ofthe Companies Act, 2013 (“the Act”)
We have audited the internal financial controls over financialreporting of IDEA CELLULAR LIMITED (“the Company”) asof March 31, 2017 in conjunction with our audit of the standaloneInd AS financial statements of the Company for the year endedon that date.
Management’s Responsibility for Internal Financial Controls
The Company’s management is responsible for establishing andmaintaining internal financial controls based on the internalcontrol over financial reporting criteria established by theCompany considering the essential components of internal controlstated in the Guidance Note on Audit of Internal FinancialControls Over Financial Reporting issued by the Institute ofChartered Accountants of India. These responsibilities includethe design, implementation and maintenance of adequate internalfinancial controls that were operating effectively for ensuring theorderly and efficient conduct of its business, including adherenceto company’s policies, the safeguarding of its assets, theprevention and detection of frauds and errors, the accuracy andcompleteness of the accounting records, and the timelypreparation of reliable financial information, as required underthe Companies Act, 2013.
Auditors’ Responsibility
Our responsibility is to express an opinion on the Company’sinternal financial controls over financial reporting based on ouraudit. We conducted our audit in accordance with the GuidanceNote on Audit of Internal Financial Controls Over FinancialReporting (the “Guidance Note”) issued by the Institute ofChartered Accountants of India and the Standards on Auditingprescribed under Section 143(10) of the Companies Act, 2013, tothe extent applicable to an audit of internal financial controls.Those Standards and the Guidance Note require that we complywith ethical requirements and plan and perform the audit toobtain reasonable assurance about whether adequate internalfinancial controls over financial reporting was established andmaintained and if such controls operated effectively in allmaterial respects.
Our audit involves performing procedures to obtain auditevidence about the adequacy of the internal financial controlssystem over financial reporting and their operating effectiveness.Our audit of internal financial controls over financial reportingincluded obtaining an understanding of internal financial controlsover financial reporting, assessing the risk that a materialweakness exists, and testing and evaluating the design andoperating effectiveness of internal control based on the assessedrisk. The procedures selected depend on the auditor’s judgement,including the assessment of the risks of material misstatement ofthe financial statements, whether due to fraud or error.
We believe that the audit evidence we have obtained is sufficientand appropriate to provide a basis for our audit opinion on theCompany’s internal financial controls system over financialreporting.
Meaning of Internal Financial Controls Over FinancialReporting
A company’s internal financial control over financial reporting isa process designed to provide reasonable assurance regardingthe reliability of financial reporting and the preparation of financialstatements for external purposes in accordance with generallyaccepted accounting principles. A company’s internal financialcontrol over financial reporting includes those policies andprocedures that (1) pertain to the maintenance of records that, inreasonable detail, accurately and fairly reflect the transactionsand dispositions of the assets of the company; (2) providereasonable assurance that transactions are recorded as necessaryto permit preparation of financial statements in accordance withgenerally accepted accounting principles, and that receipts andexpenditures of the company are being made only in accordancewith authorisations of management and directors of the company;and (3) provide reasonable assurance regarding prevention ortimely detection of unauthorised acquisition, use, or dispositionof the company’s assets that could have a material effect on thefinancial statements.
Inherent Limitations of Internal Financial Controls OverFinancial Reporting
Because of the inherent limitations of internal financial controlsover financial reporting, including the possibility of collusion orimproper management override of controls, materialmisstatements due to error or fraud may occur and not bedetected. Also, projections of any evaluation of the internalfinancial controls over financial reporting to future periods aresubject to the risk that the internal financial control over financialreporting may become inadequate because of changes inconditions, or that the degree of compliance with the policies orprocedures may deteriorate.
Opinion
In our opinion, to the best of our information and according tothe explanations given to us, the Company has, in all materialrespects, an adequate internal financial controls system overfinancial reporting and such internal financial controls overfinancial reporting were operating effectively as at March 31, 2017,based on the internal control over financial reporting criteriaestablished by the Company considering the essential componentsof internal control stated in the Guidance Note on Audit of InternalFinancial Controls Over Financial Reporting issued by the Instituteof Chartered Accountants of India.
For Deloitte Haskins & Sells LLPChartered AccountantsFirm’s Registration No. 117366W / W-100018
Hemant M. JoshiPartnerMembership No: 38019
Place : Mumbai
Date : May 13, 2017
Independent Auditors’ Report
C K
Annual Report 2016-17 103
Standalone Financial Statements
Annexure “B” to the Independent Auditor's Report(Referred to in paragraph 2 under ‘Report on Other Legal and Regulatory Requirements’ section of our report of even date)
(i) In respect of its fixed assets:
a) The Company has maintained proper records
showing full particulars, including quantitative
details and situation of fixed assets.
b) The Company has a program of verification of fixed
assets to cover all the items in a phased manner
over a period of three years which, in our opinion,
is reasonable having regard to the size of the
Company and the nature of its assets. Pursuant to
the program, certain fixed assets were physically
verified by the Management during the year.
According to the information and explanations
given to us, no material discrepancies were noticed
on such verification.
c) According to the information and explanations
given to us and the records examined by us and
based on the examination of the registered sale
deed / transfer deed /conveyance deed /court
orders approving schemes of arrangements /
amalgamations provided to us, we report that, the
title deeds, comprising all the immovable properties
of land and buildings are held in the name of the
Company as at the balance sheet date. In respect
of immovable properties of buildings that have been
taken on lease and disclosed as fixed asset in the
financial statements, the lease agreements are in the
name of the Company, where the Company is the
lessee in the agreement.
(ii) As explained to us, the inventories, except for those lying
with the third parties, were physically verified during
the year by the Management at reasonable intervals and
no material discrepancies were noticed on physical
verification.
(iii) The Company has not granted any loans, secured or
unsecured, to companies, firms, Limited Liability
Partnerships or other parties covered in the register
maintained under section 189 of the Companies
Act, 2013.
(iv) In our opinion and according to the information and
explanations given to us, the Company has complied
with the provisions of Sections 185 and 186 of the
Companies Act, 2013 in respect of grant of loans, making
investments and providing guarantees and securities,
as applicable.
(v) According to the information and explanations given to
us, the Company has not accepted any deposits from
the public to which the directives issued by the Reserve
Bank of India and the provisions of sections 73 to 76 of
the Companies Act, 2013 and the rules framed there
under are applicable.
(vi) The maintenance of cost records has been specified by
the Central Government under section 148(1) of the
Companies Act, 2013. We have broadly reviewed the
cost records maintained by the Company pursuant to
the Companies (Cost Records and Audit) Rules, 2014,
as amended prescribed by the Central Government
under sub-section (1) of Section 148 of the Companies
Act, 2013, and are of the opinion that, prima facie, the
prescribed cost records have been made and maintained.
We have, however, not made a detailed examination of
the cost records with a view to determine whether they
are accurate or complete.
(vii) According to the information and explanations given to
us, in respect of statutory dues:
a) The Company has generally been regular in
depositing undisputed statutory dues, including
Provident Fund, Employees’ State Insurance,
Income-tax, Sales Tax / Value Added Tax,
Service Tax, Customs Duty, cess and other
material statutory dues applicable to it to the
appropriate authorities. As explained to us, the
Company did not have any dues on account of
Excise duty.
b) There were no undisputed amounts payable in
respect of Provident Fund, Employees’ State
Insurance, Income-tax, Sales Tax / Value Added
Tax, Service Tax, Customs Duty, cess and other
material statutory dues in arrears as at March 31,
2017 for a period of more than six months from the
date they became payable.
c) There are no dues of cess which have not been
deposited on account of any dispute. Details of dues
of Income-tax, Sales Tax / Value Added Tax,
Service Tax and Customs Duty which have not been
deposited as on March 31, 2017 on account of
disputes are given below:
Independent Auditors’ Report

C K
104 Idea Cellular Limited
Standalone Financial StatementsIndependent Auditors’ Report
Name of Statute Nature of Forum where Period to Amount Amount
Dues Dispute is Pending which the Involved Unpaid
Amount Relates (` in Mn) (` in Mn)
Customs Act, 1962 Custom Duty Customs Excise & Service 2003-04 3.49 3.49
Tax Appellate Tribunal
Karnataka Tax on Entry Entry Tax High Court of Karnataka 2004-05 8.92 8.92
of Goods Act, 1979
MP Entry Tax Act, 1976 Entry Tax Assistant Commissioner 1998-2001, 2009-10, 87.83 0.89
2013-2017
MP Entry Tax Act, 1976 Entry Tax CG Commercial Tax Tribunal 2006-2009, 31.26 16.98
2010-2011
MP Entry Tax Act, 1976 Entry Tax CG High Court 2003-04 0.51 0.37
MP Entry Tax Act, 1976 Entry Tax Deputy Commissioner 2011-12 14.36 12.20
Commercial Tax (Appeals)
MP Entry Tax Act, 1976 Entry Tax Deputy Commissioner Appeals 2012-13 21.34 18.10
MP Entry Tax Act, 1976 Entry Tax Madhya Pradesh High Court 1998-01, 2003-14 452.89 91.52
MP Entry Tax Act, 1976 Entry Tax State Tax Tribunal 2001-03, 2004-2006 12.88 1.08
West Bengal Value Added Entry Tax Deputy Commissioner 2013-14 0.55 0.55
Tax, 2003
The Maharashtra Municipal Entry Tax Deputy Commissioner 2013-14 1.58 0.98
Corporations Act
Rajasthan Tax On Entry Of Entry Tax Supreme Court 2008-16 157.09 69.14
Goods Into Local Areas
Act, 1999
Rajasthan Tax On Entry Of Entry Tax Assistant Commissioner 2014-15 2.65 2.65
Goods Into Local Areas
Act, 1999
The Bihar Value Added Entry Tax Joint Commissioner (Appeals) 2010-11, 2013-16 33.49 30.89
Tax Act, 2005
The Bihar Value Added Entry Tax State Tax Tribunal 2010-12 1.07 0.93
Tax Act, 2005
The Uttar Pradesh Tax on Entry Tax Assessing Officer 2011-12 0.95 0.95
Entry of Goods Act, 2000
The Uttar Pradesh Tax on Entry Tax State Tax Tribunal 2007-08 4.89 4.16
Entry of Goods Act, 2000
The Uttar Pradesh Tax on Entry Tax High Court Allahabad 1999-10 29.25 12.00
Entry of Goods Act, 2000
Uttar Pradesh Trade Entry Tax State Tax Tribunal 2005-06 0.17 0.17
Tax Act, 1948
Uttar Pradesh Trade Tax Entry Tax High Court Nainital 2001-04 1.21 0.57
Act, 1948 (UTTRAKHAND
AMENDMENT)
Orissa Entry Tax Act, 1999 Entry Tax Cuttack High Court 2008-17 57.77 38.94
Himachal Pradesh Entry Entry Tax HP High Court 2010-17 114.91 71.79
Tax Act, 2010

C K
Annual Report 2016-17 105
Standalone Financial StatementsIndependent Auditors’ Report
The Jammu & Kashmir Entry Tax Srinagar High Court 2010-17 364.10 79.05
Entry Tax on Goods
Act, 2000
Income Tax Act ,1961 Income Tax Assistant Commissioner of 2009-11, 2012-13 15.21 15.21
Income Tax
Income Tax Act ,1961 Income Tax Deputy Commissioner of 2006-11 390.86 140.99
Income Tax
Income Tax Act ,1961 Income Tax Commissioner of Income 2002-2016 71,894.21 54,299.73
Tax (Appeals)
Income Tax Act ,1961 Income Tax Income Tax Appellate Tribunal 2002-05, 2007-15 1,339.71 191.18
Income Tax Act ,1961 Income Tax High Court of Karnataka 2001-02 1.38 1.38
Income Tax Act ,1961 Income Tax High Court of Andhra Pradesh 2003-09 131.58 -
Income Tax Act ,1961 Income Tax Madhya Pradesh High Court 2006-09 129.80 -
Income Tax Act ,1961 Income Tax Rajasthan High Court 2006-10 26.25 -
Income Tax Act ,1961 Income Tax Supreme Court 2002-04 9.47 -
Income Tax Act ,1961 Income Tax High Court of Gujarat 2007-10 30.73 0.32
Bombay Sales Tax Act, 1959 Sales Tax Sales tax Tribunal 2000-01 43.90 43.90
Central Sales Tax Act, 1956 Sales Tax Joint Commissioner (Appeals) 2007-08,2010-11 41.35 23.17
Central Sales Tax Act, 1956 Sales Tax Assistant Commissioner 2013-14 0.02 0.02
Central Sales Tax Act, 1956 Sales Tax Deputy Commissioner, Sales Tax 2008-09, 2011-12 37.79 27.79
Delhi Sales Tax Act, 1975 Sales Tax Additional Commissioner 2002-03 1.86 -
(Appeals)
Gujarat Sales Tax Act, 1969 Sales Tax State Tax Tribunal 1998-02 8.83 7.04
Gujarat Sales Tax Act, 1969 Sales Tax Assessing Officer Apr 06 to Dec 06 1.04 0.83
Kerala Sales tax Act, 1963 Sales Tax State Tax Tribunal 1997-98 0.05 0.05
Kerala Sales tax Act, 1963 Sales Tax Deputy Commissioner, Sales Tax 1998-99 0.06 0.06
Madhya Pradesh Sales Tax CG Appellate Board 2000-01 0.48 0.31
Commercial Tax Act, 1994
Uttar Pradesh Trade Sales Tax Joint Commissioner (Appeals) 2003-2012 3.11 1.01
Tax Act, 1948
Delhi Value Added Sales Tax State Tax Tribunal 2007-08 14.05 11.84
Tax Act, 2004
Kerala VAT Act, 2003 Sales Tax Deputy Commissioner Appeals 2009-10, 2011-12 0.94 0.94
Kerala VAT Act, 2003 Sales Tax Kerala High Court 2011-12 65.47 65.47
Kerala VAT Act, 2003 Sales Tax Assistant Commissioner, Sales tax 2011-12 1.38 1.38
Kerala VAT Act, 2003 Sales Tax Commercial Tax Officer 2010-11 51.49 51.49
Maharashtra Value Sales Tax Deputy Commissioner, Sales Tax 2011-12 15.15 15.15
Added Tax Act, 2002
Maharashtra Value Added Sales Tax Joint Commissioner (Appeals) 2008-09 308.43 308.42
Tax Act, 2002
Name of Statute Nature of Forum where Period to Amount Amount
Dues Dispute is Pending which the Involved Unpaid
Amount Relates (` in Mn) (` in Mn)

C K
106 Idea Cellular Limited
Standalone Financial StatementsIndependent Auditors’ Report
Name of Statute Nature of Forum where Period to Amount Amount
Dues Dispute is Pending which the Involved Unpaid
Amount Relates (` in Mn) (` in Mn)
Rajasthan Value Added Sales Tax Assistant Commissioner, 2011-12, 2013-14 11.64 11.19
Tax Act, 2003 Sales tax
The Bihar Value Added Sales Tax State Tax Tribunal 2008-14 34.01 22.03
Tax Act, 2005
The Bihar Value Added Sales Tax Commissioner 2016-17 1.36 1.36
Tax Act, 2005
The Bihar Value Added Sales Tax Joint Commissioner (Appeals) 2014-15 6.69 4.00
Tax Act, 2005
Uttar Pradesh Trade Sales Tax State Tax Tribunal 2006-08 0.69 0.58
Tax Act, 1948
Uttar Pradesh Trade Tax Sales Tax Assessing Officer 2008-10, 2011-12, 20.50 17.40
Act, 1948 2013-14
The Jammu & Kashmir Sales Tax Srinagar High Court 2009-17 510.15 510.15
General Sales Tax Act, 1962
Uttar Pradesh Trade Tax Sales Tax Assessing Officer 2009-10 0.07 -
Act, 1948 (UTTRAKHAND
AMENDEMENT)
Uttar Pradesh Value Sales Tax Deputy Commissioner, Sales Tax 2006-07, Apr 12 2.67 1.54
Added Tax Act, 2008 to Jul 12
Uttar Pradesh Value Sales Tax High Court Allahabad 2007-08 0.71 -
Added Tax Act, 2008
Uttar Pradesh Value Sales Tax Additional Commissioner 2011-2013 11.85 9.98
Added Tax Act, 2008 (Appeals)
The Finance Act, 1994 Service Tax Andhra Pradesh High Court 2003-04 25.15 25.15
The Finance Act, 1994 Service Tax Customs Excise & Service Tax 2003-2012 and 2,654.03 2,534.16
Appellate Tribunal 2013-2015
The Finance Act, 1994 Service Tax High Court, Mumbai 2004-2006, 290.56 4.64
2007-2010
The Finance Act, 1994 Service Tax Punjab & Haryana High Court Oct 1998- Mar 99, 14.56 14.56
2002-2003, 2004-07
The Finance Act, 1994 Service Tax Commissioner of Central Excise 2004-05, Apr 05 41.98 36.98
& Service Tax to Sep 07
The Finance Act, 1994 Service Tax Commissioner of Central Excise 1999-01, Apr 03 to 15.18 14.71
& Service Tax (Appeals) Sep 03, 2005-2012

C K
Annual Report 2016-17 107
Standalone Financial Statements
(viii) In our opinion and according to the information and
explanations given to us, the Company has not defaulted
in the repayment of loans or borrowings to financial
institutions, banks and government and dues to
debenture holders.
(ix) During the current year, the Company has not raised
moneys by way of initial public offer or further public
offer (including debt instruments). In our opinion and
according to the information and explanations given to
us, the term loans have been applied by the Company
during the year for the purposes for which they were
raised, other than temporary deployment pending
application of proceeds.
(x) To the best of our knowledge and according to the
information and explanations given to us, no fraud by
the Company and no material fraud on the Company
by its officers or employees has been noticed or reported
during the year.
(xi) According to the information and explanations given to
us, the Company has paid/accrued remuneration
amounting to ̀ 100.46 million to its Managing Director,
Mr. Himanshu Kapania. As the Company did not have
profits in the financial year ended March 31, 2017, an
amount of ` 30.54 Mn is in excess of the limits specified
in section 197 of Companies Act, 2013 (‘the Act’) read
with Schedule V thereto. The Company is in the process
of complying with the statutory requirements prescribed
to regularise such excess payments, including seeking
approval of shareholders / central government, as
necessary.
(xii) The Company is not a Nidhi Company and hence
reporting under clause (xii) of the Order is not applicable.
Independent Auditors’ Report
(xiii) In our opinion and according to the information and
explanations given to us, the Company is in compliance
with Section 188 and 177 of the Companies Act, 2013,
for all transactions with the related parties and the details
of related party transactions have been disclosed in the
financial statements etc. as required by the applicable
accounting standards.
(xiv) During the year, the Company has not made any
preferential allotment or private placement of shares or
fully or partly convertible debentures and hence
reporting under clause (xiv) of the Order is not applicable
to the Company.
(xv) In our opinion and according to the information and
explanations given to us, during the year, the Company
has not entered into any non-cash transactions with its
directors, directors of subsidiary companies, directors
of associate company or persons connected with them
and hence provisions of section 192 of the Companies
Act, 2013 are not applicable.
(xvi) The Company is not required to be registered under
section 45-IA of the Reserve Bank of India Act, 1934.
For Deloitte Haskins & Sells LLPChartered AccountantsFirm’s Registration No. 117366W / W-100018
Hemant M. JoshiPartnerMembership No: 38019
Place : Mumbai
Date : May 13, 2017
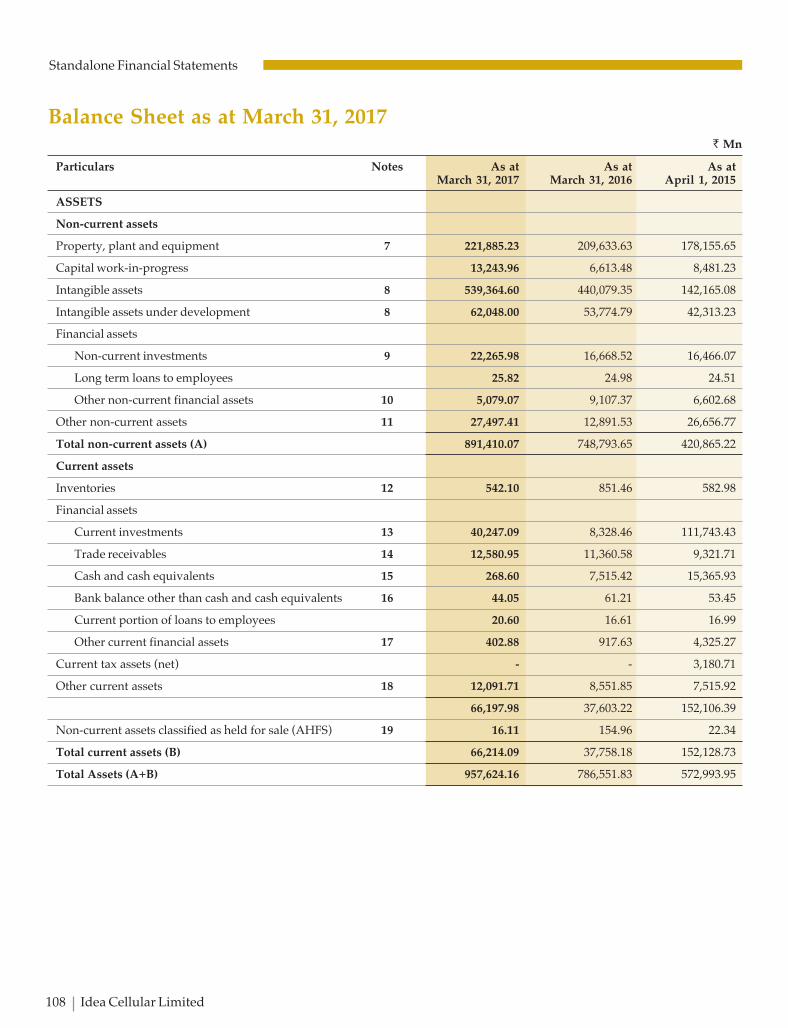
C K
108 Idea Cellular Limited
Standalone Financial Statements
Balance Sheet as at March 31, 2017` Mn
Particulars Notes As at As at As atMarch 31, 2017 March 31, 2016 April 1, 2015
ASSETS
Non-current assets
Property, plant and equipment 7 221,885.23 209,633.63 178,155.65
Capital work-in-progress 13,243.96 6,613.48 8,481.23
Intangible assets 8 539,364.60 440,079.35 142,165.08
Intangible assets under development 8 62,048.00 53,774.79 42,313.23
Financial assets
Non-current investments 9 22,265.98 16,668.52 16,466.07
Long term loans to employees 25.82 24.98 24.51
Other non-current financial assets 10 5,079.07 9,107.37 6,602.68
Other non-current assets 11 27,497.41 12,891.53 26,656.77
Total non-current assets (A) 891,410.07 748,793.65 420,865.22
Current assets
Inventories 12 542.10 851.46 582.98
Financial assets
Current investments 13 40,247.09 8,328.46 111,743.43
Trade receivables 14 12,580.95 11,360.58 9,321.71
Cash and cash equivalents 15 268.60 7,515.42 15,365.93
Bank balance other than cash and cash equivalents 16 44.05 61.21 53.45
Current portion of loans to employees 20.60 16.61 16.99
Other current financial assets 17 402.88 917.63 4,325.27
Current tax assets (net) - - 3,180.71
Other current assets 18 12,091.71 8,551.85 7,515.92
66,197.98 37,603.22 152,106.39
Non-current assets classified as held for sale (AHFS) 19 16.11 154.96 22.34
Total current assets (B) 66,214.09 37,758.18 152,128.73
Total Assets (A+B) 957,624.16 786,551.83 572,993.95
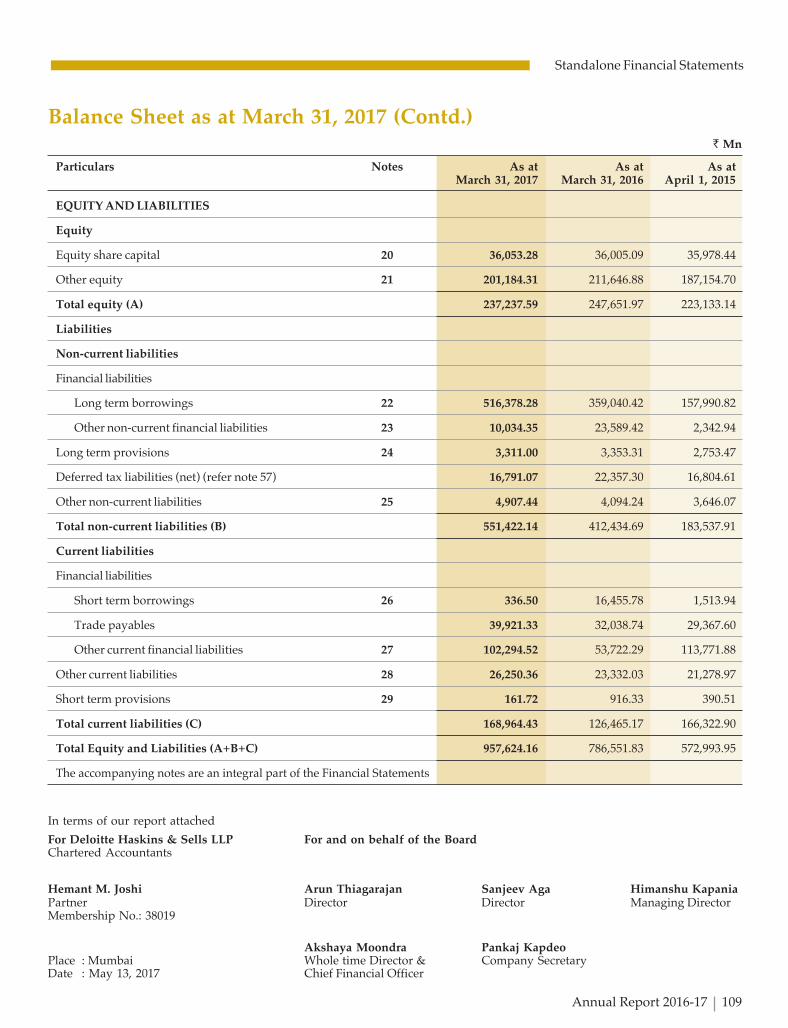
C K
Annual Report 2016-17 109
Standalone Financial Statements
In terms of our report attached
For Deloitte Haskins & Sells LLP For and on behalf of the BoardChartered Accountants
Hemant M. Joshi Arun Thiagarajan Sanjeev Aga Himanshu KapaniaPartner Director Director Managing DirectorMembership No.: 38019
Akshaya Moondra Pankaj KapdeoPlace : Mumbai Whole time Director & Company SecretaryDate : May 13, 2017 Chief Financial Officer
EQUITY AND LIABILITIES
Equity
Equity share capital 20 36,053.28 36,005.09 35,978.44
Other equity 21 201,184.31 211,646.88 187,154.70
Total equity (A) 237,237.59 247,651.97 223,133.14
Liabilities
Non-current liabilities
Financial liabilities
Long term borrowings 22 516,378.28 359,040.42 157,990.82
Other non-current financial liabilities 23 10,034.35 23,589.42 2,342.94
Long term provisions 24 3,311.00 3,353.31 2,753.47
Deferred tax liabilities (net) (refer note 57) 16,791.07 22,357.30 16,804.61
Other non-current liabilities 25 4,907.44 4,094.24 3,646.07
Total non-current liabilities (B) 551,422.14 412,434.69 183,537.91
Current liabilities
Financial liabilities
Short term borrowings 26 336.50 16,455.78 1,513.94
Trade payables 39,921.33 32,038.74 29,367.60
Other current financial liabilities 27 102,294.52 53,722.29 113,771.88
Other current liabilities 28 26,250.36 23,332.03 21,278.97
Short term provisions 29 161.72 916.33 390.51
Total current liabilities (C) 168,964.43 126,465.17 166,322.90
Total Equity and Liabilities (A+B+C) 957,624.16 786,551.83 572,993.95
The accompanying notes are an integral part of the Financial Statements
Balance Sheet as at March 31, 2017 (Contd.)` Mn
Particulars Notes As at As at As atMarch 31, 2017 March 31, 2016 April 1, 2015

C K
110 Idea Cellular Limited
Standalone Financial Statements
Statement of Profit and Loss for the year ended March 31, 2017` Mn
Particulars Notes For the year ended For the year endedMarch 31, 2017 March 31, 2016
INCOME
Service revenue 352,565.12 357,725.12
Other operating income 30 221.34 311.78
Revenue from operations 352,786.46 358,036.90
Other income 31 1,970.25 1,773.43
TOTAL INCOME 354,756.71 359,810.33
OPERATING EXPENDITURE
Employee benefit expenses 32 16,256.38 14,735.23
Network expenses and IT outsourcing cost 33 106,648.54 92,655.82
License fees and spectrum usage charges 34 40,514.83 41,507.83
Roaming and access charges 35 42,754.44 46,653.46
Subscriber acquisition and servicing expenditure 36 31,441.66 30,019.48
Advertisement and business promotion expenditure 4,554.02 4,833.19
Administration and other expenses 37 9,668.17 8,686.00
251,838.04 239,091.01
PROFIT BEFORE FINANCE CHARGES, DEPRECIATION,AMORTISATION AND TAXES 102,918.67 120,719.32
Finance costs 38 40,108.53 17,778.52
Depreciation 7 48,642.82 47,716.68
Amortisation 8 28,357.35 14,515.61
PROFIT/(LOSS) BEFORE TAX (14,190.03) 40,708.51
Tax expense:
- Current tax 56 - 8,621.82
- Deferred tax 56 (5,879.28) 5,623.81
PROFIT/(LOSS) AFTER TAX (8,310.75) 26,462.88
OTHER COMPREHENSIVE INCOME / (LOSS)
Items not to be reclassified to profit or loss in subsequent periods:
Re-measurement gains/ (losses) of defined benefit plans 53 (49.49) (205.48)
Income tax effect 17.13 71.11
Other comprehensive income / (loss) for the year, net of tax (32.36) (134.37)
TOTAL COMPREHENSIVE INCOME / (LOSS) FOR THE YEAR (8,343.11) 26,328.51
Earnings per equity share (in `): 58
Basic (2.31) 7.35
Diluted (2.31) 7.33
The accompanying notes are an integral part of the Financial Statements
In terms of our report attached
For Deloitte Haskins & Sells LLP For and on behalf of the BoardChartered Accountants
Hemant M. Joshi Arun Thiagarajan Sanjeev Aga Himanshu KapaniaPartner Director Director Managing DirectorMembership No.: 38019
Akshaya Moondra Pankaj KapdeoPlace : Mumbai Whole time Director & Company SecretaryDate : May 13, 2017 Chief Financial Officer
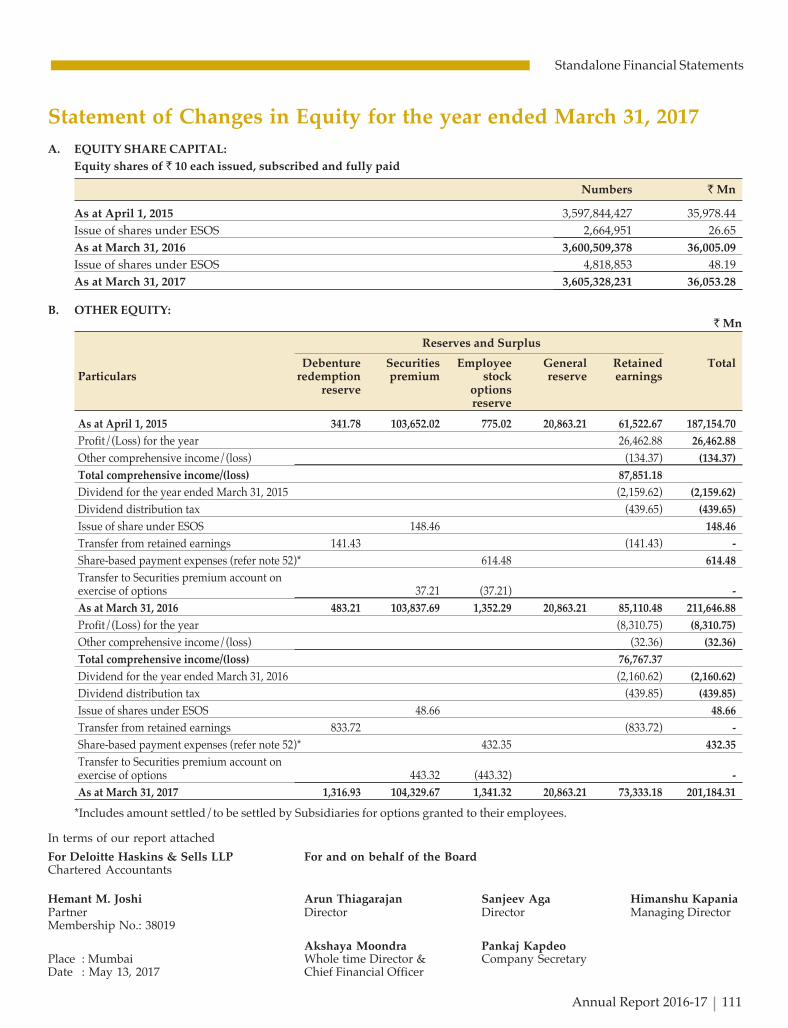
C K
Annual Report 2016-17 111
Standalone Financial Statements
A. EQUITY SHARE CAPITAL:
Equity shares of ` 10 each issued, subscribed and fully paid
Numbers ` Mn
As at April 1, 2015 3,597,844,427 35,978.44
Issue of shares under ESOS 2,664,951 26.65
As at March 31, 2016 3,600,509,378 36,005.09
Issue of shares under ESOS 4,818,853 48.19
As at March 31, 2017 3,605,328,231 36,053.28
B. OTHER EQUITY:` Mn
Reserves and Surplus
Debenture Securities Employee General Retained TotalParticulars redemption premium stock reserve earnings
reserve optionsreserve
As at April 1, 2015 341.78 103,652.02 775.02 20,863.21 61,522.67 187,154.70
Profit/(Loss) for the year 26,462.88 26,462.88
Other comprehensive income/(loss) (134.37) (134.37)
Total comprehensive income/(loss) 87,851.18
Dividend for the year ended March 31, 2015 (2,159.62) (2,159.62)
Dividend distribution tax (439.65) (439.65)
Issue of share under ESOS 148.46 148.46
Transfer from retained earnings 141.43 (141.43) -
Share-based payment expenses (refer note 52)* 614.48 614.48
Transfer to Securities premium account onexercise of options 37.21 (37.21) -
As at March 31, 2016 483.21 103,837.69 1,352.29 20,863.21 85,110.48 211,646.88
Profit/(Loss) for the year (8,310.75) (8,310.75)
Other comprehensive income/(loss) (32.36) (32.36)
Total comprehensive income/(loss) 76,767.37
Dividend for the year ended March 31, 2016 (2,160.62) (2,160.62)
Dividend distribution tax (439.85) (439.85)
Issue of shares under ESOS 48.66 48.66
Transfer from retained earnings 833.72 (833.72) -
Share-based payment expenses (refer note 52)* 432.35 432.35
Transfer to Securities premium account onexercise of options 443.32 (443.32) -
As at March 31, 2017 1,316.93 104,329.67 1,341.32 20,863.21 73,333.18 201,184.31
*Includes amount settled/to be settled by Subsidiaries for options granted to their employees.
Statement of Changes in Equity for the year ended March 31, 2017
In terms of our report attached
For Deloitte Haskins & Sells LLP For and on behalf of the BoardChartered Accountants
Hemant M. Joshi Arun Thiagarajan Sanjeev Aga Himanshu KapaniaPartner Director Director Managing DirectorMembership No.: 38019
Akshaya Moondra Pankaj KapdeoPlace : Mumbai Whole time Director & Company SecretaryDate : May 13, 2017 Chief Financial Officer
C K
112 Idea Cellular Limited
Standalone Financial Statements
Notes forming part of the Financial Statements
1. CORPORATE INFORMATION
Idea Cellular Limited (‘the Company’), a public companydomiciled in India was incorporated on March 14, 1995. It isa part of the Aditya Birla Group and its shares are listed onthe National Stock Exchange (NSE) and Bombay StockExchange (BSE) in India (Scrip Code BSE :532822; NSE:IDEA).The Company is amongst the top three telecom serviceproviders in India with pan India operations. It is engagedin the business of Mobility and Long Distance services.
The financial statements for the year ended March 31, 2017were approved by the Board of Directors and authorised forissue on May 13, 2017.
2. BASIS OF PREPARATION AND STATEMENT OFCOMPLIANCE
The financial statements of the Company comprising ofBalance Sheet, Statement of Profit and Loss, Statement ofchanges in Equity and Statement of Cash Flows together withthe notes have been prepared in accordance with IndianAccounting Standards (Ind AS) notified under the Companies(Indian Accounting Standards) Rules, 2015.
For all periods up to and including the year ended March 31,2016, the Company prepared its financial statements inaccordance with accounting standards notified under section133 of the Companies Act, 2013 (Previous GAAP).
The financial statements for the financial year endedMarch 31, 2017 are the Company’s first Ind AS compliantannual financial statements with comparative figures for theyear ended March 31, 2016 also under Ind AS. The date oftransition is April 1, 2015. Please refer to note 5 for detaileddisclosure on the first time adoption of Ind AS.
These financial statements have been prepared on a historicalcost basis, except for certain financial instruments that havebeen measured at fair values at the end of each reportingperiod, as explained in the accounting policies below.
Historical cost is generally based on the fair value of theconsideration given in exchange for goods and services onthe transaction date.
All assets and liabilities have been classified as current ornon-current in accordance with the operating cycle criteriaset out in Ind AS 1 and Schedule III to the CompaniesAct, 2013.
Deferred tax assets (including MAT credit entitlement) andliabilities are classified as non-current assets and liabilities.
3. SIGNIFICANT ACCOUNTING POLICIES
a) Revenue recognition
Revenue is recognised to the extent it is probable that theeconomic benefits will flow to the Company and can bereliably measured, regardless of the timing of receipt ofpayment. Revenue is measured at fair value of theconsideration received or receivable and is reduced forrebates and other similar allowances. Taxes and duties arecollected by the seller / service provider to be deposited withthe government and not received by the Company on its own
account. Accordingly, it is excluded from revenue. TheCompany evaluates its exposure to significant risks andreward associated with the revenue arrangements in orderto determine its position of a principal or an agent in thisregard.
i. Service Revenue
Revenue on account of telephony services (postpaid andprepaid categories, roaming, interconnect & longdistance services) is recognised on rendering of services.Rental revenues in the postpaid category are recognisedover the period of rendering of services. Recharge feeson recharge vouchers in case of prepaid category isrecognised over the validity of such vouchers.
Revenue from other services (internet services, mobileadvertisement, revenue from toll free services, etc.) isrecognised on rendering of services.
Multiple element contracts:
For revenue arrangements having more than onedeliverable, at the inception of the arrangement, theCompany evaluates all deliverables in the arrangementto determine whether they represent separatelyidentifiable components. Deliverables are considered forseparate components if the following two conditions aremet: (i) the deliverable has value to the customer on astand-alone basis and (ii) there is evidence of the fairvalue of the item. The total arrangement considerationis allocated to each separate component based on itsrelative fair value.
Revenue from passive infrastructure is recognised onaccrual basis as per the contractual terms.
ii. Indefeasible Right to Use (IRU)
The Company enters into agreements which entitle itscustomers the right to use of specified capacity of darkfibre / bandwidth capacity for a specific period of time.Under such arrangements, the rights to use the specifiedassets are given for a substantial part of the estimateduseful life of such assets.
The contracted price received upfront in advance istreated as deferred revenue and is recognised on astraight line basis over the agreement period.
iii. Unbilled Income
Unbilled income represents the value of servicesrendered but not yet been invoiced on the reporting datedue to contractual terms.
iv. Interest Income
Interest income from a financial asset is recognised whenit is probable that the economic benefits will flow to theCompany and the amount of income can be measuredreliably. Interest income is recorded using the applicableEffective Interest Rate (EIR), which is the rate that exactlydiscounts estimated future cash receipts over theexpected life of the financial asset to that asset’s netcarrying amount on initial recognition.
C K
Annual Report 2016-17 113
Standalone Financial Statements
Notes forming part of the Financial Statements
v. Dividends
Dividend Income is recognised when the Company’sright to receive the payment is established.
b) Leases
The Company evaluates whether an arrangement is (orcontains) a lease based on the substance of the arrangementat the inception of the lease. An arrangement which isdependent on the use of a specific asset or assets and conveysa right to use the asset or assets, even if it is not explicitlyspecified in an arrangement is (or contains) a lease.
Leases are classified as finance lease whenever the terms ofthe lease transfer substantially all the risks and rewards ofownership to the lessee. All other leases are classified asoperating leases.
i. Company as a lessee
Finance lease:
Assets held under finance leases are initially recognisedas assets at the commencement of the lease at their fairvalue or, if lower, at the present value of the minimumlease payments. Lease payments are apportionedbetween finance charges and reduction of the leaseliability so as to achieve a constant rate of interest on theremaining balance of the liability. Finance charges arerecognised in the statement of profit and loss, unless theyare directly attributable to qualifying assets, in which casethey are capitalised in accordance with the Company’sgeneral policy on borrowing costs. Such assets aredepreciated / amortised over the period of lease orestimated useful life of the assets whichever is less.Contingent rentals are recognised as expenses in theperiods in which they are incurred.
Operating lease:
Operating lease payments are recognised as an expensein the statement of profit and loss on a straight line basisunless payments to the lessor are structured to increasein line with expected general inflation to compensate forthe lessor’s expected inflationary cost increase; suchincreases are recognised in the year in which suchbenefits accrue. Contingent rentals arising, if any, underoperating leases are recognised as an expense in theperiod in which they are incurred.
In the event that lease incentives are received to enterinto operating leases, such incentives are recognised asa liability. The aggregate benefit of incentives isrecognised as a reduction of rental expense on a straight-line basis, except where another systematic basis is morerepresentative of the time pattern in which economicbenefits from the leased asset are consumed.
ii. Company as a lessor
Finance lease:
Amounts due from lessees under finance leases arerecognised as receivables at the amount of theCompany’s net investment in the leases. Finance lease
income is allocated to accounting period so as to reflect aconstant periodic rate of return on the net investmentoutstanding in respect of the lease.
Operating lease:
Rental income from operating lease is recognised on astraight line basis over the lease term unless paymentsto the Company are structured to increase in line withexpected general inflation to compensate for theCompany’s expected inflationary cost increase; suchincreases are recognised in the year in which suchbenefits accrue. Initial direct costs incurred in negotiatingand arranging an operating lease are added to thecarrying amount of the leased asset and recognised on astraight line basis over the lease term. Contingent rentsare recognised as revenue in the period in which theyare earned.
c) Employee benefits
i. Retirement Benefits
Contributions to Provident and Pension funds arefunded with the appropriate authorities and charged tothe Statement of Profit and Loss when the employeeshave rendered service entitling them to the contributions.
Contributions to Superannuation are funded with theLife Insurance Corporation of India and charged to theStatement of Profit and Loss when the employees haverendered service entitling them to the contributions.
The Company operates a defined benefit gratuity plan,which requires contributions to be made to a separatelyadministered fund with the Life Insurance Corporationof India. The cost of providing benefits under the definedbenefit plan is determined using the projected unit creditmethod, with actuarial valuations being carried out atperiodic intervals.
Re-measurements, comprising of actuarial gains andlosses and the return on plan assets (excluding amountsincluded in net interest on the net defined benefitliability), are recognised immediately in the balance sheetwith a corresponding charge or credit to OtherComprehensive Income (OCI) in the period in which theyoccur. Re-measurements are not reclassified to statementof profit and loss in subsequent periods.
Net interest is calculated by applying the discount rateto the net defined benefit liability or asset. The Companyrecognises the following changes in the net definedbenefit obligation as an expense in the statement of profitand loss:
• Service costs; and
• Net interest expense or income
ii. Short-term and other long-term employee benefits
A liability is recognised for benefits accruing to employeesin respect of salaries, wages and other short termemployee benefits in the period the related service isrendered at the undiscounted amount of the benefitsexpected to be paid in exchange for that service.
C K
114 Idea Cellular Limited
Standalone Financial Statements
Notes forming part of the Financial Statements
Provision for leave benefits to employees is based onactuarial valuation done by projected accrued benefitmethod at the reporting date.
iii. Share- based payments
Equity-settled share-based payments to employees aremeasured at the fair value of the equity instruments atthe grant date.
The fair value determined at the grant date of the equity-settled share-based payments is expensed on a straight-line basis over the vesting period, based on theCompany’s estimate of equity instruments that willeventually vest, with a corresponding increase in equity.At the end of each reporting period, the Company revisesits estimate of the number of equity instruments expectedto vest. The impact of the revision of the originalestimates, if any, is recognised in the statement of profitand loss such that the cumulative expense reflects therevised estimate, with a corresponding adjustment to theequity-settled employee benefits reserve.
In respect of re-pricing of existing stock option, theincremental fair value of the option on the date ofre-pricing is accounted for as employee cost over theremaining vesting period.
d) Annual Revenue Share License Fees – and Spectrum UsageCharges
The variable license fees and annual spectrum usage charges,computed at prescribed rates of revenue share, are chargedto the Statement of Profit and Loss in the period in which therelated revenue arises. Revenue for this purpose compriseof adjusted gross revenue as per the license agreement ofthe licensed service area.
e) Foreign currency transactions
The Company’s financial statements are presented in IndianRupees (INR) which is also the Company’s functionalcurrency.
Transactions in foreign currencies are initially recorded atthe INR spot rate on the date the transaction first qualifiesfor recognition. Monetary assets and liabilities denominatedin foreign currencies are translated at the functional currencyspot rates of exchange on the reporting date.
• Exchange differences arising on settlement or translationof monetary items are recognised in the statement ofprofit and loss except for the exemptions mentioned inNote 5 relating to first time adoption.
Non-monetary items that are measured in terms of historicalcost in a foreign currency are recognised using the exchangerates at the dates of the initial transactions.
f) Exceptional items
Items of income or expense from ordinary activities whichare non-recurring and are of such size, nature or incidencethat their separate disclosure is considered necessary toexplain the performance of the Company are disclosed asExceptional items in the Statement of Profit & Loss.
g) Taxes
Income tax expense represents the sum of current tax anddeferred tax.
i. Current income tax
Current income tax assets and liabilities are measured atthe amount expected to be recovered from or paid tothe taxation authorities. Current income tax is based onthe taxable income and calculated using the applicabletax rates and tax laws. The tax rates and tax laws usedto compute the amount are those that are enacted orsubstantively enacted, at the reporting date.
Current income tax relating to items recognised outsideprofit or loss is recognised outside profit or loss incorrelation to the underlying transaction either in OCIor directly in equity.
ii. Deferred tax
Deferred tax is recognised on temporary differencesbetween the carrying amounts of assets and liabilities inthe financial statements and the corresponding tax basesused in the computation of taxable profit. Deferred taxassets are generally recognised for all deductibletemporary differences to the extent it is probable thattaxable profits will be available against which thosedeductible temporary differences can be utilised.
Deferred tax liabilities are recognised for taxabletemporary differences associated with investments insubsidiaries and associates, and interests in jointventures, except where the Company is able to controlthe reversal of the temporary difference and it is probablethat the temporary difference will not reverse in theforeseeable future.
The carrying amount of deferred tax assets is reviewedat the end of each reporting date and reduced to theextent it is no longer probable that sufficient taxable profitwill be available to allow the benefit of part or that entiredeferred tax asset to be utilised. Unrecognized deferredtax assets are re-assessed at the end of each reportingdate and are recognised to the extent it has becomeprobable that future taxable profits will allow thedeferred tax asset to be recovered.
Deferred tax assets and liabilities are measured at thetax rates that are expected to apply in the year when theasset is realised or the liability is settled, based on taxrates and tax laws that have been enacted orsubstantively enacted at the reporting date.
Deferred tax relating to items recognised outside profitor loss is recognised outside profit or loss in correlationto the underlying transaction either in OCI or directly inequity.
Deferred tax assets and deferred tax liabilities are offsetif a legally enforceable right exists to set off current taxassets against current tax liabilities and the deferred taxesrelate to the same taxable entity and the same taxationauthority.

C K
Annual Report 2016-17 115
Standalone Financial Statements
h) Current / Non – Current Classification
An asset is classified as current when
a) It is expected to be realized or consumed in theCompany’s normal operating cycle;
b) It is held primarily for the purpose of trading;
c) It is expected to be realized within twelve months afterthe reporting period; or
d) If it is cash or cash equivalent, unless it is restricted frombeing exchanged or used to settle a liability for at leasttwelve months after the reporting period.
Any asset not conforming to the above is classified as non-current.
A liability is classified as current when
a) It is expected to be settled in the normal operating cycleof the Company;
b) It is held primarily for the purposes of trading;
c) It is expected to be settled within twelve months afterthe reporting period; or
d) The Company has no unconditional right to defer thesettlement of the liability for at least twelve months afterthe reporting period.
Any liability not conforming to the above is classified as non-current.
i) Property, Plant and Equipment
Property, Plant and Equipment (PPE) and Capital work inprogress held for use in the rendering of services and supplyof goods, or for administrative purposes, are stated at costless accumulated depreciation and accumulated impairmentlosses, if any. Cost includes all direct costs relating toacquisition and installation of Property, Plant and Equipmentand borrowing cost relating to qualifying assets. Whensignificant parts of plant and equipment are required to bereplaced at intervals, the Company depreciates themseparately based on their specific useful lives. Subsequentcosts are included in the assets carrying amount or recognisedas a separate asset, as appropriate, only when it is probablethat future economic benefits associated with the item willflow to the Company and the cost can be measured reliably.All other repair and maintenance costs are recognised in thestatement of profit and loss as incurred. The present value ofthe expected cost for the decommissioning of an asset afterits use is included in the cost of the respective asset if therecognition criteria for a provision are met.
Freehold Land is not depreciated. Depreciation on otherassets is provided using straight-line method on pro rata basisover their estimated useful economic lives as given below.The useful life is taken as prescribed in Schedule II to theCompanies Act, 2013 except where the estimated usefuleconomic life has been assessed to be lower based on technicalobsolescence, nature of assets, estimated usage of the assets,operating conditions of the asset and manufacturerswarranties, maintenance and support period, etc.
Particulars Estimated useful life (in years)
Buildings 9 to 30
Network Equipments 7 to 13
Optical Fibre 15
Other Plant and Equipment 5
Office Equipments 3 to 5
Computers 3
Furniture and Fixtures 3 to 10
Motor Vehicles Up to 5
An item of property, plant and equipment and any significantpart which meets the criteria for Asset held for sale will bereclassified from property, plant and equipment to Asset heldfor sale. When any significant part of property, plant andequipment is discarded or replaced, the carrying value ofdiscarded / replaced part is derecognized. Any gains or lossesarising from retirement or disposal of property, plant andequipment are determined as the difference between the netdisposal proceeds and the carrying amount of the asset andare recognized in the statement of profit and loss on the dateof retirement or disposal.
j) Intangible Assets
Intangible assets acquired separately are measured on initialrecognition at cost. Cost includes all direct costs relating toacquisition of Intangible assets and borrowing cost relatingto qualifying assets. Subsequently, intangible assets arecarried at cost less any accumulated amortisation andaccumulated impairment losses. Internally generatedintangibles are not capitalised and the related expenditure isreflected in the statement of profit and loss in the period inwhich the expenditure is incurred.
The useful lives of intangible assets are assessed as eitherfinite or indefinite. There are no intangible assets assessedwith indefinite useful life.
Intangible assets with finite lives are amortised over the usefuleconomic life. The amortisation period and the amortisationmethod for an intangible asset with a finite useful life arereviewed at least at the end of each year. Changes in theexpected useful life or the expected pattern of consumptionof future economic benefits embodied in the asset areconsidered to modify the amortisation period or method, asappropriate, and are treated as changes in accountingestimates. The amortisation expense on intangible assets withfinite lives is recognised in the statement of profit and lossunless such expenditure forms part of carrying value ofanother asset.
Intangible assets are amortised on straight line method asunder:
• Cost of spectrum and licenses is amortised on straightline method on commencement of operations over theunexpired period of the license/ spectrum.
• Software, which is not an integral part of hardware, istreated as an intangible asset and is amortised over itsuseful economic life as estimated by the managementbetween 3 to 5 years.
Notes forming part of the Financial Statements

C K
116 Idea Cellular Limited
Standalone Financial Statements
• Payment for Bandwidth capacities acquired underIndefeasible Right to Use (IRU) basis is accounted for asintangible assets and the cost is amortised over the periodof the agreement.
Gains or losses arising from derecognition of an intangibleasset are measured as the difference between the net disposalproceeds and the carrying amount of the asset and arerecognised in the statement of profit and loss when the assetis derecognised.
k) Non – Current Assets Held for sale
Non-current assets and disposal groups are classified as heldfor sale if their carrying amount will be recovered principallythrough a sale transaction rather than through continuinguse and its sale is highly probable. The sale is consideredhighly probable only when the asset or disposal groups isavailable for immediate sale in its present condition, it isunlikely that the sale will be withdrawn and the sale isexpected to be completed within one year from the date ofclassification. Non-current assets and disposal groupsclassified as held for sale are measured at the lower of theircarrying amount and fair value less costs to sell. These arenot depreciated or amortised once classified as held for sale.
Non-current assets that ceases to be classified as held for saleare measured at lower of (i) its carrying amount before theasset was classified as held for sale, adjusted for depreciationthat would have been recognised had that asset not beenclassified as held for sale, and (ii) its recoverable amount atthe date when the disposal group ceases to be classified asheld for sale.
l) Impairment of Non – Financial Assets
Tangible and Intangible assets which are subject todepreciation or amortisation are reviewed for impairment,whenever events or changes in circumstances indicate thatthe carrying amount of such assets may not be recoverable.If any such indication exists, the recoverable amount of theasset is estimated in order to determine the extent of theimpairment loss (if any). When it is not possible to estimatethe recoverable amount of an individual asset, the Companyestimates the recoverable amount of the cash-generating unitto which the asset belongs.
Recoverable amount is the higher of fair value less costs ofdisposal and value in use. In assessing value in use, theestimated future cash flows are discounted to their presentvalue using a pre-tax discount rate that reflects current marketassessments of the time value of money and the risks specificto the asset. If the recoverable amount of an asset (or cash-generating unit) is estimated to be less than its carryingamount, an impairment loss is recognised by reducing thecarrying amount of the asset (or cash-generating unit) to itsrecoverable amount.
Impairment losses recognized in the earlier periods areassessed at each reporting date for any indication that theloss has decreased or no longer exists. When an impairmentloss subsequently reverses, the carrying amount of the asset(or a cash-generating unit) is increased to the revised estimate
of its recoverable amount, but so that the increased carryingamount does not exceed the carrying amount that wouldhave been determined had such impairment loss not beenrecognised for the asset (or cash-generating unit) in prioryears. Any reversal of an impairment loss is recognisedimmediately in statement of profit and loss.
m) Borrowing Costs
Borrowing Costs directly attributable to the acquisition orconstruction of an asset that necessarily takes a substantialperiod of time to get ready for its intended use or sale arecapitalised as part of the cost of the asset. All other borrowingcosts are expensed in the period in which they are incurred.Borrowing costs consist of interest and other costs that anentity incurs in connection with the borrowing of funds.Interest income earned on the temporary investment ofspecific borrowings pending their expenditure on qualifyingassets is deducted from the borrowing costs eligible forcapitalisation. Borrowing cost also includes exchangedifferences to the extent regarded as an adjustment to theinterest costs.
n) Inventories
Inventories are valued at cost or net realisable value,whichever is lower. Cost is determined on weighted averagebasis and includes cost of purchase and other costs incurredin bringing inventories to their present location and condition.Net realisable value is the estimated selling price in theordinary course of business, less estimated costs ofcompletion and the estimated costs necessary to make thesale.
o) Cash and cash equivalents
Cash and cash equivalents in the balance sheet comprise ofcash at bank and on hand and short-term deposits with anoriginal maturity of three months or less, which are subjectto an insignificant risk of changes in value. For the purposeof the statement of cash flows, cash and cash equivalentsconsist of cash and short-term deposits, as defined above,net of outstanding bank overdrafts as they are consideredan integral part of the Company’s cash management.
p) Non-current Investments in subsidiaries and associates
Non-current Investments in subsidiaries and associates arestated at cost less provision for diminution in value otherthan temporary, if any.
q) Financial Instruments
Initial recognition and measurement
Financial Instruments (assets and liabilities) are recognisedwhen the Company becomes a party to a contract that givesrise to a financial asset of one entity and a financial liabilityor equity instrument of another entity.
Financial assets and financial liabilities are initially measuredat fair value. Transaction costs that are directly attributableto the acquisition or issue of financial assets and financialliabilities, other than those designated as fair value throughprofit or loss (FVTPL), are added to or deducted from thefair value of the financial assets or financial liabilities, as
Notes forming part of the Financial Statements
C K
Annual Report 2016-17 117
Standalone Financial Statements
appropriate, on initial recognition. Transaction costs directlyattributable to the acquisition of financial assets or financialliabilities at FVTPL are recognised immediately in statementof profit and loss.
i. Financial assets
All regular way purchase or sale of financial assets arerecognised and derecognised on a trade date basis.Regular way purchase or sales are purchases or sales offinancial assets that require delivery of assets within thetime frame established by regulation or convention inthe marketplace.
Subsequent measurement
All recognised financial assets are subsequentlymeasured in their entirety at either amortised cost or fairvalue, depending on the classification of the financialassets:
a) Financial assets measured at amortised cost
b) Financial assets measured at fair value through profitor loss (FVTPL)
c) Financial assets measured at fair value through othercomprehensive income (FVTOCI) – The Companydoes not have any assets classified as FVTOCI.
Financial assets measured at amortised cost
A financial asset is measured at amortised cost if boththe following conditions are met:
• The asset is held within a business model whoseobjective is to hold assets for collecting contractualcash flows, and
• Contractual terms of the instruments give rise onspecified dates to cash flows that are solely paymentsof principal and interest on the principal amountoutstanding.
After initial measurement, such financial assets aresubsequently measured at amortised cost using theEffective Interest Rate (EIR) method. EIR is the rate thatexactly discounts estimated future cash receipts(including all fees and points paid or received that forman integral part of the EIR, transaction costs and otherpremiums or discounts) through the expected life of thedebt instrument or where appropriate, a shorter period,to the net carrying amount on initial recognition.
The EIR amortisation is included in other income in thestatement of profit and loss. The losses arising fromimpairment are recognised in the statement of profit andloss. This category generally applies to trade and otherreceivables, loans, etc.
Financial assets measured at FVTPL
FVTPL is a residual category for financial assets in thenature of debt instruments. Financial assets includedwithin the FVTPL category are measured at fair valuewith all changes recognised in the statement of profitand loss. This category also includes derivative financial
instruments entered into by the Company that are notdesignated as hedging instruments in hedge relationshipsas defined by Ind AS 109.
Derecognition
A financial asset (or, where applicable, a part of a financialasset or part of a group of similar financial assets) isprimarily derecognised when:
• The rights to receive cash flows from the asset haveexpired, or
• The Company has transferred its rights to receivecash flows from the asset or has assumed anobligation to pay the received cash flows in fullwithout material delay to a third party under a ‘pass-through’ arrangement; and either
- the Company has transferred substantially allthe risks and rewards of the asset, or
- the Company has neither transferred norretained substantially all the risks and rewardsof the asset, but has transferred control of theasset.
Impairment of financial assets
In accordance with Ind AS 109, the Company appliesExpected Credit Loss (ECL) model for measurement andrecognition of impairment loss on the following financialassets and credit risk exposure:
• Debt instruments measured at amortised cost e.g.,loans and bank deposits
• Trade receivables
• Other Financial assets not designated as FVTPL
For recognition of impairment loss on other financialassets and risk exposure, the Company determineswhether there has been a significant increase in the creditrisk since initial recognition. If credit risk has notincreased significantly, 12-month ECL is used to providefor impairment loss. However, if credit risk has increasedsignificantly, lifetime ECL is used. If, in a subsequentperiod, credit quality of the instrument improves suchthat there is no longer a significant increase in credit risksince initial recognition, then the entity reverts torecognising impairment loss allowance based on12-month ECL.
ECL is the difference between all contractual cash flowsthat are due to the Company in accordance with thecontract and all the cash flows that the entity expects toreceive (i.e., all cash shortfalls), discounted at the originalEIR. Lifetime ECL are the expected credit losses resultingfrom all possible default events over the expected life ofa financial instrument. The 12-month ECL is a portion ofthe lifetime ECL which results from default events thatare possible within 12 months after the reporting date.
The Company follows ‘simplified approach’ forrecognition of impairment loss allowance on Tradereceivables (including lease receivables). The applicationof simplified approach does not require the Company
Notes forming part of the Financial Statements

C K
118 Idea Cellular Limited
Standalone Financial Statements
to track changes in credit risk. Rather, it recognisesimpairment loss allowance based on lifetime ECL at eachreporting date, right from its initial recognition.
ii. Financial liabilities
Subsequent measurement
All financial liabilities are subsequently measured atamortised cost using the EIR method or at FVTPL.
Financial liabilities at amortised cost
After initial recognition, interest-bearing borrowings andother payables are subsequently measured at amortisedcost using the EIR method. Gains and losses arerecognised in statement of profit and loss when theliabilities are derecognised as well as through the EIRamortisation process. Amortised cost is calculated bytaking into account any discount or premium onacquisition and fees or costs that are an integral part ofthe EIR. The EIR amortisation is included as finance costsin the statement of profit and loss.
Financial liabilities at FVTPL
Financial liabilities are classified as FVTPL when thefinancial liabilities are held for trading or are designatedas FVTPL on initial recognition. Financial liabilities areclassified as held for trading if they are incurred for thepurpose of repurchasing in the near term. This categoryalso includes derivative financial instruments enteredinto by the Company that are not designated as hedginginstruments in hedge relationships as defined by Ind AS109. Separated embedded derivatives are also classifiedas held for trading unless they are designated as effectivehedging instruments. Gains or losses on liabilities heldfor trading are recognised in the profit or loss.
De-recognition
A financial liability is de-recognised when the obligationunder the liability is discharged or cancelled or expires.
iii. Derivative financial instruments
The Company uses derivative financial instruments, suchas forward currency contracts and interest rate swaps,to manage its foreign currency risks and interest raterisks, respectively. These derivative instruments are notdesignated as cash flow, fair value or net investmenthedges and are entered into for period consistent withcurrency and interest exposures. Such derivativefinancial instruments are initially recognised at fair valueon the date on which a derivative contract is enteredinto and are subsequently re-measured at fair value atthe end of each reporting period. Derivatives are carriedas financial assets when the fair value is positive and asfinancial liabilities when the fair value is negative. Anygains or losses arising from changes in the fair value ofderivatives are taken directly to the statement of profitand loss.
Embedded derivatives
An embedded derivative is a component of a hybrid(combined) instrument that also includes a non-
derivative host contract – with the effect that some ofthe cash flows of the combined instrument vary in a waysimilar to a stand-alone derivative instrument. Anembedded derivative causes some or all of the cash flowsthat otherwise would be required by the contract to bemodified according to a specified interest rate, financialinstrument price, commodity price, foreign exchangerate, index of prices or rates, credit rating or credit index,or other variable, provided in the case of a non-financialvariable that the variable is not specific to a party to thecontract.
If the hybrid contract contains a host that is a financialasset within the scope of Ind AS 109, the Company doesnot separate embedded derivatives. Rather, it applies theclassification requirements contained in Ind AS 109 tothe entire hybrid contract. Derivatives embedded in allother host contracts are accounted for as separatederivatives and recorded at fair value if their economiccharacteristics and risks are not closely related to thoseof the host contracts and the host contracts are not heldfor trading or designated at fair value through profit orloss. These embedded derivatives are measured at fairvalue with changes in fair value recognised in profit orloss, unless designated as effective hedging instruments.
iv. Offsetting financial instruments
Financial assets and financial liabilities are offset and thenet amount is reported in the balance sheet if there is acurrently enforceable legal right to offset the recognisedamounts and there is an intention to settle on a net basisor to realise the assets and settle the liabilitiessimultaneously.
r) Fair value measurement
The fair value of an asset or a liability is measured using theassumptions that market participants would use whenpricing the asset or liability, assuming that market participantsact in their economic best interest.
The Company uses valuation techniques that are appropriatein the circumstances and for which sufficient data is availableto measure fair value, maximising the use of relevantobservable inputs and minimising the use of unobservableinputs.
All assets and liabilities for which fair value is measured ordisclosed in the financial statements are categorised withinthe fair value hierarchy, described as follows, based on thelowest level input that is significant to the fair valuemeasurement as a whole:
• Level 1 — Quoted (unadjusted) market prices in activemarkets for identical assets or liabilities
• Level 2 — Valuation techniques for which the lowestlevel input that is significant to the fair valuemeasurement is directly or indirectly observable
• Level 3 — Valuation techniques for which the lowestlevel input that is significant to the fair valuemeasurement is unobservable
Notes forming part of the Financial Statements
C K
Annual Report 2016-17 119
Standalone Financial Statements
For assets and liabilities that are recognised in the financialstatements on a recurring basis, the Company determineswhether transfers have occurred between levels in thehierarchy by re-assessing categorisation (based on the lowestlevel input that is significant to the fair value measurementas a whole) (a) on the date of the event or change incircumstances that caused the transfer or (b) at the end ofeach reporting period or (c) at the beginning of each reportingperiod.
s) Dividend distribution to equity holders
Dividends paid / payable along with applicable taxes arerecognised when it is approved by the shareholders. In caseof interim dividend it is recognised when it is approved bythe Board of Directors. A corresponding amount isaccordingly recognised directly in equity.
t) Earnings per share
The earnings considered in ascertaining the Company’sEarnings per share (EPS) is the net profit after tax. Thenumber of shares used in computing basic EPS is theweighted average number of shares outstanding during theperiod. The diluted EPS is calculated on the same basis asbasic EPS, after adjusting for the effects of potential dilutiveequity shares unless the effect of the potential dilutive equityshares is anti-dilutive.
u) Provisions and Contingent Liabilities
Provisions are recognised when the Company has a presentobligation (legal or constructive) as a result of a past event, itis probable that an outflow of resources embodying economicbenefits will be required to settle the obligation and a reliableestimate can be made of the amount of the obligation. Theexpense relating to a provision is presented in the statementof profit and loss.
If the effect of the time value of money is material, provisionsare discounted using a current pre-tax rate that reflects, whenappropriate, the risks specific to the liability. Whendiscounting is used, the increase in the provision due to thepassage of time is recognised as a finance cost.
i. Asset Retirement Obligation (ARO)
ARO is provided for those lease arrangements wherethe Company has a binding obligation to restore the saidlocation / premises at the end of the period in a conditionsimilar to inception of the arrangement. The restorationand decommissioning costs are provided at the presentvalue of expected costs to settle the obligation usingestimated cash flows and are recognised as part of thecost of the particular asset. The cash flows are discountedat a current pre-tax rate that reflects the risks specific tothe decommissioning liability. The unwinding of thediscount is expensed as incurred and recognised in thestatement of profit and loss as a finance cost. Theestimated future costs of decommissioning are reviewedannually and adjusted as appropriate. Changes in theestimated future costs or in the discount rate applied areadded to or deducted from the cost of the asset.
ii. Contingent Liabilities
A Contingent Liability is disclosed where there is apossible obligation or a present obligation that may, butprobably will not, require an outflow of resources.Contingent Assets are not recognised. Information oncontingent liabilities is disclosed in the notes to FinancialStatements unless the possibility of an outflow ofresources embodying economic benefits is remote.
v) Business Combinations
Business Combinations are accounted for using Ind AS 103Business Combination. Acquisitions of businesses areaccounted for using the acquisition method unless thetransaction is between entities under common control.Acquisition related costs are recognized in the statement ofprofit and loss as incurred. The acquiree’s identifiable assets,liabilities and contingent liabilities that meet the conditionsfor recognition are recognized at their respective fair valueat the acquisition date, except certain assets and liabilitiesrequired to be measured as per applicable standards.
Purchase consideration in excess of the Company’s interestin the acquiree’s net fair value of identifiable assets, liabilitiesand contingent liabilities is recognized as goodwill. Excess ofthe Company’s interest in the net fair value of the acquiree’sidentifiable assets, liabilities and contingent liabilities over thepurchase consideration is recognized, after reassessment offair value of net assets acquired, is recognised as Capitalreserve.
Business Combinations arising from transfer of interests inentities that are under common control are accounted usingpooling of interest method wherein, assets and liabilities ofthe combining entities are reflected at their carrying value,no adjustment are made to reflect fair values, or recognizeany new assets or liabilities. The identity of the reserves ispreserved and appears in the financial statements of thetransferee in the same form in which they appeared in thefinancial statements of the transferor.
4. USE OF ESTIMATES, ASSUMPTIONS ANDJUDGMENTS
The preparation of the financial statements requiresmanagement to make judgments, estimates and assumptionsthat affect the reported amounts of revenues, expenses, assetsand liabilities, and the accompanying disclosures includingthe disclosure of contingent liabilities. Uncertainty about theseassumptions and estimates could result in outcomes thatrequire an adjustment to the carrying amount of assets orliabilities in future periods. Difference between actual resultsand estimates are recognised in the periods in which theresults are known / materialise.
The Company has based its assumptions and estimates onparameters available when the financial statements wereprepared. Existing circumstances and assumptions aboutfuture developments, however, may change due to marketchanges or circumstances arising that are beyond the controlof the Company. Such changes are reflected in theassumptions when they occur.
Notes forming part of the Financial Statements
C K
120 Idea Cellular Limited
Standalone Financial Statements
i. Share-based payments
The Company initially measures the cost of equity-settledtransactions with employees using Black & Scholes modelto determine the fair value of the liability incurred.Estimating fair value for share-based paymenttransactions requires determination of the mostappropriate valuation model, which is dependent on theterms and conditions of the grant. This estimate alsorequires determination of the most appropriate inputsto the valuation model including the expected life of theshare option, volatility and dividend yield and makingassumptions about them. The assumptions and modelsused for estimating fair value for share-based paymenttransactions are disclosed in note 52.
ii. Taxes
The Company provides for tax considering the applicabletax regulations and based on reasonable estimates.Management periodically evaluates positions taken inthe tax returns giving due considerations to tax laws andestablishes provisions in the event if required as a resultof differing interpretation or due to retrospectiveamendments, if any.
The recognition of deferred tax assets is based onavailability of sufficient taxable profits in the Companyagainst which such assets can be utilized. MAT(Minimum Alternate Tax) is recognized as an asset onlywhen and to the extent there is convincing evidence thatthe Company will pay normal income tax and will beable to utilize such credit during the specified period. Inthe year in which the MAT credit becomes eligible to berecognized as an asset, the said asset is created by wayof a credit to the Statement of Profit and loss and isincluded in Deferred Tax Assets. The Company reviewsthe same at each balance sheet date and if required, writesdown the carrying amount of MAT credit entitlement tothe extent there is no longer convincing evidence to theeffect that Company will be able to absorb such creditduring the specified period.
iii. Defined benefit plans (gratuity benefits)
The Company’s obligation on account of gratuity andcompensated absences is determined based on actuarialvaluations. An actuarial valuation involves makingvarious assumptions that may differ from actualdevelopments in the future. These include thedetermination of the discount rate, future salary increasesand mortality rates. Due to the complexities involved inthe valuation and its long-term nature, these liabilitiesare highly sensitive to changes in these assumptions. Allassumptions are reviewed at each reporting date.
The parameter subject to frequent changes is the discountrate. In determining the appropriate discount rate, themanagement considers the interest rates of governmentbonds in currencies consistent with the currencies of thepost-employment benefit obligation.
The mortality rate is based on publicly available mortalitytables in India. Those mortality tables tend to change onlyat interval in response to demographic changes. Futuresalary increases and gratuity increases are based onexpected future inflation rates.
Further details about gratuity obligations are given innote 53(A).
iv. Allowance for Trade receivable
The Company follows a ‘simplified approach’ (i.e. basedon lifetime ECL) for recognition of impairment lossallowance on Trade receivables (including leasereceivables). For the purpose of measuring lifetime ECLallowance for trade receivables, the Company estimatesirrecoverable amounts based on the ageing of thereceivable balances and historical experience. Further, alarge number of minor receivables are grouped intohomogeneous groups and assessed for impairmentcollectively. Individual trade receivables are written offwhen management deems them not to be collectible.
v. Useful life of Property, Plant and Equipment
The residual values, useful lives and methods ofdepreciation of property, plant and equipment arereviewed at each financial year end and adjustedprospectively, if appropriate.
vi. Impairment of Non-financial assets
Non-financial assets are reviewed for impairment,whenever events or changes in circumstances indicatethat the carrying amount of such assets may not berecoverable. If any such indication exists, the recoverableamount of the asset is estimated in order to determinethe extent of the impairment loss (if any).
vii. Provision for decommissioning
In measuring the provision for ARO, the Company usestechnical estimates to determine the expected cost todismantle and remove the infrastructure equipment fromthe site and the expected timing of these costs. Discountrates are determined based on the risk adjusted bankrate of a similar period as the liability.
viii.Operating lease commitments – Company as lessee
The Company has entered into lease agreements forproperties and cell sites, where it has, on the basis ofevaluation of the terms and conditions of thearrangement determined that the significant risks andrewards related to the assets and properties are retainedwith the lessors. Accordingly, such lease agreements areaccounted for as operating leases. Further details aboutoperating lease are given in Note 45.
ix. Provisions and Contingent Liabilities
Provisions and contingent liabilities are reviewed at eachbalance sheet date and adjusted to reflect the currentbest estimates.
Notes forming part of the Financial Statements

C K
Annual Report 2016-17 121
Standalone Financial Statements
5. FIRST TIME ADOPTION OF IND AS
The Company had prepared its financial statements inaccordance with the Accounting Standards (AS) notifiedunder section 133 of the Companies Act, 2013 (PreviousGAAP) for and including the year ended March 31, 2016.The Company has prepared its first Ind AS (IndianAccounting Standards) compliant Financial Statements forthe year ended March 31, 2017 with restated comparativefigures for the year ended March 31, 2016 in compliance withInd AS. Accordingly, the Opening Balance Sheet, in line withInd AS transitional provisions, has been prepared as at April1, 2015, the date of Company’s transition to Ind AS. Theprincipal adjustments made by the Company in restating itsPrevious GAAP financial statements as at and for theFinancial year ended March 31, 2016 and the balance sheetas at April 1, 2015 are as mentioned below:
A. EXEMPTIONS APPLIED
Ind AS 101 on First Time Adoption of Ind AS allowsfirst-time adopters certain voluntary exemptions fromthe retrospective application of certain requirementsunder Ind AS. The Company has applied the followingexemptions:
I. Ind AS 103 on Business Combinations has not beenapplied to acquisitions of businesses that occurred beforeApril 1, 2015. Use of this exemption means that assetsand liabilities acquired under a business combination andeligible for recognition under Ind AS will be thePrevious GAAP carrying values on the acquisition date.Ind AS 101 requires recognition of all assets acquiredand liabilities assumed in a past business combinationexcept,
(i) Certain financial assets and liabilities that werederecognised and that fall under the de recognitionexception, and
(ii) Assets and liabilities that were not recognised in theacquirer’s balance sheet under its previous GAAPand that would not qualify for recognition underInd AS in the individual balance sheet of theacquiree.
Assets and liabilities that do not qualify forrecognition under Ind AS are excluded from the IndAS opening balance sheet. The Company has notrecognised or excluded any previously recognisedamounts as a result of Ind AS recognitionrequirements.
II. There is no change in the functional currency of theCompany and accordingly, it has elected to continue withthe carrying values for all of its property, plant andequipment and intangible assets as recognised in itsPrevious GAAP financial statements as the deemed costat the transition date subject to the adjustments fordecommissioning liabilities. As per the exemption underInd AS 101, decommissioning liability was measured in
accordance with Ind AS 37 at the date of transition toInd AS. To the extent the liability was within the scopeof Appendix-A of Ind AS 16, estimated liability thatwould have been included in the cost of related assetwhen the liability first arose by discounting the liabilityto that date using best estimate of the historical riskadjusted discount rate over the intervening period.Accumulated depreciation was calculated on thatamount as at the date of transition to Ind AS on the basisof the current estimate of the useful life of the asset, usingthe depreciation policy adopted by the Company inaccordance with Ind AS.
III. Ind AS 102 on Share-based Payment has not been appliedto equity instruments in share-based paymenttransactions that vested before the date of transition toInd AS.
IV. Appendix C to Ind AS 17 requires the Company to assesswhether a contract or arrangement contains a lease. Inaccordance with Ind AS 17, this assessment should becarried out at the inception of the contract orarrangement. However, the Company has used Ind AS101 exemption and assessed all relevant arrangementsfor classification of leases based on facts andcircumstances existing at the date of transition toInd AS.
V. The Company has decided to continue with its policy ofcapitalising exchange differences arising from translationof long-term foreign currency monetary liabilitiesoutstanding in the financial statements as on March 31,2016 as per AS 11 of the Previous GAAP.
VI. In accordance with the exemption given in Ind AS 101,the Company has recorded investment in subsidiariesat deemed cost i.e. Previous GAAP carrying amount.
B. EXCEPTIONS APPLIED
Ind AS 101 specifies mandatory exceptions from retrospectiveapplication of some aspects of other Ind ASs for first-timeadopters. Following exception is applicable to the Company:
Use of Estimates
The estimates at April 1, 2015 and March 31, 2016 areconsistent with those made for the same dates in accordancewith Previous GAAP (after adjustments to reflect anydifferences in accounting policies) apart from the followingitems where application of Previous GAAP did not requireestimation:
• Impairment of financial assets based on Expected CreditLoss (ECL) model
The estimates used by the Company to present theseamounts in accordance with Ind AS reflect conditions atApril 1, 2015, the date of transition to Ind AS and as ofMarch 31, 2016.
Notes forming part of the Financial Statements

C K
122 Idea Cellular Limited
Standalone Financial Statements
Notes forming part of the Financial Statements
C. EFFECT OF IND AS ADOPTION ON THE BALANCE SHEET
As at March 31, 2016 As at April 1, 2015
Particulars Exp. Ind AS Previous Effect of Ind AS Previous Effect ofNotes GAAP transition GAAP transition
No. to Ind AS to Ind AS
ASSETS
Non-current assets
Property, plant and equipment iv, ix 209,633.63 209,194.37 439.26 178,155.65 178,973.98 (818.33)
Capital work-in-progress 6,613.48 6,613.48 - 8,481.23 8,481.23 -
Intangible assets 440,079.35 439,968.80 110.55 142,165.08 142,165.08 -
Intangible assets underdevelopment 53,774.79 53,774.79 - 42,313.23 42,313.23 -
Financial assets
(i) Non-current investments 16,668.52 16,668.52 - 16,466.07 16,466.07 -
(ii) Long term loans to employees 24.98 24.98 - 24.51 24.51 -
(iii) Other non-current financialassets iii,iv 9,107.37 9,105.93 1.44 6,602.68 8,753.92 (2,151.24)
Other non-current assets ii, iii, vi, xii 12,891.53 25,033.62 (12,142.09) 26,656.77 30,128.25 (3,471.48)
Total non-current assets (A) 748,793.65 760,384.49 (11,590.84) 420,865.22 427,306.27 (6,441.05)
Current assets
Inventories 851.46 851.46 - 582.98 582.98 -
Financial assets
(i) Current investments v 8,328.46 8,321.00 7.46 111,743.43 111,675.00 68.43
(ii) Trade receivables 11,360.58 11,360.58 - 9,321.71 9,321.71 -
(iii) Cash and cash equivalents 7,515.42 7,515.42 - 15,365.93 15,365.93 -
(iv) Bank balance other thancash and cash equivalents 61.21 61.21 - 53.45 53.45 -
(v) Current Portion of loans toemployees 16.61 16.61 - 16.99 16.99 -
(vi) Other current financial assets iii, iv 917.63 818.38 99.25 4,325.27 1,629.07 2,696.20
Current Tax Assets (net) - - - 3,180.71 3,180.71 -
Other current assets ii, iii, vi 8,551.85 8,749.65 (197.80) 7,515.92 7,626.31 (110.39)
Non - Current assets classifiedas held for sale 154.96 - 154.96 22.34 - 22.34
Total current assets (B) 37,758.18 37,694.31 63.87 152,128.73 149,452.15 2,676.58
Total Assets (A+B) 786,551.83 798,078.80 (11,526.97) 572,993.95 576,758.42 (3,764.47)
` Mn

C K
Annual Report 2016-17 123
Standalone Financial Statements
As at March 31, 2016 As at April 1, 2015
Particulars Exp. Ind AS Previous Effect of Ind AS Previous Effect ofNotes GAAP transition GAAP transition
No. to Ind AS to Ind AS
EQUITY AND LIABILITIES
Equity
Equity share capital 36,005.09 36,005.09 - 35,978.44 35,978.44 -
Other equity 211,646.88 206,954.04 4,692.84 187,154.70 182,922.98 4,231.72
Total equity (A) 247,651.97 242,959.13 4,692.84 223,133.14 218,901.42 4,231.72
Non-current liabilities:
Financial liabilities
(i) Long Term borrowings iv, vi 359,040.42 361,583.12 (2,542.70) 157,990.82 160,064.86 (2,074.04)
(ii) Other non-current financialliabilities iv, xiii 23,589.42 24,965.51 (1,376.09) 2,342.94 3,253.95 (911.01)
Long term provisions ix 3,353.31 3,394.20 (40.89) 2,753.47 2,820.65 (67.18)
Deferred tax liabilities (net) xi, xii 22,357.30 27,830.88 (5,473.58) 16,804.61 16,090.76 713.85
Other non-current liabilities i 4,094.24 9,651.69 (5,557.45) 3,646.07 8,494.99 (4,848.92)
Total non-current liabilities (B) 412,434.69 427,425.40 (14,990.71) 183,537.91 190,725.21 (7,187.30)
Current liabilities:
Financial liabilities
(i) Short term borrowings 16,455.78 16,455.78 - 1,513.94 1,513.94 -
(ii) Trade payables iv 32,038.74 32,124.33 (85.59) 29,367.60 29,400.77 (33.17)
(iii) Other current financialliabilities iv, vi, xiii 53,722.29 51,626.13 2,096.16 113,771.88 111,674.28 2,097.60
Other current liabilities i 23,332.03 23,971.60 (639.57) 21,278.97 21,554.12 (275.15)
Short term provisions ix, x 916.33 3,516.43 (2,600.10) 390.51 2,988.68 (2,598.17)
Total current liabilities (C) 126,465.17 127,694.27 (1,229.10) 166,322.90 167,131.79 (808.89)
Total Equity and Liabilities(A+B+C) 786,551.83 798,078.80 (11,526.97) 572,993.95 576,758.42 (3,764.47)
D. RECONCILIATION OF TOTAL EQUITY AS AT MARCH 31, 2016 AND APRIL 1, 2015 ` Mn
Particulars Exp. As at As atNotes No. March 31, 2016 April 1, 2015
Total Equity (shareholders’ fund) under Previous GAAP 242,959.13 218,901.42
Effects of inflation linked escalation on rental income / expense notrequiring equalisation over the lease term, hence reversed i,ii 6,023.90 5,079.50
Effects of measuring financial instruments under Ind AS iii,iv,v 2,903.40 2,660.64
Dividends (including dividend distribution tax) not recognised as liabilityuntil declared under Ind AS x 2,600.09 2,598.17
Others* iv,vi,ix (40.55) 448.74
Deferred Tax impact on transitional adjustments due to Ind AS xi (6,794.00) (6,555.33)
Total Equity under Ind AS 247,651.97 223,133.14
*Includes Share based payments at fair value issued to Subsidiaries
Notes forming part of the Financial Statements
` Mn
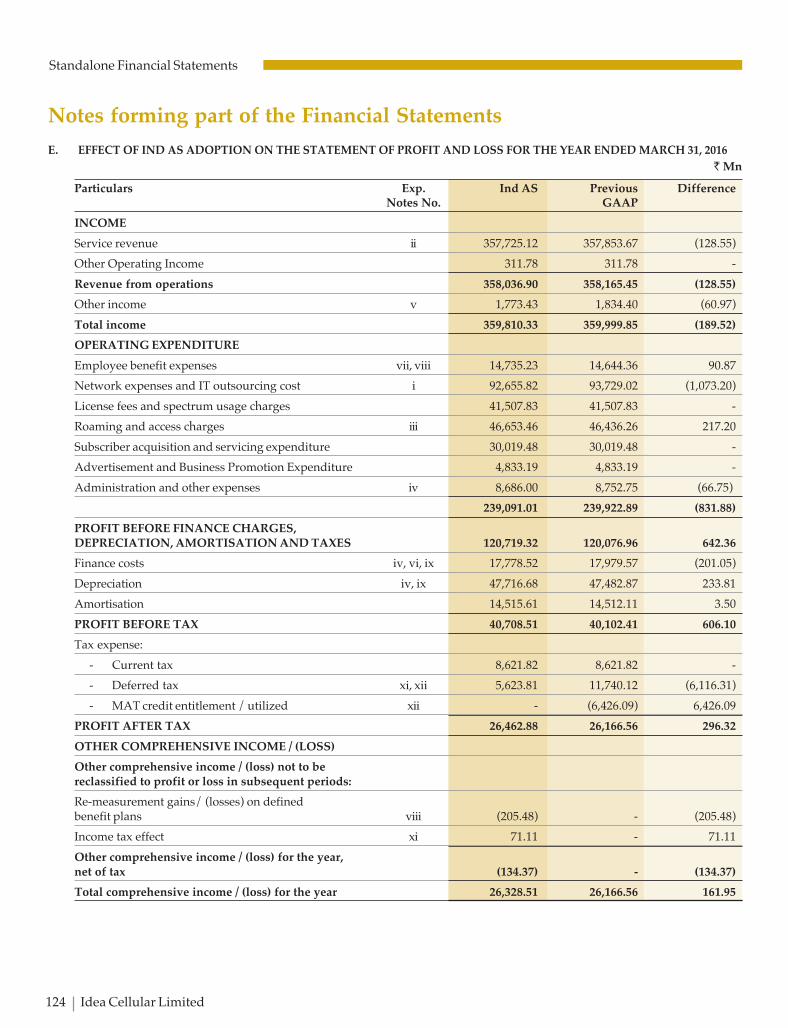
C K
124 Idea Cellular Limited
Standalone Financial Statements
E. EFFECT OF IND AS ADOPTION ON THE STATEMENT OF PROFIT AND LOSS FOR THE YEAR ENDED MARCH 31, 2016
` Mn
Particulars Exp. Ind AS Previous Difference Notes No. GAAP
INCOME
Service revenue ii 357,725.12 357,853.67 (128.55)
Other Operating Income 311.78 311.78 -
Revenue from operations 358,036.90 358,165.45 (128.55)
Other income v 1,773.43 1,834.40 (60.97)
Total income 359,810.33 359,999.85 (189.52)
OPERATING EXPENDITURE
Employee benefit expenses vii, viii 14,735.23 14,644.36 90.87
Network expenses and IT outsourcing cost i 92,655.82 93,729.02 (1,073.20)
License fees and spectrum usage charges 41,507.83 41,507.83 -
Roaming and access charges iii 46,653.46 46,436.26 217.20
Subscriber acquisition and servicing expenditure 30,019.48 30,019.48 -
Advertisement and Business Promotion Expenditure 4,833.19 4,833.19 -
Administration and other expenses iv 8,686.00 8,752.75 (66.75)
239,091.01 239,922.89 (831.88)
PROFIT BEFORE FINANCE CHARGES,DEPRECIATION, AMORTISATION AND TAXES 120,719.32 120,076.96 642.36
Finance costs iv, vi, ix 17,778.52 17,979.57 (201.05)
Depreciation iv, ix 47,716.68 47,482.87 233.81
Amortisation 14,515.61 14,512.11 3.50
PROFIT BEFORE TAX 40,708.51 40,102.41 606.10
Tax expense:
- Current tax 8,621.82 8,621.82 -
- Deferred tax xi, xii 5,623.81 11,740.12 (6,116.31)
- MAT credit entitlement / utilized xii - (6,426.09) 6,426.09
PROFIT AFTER TAX 26,462.88 26,166.56 296.32
OTHER COMPREHENSIVE INCOME / (LOSS)
Other comprehensive income / (loss) not to bereclassified to profit or loss in subsequent periods:
Re-measurement gains/ (losses) on definedbenefit plans viii (205.48) - (205.48)
Income tax effect xi 71.11 - 71.11
Other comprehensive income / (loss) for the year,net of tax (134.37) - (134.37)
Total comprehensive income / (loss) for the year 26,328.51 26,166.56 161.95
Notes forming part of the Financial Statements
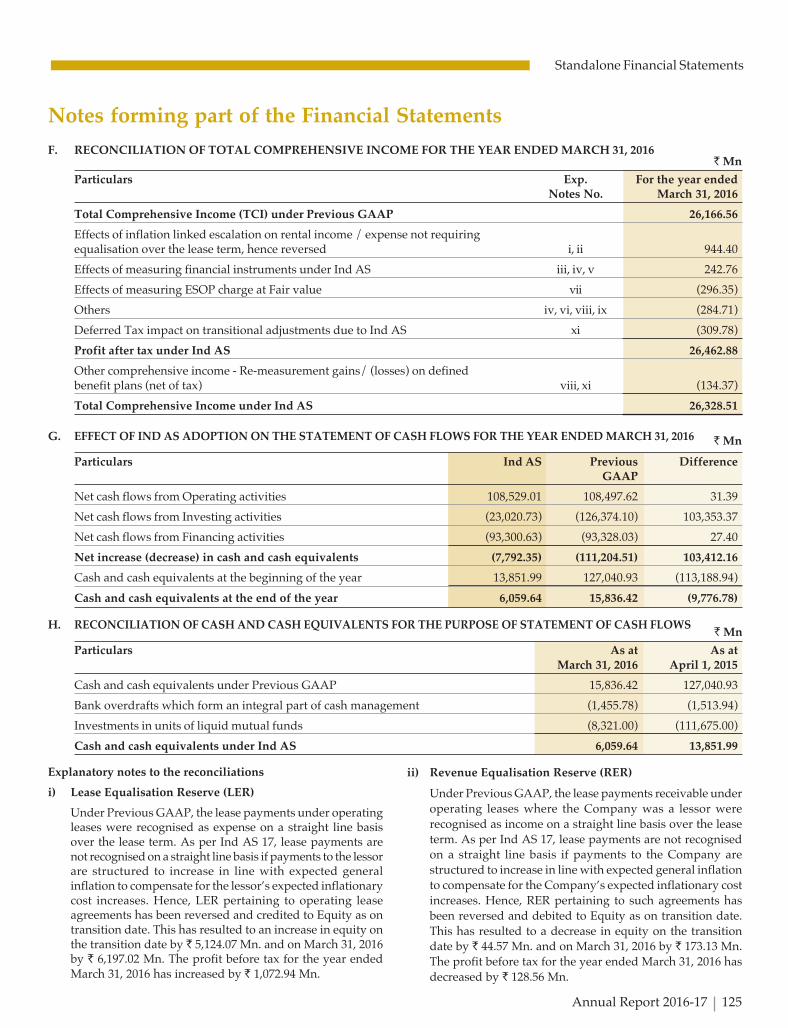
C K
Annual Report 2016-17 125
Standalone Financial Statements
F. RECONCILIATION OF TOTAL COMPREHENSIVE INCOME FOR THE YEAR ENDED MARCH 31, 2016` Mn
Particulars Exp. For the year endedNotes No. March 31, 2016
Total Comprehensive Income (TCI) under Previous GAAP 26,166.56
Effects of inflation linked escalation on rental income / expense not requiringequalisation over the lease term, hence reversed i, ii 944.40
Effects of measuring financial instruments under Ind AS iii, iv, v 242.76
Effects of measuring ESOP charge at Fair value vii (296.35)
Others iv, vi, viii, ix (284.71)
Deferred Tax impact on transitional adjustments due to Ind AS xi (309.78)
Profit after tax under Ind AS 26,462.88
Other comprehensive income - Re-measurement gains/ (losses) on definedbenefit plans (net of tax) viii, xi (134.37)
Total Comprehensive Income under Ind AS 26,328.51
G. EFFECT OF IND AS ADOPTION ON THE STATEMENT OF CASH FLOWS FOR THE YEAR ENDED MARCH 31, 2016
Particulars Ind AS Previous Difference GAAP
Net cash flows from Operating activities 108,529.01 108,497.62 31.39
Net cash flows from Investing activities (23,020.73) (126,374.10) 103,353.37
Net cash flows from Financing activities (93,300.63) (93,328.03) 27.40
Net increase (decrease) in cash and cash equivalents (7,792.35) (111,204.51) 103,412.16
Cash and cash equivalents at the beginning of the year 13,851.99 127,040.93 (113,188.94)
Cash and cash equivalents at the end of the year 6,059.64 15,836.42 (9,776.78)
H. RECONCILIATION OF CASH AND CASH EQUIVALENTS FOR THE PURPOSE OF STATEMENT OF CASH FLOWS
Particulars As at As atMarch 31, 2016 April 1, 2015
Cash and cash equivalents under Previous GAAP 15,836.42 127,040.93
Bank overdrafts which form an integral part of cash management (1,455.78) (1,513.94)
Investments in units of liquid mutual funds (8,321.00) (111,675.00)
Cash and cash equivalents under Ind AS 6,059.64 13,851.99
Notes forming part of the Financial Statements
Explanatory notes to the reconciliations
i) Lease Equalisation Reserve (LER)
Under Previous GAAP, the lease payments under operatingleases were recognised as expense on a straight line basisover the lease term. As per Ind AS 17, lease payments arenot recognised on a straight line basis if payments to the lessorare structured to increase in line with expected generalinflation to compensate for the lessor’s expected inflationarycost increases. Hence, LER pertaining to operating leaseagreements has been reversed and credited to Equity as ontransition date. This has resulted to an increase in equity onthe transition date by ` 5,124.07 Mn. and on March 31, 2016by ` 6,197.02 Mn. The profit before tax for the year endedMarch 31, 2016 has increased by ` 1,072.94 Mn.
ii) Revenue Equalisation Reserve (RER)
Under Previous GAAP, the lease payments receivable underoperating leases where the Company was a lessor wererecognised as income on a straight line basis over the leaseterm. As per Ind AS 17, lease payments are not recognisedon a straight line basis if payments to the Company arestructured to increase in line with expected general inflationto compensate for the Company’s expected inflationary costincreases. Hence, RER pertaining to such agreements hasbeen reversed and debited to Equity as on transition date.This has resulted to a decrease in equity on the transitiondate by ` 44.57 Mn. and on March 31, 2016 by ` 173.13 Mn.The profit before tax for the year ended March 31, 2016 hasdecreased by ` 128.56 Mn.
` Mn
` Mn

C K
126 Idea Cellular Limited
Standalone Financial Statements
iii) Financial Assets - Deposits
Under Previous GAAP, the Company accounted for depositsat transaction value. Under Ind AS, the deposits with inherentsignificant financing element are initially recorded at fair valuewith the difference between transaction value and fair valuebeing treated as prepaid expenses. The deposits aresubsequently measured at amortised cost and deferred rentis amortised over contract period on a straight line basis. Thishas resulted to an increase in equity on the transition date by` 217.20 Mn. and on March 31, 2016 by ̀ Nil. The profit beforetax for the year ended March 31, 2016 has decreased by` 217.20 Mn.
iv) Derivative instruments
The fair value of foreign exchange forward contracts and
interest rate swap contracts is recognised under Ind AS,which was not recognised under Previous GAAP.Consequently, the unamortised forward premium recognised
under Previous GAAP has been derecognised. Thecorresponding adjustment has been credited to Equity as onthe transition date. This has resulted to an increase in equity
on the transition date by ` 1,740.60 Mn. and on March 31,2016 by ̀ 2,261.53 Mn. The profit before tax for the year endedMarch 31, 2016 has increased by ` 520.93 Mn.
Hedged foreign currency borrowings have been restated atthe spot rate on the transition date. This has resulted to an
increase in equity on the transition date by ̀ 634.41 Mn. andon March 31, 2016 by ` 634.41 Mn. Further, as the Companyhas decided to continue capitalisation of exchange differences
arising from translation of long term foreign currencymonetary liabilities outstanding as on March 31, 2016, anadditional amount of ` 1,742.60 Mn. has been capitalised in
FY 2015-16.The additional depreciation charged due toadditional capitalisation has led to a decrease in profit beforetax by ` 279.30 Mn. for the year ended March 31, 2016.
v) Investments in Mutual Funds
Under Previous GAAP, the Company accounted for
investments in mutual funds as financial instruments
measured at lower of cost or fair value. Under Ind AS, the
Company has designated such investments at fair value
through profit and loss which are to be measured at fair value
at each reporting date. The difference between the fair value
of these instruments and Previous GAAP carrying amount
has been adjusted in equity as on the transition date. This
has resulted to an increase in equity on the transition date by
` 68.43 Mn. and on March 31, 2016 by ` 7.46 Mn. The profit
before tax for the year ended March 31, 2016 has decreasedby ` 60.97 Mn.
vi) Borrowings
Under Previous GAAP, transaction costs incurred in
connection with borrowings were disclosed as prepaid
expenses and charged to statement of profit and loss on asystematic basis. Under Ind AS, borrowings are recordedinitially at fair value less transaction costs and aresubsequently measured at amortised cost as per theEffective Interest Rate (EIR) method. This has resulted toan increase in equity on the transition date by ` 411.60 Mn.and on March 31, 2016 by ` 206.03 Mn. The profit beforetax for the year ended March 31, 2016 has decreased by` 205.57 Mn.
vii) Share-based payments
Under Previous GAAP, the cost of equity-settled employeeshare based payments was recognised based on intrinsicvalue of the options as at the grant date over the appropriatevesting period. Ind AS requires expense on such share basedpayments to be recognised based on fair value as at grantdate using an appropriate pricing model over theappropriate vesting period. The change does not affect totalequity (except for ` 0.91 Mn. being the differential in valueof options granted to employees of 100% subsidiaries),butthere is a decrease in retained earnings on the transitiondate by ` 343.53 Mn. and on March 31, 2016 by ` 639.88Mn. The profit before tax for the year ended March 31, 2016has decreased by ` 296.35 Mn.
viii) Employee Benefits
In Previous GAAP, actuarial gains and losses wererecognized in Statement of profit and loss. Under Ind AS,the actuarial gains and losses form part of re-measurementof net defined benefit liability/asset which is recognized inother comprehensive income in the respective periods. Thechange does not affect total equity but there is an increasein profit before tax for the year ended March 31, 2016 by` 205.48 Mn.
ix) Asset Retirement Obligation (ARO)
Under Previous GAAP, provision for ARO was measured atthe best estimate of the expenditure required to settle theobligation at the Balance Sheet date without considering theeffect of discounting. Under Ind AS, provision for ARO ismeasured at present value of the expenditure expected to beincurred to settle the obligation. The difference between thepresent value of ARO provision and Previous GAAP carryingamount of ARO, net of depreciation effect has been adjustedto retained earnings as on the transition date. This hasresulted to an increase in equity on the transition date by` 37.14 Mn. and on March 31, 2016 by ` 31.81 Mn. The profitbefore tax for the year ended March 31, 2016 has decreasedby ` 5.33 Mn.
x) Dividend including dividend distribution tax
Under previous GAAP, dividend payable including dividenddistribution taxes was recorded as a liability in the period to
which it relates. Under Ind AS, dividend to holders of equity
Notes forming part of the Financial Statements
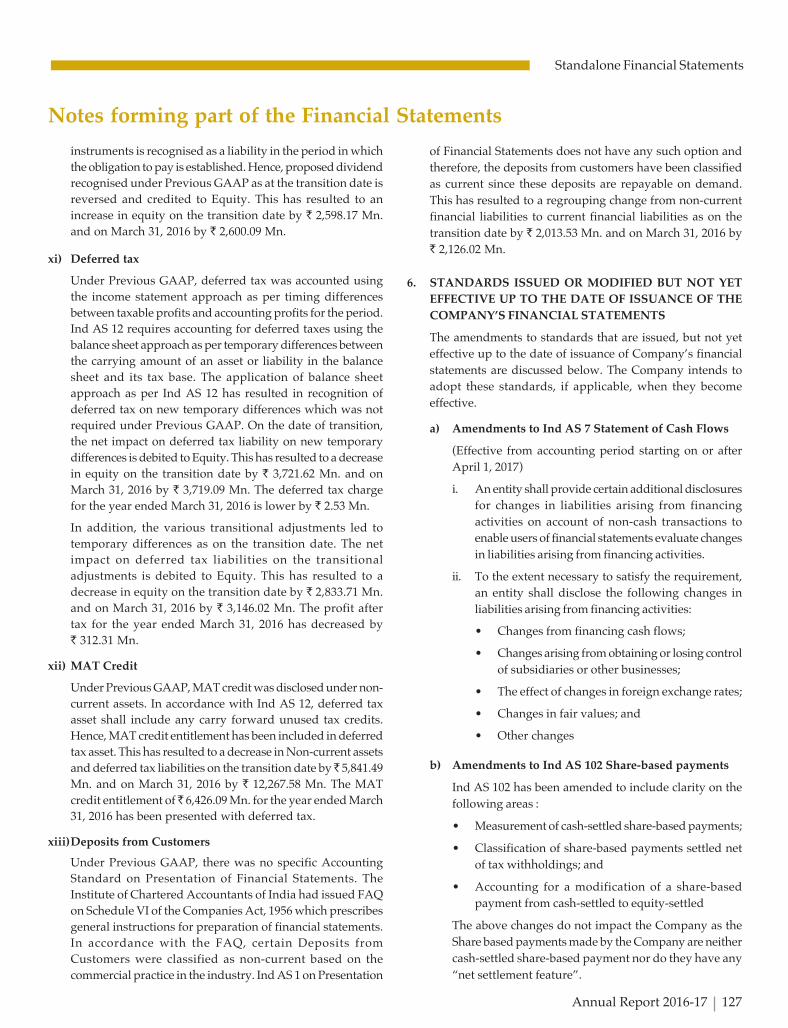
C K
Annual Report 2016-17 127
Standalone Financial Statements
instruments is recognised as a liability in the period in which
the obligation to pay is established. Hence, proposed dividend
recognised under Previous GAAP as at the transition date is
reversed and credited to Equity. This has resulted to an
increase in equity on the transition date by ` 2,598.17 Mn.
and on March 31, 2016 by ` 2,600.09 Mn.
xi) Deferred tax
Under Previous GAAP, deferred tax was accounted using
the income statement approach as per timing differences
between taxable profits and accounting profits for the period.
Ind AS 12 requires accounting for deferred taxes using the
balance sheet approach as per temporary differences between
the carrying amount of an asset or liability in the balance
sheet and its tax base. The application of balance sheet
approach as per Ind AS 12 has resulted in recognition of
deferred tax on new temporary differences which was not
required under Previous GAAP. On the date of transition,
the net impact on deferred tax liability on new temporary
differences is debited to Equity. This has resulted to a decrease
in equity on the transition date by ` 3,721.62 Mn. and on
March 31, 2016 by ` 3,719.09 Mn. The deferred tax charge
for the year ended March 31, 2016 is lower by ` 2.53 Mn.
In addition, the various transitional adjustments led to
temporary differences as on the transition date. The net
impact on deferred tax liabilities on the transitional
adjustments is debited to Equity. This has resulted to a
decrease in equity on the transition date by ` 2,833.71 Mn.
and on March 31, 2016 by ` 3,146.02 Mn. The profit after
tax for the year ended March 31, 2016 has decreased by
` 312.31 Mn.
xii) MAT Credit
Under Previous GAAP, MAT credit was disclosed under non-
current assets. In accordance with Ind AS 12, deferred tax
asset shall include any carry forward unused tax credits.
Hence, MAT credit entitlement has been included in deferred
tax asset. This has resulted to a decrease in Non-current assets
and deferred tax liabilities on the transition date by ̀ 5,841.49
Mn. and on March 31, 2016 by ` 12,267.58 Mn. The MAT
credit entitlement of ̀ 6,426.09 Mn. for the year ended March
31, 2016 has been presented with deferred tax.
xiii)Deposits from Customers
Under Previous GAAP, there was no specific Accounting
Standard on Presentation of Financial Statements. The
Institute of Chartered Accountants of India had issued FAQ
on Schedule VI of the Companies Act, 1956 which prescribes
general instructions for preparation of financial statements.
In accordance with the FAQ, certain Deposits from
Customers were classified as non-current based on the
commercial practice in the industry. Ind AS 1 on Presentation
of Financial Statements does not have any such option and
therefore, the deposits from customers have been classified
as current since these deposits are repayable on demand.
This has resulted to a regrouping change from non-current
financial liabilities to current financial liabilities as on the
transition date by ` 2,013.53 Mn. and on March 31, 2016 by
` 2,126.02 Mn.
6. STANDARDS ISSUED OR MODIFIED BUT NOT YET
EFFECTIVE UP TO THE DATE OF ISSUANCE OF THE
COMPANY’S FINANCIAL STATEMENTS
The amendments to standards that are issued, but not yet
effective up to the date of issuance of Company’s financial
statements are discussed below. The Company intends to
adopt these standards, if applicable, when they become
effective.
a) Amendments to Ind AS 7 Statement of Cash Flows
(Effective from accounting period starting on or after
April 1, 2017)
i. An entity shall provide certain additional disclosures
for changes in liabilities arising from financing
activities on account of non-cash transactions to
enable users of financial statements evaluate changes
in liabilities arising from financing activities.
ii. To the extent necessary to satisfy the requirement,
an entity shall disclose the following changes in
liabilities arising from financing activities:
• Changes from financing cash flows;
• Changes arising from obtaining or losing control
of subsidiaries or other businesses;
• The effect of changes in foreign exchange rates;
• Changes in fair values; and
• Other changes
b) Amendments to Ind AS 102 Share-based payments
Ind AS 102 has been amended to include clarity on the
following areas :
• Measurement of cash-settled share-based payments;
• Classification of share-based payments settled net
of tax withholdings; and
• Accounting for a modification of a share-based
payment from cash-settled to equity-settled
The above changes do not impact the Company as the
Share based payments made by the Company are neither
cash-settled share-based payment nor do they have any
“net settlement feature”.
Notes forming part of the Financial Statements

C K
128 Idea Cellular Limited
Standalone Financial Statements
` Mn
Particulars Freehold Buildings Plant and Furniture Office Vehicles Totalland machinery and equipments
fixtures
7 PROPERTY, PLANT AND EQUIPMENT
Cost
As at April 1, 2015* 116.05 990.08 175,940.61 290.49 258.93 559.49 178,155.65
Additions - 23.78 78,593.44 175.04 250.21 342.44 79,384.91
Disposals/Adjustments (includingassets held for sale) - (138.55) (251.81) (1.88) (0.46) (48.89) (441.59)
As at March 31, 2016 116.05 875.31 254,282.24 463.65 508.68 853.04 257,098.97
Additions - 21.90 64,475.06 522.77 307.79 594.46 65,921.98
Disposals/Adjustments (includingassets held for sale) - 157.79 (318.73) (8.42) (2.10) (131.15) (302.61)
Transfer to wholly owned Subsidiary(refer note 41) - (1.20) (7,054.50) (0.12) (4.94) (10.82) (7,071.58)
As at March 31, 2017 116.05 1,053.80 311,384.07 977.88 809.43 1,305.53 315,646.76
Accumulated Depreciation
As at April 1, 2015* - - - - - - -
Depreciation charge for the year - 100.39 47,068.36 90.49 153.44 304.00 47,716.68
Disposals/Adjustments (includingassets held for sale) - 0.13 (235.10) (0.65) (0.22) (15.50) (251.34)
As at March 31, 2016 - 100.52 46,833.26 89.84 153.22 288.50 47,465.34
Depreciation charge for the year - 78.16 47,940.97 111.35 186.28 326.06 48,642.82
Disposals/Adjustments (includingassets held for sale) - 20.59 (196.86) (7.15) (1.37) (92.71) (277.50)
Transfer to wholly owned Subsidiary(refer note 41) - (0.09) (2,063.03) (0.11) (1.71) (4.19) (2,069.13)
As at March 31, 2017 - 199.18 92,514.34 193.93 336.42 517.66 93,761.53
Net Book Value
As at March 31, 2017 116.05 854.62 218,869.73 783.95 473.01 787.87 221,885.23
As at March 31, 2016 116.05 774.79 207,448.98 373.81 355.46 564.54 209,633.63
As at April 1, 2015 116.05 990.08 175,940.61 290.49 258.93 559.49 178,155.65
*Information regarding gross block and accumulated depreciation under previous GAAP as on March 31, 2015 are as under :
Gross Block as on April 1, 2015 116.05 1,766.51 359,438.62 1,681.31 3,692.24 1,494.15 368,188.88
Accumulated Depreciationas on April 1, 2015 - 776.43 183,498.01 1,390.82 3,433.31 934.66 190,033.23
Net Block as on April 1, 2015 116.05 990.08 175,940.61 290.49 258.93 559.49 178,155.65
Footnotes:
1. Plant and machinery includes gross block of assets capitalised under finance lease ` 9,880.58 Mn (March 31, 2016:` 7,443.08 Mn, April 1, 2015: ` 4,408.63 Mn) and corresponding accumulated depreciation being ` 5,918.69 Mn (March 31,2016: ` 3,048.65 Mn, April 1, 2015: ` Nil).
2. Foreign exchange (Gain)/loss amounting to ` (661.69) Mn (March 31, 2016: ` 3,515.65 Mn ) (decapitalised) / capitalisedduring the year
3. Depreciation charge for the year includes ` 296.40 Mn (March 31, 2016: ` 572.48 Mn, April 1, 2015: ` 5,450.45 Mn) due tochange in estimated useful life of certain fixed assets.
4. Disposals/Adjustments includes assets reclassified from held for sale to PPE due to termination of agreement/intention to sell.
Notes forming part of the Financial Statements

C K
Annual Report 2016-17 129
Standalone Financial Statements
Notes forming part of the Financial Statements
` Mn
Particulars Entry / license Computer- Bandwidth Totalfees and Software
spectrum
8 INTANGIBLE ASSETS
Cost
As at April 1, 2015* 134,561.55 585.60 7,017.93 142,165.08
Additions 308,928.83 1,974.03 1,527.03 312,429.89
Retirement of expired licenses (616.93) - - (616.93)
As at March 31, 2016 442,873.45 2,559.63 8,544.96 453,978.04
Additions 123,185.23 1,583.53 2,872.97 127,641.73
Retirement of expired licenses (417.43) - - (417.43)
As at March 31, 2017 565,641.25 4,143.16 11,417.93 581,202.34
Accumulated Amortisation
As at April 1, 2015* - - - -
Amortisation charge for the year 13,143.07 728.11 644.43 14,515.61
Retirement of expired licenses (616.92) - - (616.92)
As at March 31, 2016 12,526.15 728.11 644.43 13,898.69
Amortisation charge for the year 26,446.21 1,110.58 800.56 28,357.35
Retirement of expired licenses (418.30) - - (418.30)
As at March 31, 2017 38,554.06 1,838.69 1,444.99 41,837.74
Net Book Value
As at March 31, 2017 527,087.19 2,304.47 9,972.94 539,364.60
As at March 31, 2016 430,347.30 1,831.52 7,900.53 440,079.35
As at April 1, 2015 134,561.55 585.60 7,017.93 142,165.08
*Information regarding gross block and accumulated depreciation under previous GAAP as on March 31, 2015 are as under :
Gross Block as on April 1, 2015 174,024.15 5,456.60 8,998.99 188,479.74
Accumulated Depreciation as on April 1, 2015 39,462.60 4,871.00 1,981.06 46,314.66
Net Block as on April 1, 2015 134,561.55 585.60 7,017.93 142,165.08
Footnotes:
1. Computer - software includes gross block of assets capitalised under finance lease ` 2,932.09 Mn (March 31, 2016:` 1,845.27 Mn, April 1, 2015: ` 357.10 Mn) and corresponding accumulated amortisation being ` 1,289.50 Mn (March 31,2016: ` 507.02 Mn, April 1, 2015: ` Nil).
2. The remaining amortisation period of license/ spectrum fees as at March 31, 2017 ranges between 4 to 20 years based onthe respective telecom service license / spectrum validity period.
3. Intangible asset under development includes interest amounting to ` 2,330.41 Mn (March 31, 2016: ` 3,727.15 Mn, April 1,2015: ` 2,689.88 Mn).

C K
130 Idea Cellular Limited
Standalone Financial Statements
` Mn
Particulars As at As at As atMarch 31, 2017 March 31, 2016 April 1, 2015
9 NON-CURRENT INVESTMENTS
Investment (Unquoted) at cost
a) Investments in Equity Instruments of Subsidiaries
Aditya Birla Telecom Limited 16,327.76 16,327.76 16,327.76
10,000,000 fully paid equity shares of ` 10 each
Idea Cellular Infrastructure Services Limited 4,865.08 0.50 0.50
60,000 (March 31, 2016 and April 1, 2015 : 50,000)fully paid equity shares of ` 10 each (refer note 41)
Idea Mobile Commerce Services Limited 900.00 299.00 99.00
90,000,000 (March 31, 2016 : 29,900,000 and April 1, 2015 :9,900,000) fully paid equity shares of ` 10 each
Idea Cellular Services Limited 0.50 0.50 0.50
50,000 fully paid equity shares of ` 10 each
Idea Telesystems Limited 38.31 38.31 38.31
50,000 fully paid equity shares of ` 10 each
Total investment in subsidiaries (A) 22,131.65 16,666.07 16,466.07
b) Investments in Equity Instruments of Associates
Aditya Birla Idea Payments Bank Limited (ABIPBL) 134.33 2.45 -
13,433,360 (March 31, 2016 : 245,000 and April 1, 2015 : Nil)fully paid equity shares of ` 10 each
Total investment in Associates (B) 134.33 2.45 -
Total (A+B) 22,265.98 16,668.52 16,466.07
10 OTHER NON-CURRENT FINANCIAL ASSETS
a) Deposits with body corporate and others (includingamount referred to in note 59) 4,557.11 8,545.71 6,048.96
b) Deposits and balances with government authorities 466.45 560.22 409.66
c) Derivative assets at fair value through profit or loss 13.69 1.44 144.06
d) Advance for purchase of equity shares of ABIPBL 41.82 - -
Total 5,079.07 9,107.37 6,602.68
11 OTHER NON-CURRENT ASSETS
a) Capital advances (refer note 39) 4,121.50 236.76 19,585.61
b) Cenvat credit 3,184.08 - -
c) Prepaid expenses 988.57 972.57 3,250.18
d) Advance income tax (net) 9,995.62 4,905.60 1,534.95
e) Others
- Considered Good 9,207.64 6,776.60 2,286.03
- Considered Doubtful 452.41 535.19 -
9,660.05 7,311.79 2,286.03
Allowance for doubtful advances (refer note 50) (452.41) (535.19) -
9,207.64 6,776.60 2,286.03
Total 27,497.41 12,891.53 26,656.77
Notes forming part of the Financial Statements

C K
Annual Report 2016-17 131
Standalone Financial Statements
12 INVENTORIES
Sim and recharge vouchers 542.10 851.46 582.98
Total 542.10 851.46 582.98
13 CURRENT INVESTMENTS
Investment in units of liquid mutual funds (quoted) (refer note 47) 40,247.09 8,328.46 111,743.43
Total 40,247.09 8,328.46 111,743.43
14 TRADE RECEIVABLES(Unsecured, unless otherwise stated)(including amount referred to in note 59)
a) Billed Receivables
Considered Good 7,638.06 6,888.81 5,325.58
Considered Doubtful 5,833.53 3,902.59 3,587.39
13,471.59 10,791.40 8,912.97
Allowance for doubtful advances (refer note 50) (5,833.53) (3,902.59) (3,587.39)
7,638.06 6,888.81 5,325.58
Trade receivable are secured for amounts receivable from certainparties who have provided security deposits of ` 219.68 Mn.(March 31, 2016 : ` 269.18 Mn. and April 1, 2015 : ` 265.50 Mn)
b) Unbilled Receivables 4,942.89 4,471.77 3,996.13
Total 12,580.95 11,360.58 9,321.71
15 CASH AND CASH EQUIVALENTS
a) Cash on hand 8.93 18.50 15.91
b) Cheques on hand 63.59 86.73 76.57
c) Balances with banks
- In current accounts 196.08 209.60 272.86
- In deposit accounts - 7,200.59 15,000.59
Total 268.60 7,515.42 15,365.93
16 BANK BALANCE OTHER THAN CASH AND CASHEQUIVALENTS
a) Margin money with banks 39.95 58.69 52.01
b) Earmarked bank balance towards dividend 4.10 2.52 1.44
Total 44.05 61.21 53.45
Notes forming part of the Financial Statements
` Mn
Particulars As at As at As atMarch 31, 2017 March 31, 2016 April 1, 2015

C K
132 Idea Cellular Limited
Standalone Financial Statements
Notes forming part of the Financial Statements
` Mn
Particulars As at As at As atMarch 31, 2017 March 31, 2016 April 1, 2015
17 OTHER CURRENT FINANCIAL ASSETS
a) Interest Receivable 0.19 20.00 1,061.65
b) Security deposits with body corporate and others(including amount referred to in note 59) 332.82 686.24 396.06
c) Derivative assets at fair value through profit or loss - 98.88 2,696.20
d) Other receivables (including amount referred to in note 59)
- Considered Good 69.87 112.51 171.36
- Considered Doubtful 2.46 2.55 11.30
72.33 115.06 182.66
Allowance for doubtful advances (refer note 50) (2.46) (2.55) (11.30)
69.87 112.51 171.36
Total 402.88 917.63 4,325.27
18 OTHER CURRENT ASSETS
a) Cenvat credit 10,310.28 6,764.43 3,128.18
b) Prepaid expenses 804.95 956.73 901.98
c) Others
- Considered Good 976.48 830.69 3,485.76
- Considered Doubtful 10.12 2.07 567.82
986.60 832.76 4,053.58
Allowance for doubtful advances (refer note 50) (10.12) (2.07) (567.82)
976.48 830.69 3,485.76
Total 12,091.71 8,551.85 7,515.92
19 NON CURRENT ASSETS CLASSIFIED AS HELD FOR SALE
The major classes of assets classified as held for sale are as below:
a) Plant and machinery 16.11 17.76 22.34
b) Buildings (refer footnote 4 to note 7) - 137.20 -
Total 16.11 154.96 22.34
Particulars As at March 31, 2017 As at March 31, 2016 As at April 1, 2015
Numbers `̀̀̀̀ Mn Numbers `̀̀̀̀ Mn Numbers `̀̀̀̀ Mn
20 EQUITY SHARE CAPITAL
Authorised share capital
Equity Shares of ` 10 each 6,775,000,000 67,750.00 6,775,000,000 67,750.00 6,775,000,000 67,750.00
Redeemable cumulativenon-convertible Preferenceshares of ` 10 million each 1,500 15,000.00 1,500 15,000.00 1,500 15,000.00
6,775,001,500 82,750.00 6,775,001,500 82,750.00 6,775,001,500 82,750.00
Issued, subscribed andpaid-up share capital
Equity Shares of ` 10 each fullypaid up 3,605,328,231 36,053.28 3,600,509,378 36,005.09 3,597,844,427 35,978.44
3,605,328,231 36,053.28 3,600,509,378 36,005.09 3,597,844,427 35,978.44
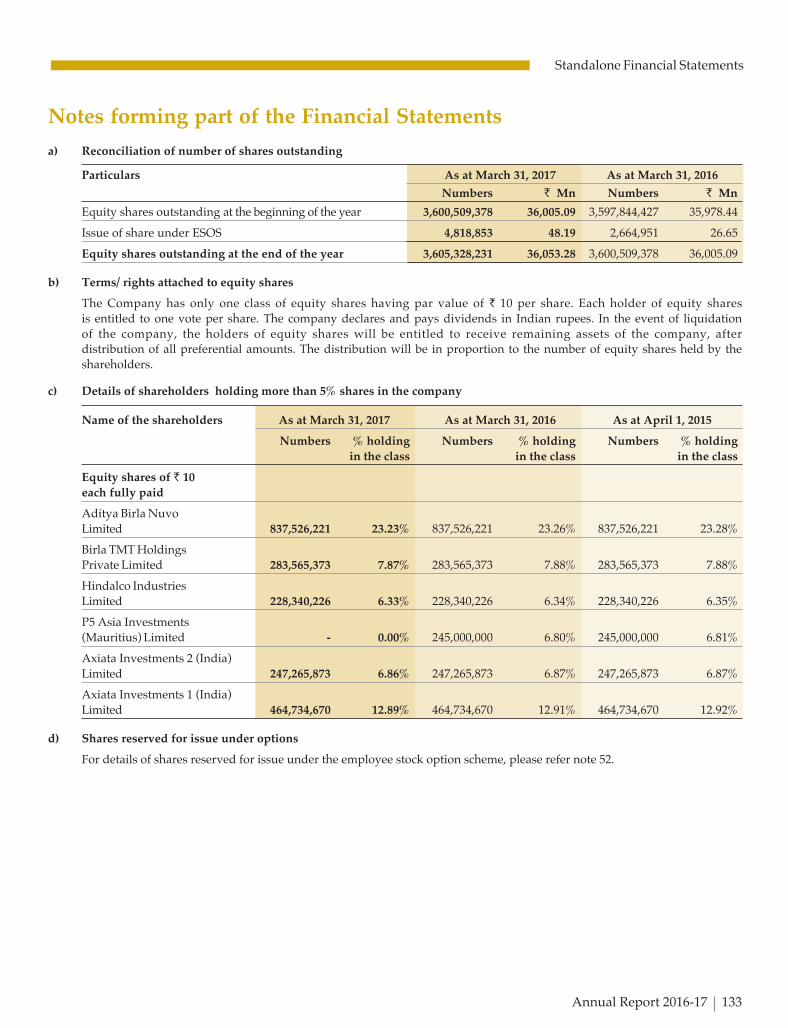
C K
Annual Report 2016-17 133
Standalone Financial Statements
a) Reconciliation of number of shares outstanding
Particulars As at March 31, 2017 As at March 31, 2016
Numbers ` Mn Numbers ` Mn
Equity shares outstanding at the beginning of the year 3,600,509,378 36,005.09 3,597,844,427 35,978.44
Issue of share under ESOS 4,818,853 48.19 2,664,951 26.65
Equity shares outstanding at the end of the year 3,605,328,231 36,053.28 3,600,509,378 36,005.09
b) Terms/ rights attached to equity shares
The Company has only one class of equity shares having par value of ` 10 per share. Each holder of equity sharesis entitled to one vote per share. The company declares and pays dividends in Indian rupees. In the event of liquidationof the company, the holders of equity shares will be entitled to receive remaining assets of the company, afterdistribution of all preferential amounts. The distribution will be in proportion to the number of equity shares held by theshareholders.
c) Details of shareholders holding more than 5% shares in the company
Name of the shareholders As at March 31, 2017 As at March 31, 2016 As at April 1, 2015
Numbers % holding Numbers % holding Numbers % holdingin the class in the class in the class
Equity shares of ` 10each fully paid
Aditya Birla NuvoLimited 837,526,221 23.23% 837,526,221 23.26% 837,526,221 23.28%
Birla TMT HoldingsPrivate Limited 283,565,373 7.87% 283,565,373 7.88% 283,565,373 7.88%
Hindalco IndustriesLimited 228,340,226 6.33% 228,340,226 6.34% 228,340,226 6.35%
P5 Asia Investments(Mauritius) Limited - 0.00% 245,000,000 6.80% 245,000,000 6.81%
Axiata Investments 2 (India)Limited 247,265,873 6.86% 247,265,873 6.87% 247,265,873 6.87%
Axiata Investments 1 (India)Limited 464,734,670 12.89% 464,734,670 12.91% 464,734,670 12.92%
d) Shares reserved for issue under options
For details of shares reserved for issue under the employee stock option scheme, please refer note 52.
Notes forming part of the Financial Statements

C K
134 Idea Cellular Limited
Standalone Financial Statements
21 OTHER EQUITY
Debenture redemption reserve 1,316.93 483.21 341.78
Securities premium account 104,329.67 103,837.69 103,652.02
Employee stock options reserve 1,341.32 1,352.29 775.02
General reserve 20,863.21 20,863.21 20,863.21
Retained earnings 73,333.18 85,110.48 61,522.67
Total 201,184.31 211,646.88 187,154.70
(i) Debenture redemption reserve
Opening balance 483.21 341.78
Transferred from retained earnings 833.72 141.43
Closing balance 1,316.93 483.21
(ii) Securities premium account
Opening balance 103,837.69 103,652.02
Premium on issue of shares under ESOS 48.66 148.46
Transfer from employee stockoptions reserve on exercise of options 443.32 37.21
Closing balance 104,329.67 103,837.69
(iii) Employee stock options reserve
Opening balance 1,352.29 775.02
Share-based payment expenses 432.35 614.48
Transfer to Securities premium account onexercise of options (443.32) (37.21)
Closing balance 1,341.32 1,352.29
(iv) General Reserve
Opening balance and Closing balance 20,863.21 20,863.21
(v) Retained Earnings
Opening balance 85,110.48 61,522.67
Net Profit/(Loss) for the year (8,310.75) 26,462.88
Other Comprehensive Income/(Loss) recognised directlyin retained earnings (32.36) (134.37)
Transfer to Debenture redemption reserve (833.72) (141.43)
Dividends (2,160.62) (2,159.62)
Dividend distribution tax (439.85) (439.65)
Closing balance 73,333.18 85,110.48
Notes forming part of the Financial Statements
Particulars As at As at As atMarch 31, 2017 March 31, 2016 April 1, 2015
` Mn

C K
Annual Report 2016-17 135
Standalone Financial Statements
22 LONG TERM BORROWINGS
a) Secured Loans
Redeemable Non-Convertible Debentures (NCDs) 13,952.36 3,953.01 3,951.62
Term Loans
Foreign currency loan
- From others 19,504.57 30,056.11 39,575.05
Rupee loan
- From banks 44,942.92 4,297.79 11,538.62
- From others - - 2,000.00
Vehicle loan from banks 169.38 291.69 288.89
Total Secured loans 78,569.23 38,598.60 57,354.18
b) Unsecured Loans
Redeemable Non-Convertible Debentures (NCDs) 59,879.12 - -
Term Loans
Foreign currency loan
- From banks 10,580.66 8,836.44 7,095.13
Rupee loan
- From banks - 500.00 -
Total Unsecured Loans 70,459.78 9,336.44 7,095.13
Subtotal (A) 149,029.01 47,935.04 64,449.31
c) Deferred Payment Liabilities towards Spectrum (B) 367,349.27 311,105.38 93,541.51
Total (A + B) 516,378.28 359,040.42 157,990.82
a) Secured Loans are covered by:
Term Loans including current maturities are secured by way of first charge / assignment ranking pari-passu interse thelenders, as under:
i. First charge on all the movable and immovable properties (including intangible assets) of the Company excluding
a) Spectrum and Telecom Licenses;
b) Vehicles up to ` 250 crores; and
c) Passive Telecom Infrastructure.
ii. Rupee Loan amounting to ` 31,500.00 Mn. (March 31, 2016: ` Nil, April 1, 2015: ` Nil) are secured by way of firstcharge on all the movable fixed assets and immovable properties (including intangible assets) of the Companyexcluding
a) Spectrum and Telecom Licenses;
b) Vehicles; and
c) Passive Telecom Infrastructure.
iii. Foreign Currency Loan amounting to ` Nil (March 31, 2016: ` 5,092.32 Mn., April 1, 2015: ` 5,803.22 Mn.) hasadditional security as first priority charge over certain Telecom Licenses.
Notes forming part of the Financial Statements
` Mn
Particulars As at As at As atMarch 31, 2017 March 31, 2016 April 1, 2015

C K
136 Idea Cellular Limited
Standalone Financial Statements
iv. NCDs amounting to ` 3,960.00 Mn. (March 31, 2016: ` 3,960.00 Mn., April 1, 2015: ` 3,960.00 Mn.) have paripassu charge only on the tangible fixed assets excluding passive telecom infrastructure and ` 10,000.00 Mn(March 31, 2016: ` Nil, April 1, 2015: ` Nil) have pari passu charge on movable fixed assets of the companyexcluding :
a) Spectrum and Telecom Licenses
b) Vehicles up to ` 250 crores and
c) Passive Telecom Infrastructure.
v. Vehicle Loans amounting to ` 353.28 Mn. (March 31, 2016: ` 519.37 Mn., April 1, 2015: ` 508.98 Mn.) is secured byhypothecation of Vehicles against which the loans have been taken.
b) Repayment Terms of outstanding long term borrowings (excluding current maturities) as on March 31, 2017
Repayment Terms for Secured Foreign Currency Borrowings
Facility 1 (` 4,095.05 Mn.) - Balance amount is repayable as follows:
Tranche 1 - Balance amount is repayable in 4 equal half yearly installments starting April, 2018
Tranche 2 - Balance amount is repayable in 2 equal half yearly installments starting April, 2020
Facility 2 (` 3,583.19 Mn.) - Balance amount is repayable in 7 equal half yearly installments starting May, 2018
Facility 3 (` 4,165.33 Mn.) - Balance amount is repayable as follows:
Tranche 1 - Balance amount is repayable in 9 equal half yearly installments starting July, 2018
Tranche 2 - Balance amount is repayable in 7 equal half yearly installments starting July, 2018
Facility 4 (` 3,737.75 Mn.) - Balance amount is repayable in 7 equal half yearly installments starting June, 2018
Facility 5 (` 4,519.62 Mn.) - Balance amount is repayable as follows:
1. 3 equal half yearly installments starting September, 2018
2. 6 equal half yearly installments starting August, 2018
Repayment Terms for Secured INR Borrowings
Facility 1 (` 31,500.00 Mn.) - Balance amount is repayable as follows:
1. 8 equal quarterly installments of 1.25% each of the total drawn amount starting June, 2019
2. 12 equal quarterly installments of 3.75% each of the total drawn amount starting June, 2021
3. 8 equal quarterly installments of 5% each of the total drawn amount starting June, 2024
4. 2 equal quarterly installments of 2.5% each of the total drawn amount starting June, 2026.
Facility 2 (` 10,000.00 Mn.) - Repayable in 20 equal quarterly installments starting September, 2021.
Facility 3 (` 3,500.00 Mn.) - Repayable in 20 equal quarterly installments starting September, 2021.
Redeemable Non-Convertible Debentures (NCDs) (` 13,960.00 Mn.) -
1. 9.45% NCDs (396) of ` 10 Mn. each - ` 3,960.00 Mn. is repayable in October, 2019 (Out of the 1,000 NCDs issued inFY 2013, the Company has re-purchased 604 NCDs of ` 10 Mn. each, aggregating to ` 6,040.00 Mn. with an optionto re-issue the same in future)
2. 8.12% NCDs (10,000) of ` 1 Mn. each - ` 10,000.00 Mn. is repayable in February 2024.
Vehicles Loans are repayable in equal monthly installments over the term of the loan ranging from 2 to 4 years.
Repayment Terms for Unsecured Foreign Currency Borrowings
Facility 1 (` 2,569.23 Mn.) - Balance amount is repayable as follows:
1. 5 equal quarterly installments of 4.125% each of the total drawn amount starting April, 2018
2. 4 equal quarterly installments of 4.75% each of the total drawn amount starting July, 2019.
Facility 2 (` 4,668.38 Mn.) - Balance amount is repayable in June, 2018.
Facility 3 (` 3,378.85 Mn.) - Balance amount is repayable in 11 equal half yearly installments starting April, 2018.
Notes forming part of the Financial Statements

C K
Annual Report 2016-17 137
Standalone Financial Statements
Repayment Terms for Unsecured INR Borrowings
Redeemable Non-Convertible Debentures (NCDs) (` 60,000.00 Mn.) -
1. 7.57% NCDs (15,000) of ` 1 Mn. each - ` 15,000.00 Mn. is repayable in December, 2021
2. 7.77% NCDs (15,000) of ` 1 Mn. each - ` 15,000.00 Mn. is repayable in January, 2022
3. 8.04% NCDs (20,000) of ` 1 Mn. each - ` 20,000.00 Mn. is repayable in January, 2022
4. 8.03% NCDs (5,000) of ` 1 Mn. each - ` 5,000.00 Mn. is repayable in January, 2022
5. 8.03% NCDs (5,000) of ` 1 Mn. each - ` 5,000.00 Mn. is repayable in February, 2022
Repayment Terms for Deferred Payment Liability (DPL)
DPL for Spectrum won in November 2012 (` 9,404.62 Mn.) - Balance amount and interest thereon is repayable in6 equated annual installments starting December, 2019.
DPL for Spectrum won in February 2014 (` 69,533.84 Mn.) - Balance amount and interest thereon is repayable in8 equated annual installments starting March, 2019.
DPL for Spectrum won in March 2015 (` 224,033.26 Mn.) - Balance amount and interest thereon is repayable in9 equated annual installments starting April, 2019.
DPL for Spectrum won in October 2016 (` 60,809.90 Mn.) - Balance amount and interest thereon is repayable in10 equated annual installments starting October, 2019.
DPL for Partial Spectrum (` 3,567.65 Mn.) - Balance amount and interest thereon is repayable in 10 equated annualinstallments starting September, 2019.
c) During the year, the Company has re-financed Loans worth ` 4,317.34 Mn. (Previous year ` 10,586.48 Mn.).
` Mn
Particulars As at As at As atMarch 31, 2017 March 31, 2016 April 1, 2015
23 OTHER NON-CURRENT FINANCIAL LIABILITIES
a) Security deposits 36.51 237.82 44.02
b) Payables for capital expenditure 43.35 8.09 56.70
c) Interest accrued but not due on deferredpayment liability 9,954.49 22,593.58 1,139.70
d) Derivative liabilities at fair value through profit or loss - 749.93 1,102.52
Total 10,034.35 23,589.42 2,342.94
24 LONG TERM PROVISIONS
a) Gratuity (refer note 53A) 1,542.84 1,542.62 1,237.21
b) Compensated absences 1,716.69 1,416.59 1,162.99
c) Asset retirement obligation (refer note 51) 51.47 394.10 353.27
Total 3,311.00 3,353.31 2,753.47
25 OTHER NON-CURRENT LIABILITIES
a) Deferred Revenue 4,307.68 3,544.00 3,066.73
b) Others 599.76 550.24 579.34
Total 4,907.44 4,094.24 3,646.07
Notes forming part of the Financial Statements
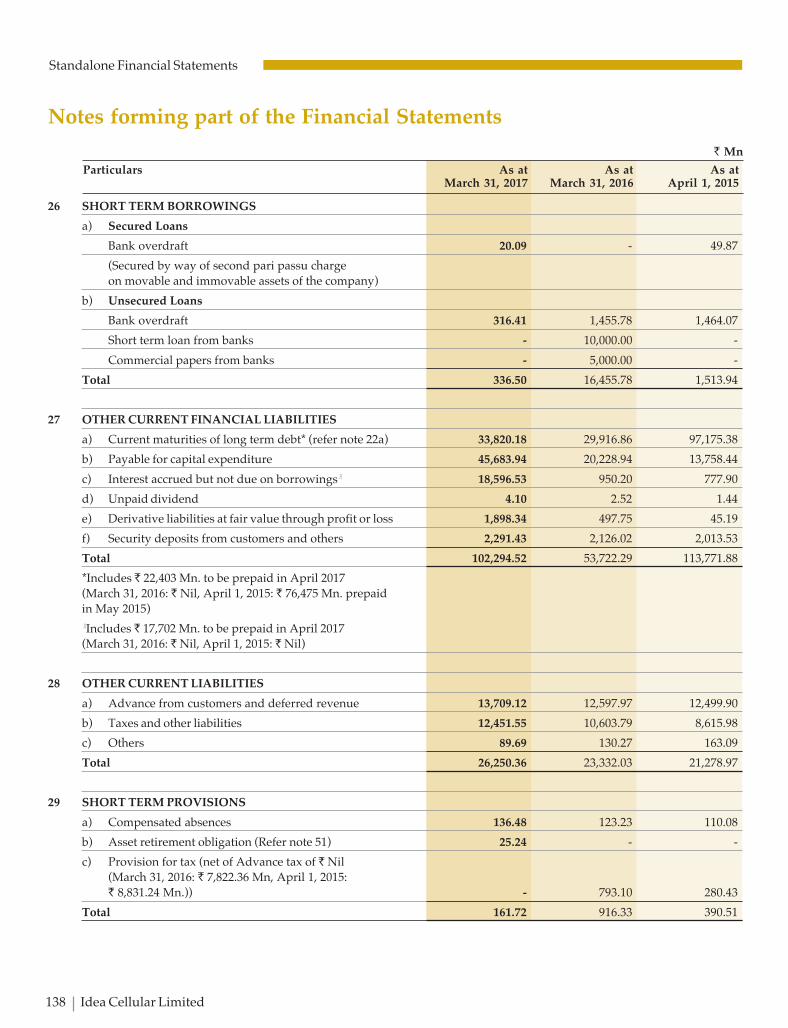
C K
138 Idea Cellular Limited
Standalone Financial Statements
Notes forming part of the Financial Statements
26 SHORT TERM BORROWINGS
a) Secured Loans
Bank overdraft 20.09 - 49.87
(Secured by way of second pari passu chargeon movable and immovable assets of the company)
b) Unsecured Loans
Bank overdraft 316.41 1,455.78 1,464.07
Short term loan from banks - 10,000.00 -
Commercial papers from banks - 5,000.00 -
Total 336.50 16,455.78 1,513.94
27 OTHER CURRENT FINANCIAL LIABILITIES
a) Current maturities of long term debt* (refer note 22a) 33,820.18 29,916.86 97,175.38
b) Payable for capital expenditure 45,683.94 20,228.94 13,758.44
c) Interest accrued but not due on borrowings# 18,596.53 950.20 777.90
d) Unpaid dividend 4.10 2.52 1.44
e) Derivative liabilities at fair value through profit or loss 1,898.34 497.75 45.19
f) Security deposits from customers and others 2,291.43 2,126.02 2,013.53
Total 102,294.52 53,722.29 113,771.88
*Includes ` 22,403 Mn. to be prepaid in April 2017(March 31, 2016: ` Nil, April 1, 2015: ` 76,475 Mn. prepaidin May 2015)
#Includes ` 17,702 Mn. to be prepaid in April 2017(March 31, 2016: ` Nil, April 1, 2015: ` Nil)
28 OTHER CURRENT LIABILITIES
a) Advance from customers and deferred revenue 13,709.12 12,597.97 12,499.90
b) Taxes and other liabilities 12,451.55 10,603.79 8,615.98
c) Others 89.69 130.27 163.09
Total 26,250.36 23,332.03 21,278.97
29 SHORT TERM PROVISIONS
a) Compensated absences 136.48 123.23 110.08
b) Asset retirement obligation (Refer note 51) 25.24 - -
c) Provision for tax (net of Advance tax of ` Nil(March 31, 2016: ` 7,822.36 Mn, April 1, 2015:` 8,831.24 Mn.)) - 793.10 280.43
Total 161.72 916.33 390.51
` Mn
Particulars As at As at As atMarch 31, 2017 March 31, 2016 April 1, 2015

C K
Annual Report 2016-17 139
Standalone Financial Statements
Notes forming part of the Financial Statements
30 OTHER OPERATING INCOME
Liabilities / provisions no longer required written back 88.89 135.26
Miscellaneous receipts 132.45 176.52
Total 221.34 311.78
31 OTHER INCOME
Interest income 124.24 276.64
Gain on Mutual Funds (including fair value gain/(loss)) 1,846.01 1,496.79
Total 1,970.25 1,773.43
32 EMPLOYEE BENEFIT EXPENSES
Salaries, wages and bonus 14,005.61 12,443.15
Contribution to provident and other funds (refer note 53B) 1,043.83 877.74
Share based payment expenses (ESOS) (refer note 52) 425.05 613.01
Staff welfare 611.30 586.64
Recruitment and training 170.59 214.69
Total 16,256.38 14,735.23
33 NETWORK EXPENSES AND IT OUTSOURCING COST
Security service charges 593.34 1,039.94
Power and fuel 29,522.21 24,603.60
Repairs and maintenance - plant and machinery 11,732.35 10,592.19
Switching and cellsites rent 802.79 1,397.21
Lease line and connectivity charges 6,749.54 6,639.46
Network insurance 169.58 180.13
Passive infrastructure charges 50,285.78 42,453.97
Other network operating expenses 1,044.71 1,129.95
IT outsourcing cost 5,748.24 4,619.37
Total 106,648.54 92,655.82
34 LICENSE FEES AND SPECTRUM USAGE CHARGES
License fees 24,897.38 25,078.74
Spectrum usage charges 15,617.45 16,429.09
Total 40,514.83 41,507.83
35 ROAMING AND ACCESS CHARGES
Roaming charges 9,107.52 13,203.70
Access charges 33,646.92 33,449.76
Total 42,754.44 46,653.46
` Mn
Particulars For the year ended For the year endedMarch 31, 2017 March 31, 2016

C K
140 Idea Cellular Limited
Standalone Financial Statements
Notes forming part of the Financial Statements
36 SUBSCRIBER ACQUISITION AND SERVICING EXPENDITURE
Cost of sim and recharge vouchers 2,017.66 1,775.35
Commission to dealers 19,652.71 19,040.32
Customer verification expenses 2,410.15 2,771.11
Collection, telecalling and servicing expenses 5,947.88 5,537.88
Customer retention and customer loyalty expenses 1,413.26 894.82
Total 31,441.66 30,019.48
37 ADMINISTRATION AND OTHER EXPENSES
Repairs and maintenance
Building 112.24 83.41
Others 815.61 499.13
Other insurance 37.42 30.11
Non network rent 1,488.76 1,178.29
Rates and taxes 543.65 158.87
Electricity 568.80 572.95
Printing and stationery 84.00 91.20
Communication expenses 117.77 111.78
Travelling and conveyance 955.41 1,040.07
Bad debts / advances written off 99.77 1,327.57
Allowances for doubtful debts and advances (refer note 50) 1,868.10 275.89
Net loss/(gain) on disposal of property, plant and equipment (150.65) (63.75)
Exchange difference (net) (328.46) 383.15
Bank charges 293.07 243.72
Directors commission - 150.01
Directors Sitting Fees 4.01 3.14
Legal and professional charges 965.61 946.27
Audit fees (refer note 54) 46.00 46.00
CSR expenditure (refer note 55) 369.66 184.69
Miscellaneous expenses 1,777.40 1,423.50
Total 9,668.17 8,686.00
38 FINANCE COSTS
Interest (refer note 59)
- On fixed period loan (Net of ` 1,973.30 Mn. capitalised,Previous year ` 345.02 Mn.) 3,546.50 4,486.68
- On deferred payment liability towards spectrum (Net of` 2,157.11 Mn. capitalised, Previous year ` 18,479.47 Mn.) 35,095.64 13,034.59
- Others 297.83 251.46
Other finance charges 68.03 428.16
Total interest expense 39,008.00 18,200.89
Exchange difference (net) on Foreign currency borrowings (118.36) -
Loss/(gain) on derivatives (including fair value changes on derivatives) 1,218.89 (422.37)
Total 40,108.53 17,778.52
` Mn
Particulars For the year ended For the year endedMarch 31, 2017 March 31, 2016

C K
Annual Report 2016-17 141
Standalone Financial Statements
Notes forming part of the Financial Statements
39. The Department of Telecommunications (DoT) conducted auctions for frequency blocks in the 700, 800, 900, 1800, 2100, 2300 and2500 MHz spectrum bands in October 2016. The Company successfully bid for its spectrum requirements at a total cost of` 127,979.80 Mn. as under:
l 54.6 MHz of 1800 MHz spectrum in the 12 service areas of Maharashtra, Madhya Pradesh, Gujarat, Haryana, Punjab, UttarPradesh (West), Bihar, Rajasthan, Himachal Pradesh, West Bengal, Assam and Jammu & Kashmir
l 20 MHz of 2100 MHz spectrum in the 4 service areas of Rajasthan, Mumbai, Bihar and Uttar Pradesh (East)
l 30 MHz of 2300 MHz spectrum in the service areas of Maharashtra, Madhya Pradesh and Kerala
l 170 MHz of 2500 MHz spectrum in the 16 service areas of Maharashtra, Madhya Pradesh, Kerala, Andhra Pradesh, Gujarat,Uttar Pradesh (West), Uttar Pradesh (East), Haryana, Bihar, Rajasthan, West Bengal, Orissa, Assam, Himachal Pradesh,Jammu & Kashmir and North east service area.
The validity of the above spectrum will be for a 20 year period starting from the spectrum assignment date. The entire spectrumexcept 2 MHz of 1800 MHz spectrum in Maharashtra service area has been assigned on November 10, 2016. As per the paymentoptions available, the Company has chosen the deferred payment option. The upfront payment amount of ̀ 63,989.90 Mn. underthe deferred payment option was paid on October 20, 2016, the due date for payment.
The above has resulted in an addition to the Intangible Assets (including intangible assets under development) during the yearby ` 121,619.80 Mn. along with corresponding Deferred Payment Liability of ` 60,809.90 Mn. which is reflected under Longterm Borrowings. An amount of ` 3,180 Mn. paid towards the upfront payment for the unassigned spectrum in Maharashtraservice area is included in Capital Advances and the deferred payment obligation of ̀ 3,180 Mn. along with accrued interest of` 132.07 Mn. is disclosed under Capital Commitments.
40. On March 20, 2017, the board of directors of the Company approved the scheme of amalgamation of Vodafone India Ltd (VIL)and its wholly owned subsidiary Vodafone Mobile Services Ltd (VMSL) with the Company subject to necessary approvals ofshareholders, creditors, SEBI, Stock Exchanges, the Competition Commission of India, the Department of Telecommunications(DoT), the Foreign Investment Promotion Board, the Reserve Bank of India, other governmental authorities and third parties asmay be required.
On the scheme of amalgamation becoming effective, the Company shall issue an aggregate number of equity shares of theCompany (credited as fully paid up) to VIL equal to 47% of the post issue paid up capital of the Company on a fully diluted basis.Immediately thereafter, on the amalgamation of VIL with the Company, the shares issued to VIL pursuant to amalgamation ofVMSL shall stand cancelled and, post such cancellation, the Company shall issue an aggregate number of equity shares of theCompany (credited as fully paid up) equal to 50% of the post issue paid up capital of the Company to the shareholders of VIL.
Existing shareholders of VIL (VIL promoters) will own 45.1% of the combined company after transferring a 4.9% stake to theAditya Birla Group for an agreed consideration concurrent with completion of the merger. The Aditya Birla Group will then own26.0% of the combined Company and the Company’s other shareholders will own the remaining 28.9%.
The Aditya Birla Group has the right to acquire up to 9.5% additional stake from VIL promoters under an agreed mechanismwith a view to equalising the shareholdings over time. Until equalisation is achieved, the additional shares held by VIL promoterswill be restricted and votes will be exercised jointly under the terms of the shareholders’ agreement. The combination will bejointly controlled by VIL promoters and the Aditya Birla Group.
41. During the year, the Company had entered into a business transfer agreement to transfer its Tower infrastructure undertaking toits wholly owned subsidiary ICISL on a going concern basis w.e.f. August 1, 2016.
Basis the agreement, the transfer of undertaking consisting of Telecom towers along with other assets and liabilities, includinghuman resources deployed has been effected for the book value of undertaking of ̀ 4,864.58 Mn. against which ICISL has issued10,000 equity shares of face value of ` 10 each to the Company.
42. Capital and other Commitments:
Estimated amount of commitments are as follows:
l Spectrum won in auctions ` 3,312.07 Mn. (Previous year: ` Nil, Transition date: ` 282,025.25 Mn.)
l Contracts remaining to be executed for capital expenditure (net of advances) and not provided for are ` 20,097.43 Mn.(Previous year: ` 19,815.03 Mn. Transition date: ` 27,661.71 Mn.)
l Long term contracts remaining to be executed including early termination commitments (if any) are ̀ 17,600.26 Mn. (Previousyear: ` 14,800.13 Mn. Transition date: ` 17,866.22 Mn.)

C K
142 Idea Cellular Limited
Standalone Financial Statements
Notes forming part of the Financial Statements
43. Contingent Liabilities:
A) Licensing Disputes:
i. One Time Spectrum Charges:
In Financial year 2012-13, DoT had issued demand notices towards one time spectrum charges
- For spectrum beyond 6.2 MHz in respective service areas for retrospective period from July 1, 2008 to December 31,2012, amounting to ` 3,691.30 Mn., and
- For spectrum beyond 4.4 MHz in respective service areas effective January 1, 2013 till expiry of the period as perrespective licenses amounting to ` 17,443.70 Mn.
In the opinion of Company, inter-alia, the above demands amount to alteration of financial terms of the licenses issued in thepast. The Company had therefore, petitioned the Hon’ble High Court of Bombay, where the matter was admitted and iscurrently sub-judice. The Hon’ble High Court of Bombay has directed the DoT, not to take any coercive action until thematter is further heard. No effects have been given in the financial statements for the above.
ii. Other Licensing Disputes - ` 58,318.18 Mn. (Previous year: ` 30,501.90 Mn., Transition date: ` 35,520.91 Mn.):
- Demands due to difference in interpretation of definition of adjusted gross revenue (AGR) and other license feeassessment related matters. Most of these demands are currently before the Hon’ble TDSAT, Hon’ble High court andHon’ble Supreme Court.
- Disputes relating to alleged non-compliance of licensing conditions & other disputes with DoT, either filed by or againstthe Company and pending before Hon’ble Supreme Court / TDSAT.
- Demands on account of alleged violations in license conditions relating to amalgamation of erstwhile SpiceCommunications Limited currently sub-judice before the Hon’ble TDSAT.
- Demand with respect to upfront spectrum amounts for continuation of services from February 2, 2012 till various datesin the service areas where the licenses were quashed following the Hon’ble Supreme Court Order.
B) Aditya Birla Telecom Limited ("ABTL") has an obligation to buy the equity shares of Indus held by P5 Asia Holdings Investments(Mauritius) Limited (P5) at fair value if:
i. ABTL sells its stake in Indus before P5 and P5 is not able to find a buyer for their stake in Indus, or
ii. Aditya Birla Group companies collectively cease to be the single largest shareholder of the Company before P5 is able to sellits stake in Indus.
In the event ABTL is not able to fulfill its obligation, the same will devolve on the company.
C) Other Matters ` Mn
Particulars As at As at As at
March 31, 2017 March 31, 2016 April 1, 2015
Income tax matters not acknowledged as debts (see note i below) 73,969.18 63,676.98 66,566.75
Sales tax and entertainment tax matters not acknowledgedas debts (see note ii below) 1,684.32 1,508.10 994.34
Service tax matters not acknowledged as debts (see note iii below) 3,041.46 3,800.83 1,364.22
Entry tax and customs matters not acknowledged as debts(see note iv below) 332.70 302.24 386.57
Other claims not acknowledged as debts (see note v below) 2,473.84 2,404.74 2,370.12
i. Income Tax Matters
- Appeals filed by the Company against the demands raised by Income Tax Authorities which are pending before AppellateAuthorities include mainly disputes on account of incorrect disallowance of revenue share license fee, disputes on non-applicability of tax deduction at source on prepaid margin allowed to prepaid distributors & roaming settlements,disallowance of interest proportionate to interest free advances given to wholly owned subsidiaries etc.
- Appeal filed for tax demand on difference between revalued figures of Investment in Indus held through a whollyowned subsidiary and book value of Passive Infrastructure assets transferred to step down subsidiary through a HighCourt approved scheme.
ii. Sales Tax and Entertainment Tax
- Sales Tax demands mainly relates to the demands raised by the VAT/Sales Tax authorities of few states on BroadbandConnectivity, SIM cards etc. on which the Company has already paid Service Tax.
- Demand of tax for non-submission of Declaration forms viz. C forms & F forms in stipulated time limit.
- In one State entertainment tax is being demanded on revenue from value added services. However, the Company haschallenged the constitutional validity of the levy.
- Amounts in respect of Jammu & Kashmir General Sales Tax Amnesty scheme pending clarification / notification.
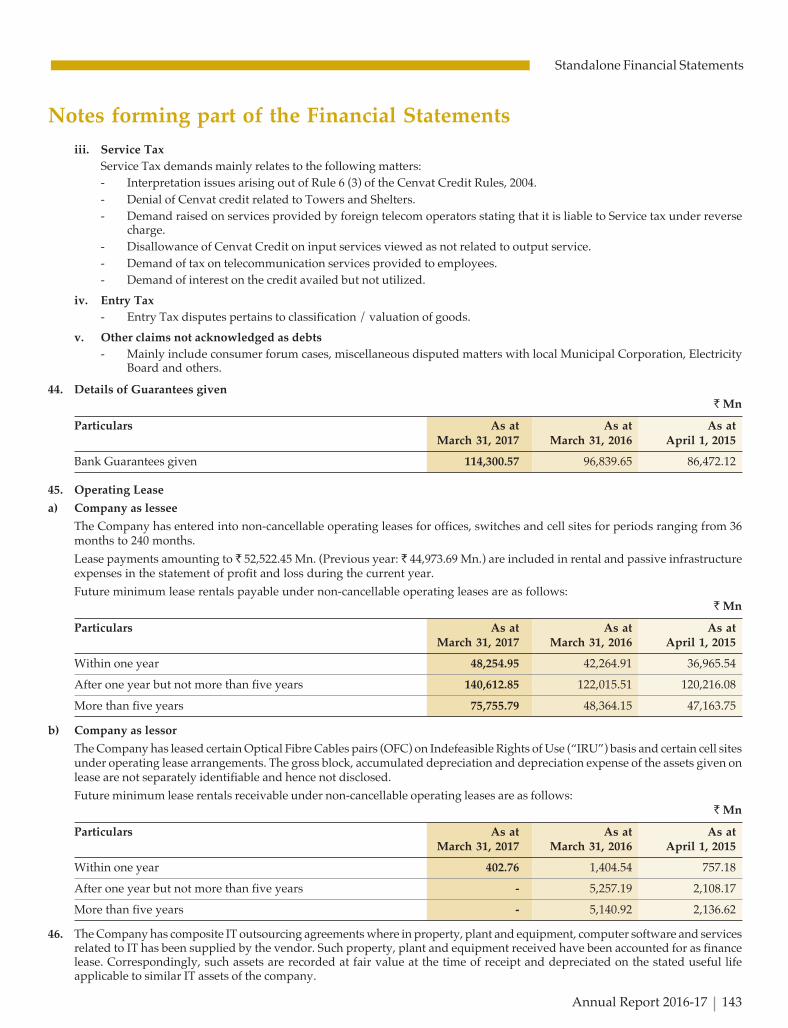
C K
Annual Report 2016-17 143
Standalone Financial Statements
iii. Service Tax
Service Tax demands mainly relates to the following matters:
- Interpretation issues arising out of Rule 6 (3) of the Cenvat Credit Rules, 2004.
- Denial of Cenvat credit related to Towers and Shelters.
- Demand raised on services provided by foreign telecom operators stating that it is liable to Service tax under reversecharge.
- Disallowance of Cenvat Credit on input services viewed as not related to output service.
- Demand of tax on telecommunication services provided to employees.
- Demand of interest on the credit availed but not utilized.
iv. Entry Tax
- Entry Tax disputes pertains to classification / valuation of goods.
v. Other claims not acknowledged as debts
- Mainly include consumer forum cases, miscellaneous disputed matters with local Municipal Corporation, ElectricityBoard and others.
44. Details of Guarantees given` Mn
Particulars As at As at As atMarch 31, 2017 March 31, 2016 April 1, 2015
Bank Guarantees given 114,300.57 96,839.65 86,472.12
45. Operating Lease
a) Company as lessee
The Company has entered into non-cancellable operating leases for offices, switches and cell sites for periods ranging from 36months to 240 months.
Lease payments amounting to ` 52,522.45 Mn. (Previous year: ` 44,973.69 Mn.) are included in rental and passive infrastructureexpenses in the statement of profit and loss during the current year.
Future minimum lease rentals payable under non-cancellable operating leases are as follows:` Mn
Particulars As at As at As atMarch 31, 2017 March 31, 2016 April 1, 2015
Within one year 48,254.95 42,264.91 36,965.54
After one year but not more than five years 140,612.85 122,015.51 120,216.08
More than five years 75,755.79 48,364.15 47,163.75
b) Company as lessor
The Company has leased certain Optical Fibre Cables pairs (OFC) on Indefeasible Rights of Use (“IRU”) basis and certain cell sitesunder operating lease arrangements. The gross block, accumulated depreciation and depreciation expense of the assets given onlease are not separately identifiable and hence not disclosed.
Future minimum lease rentals receivable under non-cancellable operating leases are as follows:` Mn
Particulars As at As at As atMarch 31, 2017 March 31, 2016 April 1, 2015
Within one year 402.76 1,404.54 757.18
After one year but not more than five years - 5,257.19 2,108.17
More than five years - 5,140.92 2,136.62
46. The Company has composite IT outsourcing agreements where in property, plant and equipment, computer software and servicesrelated to IT has been supplied by the vendor. Such property, plant and equipment received have been accounted for as financelease. Correspondingly, such assets are recorded at fair value at the time of receipt and depreciated on the stated useful lifeapplicable to similar IT assets of the company.
Notes forming part of the Financial Statements

C K
144 Idea Cellular Limited
Standalone Financial Statements
Notes forming part of the Financial Statements
47. Details of Current Investments
Particulars As at March 31, 2017 As at March 31, 2016 As at April 1, 2015
Qty in ‘000 ` in Mn. Qty in ‘000 ` in Mn. Qty in ‘000 ` in Mn.
Units Value Units Value Units Value
Birla Sun Life Cash Plus - Direct – Growth 138,096.76 36,085.95 15,266.64 3,714.59 200,491.25 45,029.65
DSP BlackRock Liquidity Fund - Direct –Growth 537.59 1,250.32 - - 237.46 475.38
Reliance Liquidity Fund - Direct – Growth 510.11 1,250.38 - - 1,423.46 3,001.62
Birla Sun Life Floating Rate Fund - STP -Direct – Growth - - - - 80,568.62 15,011.81
HDFC Cash Management Fund - SavingsPlan - Direct – Growth - - - - 119,840.03 3,501.62
ICICI Prudential Liquid -Direct- Growth - - - - 179,708.15 37,217.38
JPMorgan India Liquid Fund - Direct – Growth - - - - 55,087.31 1,000.35
IDFC Cash Fund - Direct – Growth 167.07 330.08 135.89 250.29 588.42 1,000.66
Tata Liquid Fund - Direct – Growth - - 89.48 250.25 387.34 1,000.60
DWS Insta Cash Plus Fund - Direct – Growth - - - - 5,506.14 1,000.53
Kotak Floater - ST - Direct – Growth - - - - 1,526.50 3,503.83
Religare Invesco Liquid Fund - Direct - Growth - - 479.94 1,000.73 - -
HDFC Liquid Fund - Direct - Growth - - 334.71 1,000.85 - -
Reliance Liquid Fund - TP - Direct – Growth - - 270.89 1,000.93 - -
ICICI Prudential Money Market Fund -Direct- Growth - - 4,775.70 1,000.82 - -
Birla Sun Life Savings Fund - Direct – Growth - - 374.38 110.00 - -
UTI-Liquid Cash Plan -Direct- Growth 375.58 1,000.27 - - - -
Kotak Liquid Scheme - Plan A - Direct – Growth 100.10 330.09 - - - -
Total 139,787.21 40,247.09 21,727.63 8,328.46 645,364.68 111,743.43
48. Details of Foreign Currency Exposures
A. Hedged by a Derivative InstrumentAmount in Mn
Particulars As at As at As atMarch 31, 2017 March 31, 2016 April 1, 2015
Foreign Currency Loan
Foreign Currency Loan in USD 127.03 254.05 528.21
Equivalent INR of Foreign Currency Loan 10,000.89 18,996.80 33,695.31
Trade Payables and Other Current Financial Liabilities
Trade Payables in USD 161.59 61.79 32.50
Interest accrued but not due on Foreign Currency Loans in USD 0.05 0.41 1.56
Equivalent INR of Trade Payables and Other CurrentFinancial Liabilities 10,886.76 4,248.96 2,153.38
(Amount in INR represents conversion at hedged rate)
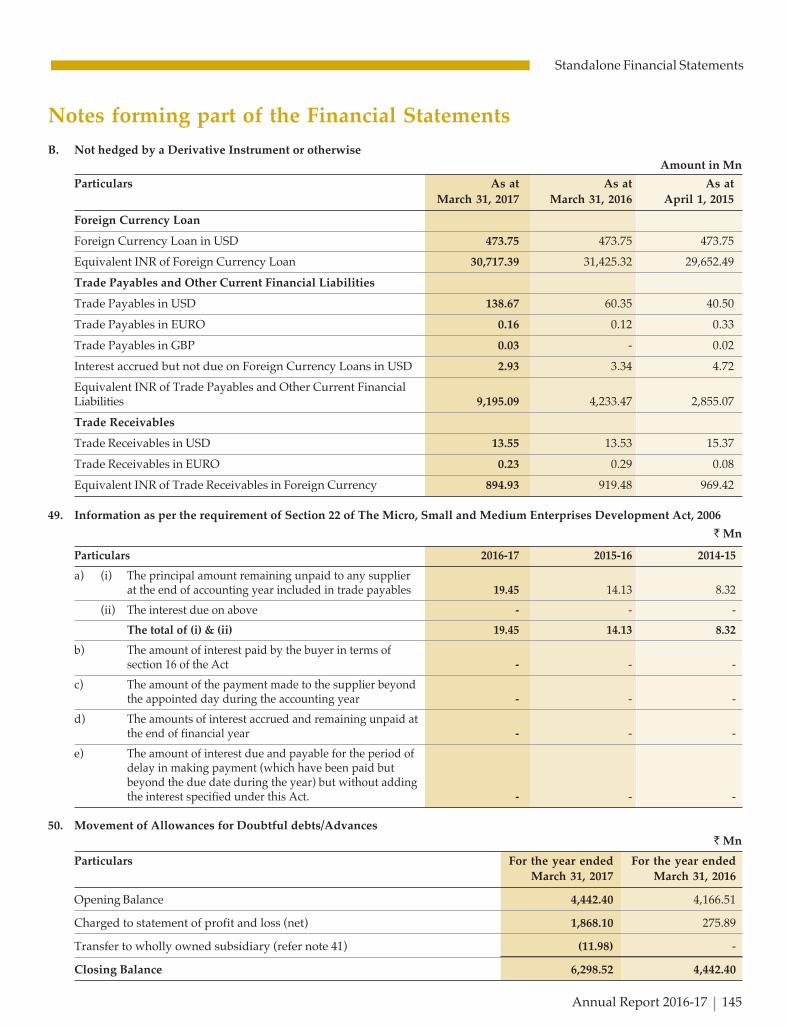
C K
Annual Report 2016-17 145
Standalone Financial Statements
B. Not hedged by a Derivative Instrument or otherwiseAmount in Mn
Particulars As at As at As at
March 31, 2017 March 31, 2016 April 1, 2015
Foreign Currency Loan
Foreign Currency Loan in USD 473.75 473.75 473.75
Equivalent INR of Foreign Currency Loan 30,717.39 31,425.32 29,652.49
Trade Payables and Other Current Financial Liabilities
Trade Payables in USD 138.67 60.35 40.50
Trade Payables in EURO 0.16 0.12 0.33
Trade Payables in GBP 0.03 - 0.02
Interest accrued but not due on Foreign Currency Loans in USD 2.93 3.34 4.72
Equivalent INR of Trade Payables and Other Current FinancialLiabilities 9,195.09 4,233.47 2,855.07
Trade Receivables
Trade Receivables in USD 13.55 13.53 15.37
Trade Receivables in EURO 0.23 0.29 0.08
Equivalent INR of Trade Receivables in Foreign Currency 894.93 919.48 969.42
49. Information as per the requirement of Section 22 of The Micro, Small and Medium Enterprises Development Act, 2006
` Mn
Particulars 2016-17 2015-16 2014-15
a) (i) The principal amount remaining unpaid to any supplierat the end of accounting year included in trade payables 19.45 14.13 8.32
(ii) The interest due on above - - -
The total of (i) & (ii) 19.45 14.13 8.32
b) The amount of interest paid by the buyer in terms ofsection 16 of the Act - - -
c) The amount of the payment made to the supplier beyondthe appointed day during the accounting year - - -
d) The amounts of interest accrued and remaining unpaid atthe end of financial year - - -
e) The amount of interest due and payable for the period ofdelay in making payment (which have been paid butbeyond the due date during the year) but without addingthe interest specified under this Act. - - -
50. Movement of Allowances for Doubtful debts/Advances` Mn
Particulars For the year ended For the year endedMarch 31, 2017 March 31, 2016
Opening Balance 4,442.40 4,166.51
Charged to statement of profit and loss (net) 1,868.10 275.89
Transfer to wholly owned subsidiary (refer note 41) (11.98) -
Closing Balance 6,298.52 4,442.40
Notes forming part of the Financial Statements
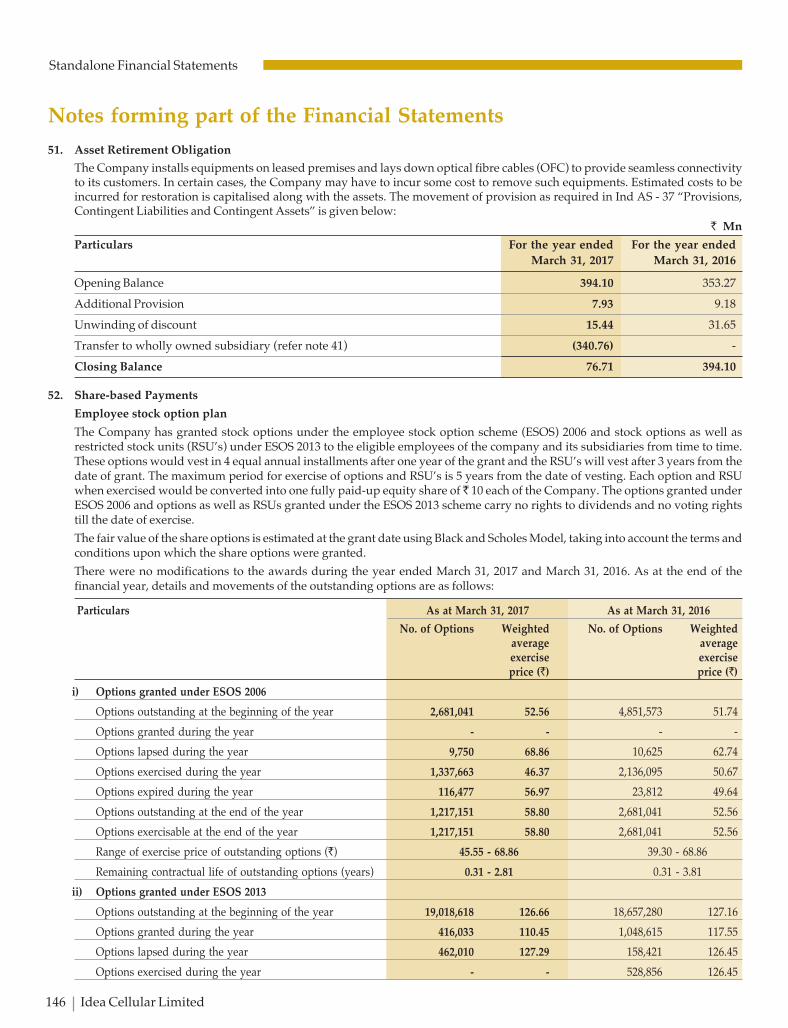
C K
146 Idea Cellular Limited
Standalone Financial Statements
Notes forming part of the Financial Statements
51. Asset Retirement Obligation
The Company installs equipments on leased premises and lays down optical fibre cables (OFC) to provide seamless connectivityto its customers. In certain cases, the Company may have to incur some cost to remove such equipments. Estimated costs to beincurred for restoration is capitalised along with the assets. The movement of provision as required in Ind AS - 37 “Provisions,Contingent Liabilities and Contingent Assets” is given below:
` Mn
Particulars For the year ended For the year ended
March 31, 2017 March 31, 2016
Opening Balance 394.10 353.27
Additional Provision 7.93 9.18
Unwinding of discount 15.44 31.65
Transfer to wholly owned subsidiary (refer note 41) (340.76) -
Closing Balance 76.71 394.10
52. Share-based Payments
Employee stock option plan
The Company has granted stock options under the employee stock option scheme (ESOS) 2006 and stock options as well asrestricted stock units (RSU’s) under ESOS 2013 to the eligible employees of the company and its subsidiaries from time to time.These options would vest in 4 equal annual installments after one year of the grant and the RSU’s will vest after 3 years from thedate of grant. The maximum period for exercise of options and RSU’s is 5 years from the date of vesting. Each option and RSUwhen exercised would be converted into one fully paid-up equity share of ̀ 10 each of the Company. The options granted underESOS 2006 and options as well as RSUs granted under the ESOS 2013 scheme carry no rights to dividends and no voting rightstill the date of exercise.
The fair value of the share options is estimated at the grant date using Black and Scholes Model, taking into account the terms andconditions upon which the share options were granted.
There were no modifications to the awards during the year ended March 31, 2017 and March 31, 2016. As at the end of thefinancial year, details and movements of the outstanding options are as follows:
Particulars As at March 31, 2017 As at March 31, 2016
No. of Options Weighted No. of Options Weightedaverage averageexercise exerciseprice (`) price (`)
i) Options granted under ESOS 2006
Options outstanding at the beginning of the year 2,681,041 52.56 4,851,573 51.74
Options granted during the year - - - -
Options lapsed during the year 9,750 68.86 10,625 62.74
Options exercised during the year 1,337,663 46.37 2,136,095 50.67
Options expired during the year 116,477 56.97 23,812 49.64
Options outstanding at the end of the year 1,217,151 58.80 2,681,041 52.56
Options exercisable at the end of the year 1,217,151 58.80 2,681,041 52.56
Range of exercise price of outstanding options (`) 45.55 - 68.86 39.30 - 68.86
Remaining contractual life of outstanding options (years) 0.31 - 2.81 0.31 - 3.81
ii) Options granted under ESOS 2013
Options outstanding at the beginning of the year 19,018,618 126.66 18,657,280 127.16
Options granted during the year 416,033 110.45 1,048,615 117.55
Options lapsed during the year 462,010 127.29 158,421 126.45
Options exercised during the year - - 528,856 126.45
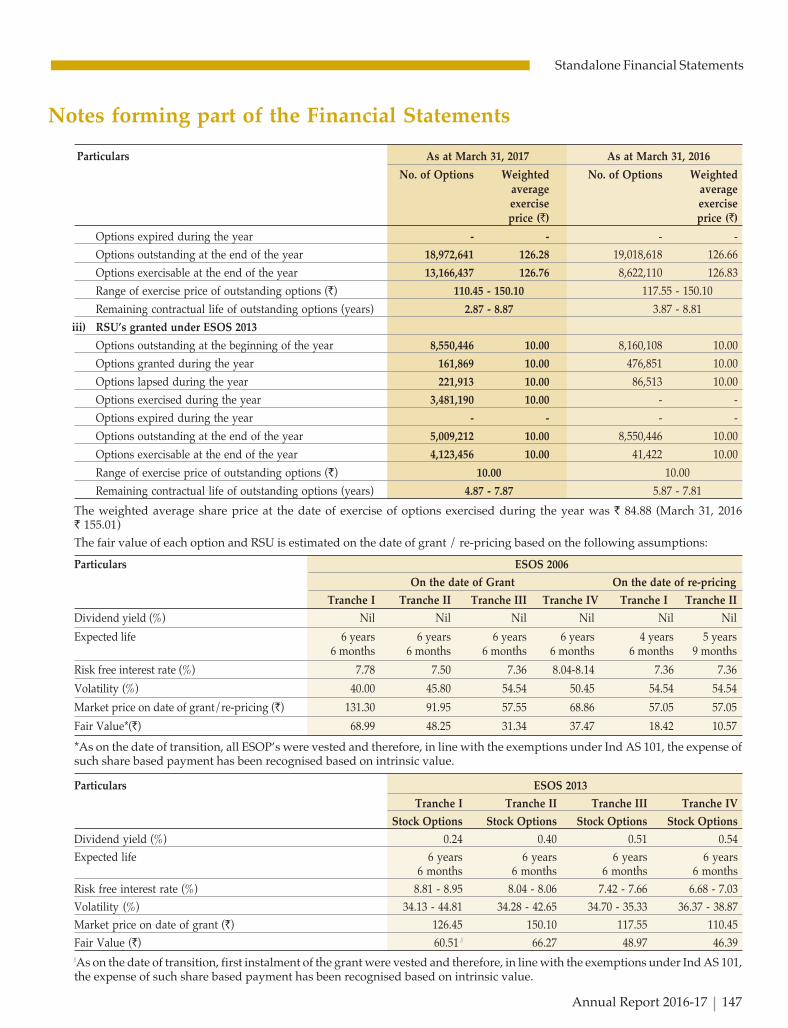
C K
Annual Report 2016-17 147
Standalone Financial Statements
Options expired during the year - - - -
Options outstanding at the end of the year 18,972,641 126.28 19,018,618 126.66
Options exercisable at the end of the year 13,166,437 126.76 8,622,110 126.83
Range of exercise price of outstanding options (`) 110.45 - 150.10 117.55 - 150.10
Remaining contractual life of outstanding options (years) 2.87 - 8.87 3.87 - 8.81
iii) RSU’s granted under ESOS 2013
Options outstanding at the beginning of the year 8,550,446 10.00 8,160,108 10.00
Options granted during the year 161,869 10.00 476,851 10.00
Options lapsed during the year 221,913 10.00 86,513 10.00
Options exercised during the year 3,481,190 10.00 - -
Options expired during the year - - - -
Options outstanding at the end of the year 5,009,212 10.00 8,550,446 10.00
Options exercisable at the end of the year 4,123,456 10.00 41,422 10.00
Range of exercise price of outstanding options (`) 10.00 10.00
Remaining contractual life of outstanding options (years) 4.87 - 7.87 5.87 - 7.81
The weighted average share price at the date of exercise of options exercised during the year was ` 84.88 (March 31, 2016` 155.01)
The fair value of each option and RSU is estimated on the date of grant / re-pricing based on the following assumptions:
Particulars ESOS 2006
On the date of Grant On the date of re-pricing
Tranche I Tranche II Tranche III Tranche IV Tranche I Tranche II
Dividend yield (%) Nil Nil Nil Nil Nil Nil
Expected life 6 years 6 years 6 years 6 years 4 years 5 years6 months 6 months 6 months 6 months 6 months 9 months
Risk free interest rate (%) 7.78 7.50 7.36 8.04-8.14 7.36 7.36
Volatility (%) 40.00 45.80 54.54 50.45 54.54 54.54
Market price on date of grant/re-pricing (`) 131.30 91.95 57.55 68.86 57.05 57.05
Fair Value*(`) 68.99 48.25 31.34 37.47 18.42 10.57
*As on the date of transition, all ESOP’s were vested and therefore, in line with the exemptions under Ind AS 101, the expense ofsuch share based payment has been recognised based on intrinsic value.
Particulars ESOS 2013
Tranche I Tranche II Tranche III Tranche IV
Stock Options Stock Options Stock Options Stock Options
Dividend yield (%) 0.24 0.40 0.51 0.54
Expected life 6 years 6 years 6 years 6 years6 months 6 months 6 months 6 months
Risk free interest rate (%) 8.81 - 8.95 8.04 - 8.06 7.42 - 7.66 6.68 - 7.03
Volatility (%) 34.13 - 44.81 34.28 - 42.65 34.70 - 35.33 36.37 - 38.87
Market price on date of grant (`) 126.45 150.10 117.55 110.45
Fair Value (`) 60.51# 66.27 48.97 46.39#As on the date of transition, first instalment of the grant were vested and therefore, in line with the exemptions under Ind AS 101,the expense of such share based payment has been recognised based on intrinsic value.
Particulars As at March 31, 2017 As at March 31, 2016
No. of Options Weighted No. of Options Weightedaverage averageexercise exerciseprice (`) price (`)
Notes forming part of the Financial Statements
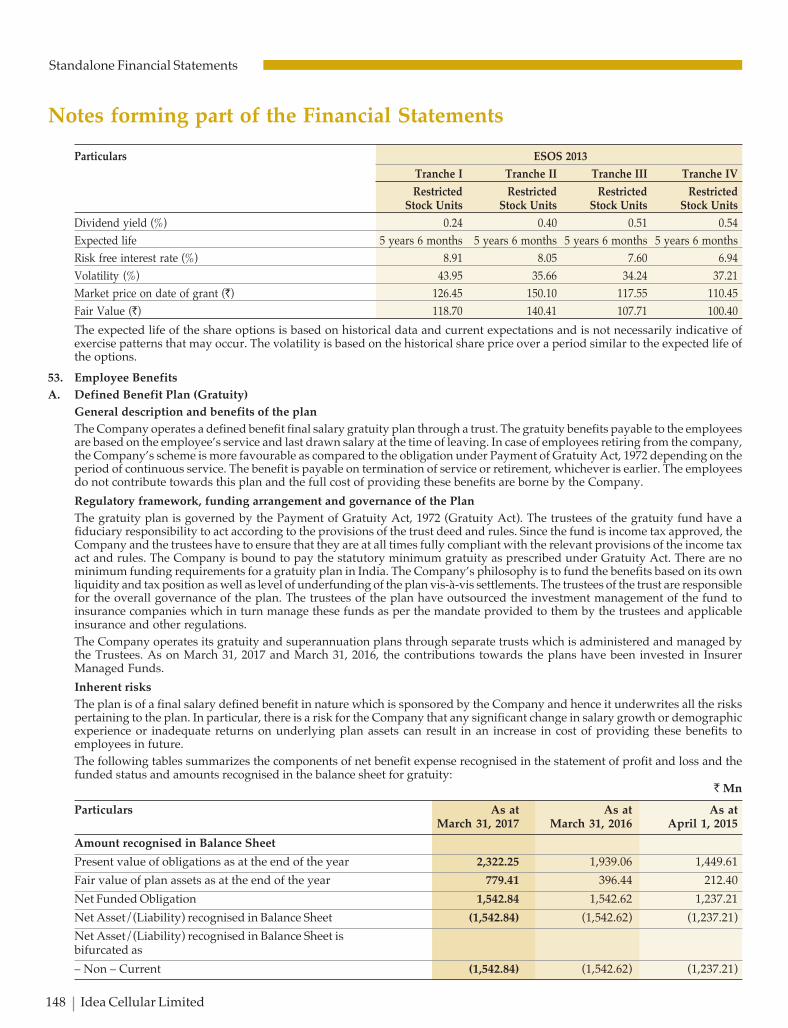
C K
148 Idea Cellular Limited
Standalone Financial Statements
Particulars ESOS 2013
Tranche I Tranche II Tranche III Tranche IV
Restricted Restricted Restricted RestrictedStock Units Stock Units Stock Units Stock Units
Dividend yield (%) 0.24 0.40 0.51 0.54
Expected life 5 years 6 months 5 years 6 months 5 years 6 months 5 years 6 months
Risk free interest rate (%) 8.91 8.05 7.60 6.94
Volatility (%) 43.95 35.66 34.24 37.21
Market price on date of grant (`) 126.45 150.10 117.55 110.45
Fair Value (`) 118.70 140.41 107.71 100.40
The expected life of the share options is based on historical data and current expectations and is not necessarily indicative ofexercise patterns that may occur. The volatility is based on the historical share price over a period similar to the expected life ofthe options.
53. Employee Benefits
A. Defined Benefit Plan (Gratuity)
General description and benefits of the plan
The Company operates a defined benefit final salary gratuity plan through a trust. The gratuity benefits payable to the employeesare based on the employee’s service and last drawn salary at the time of leaving. In case of employees retiring from the company,the Company’s scheme is more favourable as compared to the obligation under Payment of Gratuity Act, 1972 depending on theperiod of continuous service. The benefit is payable on termination of service or retirement, whichever is earlier. The employeesdo not contribute towards this plan and the full cost of providing these benefits are borne by the Company.
Regulatory framework, funding arrangement and governance of the Plan
The gratuity plan is governed by the Payment of Gratuity Act, 1972 (Gratuity Act). The trustees of the gratuity fund have afiduciary responsibility to act according to the provisions of the trust deed and rules. Since the fund is income tax approved, theCompany and the trustees have to ensure that they are at all times fully compliant with the relevant provisions of the income taxact and rules. The Company is bound to pay the statutory minimum gratuity as prescribed under Gratuity Act. There are nominimum funding requirements for a gratuity plan in India. The Company’s philosophy is to fund the benefits based on its ownliquidity and tax position as well as level of underfunding of the plan vis-à-vis settlements. The trustees of the trust are responsiblefor the overall governance of the plan. The trustees of the plan have outsourced the investment management of the fund toinsurance companies which in turn manage these funds as per the mandate provided to them by the trustees and applicableinsurance and other regulations.
The Company operates its gratuity and superannuation plans through separate trusts which is administered and managed bythe Trustees. As on March 31, 2017 and March 31, 2016, the contributions towards the plans have been invested in InsurerManaged Funds.
Inherent risks
The plan is of a final salary defined benefit in nature which is sponsored by the Company and hence it underwrites all the riskspertaining to the plan. In particular, there is a risk for the Company that any significant change in salary growth or demographicexperience or inadequate returns on underlying plan assets can result in an increase in cost of providing these benefits toemployees in future.
The following tables summarizes the components of net benefit expense recognised in the statement of profit and loss and thefunded status and amounts recognised in the balance sheet for gratuity:
` Mn
Particulars As at As at As atMarch 31, 2017 March 31, 2016 April 1, 2015
Amount recognised in Balance Sheet
Present value of obligations as at the end of the year 2,322.25 1,939.06 1,449.61
Fair value of plan assets as at the end of the year 779.41 396.44 212.40
Net Funded Obligation 1,542.84 1,542.62 1,237.21
Net Asset/(Liability) recognised in Balance Sheet (1,542.84) (1,542.62) (1,237.21)
Net Asset/(Liability) recognised in Balance Sheet isbifurcated as
– Non – Current (1,542.84) (1,542.62) (1,237.21)
Notes forming part of the Financial Statements
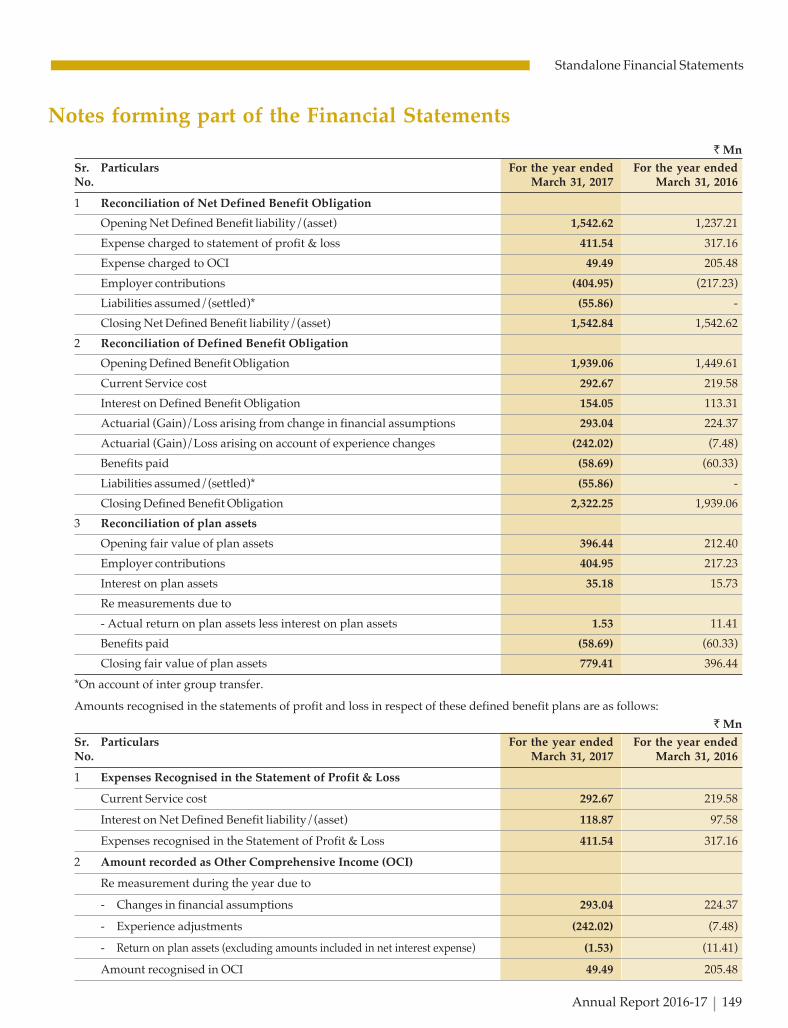
C K
Annual Report 2016-17 149
Standalone Financial Statements
` Mn
Sr. Particulars For the year ended For the year endedNo. March 31, 2017 March 31, 2016
1 Reconciliation of Net Defined Benefit Obligation
Opening Net Defined Benefit liability/(asset) 1,542.62 1,237.21
Expense charged to statement of profit & loss 411.54 317.16
Expense charged to OCI 49.49 205.48
Employer contributions (404.95) (217.23)
Liabilities assumed/(settled)* (55.86) -
Closing Net Defined Benefit liability/(asset) 1,542.84 1,542.62
2 Reconciliation of Defined Benefit Obligation
Opening Defined Benefit Obligation 1,939.06 1,449.61
Current Service cost 292.67 219.58
Interest on Defined Benefit Obligation 154.05 113.31
Actuarial (Gain)/Loss arising from change in financial assumptions 293.04 224.37
Actuarial (Gain)/Loss arising on account of experience changes (242.02) (7.48)
Benefits paid (58.69) (60.33)
Liabilities assumed/(settled)* (55.86) -
Closing Defined Benefit Obligation 2,322.25 1,939.06
3 Reconciliation of plan assets
Opening fair value of plan assets 396.44 212.40
Employer contributions 404.95 217.23
Interest on plan assets 35.18 15.73
Re measurements due to
- Actual return on plan assets less interest on plan assets 1.53 11.41
Benefits paid (58.69) (60.33)
Closing fair value of plan assets 779.41 396.44
*On account of inter group transfer.
Amounts recognised in the statements of profit and loss in respect of these defined benefit plans are as follows:
` Mn
Sr. Particulars For the year ended For the year endedNo. March 31, 2017 March 31, 2016
1 Expenses Recognised in the Statement of Profit & Loss
Current Service cost 292.67 219.58
Interest on Net Defined Benefit liability/(asset) 118.87 97.58
Expenses recognised in the Statement of Profit & Loss 411.54 317.16
2 Amount recorded as Other Comprehensive Income (OCI)
Re measurement during the year due to
- Changes in financial assumptions 293.04 224.37
- Experience adjustments (242.02) (7.48)
- Return on plan assets (excluding amounts included in net interest expense) (1.53) (11.41)
Amount recognised in OCI 49.49 205.48
Notes forming part of the Financial Statements

C K
150 Idea Cellular Limited
Standalone Financial Statements
The principal assumptions used in determining gratuity obligations are shown below:
Particulars For the year ended For the year ended
March 31, 2017 March 31, 2016
Discount rate 7.10% 8.10%
Future salary increases* 8.00% 8.00%
Mortality rate during employment As per Indian Assured Lives
Mortality (2006-08) Ult Table
Rate of Employee Turnover
Age (Years) – 21-30 5.00%
31-40 3.00%
41-59 2.00%
Disability Leaving service due to disability is
included in the provision made
for all causes of leaving service.
*The estimates of future salary increase considered takes into account inflation, seniority, promotion and other relevant factors.
A quantitative sensitivity analysis for significant assumptions on the defined benefit obligation is as below:
Particulars For the year ended For the year ended
March 31, 2017 March 31, 2016
Discount Rate Salary Discount Rate Salary
escalation Rate escalation Rate
Impact of increase in 50 bps on DBO (6.59) % 7.13 % (6.60) % 7.20 %
Impact of decrease in 50 bps on DBO 7.23 % (6.57)% 7.23 % (6.63)%
The sensitivity analysis above have been determined based on a method that extrapolates the impact on defined benefit obligation
as a result of reasonable changes in key assumptions occurring at the end of the reporting period.
The following payments are expected contributions to the defined benefit plan in future years:
` Mn
Particulars For the year ended For the year ended
March 31, 2017 March 31, 2016
Within the next 12 months 150 150
Disaggregation details of plan assets (% allocation):
` Mn
Particulars For the year ended For the year ended
March 31, 2017 March 31, 2016
Insurer Managed Funds * 779.41 396.44
*The funds are managed by Insurers and they do not provide breakup of plan assets by investment type.
Notes forming part of the Financial Statements

C K
Annual Report 2016-17 151
Standalone Financial Statements
Projected plan cash flow:
The table below shows the expected cash flow profile of the benefits to be paid to the current membership of the plan based onpast service of the employees as at the valuation date.
` Mn
Maturity Profile For the year ended For the year endedMarch 31, 2017 March 31, 2016
Expected benefits for year 1 88.42 74.35
Expected benefits for year 2 69.66 46.26
Expected benefits for year 3 72.80 68.64
Expected benefits for year 4 75.83 71.12
Expected benefits for year 5 and above 7,011.17 7,081.19
The average duration of the defined benefit plan obligation at the end of the reporting period is 13.80 years (Previous year: 13.80years).
B. Defined Contribution Plans
During the year, the Company has recognised the following amounts in the statement of profit and loss:
` Mn
Particulars For the year ended For the year endedMarch 31, 2017 March 31, 2016
Employers’ contribution to provident and pension fund 493.94 441.69
Employers’ contribution to superannuation fund 93.52 77.50
C. The Company operates its gratuity and superannuation plans through separate trusts which is administered and managed bythe Trustees. As on March 31, 2017 and March 31, 2016 the contribution towards the plans have been invested in Insurer ManagedFunds.
54. Auditor’s Remuneration
` Mn
Particulars For the year ended For the year ended
March 31, 2017 March 31, 2016
Statutory Audit Fees 46.00 46.00
Certification and Other services (included in Legal and Professional Charges) 22.68* 13.80
Out of pocket expenses (included in Misc. Expenses) 0.99 0.71
Total Remuneration 69.67 60.51
*includes ` 5 Mn. payment to an affiliate firm of statutory auditors
55. Expenditure for Corporate Social Responsibility
a) Gross amount required to be spent by the company during the year is ` 731.94 Mn. (Previous year ` 548.87 Mn.).
b) Amount spent for the year ended March 31, 2017:` Mn
Sr. No. Particulars Amount Paid Amount Payable Total
1 Healthcare 168.21 112.12 280.33
2 Education 20.59 2.52 23.11
3 Sanitation 12.00 2.40 14.40
4 Others 36.42 15.40 51.82
Total 237.22 132.44 369.66
Notes forming part of the Financial Statements

C K
152 Idea Cellular Limited
Standalone Financial Statements
c) Amount spent for the year ended March 31, 2016:
` Mn
Sr. No. Particulars Amount Paid Amount Payable Total
1 Healthcare 62.00 - 62.00
2 Education 87.93 25.10 113.03
3 Sanitation 9.65 - 9.65
4 Others - 0.01 0.01
Total 159.58 25.11 184.69
56. Tax Reconciliation
(a) Income Tax Expense
` Mn
Particulars For the year ended For the year ended
March 31, 2017 March 31, 2016
Current Tax
Current Tax on profits for the year - 8,621.82
Total Current Tax Expense (A) - 8,621.82
Deferred Tax
Relating to addition & reversal of temporary differences (4,825.95) 5,623.81
Relating to effect of previously unrecognised tax credits, now recorded (1,053.33) -
Total Deferred Tax Expense (B) (5,879.28) 5,623.81
Income Tax Expense (A+B) (5,879.28) 14,245.63
Income tax impact of re-measurement gains/ losses on defined benefit
plans taken to other comprehensive income (17.13) (71.11)
(b) Reconciliation of average effective tax rate and applicable tax rate
` Mn
Particulars For the year ended For the year ended
March 31, 2017 March 31, 2016
Profit / (Loss) from continuing operation before Income tax expense (14,190.03) 40,708.51
Applicable Tax Rate 34.61% 34.61%
Increase / reduction in taxes on account of :
Effect of unrecognised deductible temporary differences - 0.25%
Effect of previously unrecognised tax credits, now recorded 7.42% -
Effects of expenses that are not deductible in determining the taxable profits (0.64)% 0.24%
Other Items 0.04% (0.11)%
Effective Tax Rate 41.43% 34.99%
(c) Deferred tax assets are recognised to the extent that it is probable that taxable profit will be against which the deductible
temporary differences, carry forward of unabsorbed depreciation and tax losses can be utilised. Accordingly, in view of
uncertainty the Company has not recognised deferred tax assets in respect of temporary differences arising out of effects of
assessments and unused tax losses/credits of ` 4,612.09 Mn., ` 3,738.82 Mn. and ` 3,442.47 Mn. as of March 31, 2017,
March 31, 2016 and April 1, 2015 respectively.
Notes forming part of the Financial Statements

C K
Annual Report 2016-17 153
Standalone Financial Statements
Notes forming part of the Financial Statements
57. Movement in Deferred Tax` Mn
Particulars As at Recognised in As at Recognised in As at
April 1, Profit OCI March 31, Profit OCI Transfer to March 31,2015 and Loss 2016 and Loss ICISL (refer 2017
note 41)
Liabilities
Depreciation & Amortisation 18,836.96 12,117.77 - 30,954.72 21,035.59 - 167.42 52,157.73
Effects of re measuring financialinstruments under Ind AS 768.52 88.04 - 856.56 (782.97) - - 73.59
Effects of Inflation linked escalationon rental income/expense notrequiring equalisation over lease term 1,757.91 326.84 - 2,084.75 (2,084.75) - - -
Investment in Subsidiaries 3,721.62 (2.53) - 3,719.09 (1.96) - - 3,717.13
Others 210.29 (62.88) - 147.41 (147.41) - - -
Total (A) 25,295.29 12,467.24 - 37,762.53 18,018.50 - 167.42 55,948.45
Assets
Tax Losses - - - - 22,179.46 - - 22,179.46
Expenses allowable on Payment Basis 1,285.11 271.66 71.11 1,627.88 204.77 17.13 (40.68) 1,809.10
Allowances for doubtful debtsand advances 1,241.52 131.55 - 1,373.07 649.95 - (4.15) 2,018.87
MAT credit 5,841.49 6,426.09 - 12,267.58 855.82 - - 13,123.40
Others 122.57 14.13 - 136.70 7.78 - (117.93) 26.55
Total (B) 8,490.69 6,843.43 71.11 15,405.23 23,897.78 17.13 (162.76) 39,157.38
Net Deferred Tax Liabilities/(Assets)(A-B) 16,804.61 5,623.81 (71.11) 22,357.30 (5,879.28) (17.13) 330.18 16,791.07
58. Basic & Diluted Earnings per Share
Particulars For the year ended For the year endedMarch 31, 2017 March 31, 2016
Nominal value of equity shares (`) 10/- 10/-
Profit after Tax (` Mn.) (8,310.75) 26,462.88
Profit attributable to equity shareholders (` Mn.) (8,310.75) 26,462.88
Weighted average number of equity shares outstanding during the year 3,601,290,214 3,599,336,054
Basic Earnings Per Share (`) (2.31) 7.35
Dilutive effect on weighted average number of equity shares outstandingduring the year * 9,670,230
Weighted average number of diluted equity shares 3,601,290,214 3,609,006,284
Diluted Earnings Per Share (`) (2.31) 7.33
*As the company has incurred loss during the year, dilutive effect on weighted average number of shares would have an anti-dilutive impact and hence, not considered.
59. Related party transactions
The related parties where control and significant influence exists are subsidiaries and associates respectively. Key Managementpersonnel are those persons having authority and responsibility for planning, directing and controlling the activities of the entity,directly or indirectly, including any Director whether executive or otherwise.

C K
154 Idea Cellular Limited
Standalone Financial Statements
List of subsidiaries
Relationship Related Party
Aditya Birla Telecom Limited
Idea Cellular Infrastructure Services Limited
Subsidiaries (Subs) Idea Cellular Services Limited
Idea Mobile Commerce Services limited
Idea Telesystems Limited
Apart from the above, the company has transactions with the below related parties
Relationship Related Party
Associate Aditya Birla Idea Payments Bank Limited
Joint Venture of ABTL (JV) Indus Towers Limited
Aditya Birla Capital Advisors Private Limited
Aditya Birla Finance Limited
Aditya Birla Financial Services Limited
Aditya Birla Financial Shared Services Limited
Aditya Birla Health Insurance Company Limited
Aditya Birla Housing Finance Limited
Aditya Birla Insurance Brokers Limited
Aditya Birla Money Limited
Aditya Birla Money Mart Limited (ABMML)
Aditya Birla Nuvo Limited
Entities having significant influence Axiata Group Berhad
Axiata Investments 1 India Limited
Axiata Investments 2 India Limited
Birla Institute of Technology and Science Company
Birla Sun Life AMC Limited
Birla Sun Life Asset Management Company Limited
Birla Sun Life Insurance Company Limited
Birla TMT Holdings Private Limited
Dialog Axiata PLC- Sri Lanka
Grasim Industries Limited
Hindalco Industries Limited
Ultratech Cement Limited
Smt. Rajashree Birla
Mr. Kumar Mangalam Birla
Ms. Alka Bharucha (Effective December 26, 2016)
Mr. Akshaya Moondra
Mr. Arun Thiagarajan
Mr. Himanshu Kapania
Key Management Personnel (KMP) Mr. Mohan Gyani
Mr. P. Murari
Mr. R.C. Bhargava
Mr. Sanjeev Aga
Ms. Madhabi Puri Buch
Ms. Tarjani Vakil
Agora Advisory Private LimitedBharucha and Partners
OthersBreach Candy Hospital and Research CentreCitec Engineering India Private LimitedG.D. Birla Medical Research & Education FoundationSvatantra Microfin Private LimitedICL Employee’s Group Gratuity Scheme
Trust* ICL Employee Superannuation SchemeSpice Communications Limited Employee Superannuation Scheme
*Refer note 53 for information on transactions with post-employment benefit plans mentioned above.
Notes forming part of the Financial Statements

C K
Annual Report 2016-17 155
Standalone Financial Statements
A. Transactions with Related Parties for the year ended March 31, 2017 and March 31, 2016` Mn
Particulars Associate Entities JV KMP Others Subshaving
significantinfluence
Sale of service 0.16 167.26 10.00 0.05 1.38 54.53(-) (156.93) (4.77) (0.07) (0.60) (33.10)
Rent Income 7.66(-)
Purchase of service 80.21 40,615.45 23.79 6,454.76(69.87) (35,830.12) (-) (2,843.80)
Purchase of goods 113.42(98.49)
ESOP Cost 7.29(1.48)
Remuneration* 138.54(119.74)
Rent expense 9.62(9.59)
Commission 18.59(2.68)
Non-Compete Fee 15.00(15.00)
Directors’ Commission and sitting fees 1.66 152.35(1.78) (151.36)
Interest on Inter Corporate Deposit (ICD) 255.70(-)
Interest on NCD 9.45(9.45)
Expense incurred on behalf of - 0.52 - 0.01 48.69(14.38) (0.84) (0.00) (0.17) (68.54)
Expense incurred on company’s behalf by 1.89(-)
Dividend paid on equity shares 1,339.47 0.59(1,339.47) (0.54)
ICD Taken 11,100.00(-)
ICD Repaid 11,100.00(-)
Investments 173.71# 601.00(2.45) (200.00)
Sale of Fixed Assets 8.99 1.01(-) (-)
Security Deposit given 374.45(158.85)
Towards insurance premium (including advance given) 377.53(0.15)
Contribution towards Gratuity 200.00(-)
Contribution towards CSR 160.00(-)
(Figures in bracket are for the year ended March 31, 2016)*Excludes charge taken towards share based payments.#Includes advance given for purchase of shares.Note: The above does not include the transfer of tower infrastructure undertaking as per the business transfer arrangement(refer note 41).
Notes forming part of the Financial Statements

C K
156 Idea Cellular Limited
Standalone Financial Statements
B. Balances with Related Parties
i. As at March 31, 2017
` Mn
Particulars Associate Entities JV KMP Others Subs
having
significant
influence
Trade and other receivables 0.14 8.29 0.16 - 0.33 41.46
Trade and other payables 20.17 0.72 5,909.88 - 109.94 671.54
Security Deposit - - 1,000.00 - - 535.79
Other financial and non- financial asset - 39.38 - - - -
9.45% NCD - 100.00 - - - -
Interest Accrued but not due - 3.92 - - - -
Remuneration payable - - - 45.08 - -
ii. As at March 31, 2016
` Mn
Particulars Associate Entities JV KMP Others Subs
having
significant
influence
Trade and other receivables 14.38 7.54 - - 0.14 14.42
Trade and other payables - 17.58 3,682.95 1.25 0.18 108.11
Security Deposit - - 1,000.00 - - 161.24
Other financial and non- financial asset - 8.20 - - - -
9.45% NCD - 100.00 - - - -
Interest Accrued but not due - 3.92 - - - -
Remuneration payable - - - 50.71 - -
iii. As at April 1, 2015
` Mn
Particulars Associate Entities JV KMP Others Subs
having
significant
influence
Trade and other receivables - 13.46 - - 0.12 5.39
Trade and other payables - 0.66 2,969.93 - - 193.11
Security Deposit - - 1,000.00 - - 2.39
Other financial and non- financial asset - 3.71 - - - -
9.45% NCD - 100.00 - - - -
Interest Accrued but not due - 3.91 - - - -
Remuneration payable - - - 63.57 - -
Outstanding balances at period end are unsecured and considered good.
Notes forming part of the Financial Statements

C K
Annual Report 2016-17 157
Standalone Financial Statements
Notes forming part of the Financial Statements
C. Commitments with related parties
` Mn
Particulars As at March 31, 2017 As at March 31, 2016 As at April 1, 2015
JV Subs JV Subs JV Subs
Lease commitment 125,969.39 40,067.32 130,659.67 6,529.42 130,238.99 7,242.70
Opex Commitment (Net of provision) - 0.66 - 0.65 - 1.52
Total 125,969.39 40,067.98 130,659.67 6,530.07 130,238.99 7,244.22
D. Compensation of Key Management Personnel of the Company
` Mn
Particulars March 31, 2017 March 31, 2016
Short-term employee benefits 135.79 117.27
Post-employment benefits* 2.75 2.47
Share-based payment transactions 41.96 60.65
*Represents contribution to provident and superannuation funds. As Gratuity expense is based on actuarial valuations, the samecannot be computed for individual employees and hence not included.
60. Disclosure as per the requirement of Regulation 34 of the Securities and Exchange Board of India (Listing Obligations andDisclosure Requirements) Regulations, 2015: The amounts at the year end and the maximum amount of loans & advancesoutstanding during the year ending March 31, 2017 is ` Nil (Previous year ` Nil)
61. The Company is one of the members of Aditya Birla Management Corporation Private Limited, a Company limited by guarantee,which has been formed to provide common pool of facilities and resources to its members with a view to optimise the benefits ofspecialisation and minimize cost to each member. The Company’s share of expenses incurred under the common pool has beenaccounted for at actuals in the respective heads in the Statement of Profit & Loss.
62. Financial Instruments
a) Financial Instruments by Category: The following table provides categorisation of all financial instruments at carrying valueexcept non-current investments in subsidiaries and associates (including advance given for purchase of shares) which are carriedat cost.
` Mn
Particulars As at March 31, 2017 As at March 31, 2016 As at April 1, 2015
FVTPL Amortised FVTPL Amortised FVTPL AmortisedCost Cost Cost
Financial Assets
Current Investments 40,247.09 - 8,328.46 - 111,743.43 -
Trade Receivables - 12,580.95 - 11,360.58 - 9,321.71
Deposit with Body Corporates - - - 4,983.90 - 3,020.86
Security Deposits - 5,356.38 - 4,808.27 - 3,833.82
Loans to Employees - 46.42 - 41.59 - 41.50
Cash and cash equivalents - 268.60 - 7,515.42 - 15,365.93
Bank balance other than cash and cash equivalents - 44.05 - 61.21 - 53.45
Interest receivable - 0.19 - 20.00 - 1,061.65
Derivative Financial Assets 13.69 - 100.32 - 2,840.26 -
Others 69.87 - 112.51 - 171.36 -
Total Financial Assets 40,330.65 18,296.59 8,541.29 28,790.97 114,755.05 32,698.92

C K
158 Idea Cellular Limited
Standalone Financial Statements
Notes forming part of the Financial Statements
Financial Liabilities
Borrowings including Interest accrued but not due - 579,085.98 - 428,956.84 - 258,597.74
Payables for Capital Expenditure - 45,727.29 - 20,237.03 - 13,815.14
Trade Payables - 39,921.33 - 32,038.74 - 29,367.60
Derivative Financial Liabilities 1,898.34 - 1,247.68 - 1,147.71 -
Security Deposits - 2,327.94 - 2,363.84 - 2,057.55
Others 4.10 - 2.52 - 1.44 -
Total Financial Liabilities 1,902.44 667,062.54 1,250.20 483,596.45 1,149.15 303,838.03
b) Fair Value Hierarchy
The Company has classified its financial instruments into three levels in order to provide an indication about the reliability of theinputs used in determining fair values.
i. Fair value hierarchy of financial assets and liabilities measured at fair value as at March 31, 2017` Mn
Particulars Level 1 Level 2 Level 3 Total
Financial Assets
Current Investments 40,247.09 - - 40,247.09
Derivative Financial Assets - 13.69 - 13.69
Others - 69.87 - 69.87
Total Financial Assets 40,247.09 83.56 - 40,330.65
Financial Liabilities
Derivative Financial Liabilities - 1,898.34 - 1,898.34
Others - 4.10 - 4.10
Total Financial Liabilities - 1,902.44 - 1,902.44
ii. Fair value hierarchy of financial assets and liabilities measured at fair value as at March 31, 2016` Mn
Particulars Level 1 Level 2 Level 3 Total
Financial Assets
Current Investments 8,328.46 - - 8,328.46
Derivative Financial Assets - 100.32 - 100.32
Others - 112.51 - 112.51
Total Financial Assets 8,328.46 212.83 - 8,541.29
Financial Liabilities
Derivative Financial Liabilities - 1,247.68 - 1,247.68
Others - 2.52 - 2.52
Total Financial Liabilities - 1,250.20 - 1,250.20
` Mn
Particulars As at March 31, 2017 As at March 31, 2016 As at April 1, 2015
FVTPL Amortised FVTPL Amortised FVTPL AmortisedCost Cost Cost

C K
Annual Report 2016-17 159
Standalone Financial Statements
iii. Fair value hierarchy of financial assets and liabilities measured at fair value as at April 1, 2015
` Mn
Particulars Level 1 Level 2 Level 3 Total
Financial Assets
Current Investments 111,743.43 - - 111,743.43
Derivative Financial Assets - 2,840.26 - 2,840.26
Others - 171.36 - 171.36
Total Financial Assets 111,743.43 3,011.62 - 114,755.05
Financial Liabilities
Derivative Financial Liabilities - 1,147.71 - 1,147.71
Others - 1.44 - 1.44
Total Financial Liabilities - 1,149.15 - 1,149.15
iv. The carrying amounts of the following financial assets and financial liabilities are a reasonable approximation of their fairvalues. Accordingly, the fair values of such financial assets and financial liabilities have not been disclosed separately.
a) Financial Assets
- Trade Receivables
- Security Deposits and deposits with body corporates
- Loans to Employees
- Cash and Cash equivalents
- Bank balances other than cash and cash equivalents
- Interest Receivable
b) Financial Liabilities
- Trade Payables
- Payable for capital expenditure
- Security Deposits
v. Fair value hierarchy of financial liabilities measured at amortised cost is below:
` Mn
Particulars Carrying Amount Level 1 Level 2 Level 3 Total
Fixed rate borrowings including interest accrued but not due* :
As at March 31, 2017 511,240.89 - 529,377.06 - 529,377.06
As at March 31, 2016 394,507.79 - 413,498.04 - 413,498.04
As at April 1, 2015 130,033.47 - 136,204.83 - 136,204.83
*Includes Deferred Payment Liability, NCD and others.
c) Valuation Technique used to determine fair value
Fair value of quoted current investments in Mutual Funds is based on price quotations at the reporting date.
The fair value of the financial assets and liabilities is included at the amount at which the instrument could be exchanged in acurrent transaction between knowledgeable and willing parties, other than in a forced or liquidation sale. The valuation techniquesused to determine the fair values of financial assets and financial liabilities classified as level 2 include use of quoted market pricesor dealer quotes for similar instruments and generally accepted pricing models based on a discounted cash flow analysis usingrates currently available for debt on similar terms, credit risk and remaining maturities.
63. Financial risk management objectives and policies
The Company’s principal financial liabilities comprise loans and borrowings, trade and other payables. The main purpose ofthese financial liabilities is to finance and support the Company’s operations. The Company’s principal financial assets comprise
Notes forming part of the Financial Statements
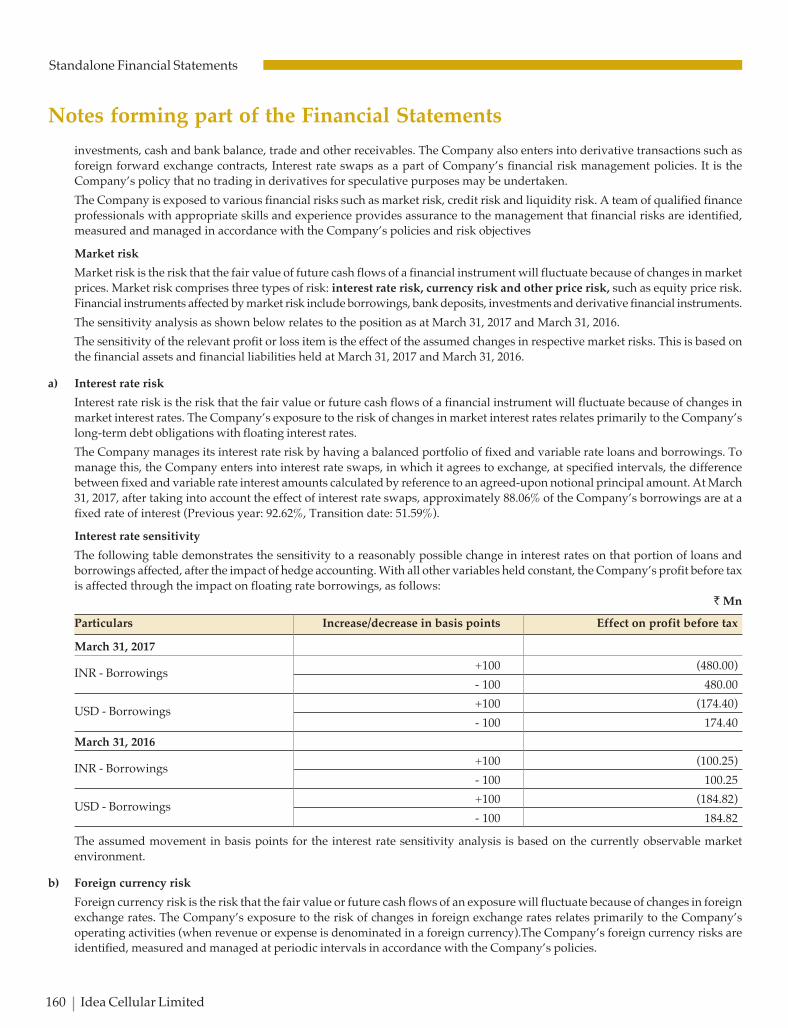
C K
160 Idea Cellular Limited
Standalone Financial Statements
investments, cash and bank balance, trade and other receivables. The Company also enters into derivative transactions such asforeign forward exchange contracts, Interest rate swaps as a part of Company’s financial risk management policies. It is theCompany’s policy that no trading in derivatives for speculative purposes may be undertaken.
The Company is exposed to various financial risks such as market risk, credit risk and liquidity risk. A team of qualified financeprofessionals with appropriate skills and experience provides assurance to the management that financial risks are identified,measured and managed in accordance with the Company’s policies and risk objectives
Market risk
Market risk is the risk that the fair value of future cash flows of a financial instrument will fluctuate because of changes in marketprices. Market risk comprises three types of risk: interest rate risk, currency risk and other price risk, such as equity price risk.Financial instruments affected by market risk include borrowings, bank deposits, investments and derivative financial instruments.
The sensitivity analysis as shown below relates to the position as at March 31, 2017 and March 31, 2016.
The sensitivity of the relevant profit or loss item is the effect of the assumed changes in respective market risks. This is based onthe financial assets and financial liabilities held at March 31, 2017 and March 31, 2016.
a) Interest rate risk
Interest rate risk is the risk that the fair value or future cash flows of a financial instrument will fluctuate because of changes inmarket interest rates. The Company’s exposure to the risk of changes in market interest rates relates primarily to the Company’slong-term debt obligations with floating interest rates.
The Company manages its interest rate risk by having a balanced portfolio of fixed and variable rate loans and borrowings. Tomanage this, the Company enters into interest rate swaps, in which it agrees to exchange, at specified intervals, the differencebetween fixed and variable rate interest amounts calculated by reference to an agreed-upon notional principal amount. At March31, 2017, after taking into account the effect of interest rate swaps, approximately 88.06% of the Company’s borrowings are at afixed rate of interest (Previous year: 92.62%, Transition date: 51.59%).
Interest rate sensitivity
The following table demonstrates the sensitivity to a reasonably possible change in interest rates on that portion of loans andborrowings affected, after the impact of hedge accounting. With all other variables held constant, the Company’s profit before taxis affected through the impact on floating rate borrowings, as follows:
` Mn
Particulars Increase/decrease in basis points Effect on profit before tax
March 31, 2017
INR - Borrowings+100 (480.00)
- 100 480.00
USD - Borrowings+100 (174.40)
- 100 174.40
March 31, 2016
INR - Borrowings+100 (100.25)
- 100 100.25
USD - Borrowings+100 (184.82)
- 100 184.82
The assumed movement in basis points for the interest rate sensitivity analysis is based on the currently observable marketenvironment.
b) Foreign currency risk
Foreign currency risk is the risk that the fair value or future cash flows of an exposure will fluctuate because of changes in foreignexchange rates. The Company’s exposure to the risk of changes in foreign exchange rates relates primarily to the Company’soperating activities (when revenue or expense is denominated in a foreign currency).The Company’s foreign currency risks areidentified, measured and managed at periodic intervals in accordance with the Company’s policies.
Notes forming part of the Financial Statements

C K
Annual Report 2016-17 161
Standalone Financial Statements
Notes forming part of the Financial Statements
When a derivative is entered into for the purpose of hedging any foreign currency exposure, the Company negotiates the termsof those derivatives to match the terms of the hedged exposure.
At March 31, 2017, the Company hedged 21.14% (Previous year: 34.91%, Transition date: 52.72%), of its foreign currency loans.This foreign currency risk is hedged by using foreign currency forward contracts.
Foreign currency sensitivity
The following tables demonstrate the sensitivity to a reasonably possible change in foreign currency rates, with all other variablesheld constant. The impact on the Company’s profit before tax is due to changes in the fair value of monetary assets and liabilitiesincluding non-designated foreign currency derivatives and embedded derivatives. The Company’s exposure to foreign currencychanges for all other currencies is not material.
` Mn
Currency exposure Change in currency exchange rate Effect on profit before tax
March 31, 2017
USD+5% (1,951.00)
- 5% 1,951.00
March 31, 2016
USD+5% (1,737.62)
- 5% 1,737.62
The derivatives have not been designated in a hedge relationship, they act as a hedge and will offset the underlying transactionswhen they occur.
c) Other price risk
The Company invests its surplus funds in various debt instruments and debt mutual funds. These comprise of mainly liquidschemes of mutual funds (liquid investments) and fixed deposits.
Mutual fund investments are susceptible to market price risk, mainly arising from changes in the interest rates or market yieldswhich may impact the return and value of such investments. However due to the very short tenor of the underlying portfolio inthe liquid schemes, these do not pose any significant price risk.
On the duration investment balance, an increase/ decrease of 25 basis points in market yields (parallel shift of the yield curves),will result in decrease/increase in the marked to market value of the investments by ̀ Nil and ̀ 0.28 Mn as on March 31, 2017 andMarch 31, 2016, respectively.
d) Credit risk
Credit risk is the risk that counterparty will not meet its obligations under a financial instrument or customer contract, leading to afinancial loss. The Company is exposed to credit risk from its operating activities (primarily trade and other receivables) and from itsfinancing activities, including deposits with banks, foreign exchange transactions and other financial instruments.
- Trade receivables
Customer credit risk is managed in accordance with the Company’s established policy, procedures and controls relating tocustomer credit risk management. Trade receivables are non-interest bearing and are generally on 15 to 30 days credit terms.Outstanding customer receivables are regularly monitored.
The Company follows a ‘simplified approach’ (i.e. based on lifetime ECL) for recognition of impairment loss allowance onTrade receivables (including lease receivables). For the purpose of measuring lifetime ECL allowance for trade receivables,the company estimates irrecoverable amounts based on the ageing of the receivable balances and historical experience.Further, a large number of minor receivables are grouped into homogeneous groups and assessed for impairment collectively.Individual trade receivables are written off when management deems them not to be collectible.
- Other financial assets and cash deposits
Credit risk from balances with banks is managed by the Company’s treasury department. Investments of surplus funds aremade only with approved counterparties and within credit limits assigned to each counter party. Counterparty credit limitsare reviewed by the Company’s Treasury Department on an annual basis, and may be updated throughout the year. Thelimits are set to minimise the concentration of risks and therefore mitigate financial loss through counterparty’s potentialfailure to make payments.
The Company’s maximum exposure to credit risk for the components of the balance sheet as at March 31, 2017, March 31,2016 and April 01, 2015 on its carrying amounts as disclosed in notes 10, 15, 16 and 17.

C K
162 Idea Cellular Limited
Standalone Financial Statements
e) Liquidity risk
Liquidity risk is the risk that the Company may not be able to meet its present and future cash and collateral obligations withoutincurring unacceptable losses. The Company’s objective is to, at all times maintain optimum levels of liquidity to meet its cash andcollateral requirements. The Company monitors its risk of a shortage of funds using a liquidity planning tool.
The Company’s objective is to maintain a balance between continuity of funding and flexibility through the use of bank overdrafts,bank loans and finance leases. Approximately 6.20% of the Company’s debt will mature in less than one year at March 31, 2017(Previous year: 11.44%, Transition date: 38.45%) based on the carrying value of borrowings reflected in the financial statements.The Company has access to a sufficient variety of sources of funding and debt maturing within 12 months can be rolled over withexisting lenders.
The table below summarizes the maturity profile of the Company’s financial liabilities based on contractual undiscounted payments:
` Mn
Particulars Carrying Less than 1 to 5 years > 5 years TotalValue 1 year payments
As at March 31, 2017
Borrowings and Interest thereon 579,085.98 63,021.23 377,908.16 470,531.22 911,460.61
Trade and other payables 85,648.62 85,605.27 43.35 - 85,648.62
Other financial liabilities 2,332.04 2,295.53 36.51 - 2,332.04
Derivatives 1,898.34 1,898.34 - - 1,898.34
Total 668,964.98 152,820.37 377,988.02 470,531.22 1,001,339.61
As at March 31, 2016
Borrowings and Interest thereon 428,956.84 49,248.16 249,120.28 394,379.67 692,748.11
Trade and other payables 52,275.77 52,267.68 8.09 - 52,275.77
Other financial liabilities 2,366.36 2,128.54 237.82 - 2,366.36
Derivatives 1,247.68 497.75 749.93 - 1,247.68
Total 484,846.65 104,142.13 250,116.12 394,379.67 748,637.92
As at April 1, 2015
Borrowings and Interest thereon 258,597.74 105,665.61 127,577.93 108,763.60 342,007.14
Trade and other payables 43,182.74 43,126.04 56.70 - 43,182.74
Other financial liabilities 2,058.99 2,014.97 44.02 - 2,058.99
Derivatives 1,147.71 45.19 1,102.52 - 1,147.71
Total 304,987.18 150,851.81 128,781.17 108,763.60 388,396.58
64. Capital management
For the purpose of the Company’s capital management, capital includes issued equity capital, share premium and all other equityreserves attributable to the equity holders. The primary objective of the Company’s capital management is to maximise theshareholder value.
The Company manages its capital structure and makes adjustments in light of changes in economic conditions and the requirementsof the financial covenants. To maintain or adjust the capital structure, the Company may adjust the dividend payment toshareholders, return capital to shareholders or issue new shares. The Company monitors capital using the debt-equity ratio,which is net debt divided by total equity. The Company includes within net debt, interest bearing loans and borrowings less cashand cash equivalents, Bank balance other than cash and cash equivalents and investment in liquid mutual funds.
Notes forming part of the Financial Statements
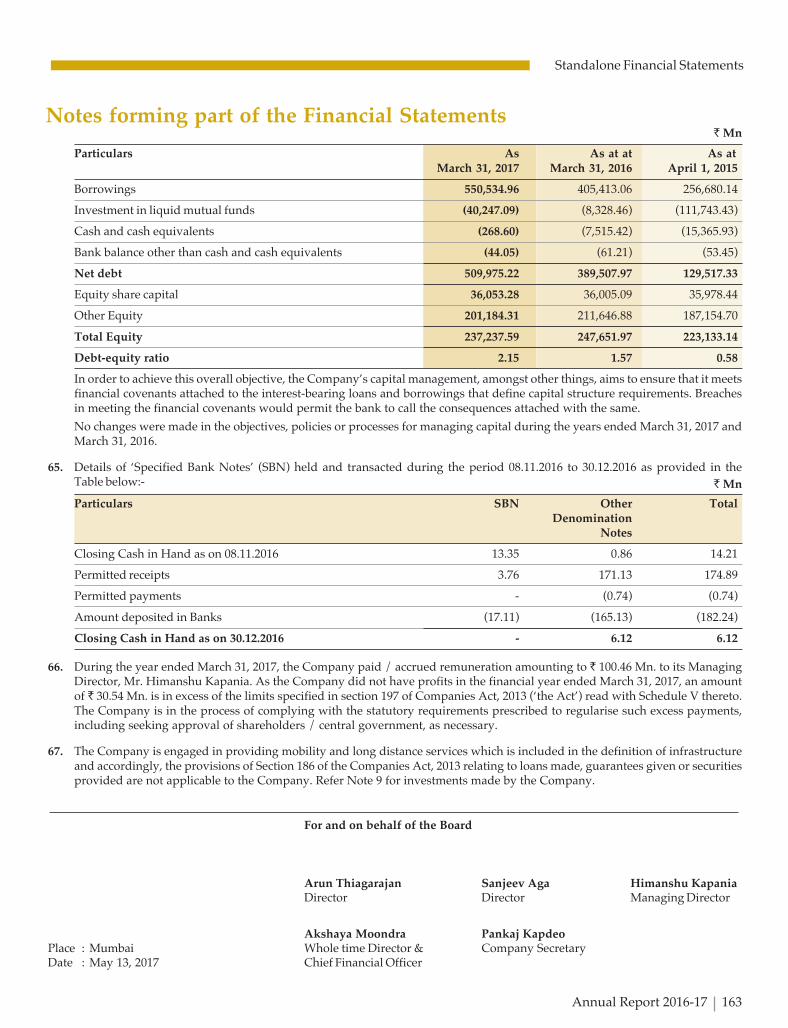
C K
Annual Report 2016-17 163
Standalone Financial Statements
Particulars As As at at As atMarch 31, 2017 March 31, 2016 April 1, 2015
Borrowings 550,534.96 405,413.06 256,680.14
Investment in liquid mutual funds (40,247.09) (8,328.46) (111,743.43)
Cash and cash equivalents (268.60) (7,515.42) (15,365.93)
Bank balance other than cash and cash equivalents (44.05) (61.21) (53.45)
Net debt 509,975.22 389,507.97 129,517.33
Equity share capital 36,053.28 36,005.09 35,978.44
Other Equity 201,184.31 211,646.88 187,154.70
Total Equity 237,237.59 247,651.97 223,133.14
Debt-equity ratio 2.15 1.57 0.58
In order to achieve this overall objective, the Company’s capital management, amongst other things, aims to ensure that it meetsfinancial covenants attached to the interest-bearing loans and borrowings that define capital structure requirements. Breachesin meeting the financial covenants would permit the bank to call the consequences attached with the same.
No changes were made in the objectives, policies or processes for managing capital during the years ended March 31, 2017 andMarch 31, 2016.
65. Details of ‘Specified Bank Notes’ (SBN) held and transacted during the period 08.11.2016 to 30.12.2016 as provided in theTable below:-
Particulars SBN Other TotalDenomination
Notes
Closing Cash in Hand as on 08.11.2016 13.35 0.86 14.21
Permitted receipts 3.76 171.13 174.89
Permitted payments - (0.74) (0.74)
Amount deposited in Banks (17.11) (165.13) (182.24)
Closing Cash in Hand as on 30.12.2016 - 6.12 6.12
66. During the year ended March 31, 2017, the Company paid / accrued remuneration amounting to ` 100.46 Mn. to its ManagingDirector, Mr. Himanshu Kapania. As the Company did not have profits in the financial year ended March 31, 2017, an amountof ` 30.54 Mn. is in excess of the limits specified in section 197 of Companies Act, 2013 (‘the Act’) read with Schedule V thereto.The Company is in the process of complying with the statutory requirements prescribed to regularise such excess payments,including seeking approval of shareholders / central government, as necessary.
67. The Company is engaged in providing mobility and long distance services which is included in the definition of infrastructureand accordingly, the provisions of Section 186 of the Companies Act, 2013 relating to loans made, guarantees given or securitiesprovided are not applicable to the Company. Refer Note 9 for investments made by the Company.
Notes forming part of the Financial Statements
For and on behalf of the Board
Arun Thiagarajan Sanjeev Aga Himanshu KapaniaDirector Director Managing Director
Akshaya Moondra Pankaj KapdeoPlace : Mumbai Whole time Director & Company SecretaryDate : May 13, 2017 Chief Financial Officer
` Mn
` Mn

C K
164 Idea Cellular Limited
Standalone Financial Statements
Statement of Cash Flows for the year ended March 31, 2017
` Mn
Particulars For the year ended For the year endedMarch 31, 2017 March 31, 2016
A) Cash Flow from Operating Activities
Profit/(Loss) before Tax (14,190.03) 40,708.51
Adjustments For
Depreciation 48,642.82 47,716.68
Amortisation 28,357.35 14,515.61
Loss / (Gain) on disposal of PPE, intangible assets andnon-current assets held for sale (150.65) (63.75)
Finance costs (including fair value change infinancial instruments) 40,108.53 17,778.52
Interest income (124.24) (276.64)
Gain on Mutual Funds (including fair value gain/(loss)) (1,846.01) (1,496.79)
Bad debts / advances written off 99.77 1,327.57
Allowance for doubtful debts / advances 1,868.10 275.89
Share based payment expense (ESOS) 425.05 613.01
Provision for gratuity and compensated absences 310.58 366.68
Liabilities / provisions no longer required written back (88.89) (135.26)
117,602.41 80,621.52
Operating Profit before Working Capital Changes 103,412.38 121,330.03
Adjustments for changes in Working Capital
(Increase)/Decrease in Trade receivables (3,526.03) (3,603.02)
(Increase)/Decrease in Inventories 309.36 (268.48)
(Increase)/Decrease in Other financial and nonfinancial assets (5,148.39) (6,244.32)
Increase /(Decrease) in Trade Payables 8,671.59 2,806.39
Increase /(Decrease) in Other financial & nonfinancial liabilities 3,891.78 2,807.50
4,198.31 (4,501.93)
Cash generated from Operations 107,610.69 116,828.10
Tax paid (including TDS) (net) (5,883.12) (8,299.09)
Net Cash from / (used in) Operating Activities 101,727.57 108,529.01
B) Cash Flow from Investing Activities
Purchase of PPE & Intangible assets (including CWIPand Intangible assets under development) (52,777.46) (71,173.84)
Payment towards Spectrum and Licenses -Upfront payment (66,207.00) (58,081.99)
Payment towards Spectrum and Licenses - Deferredpayment liability (7,181.60) -
Proceeds from sale of PPE, Intangible assets and AHFS 356.85 207.50
Investment in Idea Mobile Commerce Services Limited (601.00) (200.00)
Investment in Aditya Birla Idea Payments Bank Limited(Including advance given for purchase of shares) (173.70) (2.45)
Net proceeds from sale / (purchase) ofCurrent Investments (30,072.62) 104,911.76
Interest received 61.05 1,318.29
Net Cash from / (used in) Investing Activities (156,595.48) (23,020.73)

C K
Annual Report 2016-17 165
Standalone Financial Statements
Statement of Cash Flows for the year ended March 31, 2017
C) Cash Flow from Financing Activities
Proceeds from issue of Equity Share Capital under ESOS 96.85 175.10
Proceeds from Long Term Borrowings 115,155.79 347.11
Repayment of Long Term Borrowings (15,859.04) (101,630.03)
Proceeds from Short Term Borrowings 11,100.00 14,798.09
Repayment of Short Term Borrowings (26,100.00) -
Payment of Dividend, including Dividend Distribution Tax (2,598.89) (2,598.19)
Payment of Interest and Finance Charges (33,054.34) (4,392.71)
Net Cash from / (used in) Financing Activities 48,740.37 (93,300.63)
Net Increase / (Decrease) in Cash and Cash Equivalents (6,127.54) (7,792.35)
Cash and Cash Equivalents at the beginning 6,059.64 13,851.99
Cash and Cash Equivalents at the end (67.90) 6,059.64
Notes to Statement of Cash Flows for the year ended March 31, 2017 0.00 0.00
1. Cash and Cash Equivalents include the following Balance Sheet amounts
Cash on hand 8.93 18.50
Cheques on hand 63.59 86.73
Balances with banks
- In Current Accounts 196.08 209.60
- In Deposit Accounts - 7,200.59
Bank overdrafts which forms an integral part of cash management system (336.50) (1,455.78)
(67.90) 6,059.64
2. The above Statement of Cash Flows has been prepared under the indirect method as set out in Ind AS 7 on Statement of CashFlows
` Mn
Particulars For the year ended For the year endedMarch 31, 2017 March 31, 2016
In terms of our report attached
For Deloitte Haskins & Sells LLP For and on behalf of the BoardChartered Accountants
Hemant M. Joshi Arun Thiagarajan Sanjeev Aga Himanshu KapaniaPartner Director Director Managing DirectorMembership No.: 38019
Akshaya Moondra Pankaj KapdeoPlace : Mumbai Whole time Director & Company SecretaryDate : May 13, 2017 Chief Financial Officer

C K
166 Idea Cellular Limited
Consolidated Financial Statements
TO THE MEMBERS OFIDEA CELLULAR LIMITED
Report on the Consolidated Ind AS Financial Statements
We have audited the accompanying consolidated Ind AS financialstatements of IDEA CELLULAR LIMITED (hereinafter referredto as “the Parent”) and its subsidiaries (the Parent and itssubsidiaries together referred to as “the Group”), its associateand joint venture, comprising the Consolidated Balance Sheet asat March 31, 2017, the Consolidated Statement of Profit and Lossincluding other comprehensive income, the Statement ofConsolidated Cash Flows, the Consolidated Statement of Changesin Equity, for the year then ended, and a summary of thesignificant accounting policies and other explanatory information(hereinafter referred to as “the consolidated Ind AS financialstatements”).
Management’s Responsibility for the Consolidated Ind ASFinancial Statements
The Parent’s Board of Directors is responsible for the preparationof these consolidated Ind AS financial statements in terms of therequirements of the Companies Act, 2013 (hereinafter referredto as “the Act”) that give a true and fair view of the consolidatedfinancial position, consolidated financial performance includingother comprehensive income, consolidated cash flows andconsolidated statement of changes in equity of the Groupincluding its associate and Joint venture in accordance with theaccounting principles generally accepted in India, including theIndian Accounting Standards (Ind AS) prescribed under Section133 of the Act. The respective Board of Directors of the companiesincluded in the Group and of its associate and joint venture areresponsible for maintenance of adequate accounting records inaccordance with the provisions of the Act for safeguarding theassets of the Group and its associate and joint venture and forpreventing and detecting frauds and other irregularities; theselection and application of appropriate accounting policies;making judgments and estimates that are reasonable and prudent;and the design, implementation and maintenance of adequateinternal financial controls, that were operating effectively forensuring the accuracy and completeness of the accountingrecords, relevant to the preparation and presentation of thefinancial statements that give a true and fair view and are freefrom material misstatement, whether due to fraud or error, whichhave been used for the purpose of preparation of the consolidatedInd AS financial statements by the Directors of the Parent, asaforesaid.
Auditors’ Responsibility
Our responsibility is to express an opinion on these consolidatedInd AS financial statements based on our audit. In conductingour audit, we have taken into account the provisions of the Act,the accounting and auditing standards and matters which arerequired to be included in the audit report under the provisionsof the Act and the Rules made thereunder.
We conducted our audit in accordance with the Standards onAuditing specified under Section 143(10) of the Act. ThoseStandards require that we comply with ethical requirements andplan and perform the audit to obtain reasonable assurance aboutwhether the consolidated Ind AS financial statements are freefrom material misstatement.
An audit involves performing procedures to obtain audit evidenceabout the amounts and the disclosures in the consolidated IndAS financial statements. The procedures selected depend on theauditor’s judgment, including the assessment of the risks ofmaterial misstatement of the consolidated Ind AS financialstatements, whether due to fraud or error. In making those riskassessments, the auditor considers internal financial controlrelevant to the Parent’s preparation of the consolidated Ind ASfinancial statements that give a true and fair view in order todesign audit procedures that are appropriate in the circumstances.An audit also includes evaluating the appropriateness of theaccounting policies used and the reasonableness of the accountingestimates made by the Parent’s Board of Directors, as well asevaluating the overall presentation of the consolidated Ind ASfinancial statements.
We believe that the audit evidence obtained by us and the auditevidence obtained by the other auditors in terms of their reportreferred to in sub-paragraphs (a) of the Other Matters paragraphbelow, is sufficient and appropriate to provide a basis for ouraudit opinion on the consolidated Ind AS financial statements.
Opinion
In our opinion and to the best of our information and accordingto the explanations given to us, and based on the considerationof the other auditors on separate financial statements of the jointventure referred to below in the Other Matters paragraph, theaforesaid consolidated Ind AS financial statements give theinformation required by the Act in the manner so required andgive a true and fair view in conformity with the accountingprinciples generally accepted in India, of the consolidated stateof affairs of the Group, its associate and joint venture as at March31, 2017, and their consolidated loss, consolidated totalcomprehensive loss, their consolidated cash flows andconsolidated statement of changes in equity for the year endedon that date.
Emphasis of Matter
We draw attention to Note 44A(i) to the consolidated Ind ASfinancial statements which describes the uncertainties related tothe legal outcome in respect of the Department ofTelecommunications (DoT) demand notices for one time spectrumcharges.
Our opinion is not modified in respect of this matter.
Other Matters
(a) The consolidated Ind AS financial statements include theGroup’s share of net profit of ` 4,302.93 Mn. and totalcomprehensive income of ̀ 4,298.52 Mn. for the year endedMarch 31, 2017, as considered in the consolidated Ind ASfinancial statements, in respect of Indus Towers Limited ajoint venture of Aditya Birla Telecom Limited (Subsidiary ofthe Parent), whose financial statements have not beenaudited by us. These financial statements have been auditedby the other auditors whose report has been furnished to usby the Management, and our opinion on the consolidatedInd AS financial statements, in so far as it relates to theamounts and disclosures included in respect of this joint
Independent Auditors’ Report
Independent Auditors’ Report

C K
Annual Report 2016-17 167
Consolidated Financial StatementsIndependent Auditors’ Report
venture, and our report in terms of subsection (3) of Section143 of the Act, in so far as it relates to the aforesaid jointventure is based solely on the report of such other auditors.
(b) The comparative financial information for the year endedMarch 31, 2016 and the transition date opening balance sheetas at April 1, 2015 in respect of one joint venture included inthis consolidated Ind AS financial statements prepared inaccordance with the Ind AS have been audited by otherauditors and have been relied upon by us.
Our opinion on the consolidated Ind AS financial statementsabove, and our report on Other Legal and RegulatoryRequirements below, is not modified in respect of the abovematters with respect to our reliance on the work done andthe report of the other auditors.
Report on Other Legal and Regulatory Requirements
As required by Section 143(3) of the Act, based on our audit andon the consideration of the report of other auditors on separatefinancial statements and the other financial information of jointventure company incorporated in India, referred in the OtherMatters paragraph above we report, to the extent applicable, that:
(a) We have sought and obtained all the information andexplanations which to the best of our knowledge and beliefwere necessary for the purposes of our audit of the aforesaidconsolidated Ind AS financial statements.
(b) In our opinion, proper books of account as required by lawrelating to preparation of the aforesaid consolidated IndAS financial statements have been kept so far as it appearsfrom our examination of those books and the report of theother auditors.
(c) The Consolidated Balance Sheet, the ConsolidatedStatement of Profit and Loss (including OtherComprehensive Income), the Statement of ConsolidatedCash Flows and Consolidated Statement of Changes inEquity dealt with by this report are in agreement with therelevant books of account maintained for the purpose ofpreparation of the consolidated Ind AS financial statements.
(d) In our opinion, the aforesaid consolidated Ind AS financialstatements comply with the Indian Accounting Standardsprescribed under Section 133 of the Act.
(e) On the basis of the written representations received fromthe directors of the Parent as on March 31, 2017 taken onrecord by the Board of Directors of the Parent and the reportsof the statutory auditors of its subsidiary companies, itsassociate company and joint venture company incorporatedin India, none of the directors of the Group companies, itsassociate company and joint venture company incorporatedin India is disqualified as on March 31, 2017 from beingappointed as a director in terms of Section 164 (2) of theAct.
(f) With respect to the adequacy of the internal financialcontrols over financial reporting and the operating
effectiveness of such controls, refer to our separate Reportin “Annexure A”, which is based on the auditors’ reports ofthe Parent, subsidiary companies, associate company andjoint venture company incorporated in India. Our reportexpresses an unmodified opinion on the adequacy andoperating effectiveness of the Parent’s, subsidiarycompanies’, associate company’s and joint venturecompany’s internal financial controls over financialreporting.
(g) With respect to the other matters to be included in theAuditor’s Report in accordance with Rule 11 of theCompanies (Audit and Auditor’s) Rules, 2014, as amended,in our opinion and to the best of our information andaccording to the explanations given to us:
i. The consolidated Ind AS financial statements disclosethe impact of pending litigations on the consolidatedfinancial position of the Group, its associate and jointventure. Refer Notes 44 A and 44 C to the consolidatedInd AS financial statements.
ii. The Group, its associate and joint venture did not haveany material foreseeable losses on long-term contractsincluding derivative contracts.
iii. There were no amounts which were required to betransferred to the Investor Education and ProtectionFund by the Parent and its subsidiary companies,associate company and joint venture companyincorporated in India.
iv. The Parent has provided requisite disclosures in theconsolidated Ind AS financial statements as regards theholding and dealings in Specified Bank Notes as definedin the Notification S.O. 3407(E) dated November 8,2016 of the Ministry of Finance, during the period fromNovember 8, 2016 to December 30, 2016 of the Groupentities as applicable. Based on audit proceduresperformed and the representations provided to us bythe management we report that the disclosures are inaccordance with the relevant books of accountsmaintained by those entities for the purpose ofpreparation of the consolidated Ind AS financialstatements and as produced to us by the Managementof the respective Group entities.
For Deloitte Haskins & Sells LLPChartered AccountantsFirm’s Registration No. 117366W / W-100018
Hemant M. JoshiPartnerMembership No: 38019
Place : MumbaiDate : May 13, 2017

C K
168 Idea Cellular Limited
Consolidated Financial Statements
Annexure “A” to the Independent Auditor’s Report(Referred to in paragraph (f) under ‘Report on Other Legal and Regulatory Requirements’of our report of even date)
Report on the Internal Financial Controls Over Financial
Reporting under Clause (i) of Sub-section 3 of Section 143 of
the Companies Act, 2013 (“the Act”)
In conjunction with our audit of the consolidated Ind AS financial
statements of the Company as of and for the year ended March
31, 2017, we have audited the internal financial controls over
financial reporting of IDEA CELLULAR LIMITED (hereinafter
referred to as “the Parent”) and its subsidiary companies, its
associate company and joint venture company, which are
companies incorporated in India, as of that date.
Management’s Responsibility for Internal Financial Controls
The respective Board of Directors of the Parent, its subsidiary
companies, its associate company and joint venture company,
which are companies incorporated in India, are responsible for
establishing and maintaining internal financial controls based
on, the internal control over financial reporting criteria
established by the respective Companies considering the
essential components of internal control stated in the Guidance
Note on Audit of Internal Financial Controls Over Financial
Reporting issued by the Institute of Chartered Accountants of
India (ICAI). These responsibilities include the design,
implementation and maintenance of adequate internal financial
controls that were operating effectively for ensuring the orderly
and efficient conduct of its business, including adherence to the
respective company’s policies, the safeguarding of its assets, the
prevention and detection of frauds and errors, the accuracy and
completeness of the accounting records, and the timely
preparation of reliable financial information, as required under
the Companies Act, 2013.
Auditors’ Responsibility
Our responsibility is to express an opinion on the internal financial
controls over financial reporting of the Parent, its subsidiary
companies, its associate company and joint venture company,
which are companies incorporated in India, based on our audit.
We conducted our audit in accordance with the Guidance Note
on Audit of Internal Financial Controls Over Financial Reporting
(the “Guidance Note”) issued by the Institute of Chartered
Accountants of India and the Standards on Auditing, prescribed
under Section 143(10) of the Companies Act, 2013, to the extent
applicable to an audit of internal financial controls. Those
Standards and the Guidance Note require that we comply with
ethical requirements and plan and perform the audit to obtain
reasonable assurance about whether adequate internal
financial controls over financial reporting was established and
maintained and if such controls operated effectively in all material
respects.
Our audit involves performing procedures to obtain audit
evidence about the adequacy of the internal financial controls
system over financial reporting and their operating effectiveness.
Our audit of internal financial controls over financial reporting
included obtaining an understanding of internal financial controls
over financial reporting, assessing the risk that a material
weakness exists, and testing and evaluating the design and
operating effectiveness of internal control based on the assessed
risk. The procedures selected depend on the auditor’s judgement,
including the assessment of the risks of material misstatement of
the financial statements, whether due to fraud or error.
We believe that the audit evidence we have obtained and the
audit evidence obtained by auditors of the joint venture company,
which is company incorporated in India, in terms of their report
referred to in the Other Matters paragraph below, is sufficient
and appropriate to provide a basis for our audit opinion on the
internal financial controls system over financial reporting
of the Parent, its subsidiary companies, its associate company
and joint venture company, which are companies incorporated
in India.
Meaning of Internal Financial Controls Over Financial
Reporting
A company’s internal financial control over financial reporting is
a process designed to provide reasonable assurance regarding
the reliability of financial reporting and the preparation of financial
statements for external purposes in accordance with generally
accepted accounting principles. A company’s internal financial
control over financial reporting includes those policies and
procedures that (1) pertain to the maintenance of records that, in
reasonable detail, accurately and fairly reflect the transactions
and dispositions of the assets of the company; (2) provide
reasonable assurance that transactions are recorded as necessary
to permit preparation of financial statements in accordance with
generally accepted accounting principles, and that receipts and
expenditures of the company are being made only in accordance
with authorisations of management and directors of the company;
and (3) provide reasonable assurance regarding prevention or
timely detection of unauthorised acquisition, use, or disposition
of the company’s assets that could have a material effect on the
financial statements.
Inherent Limitations of Internal Financial Controls Over
Financial Reporting
Because of the inherent limitations of internal financial controls
over financial reporting, including the possibility of collusion or
improper management override of controls, material
misstatements due to error or fraud may occur and not be
detected. Also, projections of any evaluation of the internal
financial controls over financial reporting to future periods are
subject to the risk that the internal financial control over financial
reporting may become inadequate because of changes in
conditions, or that the degree of compliance with the policies or
procedures may deteriorate.
Independent Auditors’ Report

C K
Annual Report 2016-17 169
Consolidated Financial Statements
Opinion
In our opinion to the best of our information and according to
the explanations given to us and based on the consideration of
the report of other auditors referred to in the Other Matters
paragraph below, the Parent, its subsidiary companies, its
associate company and joint venture company, which are
companies incorporated in India, have, in all material respects,
an adequate internal financial controls system over financial
reporting and such internal financial controls over financial
reporting were operating effectively as at March 31, 2017, based
on, the internal control over financial reporting criteria established
by the respective companies considering the essential components
of internal control stated in the Guidance Note on Audit of Internal
Financial Controls Over Financial Reporting issued by the Institute
of Chartered Accountants of India.
Other Matters
Our aforesaid report under Section 143(3)(i) of the Act on the
adequacy and operating effectiveness of the internal financial
controls over financial reporting insofar as it relates to a joint
venture, which is company incorporated in India, is based solely
on the corresponding report of the auditors of such company
incorporated in India.
Our opinion is not modified in respect of the above matter.
For Deloitte Haskins & Sells LLPChartered AccountantsFirm’s Registration No. 117366W / W-100018
Hemant M. JoshiPartnerMembership No: 38019
Place : MumbaiDate : May 13, 2017
Independent Auditors’ Report
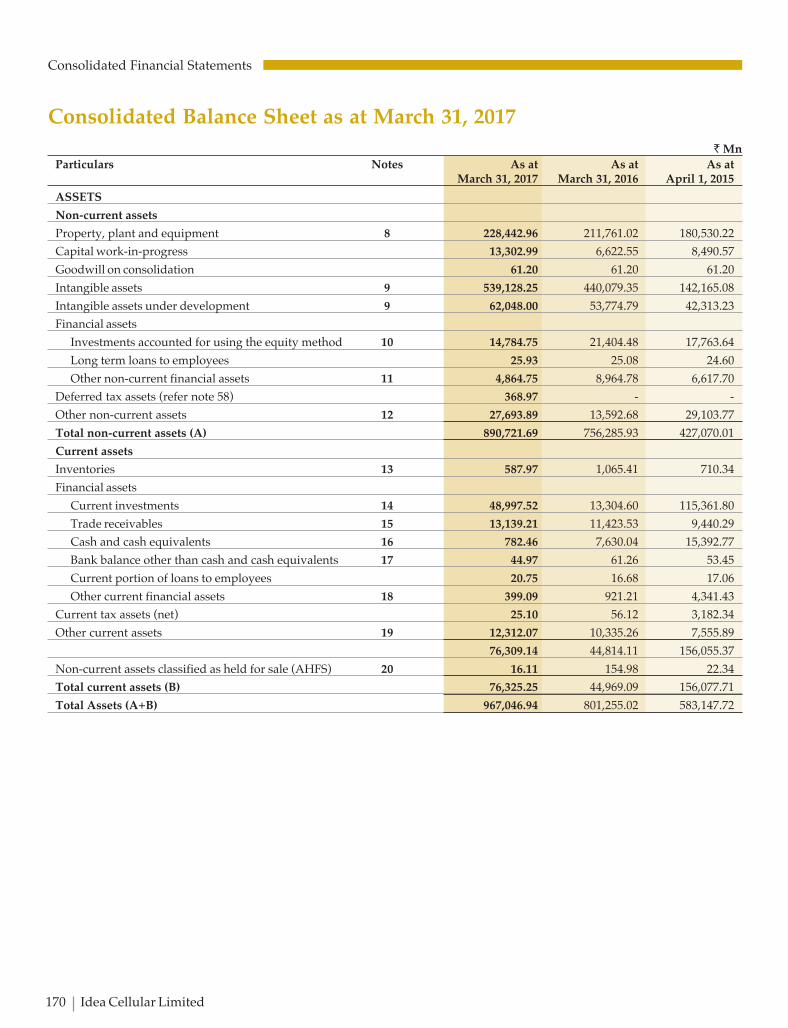
C K
170 Idea Cellular Limited
Consolidated Financial Statements
Consolidated Balance Sheet as at March 31, 2017
` MnParticulars Notes As at As at As at
March 31, 2017 March 31, 2016 April 1, 2015
ASSETS
Non-current assets
Property, plant and equipment 8 228,442.96 211,761.02 180,530.22
Capital work-in-progress 13,302.99 6,622.55 8,490.57
Goodwill on consolidation 61.20 61.20 61.20
Intangible assets 9 539,128.25 440,079.35 142,165.08
Intangible assets under development 9 62,048.00 53,774.79 42,313.23
Financial assets
Investments accounted for using the equity method 10 14,784.75 21,404.48 17,763.64
Long term loans to employees 25.93 25.08 24.60
Other non-current financial assets 11 4,864.75 8,964.78 6,617.70
Deferred tax assets (refer note 58) 368.97 - -
Other non-current assets 12 27,693.89 13,592.68 29,103.77
Total non-current assets (A) 890,721.69 756,285.93 427,070.01
Current assets
Inventories 13 587.97 1,065.41 710.34
Financial assets
Current investments 14 48,997.52 13,304.60 115,361.80
Trade receivables 15 13,139.21 11,423.53 9,440.29
Cash and cash equivalents 16 782.46 7,630.04 15,392.77
Bank balance other than cash and cash equivalents 17 44.97 61.26 53.45
Current portion of loans to employees 20.75 16.68 17.06
Other current financial assets 18 399.09 921.21 4,341.43
Current tax assets (net) 25.10 56.12 3,182.34
Other current assets 19 12,312.07 10,335.26 7,555.89
76,309.14 44,814.11 156,055.37
Non-current assets classified as held for sale (AHFS) 20 16.11 154.98 22.34
Total current assets (B) 76,325.25 44,969.09 156,077.71
Total Assets (A+B) 967,046.94 801,255.02 583,147.72

C K
Annual Report 2016-17 171
Consolidated Financial Statements
In terms of our report attached For and on behalf of the Board
For Deloitte Haskins & Sells LLPChartered Accountants
Hemant M. Joshi Arun Thiagarajan Sanjeev Aga Himanshu KapaniaPartner Director Director Managing DirectorMembership No.: 38019
Akshaya Moondra Pankaj KapdeoPlace : Mumbai Whole time Director & Company SecretaryDate : May 13, 2017 Chief Financial Officer
EQUITY AND LIABILITIES
Equity
Equity share capital 21 36,053.28 36,005.09 35,978.44
Other equity 22 211,269.16 199,499.78 174,764.13
Total equity (A) 247,322.44 235,504.87 210,742.57
Liabilities
Non-current liabilities
Financial liabilities
Long term borrowings 23 516,378.28 359,040.42 157,990.82
Other non-current financial liabilities 24 10,381.81 23,721.63 2,345.85
Long term provisions 25 3,842.29 3,453.90 2,843.47
Deferred tax liabilities (net) (refer note 58) 13,587.10 19,538.60 13,275.78
Other non-current liabilities 26 4,920.46 4,108.30 3,661.28
Total non-current liabilities (B) 549,109.94 409,862.85 180,117.20
Current liabilities
Financial liabilities
Short term borrowings 27 347.09 16,455.78 1,513.94
Trade payables 40,776.67 32,471.30 29,617.48
Other current financial liabilities 28 102,560.08 82,539.69 139,401.84
Other current liabilities 29 26,732.08 23,494.15 21,358.81
Short term provisions 30 198.64 926.38 395.88
Total current liabilities (C) 170,614.56 155,887.30 192,287.95
Total Equity and Liabilities (A+B+C) 967,046.94 801,255.02 583,147.72
The accompanying notes are an integral part of the Financial Statements
Consolidated Balance Sheet as at March 31, 2017 (Contd.)` Mn
Particulars Notes As at As at As atMarch 31, 2017 March 31, 2016 April 1, 2015

C K
172 Idea Cellular Limited
Consolidated Financial Statements
Consolidated Statement of Profit and Loss for the year ended March 31, 2017` Mn
Particulars Notes For the year ended For the year endedMarch 31, 2017 March 31, 2016
INCOME
Service revenue 355,298.44 358,833.89Sale of Trading Goods 228.11 329.74Other operating income 31 230.82 330.43Revenue from operations 355,757.37 359,494.06Other income 32 3,069.35 2,131.39TOTAL INCOME 358,826.72 361,625.45OPERATING EXPENDITURECost of Trading Goods 279.19 288.98Employee benefit expenses 33 17,976.45 16,118.51Network expenses and IT outsourcing cost 34 106,652.64 92,777.63License fees and spectrum usage charges 35 40,514.83 41,507.83Roaming and access charges 36 42,754.44 46,653.46Subscriber acquisition and servicing expenditure 37 30,282.23 28,668.04Advertisement and business promotion expenditure 4,576.89 4,864.45Administration and other expenses 38 9,957.84 8,939.84
252,994.51 239,818.74PROFIT BEFORE FINANCE CHARGES, DEPRECIATION,AMORTISATION AND TAXES 105,832.21 121,806.71Fair value (gain) / loss on Compulsorily Convertible Preference Shares (CCPS) 290.15 3,173.78Finance costs 39 40,120.63 17,787.72Depreciation 8 49,913.76 48,045.13Amortisation 9 28,358.28 14,515.61PROFIT/(LOSS) BEFORE TAX AND SHARE OFJOINT VENTURE AND ASSOCIATE (12,850.61) 38,284.47Add: Share in Profits of Joint Venture 4,302.93 4,216.81Add: Share in Loss of Associate (84.67) -PROFIT/(LOSS) BEFORE TAX (8,632.35) 42,501.28Tax expense:
- Current tax 57 990.09 8,921.67- Deferred tax 57 (5,625.48) 6,298.28
PROFIT/(LOSS) AFTER TAX (3,996.96) 27,281.33OTHER COMPREHENSIVE INCOME / (LOSS)Items not to be reclassified to profit or loss in subsequent periods:
Re-measurement gains/(losses) of defined benefit plans 54 (56.82) (200.06)Income tax effect 19.30 69.21Group’s share in other comprehensive income of joint venture and associate (5.82) (8.40)OTHER COMPREHENSIVE INCOME / (LOSS) FOR THE YEAR, NET OF TAX (43.34) (139.25)TOTAL COMPREHENSIVE INCOME / (LOSS) FOR THE YEAR (4,040.30) 27,142.08Earnings per equity share (in `): 59
Basic (1.23) 7.42Diluted (1.23) 7.40
The accompanying notes are an integral part of the Financial Statements
In terms of our report attached For and on behalf of the Board
For Deloitte Haskins & Sells LLPChartered Accountants
Hemant M. Joshi Arun Thiagarajan Sanjeev Aga Himanshu KapaniaPartner Director Director Managing DirectorMembership No.: 38019
Akshaya Moondra Pankaj KapdeoPlace : Mumbai Whole time Director & Company SecretaryDate : May 13, 2017 Chief Financial Officer
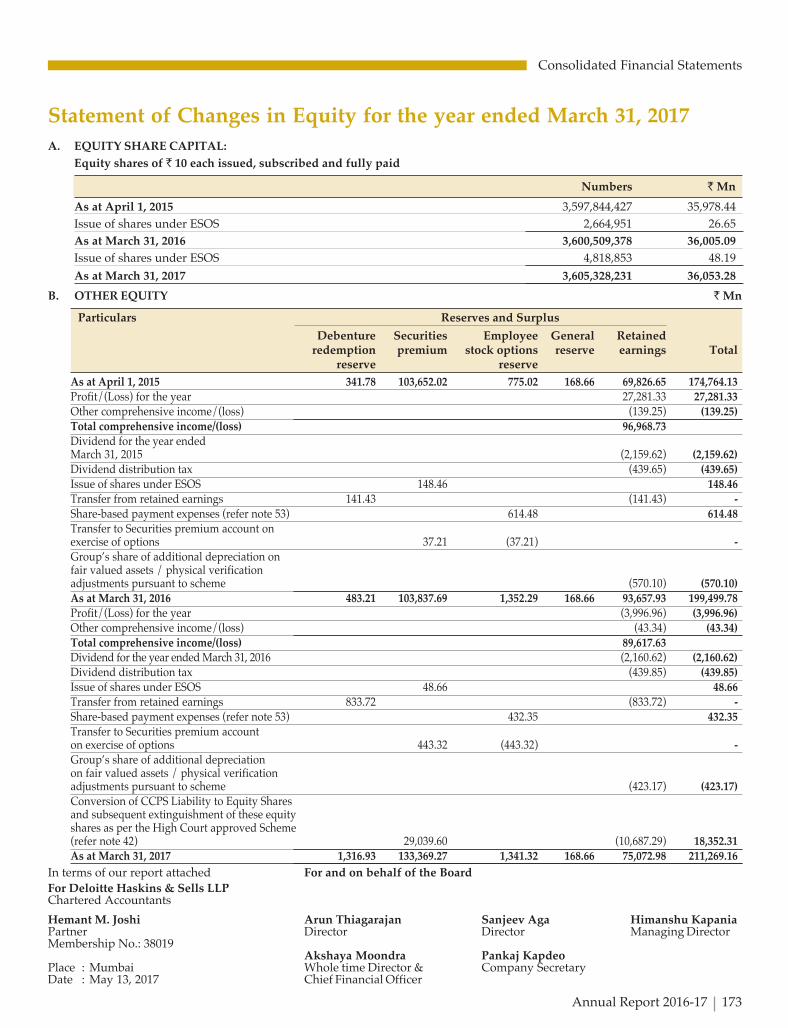
C K
Annual Report 2016-17 173
Consolidated Financial Statements
A. EQUITY SHARE CAPITAL:
Equity shares of ` 10 each issued, subscribed and fully paid
Numbers ` Mn
As at April 1, 2015 3,597,844,427 35,978.44
Issue of shares under ESOS 2,664,951 26.65
As at March 31, 2016 3,600,509,378 36,005.09
Issue of shares under ESOS 4,818,853 48.19
As at March 31, 2017 3,605,328,231 36,053.28
B. OTHER EQUITY ` Mn
Particulars Reserves and Surplus
Debenture Securities Employee General Retainedredemption premium stock options reserve earnings Total
reserve reserve
As at April 1, 2015 341.78 103,652.02 775.02 168.66 69,826.65 174,764.13Profit/(Loss) for the year 27,281.33 27,281.33Other comprehensive income/(loss) (139.25) (139.25)Total comprehensive income/(loss) 96,968.73Dividend for the year endedMarch 31, 2015 (2,159.62) (2,159.62)Dividend distribution tax (439.65) (439.65)Issue of shares under ESOS 148.46 148.46Transfer from retained earnings 141.43 (141.43) -Share-based payment expenses (refer note 53) 614.48 614.48Transfer to Securities premium account onexercise of options 37.21 (37.21) -Group’s share of additional depreciation onfair valued assets / physical verificationadjustments pursuant to scheme (570.10) (570.10)As at March 31, 2016 483.21 103,837.69 1,352.29 168.66 93,657.93 199,499.78Profit/(Loss) for the year (3,996.96) (3,996.96)Other comprehensive income/(loss) (43.34) (43.34)Total comprehensive income/(loss) 89,617.63Dividend for the year ended March 31, 2016 (2,160.62) (2,160.62)Dividend distribution tax (439.85) (439.85)Issue of shares under ESOS 48.66 48.66Transfer from retained earnings 833.72 (833.72) -Share-based payment expenses (refer note 53) 432.35 432.35Transfer to Securities premium accounton exercise of options 443.32 (443.32) -Group’s share of additional depreciationon fair valued assets / physical verificationadjustments pursuant to scheme (423.17) (423.17)Conversion of CCPS Liability to Equity Sharesand subsequent extinguishment of these equityshares as per the High Court approved Scheme(refer note 42) 29,039.60 (10,687.29) 18,352.31As at March 31, 2017 1,316.93 133,369.27 1,341.32 168.66 75,072.98 211,269.16
Statement of Changes in Equity for the year ended March 31, 2017
In terms of our report attached For and on behalf of the Board
For Deloitte Haskins & Sells LLPChartered Accountants
Hemant M. Joshi Arun Thiagarajan Sanjeev Aga Himanshu KapaniaPartner Director Director Managing DirectorMembership No.: 38019
Akshaya Moondra Pankaj KapdeoPlace : Mumbai Whole time Director & Company SecretaryDate : May 13, 2017 Chief Financial Officer

C K
174 Idea Cellular Limited
Consolidated Financial Statements
1. Corporate Information
Idea Cellular Limited (‘the Company’), a public companydomiciled in India was incorporated on March 14, 1995. It isa part of the Aditya Birla Group and its shares are listed onthe National Stock Exchange (NSE) and Bombay StockExchange (BSE) in India (Scrip Code BSE:532822; NSE:IDEA).The Company is amongst the top three telecom serviceproviders in India with pan India operations. It is engagedin the business of Mobility and Long Distance services. Thesubsidiaries are in the business of trading of Handsets andData cards, mobile banking services and passiveinfrastructure services. The Joint Venture is in the businessof providing passive infrastructure services and the associateis in the business of providing payments bank services andis yet to commence operations.
The consolidated financial statements for the year endedMarch 31, 2017 were approved by the Board of Directorsand authorised for issue on May 13, 2017.
2. Basis of preparation
The consolidated financial statements of the Company, itssubsidiary companies (together referred to as the “Group”),joint venture and associate comprising of ConsolidatedBalance Sheet and Consolidated Statement of Profit and Loss,Consolidated Statement of Changes in Equity, Statement ofConsolidated Cash Flows together with the consolidatednotes have been prepared in accordance with IndianAccounting Standards (Ind AS) notified under the Companies(Indian Accounting Standards) Rules, 2015.
For all periods up to and including the year ended March 31,2016, the Group prepared its consolidated financialstatements in accordance with accounting standards notifiedunder section 133 of the Companies Act 2013 (PreviousGAAP).
The consolidated financial statements for the financial yearended March 31, 2017 are the company’s first Ind AScompliant annual financial statements with comparativefigures for the year ended March 31, 2016 also under IndAS. The date of transition is April 1, 2015. Please refer tonote 6 for detailed disclosure on the first time adoption ofInd AS.
These consolidated financial statements have been preparedon a historical cost basis, except for certain financialinstruments that have been measured at fair values at theend of each reporting period, as explained in the accountingpolicies below.
Historical cost is generally based on the fair value of theconsideration given in exchange for goods and services onthe transaction date.
All assets and liabilities have been classified as current ornon-current in accordance with the operating cycle criteriaset out in Ind AS 1 and Schedule III to the Companies Act,2013.Deferred tax assets (including MAT credit entitlement)and liabilities are classified as non-current assets and liabilities.
Notes forming part of the Consolidated Financial Statements
3. Basis of Consolidation
The consolidated financial statements have been preparedin accordance with Ind AS 110 on Consolidated FinancialStatements.
Subsidiaries are entities over which the Group has control.The Group controls an entity when the Group has:
• Power over the investee
• Exposure or rights, to variable returns from itsinvolvement with the investee and
• Has the ability to affect those returns through its powerto direct the relevant activities of the investee.
Generally, there is a presumption that majority of votingrights results in control. To support this presumption andwhen the Group has less than majority of voting or similarrights over an investee, the Group considers all relevant factsand circumstances in assessing whether it has power overan investee, including:
• The size of the Group’s holding of voting rights relativeto the size and dispersion of holdings of the other voteholders
• Rights arising from other contractual arrangements
• Potential voting rights held by the Group
The consolidated financial statements of the group areprepared based on a line by line combination of the separatefinancial statements of the Company and its subsidiarieswhereby the book values of like items of assets, liabilities,income, expenses and tax have been added after eliminatingintra-group balances, transactions and resulting unrealisedgains or losses.
Subsidiaries are consolidated from the date on which controlis acquired by the group. Non-controlling interests in theresults and equity of subsidiaries are shown separately inthe Consolidated Statement of Profit and Loss, ConsolidatedStatement of Changes in Equity and Consolidated BalanceSheet respectively.
The financial statements of the following entities in the Groupare prepared using uniform accounting policies and aredrawn up to the same accounting period as that of theCompany.
Sr. Name of the Relationship Voting Power % as atNo. Company
March 31, March 31, April 1,
2017 2016 2015
1. Idea Telesystems Limited Subsidiary 100.00 100.00 100.00
2. Aditya Birla TelecomLimited Subsidiary 100.00 100.00 100.00
3. Idea Cellular ServicesLimited Subsidiary 100.00 100.00 100.00
4. Idea Cellular InfrastructureServices Limited Subsidiary 100.00 100.00 100.00
5. Idea Mobile CommerceServices Limited Subsidiary 100.00 100.00 100.00

C K
Annual Report 2016-17 175
Consolidated Financial Statements
Changes in ownership interests
The group treats transactions with non-controlling intereststhat do not result in a loss of control as transactions withequity owners of the group. A change in ownership interestresults in an adjustment between the carrying amounts ofthe controlling and non-controlling interests to reflect theirrelative interests in the subsidiary. Any difference betweenthe amount of the adjustment to non-controlling interests andany consideration paid or received is recognised withinequity.
The subsidiaries are deconsolidated from the date the Grouploses control on such subsidiaries. When the group ceases toconsolidate because of a loss of control, any retained interestin the entity is re-measured to its fair value with the changein carrying amount recognised in profit or loss. This fair valuebecomes the initial carrying amount for the purposes ofsubsequently accounting for the retained interest as anassociate, joint venture or financial asset. In addition, anyamounts previously recognised in other comprehensiveincome in respect of that entity are accounted for as if thegroup had directly disposed of the related assets or liabilities.This may mean that amounts previously recognised in othercomprehensive income are reclassified to profit or loss.
4. Significant Accounting Policies
a) Revenue recognition
Revenue is recognised to the extent it is probable that theeconomic benefits will flow to the Group and can be reliablymeasured, regardless of the timing of receipt of payment.Revenue is measured at fair value of the considerationreceived or receivable and is reduced for rebates and othersimilar allowances. Taxes and duties are collected by the seller/ service provider to be deposited with the government andnot received by the respective companies on their ownaccount. Accordingly, it is excluded from revenue. The Groupevaluates its exposure to significant risks and rewardassociated with the revenue arrangements in order todetermine its position of a principal or an agent in this regard.
i. Revenue from supply of services and sale of goods
Revenue on account of telephony services (postpaid andprepaid categories, roaming, interconnect & longdistance services) is recognised on rendering of services.Rental revenues in the postpaid category are recognisedover the period of rendering of services. Recharge feeson recharge vouchers in case of prepaid category isrecognised over the validity of such vouchers.
Revenue from other services (internet services, Mobileadvertisement, revenue from toll free services, etc.) isrecognised on rendering of services.
Revenue from sale of handsets, data cards and relatedaccessories is recognised when the significant risks andrewards of ownership of the goods have passed to thebuyer, usually on the delivery of goods.
Multiple element contracts:
For revenue arrangements having more than onedeliverable, at the inception of the arrangement, theGroup evaluates all deliverables in the arrangement todetermine whether they represent separately identifiablecomponents. Deliverables are considered for separatecomponents if the following two conditions are met: (i)the deliverable has value to the customer on a stand-alone basis and (ii) there is evidence of the fair value ofthe item. The total arrangement consideration is allocatedto each separate component based on its relative fairvalue.
Revenue from passive infrastructure is recognised onaccrual basis as per the contractual terms.
ii. Indefeasible Right to Use (IRU)
The Group enters into agreements which entitle itscustomers the right to use of specified capacity of darkfibre / bandwidth capacity for a specific period of time.Under such arrangements, the rights to use the specifiedassets are given for a substantial part of the estimateduseful life of such assets.
The contracted price received upfront in advance istreated as deferred revenue and is recognised on astraight line basis over the agreement period.
iii. Unbilled Income
Unbilled income represents the value of servicesrendered but not yet been invoiced on the reporting datedue to contractual terms.
iv. Interest Income
Interest income from a financial asset is recognised whenit is probable that the economic benefits will flow to theGroup and the amount of income can be measuredreliably. Interest income is recorded using the applicableEffective Interest Rate (EIR), which is the rate that exactlydiscounts estimated future cash receipts over theexpected life of the financial asset to that asset’s netcarrying amount on initial recognition.
v. Dividends
Dividend Income is recognised when the Group’s rightto receive the payment is established.
b) Leases
The Group evaluates whether an arrangement is (or contains)a lease based on the substance of the arrangement at theinception of the lease. An arrangement which is dependenton the use of a specific asset or assets and conveys a right touse the asset or assets, even if it is not explicitly specified inan arrangement is (or contains) a lease.
Leases are classified as finance lease whenever the terms ofthe lease transfer substantially all the risks and rewards ofownership to the lessee. All other leases are classified asoperating leases.
Notes forming part of the Consolidated Financial Statements

C K
176 Idea Cellular Limited
Consolidated Financial Statements
Notes forming part of the Consolidated Financial Statements
i. Group as a lessee
Finance lease:
Assets held under finance leases are initially recognisedas assets at the commencement of the lease at their fairvalue or, if lower, at the present value of the minimumlease payments. Lease payments are apportioned betweenfinance charges and reduction of the lease liability so as toachieve a constant rate of interest on the remaining balanceof the liability. Finance charges are recognised in theConsolidated Statement of Profit and Loss, unless theyare directly attributable to qualifying assets, in which casethey are capitalised in accordance with the Group’s generalpolicy on borrowing costs. Such assets are depreciated /amortised over the period of lease or estimated useful lifeof the assets whichever is less. Contingent rentals arerecognised as expenses in the periods in which they areincurred.
Operating lease:
Operating lease payments are recognised as an expensein the Consolidated Statement of Profit and Loss on astraight line basis unless payments to the lessor arestructured to increase in line with expected generalinflation to compensate for the lessor’s expectedinflationary cost increase; such increases are recognisedin the year in which such benefits accrue. Contingentrentals arising, if any, under operating leases arerecognised as an expense in the period in which theyare incurred.
In the event that lease incentives are received to enterinto operating leases, such incentives are recognised asa liability. The aggregate benefit of incentives isrecognised as a reduction of rental expense on a straight-line basis, except where another systematic basis is morerepresentative of the time pattern in which economicbenefits from the leased asset are consumed.
ii. Group as a lessor
Finance lease:
Amounts due from lessees under finance leases arerecognised as receivables at the amount of the Group’snet investment in the leases. Finance lease income isallocated to accounting period so as to reflect a constantperiodic rate of return on the net investment outstandingin respect of the lease.
Operating lease:
Rental income from operating lease is recognised on astraight line basis over the lease term unless paymentsto the Group are structured to increase in line withexpected general inflation to compensate for the Group’sexpected inflationary cost increase; such increases arerecognised in the year in which such benefits accrue.Initial direct costs incurred in negotiating and arrangingan operating lease are added to the carrying amount ofthe leased asset and recognised on a straight line basisover the lease term. Contingent rents are recognised asrevenue in the period in which they are earned.
c) Employee benefits
i. Retirement Benefits
Contributions to Provident and Pension funds arefunded with the appropriate authorities and charged tothe Consolidated Statement of Profit and Loss when theemployees have rendered service entitling them to thecontributions.
Contributions to Superannuation are funded with theLife Insurance Corporation of India and charged to theConsolidated Statement of Profit and Loss when theemployees have rendered service entitling them to thecontributions.
The Group operates a defined benefit gratuity plan,which requires contributions to be made to a separatelyadministered fund with the Life Insurance Corporationof India. The cost of providing benefits under the definedbenefit plan is determined using the projected unit creditmethod, with actuarial valuations being carried out atperiodic intervals.
Re-measurements, comprising of actuarial gains andlosses and the return on plan assets (excluding amountsincluded in net interest on the net defined benefitliability), are recognised immediately in the consolidatedbalance sheet with a corresponding charge or credit toOther Comprehensive Income (OCI) in the period inwhich they occur. Re-measurements are not reclassifiedto the Consolidated Statement of Profit and Loss insubsequent periods.
Net interest is calculated by applying the discount rateto the net defined benefit liability or asset. The Grouprecognises the following changes in the net definedbenefit obligation as an expense in the ConsolidatedStatement of Profit and Loss:
• Service costs; and
• Net interest expense or income
ii. Short-term and other long-term employee benefits
A liability is recognised for benefits accruing toemployees in respect of salaries, wages and other shortterm employee benefits in the period the related serviceis rendered at the undiscounted amount of the benefitsexpected to be paid in exchange for that service.
Provision for leave benefits to employees is based onactuarial valuation done by projected accrued benefitmethod at the reporting date.
iii. Share- based payments
Equity-settled share-based payments to employees aremeasured at the fair value of the equity instruments atthe grant date.
The fair value determined at the grant date of the equity-settled share-based payments is expensed on a straight-line basis over the vesting period, based on the Group’sestimate of equity instruments that will eventually vest,with a corresponding increase in equity. At the end of
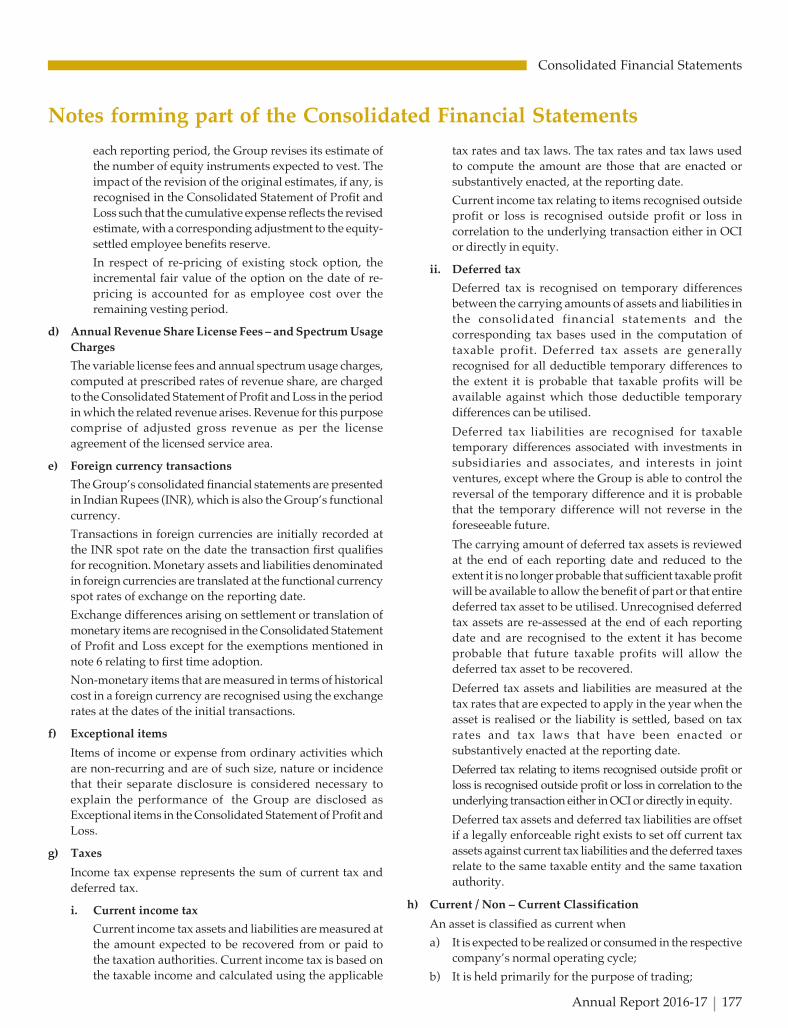
C K
Annual Report 2016-17 177
Consolidated Financial Statements
each reporting period, the Group revises its estimate ofthe number of equity instruments expected to vest. Theimpact of the revision of the original estimates, if any, isrecognised in the Consolidated Statement of Profit andLoss such that the cumulative expense reflects the revisedestimate, with a corresponding adjustment to the equity-settled employee benefits reserve.
In respect of re-pricing of existing stock option, theincremental fair value of the option on the date of re-pricing is accounted for as employee cost over theremaining vesting period.
d) Annual Revenue Share License Fees – and Spectrum Usage
Charges
The variable license fees and annual spectrum usage charges,computed at prescribed rates of revenue share, are chargedto the Consolidated Statement of Profit and Loss in the periodin which the related revenue arises. Revenue for this purposecomprise of adjusted gross revenue as per the licenseagreement of the licensed service area.
e) Foreign currency transactions
The Group’s consolidated financial statements are presentedin Indian Rupees (INR), which is also the Group’s functionalcurrency.
Transactions in foreign currencies are initially recorded atthe INR spot rate on the date the transaction first qualifiesfor recognition. Monetary assets and liabilities denominatedin foreign currencies are translated at the functional currencyspot rates of exchange on the reporting date.
Exchange differences arising on settlement or translation ofmonetary items are recognised in the Consolidated Statementof Profit and Loss except for the exemptions mentioned innote 6 relating to first time adoption.
Non-monetary items that are measured in terms of historicalcost in a foreign currency are recognised using the exchangerates at the dates of the initial transactions.
f) Exceptional items
Items of income or expense from ordinary activities whichare non-recurring and are of such size, nature or incidencethat their separate disclosure is considered necessary toexplain the performance of the Group are disclosed asExceptional items in the Consolidated Statement of Profit andLoss.
g) Taxes
Income tax expense represents the sum of current tax anddeferred tax.
i. Current income tax
Current income tax assets and liabilities are measured atthe amount expected to be recovered from or paid tothe taxation authorities. Current income tax is based onthe taxable income and calculated using the applicable
tax rates and tax laws. The tax rates and tax laws usedto compute the amount are those that are enacted orsubstantively enacted, at the reporting date.
Current income tax relating to items recognised outsideprofit or loss is recognised outside profit or loss incorrelation to the underlying transaction either in OCIor directly in equity.
ii. Deferred tax
Deferred tax is recognised on temporary differencesbetween the carrying amounts of assets and liabilities inthe consolidated financial statements and thecorresponding tax bases used in the computation oftaxable profit. Deferred tax assets are generallyrecognised for all deductible temporary differences tothe extent it is probable that taxable profits will beavailable against which those deductible temporarydifferences can be utilised.
Deferred tax liabilities are recognised for taxabletemporary differences associated with investments insubsidiaries and associates, and interests in jointventures, except where the Group is able to control thereversal of the temporary difference and it is probablethat the temporary difference will not reverse in theforeseeable future.
The carrying amount of deferred tax assets is reviewedat the end of each reporting date and reduced to theextent it is no longer probable that sufficient taxable profitwill be available to allow the benefit of part or that entiredeferred tax asset to be utilised. Unrecognised deferredtax assets are re-assessed at the end of each reportingdate and are recognised to the extent it has becomeprobable that future taxable profits will allow thedeferred tax asset to be recovered.
Deferred tax assets and liabilities are measured at thetax rates that are expected to apply in the year when theasset is realised or the liability is settled, based on taxrates and tax laws that have been enacted orsubstantively enacted at the reporting date.
Deferred tax relating to items recognised outside profit orloss is recognised outside profit or loss in correlation to theunderlying transaction either in OCI or directly in equity.
Deferred tax assets and deferred tax liabilities are offsetif a legally enforceable right exists to set off current taxassets against current tax liabilities and the deferred taxesrelate to the same taxable entity and the same taxationauthority.
h) Current / Non – Current Classification
An asset is classified as current when
a) It is expected to be realized or consumed in the respectivecompany’s normal operating cycle;
b) It is held primarily for the purpose of trading;
Notes forming part of the Consolidated Financial Statements
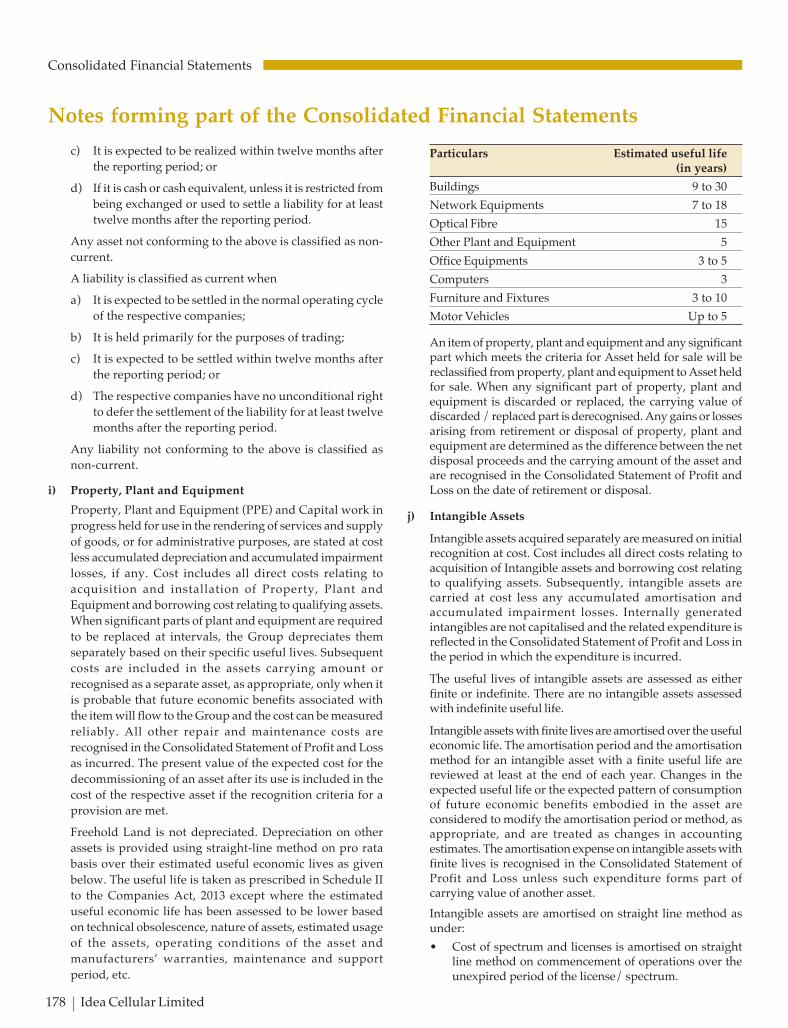
C K
178 Idea Cellular Limited
Consolidated Financial Statements
c) It is expected to be realized within twelve months after
the reporting period; or
d) If it is cash or cash equivalent, unless it is restricted from
being exchanged or used to settle a liability for at least
twelve months after the reporting period.
Any asset not conforming to the above is classified as non-
current.
A liability is classified as current when
a) It is expected to be settled in the normal operating cycle
of the respective companies;
b) It is held primarily for the purposes of trading;
c) It is expected to be settled within twelve months after
the reporting period; or
d) The respective companies have no unconditional right
to defer the settlement of the liability for at least twelve
months after the reporting period.
Any liability not conforming to the above is classified as
non-current.
i) Property, Plant and Equipment
Property, Plant and Equipment (PPE) and Capital work in
progress held for use in the rendering of services and supply
of goods, or for administrative purposes, are stated at cost
less accumulated depreciation and accumulated impairment
losses, if any. Cost includes all direct costs relating to
acquisition and installation of Property, Plant and
Equipment and borrowing cost relating to qualifying assets.
When significant parts of plant and equipment are required
to be replaced at intervals, the Group depreciates them
separately based on their specific useful lives. Subsequent
costs are included in the assets carrying amount or
recognised as a separate asset, as appropriate, only when it
is probable that future economic benefits associated with
the item will flow to the Group and the cost can be measured
reliably. All other repair and maintenance costs are
recognised in the Consolidated Statement of Profit and Loss
as incurred. The present value of the expected cost for the
decommissioning of an asset after its use is included in the
cost of the respective asset if the recognition criteria for a
provision are met.
Freehold Land is not depreciated. Depreciation on other
assets is provided using straight-line method on pro rata
basis over their estimated useful economic lives as given
below. The useful life is taken as prescribed in Schedule II
to the Companies Act, 2013 except where the estimated
useful economic life has been assessed to be lower based
on technical obsolescence, nature of assets, estimated usage
of the assets, operating conditions of the asset and
manufacturers’ warranties, maintenance and support
period, etc.
Particulars Estimated useful life(in years)
Buildings 9 to 30
Network Equipments 7 to 18
Optical Fibre 15
Other Plant and Equipment 5
Office Equipments 3 to 5
Computers 3
Furniture and Fixtures 3 to 10
Motor Vehicles Up to 5
An item of property, plant and equipment and any significantpart which meets the criteria for Asset held for sale will bereclassified from property, plant and equipment to Asset heldfor sale. When any significant part of property, plant andequipment is discarded or replaced, the carrying value ofdiscarded / replaced part is derecognised. Any gains or lossesarising from retirement or disposal of property, plant andequipment are determined as the difference between the netdisposal proceeds and the carrying amount of the asset andare recognised in the Consolidated Statement of Profit andLoss on the date of retirement or disposal.
j) Intangible Assets
Intangible assets acquired separately are measured on initialrecognition at cost. Cost includes all direct costs relating toacquisition of Intangible assets and borrowing cost relatingto qualifying assets. Subsequently, intangible assets arecarried at cost less any accumulated amortisation andaccumulated impairment losses. Internally generatedintangibles are not capitalised and the related expenditure isreflected in the Consolidated Statement of Profit and Loss inthe period in which the expenditure is incurred.
The useful lives of intangible assets are assessed as eitherfinite or indefinite. There are no intangible assets assessedwith indefinite useful life.
Intangible assets with finite lives are amortised over the usefuleconomic life. The amortisation period and the amortisationmethod for an intangible asset with a finite useful life arereviewed at least at the end of each year. Changes in theexpected useful life or the expected pattern of consumptionof future economic benefits embodied in the asset areconsidered to modify the amortisation period or method, asappropriate, and are treated as changes in accountingestimates. The amortisation expense on intangible assets withfinite lives is recognised in the Consolidated Statement ofProfit and Loss unless such expenditure forms part ofcarrying value of another asset.
Intangible assets are amortised on straight line method asunder:
• Cost of spectrum and licenses is amortised on straightline method on commencement of operations over theunexpired period of the license/ spectrum.
Notes forming part of the Consolidated Financial Statements

C K
Annual Report 2016-17 179
Consolidated Financial Statements
• Software, which is not an integral part of hardware, istreated as an intangible asset and is amortised over its
useful economic life as estimated by the managementbetween 3 to 5 years.
• Payment for Bandwidth capacities acquired under
Indefeasible Right to Use (IRU) basis is accounted for asintangible assets and the cost is amortised over the periodof the agreement.
Gains or losses arising from derecognition of an
intangible asset are measured as the difference betweenthe net disposal proceeds and the carrying amount ofthe asset and are recognised in the Consolidated
Statement of Profit and Loss when the asset isderecognised.
k) Non – Current Assets Held for sale
Non-current assets and disposal groups are classified as heldfor sale if their carrying amount will be recovered principally
through a sale transaction rather than through continuinguse and its sale is highly probable. The sale is consideredhighly probable only when the asset or disposal groups is
available for immediate sale in its present condition, it isunlikely that the sale will be withdrawn and the sale isexpected to be completed within one year from the date ofclassification. Non-current assets and disposal groups
classified as held for sale are measured at the lower of theircarrying amount and fair value less costs to sell. These arenot depreciated or amortised once classified as held for sale.
Non-current assets that ceases to be classified as held for saleare measured at lower of (i) its carrying amount before theasset was classified as held for sale, adjusted for depreciation
that would have been recognised had that asset not beenclassified as held for sale, and (ii) its recoverable amount atthe date when the disposal group ceases to be classified as
held for sale.
l) Impairment of Non – Financial Assets
Tangible and Intangible assets which are subject to
depreciation or amortisation are reviewed for impairment,whenever events or changes in circumstances indicate thatthe carrying amount of such assets may not be recoverable.
If any such indication exists, the recoverable amount of theasset is estimated in order to determine the extent of theimpairment loss (if any). When it is not possible to estimate
the recoverable amount of an individual asset, the Groupestimates the recoverable amount of the cash-generating unitto which the asset belongs.
Recoverable amount is the higher of fair value less costs ofdisposal and value in use. In assessing value in use, theestimated future cash flows are discounted to their presentvalue using a pre-tax discount rate that reflects current marketassessments of the time value of money and the risks specificto the asset. If the recoverable amount of an asset (or cash-
generating unit) is estimated to be less than its carryingamount, an impairment loss is recognised by reducing the
carrying amount of the asset (or cash-generating unit) to itsrecoverable amount.
Impairment losses recognised in the earlier periods are assessedat each reporting date for any indication that the loss has
decreased or no longer exists. When an impairment losssubsequently reverses, the carrying amount of the asset (or acash-generating unit) is increased to the revised estimate of its
recoverable amount, but so that the increased carrying amountdoes not exceed the carrying amount that would have beendetermined had such impairment loss not been recognised for
the asset (or cash-generating unit) in prior years. Any reversalof an impairment loss is recognised immediately inConsolidated Statement of Profit and Loss.
m) Investment in Associates and Joint Arrangements
Investments in joint arrangements are classified as either jointoperations or joint ventures in accordance with Ind AS 111on Joint Arrangements. The classification depends on the
contractual rights and obligations of each investor, rather thanthe legal structure of the joint arrangement.
Associates are all entities over which the group has significantinfluence but not control or joint control.
Significant influence is the power to participate in the financialand operating policy decisions of the investee.
Investments in joint ventures and associates are initiallyrecognised at cost and subsequently accounted for using the
equity method of accounting in the consolidated financialstatements of the group as per Ind AS 28 – Investments inAssociates and Joint ventures.
Under the equity method of accounting, the investments areinitially recognised at cost and adjusted thereafter to
recognize the group’s share of the post-acquisition profits orlosses of the investee in the Statement of Profit and Loss andthe group’s share of other comprehensive income of the
investee in other comprehensive income. Dividends receivedor receivable from associates and joint ventures arerecognised as a reduction in the carrying amount of the
investment.
When the group’s share of losses in an equity-accounted
investee equals or exceeds its interest in the entity, including
any other unsecured long-term receivables, the group does
not recognize further losses, unless it has incurred legal or
constructive obligations or made payments on behalf of the
equity-accounted investee. If the equity-accounted investee
subsequently reports profits, the Group resumes recognizing
its share of those profits only after its share of profits equals
the share of losses not recognised.
Unrealized gains on transactions between the group and its
associates and joint ventures are eliminated to the extent of
Notes forming part of the Consolidated Financial Statements

C K
180 Idea Cellular Limited
Consolidated Financial Statements
the group’s interest in these entities. Unrealized losses arealso eliminated unless the transaction provides evidence ofan impairment of the asset transferred. Accounting policiesof equity accounted investees have been changed wherenecessary to ensure consistency with the policies adoptedby the group.
When necessary, the entire carrying amount of the investment(including goodwill) is tested for impairment in accordancewith Ind AS 36 – Impairment of Assets as a single asset bycomparing its recoverable amount (higher of value in useand fair value less cost of disposal) with its carrying amount.Any reversal of the impairment loss is recognised inaccordance with Ind AS 36 to the extent that the recoverableamount of the investment subsequently increases.
The Financial Statements of the following associate and jointventure used in the consolidation are drawn up to the samereporting date as that of the Group and the accounting policieshave been changed where necessary to ensure consistencywith the policies adopted by the group. Both the entities areincorporated in India.
Sr. Name of the Relationship Voting Power % as atNo. Company
March 31, March 31, April 1,2017 2016 2015
1. Indus Towers Limited* Joint Venture 11.15 16.00 16.00
2. Aditya Birla IdeaPayments Bank Limited#
(ABIPBL) Associate 9.84 49.00 N.A.
* Indus Towers limited is classified as a Joint Venture through a
contractual arrangement. Entire shareholding is held by Aditya
Birla Telecom Limited. The shareholding has changed from 16% to11.15% effective February 1, 2017.
# Although the group holds less than 20% of equity shares ofABIPBL, the group exercises its significant influence by virtue ofhaving directors on the board of ABIPBL .
Changes in ownership interests
The Group ceases to equity account for an investment if itloses joint control or significant influence over such equityaccounted investee. When the group ceases to equity accountfor an investee, any retained interest in the entity is re-measured to its fair value with the change in carrying amountrecognised in profit or loss. This fair value becomes the initialcarrying amount for the purposes of subsequent accountingfor the retained interest in the investee. In addition, anyamounts previously recognised in other comprehensiveincome in respect of that investee are accounted for as if thegroup had directly disposed of the related assets or liabilities.This may mean that amounts previously recognised in othercomprehensive income are reclassified to profit and loss.
If the ownership interest in a joint venture or an associate isreduced but joint control or significant influence is retained,only a proportionate share of the amounts previouslyrecognised in other comprehensive income are reclassified
to profit and loss where appropriate.
n) Borrowing Costs
Borrowing Costs directly attributable to the acquisition orconstruction of an asset that necessarily takes a substantialperiod of time to get ready for its intended use or sale arecapitalised as part of the cost of the asset. All other borrowingcosts are expensed in the period in which they are incurred.Borrowing costs consist of interest and other costs that anentity incurs in connection with the borrowing of funds.Interest income earned on the temporary investment ofspecific borrowings pending their expenditure on qualifyingassets is deducted from the borrowing costs eligible forcapitalisation. Borrowing cost also includes exchangedifferences to the extent regarded as an adjustment to theinterest costs.
o) Inventories
Inventories are valued at cost or net realisable value,whichever is lower. Cost is determined on weighted averagebasis and includes cost of purchase and other costs incurredin bringing inventories to their present location and condition.Net realisable value is the estimated selling price in theordinary course of business, less estimated costs ofcompletion and the estimated costs necessary to make thesale.
p) Cash and cash equivalents
Cash and cash equivalents in the consolidated Balance Sheetcomprise of cash at bank and on hand and short-termdeposits with an original maturity of three months or less,which are subject to an insignificant risk of changes in value.For the purpose of the Statement of Consolidated Cash Flows,cash and cash equivalents consist of cash and short-termdeposits, as defined above, net of outstanding bankoverdrafts as they are considered an integral part of theGroup’s cash management.
q) Financial Instruments
Initial recognition and measurement
Financial Instruments (assets and liabilities) are recognisedwhen the Group becomes a party to a contract that gives riseto a financial asset of one entity and a financial liability orequity instrument of another entity.
Financial assets and financial liabilities are initially measuredat fair value. Transaction costs that are directly attributableto the acquisition or issue of financial assets and financialliabilities, other than those designated as fair value throughprofit or loss (FVTPL), are added to or deducted from thefair value of the financial assets or financial liabilities, asappropriate, on initial recognition. Transaction costs directlyattributable to the acquisition of financial assets or financialliabilities at FVTPL are recognised immediately in Statementof Profit and Loss.
i. Financial assets
All regular way purchase or sale of financial assets arerecognised and derecognised on a trade date basis.
Notes forming part of the Consolidated Financial Statements

C K
Annual Report 2016-17 181
Consolidated Financial Statements
Notes forming part of the Consolidated Financial Statements
Regular way purchase or sales are purchases or sales offinancial assets that require delivery of assets within thetime frame established by regulation or convention inthe marketplace.
Subsequent measurement
All recognised financial assets are subsequentlymeasured in their entirety at either amortised cost or fairvalue, depending on the classification of the financialassets:
a) Financial assets measured at amortised cost
b) Financial assets measured at fair value through profitor loss (FVTPL)
c) Financial assets measured at fair value through othercomprehensive income (FVTOCI) – The Group doesnot have any assets classified as FVTOCI.
Financial assets measured at amortised cost
A financial asset is measured at amortised cost if boththe following conditions are met:
• The asset is held within a business model whoseobjective is to hold assets for collecting contractualcash flows, and
• Contractual terms of the instruments give rise onspecified dates to cash flows that are solely paymentsof principal and interest on the principal amountoutstanding.
After initial measurement, such financial assets aresubsequently measured at amortised cost using theEffective Interest Rate (EIR) method. EIR is the rate thatexactly discounts estimated future cash receipts(including all fees and points paid or received that forman integral part of the EIR, transaction costs and otherpremiums or discounts) through the expected life of thedebt instrument or where appropriate, a shorter period,to the net carrying amount on initial recognition.
The EIR amortisation is included in other income in theStatement of Profit and Loss. The losses arising fromimpairment are recognised in the Statement of Profit andLoss. This category generally applies to trade and otherreceivables, loans, etc.
Financial assets measured at FVTPL
FVTPL is a residual category for financial assets in thenature of debt instruments. Financial assets includedwithin the FVTPL category are measured at fair valuewith all changes recognised in the ConsolidatedStatement of Profit and Loss. This category also includesderivative financial instruments entered into by theGroup that are not designated as hedging instrumentsin hedge relationships as defined by Ind AS 109.
Derecognition
A financial asset (or, where applicable, a part of a financialasset or part of a group of similar financial assets) isprimarily derecognised when:
• The rights to receive cash flows from the asset haveexpired, or
• The Group has transferred its rights to receive cashflows from the asset or has assumed an obligationto pay the received cash flows in full without materialdelay to a third party under a ‘pass-through’arrangement; and either
- the Group has transferred substantially all therisks and rewards of the asset, or
- the Group has neither transferred nor retainedsubstantially all the risks and rewards of theasset, but has transferred control of the asset.
Impairment of financial assets
In accordance with Ind AS 109, the Group appliesExpected Credit Loss (ECL) model for measurement andrecognition of impairment loss on the following financialassets and credit risk exposure:
• Debt instruments measured at amortised cost e.g.,loans and bank deposits
• Trade receivables
• Other Financial assets not designated as FVTPL
For recognition of impairment loss on other financialassets and risk exposure, the Group determines whetherthere has been a significant increase in the credit risksince initial recognition. If credit risk has not increasedsignificantly, 12-month ECL is used to provide forimpairment loss. However, if credit risk has increasedsignificantly, lifetime ECL is used. If, in a subsequentperiod, credit quality of the instrument improves suchthat there is no longer a significant increase in credit risksince initial recognition, then the entity reverts torecognising impairment loss allowance based on 12-month ECL.
ECL is the difference between all contractual cash flowsthat are due to the Group in accordance with the contractand all the cash flows that the entity expects to receive(i.e., all cash shortfalls), discounted at the original EIR.Lifetime ECL are the expected credit losses resulting fromall possible default events over the expected life of afinancial instrument. The 12-month ECL is a portion ofthe lifetime ECL which results from default events thatare possible within 12 months after the reporting date.
The Group follows ‘simplified approach’ for recognitionof impairment loss allowance on Trade receivables(including lease receivables). The application of simplifiedapproach does not require the Group to track changesin credit risk. Rather, it recognises impairment lossallowance based on lifetime ECL at each reporting date,right from its initial recognition.
ii. Financial liabilities
Subsequent measurement
All financial liabilities are subsequently measured atamortised cost using the EIR method or at FVTPL.

C K
182 Idea Cellular Limited
Consolidated Financial Statements
Notes forming part of the Consolidated Financial Statements
Financial liabilities at amortised cost
After initial recognition, interest-bearing borrowings andother payables are subsequently measured at amortisedcost using the EIR method. Gains and losses arerecognised in Statement of Profit and Loss when theliabilities are derecognised as well as through the EIRamortisation process. Amortised cost is calculated bytaking into account any discount or premium onacquisition and fees or costs that are an integral part ofthe EIR. The EIR amortisation is included as finance costsin the Consolidated Statement of Profit and Loss.
Financial liabilities at FVTPL
Financial liabilities are classified as FVTPL when thefinancial liabilities are held for trading or are designatedas FVTPL on initial recognition. Financial liabilities areclassified as held for trading if they are incurred for thepurpose of repurchasing in the near term. This categoryalso includes derivative financial instruments enteredinto by the Group that are not designated as hedginginstruments in hedge relationships as defined by Ind AS109. Separated embedded derivatives are also classifiedas held for trading unless they are designated as effectivehedging instruments. Gains or losses on liabilities heldfor trading are recognised in the Statement of Profit andLoss.
Derecognition
A financial liability is derecognised when the obligationunder the liability is discharged or cancelled or expires.
iii. Derivative financial instruments:
The Group uses derivative financial instruments, suchas forward currency contracts and interest rate swaps,to manage its foreign currency risks and interest raterisks, respectively. These derivative instruments are notdesignated as cash flow, fair value or net investmenthedges and are entered into for period consistent withcurrency and interest exposures. Such derivativefinancial instruments are initially recognised at fair valueon the date on which a derivative contract is enteredinto and are subsequently re-measured at fair value atthe end of each reporting period. Derivatives are carriedas financial assets when the fair value is positive and asfinancial liabilities when the fair value is negative. Anygains or losses arising from changes in the fair value ofderivatives are taken directly to the Statement of Profitand Loss.
Embedded derivatives
An embedded derivative is a component of a hybrid(combined) instrument that also includes a non-derivative host contract – with the effect that some ofthe cash flows of the combined instrument vary in a waysimilar to a stand-alone derivative instrument. Anembedded derivative causes some or all of the cash flowsthat otherwise would be required by the contract to bemodified according to a specified interest rate, financialinstrument price, commodity price, foreign exchangerate, index of prices or rates, credit rating or credit index,
or other variable, provided in the case of a non-financialvariable that the variable is not specific to a party to thecontract.
If the hybrid contract contains a host that is a financialasset within the scope of Ind AS 109, the Group doesnot separate embedded derivatives. Rather, it applies theclassification requirements contained in Ind AS 109 tothe entire hybrid contract. Derivatives embedded in allother host contracts are accounted for as separatederivatives and recorded at fair value if their economiccharacteristics and risks are not closely related to thoseof the host contracts and the host contracts are not heldfor trading or designated at fair value through profit orloss. These embedded derivatives are measured at fairvalue with changes in fair value recognised in theStatement of Profit and Loss, unless designated aseffective hedging instruments.
iv. Offsetting financial instruments
Financial assets and financial liabilities are offset and thenet amount is reported in the consolidated balance sheetif there is a currently enforceable legal right to offset therecognised amounts and there is an intention to settleon a net basis or to realise the assets and settle theliabilities simultaneously.
r) Fair value measurement
The fair value of an asset or a liability is measured using theassumptions that market participants would use whenpricing the asset or liability, assuming that market participantsact in their economic best interest.
The Group uses valuation techniques that are appropriate inthe circumstances and for which sufficient data is availableto measure fair value, maximising the use of relevantobservable inputs and minimising the use of unobservableinputs.
All assets and liabilities for which fair value is measured ordisclosed in the consolidated financial statements arecategorised within the fair value hierarchy, described asfollows, based on the lowest level input that is significant tothe fair value measurement as a whole:
• Level 1 - Quoted (unadjusted) market prices in activemarkets for identical assets or liabilities
• Level 2 - Valuation techniques for which the lowest levelinput that is significant to the fair value measurement isdirectly or indirectly observable
• Level 3 - Valuation techniques for which the lowest levelinput that is significant to the fair value measurement isunobservable
For assets and liabilities that are recognised in the financialstatements on a recurring basis, the Group determineswhether transfers have occurred between levels in thehierarchy by re-assessing categorisation (based on the lowestlevel input that is significant to the fair value measurementas a whole) (a) on the date of the event or change incircumstances that caused the transfer or (b) at the end ofeach reporting period or (c) at the beginning of each reportingperiod.

C K
Annual Report 2016-17 183
Consolidated Financial Statements
Notes forming part of the Consolidated Financial Statements
s) Dividend distribution to equity holders
Dividends paid / payable along with applicable taxes arerecognised when it is approved by the shareholders. In caseof interim dividend it is recognised when it is approved bythe Board of Directors. A corresponding amount isaccordingly recognised directly in equity.
t) Earnings per share
The earnings considered in ascertaining the Group’s Earningsper Share (EPS) is the net profit after tax. The number ofshares used in computing basic EPS is the weighted averagenumber of shares outstanding during the period. The dilutedEPS is calculated on the same basis as basic EPS, afteradjusting for the effects of potential dilutive equity sharesunless the effect of the potential dilutive equity shares is anti-dilutive.
u) Provisions and Contingent Liabilities
Provisions are recognised when the Group has a presentobligation (legal or constructive) as a result of a past event, itis probable that an outflow of resources embodying economicbenefits will be required to settle the obligation and a reliableestimate can be made of the amount of the obligation. Theexpense relating to a provision is presented in theConsolidated Statement of Profit and Loss.
If the effect of the time value of money is material, provisionsare discounted using a current pre-tax rate that reflects, whenappropriate, the risks specific to the liability. Whendiscounting is used, the increase in the provision due to thepassage of time is recognised as a finance cost.
i. Asset Retirement Obligation (ARO)
ARO is provided for those lease arrangements wherethe Group has a binding obligation to restore the saidlocation / premises at the end of the period in a conditionsimilar to inception of the arrangement. The restorationand decommissioning costs are provided at the presentvalue of expected costs to settle the obligation usingestimated cash flows and are recognised as part of thecost of the particular asset. The cash flows are discountedat a current pre-tax rate that reflects the risks specific tothe decommissioning liability. The unwinding of thediscount is expensed as incurred and recognised in theConsolidated Statement of Profit and Loss as a financecost. The estimated future costs of decommissioning arereviewed annually and adjusted as appropriate. Changesin the estimated future costs or in the discount rateapplied are added to or deducted from the cost of theasset.
ii. Contingent Liabilities
A Contingent Liability is disclosed where there is apossible obligation or a present obligation that may, butprobably will not, require an outflow of resources.Contingent Assets are not recognised. Information oncontingent liabilities is disclosed in the notes toconsolidated financial statements unless the possibilityof an outflow of resources embodying economic benefitsis remote.
v) Business Combinations
Business Combinations are accounted for using Ind AS 103Business Combination. Acquisitions of businesses areaccounted for using the acquisition method unless thetransaction is between entities under common control.Acquisition related costs are recognised in the ConsolidatedStatement of Profit and Loss as incurred. The acquiree’sidentifiable assets, liabilities and contingent liabilities that meetthe conditions for recognition are recognised at theirrespective fair value at the acquisition date, except certainassets and liabilities required to be measured as per applicablestandards.
Purchase consideration in excess of the Group’s interest inthe acquiree’s net fair value of identifiable assets, liabilitiesand contingent liabilities is recognised as goodwill. Excess ofthe Group’s interest in the net fair value of the acquiree’sidentifiable assets, liabilities and contingent liabilities over thepurchase consideration is recognised, after reassessment offair value of net assets acquired, is recognised as Capitalreserve.
Business Combinations arising from transfer of interests inentities that are under common control are accounted usingpooling of interest method wherein, assets and liabilities ofthe combining entities are reflected at their carrying value,no adjustments are made to reflect fair values, or recognizeany new assets or liabilities. The identity of the reserves ispreserved and appears in the financial statements of thetransferee in the same form in which they appeared in thefinancial statements of the transferor.
5. Use of Estimates, assumptions and judgments
The preparation of the consolidated financial statementsrequires management to make judgments, estimates andassumptions that affect the reported amounts of revenues,expenses, assets and liabilities and the accompanyingdisclosures including the disclosure of contingent liabilities.Uncertainty about these assumptions and estimates couldresult in outcomes that require an adjustment to the carryingamount of assets or liabilities in future periods. Differencebetween actual results and estimates are recognised in theperiods in which the results are known / materialise.
The Group has based its assumptions and estimates onparameters available when the consolidated financialstatements were prepared. Existing circumstances andassumptions about future developments, however, maychange due to market changes or circumstances arising thatare beyond the control of the Group. Such changes arereflected in the assumptions when they occur.
i. Share-based payments
The Group initially measures the cost of equity-settledtransactions with employees using Black & Scholes modelto determine the fair value of the liability incurred.Estimating fair value for share-based paymenttransactions requires determination of the mostappropriate valuation model, which is dependent on theterms and conditions of the grant. This estimate alsorequires determination of the most appropriate inputsto the valuation model including the expected life of the
C K
184 Idea Cellular Limited
Consolidated Financial Statements
Notes forming part of the Consolidated Financial Statements
share option, volatility and dividend yield and makingassumptions about them. The assumptions and modelsused for estimating fair value for share-based paymenttransactions are disclosed in note 53.
ii. Taxes
The respective companies provides for tax consideringthe applicable tax regulations and based on reasonableestimates. Management periodically evaluates positionstaken in the tax returns giving due considerations to taxlaws and establishes provisions in the event if requiredas a result of differing interpretation or due toretrospective amendments, if any.
The recognition of deferred tax assets is based onavailability of sufficient taxable profits in the respectivecompanies against which such assets can be utilized.MAT is recognised as an asset only when and to theextent there is convincing evidence that the respectivecompany will pay normal income tax and will be able toutilize such credit during the specified period. In the yearin which the MAT credit becomes eligible to berecognised as an asset, the said asset is created by wayof a credit to the Consolidated Statement of Profit andloss and is included in Deferred Tax Assets. Therespective companies review the same at each balancesheet date and if required, writes down the carryingamount of MAT credit entitlement to the extent there isno longer convincing evidence to the effect that thecompany will be able to absorb such credit during thespecified period.
iii. Defined benefit plans (gratuity benefits)
The Group’s obligation on account of gratuity andcompensated absences is determined based on actuarialvaluations. An actuarial valuation involves makingvarious assumptions that may differ from actualdevelopments in the future. These include thedetermination of the discount rate, future salary increasesand mortality rates. Due to the complexities involved inthe valuation and its long-term nature, these liabilitiesare highly sensitive to changes in these assumptions. Allassumptions are reviewed at each reporting date.
The parameter subject to frequent changes is the discountrate. In determining the appropriate discount rate, themanagement considers the interest rates of governmentbonds in currencies consistent with the currencies of thepost-employment benefit obligation.
The mortality rate is based on publicly available mortalitytables in India. Those mortality tables tend to change onlyat interval in response to demographic changes. Futuresalary increases and gratuity increases are based onexpected future inflation rates.
Further details about gratuity obligations are given innote 54 (A).
iv. Allowance for Trade receivables
The Group follows a ‘simplified approach’ (i.e. based onlifetime ECL) for recognition of impairment lossallowance on Trade receivables (including leasereceivables). For the purpose of measuring lifetime ECLallowance for trade receivables, the Group estimatesirrecoverable amounts based on the ageing of thereceivable balances and historical experience. Further, alarge number of minor receivables are grouped intohomogeneous groups and assessed for impairmentcollectively. Individual trade receivables are written offwhen management deems them not to be collectible.
v. Useful life of Property, Plant and Equipment
The residual values, useful lives and methods ofdepreciation of property, plant and equipment arereviewed at each financial year end and adjustedprospectively, if appropriate.
vi. Impairment of Non-financial assets
Non-financial assets are reviewed for impairment,whenever events or changes in circumstances indicatethat the carrying amount of such assets may not berecoverable. If any such indication exists, the recoverableamount of the asset is estimated in order to determinethe extent of the impairment loss (if any).
vii. Provision for decommissioning
In measuring the provision for ARO, the Group usestechnical estimates to determine the expected cost todismantle and remove the infrastructure equipment fromthe site and the expected timing of these costs. Discountrates are determined based on the risk adjusted bankrate of a similar period as the liability.
viii.Operating lease commitments – Group as lessee
The Group has entered into lease agreements forproperties and cell sites, where it has, on the basis ofevaluation of the terms and conditions of thearrangement determined that the significant risks andrewards related to the assets and properties are retainedwith the lessors. Accordingly, such lease agreements areaccounted for as operating leases. Further details aboutoperating lease are given in note 46.
ix. Provisions and Contingent Liabilities
Provisions and contingent liabilities are reviewed at eachbalance sheet date and adjusted to reflect the currentbest estimates.
6. First Time Adoption of Ind AS
These are the group’s first consolidated financial statementsprepared in accordance with Ind AS. The group had preparedits consolidated financial statements in accordance with theAccounting Standards (AS) notified under section 133 of the
C K
Annual Report 2016-17 185
Consolidated Financial Statements
Notes forming part of the Consolidated Financial Statements
Companies Act, 2013 (Previous GAAP) for and including theyear ended March 31, 2016. The Group has prepared its firstInd AS (Indian Accounting Standards) compliantconsolidated financial statements for the year ended March31, 2017 with restated comparative figures for the year endedMarch 31, 2016 in compliance with Ind AS. Accordingly, theOpening Balance Sheet, in line with Ind AS transitionalprovisions, has been prepared as at April 1, 2015, the date ofgroup’s transition to Ind AS. The principal adjustments madeby the Group in restating its Previous GAAP consolidatedfinancial statements as at and for the Financial year endedMarch 31, 2016 and the balance sheet as at April 1, 2015 areas mentioned below:
A. Exemptions applied
Ind AS 101 on First Time Adoption of Ind AS allows first-time adopters certain voluntary exemptions from theretrospective application of certain requirements under IndAS. The Group has applied the following exemptions:
I. Ind AS 103 on Business Combinations has not beenapplied to acquisitions of businesses that occurred beforeApril 1, 2015. Use of this exemption means that assetsand liabilities acquired under a business combination andeligible for recognition under Ind AS will be the PreviousGAAP carrying values on the acquisition date. Ind AS101 requires recognition of all assets acquired and liabilitiesassumed in a past business combination except,
(i) Certain financial assets and liabilities that werederecognised and that fall under the de recognitionexception, and
(ii) Assets and liabilities that were not recognised in theacquirer’s balance sheet under its Previous GAAP andthat would not qualify for recognition under Ind ASin the individual balance sheet of the acquiree.
Assets and liabilities that do not qualify for recognition underInd AS are excluded from the Ind AS opening balance sheet.The Group has not recognised or excluded any previouslyrecognised amounts as a result of Ind AS recognitionrequirements.
II. There is no change in the functional currency of the groupand accordingly, it has elected to continue with thecarrying values for all of its property, plant andequipment and intangible assets as recognised in itsPrevious GAAP consolidated financial statements as thedeemed cost at the transition date subject to theadjustments for decommissioning liabilities. As per theexemption under Ind AS 101, decommissioning liabilitywas measured in accordance with Ind AS 37 at the dateof transition to Ind AS. To the extent the liability waswithin the scope of Appendix-A of Ind AS 16, estimatedliability that would have been included in the cost ofrelated asset when the liability first arose by discountingthe liability to that date using best estimate of thehistorical risk adjusted discount rate over the interveningperiod. Accumulated depreciation was calculated on thatamount as at the date of transition to Ind AS on the basis
of the current estimate of the useful life of the asset, usingthe depreciation policy adopted by the Group inaccordance with Ind AS.
III. Ind AS 102 on Share-based Payment has not been appliedto equity instruments in share-based paymenttransactions that vested before the date of transition toInd AS.
IV. Appendix C to Ind AS 17 requires the Group to assesswhether a contract or arrangement contains a lease. Inaccordance with Ind AS 17, this assessment should becarried out at the inception of the contract orarrangement. However, the Group has used Ind AS 101exemption and assessed all relevant arrangements forclassification of leases based on facts and circumstancesexisting at the date of transition to Ind AS.
V. The Group has decided to continue with its policy ofcapitalising exchange differences arising from translationof long-term foreign currency monetary liabilitiesoutstanding in the consolidated financial statements ason March 31, 2016 as per AS 11 of the Previous GAAP.
VI. In accordance with the exemption given in Ind AS 101,the Group has recorded investment in subsidiaries atdeemed cost i.e. Previous GAAP carrying amount.
VII. Ind AS 101 provides an exemption for changing fromproportionate consolidation to the equity method. As perthe exemption, when changing from proportionateconsolidation to the equity method, an entity shouldrecognize its investment in the joint venture at transitiondate to Ind AS. That initial investment should bemeasured as the aggregate of the carrying amounts ofthe assets and liabilities that the entity had previouslyproportionately consolidated, including any goodwillarising from acquisition duly adjusted for Ind AStransition effects. The balance of the investment in jointventure at the date of transition to Ind AS, determinedin accordance with the above is regarded as the deemedcost of the investment at initial recognition.
B. Exceptions applied
Ind AS 101 specifies mandatory exceptions from retrospectiveapplication of some aspects of other Ind ASs for first-timeadopters. Following exception is applicable to the Group:
I. Use of Estimates
The estimates at April 1, 2015 and March 31, 2016 areconsistent with those made for the same dates inaccordance with Previous GAAP (after adjustments toreflect any differences in accounting policies) apart fromthe following items where application of Previous GAAPdid not require estimation:
• Impairment of financial assets based on ExpectedCredit Loss (ECL) model
The estimates used by the Group to present theseamounts in accordance with Ind AS reflect conditions atApril 1, 2015, the date of transition to Ind AS and as ofMarch 31, 2016.
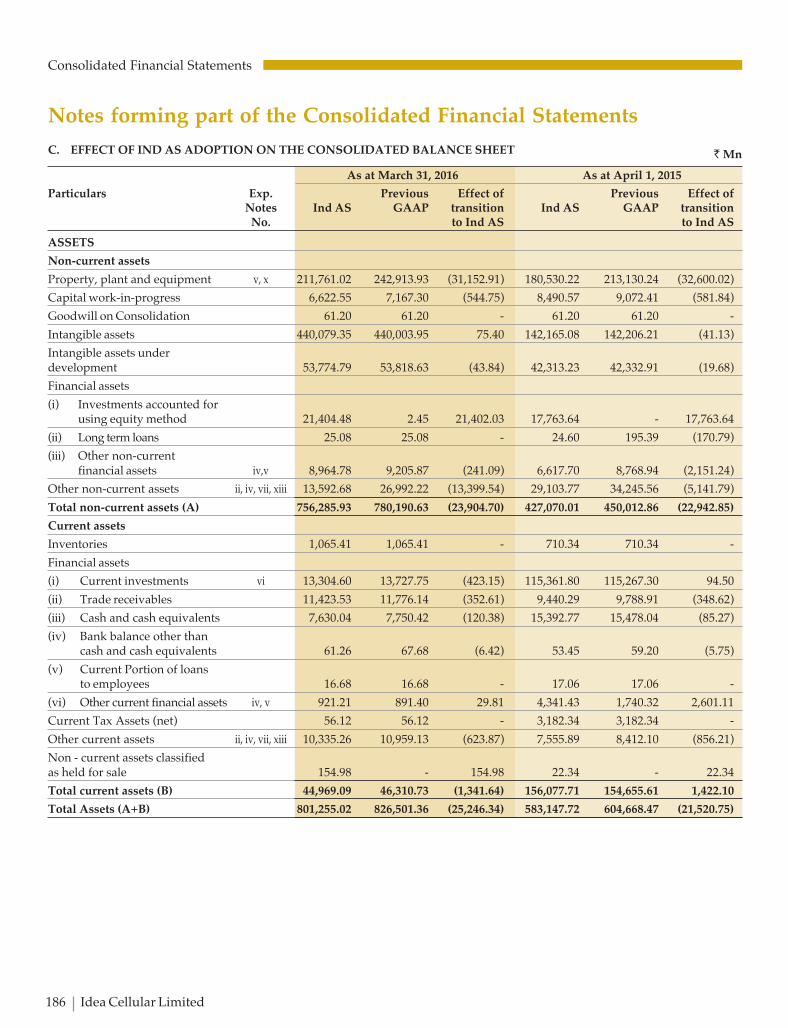
C K
186 Idea Cellular Limited
Consolidated Financial Statements
Notes forming part of the Consolidated Financial Statements
C. EFFECT OF IND AS ADOPTION ON THE CONSOLIDATED BALANCE SHEET
As at March 31, 2016 As at April 1, 2015
Particulars Exp. Previous Effect of Previous Effect ofNotes Ind AS GAAP transition Ind AS GAAP transition
No. to Ind AS to Ind AS
ASSETS
Non-current assets
Property, plant and equipment v, x 211,761.02 242,913.93 (31,152.91) 180,530.22 213,130.24 (32,600.02)
Capital work-in-progress 6,622.55 7,167.30 (544.75) 8,490.57 9,072.41 (581.84)
Goodwill on Consolidation 61.20 61.20 - 61.20 61.20 -
Intangible assets 440,079.35 440,003.95 75.40 142,165.08 142,206.21 (41.13)
Intangible assets underdevelopment 53,774.79 53,818.63 (43.84) 42,313.23 42,332.91 (19.68)
Financial assets
(i) Investments accounted forusing equity method 21,404.48 2.45 21,402.03 17,763.64 - 17,763.64
(ii) Long term loans 25.08 25.08 - 24.60 195.39 (170.79)
(iii) Other non-currentfinancial assets iv,v 8,964.78 9,205.87 (241.09) 6,617.70 8,768.94 (2,151.24)
Other non-current assets ii, iv, vii, xiii 13,592.68 26,992.22 (13,399.54) 29,103.77 34,245.56 (5,141.79)
Total non-current assets (A) 756,285.93 780,190.63 (23,904.70) 427,070.01 450,012.86 (22,942.85)
Current assets
Inventories 1,065.41 1,065.41 - 710.34 710.34 -
Financial assets
(i) Current investments vi 13,304.60 13,727.75 (423.15) 115,361.80 115,267.30 94.50
(ii) Trade receivables 11,423.53 11,776.14 (352.61) 9,440.29 9,788.91 (348.62)
(iii) Cash and cash equivalents 7,630.04 7,750.42 (120.38) 15,392.77 15,478.04 (85.27)
(iv) Bank balance other thancash and cash equivalents 61.26 67.68 (6.42) 53.45 59.20 (5.75)
(v) Current Portion of loansto employees 16.68 16.68 - 17.06 17.06 -
(vi) Other current financial assets iv, v 921.21 891.40 29.81 4,341.43 1,740.32 2,601.11
Current Tax Assets (net) 56.12 56.12 - 3,182.34 3,182.34 -
Other current assets ii, iv, vii, xiii 10,335.26 10,959.13 (623.87) 7,555.89 8,412.10 (856.21)
Non - current assets classifiedas held for sale 154.98 - 154.98 22.34 - 22.34
Total current assets (B) 44,969.09 46,310.73 (1,341.64) 156,077.71 154,655.61 1,422.10
Total Assets (A+B) 801,255.02 826,501.36 (25,246.34) 583,147.72 604,668.47 (21,520.75)
` Mn

C K
Annual Report 2016-17 187
Consolidated Financial Statements
Notes forming part of the Consolidated Financial Statements
As at March 31, 2016 As at April 1, 2015
Particulars Exp. Previous Effect of Previous Effect ofNotes Ind AS GAAP transition Ind AS GAAP transition
No. to Ind AS to Ind AS
EQUITY AND LIABILITIES
Equity
Equity share capital 36,005.09 36,005.09 - 35,978.44 35,978.44 -
Other equity 199,499.78 221,670.32 (22,170.54) 174,764.13 194,313.95 (19,549.82)
Total equity (A) 235,504.87 257,675.41 (22,170.54) 210,742.57 230,292.39 (19,549.82)
Non-current liabilities:
Financial liabilities
(i) Long Term borrowings v, vii 359,040.42 365,684.91 (6,644.49) 157,990.82 166,031.82 (8,041.00)
(ii) Other non-currentfinancial liabilities v, xiv 23,721.63 25,373.83 (1,652.20) 2,345.85 3,481.83 (1,135.98)
Long term provisions x 3,453.90 6,475.39 (3,021.49) 2,843.47 5,735.14 (2,891.67)
Deferred tax liabilities (net) xii, xiii 19,538.60 30,713.68 (11,175.08) 13,275.78 19,015.32 (5,739.54)
Other non-current liabilities i 4,108.30 7,366.42 (3,258.12) 3,661.28 6,151.64 (2,490.36)
Total non-current liabilities (B) 409,862.85 435,614.23 (25,751.38) 180,117.20 200,415.75 (20,298.55)
Current liabilities:
Financial liabilities
(i) Short term borrowings 16,455.78 16,455.78 - 1,513.94 2,073.03 (559.09)
(ii) Trade payable v 32,471.30 33,108.97 (637.67) 29,617.48 30,710.77 (1,093.29)
(iii) Other current financialliabilities iii,v,vii 82,539.69 55,393.38 27,146.31 139,401.84 116,122.00 23,279.84
Other current liabilities i 23,494.15 23,978.45 (484.30) 21,358.81 22,033.20 (674.39)
Short term provisions x, xi 926.38 4,275.14 (3,348.76) 395.88 3,021.33 (2,625.45)
Total current liabilities (C) 155,887.30 133,211.72 22,675.58 192,287.95 173,960.33 18,327.62
Total Equity and Liabilities(A+B+C) 801,255.02 826,501.36 (25,246.34) 583,147.72 604,668.47 (21,520.75)
` Mn
D. RECONCILIATION OF TOTAL EQUITY AS AT MARCH 31, 2016 AND APRIL 1, 2015 ` Mn
Particulars Exp. As at As atNotes No. March 31, 2016 April 1, 2015
Total Equity (shareholders’ funds) under Previous GAAP 257,675.41 230,292.39
Effects of inflation linked escalation on rental income / expense notrequiring equalisation over the lease term, hence reversed i,ii 5,810.69 4,986.84
Effects of measuring financial instruments under Ind AS iii,iv,v,vi (25,888.25) (22,932.45)
Dividends (including dividend distribution tax) not recognised asliability until declared under Ind AS xi 2,600.09 2,598.17
Others v,vii,x (90.87) 408.32
Deferred Tax impact on transitional adjustments due to Ind AS xii (2,984.43) (2,796.67)
Effects on Group’s share of Indus Equity on transition to Ind AS xv (1,554.56) (1,729.98)
Deferred tax on undistributed earnings of Joint Venture (net of reversalof dividend distribution tax on payment of dividend) xii (63.21) (84.05)
Total Equity under Ind AS 235,504.87 210,742.57

C K
188 Idea Cellular Limited
Consolidated Financial Statements
Notes forming part of the Consolidated Financial Statements
` MnE. EFFECT OF IND AS ADOPTION ON THE CONSOLIDATED STATEMENT OF PROFIT AND LOSS FOR THE YEAR ENDED MARCH 31, 2016
Particulars Exp. Ind AS Previous Difference Notes No. GAAP
INCOME
Service revenue ii 358,833.89 359,023.14 (189.25)
Sale of Trading Goods 329.74 329.74 -
Other Operating Income 330.43 456.59 (126.16)
Revenue from operations 359,494.06 359,809.47 (315.41)
Other income vi 2,131.39 2,271.17 (139.78)
Total income 361,625.45 362,080.64 (455.19)
OPERATING EXPENDITURE
Cost of Trading Goods 288.98 288.98 -
Employee benefit expenses viii,ix 16,118.51 16,599.01 (480.50)
Network expenses and IT outsourcing cost i 92,777.63 81,706.67 11,070.96
License fees and spectrum usage charges 41,507.83 41,507.83 -
Roaming and access charges iv 46,653.46 46,436.26 217.20
Subscriber acquisition and servicing expenditure 28,668.04 28,668.02 0.02
Advertisement and Business Promotion Expenditure 4,864.45 4,864.45 -
Administration and other expenses v 8,939.84 9,438.66 (498.82)
239,818.74 229,509.88 10,308.86
PROFIT BEFORE FINANCE CHARGES,DEPRECIATION, AMORTISATION AND TAXES 121,806.71 132,570.76 (10,764.05)
Fair Value (gain) / loss on CCPS iii 3,173.78 - 3,173.78
Finance costs v,vii,x 17,787.72 18,816.42 (1,028.70)
Depreciation v,x 48,045.13 51,959.36 (3,914.23)
Amortisation 14,515.61 14,548.42 (32.81)
PROFIT/(LOSS) BEFORE TAX AND SHARE OFJOINT VENTURE AND ASSOCIATE 38,284.47 47,246.56 (8,962.09)
Add: Share in Profits of Joint Venture 4,216.81 - 4,216.81
PROFIT/(LOSS) BEFORE TAX 42,501.28 47,246.56 (4,745.28)
Tax expense:
- Current tax 8,921.67 11,220.07 (2,298.40)
- Deferred tax xii,xiii 6,298.28 11,698.43 (5,400.15)
- MAT credit entitlement / utilised xiii - (6,471.23) 6,471.23
PROFIT/(LOSS) AFTER TAX 27,281.33 30,799.29 (3,517.96)
OTHER COMPREHENSIVE INCOME / (LOSS)
Items not to be reclassified to profit or loss insubsequent periods:
Re-measurement gains/ (losses) on defined benefit plans ix (200.06) - (200.06)
Income tax effect xii 69.21 - 69.21
Group’s share in other comprehensive income/(loss)of joint venture and associate (8.40) - (8.40)
Other comprehensive income / (loss)for the year, net of tax (139.25) - (139.25)
Total comprehensive income / (loss) for the year 27,142.08 30,799.29 (3,657.21)

C K
Annual Report 2016-17 189
Consolidated Financial Statements
Explanatory Notes
i) Lease Equalisation Reserve (LER)
Under Previous GAAP, the lease payments under operatingleases were recognised as expense on a straight line basisover the lease term. As per Ind AS 17, lease payments arenot recognised on a straight line basis if payments to thelessor are structured to increase in line with expected generalinflation to compensate for the lessor’s expected inflationarycost increases. Hence, LER pertaining to operating leaseagreements has been reversed and credited to Equity as ontransition date. This has resulted to an increase in equity onthe transition date by ` 5,076.00 Mn. and on March 31, 2016by ` 6,089.10 Mn. The profit before tax for the year endedMarch 31, 2016 has increased by ` 1,013.10 Mn.
Notes forming part of the Consolidated Financial Statements
F. RECONCILIATION OF TOTAL COMPREHENSIVE INCOME FOR THE YEAR ENDED MARCH 31, 2016 ` Mn
Particulars Exp. For the year endedNotes No. March 31, 2016
Total Comprehensive Income (TCI) under Previous GAAP 30,799.29
Effects of inflation linked escalation on rental income / expense not requiringequalisation over the lease term, hence reversed i,ii 823.85
Effects of measuring financial instruments under Ind AS iii,iv,v,vi (2,955.80)
Effects of measuring ESOP charge at Fair value viii (297.25)
Others v,vii,ix,x,xv (115.14)
Deferred Tax impact on transitional adjustments due to Ind AS xii (256.97)
Deferred tax on undistributed earnings of Joint Venture xv (716.65)
Profit after tax under Ind AS 27,281.33
Other comprehensive income - Re-measurement gains/(losses) on defined benefit plans (net of tax) ix,xii (139.25)
Total Comprehensive Income under Ind AS 27,142.08
G. EFFECT OF IND AS ADOPTION ON THE STATEMENT OF CONSOLIDATED CASH FLOWS FOR THE YEAR ENDED MARCH 31, 2016` Mn
Particulars Ind AS Previous DifferenceGAAP
Net cash flows from Operating activities 109,486.09 118,147.30 (8,661.21)
Net cash flows from Investing activities (23,889.91) (129,928.36) 106,038.45
Net cash flows from Financing activities (93,300.75) (97,486.06) 4,185.31
Net increase (decrease) in cash and cash equivalents (7,704.57) (109,267.12) 101,562.55
Cash and cash equivalents at the beginning of period 13,878.83 130,745.29 (116,866.46)
Cash and cash equivalents at the end of period 6,174.26 21,478.17 (15,303.91)
H. RECONCILIATION OF CASH AND CASH EQUIVALENTS FOR THE PURPOSE OF STATEMENT OF CONSOLIDATED CASH FLOWS` Mn
Particulars As at As atMarch 31, 2016 April 1, 2015
Cash and cash equivalents under Previous GAAP 21,478.17 130,745.29
Bank overdrafts which form an integral part of cash management (1,455.78) (1,513.94)
Investments in units of liquid mutual funds (13,727.75) (115,267.30)
Share of Indus in cash and cash equivalents (120.38) (85.22)
Cash and cash equivalents under Ind AS 6,174.26 13,878.83
ii) Revenue Equalisation Reserve (RER)
Under Previous GAAP, the lease payments receivable underoperating leases where the Group was a lessor wererecognised as income on a straight line basis over the leaseterm. As per Ind AS 17, lease payments are not recognisedon a straight line basis if payments to the Group arestructured to increase in line with expected general inflationto compensate for the Group’s expected inflationary costincreases. Hence, RER pertaining to such agreements hasbeen reversed and debited to Equity as on transition date.This has resulted to a decrease in equity on the transitiondate by ` 89.16 Mn. and on March 31, 2016 by ` 278.41 Mn.The profit before tax for the year ended March 31, 2016 hasdecreased by ` 189.25 Mn.

C K
190 Idea Cellular Limited
Consolidated Financial Statements
Notes forming part of the Consolidated Financial Statements
iii) CCPS
Under previous GAAP, preference shares were recorded asShare Capital. Such shares issued by a subsidiary weredisclosed as a separate line item below the shareholder’s fundand above liabilities. Under Ind AS, such financial instrumentsneed to be assessed as to whether the same is a liability orequity in accordance with the provisions of Ind AS 109.Accordingly, CCPS issued by ABTL, a 100% subsidiary ofIdea, has been classified as a liability to be recognised atFVTPL. This has resulted to a decrease in equity on thetransition date by ` 25,619.18 Mn. and on March 31, 2016 by` 28,792.96 Mn. The profit before tax for the year endedMarch 31, 2016 has decreased by ` 3,173.78 Mn.
iv) Financial Assets - Deposits
Under Previous GAAP, the Group accounted for deposits attransaction value. Under Ind AS, the deposits with inherentsignificant financing element are initially recorded at fair valuewith the difference between transaction value and fair valuebeing treated as prepaid expenses. The deposits aresubsequently measured at amortised cost and deferred rentis amortised over contract period on a straight line basis. Thishas resulted to an increase in equity on the transition date by` 217.20 Mn. and on March 31, 2016 by ̀ Nil. The profit beforetax for the year ended March 31, 2016 has decreased by` 217.20 Mn.
v) Derivative instruments
The fair value of foreign exchange forward contracts andinterest rate swap contracts is recognised under Ind AS,which was not recognised under Previous GAAP.Consequently, the unamortised forward premium recognisedunder Previous GAAP has been derecognised. Thecorresponding adjustment has been credited to Equity as onthe transition date. This has resulted to an increase in equityon the transition date by ` 1,740.62 Mn. and on March 31,2016 by ̀ 2,261.46 Mn. The profit before tax for the year endedMarch 31, 2016 has increased by ` 520.84 Mn.
Hedged foreign currency borrowings have been restated atthe spot rate on the transition date. This has resulted to anincrease in equity on the transition date by ̀ 634.41 Mn. andon March 31, 2016 by ̀ 634.41 Mn. Further, as the Group hasdecided to continue capitalisation of exchange differencesarising from translation of long term foreign currencymonetary liabilities outstanding as on March 31, 2016, anadditional amount of ` 1,742.60 Mn. has been capitalised inFY 2015-16.The additional depreciation charged due toadditional capitalisation has led to a decrease in profit beforetax by ` 279.30 Mn. for the year ended March 31, 2016.
vi) Investments in Mutual Funds
Under Previous GAAP, the Group accounted for investmentsin mutual funds as financial instruments measured at lowerof cost or fair value. Under Ind AS, the Group has designatedsuch investments at fair value through profit and loss whichare to be measured at fair value at each reporting date. Thedifference between the fair value of these instruments andPrevious GAAP carrying amount has been adjusted in equityas on the transition date. This has resulted to an increase inequity on the transition date by ` 94.50 Mn. and on March
31, 2016 by ̀ 8.84 Mn. The profit before tax for the year endedMarch 31, 2016 has decreased by ` 85.66 Mn.
vii) Borrowings
Under Previous GAAP, transaction costs incurred inconnection with borrowings were disclosed as prepaidexpenses and charged to profit and loss on a systematic basis.Under Ind AS, borrowings are recorded initially at fair valueless transaction costs and are subsequently measured atamortised cost as per the Effective Interest Rate (EIR) method.This has resulted to an increase in equity on the transitiondate by ` 411.60 Mn. and on March 31, 2016 by ` 206.03 Mn.The profit before tax for the year ended March 31, 2016 hasdecreased by ` 205.57 Mn.
viii) Share-based payments
Under Previous GAAP, the cost of equity-settled employeeshare based payments was recognised based on intrinsicvalue of the options as at the grant date over the appropriatevesting period. Ind AS requires expense on such share basedpayments to be recognised based on fair value as at grantdate using an appropriate pricing model over the appropriatevesting period. The change does not affect total equity, butthere is a decrease in retained earnings on the transition dateby ` 343.53 Mn. and on March 31, 2016 by ` 640.78 Mn. Theprofit before tax for the year ended March 31, 2016 hasdecreased by ` 297.25 Mn.
ix) Employee Benefits
In Previous GAAP, actuarial gains and losses were recognisedin the Statement of Profit and Loss. Under Ind AS, theactuarial gains and losses form part of re-measurement ofnet defined benefit liability/asset which is recognised in othercomprehensive income in the respective periods. The changedoes not affect total equity but there is an increase inprofit before tax for the year ended March 31, 2016 by` 200.06 Mn.
x) Asset Retirement Obligation (ARO)
Under Previous GAAP, provision for ARO was measured atthe best estimate of the expenditure required to settle theobligation at the Balance Sheet date without considering theeffect of discounting. Under Ind AS, provision for ARO ismeasured at present value of the expenditure expected to beincurred to settle the obligation. The difference between thepresent value of ARO provision and Previous GAAP carryingamount of ARO, net of depreciation effect has been adjustedto retained earnings as on the transition date. This hasresulted to decrease in equity on the transition date by` 3.28 Mn. and on March 31, 2016 by ` 17.60 Mn. The profitbefore tax for the year ended March 31, 2016 has decreasedby ` 14.32 Mn.
xi) Dividend including dividend distribution tax
Under Previous GAAP, dividend payable including dividenddistribution taxes was recorded as a liability in the period towhich it relates. Under Ind AS, dividend to holders of equityinstruments is recognised as a liability in the period in whichthe obligation to pay is established. Hence, proposed dividendrecognised under Previous GAAP as at the transition date isreversed and credited to Equity. This has resulted to an

C K
Annual Report 2016-17 191
Consolidated Financial Statements
Notes forming part of the Consolidated Financial Statements
increase in equity on the transition date by ` 2,598.17 Mn.and on March 31, 2016 by ` 2,600.09 Mn.
xii) Deferred tax
Various transitional adjustments led to temporary differencesas on the transition date. The net impact on deferred taxliabilities on the transitional adjustments is debited to Equity.This has resulted to a decrease in equity on the transitiondate by ` 2,796.67 Mn. and on March 31, 2016 by ` 2,984.43Mn. The profit after tax for the year ended March 31, 2016has decreased by ` 187.76 Mn.
In addition, Ind AS requires recognition of deferred taxliabilities for all taxable temporary differences (includingundistributed profits) associated with investments withsubsidiaries, joint ventures and associates except in caseswhere entity is able to control the timing of reversal of suchtemporary differences and the same is not probable in theforeseeable future. Accordingly, deferred tax liabilities havebeen created on the undistributed profits of the joint venture.This has resulted in a decrease in equity on the transitiondate by ` 84.05 Mn. and on March 31, 2016 by ` 63.21 Mn.
xiii)MAT Credit
Under Previous GAAP, MAT credit was disclosed under non-current/current assets. In accordance with Ind AS 12,deferred tax assets shall include any carry forward unusedtax credits. Hence, MAT credit entitlement has been includedin deferred tax assets. This has resulted to a decrease inCurrent assets on the transition date by ` 6.90 Mn,March 31, 2016 by ` Nil, Non-current assets ` 5,841.49 Mnand on March 31, 2016 by ` 12,285.83 Mn. and deferred taxliabilities on the transition date by ` 5,848.39 Mn. and onMarch 31, 2016 by ` 12,285.83 Mn. The MAT creditentitlement of ` 6,471.23 Mn. for the year ended March 31,2016 has been presented with deferred tax.
xiv) Deposits from Customers
Under Previous GAAP, there was no specific AccountingStandard on Presentation of Financial Statements. TheInstitute of Chartered Accountants of India had issued FAQon Schedule VI of the Companies Act, 1956 which prescribesgeneral instructions for preparation of financial statements.In accordance with the FAQ, certain Deposits fromCustomers were classified as non-current based on thecommercial practice in the industry. Ind AS 1 on Presentationof Financial Statements does not have any such option andtherefore, the deposits from customers have been classifiedas current since these deposits are repayable on demand.This has resulted to a regrouping change from non-currentfinancial liabilities to current financial liabilities as on thetransition date by ` 2,013.53 Mn. and on March 31, 2016 by` 2,126.02 Mn.
xv) Joint venture
Under Previous GAAP, Indus Towers Limited, a joint venturewas accounted for using the proportionate consolidationmethod. Under Ind AS, investment in joint ventures isaccounted using the equity method.
For the purposes of applying the equity method, theinvestment in Indus Towers Limited of ` 17,763.64 Mn. atthe date of transition has been measured as the aggregate ofthe carrying amounts of the assets and liabilities that theGroup had previously proportionately consolidated dulyadjusted for Ind AS transition effects. An impairmentassessment has been performed as at April 1, 2015 and noimpairment provision is considered necessary.
a) The Group’s proportionate share (16%) of the assets andliabilities of Indus Towers Limited under Previous GAAPare as follows:
` Mn
Particulars As at As at March 31, 2016 April 1, 2015
Non-current assets
Property, plant and equipment 31,617.28 31,808.64
Other non-current assets 6,313.50 6,796.29
Total non-current assets 37,930.78 38,604.93
Current Assets
Current Investment 432.00 -
Other current assets 2,926.89 3,380.65
Total current assets 3,358.89 3,380.65
Total assets 41,289.67 41,985.58
Non-current liabilities
Borrowings 4,101.79 5,966.96
Other Non-Current Liabilities 5,455.12 5,163.43
Deferred Tax Liability 2,674.45 2,771.89
Total non-current liabilities 12,231.36 13,902.28
Current liabilities
Borrowings - 559.09
Other Current Liabilities 10,461.98 8,030.62
Total current liabilities 10,461.98 8,589.71
Total liabilities 22,693.34 22,491.99
b) The following items of income and expenditure werepreviously proportionately consolidated under PreviousGAAP:
` Mn
Particulars For the year endedMarch 31, 2016
Revenue from Operations 25,737.42
Other Income 54.12
Expenses
Operating Costs 14,535.78
Finance Costs 835.39
Depreciation andamortisation expense 4,186.57
Provision for Taxation 2,200.96
Profit after tax 4,032.84

C K
192 Idea Cellular Limited
Consolidated Financial Statements
Notes forming part of the Consolidated Financial Statements
c) Impact on account of equity accounting of the joint ventureunder Ind AS: ` Mn
Particulars For the year endedMarch 31, 2016
Share of profits of joint venturerecognised as per equity method 4,216.81
Share of other comprehensive income/(loss) (re-measurements) of jointventure recognised as per equity method (8.40)
d) Summarised Statement of Cash Flows of Indus TowersLimited as per Previous GAAP for the year ended March31, 2016 not considered under Ind AS in the Statement ofConsolidated Cash Flows:
` Mn
Particulars For the year endedMarch 31, 2016
Cash flow from operating activities 8,941.04
Cash flow from investing activities (4,419.00)
Cash flow from financing activities (4,486.88)
7. Standards issued or modified but not yet effective up tothe date of issuance of the Group’s consolidated financialstatements
The amendments to standards that are issued, but not yeteffective up to the date of issuance of Group’s consolidatedfinancial statements are discussed below. The Group intendsto adopt these standards, if applicable, when they becameeffective.
a) Amendments to Ind AS 7 Statement of Cash Flows
(Effective from accounting period starting on or after April 1, 2017)
i. An entity shall provide certain additional disclosures forchanges in liabilities arising from financing activities onaccount of non-cash transactions to enable users ofconsolidated financial statements evaluate changes inliabilities arising from financing activities.
ii. To the extent necessary to satisfy the requirement, anentity shall disclose the following changes in liabilitiesarising from financing activities:
• Changes from financing cash flows;
• Changes arising from obtaining or losing controlof subsidiaries or other businesses;
• The effect of changes in foreign exchange rates;
• Changes in fair values; and
• Other changes.
b) Amendments to Ind AS 102 Share-based payments
Ind AS 102 has been amended to include clarity on thefollowing areas:
• Measurement of cash-settled share-based payments
• Classification of share-based payments settled net of taxwithholdings; and
• Accounting for a modification of a share-based paymentfrom cash-settled to equity settled
The above changes do not impact the Group as the Share basedpayments made by the Group are neither cash-settledshare-based payment nor do they have any “net settlementfeature”.

C K
Annual Report 2016-17 193
Consolidated Financial Statements
Notes forming part of the Consolidated Financial Statements
` Mn
Particulars Freehold Buildings Plant and Furniture Office Vehicles Totalland machinery and equip-
fixtures ments
8 PROPERTY, PLANT AND EQUIPMENT
Cost
As at April 1, 2015 * 119.03 994.44 178,307.84 290.49 258.93 559.49 180,530.22
Additions - 23.78 78,674.62 175.18 250.21 342.44 79,466.23
Disposals/Adjustments (including assets held for sale) - (138.55) (252.63) (1.88) (0.46) (48.89) (442.41)
As at March 31, 2016 119.03 879.67 256,729.83 463.79 508.68 853.04 259,554.04
Additions - 21.90 65,157.67 523.23 307.79 610.23 66,620.82
Disposals/Adjustments (including assets held for sale) - 157.79 (319.50) (8.42) (2.10) (131.15) (303.38)
As at March 31, 2017 119.03 1,059.36 321,568.00 978.60 814.37 1,332.12 325,871.48
Accumulated Depreciation
As at April 1, 2015 - - - - - - -
Depreciation charge for the year - 100.65 47,396.55 90.49 153.44 304.00 48,045.13
Disposals/Adjustments (including assets held for sale) - 0.13 (235.87) (0.65) (0.22) (15.50) (252.11)
As at March 31, 2016 - 100.78 47,160.68 89.84 153.22 288.50 47,793.02
Depreciation charge for the year - 78.43 49,204.02 111.69 187.22 332.40 49,913.76
Disposals/Adjustments (including assets held for sale) - 20.59 (197.62) (7.15) (1.37) (92.71) (278.26)
As at March 31, 2017 - 199.80 96,167.08 194.38 339.07 528.19 97,428.52
Net Book Value
As at March 31, 2017 119.03 859.56 225,400.92 784.22 475.30 803.93 228,442.96
As at March 31, 2016 119.03 778.89 209,569.15 373.95 355.46 564.54 211,761.02
As at April 1, 2015 119.03 994.44 178,307.84 290.49 258.93 559.49 180,530.22
*Information regarding gross block and accumulated depreciation under previous GAAP as on March 31, 2015 are as under :
Gross Block as on April 1, 2015 119.03 1,773.32 364,069.12 1,681.31 3,696.15 1,494.15 372,833.08
Accumulated Depreciation as on April 1, 2015 - (778.88) (185,761.28) (1,390.82) (3,437.22) (934.66) (192,302.86)
Net Block as on April 1, 2015 119.03 994.44 178,307.84 290.49 258.93 559.49 180,530.22
Footnotes:
1. Plant and machinery includes gross block of assets capitalised under finance lease ` 9,880.58 Mn (March 31, 2016:` 7,443.08 Mn, April 1, 2015: ` 4,408.63 Mn) and corresponding accumulated depreciation being ` 5,918.69 Mn (March 31,2016: ` 3,048.65 Mn, April 1, 2015: ` Nil).
2. Foreign exchange (gain)/loss amounting to ` (661.69) Mn (March 31, 2016: ` 3,515.65 Mn) (decapitalised)/capitalisedduring the year.
3. Depreciation charge for the year includes ` 296.40 Mn (March 31, 2016: ` 572.48 Mn, April 1, 2015: ` 5,466.05 Mn) dueto change in estimated useful life of certain fixed assets.
4. Disposals / Adjustments includes assets reclassified from held for sale to PPE due to termination of agreement/intentionto sell.

C K
194 Idea Cellular Limited
Consolidated Financial Statements
Notes forming part of the Consolidated Financial Statements
` Mn
Particulars Entry / license Computer - Bandwidth Totalfees and Software
spectrum
9 INTANGIBLE ASSETS
Cost
As at April 1, 2015* 134,561.55 585.60 7,017.93 142,165.08
Additions 308,928.83 1,974.03 1,527.03 312,429.89
Retirement of expired licenses (616.93) - - (616.93)
As at March 31, 2016 442,873.45 2,559.63 8,544.96 453,978.04
Additions 122,944.32 1,589.02 2,872.97 127,406.31
Retirement of expired licenses (417.43) - - (417.43)
As at March 31, 2017 565,400.34 4,148.65 11,417.93 580,966.92
Accumulated Amortisation
As at April 1, 2015 - - - -
Amortisation charge for the year 13,143.07 728.11 644.43 14,515.61
Retirement of expired licenses (616.92) - - (616.92)
As at March 31, 2016 12,526.15 728.11 644.43 13,898.69
Amortisation charge for the year 26,446.21 1,111.51 800.56 28,358.28
Retirement of expired licenses (418.30) - - (418.30)
As at March 31, 2017 38,554.06 1,839.62 1,444.99 41,838.67
Net Book Value
As at March 31, 2017 526,846.28 2,309.03 9,972.94 539,128.25
As at March 31, 2016 430,347.30 1,831.52 7,900.53 440,079.35
As at April 1, 2015 134,561.55 585.60 7,017.93 142,165.08
*Information regarding gross block and accumulated amortisation under previous GAAP as on March 31, 2015 are as under :
Gross Block as on April 1, 2015 174,024.15 5,456.60 8,998.99 188,479.74
Accumulated Amortisation as on April 1, 2015 (39,462.60) (4,871.00) (1,981.06) (46,314.66)
Net Block as on April 1, 2015 134,561.55 585.60 7,017.93 142,165.08
Footnotes:
1. Computer - software includes gross block of assets capitalised under finance lease ` 2,932.09 Mn (March 31, 2016:` 1,845.27 Mn, April 1, 2015: ` 357.10 Mn) and corresponding accumulated amortisation being ` 1,289.50 Mn (March 31,2016: ` 507.02 Mn, April 1, 2015: ` Nil).
2. The remaining amortisation period of license/ spectrum fees as at March 31, 2017 ranges between 4 to 20 years based onthe respective telecom service license / spectrum validity period.
3. Intangible assets under development includes interest amounting to ` 2,330.41 Mn (March 31, 2016: ` 3,727.15 Mn, April1, 2015: ` 2,689.88 Mn).

C K
Annual Report 2016-17 195
Consolidated Financial Statements
` Mn
Particulars As at As at As atMarch 31, 2017 March 31, 2016 April 1, 2015
10 INVESTMENTS ACCOUNTED FOR USING
THE EQUITY METHOD (UNQUOTED)
a) Investments in Equity Instruments of Associate
Aditya Birla Idea Payments Bank Limited (ABIPBL) 134.33 2.45 -
13,433,360 (March 31, 2016 : 245,000 and April 1, 2015 : Nil)fully paid equity shares of ` 10 each
Add: Group’s share of Loss / Reserves of ABIBPL (86.14) - -
Total investment in Associates (A) 48.19 2.45 -
b) Investments in Equity Instruments of Joint Venture
Indus Towers Limited 0.13 0.19 0.19
132,868 (March 31, 2016 and April 1, 2015: 190,662)fully paid equity shares of ` 1 each)
Add: Group’s share of Profit / Reserves of Indus Towers Limited 14,736.43 21,401.84 17,763.45
Total investment in Joint Venture (B) 14,736.56 21,402.03 17,763.64
Total (A+B) 14,784.75 21,404.48 17,763.64
11 OTHER NON-CURRENT FINANCIAL ASSETS
a) Deposits with body corporates and others (includingamount referred to in note 60) 4,109.25 8,385.85 6,046.57
b) Deposits and balances with government authorities 699.99 577.49 425.73
c) Derivative assets at fair value through profit or loss 13.69 1.44 145.40
d) Advance for purchase of equity shares of ABIPBL 41.82 - -
Total 4,864.75 8,964.78 6,617.70
12 OTHER NON-CURRENT ASSETS
a) Capital advances (refer note 40) 4,123.00 238.54 19,585.61
b) Cenvat credit 3,184.08 - -
c) Prepaid expenses 988.77 972.68 3,250.25
d) Advance income tax (net) 10,128.02 4,992.04 1,626.73
e) Others
- Considered Good 9,270.02 7,389.42 4,641.18
- Considered Doubtful 452.41 535.19 -
9,722.43 7,924.61 4,641.18
Allowance for doubtful advances (refer note 50) (452.41) (535.19) -
9,270.02 7,389.42 4,641.18
Total 27,693.89 13,592.68 29,103.77
13 INVENTORIES
Sim and recharge vouchers 542.10 851.46 582.98
Trading Goods 45.87 213.95 127.36
Total 587.97 1,065.41 710.34
Notes forming part of the Consolidated Financial Statements

C K
196 Idea Cellular Limited
Consolidated Financial Statements
Notes forming part of the Consolidated Financial Statements
` Mn
Particulars As at As at As atMarch 31, 2017 March 31, 2016 April 1, 2015
14 CURRENT INVESTMENTS
Investment in units of liquid mutual funds (quoted) (refer note 48) 48,997.52 13,304.60 115,361.80
Total 48,997.52 13,304.60 115,361.80
15 TRADE RECEIVABLES (Unsecured, unless otherwise stated)(including amount referred to in note 60)
a) Billed Receivables
Unsecured - Considered good 8,039.19 6,947.55 5,370.21
Unsecured - Considered doubtful 5,867.24 3,923.54 3,601.49
13,906.43 10,871.09 8,971.70
Allowance for doubtful advances (refer note 50) (5,867.24) (3,923.54) (3,601.49)
8,039.19 6,947.55 5,370.21
Trade receivable are secured for amounts receivable from certainparties who have provided security deposits of ` 631.43 Mn.(March 31, 2016 : ` 287.68 Mn. and April 1, 2015 : ` 267.77 Mn)
b) Unbilled Receivables 5,100.02 4,475.98 4,070.08
Total 13,139.21 11,423.53 9,440.29
16 CASH AND CASH EQUIVALENTS
a) Cash on hand 8.93 18.51 15.94
b) Cheques on hand 63.62 86.73 77.00
c) Balances with banks
- In current accounts 709.91 323.61 299.19
- In deposit accounts - 7,201.19 15,000.64
Total 782.46 7,630.04 15,392.77
17 BANK BALANCE OTHER THAN CASH AND CASH EQUIVALENTS
a) Margin money with banks 40.87 58.74 52.01
b) Earmarked bank balance towards dividend 4.10 2.52 1.44
Total 44.97 61.26 53.45
18 OTHER CURRENT FINANCIAL ASSETS
a) Interest Receivable 0.24 20.00 1,061.65
b) Security deposits with body corporates and others(including amount referred to in note 60) 333.65 686.34 396.16
c) Derivative assets at fair value through profit or loss - 98.88 2,696.21
d) Other receivables (including amount referred to in note 60)
- Considered good 65.20 115.99 187.41
- Considered doubtful 2.46 2.55 11.30
67.66 118.54 198.71
Allowance for doubtful advances (refer note 50) (2.46) (2.55) (11.30)
65.20 115.99 187.41
Total 399.09 921.21 4,341.43

C K
Annual Report 2016-17 197
Consolidated Financial Statements
Notes forming part of the Consolidated Financial Statements
` Mn
Particulars As at As at As atMarch 31, 2017 March 31, 2016 April 1, 2015
19 OTHER CURRENT ASSETS
a) Cenvat credit 10,411.26 6,778.28 3,135.68
b) Prepaid expenses 884.51 969.86 909.68
c) Others
- Considered good 1,016.30 2,587.12 3,510.53
- Considered doubtful 10.25 2.07 567.82
1,026.55 2,589.19 4,078.35
Allowance for doubtful advances (refer note 50) (10.25) (2.07) (567.82)
1,016.30 2,587.12 3,510.53
Total 12,312.07 10,335.26 7,555.89
20 NON CURRENT ASSETS CLASSIFIED AS HELD FOR SALE
The major classes of assets classified as held for sale are as below:
a) Plant and machinery 16.11 17.78 22.34
b) Buildings (refer footnote 4 to note 8) - 137.20 -
Total 16.11 154.98 22.34
21 EQUITY SHARE CAPITAL
Particulars As at March 31, 2017 As at March 31, 2016 As at April 1, 2015
Numbers `̀̀̀̀ Mn Numbers `̀̀̀̀ Mn Numbers `̀̀̀̀ Mn
Authorised share capital
Equity Shares of ` 10 each 6,775,000,000 67,750.00 6,775,000,000 67,750.00 6,775,000,000 67,750.00
Redeemable cumulative non-convertiblePreference shares of ` 10 million each 1,500 15,000.00 1,500 15,000.00 1,500 15,000.00
6,775,001,500 82,750.00 6,775,001,500 82,750.00 6,775,001,500 82,750.00
Issued, Subscribed and Paid-Up
Equity Shares of ` 10 each fully paid up 3,605,328,231 36,053.28 3,600,509,378 36,005.09 3,597,844,427 35,978.44
3,605,328,231 36,053.28 3,600,509,378 36,005.09 3,597,844,427 35,978.44
22 OTHER EQUITY ` Mn
Particulars As at As at As atMarch 31, 2017 March 31, 2016 April 1, 2015
Debenture redemption reserve 1,316.93 483.21 341.78
Securities premium account 133,369.27 103,837.69 103,652.02
Employee stock options reserve 1,341.32 1,352.29 775.02
General reserve 168.66 168.66 168.66
Retained earnings 75,072.98 93,657.93 69,826.65
Total 211,269.16 199,499.78 174,764.13
(i) Debenture redemption reserve
Opening balance 483.21 341.78
Transfer from retained earnings 833.72 141.43
Closing balance 1,316.93 483.21
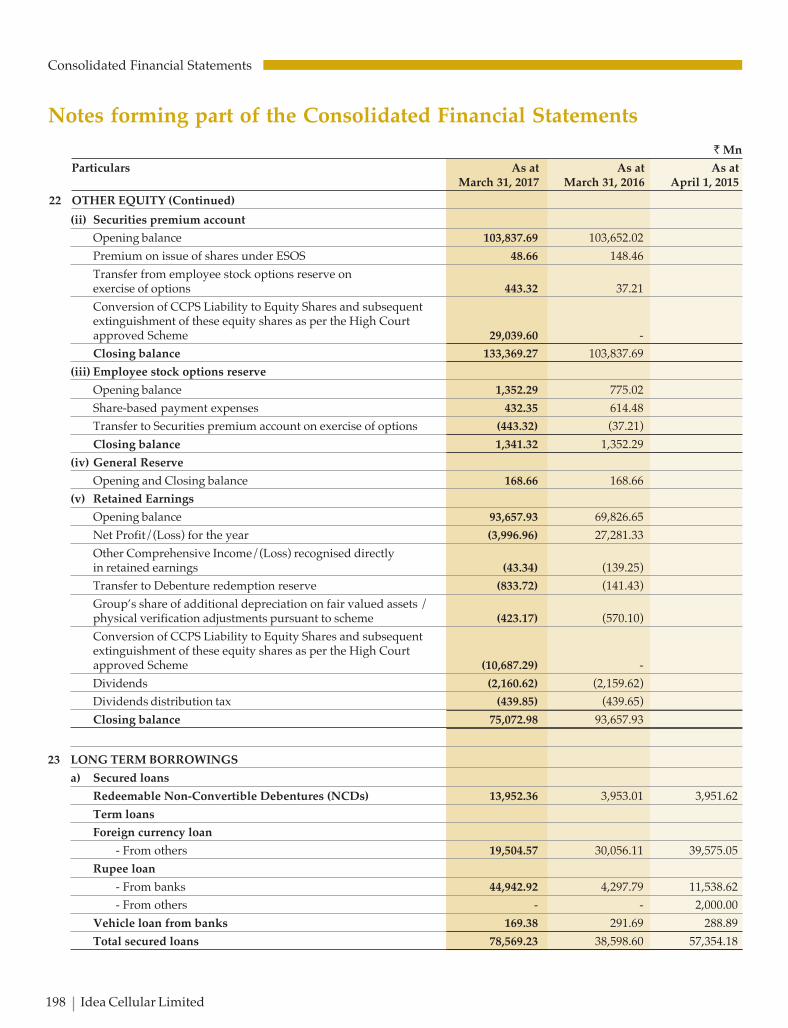
C K
198 Idea Cellular Limited
Consolidated Financial Statements
Notes forming part of the Consolidated Financial Statements
(ii) Securities premium account
Opening balance 103,837.69 103,652.02
Premium on issue of shares under ESOS 48.66 148.46
Transfer from employee stock options reserve onexercise of options 443.32 37.21
Conversion of CCPS Liability to Equity Shares and subsequentextinguishment of these equity shares as per the High Courtapproved Scheme 29,039.60 -
Closing balance 133,369.27 103,837.69
(iii) Employee stock options reserve
Opening balance 1,352.29 775.02
Share-based payment expenses 432.35 614.48
Transfer to Securities premium account on exercise of options (443.32) (37.21)
Closing balance 1,341.32 1,352.29
(iv) General Reserve
Opening and Closing balance 168.66 168.66
(v) Retained Earnings
Opening balance 93,657.93 69,826.65
Net Profit/(Loss) for the year (3,996.96) 27,281.33
Other Comprehensive Income/(Loss) recognised directlyin retained earnings (43.34) (139.25)
Transfer to Debenture redemption reserve (833.72) (141.43)
Group’s share of additional depreciation on fair valued assets /physical verification adjustments pursuant to scheme (423.17) (570.10)
Conversion of CCPS Liability to Equity Shares and subsequentextinguishment of these equity shares as per the High Courtapproved Scheme (10,687.29) -
Dividends (2,160.62) (2,159.62)
Dividends distribution tax (439.85) (439.65)
Closing balance 75,072.98 93,657.93
23 LONG TERM BORROWINGS
a) Secured loans
Redeemable Non-Convertible Debentures (NCDs) 13,952.36 3,953.01 3,951.62
Term loans
Foreign currency loan
- From others 19,504.57 30,056.11 39,575.05
Rupee loan
- From banks 44,942.92 4,297.79 11,538.62
- From others - - 2,000.00
Vehicle loan from banks 169.38 291.69 288.89
Total secured loans 78,569.23 38,598.60 57,354.18
` Mn
Particulars As at As at As atMarch 31, 2017 March 31, 2016 April 1, 2015
22 OTHER EQUITY (Continued)

C K
Annual Report 2016-17 199
Consolidated Financial Statements
Notes forming part of the Consolidated Financial Statements
b) Unsecured loans
Redeemable Non-Convertible Debentures (NCDs) 59,879.12 - -
Term loans
Foreign currency loan
- From banks 10,580.66 8,836.44 7,095.13
Rupee loan
- From banks - 500.00 -
Total unsecured loans 70,459.78 9,336.44 7,095.13
Subtotal (A) 149,029.01 47,935.04 64,449.31
c) Deferred payment liabilities towards spectrum (B) 367,349.27 311,105.38 93,541.51
Total (A + B) 516,378.28 359,040.42 157,990.82
a) Secured Loans are covered by:
Term Loans including current maturities are secured by way of first charge / assignment ranking pari-passu interse the
lenders, as under:
i. First charge on all the movable and immovable properties (including intangible assets) of the Company excluding:
a) Spectrum and Telecom Licenses
b) Vehicles up to ` 250 crores and
c) Passive Telecom Infrastructure.
ii. Rupee Loan amounting to ̀ 31,500.00 Mn. (March 31, 2016: ̀ Nil, April 1, 2015: ̀ Nil) are secured by way of first charge
on all the movable fixed assets and immovable properties (including intangible assets) of the Company excluding:
a) Spectrum and Telecom Licenses;
b) Vehicles; and
c) Passive Telecom Infrastructure.
iii. Foreign Currency Loan amounting to ̀ Nil (March 31, 2016: ̀ 5,092.32 Mn., April 1, 2015: ̀ 5,803.22 Mn.) has additional
security as first priority charge over certain Telecom Licenses.
iv. NCDs amounting to ` 3,960.00 Mn. (March 31, 2016: ` 3,960.00 Mn., April 1, 2015: ` 3,960.00 Mn.) have pari passu
charge only on the tangible fixed assets excluding passive telecom infrastructure and ` 10,000.00 Mn (March 31, 2016:
` Nil, April 1, 2015: ` Nil) have pari passu charge on movable fixed assets of the company excluding :
a) Spectrum and Telecom Licenses;
b) Vehicles up to ` 250 crores; and
c) Passive Telecom Infrastructure.
v. Vehicle Loans amounting to ` 353.28 Mn. (March 31, 2016: ` 519.37 Mn., April 1, 2015: ` 508.98 Mn.) is secured by
hypothecation of Vehicles against which the loans have been taken.
b) Repayment Terms of outstanding long term borrowings (excluding current maturities) as on March 31, 2017
Repayment Terms for Secured Foreign Currency Borrowings
Facility 1 (` 4,095.05 Mn.) - Balance amount is repayable as follows:
Tranche 1 - Balance amount is repayable in 4 equal half yearly installments starting April, 2018
` Mn
Particulars As at As at As atMarch 31, 2017 March 31, 2016 April 1, 2015
23 LONG TERM BORROWINGS (Continued)
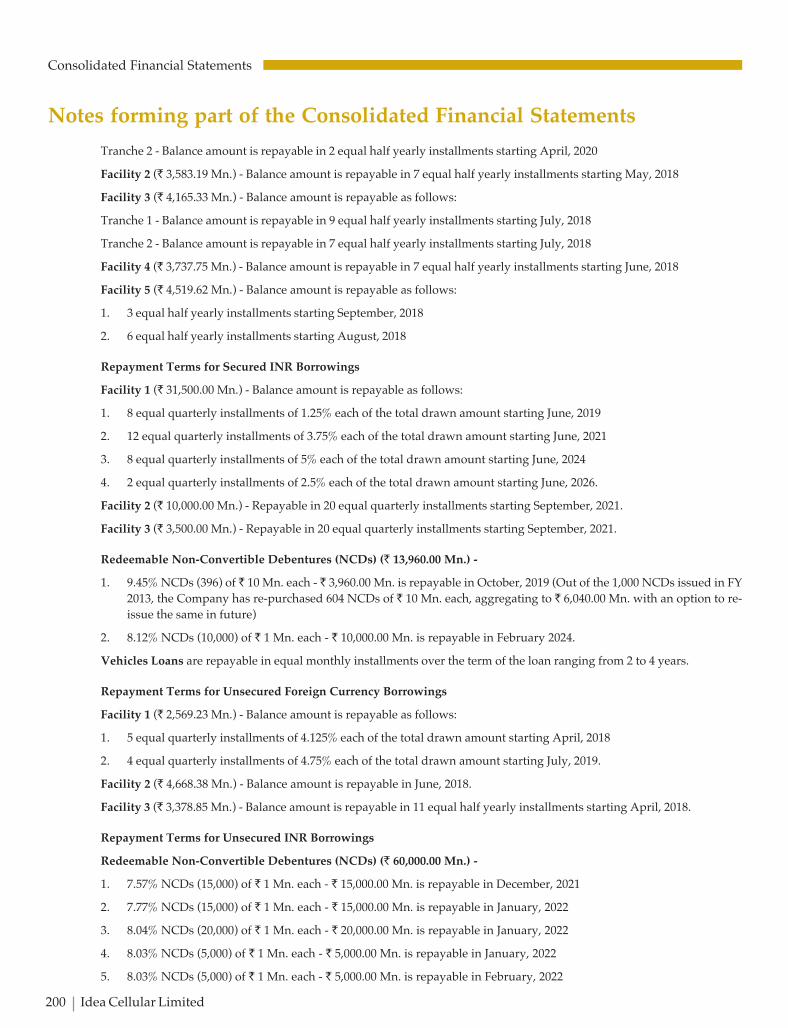
C K
200 Idea Cellular Limited
Consolidated Financial Statements
Tranche 2 - Balance amount is repayable in 2 equal half yearly installments starting April, 2020
Facility 2 (` 3,583.19 Mn.) - Balance amount is repayable in 7 equal half yearly installments starting May, 2018
Facility 3 (` 4,165.33 Mn.) - Balance amount is repayable as follows:
Tranche 1 - Balance amount is repayable in 9 equal half yearly installments starting July, 2018
Tranche 2 - Balance amount is repayable in 7 equal half yearly installments starting July, 2018
Facility 4 (` 3,737.75 Mn.) - Balance amount is repayable in 7 equal half yearly installments starting June, 2018
Facility 5 (` 4,519.62 Mn.) - Balance amount is repayable as follows:
1. 3 equal half yearly installments starting September, 2018
2. 6 equal half yearly installments starting August, 2018
Repayment Terms for Secured INR Borrowings
Facility 1 (` 31,500.00 Mn.) - Balance amount is repayable as follows:
1. 8 equal quarterly installments of 1.25% each of the total drawn amount starting June, 2019
2. 12 equal quarterly installments of 3.75% each of the total drawn amount starting June, 2021
3. 8 equal quarterly installments of 5% each of the total drawn amount starting June, 2024
4. 2 equal quarterly installments of 2.5% each of the total drawn amount starting June, 2026.
Facility 2 (` 10,000.00 Mn.) - Repayable in 20 equal quarterly installments starting September, 2021.
Facility 3 (` 3,500.00 Mn.) - Repayable in 20 equal quarterly installments starting September, 2021.
Redeemable Non-Convertible Debentures (NCDs) (` 13,960.00 Mn.) -
1. 9.45% NCDs (396) of ` 10 Mn. each - ` 3,960.00 Mn. is repayable in October, 2019 (Out of the 1,000 NCDs issued in FY
2013, the Company has re-purchased 604 NCDs of ` 10 Mn. each, aggregating to ` 6,040.00 Mn. with an option to re-
issue the same in future)
2. 8.12% NCDs (10,000) of ` 1 Mn. each - ` 10,000.00 Mn. is repayable in February 2024.
Vehicles Loans are repayable in equal monthly installments over the term of the loan ranging from 2 to 4 years.
Repayment Terms for Unsecured Foreign Currency Borrowings
Facility 1 (` 2,569.23 Mn.) - Balance amount is repayable as follows:
1. 5 equal quarterly installments of 4.125% each of the total drawn amount starting April, 2018
2. 4 equal quarterly installments of 4.75% each of the total drawn amount starting July, 2019.
Facility 2 (` 4,668.38 Mn.) - Balance amount is repayable in June, 2018.
Facility 3 (` 3,378.85 Mn.) - Balance amount is repayable in 11 equal half yearly installments starting April, 2018.
Repayment Terms for Unsecured INR Borrowings
Redeemable Non-Convertible Debentures (NCDs) (` 60,000.00 Mn.) -
1. 7.57% NCDs (15,000) of ` 1 Mn. each - ` 15,000.00 Mn. is repayable in December, 2021
2. 7.77% NCDs (15,000) of ` 1 Mn. each - ` 15,000.00 Mn. is repayable in January, 2022
3. 8.04% NCDs (20,000) of ` 1 Mn. each - ` 20,000.00 Mn. is repayable in January, 2022
4. 8.03% NCDs (5,000) of ` 1 Mn. each - ` 5,000.00 Mn. is repayable in January, 2022
5. 8.03% NCDs (5,000) of ` 1 Mn. each - ` 5,000.00 Mn. is repayable in February, 2022
Notes forming part of the Consolidated Financial Statements
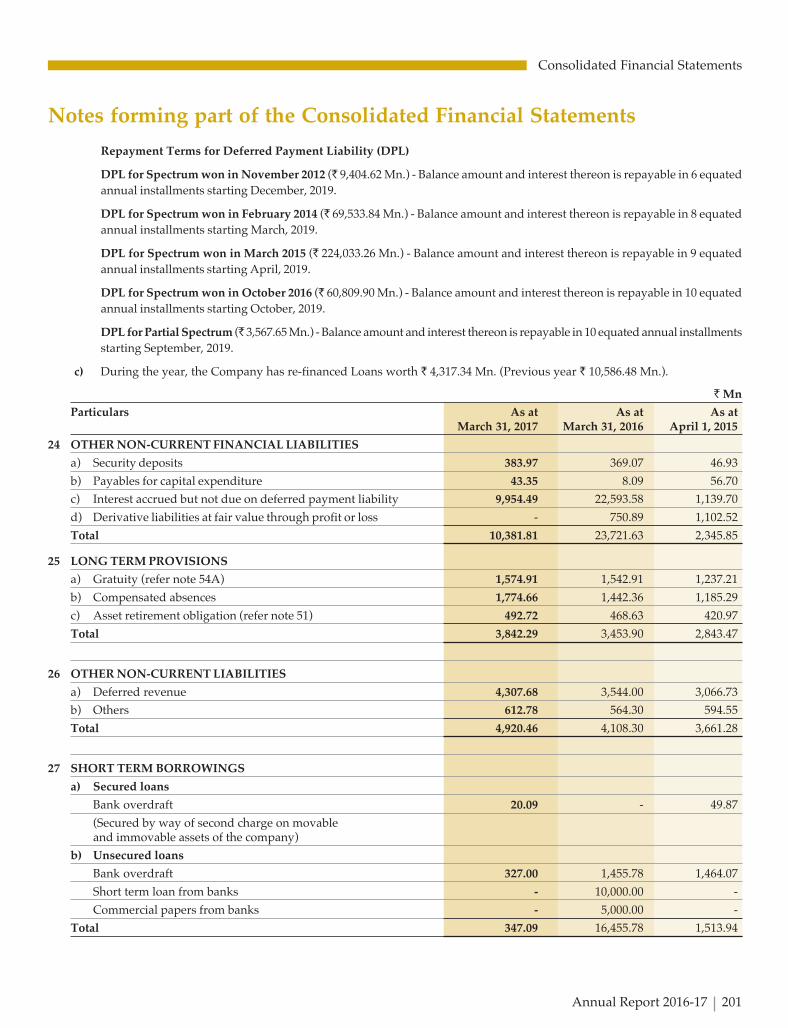
C K
Annual Report 2016-17 201
Consolidated Financial Statements
Repayment Terms for Deferred Payment Liability (DPL)
DPL for Spectrum won in November 2012 (` 9,404.62 Mn.) - Balance amount and interest thereon is repayable in 6 equated
annual installments starting December, 2019.
DPL for Spectrum won in February 2014 (` 69,533.84 Mn.) - Balance amount and interest thereon is repayable in 8 equated
annual installments starting March, 2019.
DPL for Spectrum won in March 2015 (` 224,033.26 Mn.) - Balance amount and interest thereon is repayable in 9 equated
annual installments starting April, 2019.
DPL for Spectrum won in October 2016 (` 60,809.90 Mn.) - Balance amount and interest thereon is repayable in 10 equated
annual installments starting October, 2019.
DPL for Partial Spectrum (` 3,567.65 Mn.) - Balance amount and interest thereon is repayable in 10 equated annual installments
starting September, 2019.
c) During the year, the Company has re-financed Loans worth ` 4,317.34 Mn. (Previous year ` 10,586.48 Mn.).
` Mn
Particulars As at As at As atMarch 31, 2017 March 31, 2016 April 1, 2015
24 OTHER NON-CURRENT FINANCIAL LIABILITIES
a) Security deposits 383.97 369.07 46.93
b) Payables for capital expenditure 43.35 8.09 56.70
c) Interest accrued but not due on deferred payment liability 9,954.49 22,593.58 1,139.70
d) Derivative liabilities at fair value through profit or loss - 750.89 1,102.52
Total 10,381.81 23,721.63 2,345.85
25 LONG TERM PROVISIONS
a) Gratuity (refer note 54A) 1,574.91 1,542.91 1,237.21
b) Compensated absences 1,774.66 1,442.36 1,185.29
c) Asset retirement obligation (refer note 51) 492.72 468.63 420.97
Total 3,842.29 3,453.90 2,843.47
26 OTHER NON-CURRENT LIABILITIES
a) Deferred revenue 4,307.68 3,544.00 3,066.73
b) Others 612.78 564.30 594.55
Total 4,920.46 4,108.30 3,661.28
27 SHORT TERM BORROWINGS
a) Secured loans
Bank overdraft 20.09 - 49.87
(Secured by way of second charge on movableand immovable assets of the company)
b) Unsecured loans
Bank overdraft 327.00 1,455.78 1,464.07
Short term loan from banks - 10,000.00 -
Commercial papers from banks - 5,000.00 -
Total 347.09 16,455.78 1,513.94
Notes forming part of the Consolidated Financial Statements

C K
202 Idea Cellular Limited
Consolidated Financial Statements
` Mn
Particulars As at As at As atMarch 31, 2017 March 31, 2016 April 1, 2015
28 OTHER CURRENT FINANCIAL LIABILITIES
a) Current maturities of long term debt* (refer note 23a) 33,820.18 29,916.86 97,175.38
b) Payable for capital expenditure 45,942.96 20,252.33 13,768.46
c) Interest accrued but not due on borrowings # 18,596.53 950.20 777.90
d) Unpaid dividend 4.10 2.52 1.44
e) Derivative liabilities at fair value through profit or loss 1,898.51 497.75 45.19
f) CCPS Liability (refer note 42) - 28,792.96 25,619.18
g) Security deposits from customers and others 2,297.80 2,127.07 2,014.29
Total 102,560.08 82,539.69 139,401.84
*Includes ` 22,403 Mn. to be prepaid in April 2017 (March 31, 2016:` Nil, April 1, 2015: ` 76,475 Mn. prepaid in May 2015)#Includes ` 17,702 Mn. to be prepaid in April 2017 (March 31, 2016:` Nil, April 1, 2015: ` Nil)
29 OTHER CURRENT LIABILITIES
a) Advance from customers and deferred revenue 14,138.78 12,714.25 12,541.05
b) Taxes and other liabilities 12,503.61 10,649.63 8,654.67
c) Others 89.69 130.27 163.09
Total 26,732.08 23,494.15 21,358.81
30 SHORT TERM PROVISIONS
a) Compensated absences 144.93 129.58 114.62
b) Asset retirement obligation (refer note 51) 32.03 - -
c) Provision for current tax (net of advance tax) 21.68 796.80 281.26
Total 198.64 926.38 395.88
` Mn
Particulars For the year ended For the year endedMarch 31, 2017 March 31, 2016
31 OTHER OPERATING INCOME
Liabilities / provisions no longer required written back 93.48 136.82
Miscellaneous receipts 137.34 193.61
Total 230.82 330.43
32 OTHER INCOME
Interest income 674.64 276.70
Gain on Mutual Funds (including fair value gain/(loss)) 2,394.71 1,854.69
Total 3,069.35 2,131.39
Notes forming part of the Consolidated Financial Statements

C K
Annual Report 2016-17 203
Consolidated Financial Statements
` Mn
Particulars For the year ended For the year endedMarch 31, 2017 March 31, 2016
33 EMPLOYEE BENEFIT EXPENSES
Salaries, wages and bonus 15,575.61 13,715.03
Contribution to provident and other funds (refer note 54B) 1,118.78 925.51
Share based payment expenses (ESOS) (refer note 53) 432.35 614.48
Staff welfare 675.68 645.71
Recruitment and training 174.03 217.78
Total 17,976.45 16,118.51
34 NETWORK EXPENSES AND IT OUTSOURCING COST
Security service charges 1,098.62 1,077.63
Power and fuel 30,616.91 25,203.00
Repairs and maintenance - plant and machinery 12,057.20 10,627.69
Switching and cellsites rent 1,643.86 1,488.57
Lease line and connectivity charges 6,749.54 6,639.46
Network insurance 174.35 181.76
Passive infrastructure charges 47,330.42 41,724.13
Other network operating expenses 1,122.40 1,132.34
IT outsourcing cost 5,859.34 4,703.05
Total 106,652.64 92,777.63
35 LICENSE FEES AND SPECTRUM USAGE CHARGES
License fees 24,897.38 25,078.74
Spectrum usage charges 15,617.45 16,429.09
Total 40,514.83 41,507.83
36 ROAMING AND ACCESS CHARGES
Roaming charges 9,107.52 13,203.70
Access charges 33,646.92 33,449.76
Total 42,754.44 46,653.46
37 SUBSCRIBER ACQUISITION AND SERVICING EXPENDITURE
Cost of sim and recharge vouchers 2,017.66 1,775.35
Commission to dealers 18,477.53 17,683.14
Customer verification expenses 2,410.15 2,771.11
Collection, telecalling and servicing expenses 5,963.60 5,543.59
Customer retention and customer loyalty expenses 1,413.29 894.85
Total 30,282.23 28,668.04
Notes forming part of the Consolidated Financial Statements

C K
204 Idea Cellular Limited
Consolidated Financial Statements
` Mn
Particulars For the year ended For the year endedMarch 31, 2017 March 31, 2016
38 ADMINISTRATION AND OTHER EXPENSES
Repairs and maintenance
Building 113.13 83.59
Others 818.17 500.83
Other insurance 38.00 31.12
Non network rent 1,504.54 1,180.24
Rates and taxes 550.29 159.92
Electricity 570.47 574.17
Printing and stationery 84.99 91.90
Communication expenses 121.18 115.82
Travelling and conveyance 1,162.98 1,236.02
Bad debts / advances written off 104.16 1,328.12
Allowances for doubtful debts and advances (refer note 50) 1,869.01 282.74
Net loss/(gain) on disposal of property, plant and equipment (176.19) (63.75)
Exchange difference (net) (326.26) 387.95
Bank charges 304.30 244.11
Directors commission - 150.01
Directors Sitting Fees 4.77 3.81
Legal and professional charges 1,004.18 964.82
Audit fees (refer note 55) 47.20 46.95
CSR expenditure (refer note 56) 372.47 188.99
Miscellaneous expenses 1,790.45 1,432.48
Total 9,957.84 8,939.84
39 FINANCE COSTS
Interest
- On fixed period loan (Net of ` 1,732.39 Mn. capitalised,Previous year ` 345.02 Mn.) 3,546.50 4,636.23
- On deferred payment liability towards spectrum (Net of ` 2,157.11 Mn.capitalised, Previous year ` 18,479.47 Mn.) 35,095.64 13,034.59
- Others 284.18 109.51
Other finance charges 94.74 428.79
Total interest expense 39,021.06 18,209.12
Exchange difference (net) on foreign currency borrowings (118.36) -
Loss / (gain) on derivatives (including fair value changes on derivatives) 1,217.93 (421.40)
Total 40,120.63 17,787.72
Notes forming part of the Consolidated Financial Statements
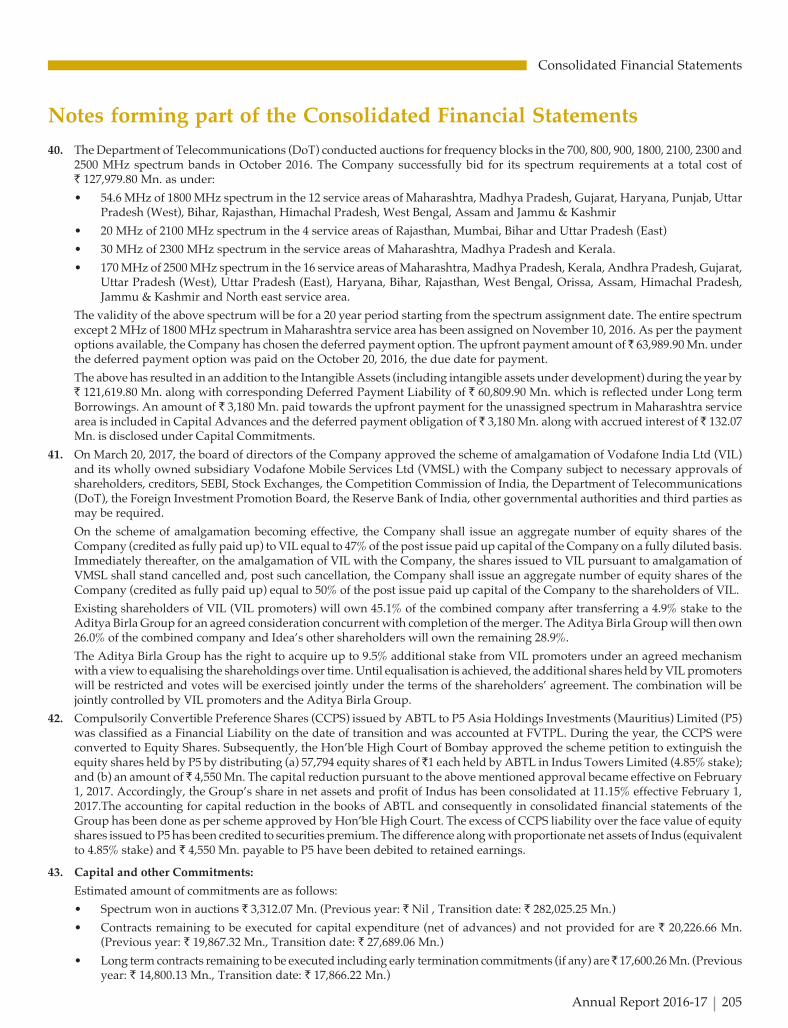
C K
Annual Report 2016-17 205
Consolidated Financial Statements
40. The Department of Telecommunications (DoT) conducted auctions for frequency blocks in the 700, 800, 900, 1800, 2100, 2300 and2500 MHz spectrum bands in October 2016. The Company successfully bid for its spectrum requirements at a total cost of` 127,979.80 Mn. as under:
• 54.6 MHz of 1800 MHz spectrum in the 12 service areas of Maharashtra, Madhya Pradesh, Gujarat, Haryana, Punjab, UttarPradesh (West), Bihar, Rajasthan, Himachal Pradesh, West Bengal, Assam and Jammu & Kashmir
• 20 MHz of 2100 MHz spectrum in the 4 service areas of Rajasthan, Mumbai, Bihar and Uttar Pradesh (East)
• 30 MHz of 2300 MHz spectrum in the service areas of Maharashtra, Madhya Pradesh and Kerala.
• 170 MHz of 2500 MHz spectrum in the 16 service areas of Maharashtra, Madhya Pradesh, Kerala, Andhra Pradesh, Gujarat,Uttar Pradesh (West), Uttar Pradesh (East), Haryana, Bihar, Rajasthan, West Bengal, Orissa, Assam, Himachal Pradesh,Jammu & Kashmir and North east service area.
The validity of the above spectrum will be for a 20 year period starting from the spectrum assignment date. The entire spectrumexcept 2 MHz of 1800 MHz spectrum in Maharashtra service area has been assigned on November 10, 2016. As per the paymentoptions available, the Company has chosen the deferred payment option. The upfront payment amount of ̀ 63,989.90 Mn. underthe deferred payment option was paid on the October 20, 2016, the due date for payment.
The above has resulted in an addition to the Intangible Assets (including intangible assets under development) during the year by` 121,619.80 Mn. along with corresponding Deferred Payment Liability of ` 60,809.90 Mn. which is reflected under Long termBorrowings. An amount of ` 3,180 Mn. paid towards the upfront payment for the unassigned spectrum in Maharashtra servicearea is included in Capital Advances and the deferred payment obligation of ` 3,180 Mn. along with accrued interest of ` 132.07Mn. is disclosed under Capital Commitments.
41. On March 20, 2017, the board of directors of the Company approved the scheme of amalgamation of Vodafone India Ltd (VIL)and its wholly owned subsidiary Vodafone Mobile Services Ltd (VMSL) with the Company subject to necessary approvals ofshareholders, creditors, SEBI, Stock Exchanges, the Competition Commission of India, the Department of Telecommunications(DoT), the Foreign Investment Promotion Board, the Reserve Bank of India, other governmental authorities and third parties asmay be required.
On the scheme of amalgamation becoming effective, the Company shall issue an aggregate number of equity shares of theCompany (credited as fully paid up) to VIL equal to 47% of the post issue paid up capital of the Company on a fully diluted basis.Immediately thereafter, on the amalgamation of VIL with the Company, the shares issued to VIL pursuant to amalgamation ofVMSL shall stand cancelled and, post such cancellation, the Company shall issue an aggregate number of equity shares of theCompany (credited as fully paid up) equal to 50% of the post issue paid up capital of the Company to the shareholders of VIL.
Existing shareholders of VIL (VIL promoters) will own 45.1% of the combined company after transferring a 4.9% stake to theAditya Birla Group for an agreed consideration concurrent with completion of the merger. The Aditya Birla Group will then own26.0% of the combined company and Idea’s other shareholders will own the remaining 28.9%.
The Aditya Birla Group has the right to acquire up to 9.5% additional stake from VIL promoters under an agreed mechanismwith a view to equalising the shareholdings over time. Until equalisation is achieved, the additional shares held by VIL promoterswill be restricted and votes will be exercised jointly under the terms of the shareholders’ agreement. The combination will bejointly controlled by VIL promoters and the Aditya Birla Group.
42. Compulsorily Convertible Preference Shares (CCPS) issued by ABTL to P5 Asia Holdings Investments (Mauritius) Limited (P5)was classified as a Financial Liability on the date of transition and was accounted at FVTPL. During the year, the CCPS wereconverted to Equity Shares. Subsequently, the Hon’ble High Court of Bombay approved the scheme petition to extinguish theequity shares held by P5 by distributing (a) 57,794 equity shares of ̀ 1 each held by ABTL in Indus Towers Limited (4.85% stake);and (b) an amount of ̀ 4,550 Mn. The capital reduction pursuant to the above mentioned approval became effective on February1, 2017. Accordingly, the Group’s share in net assets and profit of Indus has been consolidated at 11.15% effective February 1,2017.The accounting for capital reduction in the books of ABTL and consequently in consolidated financial statements of theGroup has been done as per scheme approved by Hon’ble High Court. The excess of CCPS liability over the face value of equityshares issued to P5 has been credited to securities premium. The difference along with proportionate net assets of Indus (equivalentto 4.85% stake) and ` 4,550 Mn. payable to P5 have been debited to retained earnings.
43. Capital and other Commitments:
Estimated amount of commitments are as follows:
• Spectrum won in auctions ` 3,312.07 Mn. (Previous year: ` Nil , Transition date: ` 282,025.25 Mn.)
• Contracts remaining to be executed for capital expenditure (net of advances) and not provided for are ` 20,226.66 Mn.(Previous year: ` 19,867.32 Mn., Transition date: ` 27,689.06 Mn.)
• Long term contracts remaining to be executed including early termination commitments (if any) are ̀ 17,600.26 Mn. (Previousyear: ` 14,800.13 Mn., Transition date: ` 17,866.22 Mn.)
Notes forming part of the Consolidated Financial Statements

C K
206 Idea Cellular Limited
Consolidated Financial Statements
Notes forming part of the Consolidated Financial Statements
44. Contingent Liabilities:
A) Licensing Disputes:
i. One Time Spectrum Charges:
In Financial year 2012-13, DoT had issued demand notices towards one time spectrum charges
- For spectrum beyond 6.2 MHz in respective service areas for retrospective period from July 1, 2008 to December 31, 2012,amounting to ` 3,691.30 Mn.., and
- For spectrum beyond 4.4 MHz in respective service areas effective January 1, 2013 till expiry of the period as per respectivelicenses amounting to ` 17,443.70 Mn.
In the opinion of Company, inter-alia, the above demands amount to alteration of financial terms of the licenses issued in the past.The Company had therefore, petitioned the Hon’ble High Court of Bombay, where the matter was admitted and is currently sub-judice. The Hon’ble High Court of Bombay has directed the DoT, not to take any coercive action until the matter is further heard.No effects have been given in the consolidated financial statements for the above.
ii. Other Licensing Disputes - ` 58,318.18 Mn. (Previous year: ` 30,501.90 Mn., Transition date: ` 35,520.91 Mn.):
- Demands due to difference in interpretation of definition of Adjusted Gross Revenue (AGR) and other license fee assessmentrelated matters. Most of these demands are currently before the Hon’ble TDSAT, Hon’ble High court and Hon’ble SupremeCourt.
- Disputes relating to alleged non-compliance of licensing conditions & other disputes with DoT, either filed by or against theCompany and pending before Hon’ble Supreme Court / TDSAT.
- Demands on account of alleged violations in license conditions relating to amalgamation of erstwhile SpiceCommunications Limited currently sub-judice before the Hon’ble TDSAT.
- Demand with respect to upfront spectrum amounts for continuation of services from February 02, 2012 till various dates inthe service areas where the licenses were quashed following the Hon’ble Supreme Court Order.
B) The Group has an obligation to buy equity shares of Indus held by P5 at fair value if:
i. The Group sells its stake in Indus before P5 and P5 is not able to find a buyer for their stake in Indus, or
ii. Aditya Birla Group companies collectively cease to be the single largest shareholder of the Company before P5 is able to sellits stake in Indus.
C) Other Matters` Mn
Particulars As at As at As atMarch 31, 2017 March 31, 2016 April 1, 2015
Income tax matters not acknowledged as debts (see note i below) 74,030.30 88,017.53 100,040.47
Sales tax and entertainment tax matters not acknowledged asdebts (see note ii below) 1,687.26 1,511.18 996.85
Service tax matters not acknowledged as debts (see note iii below) 4,073.00 3,968.07 1,525.82
Entry tax and customs matters not acknowledged as debts(see note iv below) 351.20 320.93 402.82
Other claims not acknowledged as debts (see note v below) 2,611.25 2,429.26 2,394.48
i. Income Tax Matters:
- Appeals filed by the Company against the demands raised by Income Tax Authorities which are pending before AppellateAuthorities include mainly disputes on account of incorrect disallowance of revenue share license fee, disputes on non-applicability of tax deduction at source on pre-paid margin allowed to prepaid distributors & roaming settlements,disallowance of interest proportionate to interest free advances given to wholly owned subsidiaries etc.
- Appeal filed for tax demand on difference between revalued figures of Investment in Indus held through a whollyowned subsidiary and book value of Passive Infrastructure assets transferred to step down subsidiary through a HighCourt approved scheme.
ii. Sales Tax and Entertainment Tax:
- Sales Tax demands mainly relates to the demands raised by the VAT/Sales Tax authorities of few states on BroadbandConnectivity, SIM cards etc. on which the Company has already paid Service Tax.

C K
Annual Report 2016-17 207
Consolidated Financial Statements
Notes forming part of the Consolidated Financial Statements
- Demand of tax for non-submission of Declaration forms viz. C forms & F forms in stipulated time limit.
- In one State entertainment tax is being demanded on revenue from value added services. However, the Company haschallenged the constitutional validity of the levy.
- Amounts in respect of Jammu & Kashmir General Sales Tax Amnesty scheme pending clarification / notification.
iii. Service Tax:
Service Tax demands mainly relates to the following matters:
- Interpretation issues arising out of Rule 6 (3) of the Cenvat Credit Rules, 2004.
- Denial of Cenvat credit related to Towers and Shelters.
- Demand raised on services provided by Foreign Telecom operators for Service tax under reverse charge.
- Disallowance of Cenvat Credit on input services viewed as not related to output service.
- Demand of tax on telecommunication services provided to employees.
- Demand of interest on the credit availed but not utilized.
iv. Entry Tax:
- Entry Tax disputes pertains to classification / valuation of goods.
v. Other claims not acknowledged as debts :
- Mainly include consumer forum cases, miscellaneous disputed matters with local Municipal Corporation, ElectricityBoard and others.
45. Details of Guarantees given` Mn
Particulars As at As at As atMarch 31, 2017 March 31, 2016 April 1, 2015
Bank guarantees given 114,302.80 96,842.27 86,474.04
46. Operating Lease
a) Group as lessee
The Group has entered into non-cancellable operating leases for offices, switches and cell sites for periods ranging from 36months to 240 months.
Lease payments amounting to ` 50,423.93 Mn. (Previous year: ` 44,337.17 Mn.) are included in rental and passive infrastructureexpenses in the Statement of Profit and Loss during the current year.
Future minimum lease rentals payable under non-cancellable operating leases are as follows:
` Mn
Particulars As at As at As atMarch 31, 2017 March 31, 2016 April 1, 2015
Within one year 45,333.60 41,662.24 36,360.94
After one year but not more than five years 127,326.34 119,444.43 117,647.59
More than five years 60,332.11 45,866.62 43,930.11
b) Group as lessor
The Group has leased certain Optical Fibre Cables pairs (OFC) on Indefeasible Rights of Use (IRU) basis and certain cell sitesunder operating lease arrangements. The gross block, accumulated depreciation and depreciation expense of the assets given onlease are not separately identifiable and hence not disclosed.
Future minimum lease rentals receivable under non-cancellable operating leases are as follows:
` Mn
Particulars As at As at As atMarch 31, 2017 March 31, 2016 April 1, 2015
Within one year 2,909.54 2,010.35 1,266.43
After one year but not more than five years 10,579.63 7,834.28 4,275.71
More than five years 8,445.32 7,470.09 4,690.82

C K
208 Idea Cellular Limited
Consolidated Financial Statements
Notes forming part of the Consolidated Financial Statements
47. The Group has composite IT outsourcing agreements where in Property, plant and equipment, computer software and servicesrelated to IT has been supplied by the vendor. Such Property, plant and equipment received have been accounted for as financelease. Correspondingly, such assets are recorded at fair value at the time of receipt and depreciated on the stated useful lifeapplicable to similar IT assets of the Group.
48. Details of Current Investments:
Particulars As at March 31, 2017 As at March 31, 2016 As at April 1, 2015
Qty in ` 000 ` in Mn Qty in ` 000 ` in Mn Qty in ` 000 ` in MnUnits Value Units Value Units Value
Birla Sun Life Cash Plus - Dir - Growth 171,583.65 44,836.38 21,137.94 5,143.17 211,684.92 47,543.72
Reliance Liquidity Fund - Dir - Growth 510.11 1,250.38 - - 1,423.46 3,001.62
DSP BlackRock Liquidity Fund - Dir - Growth 537.59 1,250.32 - - 237.46 475.38
UTI-Liquid Cash Plan -Dir- Growth 375.58 1,000.27 - - - -
Kotak Liquid Scheme - Plan A - Dir – Growth 100.10 330.09 - - - -
IDFC Cash Fund - Dir - Growth 167.07 330.08 135.89 250.29 588.42 1,000.66
Religare Invesco Liquid Fund - Dir - Growth - - 479.94 1,000.73 - -
HDFC Liquid Fund - Dir - Growth - - 334.71 1,000.85 - -
Reliance Liquid Fund - TP - Dir - Growth - - 270.89 1,000.93 - -
ICICI Prudential Money Market Fund - Dir- Growth - - 4,775.70 1,000.82 - -
Birla Sun Life Savings Fund - Dir - Growth - - 12,448.39 3,657.56 4,095.74 1,104.30
Tata Liquid Fund - Dir - Growth - - 89.48 250.25 387.34 1,000.60
Birla Sun Life Floating Rate Fund - STP - Dir - Growth - - - - 80,568.62 15,011.81
HDFC Cash Mgmt Fund - Savings Plan - Dir - Growth - - - - 119,840.03 3,501.62
ICICI Prudential Liquid -Dir- Growth - - - - 179,708.15 37,217.38
JPMorgan India Liquid Fund - Dir - Growth - - - - 55,087.31 1,000.35
DWS Insta Cash Plus Fund - Dir - Growth - - - - 5,506.14 1,000.53
Kotak Floater - ST - Dir - Growth - - - - 1,526.50 3,503.83
Total 173,274.10 48,997.52 39,672.94 13,304.60 660,654.09 115,361.80
49. Details of Foreign Currency Exposures
A. Hedged by a Derivative InstrumentAmount in Mn
Particulars As at As at As atMarch 31, 2017 March 31, 2016 April 1, 2015
Foreign Currency Loan
Foreign Currency Loan in USD 127.03 254.05 528.21
Equivalent INR of Foreign Currency Loan 10,000.89 18,996.80 33,695.31
Trade Payables and Other Current Financial Liabilities
Trade Payables in USD 161.67 62.47 32.63
Interest accrued but not due on Foreign Currency Loans in USD 0.05 0.41 1.56
Equivalent INR of Trade Payables and Other CurrentFinancial Liabilities 10,891.80 4,294.82 2,161.31
(Amount in INR represents conversion at hedged rate)

C K
Annual Report 2016-17 209
Consolidated Financial Statements
Notes forming part of the Consolidated Financial Statements
B. Not hedged by a Derivative Instrument or otherwiseAmount in Mn
Particulars As at As at As atMarch 31, 2017 March 31, 2016 April 1, 2015
Foreign Currency Loan
Foreign Currency Loan in USD 473.75 473.75 473.75
Equivalent INR of Foreign Currency Loan 30,717.39 31,425.32 29,652.49
Trade Payables and Other Current Financial Liabilities
Trade Payables in USD 138.67 60.35 40.73
Trade Payables in EURO 0.16 0.12 0.33
Trade Payables in GBP 0.03 - 0.02
Interest accrued but not due on Foreign Currency Loans in USD 2.93 3.34 4.72
Equivalent INR of Trade Payables and Other CurrentFinancial Liabilities 9,195.09 4,234.46 2,869.59
Trade Receivables
Trade Receivables in USD 13.55 13.53 15.37
Trade Receivables in EURO 0.23 0.29 0.08
Equivalent INR of Trade Receivables in Foreign Currency 894.93 919.48 969.42
50. Movement of Allowances for Doubtful debts/Advances` Mn
Particulars For the year ended For the year endedMarch 31, 2017 March 31, 2016
Opening Balance 4,463.35 4,180.61
Charged to the Statement of Profit and Loss (net) 1,869.01 282.74
Closing Balance 6,332.36 4,463.35
51. Asset Retirement Obligation:
The Group installs equipment’s on leased premises and lays down optical fibre cables (OFC) to provide seamless connectivity toits customers. In certain cases, the Company may have to incur some cost to remove such equipment’s on leased premises.Estimated costs to be incurred for restoration is capitalised along with the assets. The movement of provision as required in IndAS - 37 “Provisions, Contingent Liabilities and Contingent Assets” is given below:
` Mn
Particulars For the year ended For the year endedMarch 31, 2017 March 31, 2016
Opening Balance 468.63 420.97
Additional Provision 14.19 9.24
Unwinding of discount 41.93 38.42
Closing Balance 524.75 468.63
52. Segment information
The Group operates in three different segments as
(a) Mobility Services: providing GSM based mobile and related telephony services
(b) International Long Distance (ILD): providing international long distance services.
(c) Passive Infrastructure (PI): providing passive infrastructure services.
The above segments have been identified based on the significant components of the enterprise for which discrete financialinformation is available and are reviewed by the Chief operating decision maker (CODM) to assess the Group’s performanceand allocate resources.
Transactions between segments are accounted on agreed terms on arm’s length basis and have been eliminated at the Grouplevel.

C K
210 Idea Cellular Limited
Consolidated Financial Statements
The Group’s operating segment information for the year ended March 31, 2017 are as below:` Mn
Particulars Business Segments Elimination Total
Mobility ILD PI
Revenue
External Revenue 346,856.70 6,177.04 2,723.63 - 355,757.37
Inter-segment Revenue 1,931.40 1,333.40 4,861.24 (8,126.04) -
Total Revenue from Operations 348,788.10 7,510.44 7,584.87 (8,126.04) 355,757.37
Segment Result 22,759.59 521.67 1,209.56 - 24,490.82
Other Income 3,069.35
Finance Costs (40,410.78)
Profit/(Loss) before Tax and Share of Joint Venture (12,850.61)
Add: Share in Profits of Joint Venture 4,302.93
Add: Share in Loss of Associate (84.67)
Profit/(Loss) before Tax (8,632.35)
Provision for Tax (net) 4,635.39
Profit/(Loss) after Tax (3,996.96)
Other Information
Depreciation & Amortisation 76,973.11 27.32 1,271.61 - 78,272.04
Capital Expenditure 212,078.72 30.73 755.79 - 212,865.24
The Group’s operating segment information for the year ended March 31, 2016 are as below:` Mn
Particulars Business Segments Elimination Total
Mobility ILD PI
Revenue
External Revenue 351,421.52 6,983.59 1,088.95 - 359,494.06
Inter-segment Revenue 2,208.90 1,419.71 1,332.95 (4,961.56) -
Total Revenue from Operations 353,630.42 8,403.30 2,421.90 (4,961.56) 359,494.06
Segment Result 55,710.49 768.83 635.26 - 57,114.58
Other Income 2,131.39
Finance Costs (20,961.50)
Profit before Tax and Share of Joint Venture 38,284.47
Add: Share in Profits of Joint Venture 4,216.81
Add: Share in Loss of Associate -
Profit before Tax 42,501.28
Provision for Tax (net) (15,219.95)
Profit after Tax 27,281.33
Other Information
Depreciation & Amortisation 62,195.81 36.74 328.19 - 62,560.74
Capital Expenditure 382,037.63 23.91 81.05 - 382,142.59
Notes forming part of the Consolidated Financial Statements

C K
Annual Report 2016-17 211
Consolidated Financial Statements
The Group’s segment assets and liabilities as at March 31, 2017 are as below:` Mn
Particulars Business Segments Unallocated Total
Mobility ILD PI Assets
Segment Assets 877,083.97 975.05 23,164.75 67,077.97 968,301.74
Less: Inter Segment Eliminations (533.40) (144.35) (577.05) (1,254.80)
Total Assets 876,550.57 830.70 22,587.70 67,077.97 967,046.94
Segment Liabilities 703,836.68 479.55 3,050.19 13,612.88 720,979.30
Less: Inter Segment Eliminations (721.40) (533.40) (1,254.80)
Total Liabilities 703,115.28 479.55 2,516.79 13,612.88 719,724.50
The Group’s segment assets and liabilities as at March 31, 2016 are as below:` Mn
Particulars Business Segments Unallocated Total
Mobility ILD PI Assets
Segment Assets 744,450.06 1,476.18 23,659.94 33,167.60 802,753.78
Less: Inter Segment Eliminations (922.41) (556.02) (20.33) (1,498.76)
Total Assets 743,527.65 920.16 23,639.61 33,167.60 801,255.02
Segment Liabilities 544,728.56 739.80 1,442.63 20,337.92 567,248.91
Less: Inter Segment Eliminations (576.35) (922.41) (1,498.76)
Total Liabilities 544,152.21 739.80 520.22 20,337.92 565,750.15
The Group’s segment assets and liabilities as at April, 1 2015 are as below:` Mn
Particulars Business Segments Unallocated Total
Mobility ILD PI Assets
Segment Assets 425,603.48 1,194.34 20,418.13 138,641.76 585,857.71
Less: Inter Segment Eliminations (2,107.65) (482.75) (119.59) (2,709.99)
Total Assets 423,495.83 711.59 20,298.54 138,641.76 583,147.72
Segment Liabilities 358,568.24 491.56 2,496.86 13,558.48 375,115.14
Less: Inter Segment Eliminations (602.34) (2,107.65) (2,709.99)
Total Liabilities 357,965.90 491.56 389.21 13,558.48 372,405.15
Information About major customers
There is no single external customer from whom the revenue exceeds 10% of the total revenue of the Group.
53. Share-based payments
Employee stock option plan
The Company has granted stock options under the employee stock option scheme (ESOS) 2006 and stock options as well asrestricted stock units (RSU’s) under ESOS 2013 to the eligible employees of the company and its subsidiaries from time to time.These options would vest in 4 equal annual installments after one year of the grant and the RSU’s will vest after 3 years from thedate of grant. The maximum period for exercise of options and RSU’s is 5 years from the date of vesting. Each option and RSUwhen exercised would be converted into one fully paid-up equity share of ` 10 each of the Company. The options granted underESOS 2006 and options as well as RSUs granted under the ESOS 2013 scheme carry no rights to dividends and no voting rightstill the date of exercise.
The fair value of the share options is estimated at the grant date using Black and Scholes Model, taking into account the terms andconditions upon which the share options were granted.
Notes forming part of the Consolidated Financial Statements

C K
212 Idea Cellular Limited
Consolidated Financial Statements
There were no modifications to the awards during the year ended March 31, 2017 and March 31, 2016. As at the end of thefinancial year, details and movements of the outstanding options are as follows:
Particulars As at March 31, 2017 As at March 31, 2016
Weighted WeightedNo. of average No. of average
Options exercise Options exerciseprice (`) price (`)
i) Options granted under ESOS 2006
Options outstanding at the beginning of the year 2,681,041 52.56 4,851,573 51.74
Options granted during the year - - - -
Options lapsed during the year 9,750 68.86 10,625 62.74
Options exercised during the year 1,337,663 46.37 2,136,095 50.67
Options expired during the year 116,477 56.97 23,812 49.64
Options outstanding at the end of the year 1,217,151 58.80 2,681,041 52.56
Options exercisable at the end of the year 1,217,151 58.80 2,681,041 52.56
Range of exercise price of outstanding options (`) 45.55 - 68.86 39.30 - 68.86
Remaining contractual life of outstanding options (years) 0.31 - 2.81 0.31 - 3.81
ii) Options granted under ESOS 2013
Options outstanding at the beginning of the year 19,018,618 126.66 18,657,280 127.16
Options granted during the year 416,033 110.45 1,048,615 117.55
Options lapsed during the year 462,010 127.29 158,421 126.45
Options exercised during the year - - 528,856 126.45
Options expired during the year - - - -
Options outstanding at the end of the year 18,972,641 126.28 19,018,618 126.66
Options exercisable at the end of the year 13,166,437 126.76 8,622,110 126.83
Range of exercise price of outstanding options (`) 110.45 - 150.10 117.55 - 150.10
Remaining contractual life of outstanding options (years) 2.87 - 8.87 3.87 - 8.81
iii) RSU’s granted under ESOS 2013
Options outstanding at the beginning of the year 8,550,446 10.00 8,160,108 10.00
Options granted during the year 161,869 10.00 476,851 10.00
Options lapsed during the year 221,913 10.00 86,513 10.00
Options exercised during the year 3,481,190 10.00 - -
Options expired during the year - - - -
Options outstanding at the end of the year 5,009,212 10.00 8,550,446 10.00
Options exercisable at the end of the year 4,123,456 10.00 41,422 10.00
Range of exercise price of outstanding options (`) 10.00 10.00
Remaining contractual life of outstanding options (years) 4.87 - 7.87 5.87 - 7.81
The weighted average share price at the date of exercise of options exercised during the year was ` 84.88 (March 31, 2016` 155.01).
Notes forming part of the Consolidated Financial Statements
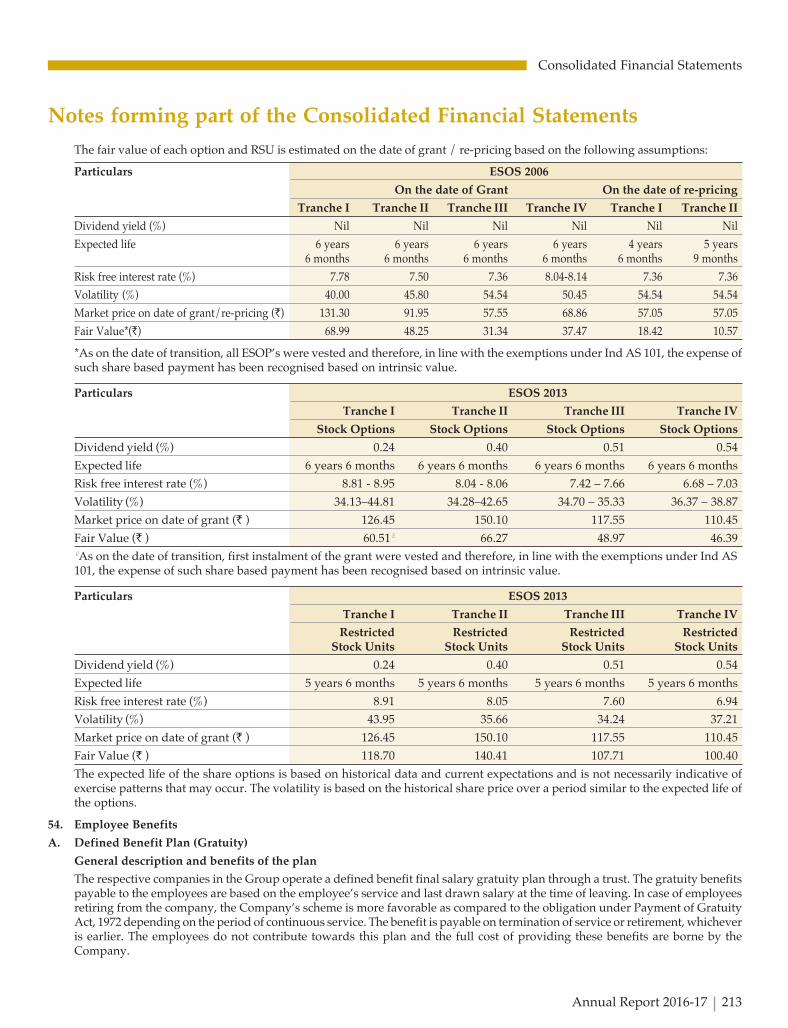
C K
Annual Report 2016-17 213
Consolidated Financial Statements
The fair value of each option and RSU is estimated on the date of grant / re-pricing based on the following assumptions:
Particulars ESOS 2006
On the date of Grant On the date of re-pricing
Tranche I Tranche II Tranche III Tranche IV Tranche I Tranche II
Dividend yield (%) Nil Nil Nil Nil Nil Nil
Expected life 6 years 6 years 6 years 6 years 4 years 5 years6 months 6 months 6 months 6 months 6 months 9 months
Risk free interest rate (%) 7.78 7.50 7.36 8.04-8.14 7.36 7.36
Volatility (%) 40.00 45.80 54.54 50.45 54.54 54.54
Market price on date of grant/re-pricing (`) 131.30 91.95 57.55 68.86 57.05 57.05
Fair Value*(`) 68.99 48.25 31.34 37.47 18.42 10.57
*As on the date of transition, all ESOP’s were vested and therefore, in line with the exemptions under Ind AS 101, the expense ofsuch share based payment has been recognised based on intrinsic value.
Particulars ESOS 2013
Tranche I Tranche II Tranche III Tranche IV
Stock Options Stock Options Stock Options Stock Options
Dividend yield (%) 0.24 0.40 0.51 0.54
Expected life 6 years 6 months 6 years 6 months 6 years 6 months 6 years 6 months
Risk free interest rate (%) 8.81 - 8.95 8.04 - 8.06 7.42 – 7.66 6.68 – 7.03
Volatility (%) 34.13–44.81 34.28–42.65 34.70 – 35.33 36.37 – 38.87
Market price on date of grant (` ) 126.45 150.10 117.55 110.45
Fair Value (` ) 60.51# 66.27 48.97 46.39#As on the date of transition, first instalment of the grant were vested and therefore, in line with the exemptions under Ind AS101, the expense of such share based payment has been recognised based on intrinsic value.
Particulars ESOS 2013
Tranche I Tranche II Tranche III Tranche IV
Restricted Restricted Restricted RestrictedStock Units Stock Units Stock Units Stock Units
Dividend yield (%) 0.24 0.40 0.51 0.54
Expected life 5 years 6 months 5 years 6 months 5 years 6 months 5 years 6 months
Risk free interest rate (%) 8.91 8.05 7.60 6.94
Volatility (%) 43.95 35.66 34.24 37.21
Market price on date of grant (` ) 126.45 150.10 117.55 110.45
Fair Value (` ) 118.70 140.41 107.71 100.40
The expected life of the share options is based on historical data and current expectations and is not necessarily indicative ofexercise patterns that may occur. The volatility is based on the historical share price over a period similar to the expected life ofthe options.
54. Employee Benefits
A. Defined Benefit Plan (Gratuity)
General description and benefits of the plan
The respective companies in the Group operate a defined benefit final salary gratuity plan through a trust. The gratuity benefitspayable to the employees are based on the employee’s service and last drawn salary at the time of leaving. In case of employeesretiring from the company, the Company’s scheme is more favorable as compared to the obligation under Payment of GratuityAct, 1972 depending on the period of continuous service. The benefit is payable on termination of service or retirement, whicheveris earlier. The employees do not contribute towards this plan and the full cost of providing these benefits are borne by theCompany.
Notes forming part of the Consolidated Financial Statements

C K
214 Idea Cellular Limited
Consolidated Financial Statements
Regulatory framework, funding arrangement and governance of the Plan
The gratuity plan is governed by the Payment of Gratuity Act, 1972 (Gratuity Act). The trustees of the gratuity fund have afiduciary responsibility to act according to the provisions of the trust deed and rules. Since the fund is income tax approved, theCompany and the trustees have to ensure that they are at all times fully compliant with the relevant provisions of the income taxact and rules. The Company is bound to pay the statutory minimum gratuity as prescribed under Gratuity Act. There are nominimum funding requirements for a gratuity plan in India. The Company’s philosophy is to fund the benefits based on its ownliquidity and tax position as well as level of underfunding of the plan vis-à-vis settlements. The trustees of the trust are responsiblefor the overall governance of the plan. The trustees of the plan have outsourced the investment management of the fund toinsurance companies which in turn manage these funds as per the mandate provided to them by the trustees and applicableinsurance and other regulations.
Inherent risks
The plan is of a final salary defined benefit in nature which is sponsored by the Company and hence it underwrites all the riskspertaining to the plan. In particular, there is a risk for the Company that any significant change in salary growth or demographicexperience or inadequate returns on underlying plan assets can result in an increase in cost of providing these benefits toemployees in future.
The following tables summarize the components of net benefit expense recognised in the Consolidated Statement of Profit andLoss and the funded status and amounts recognised in the Consolidated Balance Sheet for gratuity:
` Mn
Particulars As at As at As atMarch 31, 2017 March 31, 2016 April 01, 2015
Amount recognised in Balance Sheet
Present value of obligations as at the end of the year 2,400.25 1,968.28 1,476.06
Fair value of plan assets as at the end of the year 826.14 425.55 238.97
Net Funded Obligation 1,574.11 1,542.73 1,237.09
Net Asset/(Liability) recognised in Balance Sheet (1,574.11) (1,542.73) (1,237.09)
Net Asset/(Liability) recognised in Balance Sheet is bifurcated as
- Other non-financial asset 0.80 0.18 0.12
- Long term provision (1,574.91) (1,542.91) (1,237.21)
` Mn
Sr. Particulars For the year ended For the year endedNo. March 31, 2017 March 31, 2016
1 Reconciliation of Net Defined Benefit Obligation
Opening Net Defined Benefit liability/(asset) 1,542.73 1,237.09
Expense charged to the Statement of Profit & Loss 427.93 326.52
Expense charged to OCI 56.82 200.05
Employer contributions (423.56) (220.93)
Liabilities assumed / (settled)* (29.81) -
Closing Net Defined Benefit liability/(asset) 1,574.11 1,542.73
2 Reconciliation of Defined Benefit Obligation
Opening Defined Benefit Obligation 1,968.28 1,476.06
Current Service cost 307.84 229.09
Interest on Defined Benefit Obligation 157.94 115.29
Actuarial (Gain)/Loss arising from change in financial assumptions 295.86 225.94
Actuarial (Gain)/Loss arising from change in demographic assumption 0.19 -
Actuarial (Gain)/Loss arising on account of experience changes (237.57) (14.24)
Benefits paid (62.48) (63.86)
Liabilities assumed / (settled)* (29.81) -
Closing of Defined Benefit Obligation 2,400.25 1,968.28
Notes forming part of the Consolidated Financial Statements

C K
Annual Report 2016-17 215
Consolidated Financial Statements
` Mn
Sr. Particulars For the year ended For the year endedNo. March 31, 2017 March 31, 2016
3 Reconciliation of plan assets
Opening fair value of plan assets 425.55 238.97
Employer contributions 423.56 220.93
Interest on plan assets 37.85 17.86
Re measurements due to- - -
- Actual return on plan assets less interest on plan assets 1.66 11.65
Benefits paid (62.48) (63.86)
Closing fair value of plan assets 826.14 425.55
*On account of inter group transfer.
Amounts recognised in Statements of Profit and Loss in respect of these defined benefit plans are as follows: ` Mn
Sr. Particulars For the year ended For the year endedNo. March 31, 2017 March 31, 2016
1 Expenses Recognised in the Statement of Profit & Loss
Current Service cost 307.84 229.09
Interest on Net Defined Benefit liability/(asset) 120.09 97.43
Expenses recognised in the Statement of Profit & Loss 427.93 326.52
2 Amount recorded as Other Comprehensive Income (OCI)
Re measurement during the year due to
- Changes in financial assumptions 295.86 225.94
- Experience adjustments (237.38) (14.24)
- Return on plan assets (excluding amounts included in net interest expense) (1.66) (11.65)
Amount recognised in OCI 56.82 200.05
The principal assumptions used in determining gratuity obligations are shown below:
Particulars For the year ended For the year endedMarch 31, 2017 March 31, 2016
Discount rate 7.10% 8.10%
Future salary increases* 8.00% 8.00%
Mortality rate during employment As per Indian Assured Lives Mortality(2006-08) Ult Table
Rate of Employee Turnover
Age(Years) – 21-30 5 -12%
31-40 3-12%
41and above 2-12%
Disability Leaving service due to disability is included in theprovision made for all causes of leaving service.
*The estimates of future salary increase considered takes into account inflation, seniority, promotion and other relevant factors.
A quantitative sensitivity analysis for significant assumptions on the defined benefit obligation is as below:
Particulars For the year ended For the year endedMarch 31, 2017 March 31, 2016
Discount Salary Discount SalaryRate escalation Rate Rate escalation Rate
Impact of increase in 50 bps on DBO (8.04)% 5.36% (6.55)% 7.14%
Impact of decrease in 50 bps on DBO 5.46% (8.01)% 7.18% (6.57)%
The sensitivity analysis above have been determined based on a method that extrapolates the impact on defined benefit obligationas a result of reasonable changes in key assumptions occurring at the end of the reporting period.
Notes forming part of the Consolidated Financial Statements

C K
216 Idea Cellular Limited
Consolidated Financial Statements
The following payments are expected contributions to the defined benefit plan in future years:
` Mn
Particulars For the year ended For the year endedMarch 31, 2017 March 31, 2016
Within the next 12 months 158.00 153.76
Disaggregation details of plan assets (% allocation):
` Mn
Particulars For the year ended For the year endedMarch 31, 2017 March 31, 2016
Insurer Managed Funds * 826.15 425.56
*The funds are managed by Insurers and they do not provide breakup of plan assets by investment type.
Projected plan cash flow:
The table below shows the expected cash flow profile of the benefits to be paid to the current membership of the plan basedon past service of the employees as at the valuation date.
` Mn
Maturity Profile For the year ended For the year endedMarch 31, 2017 March 31, 2016
Expected benefits for year 1 92.88 76.04
Expected benefits for year 2 73.69 48.61
Expected benefits for year 3 78.87 72.04
Expected benefits for year 4 82.42 75.81
Expected benefits for year 5 and above 7,089.90 7,140.47
The average duration of the defined benefit plan obligation at the end of the reporting period is 12.92 – 19.53 years (March 31,2016: 11.86 - 13.80 years).
B. Defined contribution plans:
During the year, the Company has recognised the following amounts in the statement of profit and loss:
` Mn
Particulars For the year ended For the year endedMarch 31, 2017 March 31, 2016
Employers’ contribution to provident and pension fund 536.43 474.68
Employers’ contribution to superannuation fund 95.42 77.65
C. The Company operates its gratuity and superannuation plans through separate trusts which is administered and managed bythe Trustees. As on March 31, 2017 and March 31, 2016, the contributions towards the plans have been invested in InsurerManaged Funds.
55. Auditor’s Remuneration
` Mn
Particulars For the year ended For the year endedMarch 31, 2017 March 31, 2016
Statutory Audit Fees 47.20 46.95
Certification and Other services (included in Legal and Professional Charges) 22.90* 14.05
Out of pocket expenses (included in Misc. Expenses) 0.99 0.71
Total Remuneration 71.09 61.71
*includes ` 5 Mn. payment to an affiliate firm of statutory auditors
Notes forming part of the Consolidated Financial Statements
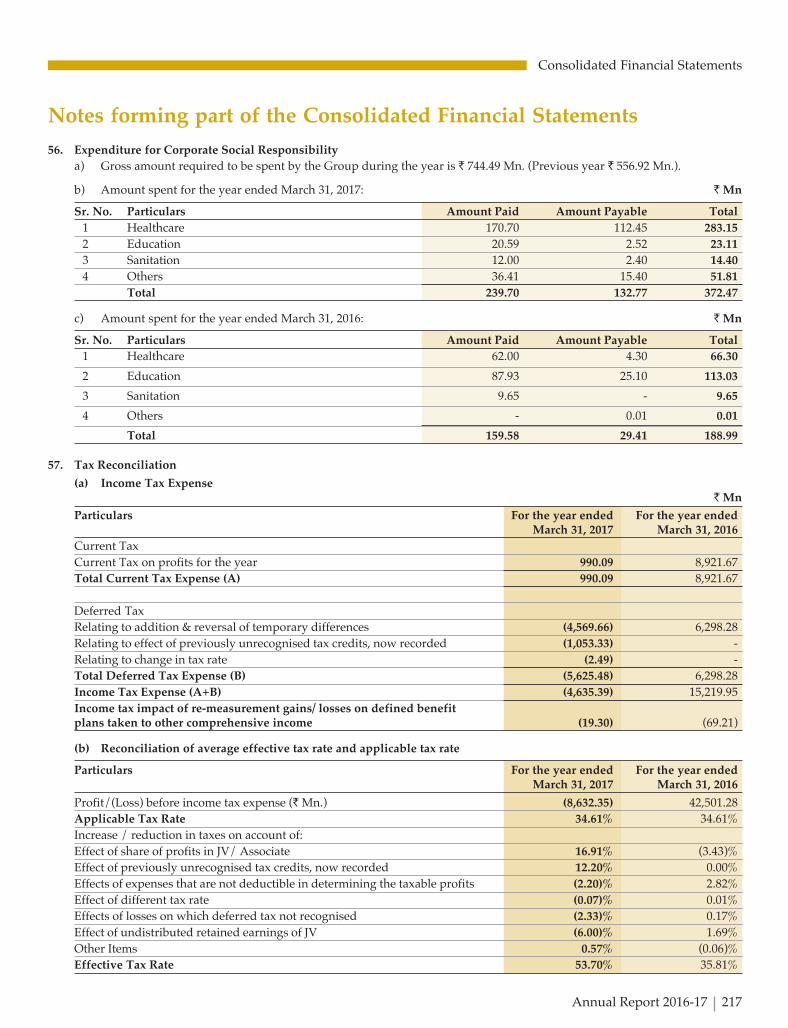
C K
Annual Report 2016-17 217
Consolidated Financial Statements
56. Expenditure for Corporate Social Responsibility
a) Gross amount required to be spent by the Group during the year is ` 744.49 Mn. (Previous year ` 556.92 Mn.).
b) Amount spent for the year ended March 31, 2017: ` Mn
Sr. No. Particulars Amount Paid Amount Payable Total
1 Healthcare 170.70 112.45 283.15
2 Education 20.59 2.52 23.11
3 Sanitation 12.00 2.40 14.40
4 Others 36.41 15.40 51.81
Total 239.70 132.77 372.47
c) Amount spent for the year ended March 31, 2016: ` Mn
Sr. No. Particulars Amount Paid Amount Payable Total
1 Healthcare 62.00 4.30 66.30
2 Education 87.93 25.10 113.03
3 Sanitation 9.65 - 9.65
4 Others - 0.01 0.01
Total 159.58 29.41 188.99
57. Tax Reconciliation
(a) Income Tax Expense` Mn
Particulars For the year ended For the year endedMarch 31, 2017 March 31, 2016
Current Tax
Current Tax on profits for the year 990.09 8,921.67
Total Current Tax Expense (A) 990.09 8,921.67
Deferred Tax
Relating to addition & reversal of temporary differences (4,569.66) 6,298.28
Relating to effect of previously unrecognised tax credits, now recorded (1,053.33) -
Relating to change in tax rate (2.49) -
Total Deferred Tax Expense (B) (5,625.48) 6,298.28
Income Tax Expense (A+B) (4,635.39) 15,219.95
Income tax impact of re-measurement gains/ losses on defined benefitplans taken to other comprehensive income (19.30) (69.21)
(b) Reconciliation of average effective tax rate and applicable tax rate
Particulars For the year ended For the year endedMarch 31, 2017 March 31, 2016
Profit/(Loss) before income tax expense (` Mn.) (8,632.35) 42,501.28
Applicable Tax Rate 34.61% 34.61%
Increase / reduction in taxes on account of:
Effect of share of profits in JV/ Associate 16.91% (3.43)%
Effect of previously unrecognised tax credits, now recorded 12.20% 0.00%
Effects of expenses that are not deductible in determining the taxable profits (2.20)% 2.82%
Effect of different tax rate (0.07)% 0.01%
Effects of losses on which deferred tax not recognised (2.33)% 0.17%
Effect of undistributed retained earnings of JV (6.00)% 1.69%
Other Items 0.57% (0.06)%
Effective Tax Rate 53.70% 35.81%
Notes forming part of the Consolidated Financial Statements
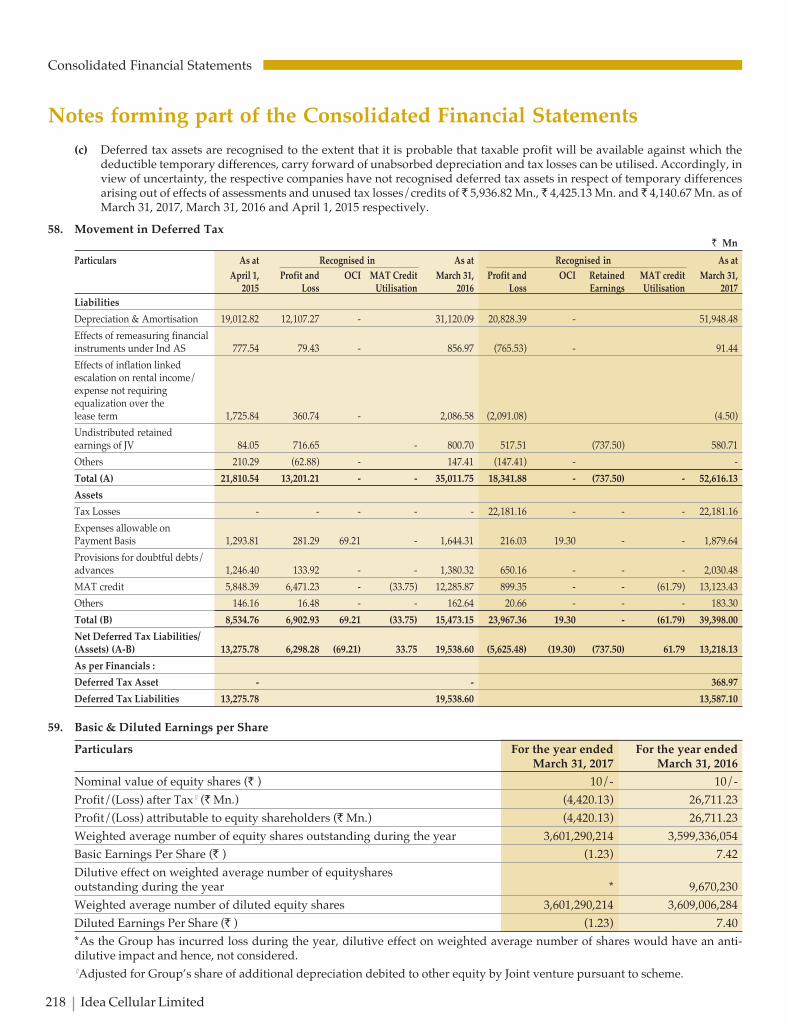
C K
218 Idea Cellular Limited
Consolidated Financial Statements
Notes forming part of the Consolidated Financial Statements
(c) Deferred tax assets are recognised to the extent that it is probable that taxable profit will be available against which thedeductible temporary differences, carry forward of unabsorbed depreciation and tax losses can be utilised. Accordingly, inview of uncertainty, the respective companies have not recognised deferred tax assets in respect of temporary differencesarising out of effects of assessments and unused tax losses/credits of ̀ 5,936.82 Mn., ` 4,425.13 Mn. and ` 4,140.67 Mn. as ofMarch 31, 2017, March 31, 2016 and April 1, 2015 respectively.
58. Movement in Deferred Tax` Mn
Particulars As at Recognised in As at Recognised in As at
April 1, Profit and OCI MAT Credit March 31, Profit and OCI Retained MAT credit March 31,2015 Loss Utilisation 2016 Loss Earnings Utilisation 2017
Liabilities
Depreciation & Amortisation 19,012.82 12,107.27 - 31,120.09 20,828.39 - 51,948.48
Effects of remeasuring financialinstruments under Ind AS 777.54 79.43 - 856.97 (765.53) - 91.44
Effects of inflation linkedescalation on rental income/expense not requiringequalization over thelease term 1,725.84 360.74 - 2,086.58 (2,091.08) (4.50)
Undistributed retainedearnings of JV 84.05 716.65 - 800.70 517.51 (737.50) 580.71
Others 210.29 (62.88) - 147.41 (147.41) - -
Total (A) 21,810.54 13,201.21 - - 35,011.75 18,341.88 - (737.50) - 52,616.13
Assets
Tax Losses - - - - - 22,181.16 - - - 22,181.16
Expenses allowable onPayment Basis 1,293.81 281.29 69.21 - 1,644.31 216.03 19.30 - - 1,879.64
Provisions for doubtful debts/advances 1,246.40 133.92 - - 1,380.32 650.16 - - - 2,030.48
MAT credit 5,848.39 6,471.23 - (33.75) 12,285.87 899.35 - - (61.79) 13,123.43
Others 146.16 16.48 - - 162.64 20.66 - - - 183.30
Total (B) 8,534.76 6,902.93 69.21 (33.75) 15,473.15 23,967.36 19.30 - (61.79) 39,398.00
Net Deferred Tax Liabilities/(Assets) (A-B) 13,275.78 6,298.28 (69.21) 33.75 19,538.60 (5,625.48) (19.30) (737.50) 61.79 13,218.13
As per Financials :
Deferred Tax Asset - - 368.97
Deferred Tax Liabilities 13,275.78 19,538.60 13,587.10
59. Basic & Diluted Earnings per Share
Particulars For the year ended For the year endedMarch 31, 2017 March 31, 2016
Nominal value of equity shares (` ) 10/- 10/-
Profit/(Loss) after Tax# (` Mn.) (4,420.13) 26,711.23
Profit/(Loss) attributable to equity shareholders (` Mn.) (4,420.13) 26,711.23
Weighted average number of equity shares outstanding during the year 3,601,290,214 3,599,336,054
Basic Earnings Per Share (` ) (1.23) 7.42
Dilutive effect on weighted average number of equitysharesoutstanding during the year * 9,670,230
Weighted average number of diluted equity shares 3,601,290,214 3,609,006,284
Diluted Earnings Per Share (` ) (1.23) 7.40
*As the Group has incurred loss during the year, dilutive effect on weighted average number of shares would have an anti-dilutive impact and hence, not considered.#Adjusted for Group’s share of additional depreciation debited to other equity by Joint venture pursuant to scheme.
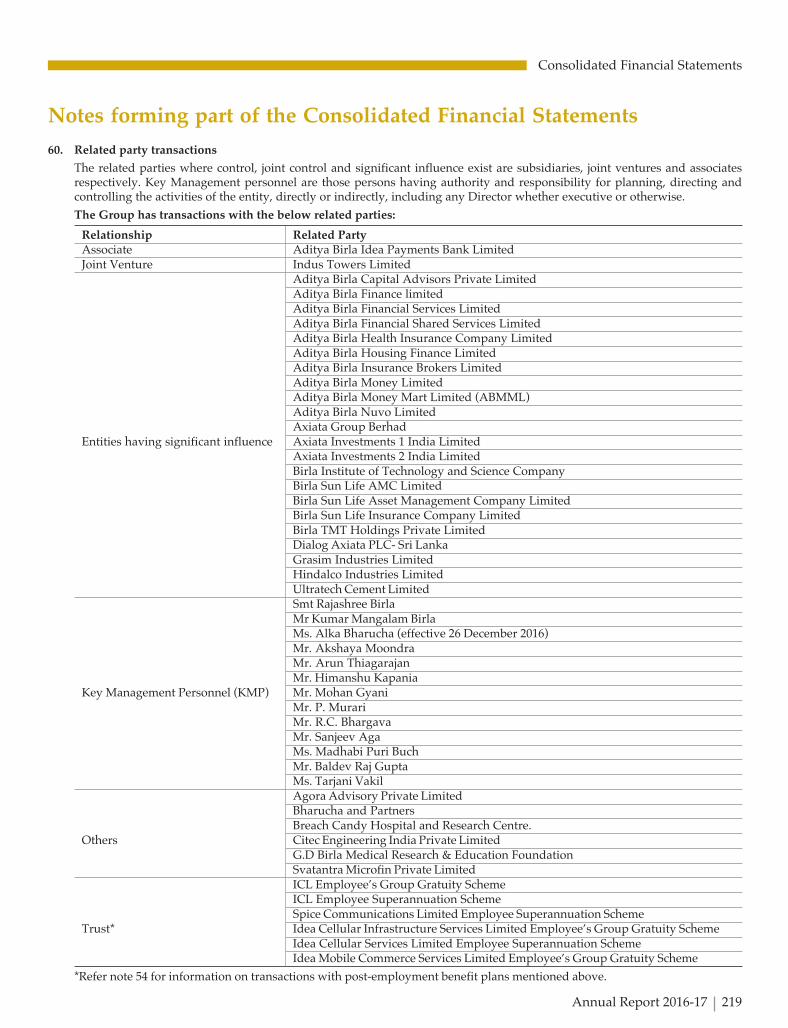
C K
Annual Report 2016-17 219
Consolidated Financial Statements
60. Related party transactions
The related parties where control, joint control and significant influence exist are subsidiaries, joint ventures and associatesrespectively. Key Management personnel are those persons having authority and responsibility for planning, directing andcontrolling the activities of the entity, directly or indirectly, including any Director whether executive or otherwise.
The Group has transactions with the below related parties:
Relationship Related PartyAssociate Aditya Birla Idea Payments Bank LimitedJoint Venture Indus Towers Limited
Aditya Birla Capital Advisors Private LimitedAditya Birla Finance limitedAditya Birla Financial Services LimitedAditya Birla Financial Shared Services LimitedAditya Birla Health Insurance Company LimitedAditya Birla Housing Finance LimitedAditya Birla Insurance Brokers LimitedAditya Birla Money LimitedAditya Birla Money Mart Limited (ABMML)Aditya Birla Nuvo LimitedAxiata Group Berhad
Entities having significant influence Axiata Investments 1 India LimitedAxiata Investments 2 India LimitedBirla Institute of Technology and Science CompanyBirla Sun Life AMC LimitedBirla Sun Life Asset Management Company LimitedBirla Sun Life Insurance Company LimitedBirla TMT Holdings Private LimitedDialog Axiata PLC- Sri LankaGrasim Industries LimitedHindalco Industries LimitedUltratech Cement LimitedSmt Rajashree BirlaMr Kumar Mangalam BirlaMs. Alka Bharucha (effective 26 December 2016)Mr. Akshaya MoondraMr. Arun ThiagarajanMr. Himanshu Kapania
Key Management Personnel (KMP) Mr. Mohan GyaniMr. P. MurariMr. R.C. BhargavaMr. Sanjeev AgaMs. Madhabi Puri BuchMr. Baldev Raj GuptaMs. Tarjani VakilAgora Advisory Private LimitedBharucha and PartnersBreach Candy Hospital and Research Centre.
Others Citec Engineering India Private LimitedG.D Birla Medical Research & Education FoundationSvatantra Microfin Private LimitedICL Employee’s Group Gratuity SchemeICL Employee Superannuation SchemeSpice Communications Limited Employee Superannuation Scheme
Trust* Idea Cellular Infrastructure Services Limited Employee’s Group Gratuity SchemeIdea Cellular Services Limited Employee Superannuation SchemeIdea Mobile Commerce Services Limited Employee’s Group Gratuity Scheme
*Refer note 54 for information on transactions with post-employment benefit plans mentioned above.
Notes forming part of the Consolidated Financial Statements

C K
220 Idea Cellular Limited
Consolidated Financial Statements
A. Transactions with Related Parties for the year ended March 31, 2017 and March 31, 2016` Mn
Particulars Entitieshaving Joint
Associate significant Venture KMP Othersinfluence
Sale of service 0.16 167.26 10.00 0.05 1.38(-) (156.93) (4.77) (0.07) (0.60)
Purchase of service 170.81 40,615.45 23.79(70.43) (35,830.12) (-)
Remuneration* 138.54(119.74)
Non-Compete Fee 15.00(15.00)
Director’s Commission and sitting fees 1.66 153.06(1.78) (152.02)
Interest on NCD 9.45(9.45)
Expense incurred on behalf of - 0.52 - 0.01(14.38) (0.84) (0.00) (0.17)
Dividend paid on equity shares 1,339.47 0.59(1,339.47) (0.54)
Investments 173.71#
(2.45)
Sale of Fixed Assets 8.99(-)
Towards insurance including advance given 385.71(0.15)
Contribution towards Gratuity 200.00(-)
Contribution towards CSR 160.00(-)
(Figures in bracket are for the year ended March 31, 2016)*excludes charge taken towards share based payments.# Includes advance given for purchase of shares.
B. Balances with Related Parties:
i. As at March 31, 2017` Mn
EntitiesParticulars Associate having JV KMP Others
significantinfluence
Trade and Other Receivables 0.14 8.29 0.16 - 0.33
Trade and Other Payables 20.17 2.34 5,909.88 - 109.94
Security Deposit - - 1,000.00 - -
Other financial and non- financial asset - 39.38 - - -
9.45% NCD - 100.00 - - -
Interest Accrued but not due - 3.92 - - -
Remuneration payable - - - 45.08 -
Notes forming part of the Consolidated Financial Statements

C K
Annual Report 2016-17 221
Consolidated Financial Statements
ii. As at March 31, 2016` Mn
EntitiesParticulars Associate having JV KMP Others
significantinfluence
Trade and Other Receivables 14.38 7.54 - - 0.14
Trade and Other Payables - 17.66 3,682.95 1.25 0.18
Security Deposit - - 1,000.00 - -
Other financial and non- financial asset - 8.20 - - -
9.45% NCD - 100.00 - - -
Interest Accrued but not due - 3.92 - - -
Remuneration payable - - - 50.71 -
iii. As at April 1, 2015` Mn
EntitiesParticulars Associate having JV KMP Others
significantinfluence
Trade and Other Receivables - 13.46 - - 0.12
Trade and Other Payables - 0.82 2,969.93 - -
Security Deposit - - 1,000.00 - -
Other financial and non- financial asset - 3.71 - - -
Advance taken - - - - -
9.45% NCD - 100.00 - - -
Interest Accrued but not due - 3.91 - - -
Remuneration payable - - - 63.57 -
Outstanding balances at year end are unsecured and considered good.
C. Commitments with related parties: The group has lease commitments towards its joint venture amounting to ` 125,969.39 Mn.(Previous year: ` 130,659.67 Mn., Transition date : ` 130,238.99 Mn.)
D. Compensation of Key Management Personnel of the Company:` Mn
Particulars March 31, 2017 March 31, 2016
Short-term employee benefits 135.79 117.27
Post-employment benefits* 2.75 2.47
Share-based payment transactions 41.96 60.65
*represents contribution to provident and superannuation funds. As Gratuity expense is based on actuarial valuations, the samecannot be computed for individual employees and hence not included.
61. The Company is one of the members of Aditya Birla Management Corporation Private Limited, a Company limited by guarantee,which has been formed to provide common pool of facilities and resources to its members with a view to optimise the benefits ofspecialisation and minimize cost to each member. The Company’s share of expenses incurred under the common pool has beenaccounted for at actuals in the respective heads in the Statement of Profit & Loss.
Notes forming part of the Consolidated Financial Statements
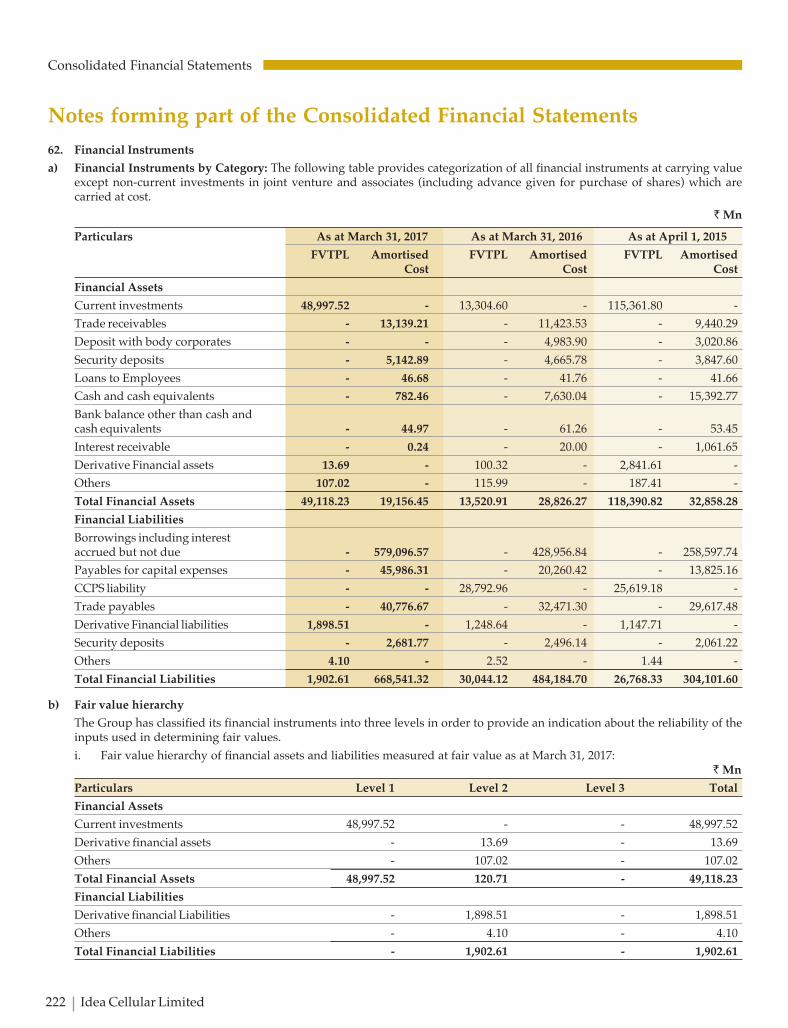
C K
222 Idea Cellular Limited
Consolidated Financial Statements
62. Financial Instruments
a) Financial Instruments by Category: The following table provides categorization of all financial instruments at carrying valueexcept non-current investments in joint venture and associates (including advance given for purchase of shares) which arecarried at cost.
` Mn
Particulars As at March 31, 2017 As at March 31, 2016 As at April 1, 2015
FVTPL Amortised FVTPL Amortised FVTPL AmortisedCost Cost Cost
Financial Assets
Current investments 48,997.52 - 13,304.60 - 115,361.80 -
Trade receivables - 13,139.21 - 11,423.53 - 9,440.29
Deposit with body corporates - - - 4,983.90 - 3,020.86
Security deposits - 5,142.89 - 4,665.78 - 3,847.60
Loans to Employees - 46.68 - 41.76 - 41.66
Cash and cash equivalents - 782.46 - 7,630.04 - 15,392.77
Bank balance other than cash andcash equivalents - 44.97 - 61.26 - 53.45
Interest receivable - 0.24 - 20.00 - 1,061.65
Derivative Financial assets 13.69 - 100.32 - 2,841.61 -
Others 107.02 - 115.99 - 187.41 -
Total Financial Assets 49,118.23 19,156.45 13,520.91 28,826.27 118,390.82 32,858.28
Financial Liabilities
Borrowings including interestaccrued but not due - 579,096.57 - 428,956.84 - 258,597.74
Payables for capital expenses - 45,986.31 - 20,260.42 - 13,825.16
CCPS liability - - 28,792.96 - 25,619.18 -
Trade payables - 40,776.67 - 32,471.30 - 29,617.48
Derivative Financial liabilities 1,898.51 - 1,248.64 - 1,147.71 -
Security deposits - 2,681.77 - 2,496.14 - 2,061.22
Others 4.10 - 2.52 - 1.44 -
Total Financial Liabilities 1,902.61 668,541.32 30,044.12 484,184.70 26,768.33 304,101.60
b) Fair value hierarchy
The Group has classified its financial instruments into three levels in order to provide an indication about the reliability of theinputs used in determining fair values.
i. Fair value hierarchy of financial assets and liabilities measured at fair value as at March 31, 2017:` Mn
Particulars Level 1 Level 2 Level 3 Total
Financial Assets
Current investments 48,997.52 - - 48,997.52
Derivative financial assets - 13.69 - 13.69
Others - 107.02 - 107.02
Total Financial Assets 48,997.52 120.71 - 49,118.23
Financial Liabilities
Derivative financial Liabilities - 1,898.51 - 1,898.51
Others - 4.10 - 4.10
Total Financial Liabilities - 1,902.61 - 1,902.61
Notes forming part of the Consolidated Financial Statements

C K
Annual Report 2016-17 223
Consolidated Financial Statements
ii. Fair value hierarchy of financial assets and liabilities measured at fair value as at March 31, 2016:` Mn
Particulars Level 1 Level 2 Level 3 Total
Financial Assets
Current investments 13,304.60 - - 13,304.60
Derivative financial assets - 100.32 - 100.32
Others - 115.99 - 115.99
Total Financial Assets 13,304.60 216.31 - 13,520.91
Financial Liabilities
CCPS liability - - 28,792.96 28,792.96
Derivative financial liabilities - 1,248.64 - 1,248.64
Others - 2.52 - 2.52
Total Financial Liabilities - 1,251.16 28,792.96 30,044.12
iii. Fair value hierarchy of financial assets and liabilities measured at fair value as at April 1, 2015:` Mn
Particulars Level 1 Level 2 Level 3 Total
Financial Assets
Current investments 115,361.80 - - 115,361.80
Derivative financial assets - 2,841.61 - 2,841.61
Others - 187.41 - 187.41
Total Financial Assets 115,361.80 3,029.02 - 118,390.82
Financial Liabilities
CCPS liability - - 25,619.18 25,619.18
Derivative financial liabilities - 1,147.71 - 1,147.71
Others - 1.44 - 1.44
Total Financial Liabilities - 1,149.15 25,619.18 26,768.33
iv. The carrying amounts of the following financial assets and financial liabilities are a reasonable approximation of their fairvalues. Accordingly, the fair values of such financial assets and financial liabilities have not been disclosed separately.
a) Financial Assets
- Trade receivables
- Security deposits and deposits with body corporates
- Loans to Employees
- Cash and cash equivalents
- Bank balances other than cash and cash equivalents
- Interest receivable
b) Financial Liabilities
- Trade payables
- Payable for capital expenditure
- Security deposits
v. Fair value hierarchy of financial liabilities measured at amortised cost is below:` Mn
Particulars Carrying Amount Level 1 Level 2 Level 3 Total
Fixed rate borrowings including interest accrued but not due* :
As at March 31, 2017 511,240.89 - 529,377.06 - 529,377.06
As at March 31, 2016 394,507.79 - 413,498.04 - 413,498.04
As at April 1, 2015 130,033.47 - 136,204.83 - 136,204.83
*Includes Deferred Payment Liability, NCD and others.
Notes forming part of the Consolidated Financial Statements
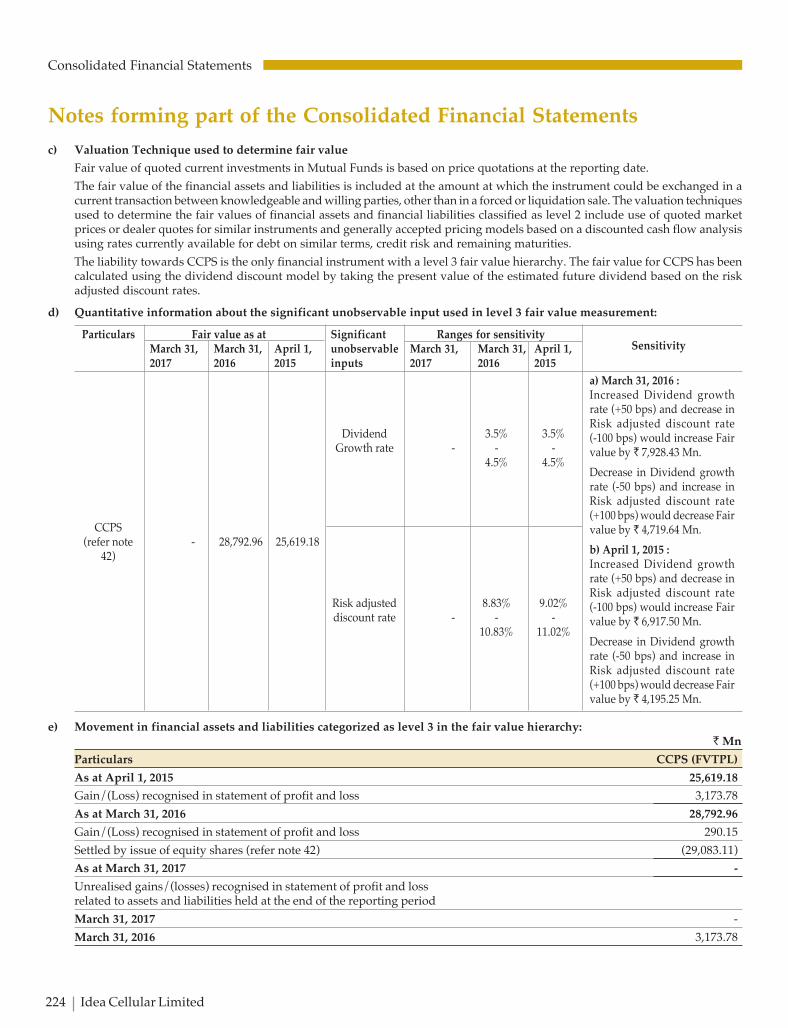
C K
224 Idea Cellular Limited
Consolidated Financial Statements
c) Valuation Technique used to determine fair value
Fair value of quoted current investments in Mutual Funds is based on price quotations at the reporting date.
The fair value of the financial assets and liabilities is included at the amount at which the instrument could be exchanged in acurrent transaction between knowledgeable and willing parties, other than in a forced or liquidation sale. The valuation techniquesused to determine the fair values of financial assets and financial liabilities classified as level 2 include use of quoted marketprices or dealer quotes for similar instruments and generally accepted pricing models based on a discounted cash flow analysisusing rates currently available for debt on similar terms, credit risk and remaining maturities.
The liability towards CCPS is the only financial instrument with a level 3 fair value hierarchy. The fair value for CCPS has beencalculated using the dividend discount model by taking the present value of the estimated future dividend based on the riskadjusted discount rates.
d) Quantitative information about the significant unobservable input used in level 3 fair value measurement:
Particulars Fair value as at Significant Ranges for sensitivitySensitivityMarch 31, March 31, April 1, unobservable March 31, March 31, April 1,
2017 2016 2015 inputs 2017 2016 2015
Dividend 3.5% 3.5%Growth rate - - -
4.5% 4.5%
CCPS(refer note - 28,792.96 25,619.18
42)
Risk adjusted 8.83% 9.02%discount rate - - -
10.83% 11.02%
e) Movement in financial assets and liabilities categorized as level 3 in the fair value hierarchy:` Mn
Particulars CCPS (FVTPL)
As at April 1, 2015 25,619.18
Gain/(Loss) recognised in statement of profit and loss 3,173.78
As at March 31, 2016 28,792.96
Gain/(Loss) recognised in statement of profit and loss 290.15
Settled by issue of equity shares (refer note 42) (29,083.11)
As at March 31, 2017 -
Unrealised gains/(losses) recognised in statement of profit and lossrelated to assets and liabilities held at the end of the reporting period
March 31, 2017 -
March 31, 2016 3,173.78
Notes forming part of the Consolidated Financial Statements
a) March 31, 2016 :Increased Dividend growthrate (+50 bps) and decrease inRisk adjusted discount rate(-100 bps) would increase Fairvalue by ` 7,928.43 Mn.
Decrease in Dividend growthrate (-50 bps) and increase inRisk adjusted discount rate(+100 bps) would decrease Fairvalue by ` 4,719.64 Mn.
b) April 1, 2015 :Increased Dividend growthrate (+50 bps) and decrease inRisk adjusted discount rate(-100 bps) would increase Fairvalue by ` 6,917.50 Mn.
Decrease in Dividend growthrate (-50 bps) and increase inRisk adjusted discount rate(+100 bps) would decrease Fairvalue by ` 4,195.25 Mn.

C K
Annual Report 2016-17 225
Consolidated Financial Statements
63. Financial risk management objectives and policies
The Group’s principal financial liabilities comprise loans and borrowings, trade and other payables. The main purpose of thesefinancial liabilities is to finance and support the Group’s operations. The Group’s principal financial assets comprise investments,cash and bank balance, trade and other receivables. The Group also enters into derivative transactions such as foreign forwardexchange contracts, Interest rate swaps as a part of Group’s financial risk management policies. It is the Group’s policy that notrading in derivatives for speculative purposes may be undertaken.
The Group is exposed to various financial risks such as market risk, credit risk and liquidity risk. A team of qualified financeprofessionals with appropriate skills and experience provides assurance to the management that financial risks are identified,measured and managed in accordance with the Group’s policies and risk objectives.
Market risk
Market risk is the risk that the fair value of future cash flows of a financial instrument will fluctuate because of changes inmarket prices. Market risk comprises three types of risk: interest rate risk, currency risk and other price risk, such as equity pricerisk. Financial instruments affected by market risk include borrowings, bank deposits, investments and derivative financialinstruments.
The sensitivity analysis as shown below relates to the position as at March 31, 2017 and March 31, 2016.
The sensitivity of the relevant profit or loss item is the effect of the assumed changes in respective market risks. This is based onthe financial assets and financial liabilities held at March 31, 2017 and March 31, 2016.
a) Interest rate risk
Interest rate risk is the risk that the fair value or future cash flows of a financial instrument will fluctuate because of changes inmarket interest rates. The Company’s exposure to the risk of changes in market interest rates relates primarily to the Company’slong-term debt obligations with floating interest rates.
The Company manages its interest rate risk by having a balanced portfolio of fixed and variable rate loans and borrowings. Tomanage this, the Company enters into interest rate swaps, in which it agrees to exchange, at specified intervals, the differencebetween fixed and variable rate interest amounts calculated by reference to an agreed-upon notional principal amount. AtMarch 31, 2017, after taking into account the effect of interest rate swaps, approximately 88.06% of the Company’s borrowingsare at a fixed rate of interest (Previous year: 92.62%, Transition date: 51.59%).
Interest rate sensitivity
The following table demonstrates the sensitivity to a reasonably possible change in interest rates on that portion of loans andborrowings affected, after the impact of hedge accounting. With all other variables held constant, the Company’s profit beforetax is affected through the impact on floating rate borrowings, as follows:
` Mn
Particulars Increase/decrease in basis points Effect on profit before tax
March 31, 2017
INR - Borrowings+100 (480.00)
- 100 480.00
USD - Borrowings+100 (174.40)
- 100 174.40
March 31, 2016
INR - Borrowings+100 (100.25)
- 100 100.25
USD - Borrowings+100 (184.82)
- 100 184.82
The assumed movement in basis points for the interest rate sensitivity analysis is based on the currently observable marketenvironment.
b) Foreign currency risk
Foreign currency risk is the risk that the fair value or future cash flows of an exposure will fluctuate because of changes inforeign exchange rates. The Company’s exposure to the risk of changes in foreign exchange rates relates primarily to the Company’soperating activities (when revenue or expense is denominated in a foreign currency).
The Company’s foreign currency risks are identified, measured and managed at periodic intervals in accordance with theCompany’s policies.
Notes forming part of the Consolidated Financial Statements

C K
226 Idea Cellular Limited
Consolidated Financial Statements
When a derivative is entered into for the purpose of hedging any foreign currency exposure, the Company negotiates the termsof those derivatives to match the terms of the hedged exposure.
At March 31, 2017, the Company hedged 21.14% (Previous year: 34.91%, Transition date: 52.72%), of its foreign currency loans.This foreign currency risk is hedged by using foreign currency forward contracts.
Foreign currency sensitivity
The following tables demonstrate the sensitivity to a reasonably possible change in foreign currency rates, with all other variablesheld constant. The impact on the Company’s profit before tax is due to changes in the fair value of monetary assets and liabilitiesincluding non-designated foreign currency derivatives and embedded derivatives. The Company’s exposure to foreign currencychanges for all other currencies is not material.
` Mn
Currency exposure Change in currency exchange rate Effect on profit before tax
March 31, 2017
USD+5% (1,951.00)
- 5% 1,951.00
March 31, 2016
USD+5% (1,737.62)
- 5% 1,737.62
The derivatives have not been designated in a hedge relationship , they act as a hedge and will offset the underlying transactionswhen they occur.
c) Other Price risk
The Group invests its surplus funds in various debt instruments and debt mutual funds. These comprise of mainly liquidschemes of mutual funds (liquid investments) and fixed deposits.
Mutual fund investments are susceptible to market price risk, mainly arising from changes in the interest rates or market yieldswhich may impact the return and value of such investments. However due to the very short tenor of the underlying portfolio inthe liquid schemes, these do not pose any significant price risk.
On the duration investment balance, an increase/ decrease of 25 basis points in market yields (parallel shift of the yield curves),will result in decrease/increase in the marked to market value of the investments by ` Nil and ` 9.14 Mn. as on March 31, 2017and March 31, 2016 respectively.
d) Credit risk
Credit risk is the risk that counterparty will not meet its obligations under a financial instrument or customer contract, leading toa financial loss. The Group is exposed to credit risk from its operating activities (primarily trade and other receivables) and fromits financing activities, including deposits with banks, foreign exchange transactions and other financial instruments.
- Trade receivables
Customer credit risk is managed in accordance with the Company’s established policy, procedures and controls relating tocustomer credit risk management. Trade receivables are non-interest bearing and are generally on 15 to 30 days credit terms.Outstanding customer receivables are regularly monitored.
The Group follows a ‘simplified approach’ (i.e. based on lifetime ECL) for recognition of impairment loss allowance onTrade receivables (including lease receivables). For the purpose of measuring lifetime ECL allowance for trade receivables,the Group estimates irrecoverable amounts based on the ageing of the receivable balances and historical experience. Further,a large number of minor receivables are grouped into homogeneous groups and assessed for impairment collectively.Individual trade receivables are written off when management deems them not to be collectible.
- Other financial assets and cash deposits
Credit risk from balances with banks is managed by the Group’s treasury department. Investments of surplus funds aremade only with approved counterparties and within credit limits assigned to each counter party. Counterparty credit limitsare reviewed by the Group’s Treasury Department on an annual basis, and may be updated throughout the year. The limitsare set to minimise the concentration of risks and therefore mitigate financial loss through counterparty’s potential failure tomake payments.
The Group’s maximum exposure to credit risk for the components of the Balance Sheet as at March 31, 2017, March 31, 2016and April 01, 2015 on its carrying amounts as disclosed in notes 11, 16, 17 and 18.
Notes forming part of the Consolidated Financial Statements

C K
Annual Report 2016-17 227
Consolidated Financial Statements
e) Liquidity risk
Liquidity risk is the risk that the Group may not be able to meet its present and future cash and collateral obligations withoutincurring unacceptable losses. The Group’s objective is to, at all times maintain optimum levels of liquidity to meet its cash andcollateral requirements. The Group monitors its risk of a shortage of funds using a liquidity planning tool.
The Group’s objective is to maintain a balance between continuity of funding and flexibility through the use of bank overdrafts,bank loans and finance leases. Approximately 6.21% of the Group’s debt will mature in less than one year as at March 31, 2017(Previous year: 11.44%, Transition date: 38.45%) based on the carrying value of borrowings reflected in the financial statements.The Group has access to a sufficient variety of sources of funding and debt maturing within 12 months can be rolled over withexisting lenders.
The table below summarizes the maturity profile of the Group’s financial liabilities based on contractual undiscounted payments:
` Mn
Particulars Carrying Less than 1 1 to 5 > 5 TotalValue year years years payments
As at March 31, 2017
Borrowings and Interest thereon 579,096.57 63,031.82 377,908.16 470,531.22 911,471.20
Trade and other payables 86,762.98 86,719.63 43.35 - 86,762.98
Other financial liabilities 2,685.87 2,301.90 383.97 - 2,685.87
Derivatives 1,898.51 1,898.51 - - 1,898.51
Total 670,443.93 153,951.86 378,335.48 470,531.22 1,002,818.56
As at March 31, 2016
Borrowings and interest thereon 428,956.84 49,248.16 249,120.28 394,379.67 692,748.11
Trade and other payables 52,731.72 52,723.63 8.09 - 52,731.72
Other financial liabilities 2,498.66 2,129.59 369.07 - 2,498.66
Payable for CCPS 28,792.96 28,792.96 - - 28,792.96
Derivatives 1,248.64 497.75 750.89 - 1,248.64
Total 514,228.82 133,392.09 250,248.33 394,379.67 778,020.09
As at April 1, 2015
Borrowings and interest thereon 258,597.74 105,665.61 127,577.93 108,763.60 342,007.14
Trade and other payables 43,442.64 43,385.94 56.70 - 43,442.64
Other financial liabilities 2,062.66 2,015.73 46.93 - 2,062.66
Payable for CCPS 25,619.18 25,619.18 - - 25,619.18
Derivatives 1,147.71 45.19 1,102.52 - 1,147.71
Total 330,869.93 176,731.65 128,784.08 108,763.60 414,279.33
64. Capital management
For the purpose of the Group’s capital management, capital includes issued equity capital, share premium and all other equityreserves attributable to the equity holders. The primary objective of the Group’s capital management is to maximise the shareholdervalue.
The Group manages its capital structure and makes adjustments in light of changes in economic conditions and the requirementsof the financial covenants. To maintain or adjust the capital structure, the Group may adjust the dividend payment to shareholders,return capital to shareholders or issue new shares. The Group monitors capital using the debt-equity ratio, which is net debtdivided by total equity. The Group includes within net debt, interest bearing loans and borrowings less cash and cash equivalents,Bank balance other than cash and cash equivalents and investment in liquid mutual funds.
Notes forming part of the Consolidated Financial Statements

C K
228 Idea Cellular Limited
Consolidated Financial Statements
` Mn
Particulars As at As at As atMarch 31, 2017 March 31, 2016 April 1, 2015
Borrowings 516,725.37 375,496.20 159,504.76
Current maturities of long term debts 33,820.18 29,916.86 97,175.38
Less: Investment in liquid mutual funds (48,997.52) (13,304.60) (115,361.80)
Less: Cash and cash equivalents (782.46) (7,630.04) (15,392.77)
Less: Bank balance other than cash and cash equivalents (44.97) (61.26) (53.45)
Debt 500,720.60 384,417.16 125,872.12
Equity share capital 36,053.28 36,005.09 35,978.44
Other Equity 211,269.16 199,499.78 174,764.13
Total Equity 247,322.44 235,504.87 210,742.57
Debt Equity ratio 2.02 1.63 0.60
In order to achieve this overall objective, the Group’s capital management, amongst other things, aims to ensure that it meetsfinancial covenants attached to the interest-bearing loans and borrowings that define capital structure requirements. Breaches inmeeting the financial covenants would permit the bank to call the consequences attached with the same.
No changes were made in the objectives, policies or processes for managing capital during the years ended March 31, 2017 andMarch 31, 2016.
Notes forming part of the Consolidated Financial Statements
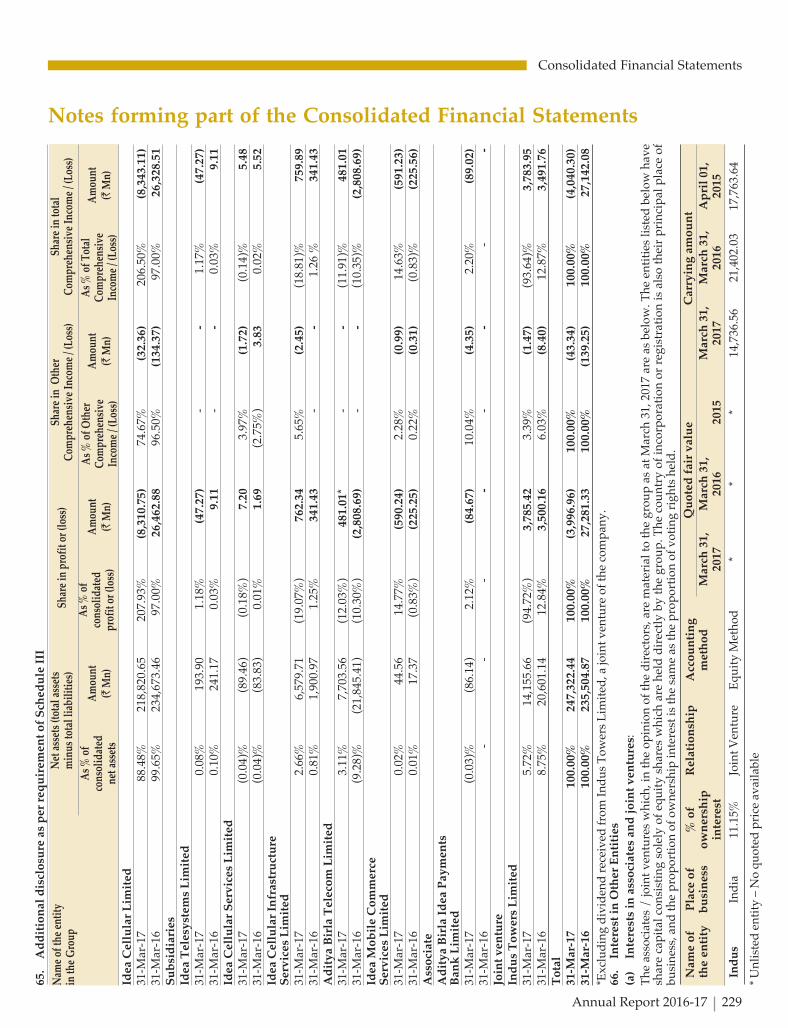
C K
Annual Report 2016-17 229
Consolidated Financial Statements
Notes forming part of the Consolidated Financial Statements
Net
ass
ets
(tot
al a
sset
sm
inus
tota
l lia
bili
ties
)Sh
are
in p
rofi
t or (
loss
)Sh
are
in O
ther
Com
preh
ensi
ve In
com
e / (
Loss
)Sh
are
in to
tal
Com
preh
ensi
ve In
com
e / (
Loss
)
As
% o
f Tot
alC
ompr
ehen
sive
Inco
me
/ (Lo
ss)
As
% o
fco
nsol
idat
edne
t ass
ets
Am
ount
(` M
n)A
mou
nt(`
Mn)
Am
ount
(` M
n)A
mou
nt(`
Mn)
As
% o
fco
nsol
idat
edpr
ofit
or (
loss
)
As
% o
f Oth
erC
ompr
ehen
sive
Inco
me
/ (Lo
ss)
65.
Ad
dit
ion
al d
iscl
osu
re a
s p
er r
equ
irem
ent
of
Sch
edu
le I
II
Nam
e of
the
enti
tyin
the
Gro
up
Idea
Cel
lula
r L
imit
ed31
-Mar
-17
88.4
8%21
8,82
0.65
207.
93%
(8,3
10.7
5)74
.67%
(32.
36)
206.
50%
(8,3
43.1
1)31
-Mar
-16
99.6
5%23
4,67
3.46
97.0
0%26
,462
.88
96.5
0%(1
34.3
7)97
.00%
26,3
28.5
1S
ub
sid
iari
esId
ea T
eles
yst
ems
Lim
ited
31-M
ar-1
70.
08%
193.
901.
18%
(47.
27)
--
1.17
%(4
7.27
)31
-Mar
-16
0.10
%24
1.17
0.03
%9.
11-
-0.
03%
9.11
Idea
Cel
lula
r S
erv
ices
Lim
ited
31-M
ar-1
7(0
.04)
%(8
9.46
)(0
.18%
)7.
203.
97%
(1.7
2)(0
.14)
%5.
4831
-Mar
-16
(0.0
4)%
(83.
83)
0.01
%1.
69(2
.75%
)3.
830.
02%
5.52
Idea
Cel
lula
r In
fras
tru
ctu
reS
erv
ices
Lim
ited
31-M
ar-1
72.
66%
6,57
9.71
(19.
07%
)76
2.34
5.65
%(2
.45)
(18.
81)%
759.
8931
-Mar
-16
0.81
%1,
900.
971.
25%
341.
43-
-1.
26 %
341.
43A
dit
ya
Bir
la T
elec
om
Lim
ited
31-M
ar-1
73.
11%
7,70
3.56
(12.
03%
)48
1.01
*-
-(1
1.91
)%48
1.01
31-M
ar-1
6(9
.28)
%(2
1,84
5.41
)(1
0.30
%)
(2,8
08.6
9)-
-(1
0.35
)%(2
,808
.69)
Idea
Mo
bil
e C
om
mer
ceS
erv
ices
Lim
ited
31-M
ar-1
70.
02%
44.5
614
.77%
(590
.24)
2.28
%(0
.99)
14.6
3%(5
91.2
3)31
-Mar
-16
0.01
%17
.37
(0.8
3%)
(225
.25)
0.22
%(0
.31)
(0.8
3)%
(225
.56)
Ass
oci
ate
Ad
ity
a B
irla
Id
ea P
aym
ents
Ban
k L
imit
ed31
-Mar
-17
(0.0
3)%
(86.
14)
2.12
%(8
4.67
)10
.04%
(4.3
5)2.
20%
(89.
02)
31-M
ar-1
6-
--
--
--
-Jo
int
ven
ture
Ind
us
To
wer
s L
imit
ed31
-Mar
-17
5.72
%14
,155
.66
(94.
72%
)3,
785.
423.
39%
(1.4
7)(9
3.64
)%3,
783.
9531
-Mar
-16
8.75
%20
,601
.14
12.8
4%3,
500.
166.
03%
(8.4
0)12
.87%
3,49
1.76
To
tal
31-M
ar-1
710
0.00
%24
7,32
2.44
100.
00%
(3,9
96.9
6)10
0.00
%(4
3.34
)10
0.00
%(4
,040
.30)
31-M
ar-1
610
0.00
%23
5,50
4.87
100.
00%
27,2
81.3
310
0.00
%(1
39.2
5)10
0.00
%27
,142
.08
*Exc
lud
ing
div
iden
d r
ecei
ved
fro
m I
nd
us
To
wer
s L
imit
ed, a
join
t v
entu
re o
f th
e co
mp
any
.66
.In
tere
st i
n O
ther
En
titi
es
(a)
Inte
rest
s in
ass
oci
ates
an
d j
oin
t v
entu
res:
Th
e as
soci
ates
/ jo
int
ven
ture
s w
hic
h, i
n t
he
op
inio
n o
f th
e d
irec
tors
, are
mat
eria
l to
th
e g
rou
p a
s at
Mar
ch 3
1, 2
017
are
as b
elo
w. T
he
enti
ties
lis
ted
bel
ow
hav
esh
are
cap
ital
co
nsi
stin
g s
ole
ly o
f eq
uit
y s
har
es w
hic
h a
re h
eld
dir
ectl
y b
y t
he
gro
up
. Th
e co
un
try
of
inco
rpo
rati
on
or
reg
istr
atio
n i
s al
so t
hei
r p
rin
cip
al p
lace
of
bu
sin
ess,
an
d t
he
pro
po
rtio
n o
f o
wn
ersh
ip i
nte
rest
is
the
sam
e as
th
e p
rop
ort
ion
of
vo
tin
g r
igh
ts h
eld
.
Nam
e o
fP
lace
of
% o
fR
elat
ion
ship
Acc
ou
nti
ng
Q
uo
ted
fai
r v
alu
e
Car
ryin
g a
mo
un
tth
e en
tity
bu
sin
ess
ow
ner
ship
met
ho
dM
arch
31,
Mar
ch 3
1,M
arch
31,
Mar
ch 3
1,A
pri
l 01
,in
tere
st20
1720
1620
1520
1720
1620
15
Ind
us
Ind
ia11
.15%
Join
t V
entu
reE
qu
ity
Met
ho
d*
**
14,7
36.5
621
,402
.03
17,7
63.6
4
* U
nli
sted
en
tity
– N
o q
uo
ted
pri
ce a
vai
lab
le

C K
230 Idea Cellular Limited
Consolidated Financial Statements
(b) Summarised financial information for associates and joint ventures:
The table below provide summarised financial information for the joint ventures and associates of the group. The informationdisclosed reflects the amounts presented in the financial statements of the relevant associates and joint ventures and not IdeaCellular Limited’s share of those amounts.
Summarised Balance Sheet:` Mn
Particulars Indus Towers Limited (Indus) ABIPBL
As at As at As at As atMarch 31, 2017 March 31, 2016 April 01, 2015 March 31, 2017
Equity
Equity share capital 1.19 1.19 1.19 1,365.65
Other equity 132,163.59 133,761.51 111,021.59 (267.54)
Total Equity 132,164.78 133,762.70 111,022.78 1,098.11
Liabilities
Long term borrowings 10,589.19 25,585.16 37,203.20 -
Other non-current Liabilities 18,144.97 16,045.21 14,768.78 224.33
Deferred tax liability 11,225.17 10,881.00 11,046.45 -
Short term borrowings 11,535.48 - 3,494.30 -
Other current liabilities 42,000.32 38,068.71 50,234.43 336.17
Total Liabilities 93,495.13 90,580.08 116,747.16 560.50
Assets
Net Block (including CWIP) 191,656.14 192,489.63 193,883.58 708.93
Other non-current assets 15,493.66 14,950.39 15,241.13 60.07
Current investments - 2,702.63 - 770.66
Other current assets 18,510.11 14,200.13 18,645.23 118.95
Total Assets 225,659.91 224,342.78 227,769.94 1,658.61
Summarized Statement of Profit and Loss:` Mn
Particulars Indus Towers Limited (Indus) ABIPBL
For the year ended For the year ended For the year endedMarch 31, 2017 March 31, 2016 March 31, 2017
Revenues from operations 175,279.82 161,694.55 -
Other income 1,682.88 1,773.27 28.05
Operating Costs 101,683.27 91,766.46 368.34
EBITDA 75,279.43 71,701.36 (340.29)
Finance costs 5,440.29 6,226.06 5.49
Depreciation & amortisation 26,115.43 25,442.08 6.28
Profit /(loss) before tax 43,723.71 40,033.22 (352.06)
Exceptional item - 549.00 -
Taxes 15,273.05 14,227.15 -
Profit/(loss) after tax 28,450.66 26,355.07 (352.06)
Other Comprehensive Income/(loss) (22.03) (52.46) (0.84)
Total Comprehensive Income/(loss) 28,428.63 26,302.61 (352.90)
The Group has received a dividend of ` 3,622.58 Mn. (Previous year: ` Nil) from Indus Towers Limited
Notes forming part of the Consolidated Financial Statements

C K
Annual Report 2016-17 231
Consolidated Financial Statements
The contingent liabilities and capital commitment of the above joint venture and associates are given below:` Mn
Particulars Indus Towers Limited (Indus) ABIPBL
As at As at As at As at As at As atMarch 31, March 31, April 1, March 31, March 31, April 1,
2017 2016 2015 2017 2016 2015
Contingent Liability 36,787.00 31,044.00 21,729.00 - - -
Capital Commitment 7,077.00 3,864.00 2,889.00 - - -
(c) Reconciliation to carrying amounts:
The table below provides reconciliation to carrying amounts for the joint venture and associates material to the Group.` Mn
Particulars Indus
March 31, 2017 March 31, 2016
Opening net assets 133,762.70 111,022.78
Profit for the year 28,450.66 26,355.07
Other comprehensive income/(loss) (22.03) (52.46)
Dividends paid (incl. DDT) (27,251.05) -
Other Equity Movement (2,775.50) (3,562.69)
Closing net assets 132,164.78 133,762.70
Group’s share in % 11.15% 16.00%
Group’s share in ` 14,736.56 21,402.03
Carrying Amount 14,736.56 21,402.03
67. Information with respect to Subsidiaries as at March 31, 2017:` Mn
Particulars Aditya Birla Idea Idea Idea IdeaTelecom Cellular Cellular Telesystems MobileLimited Services Infrastructure Limited Commerce
Limited Services ServicesLimited Limited
Equity share capital 100.00 0.50 0.60 0.50 900.00
Other equity 63,430.48 8.43 6,622.76 191.01 (875.83)
Total Assets 23.69 146.06 8,896.69 61.84 440.39
Total Liabilities 16,390.17 137.13 3,071.83 45.61 521.15
Investments other than investments in Subsidiary 79,896.96 - 798.50 175.28 104.93
Turnover (Total Revenue) 4,963.03 1,571.60 7,635.18 358.21 113.15
Profit/(Loss) before Taxation 4,662.04 10.78 1,167.78 (47.41) (590.25)
Provision for taxation 382.61 3.57 405.43 (0.14) -
Profit/(Loss) after taxation 4,279.43 7.21 762.35 (47.27) (590.25)
Other comprehensive income/(loss) 10,616.64 (1.73) (2.46) - (0.98)
Total comprehensive income/(loss) 14,896.07 5.48 759.89 (47.27) (591.23)
Notes forming part of the Consolidated Financial Statements
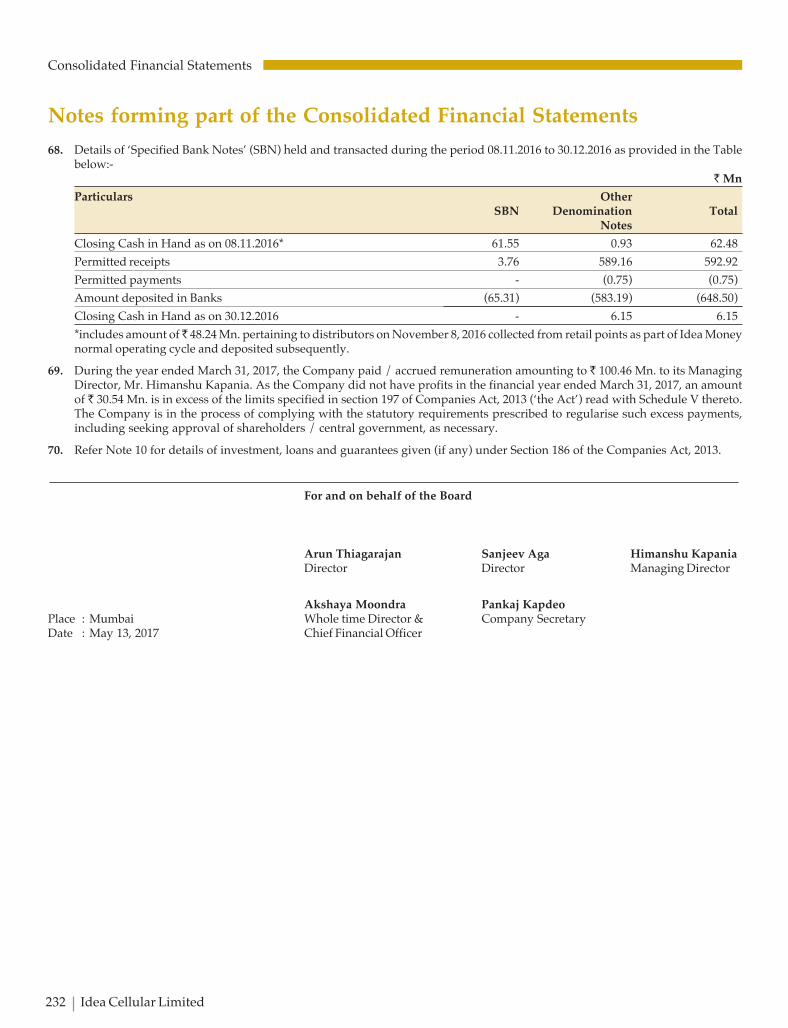
C K
232 Idea Cellular Limited
Consolidated Financial Statements
68. Details of ‘Specified Bank Notes’ (SBN) held and transacted during the period 08.11.2016 to 30.12.2016 as provided in the Tablebelow:-
` Mn
Particulars OtherSBN Denomination Total
Notes
Closing Cash in Hand as on 08.11.2016* 61.55 0.93 62.48
Permitted receipts 3.76 589.16 592.92
Permitted payments - (0.75) (0.75)
Amount deposited in Banks (65.31) (583.19) (648.50)
Closing Cash in Hand as on 30.12.2016 - 6.15 6.15
*includes amount of ̀ 48.24 Mn. pertaining to distributors on November 8, 2016 collected from retail points as part of Idea Moneynormal operating cycle and deposited subsequently.
69. During the year ended March 31, 2017, the Company paid / accrued remuneration amounting to ` 100.46 Mn. to its ManagingDirector, Mr. Himanshu Kapania. As the Company did not have profits in the financial year ended March 31, 2017, an amountof ` 30.54 Mn. is in excess of the limits specified in section 197 of Companies Act, 2013 (‘the Act’) read with Schedule V thereto.The Company is in the process of complying with the statutory requirements prescribed to regularise such excess payments,including seeking approval of shareholders / central government, as necessary.
70. Refer Note 10 for details of investment, loans and guarantees given (if any) under Section 186 of the Companies Act, 2013.
Notes forming part of the Consolidated Financial Statements
For and on behalf of the Board
Arun Thiagarajan Sanjeev Aga Himanshu KapaniaDirector Director Managing Director
Akshaya Moondra Pankaj KapdeoPlace : Mumbai Whole time Director & Company SecretaryDate : May 13, 2017 Chief Financial Officer

C K
Annual Report 2016-17 233
Consolidated Financial Statements
Statement of Consolidated Cash Flows for the year ended March 31, 2017
` Mn
Particulars For the year ended For the year endedMarch 31, 2017 March 31, 2016
A) Cash Flow from Operating Activities
Profit/(Loss) before Tax (8,632.35) 42,501.28
Adjustments For
Share in profits / (loss) of joint venture and associate (4,218.26) (4,216.81)
Depreciation 49,913.76 48,045.13
Amortisation 28,358.28 14,515.61
Loss / (Gain) on disposal of PPE, intangible assets andnon-current assets held for sale (176.19) (63.75)
Finance costs (including fair value change in financialinstruments) 40,410.78 20,961.50
Interest income (674.64) (276.70)
Gain on Mutual Funds (including fair value gain/(loss)) (2,394.71) (1,854.69)
Bad debts / advances written off 104.16 1,328.12
Allowance for doubtful debts / advances 1,869.01 282.74
Share based payment expenses (ESOS) 432.35 614.48
Provision for gratuity and compensated absences 322.83 377.67
Liabilities / provisions no longer required written back (93.48) (136.82)
113,853.89 79,576.48
Operating Profit before Working Capital Changes 105,221.54 122,077.76
Adjustments for changes in Working Capital
(Increase)/Decrease in Trade receivables (3,614.16) (3,554.79)
(Increase)/Decrease in Inventories 477.44 (355.07)
(Increase)/Decrease in Other financial and non financial assets (2,537.89) (6,078.18)
Increase /(Decrease) in Trade Payables 8,398.87 2,990.58
Increase /(Decrease) in Other financial & non financial liabilities 4,235.74 3,017.22
6,960.00 (3,980.24)
Cash generated from Operations 112,181.54 118,097.52
Tax paid (including TDS) (net) (6,808.39) (8,611.43)
Net Cash from / (used in) Operating Activities 105,373.15 109,486.09
B) Cash Flow from Investing Activities
Purchase of PPE & Intangible assets (including CWIP) (53,312.81) (71,242.71)
Payment towards Spectrum and Licenses - Upfront payment (66,207.00) (58,081.99)
Payment towards Spectrum and Licenses - Deferredpayment liability (7,181.60) -
Proceeds from sale of PPE, Intangible assets and AHFS 382.42 207.00
Investment in Aditya Birla Idea Payments Bank Limited(including advance given for purchase of shares) (173.70) (2.45)
Net proceeds from sale / (purchase) of Current Investment (33,298.21) 103,911.89
Interest received 611.40 1,318.35
Dividend received from Joint Venture 3,622.58 -
Net Cash from / (used in) Investing Activities (155,556.92) (23,889.91)

C K
234 Idea Cellular Limited
Consolidated Financial Statements
Statement of Consolidated Cash Flows for the year ended March 31, 2017
` Mn
Particulars For the year ended For the year endedMarch 31, 2017 March 31, 2016
C) Cash Flow from Financing Activities
Proceeds from issue of Equity Share Capital under ESOS 96.85 175.10
Amount paid on extinguishment of Equity Shares held byP5 as per high court approved scheme (4,550.00) -
Proceeds from Long Term Borrowings 115,155.79 347.11
Repayment of Long Term Borrowings (15,859.04) (101,630.03)
Proceeds from Short Term Borrowings - 14,798.09
Repayment of Short Term Borrowings (15,000.00) -
Payment of Dividend, including Dividend Distribution Tax (2,598.89) (2,598.19)
Payment of Interest and Finance Charges (32,799.83) (4,392.83)
Net Cash from / (used in) Financing Activities 44,444.88 (93,300.75)
Net Increase / (Decrease) in Cash and Cash Equivalents (5,738.89) (7,704.57)
Cash and Cash Equivalents at the beginning 6,174.26 13,878.83
Cash and Cash Equivalents at the end 435.37 6,174.26
Notes to Statement of Cash Flows for the year ended March 31, 2017
1. Cash and Cash Equivalents include the following Balance Sheet amounts
Cash on hand 8.93 18.51
Cheques on hand 63.62 86.73
Balances with banks
- In Current Accounts 709.91 323.61
- In Deposit Accounts - 7,201.19
Bank overdrafts which forms an integral part of cash management (347.09) (1,455.78)
435.37 6,174.26
2. The above Statement of Cash Flows has been prepared under the indirect method as set out in Ind AS 7 on Statement of Cash Flows
In terms of our report attached
For Deloitte Haskins & Sells LLP For and on behalf of the BoardChartered Accountants
Hemant M. Joshi Arun Thiagarajan Sanjeev Aga Himanshu KapaniaPartner Director Director Managing DirectorMembership No.: 38019
Akshaya Moondra Pankaj KapdeoPlace : Mumbai Whole time Director & Company SecretaryDate : May 13, 2017 Chief Financial Officer

ID
EA
C
EL
LU
LA
R L
IM
IT
ED
A
NN
UA
L R
EP
OR
T 2
01
6-
20
17
CMYKCMYK
Th
om
so
n P
ress
Idea Cellular LimitedSuman Tower, Plot No. 18, Sector - 11,
Gandhinagar - 382 011, Gujarat
www.ideacellular.com
IDEA CELLULAR LIMITEDIDEA CELLULAR LIMITEDIDEA CELLULAR LIMITEDIDEA CELLULAR LIMITEDIDEA CELLULAR LIMITED


