Download - IDH Group - my\}dentist

IDH Group
Europe’s largest dental services group

DISCLAIMER
THIS PRESENTATION IS NOT AN OFFER OR SOLICITATION OF AN OFFER TO BUY OR SELL SECURITIES IN THE UNITED STATES OF AMERICA OR IN ANY OTHER JURISDICTION. IT IS
PROVIDED AS INFORMATION ONLY.
This presentation is furnished only for the use of the intended recipient, and may not be relied upon for the purposes of entering into any transaction.
By attending this presentation, you agree to be bound by these restrictions. Any failure to comply with these restrictions may constitute a violation of applicable securities laws.
Certain information herein (including market data and statistical information) has been obtained from various sources. We do not represent that it is complete or accurate. All
projections, valuations and statistical analyses are provided to assist the recipient in the evaluation of the matters described herein. They may be based on subjective assessments
and assumptions and may use one among alternative methodologies that produce different results and to the extent that they are based on historical information, they should not
be relied upon as an accurate prediction of future performance.
This presentation may include forward-looking statements that reflect our intentions, beliefs or current expectations. Forward-looking statements involve all matters that are not
historical by using the words “may”, “will”, “would”, “should”, “expect”, “intend”, “estimate”, “anticipate”, “believe”, and similar expressions or their negatives. Such statements are
made on the basis of assumptions and expectations that we currently believe are reasonable, but could prove to be wrong.
This presentation does not constitute an offer or an agreement, or a solicitation of an offer or an agreement, to enter into any transaction (including for the provision of any
services) and does not constitute an offer or invitation to subscribe for or purchase any securities, and nothing contained herein shall form the basis of any contract or commitment
whatsoever. Any decision to purchase securities in the context of a proposed offering, if any, should be made solely on the basis of information contained in the offering
memorandum published in relation to such an offering.
The information contained herein does not constitute investment, legal, accounting, regulatory, taxation or other advice and the information does not take into account your
investment objectives or legal, accounting, regulatory, taxation or financial situation or particular needs. You are solely responsible for forming your own opinions and conclusions
on such matters and the market and for making your own independent assessment of the information herein. You are solely responsible for seeking independent professional
advice in relation to the information and any action taken on the basis of the information. Investors and prospective investors in the securities of any issuer mentioned herein are
required to make their own independent investigation and appraisal of the business and financial condition of such issuer and the nature of the securities.
This presentation includes certain financial data that are “non-IFRS financial measures”. These non-IFRS financial measures do not have a standardised meaning prescribed by
International Financial Reporting Standards or UK Accounting Standards and therefore may not be directly comparable to similarly titled measures presented by other entities, nor
should they be construed as an alternative to other financial measures determined in accordance with International Financial Reporting Standards or UK Accounting Standards.
Although we believe these non-IFRS financial measures provide useful information to users in measuring the financial performance and condition, of the business, you are
cautioned not to place undue reliance on any non-IFRS financial measures included in this presentation. This presentation contains certain data and forward looking statements
regarding the UK economy, the markets in which we operate and its position in the industry that were obtained from publicly available information, independent industry
publications and other third party data. We have not independently verified such data and forward looking statements and cannot guarantee their accuracy or completeness.
2
3
Tom Riall
Chief Executive Officer
• Over 25 years in the business services
industry.
• Joined IDH in May 2017.
• Previously CEO of Priory Group, Europe’s
largest provider of behavioural care.
• Also held senior leadership roles at Serco,
Reliance Secure Task Management and
Onyx UK Ltd.
Introduction to IDH Group
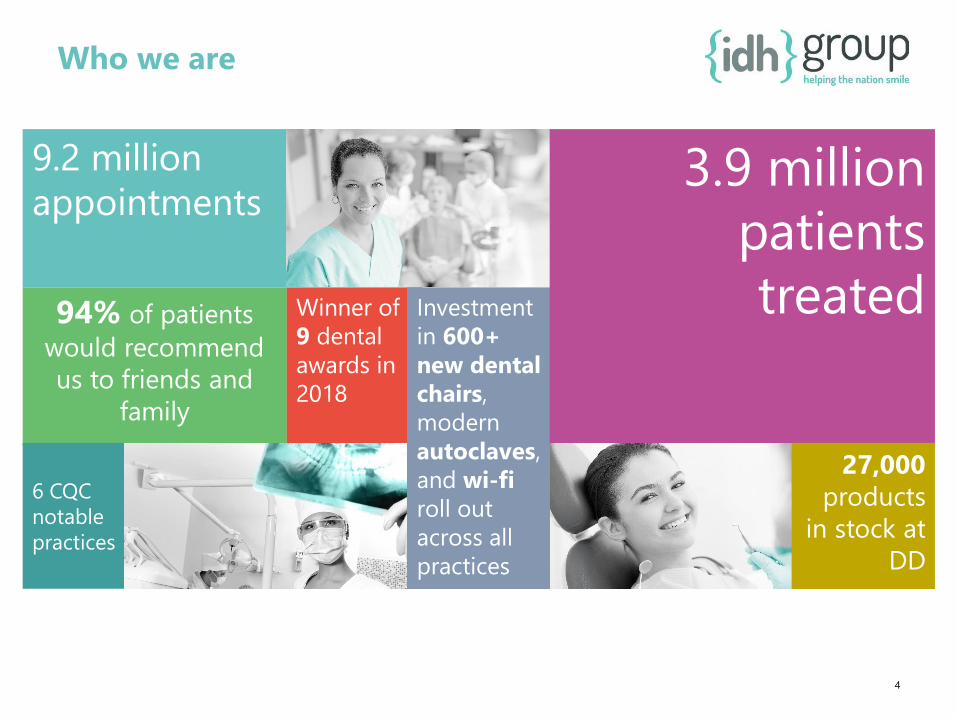
Who we are
4
9.2 million
appointments
Winner of
9 dental
awards in
2018
94% of patients
would recommend
us to friends and
family
6 CQC
notable
practices
Investment
in 600+
new dental
chairs,
modern
autoclaves,
and wi-fi
roll out
across all
practices
3.9 million
patients
treated
27,000
products
in stock at
DD

We are the leading provider of dental
services in the UK
5
Practices
DD locations• 604 practices across the UK
• Serving 3.9m patients
• Working with 2,700 clinicians
• Leading provider of services to
the NHS
• Unique {my}options affordable
private offering growing rapidly
in FY20
• One of the largest full service
dental support companies in
the UK
• Services include consumables,
equipment installation,
engineering maintenance to
{my}dentist and other providers
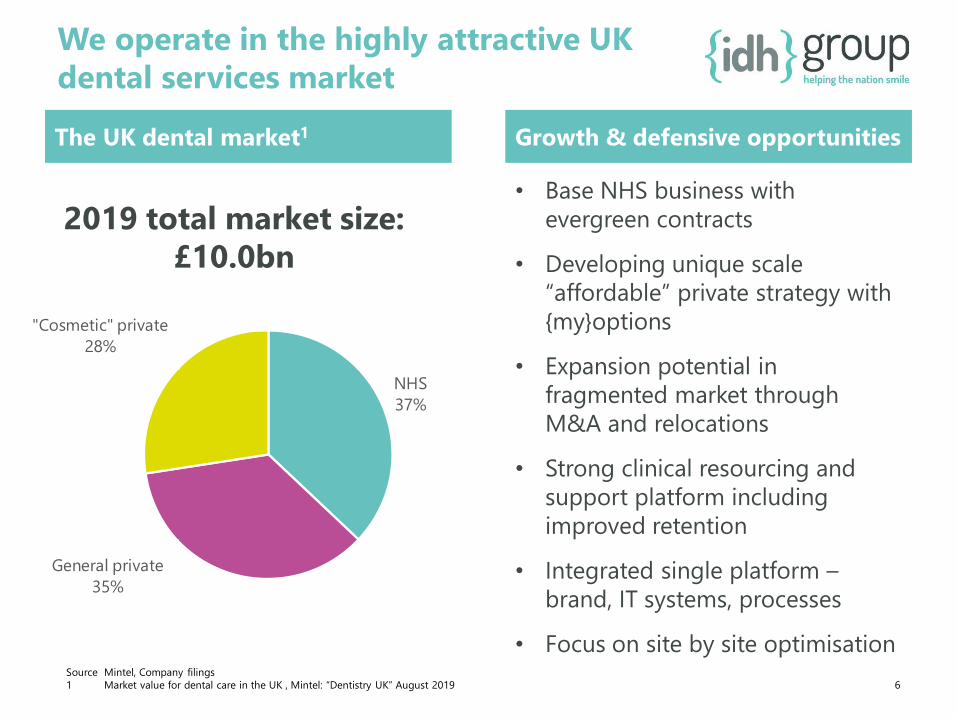
NHS
37%
General private
35%
"Cosmetic" private
28%
We operate in the highly attractive UK
dental services market
6
The UK dental market1
Source Mintel, Company filings
1 Market value for dental care in the UK , Mintel: “Dentistry UK” August 2019
2019 total market size:
£10.0bn
• Base NHS business with
evergreen contracts
• Developing unique scale
“affordable” private strategy with
{my}options
• Expansion potential in
fragmented market through
M&A and relocations
• Strong clinical resourcing and
support platform including
improved retention
• Integrated single platform –
brand, IT systems, processes
• Focus on site by site optimisation
Growth & defensive opportunities

Treatment
band
UDA Revenue Patient
contribution
1 - Check-up 1 £27.00 £22.70 (84.1%)
2 - Fillings,
extractions
3 £81.00 £62.10 (76.7%)
3 - Crowns,
bridges
12 £324.00 £269.30 (83.1%)
NHS is still a significant part of the
business
7
Dentistry is a small part of the NHS
Patient co-pay significant
Dental – 2.9%
NHS gross
expenditure 2018-
19: £129bn
Source: Fullfact.org/health/spending-English-NHS
• Access to NHS dentistry reduced
from 56.1% of population in 2013 to
50.2% in 2019
• Main delivery constraints linked to
workforce
• 87% of {my}dentist NHS contracts
are evergreen
• NHS reviewing use of “flexible”
commissioning to improve
nationwide delivery
• Non-exempt patients co-pay a
significant proportion of the UDA
value
• Patient charges have increased by
5% per annum

Private dentistry is a key growth
opportunity
8
• Significant opportunity to develop
private revenue
• Rebalancing revenue toward private
in line with overall market
• Market share of private only 1.6%
compared to 9.7% of NHS market
• Organic private growth through
• Roll-out and development of
{my}options
• Private orthodontics and clear
aligners
• Advanced Oral Health Centres
hub and spoke implant placing
Acceleration through {my}options
0
50,000
100,000
150,000
200,000
250,000
300,000
350,000
400,000
450,000
1 3 5 7 9 111315171921232527293133353739414345474951
Wee
kly
Rev
enu
e
FY Week Number
Affordable private
weekly revenue
Rolled –out to 400+
practices by the end of
H1 FY2020
% of total revenue NHS Private
UK dental 37% 63%
2016 82% 18%
Q2 2019 73.5% 26.5%

Affordable private fills significant market
gap
9
• 50% of NHS practices closed to new patients
• Private dentistry considered unaffordable
• Harder than ever for patients to get access
to the treatment they need
• Growing numbers of clinicians also want to
find a better balance between their NHS and
private work
• There is a significant gap in the market
• {my}options provides patients with the
access they need and clinicians with the
careers they want
• Transparent pricing and a fair fee-per-item
remuneration model
• Comprehensive range of treatments, flexible,
convenient and longer appointments

NHS fee
paying, 40%
Didn't have a
dentist, 28%
Private patient,
27%
NHS exempt,
5%
• 50,000 patients have signed up to {my}options so far and 82% are new to
{my}dentist
• Of the 82%:
• 28% of patients didn’t previously have a dentist
• 27% were a private patient elsewhere
• 45% were NHS patients elsewhere (both exempt and fee paying)
• Of the 18% that were existing patients, 80% were upgrading from NHS care
10
Affordable private driving new patients
and incremental revenue
Existing patients,
18%
New patients,
82%
0
20
40
60
80
100
Apr-19 May-19 Jun-19 Jul-19 Aug-19 Sep-19 Oct-19 Nov-19 Dec-19 Jan-20 Feb-20 Mar-20
Nu
mb
er
of
clin
icia
n leavers
Month
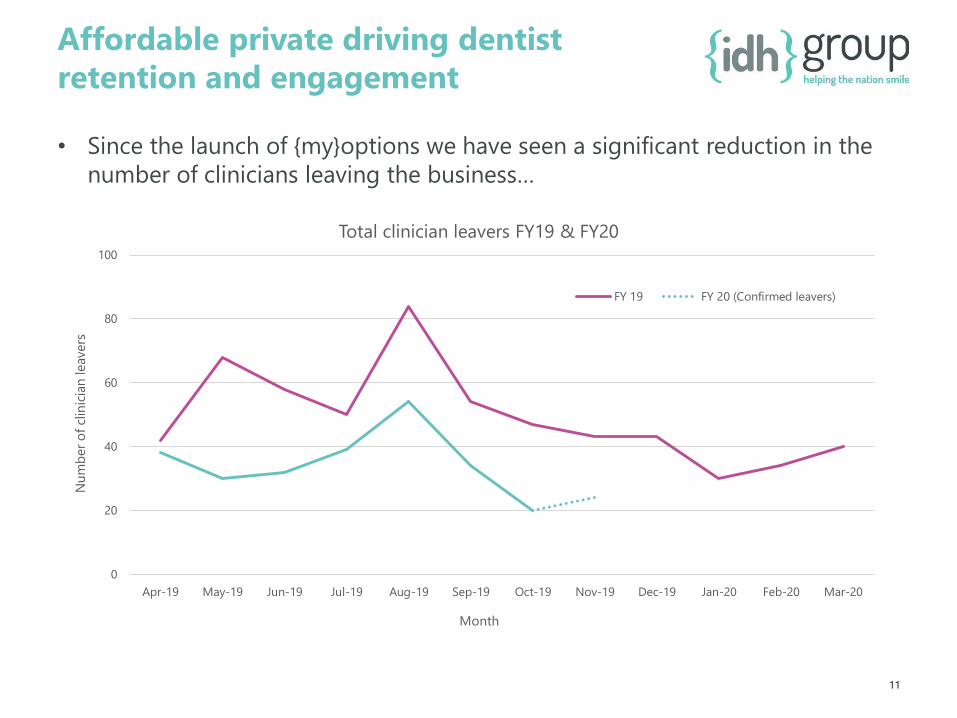
Total clinician leavers FY19 & FY20
FY 19 FY 20 (Confirmed leavers)
11
• Since the launch of {my}options we have seen a significant reduction in the
number of clinicians leaving the business…
Affordable private driving dentist
retention and engagement

Success in recruitment and retention
• 2,700 clinicians engaged in our practices
• Unique in-house dental training academy –
delivered 70,000 hours of CPD last year
• Largest clinical support network of any
provider including 400 mentors for new
clinicians and team of Clinical Directors and
Clinical Support Managers.
• Recruited 100+ new graduate dentists in 2019
• 7,500 staff including 4,000 nurses, 1,000
receptionists
• £2.5m invested in increasing nurse numbers
and improving pay and development
opportunities
• Invested additional £30m in rebranding and
refresh of practices, £20m in new chairs, digital
radiography and the latest technology12
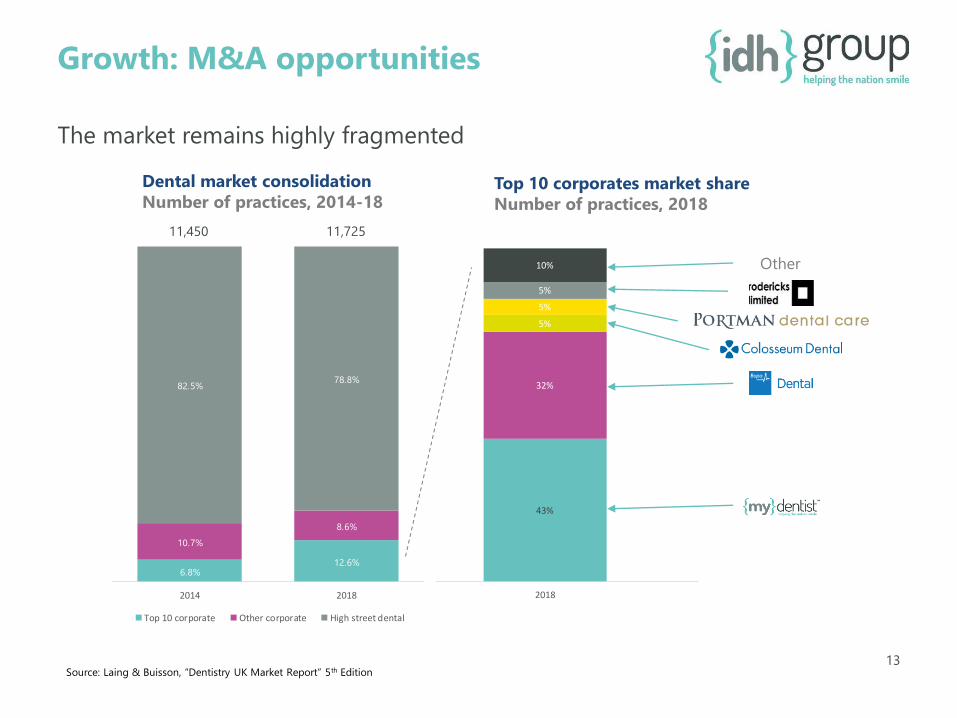
43%
32%
5%
5%
5%
10%
2018
6.8%12.6%
10.7%
8.6%
82.5%78.8%
2014 2018
Top 10 corporate Other corporate High street dental
The market remains highly fragmented
13
Dental market consolidation
Number of practices, 2014-18Top 10 corporates market share
Number of practices, 2018
Other
Growth: M&A opportunities
11,450 11,725
Source: Laing & Buisson, “Dentistry UK Market Report” 5th Edition

Growth: Site rationalisation opportunities
• No scope in some existing locations for organic growth
through introduction of {my}options due to capacity
constraints
• Strategy to identify retail locations where practice can
move and expand to 4-6 surgeries
• Trial process underway with locations in Glasgow,
Shipley and Halifax
14
Halifax
Shipley
Glasgow –
The Forge
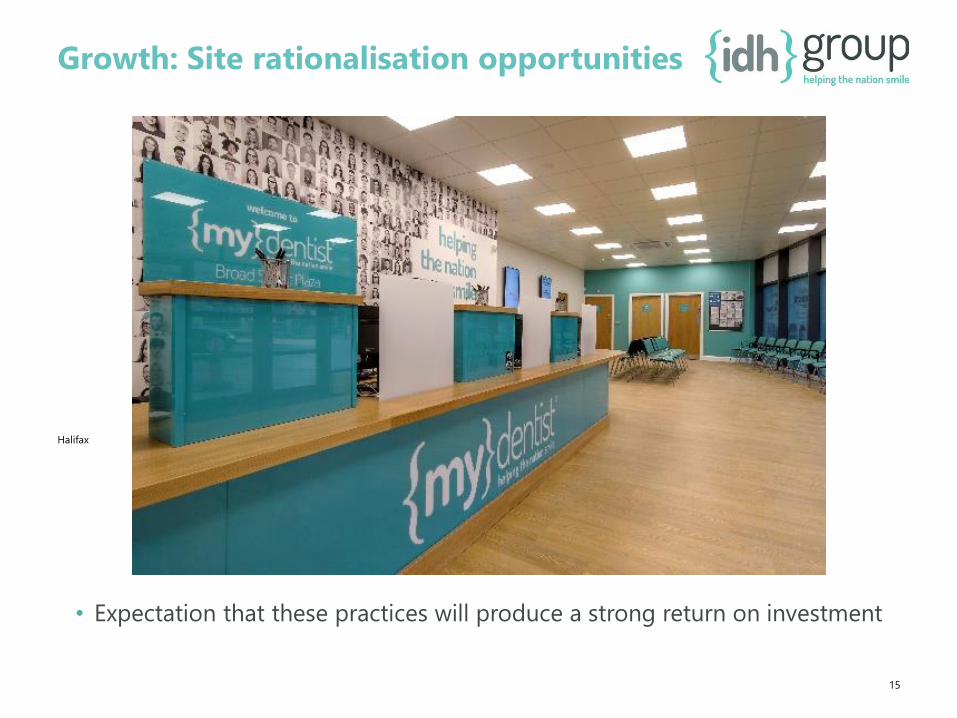
Growth: Site rationalisation opportunities
15
Halifax
• Expectation that these practices will produce a strong return on investment

DD provides all key support services
16
Key:
High Street - Core business
Aesthetics - High Growth
Engineering - High Margin
Health - High volume low margin
authorities
Other - Range extension
£21m
Engineering
Equipment/Services/
Digital…
£9.4m
Health Authorities
7%
£5.9m
Other Service &
Products
4%
£84.2m
High Street
(Dental)
62%
£15m
Aesthetics
11%
Revenue - FY19 £135m • DD supplies over 27,000 products to
12,000 dental practices across the UK and
the Republic of Ireland
• Market opportunity of £3.1bn including
adjacent sectors in primary care,
veterinarian and oral health
• Significant investment in customer
services through improved support and
customer website
• Development of aesthetics through
exclusive distribution contract with
Galderma
• Own-brand “UnoDent” growth higher than
current market share
• Fully independent stand-alone company
with contracts across the sector including
NHS, Bupa Dental, Portman and the MoD
2.0
3.0
4.0
5.0
6.0
7.0
8.0
9.0
10.0
11.0
12.0
40.0
45.0
50.0
55.0
60.0
65.0
70.0
75.0
FY17 FY18 FY19 FY20 E
Adjusted EBITDA mydentist DD
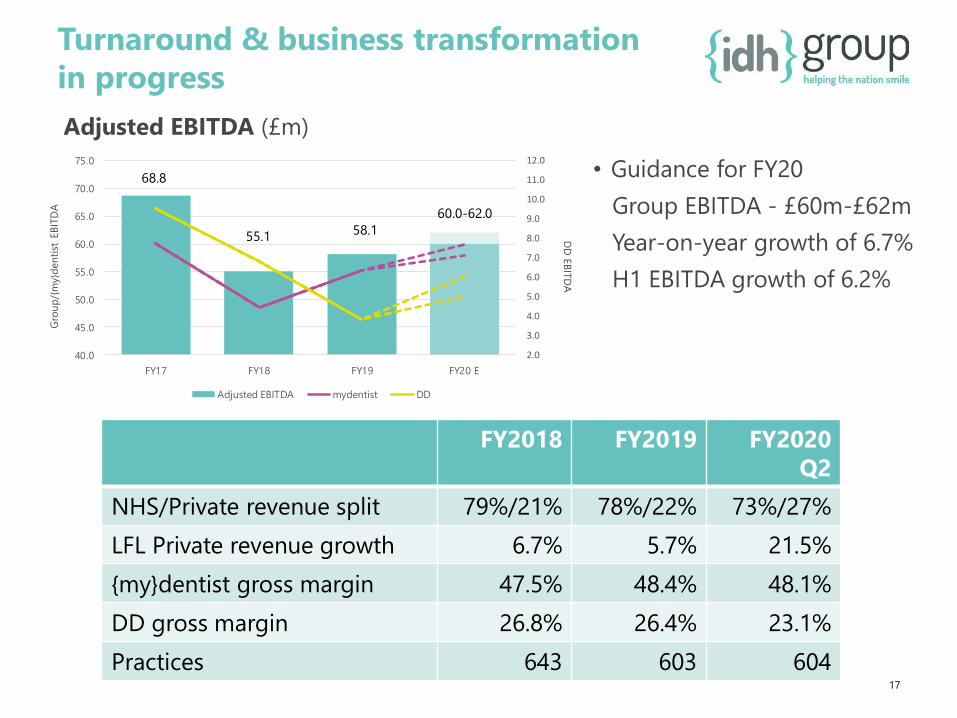
Turnaround & business transformation
in progress
17
• Guidance for FY20
Group EBITDA - £60m-£62m
Year-on-year growth of 6.7%
H1 EBITDA growth of 6.2%
DD
EB
ITD
A
Gro
up
/{m
y}d
en
tist
EB
ITD
A
Adjusted EBITDA (£m)
FY2018 FY2019 FY2020
Q2
NHS/Private revenue split 79%/21% 78%/22% 73%/27%
LFL Private revenue growth 6.7% 5.7% 21.5%
{my}dentist gross margin 47.5% 48.4% 48.1%
DD gross margin 26.8% 26.4% 23.1%
Practices 643 603 604
68.8
55.1 58.1
60.0-62.0

Large and stable market - defensive characteristics
Scale operator – network and scale opportunities
Like-for-like growth opportunities – site EBITDA
optimisation, growing market, opportunities to provide
choice and engage patients through {my}options
Fragmented UK market – opportunities for hub-and-
spoke strategic growth plus leveraging on scale to drive
down acquisition multiple
International growth potential in mid-term
IDH Group highlights
18


