
© IEA Clean Coal Centre www.iea-coal.org.uk
IEA ENERGY TECHNOLOGY DAYCoal Fired Power and Efficiency
New York 3 May 2006
Dr John TopperDirector, IEA Clean Coal Centre
http://www.iea-coal.org.uk

© IEA Clean Coal Centre www.iea-coal.org.uk
IEA Clean Coal Centre Members
UK
USA
Japan
Anglo S Africa
Eskom S Africa
NIGBHEL India
BRICC China
Austria
Canada
CEC
Italy
ACIC Australia
CANZ N Zealand
Danish Power Group
http://www.ieahttp://www.iea--coal.org.ukcoal.org.uk
Rep. of Korea
BG Group UK
Germany
Eletrobras, Brazil
© IEA Clean Coal Centre www.iea-coal.org.uk
Membership character
Our Network
Kyoto Protocol signatoriesNon-Kyoto signatoriesOECD CountriesDeveloping countries (China, India, S. Africa, Brazil)GovernmentsIndustry – coal and power and equipment
© IEA Clean Coal Centre www.iea-coal.org.uk
Some of our Power Related reports
Completed in last 12 monthsInternational funding sources for major
coal investment projects Feb 06Implementing clean coal projects under Kyoto Apr 05Coal full life cycle analysis Sep 05Towards zero emission coal-fired power stations Sep 05Fuels for biomass cofiring Oct 05Life extension of coal-fired power plants Nov05Use of coal in areas of water shortage Nov 05In ProgressPublic attitudes to new coal power plantsClean coal technologies for a carbon constrained worldFuture developments in IGCCCO2 capture technologiesCofiring coal with waste and opportunity fuelsCoal resources for future power generation in China

© IEA Clean Coal Centre www.iea-coal.org.uk
Towards Zero Emissions
Report by Dr Colin HendersonObtainable via IEA CCC website
www.iea-coal.org.uk

© IEA Clean Coal Centre www.iea-coal.org.uk
Current plant emissions and suggested ZETstargets (stack gas concentrations at 6% O2, dry)
>80% removal
90% removal<1<25<25IGCC as ZETs
>80% removal
90% removal<10<100 (interim)<50 (eventual)
<100 (interim)<30 (eventual)
PCC as ZETs
~3700<30 (SCR)-300NegligibleNGCC
<1<7598-99% removal
IGCC
<50120-400As PCCPFBC
<50<200-400As PCCCFBC
710-92010-25100-200(SCR)
100-400(to 98%)
PCC +FGD
CO2
kg/MWhMercuryParticles
mg/m³NOx as NO2
mg/m³SO2
mg/m³Techn’gy

© IEA Clean Coal Centre www.iea-coal.org.uk
Two tracks for sustainability based on coal
Progressive improvements in emissions, competitiveness, efficiency, for:
interim environmental benefits – all emissions and wastes
a credible platform and, ultimately,
a very high efficiency technology base for near-zero emissions plants
Develop near-zero emissions plants:
CO2 capture and storage (CCS)
very low conventional emissions
© IEA Clean Coal Centre www.iea-coal.org.uk
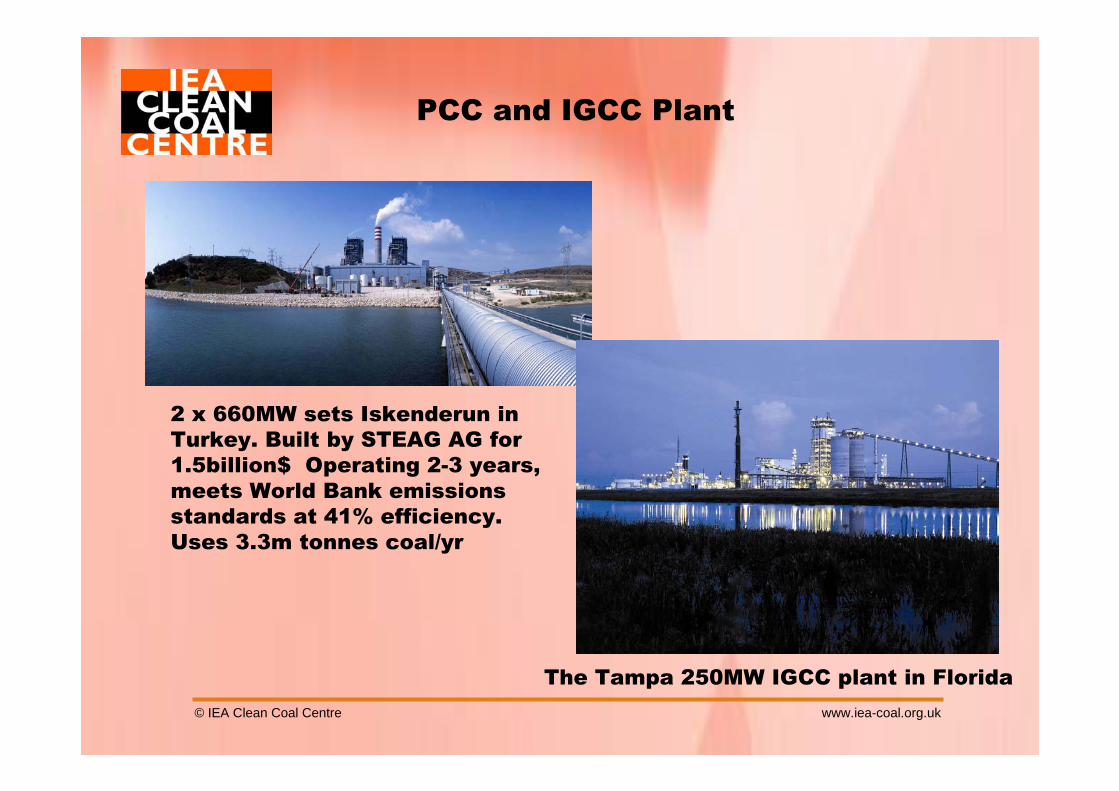
PCC and IGCC Plant
2 x 660MW sets Iskenderun in Turkey. Built by STEAG AG for 1.5billion$ Operating 2-3 years, meets World Bank emissions standards at 41% efficiency. Uses 3.3m tonnes coal/yr
The Tampa 250MW IGCC plant in Florida
© IEA Clean Coal Centre www.iea-coal.org.uk
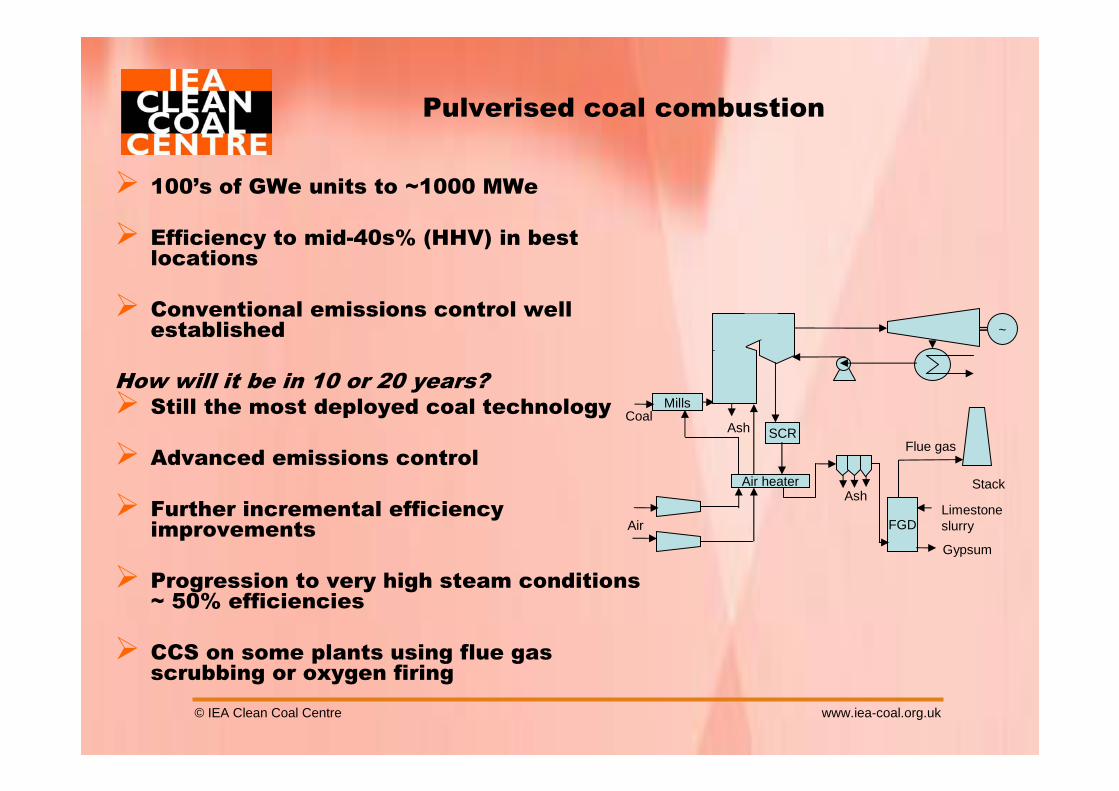
Pulverised coal combustion
100’s of GWe units to ~1000 MWe
Efficiency to mid-40s% (HHV) in best locations
Conventional emissions control well established
How will it be in 10 or 20 years?Still the most deployed coal technology
Advanced emissions control
Further incremental efficiency improvements
Progression to very high steam conditions ~ 50% efficiencies
CCS on some plants using flue gas scrubbing or oxygen firing
~
Limestone slurry
Gypsum
Mills
Air heater
Ash
Air
Coal
AshStack
FGD
SCRFlue gas

© IEA Clean Coal Centre www.iea-coal.org.uk
Integrated gasification combined cycle (IGCC)
Demonstrations in USA and Europe and, shortly, in Japan
Cost/availability concerns have held back orders but reference plants soon
Efficiency ~40-43% HHV
V. low emissions, Hg capture simple
How will it be in 10 or 20 years?More widely deployed
Advanced performance and lower cost
New gasifier designs &polygeneration
CCS using pre-combustion capture
Gasification
Coal and oxygen Raw
gas
Clean fuel gas
~Gas turbine
Waste heatboiler
Stack
Steamturbine ~
Byproductsand wastes
Slag
Air
Gas cleaning

© IEA Clean Coal Centre www.iea-coal.org.uk
1000 US$/kWe49% HHV (non-ZETs - 5% pts)
500 US$/kWe54% HHV
NGCC advanced
1000 US$/kWe45% HHV
500 US$/kWe51% HHV
NGCC current/near-term
1700 US$/kWe (advanced O2 production; based on non-ZETs +30%)41% HHV
1300 US$/kWe (based on radiant and advanced O2 production, reducing cost 7%)48% HHV
IGCC advanced, long-term
1900 US$/kWe35% HHV1500 US$/kWe (slurry feed, water quench)32% HHV
1400 US$/kWe (dry feed, radiant cooling)43% HHV1200 US$/kWe (slurry feed, water quench) 38% HHV
IGCC current/near-term
1600 US$/kWe (advanced oxy-coal; based on non-ZETs +33%)40% HHV (non-ZETs - 8% points)
1200 US$/kWe (based on cost equal to above)48% HHV
UltrasupercriticalPCC, long-term
1900 US$/kWe (flue gas scrubbing)33% HHV
1200 US$/kWe41% HHV
Supercritical PCC, current/near-term
ZETsNon-ZETs reference
ZETs plants capital cost (US$/kWe net) and net efficiency (% HHV) estimates
© IEA Clean Coal Centre www.iea-coal.org.uk
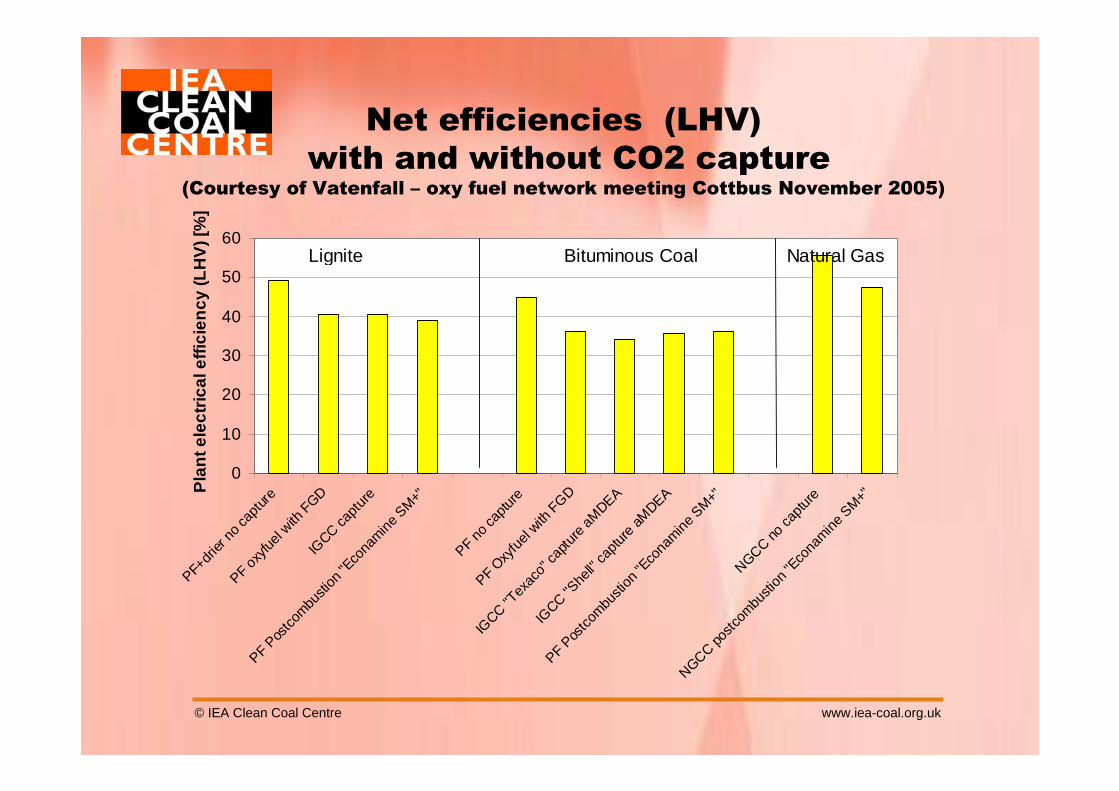
Net efficiencies (LHV)with and without CO2 capture
(Courtesy of Vatenfall – oxy fuel network meeting Cottbus November 2005)
0
10
20
30
40
50
60
PF+dr
ier no
capt
ure
PF ox
yfuel
with F
GDIG
CC capt
ure
PF Pos
tcombu
stion
"Eco
namine
SM+"
PF no
captu
re
PF Oxy
fuel
with F
GD
IGCC "T
exac
o" ca
pture
aMDEA
IGCC "S
hell"
captu
re aM
DEA
PF Pos
tcombu
stion
"Eco
namine
SM+"
NGCC no ca
pture
NGCC postc
ombu
stion
"Eco
namine
SM+"
Pla
nt e
lect
rica
l eff
icie
ncy
(LH
V) [
%]
Natural GasLignite Bituminous Coal
© IEA Clean Coal Centre www.iea-coal.org.uk
Summary picture on capital costs and efficiencies of ZETs plants
Main incremental cost of ZETs plants will come from CO2capture, which incurs a large specific capital cost penalty
PCC and IGCC in ZETs forms could be broadly similar in capital cost
However, range and uncertainty in estimated costs are considerable
Efficiency penalties of combustion-based ZETs systems could be becoming more similar to those being predicted for IGCC-based ZETs
© IEA Clean Coal Centre www.iea-coal.org.uk
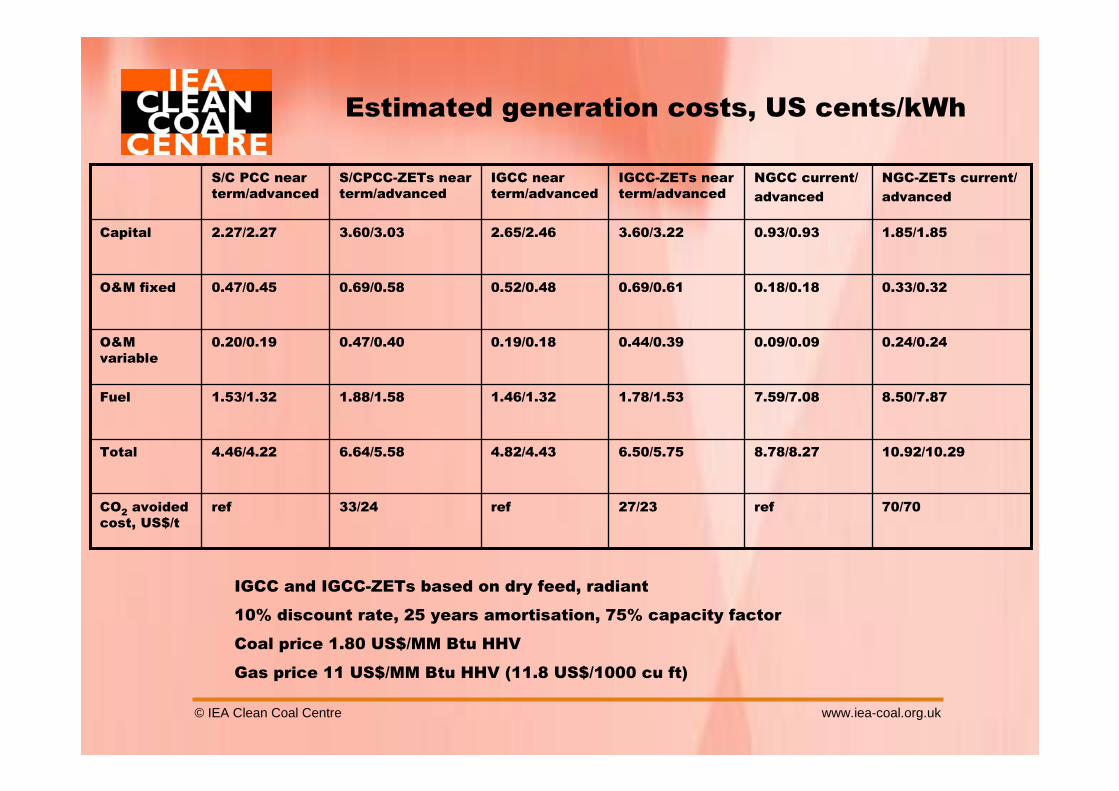
Estimated generation costs, US cents/kWh
70/70ref27/23ref33/24refCO2 avoided cost, US$/t
10.92/10.298.78/8.276.50/5.754.82/4.436.64/5.584.46/4.22Total
8.50/7.877.59/7.081.78/1.531.46/1.321.88/1.581.53/1.32Fuel
0.24/0.240.09/0.090.44/0.390.19/0.180.47/0.400.20/0.19O&M variable
0.33/0.320.18/0.180.69/0.610.52/0.480.69/0.580.47/0.45O&M fixed
1.85/1.850.93/0.933.60/3.222.65/2.463.60/3.032.27/2.27Capital
NGC-ZETs current/advanced
NGCC current/advanced
IGCC-ZETs near term/advanced
IGCC near term/advanced
S/CPCC-ZETs near term/advanced
S/C PCC near term/advanced
IGCC and IGCC-ZETs based on dry feed, radiant
10% discount rate, 25 years amortisation, 75% capacity factor
Coal price 1.80 US$/MM Btu HHV
Gas price 11 US$/MM Btu HHV (11.8 US$/1000 cu ft)

© IEA Clean Coal Centre www.iea-coal.org.uk
Breakeven coal/ natural gas prices
Reference is NGCC-ZETsAll plants are near-term
0
2
4
6
8
10
12
1.0 2.0 3.0 4.0 5.0 6.0
Delivered coal price, US$/MMBtu HHV
Nat
ura
l gas
pri
ce, U
S$/
MM
Btu
HH
V
PCC
PCC-ZETs
IGCC
IGCC-ZETs
COAL PREFERRED
GAS PREFERRED
© IEA Clean Coal Centre www.iea-coal.org.uk
G8 Action Plan for Climate change
© IEA Clean Coal Centre www.iea-coal.org.uk
Action Plan on Climate Change
Powering a Cleaner FutureThe G8 Request – Task 13We will support efforts to make electricity generation
from coal and other fossil fuels cleaner and more efficient by:
Supporting IEA work in major coal using economies to review, assess and disseminate widely information on energy efficiency of coal-fired power plants; and to recommend options to make best practice more accessible;
Inviting the IEA to carry out a global study of recently constructed plants, building on the work of its Clean Coal Centre, to assess which are the most cost effective and have the highest efficiencies and lowest emissions, and to disseminate this information widely;

© IEA Clean Coal Centre www.iea-coal.org.uk
China and India

© IEA Clean Coal Centre www.iea-coal.org.uk
China & IEA Clean Coal Centre
China an industrial sponsor of the IEA CCC via Beijing Institute of Coal Chemistry
Two Chinese staff members at the Centre
Strong links to major industrial groupings and key universities via a Senior Associate
Study report in preparation (Coal Resources for Power Generation in China) 2006
World Bank project (H2 production and CO2 sequestration for IGCC) 2006
Study report (Coal in China) 2003-2004
World Bank project (non-power sector clean coal technology) 2002-2003
© IEA Clean Coal Centre www.iea-coal.org.uk
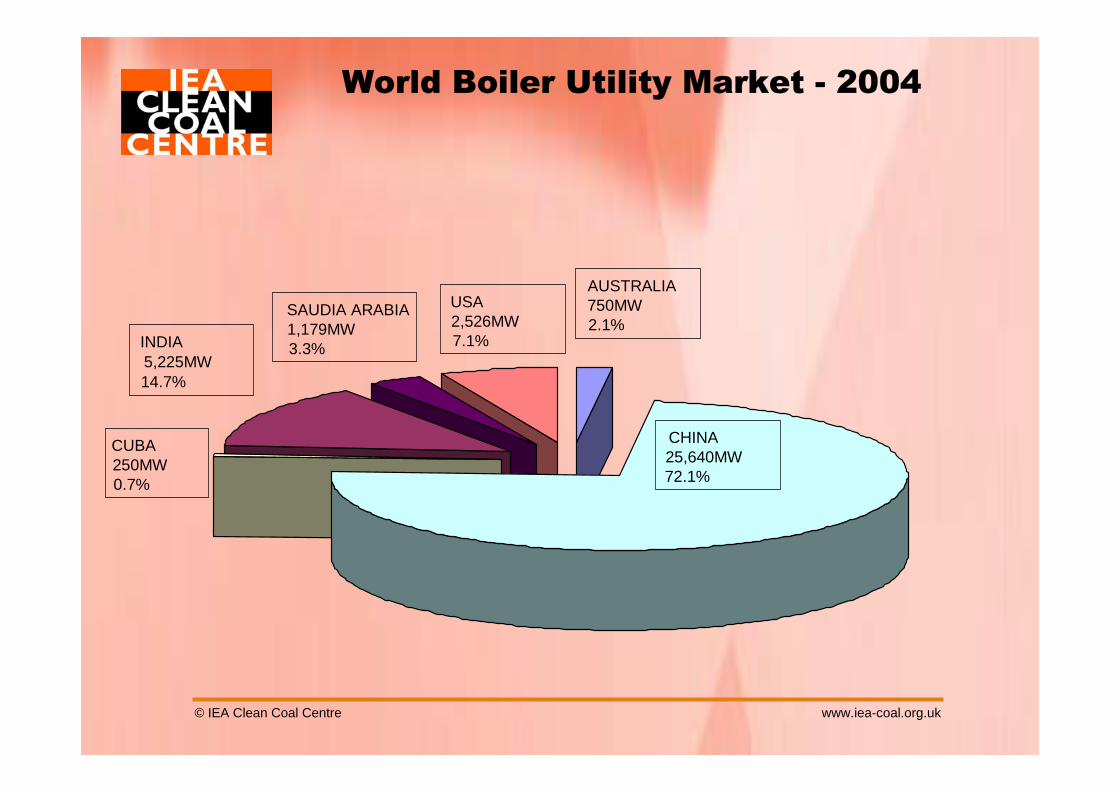
World Boiler Utility Market - 2004
CHINA25,640MW72.1%
CUBA250MW0.7%
INDIA5,225MW14.7%
SAUDIA ARABIA1,179MW3.3%
USA2,526MW7.1%
AUSTRALIA750MW2.1%
© IEA Clean Coal Centre www.iea-coal.org.uk
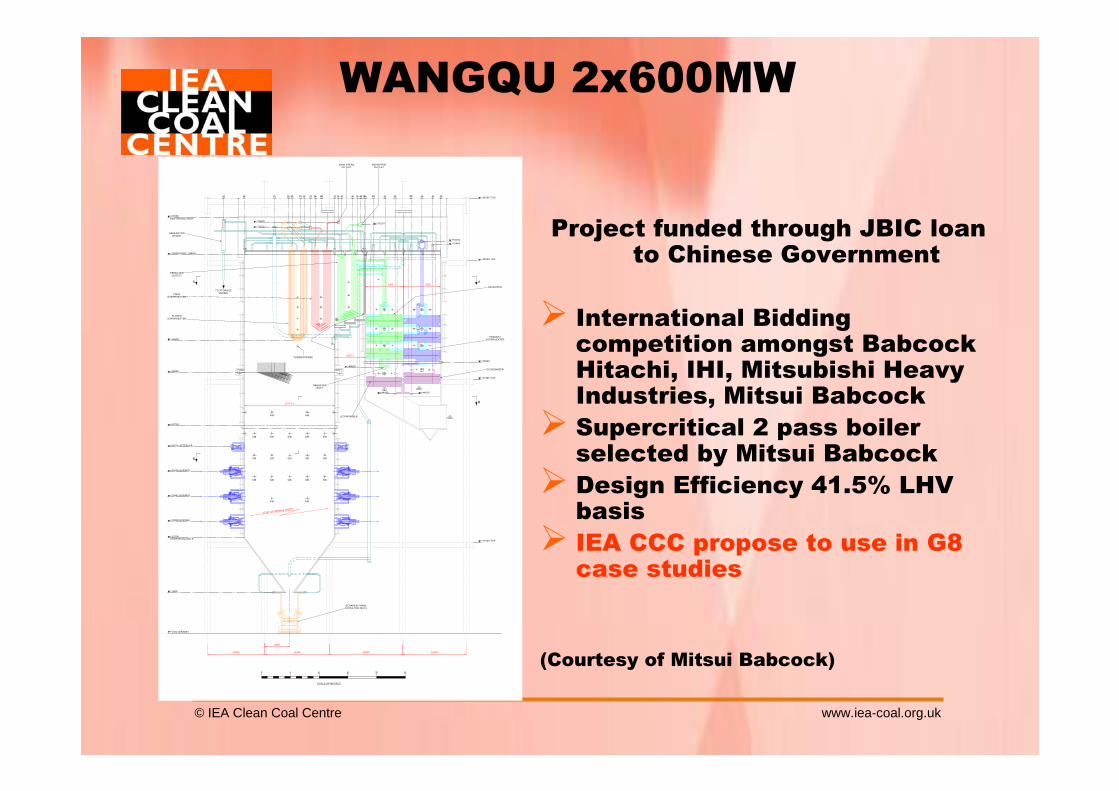
WANGQU 2x600MW
Project funded through JBIC loan to Chinese Government
International Bidding competition amongst Babcock Hitachi, IHI, Mitsubishi Heavy Industries, Mitsui BabcockSupercritical 2 pass boiler selected by Mitsui BabcockDesign Efficiency 41.5% LHV basisIEA CCC propose to use in G8 case studies
(Courtesy of Mitsui Babcock)SCALE OF METRES
0 5 10 15 20 25
22187.4 FURNACE WIDTH
+20830 BURNER
+17808HOPPER KNUCKLE
+0.0m (GRADE)
+7600
+25461 BURNER
+30093 BURNER
+34724 AFTER AIR
+38700
+48590
+54600
+70600 ROOF TUBES
+77550PENTHOUSE ROOF
MAIN STEAMOUTLET
REHEATEROUTLET
+75570
+76570+76170
+73100
+72450
SCRAPER CHAINCONVEYOR (SCC)
+17000 TOF
REHEATER
PRIMARYSUPERHEATER
+50520
ECONOMISER
ECONOMISER
+49520
+44620+44620
SEPERATORVESSEL
FINALSUPERHEATER
REHEATEROUTLET
PLATENSUPERHEATER
THERMOPROBE
TO STORAGEVESSEL
A A
B
B15747.4
+81000 TOS
4300
10000 11200 12800 11000
5322.3
6555 6555
S/B S/B
S/B S/B S/B
+47360 TOF
+69500 TOF
REHEATERINLET
B B
B
S/B S/B
S/B S/B
S/B S/B S/B
S/B S/BS/B S/B S/B
F/B F/B
© IEA Clean Coal Centre www.iea-coal.org.uk
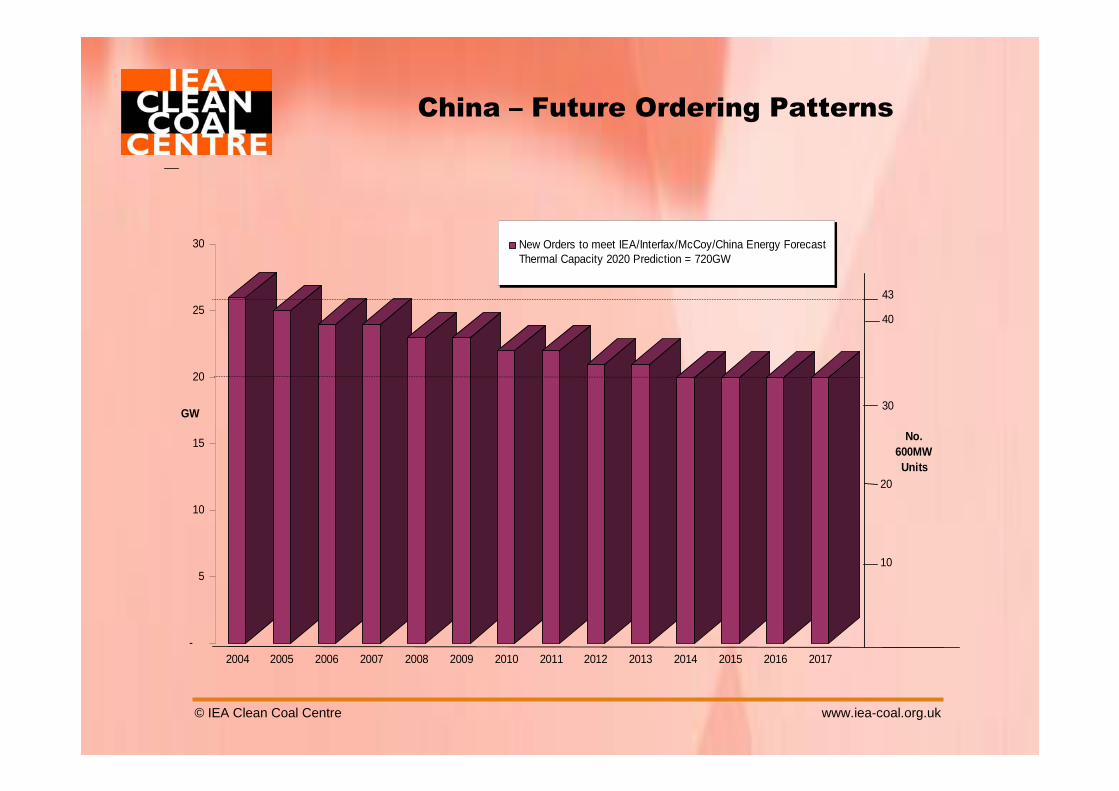
China – Future Ordering Patterns
-
5
10
15
20
25
30
2004 2005 2006 2007 2008 2009 2010 2011 2012 2013 2014 2015 2016 2017
New Orders to meet IEA/Interfax/McCoy/China Energy ForecastThermal Capacity 2020 Prediction = 720GW
GW
10
20
30
40
43
No.600MWUnits
© IEA Clean Coal Centre www.iea-coal.org.uk
India and IEA Clean Coal Centre
The CCC has a longstanding relationship with Bharat Heavy Electrical Ltd (BHEL) who are India’s biggest power plant equipment manufacturer: state owned
BHEL is a sponsor member of the CCC
Significant recent reports with Indian aspects
o Improving Efficiencies of Power plant in Developing Countries (2003)
o Use of coal in areas of water shortage (2005)
o Coal Upgrading to reduce CO2 Emissions (2002)
© IEA Clean Coal Centre www.iea-coal.org.uk
Coal in India
India has recoverable coal reserves estimated as 92 Gt (cf 247 Gt in the USA, 115 Gt in China and 220,000 in the UK)
Two-thirds of the coal is used for power generation, and India has acute power shortages in many parts and needs to increase capacity
India’s coals are mainly low grade with a high ash content (40% cf UK or traded coal at 10%) but a low sulphur content (<0.5%)
Production is 360Mt/y of which 50 Mt is mined underground and 25 Mt is low rank (young) coal
Investment in power generation capacity is slow. Planned capacity additions in each 5-year plan fall well short of planned additions
© IEA Clean Coal Centre www.iea-coal.org.uk
Coal in India
Use of coal washeries to upgrade the coal used would make a significant contribution to increasing plant efficiency and reducing GHGs (and this is probably true in China as well)
India needs to use clean coal technologies for all new plant, and to upgrade many older ones
New mega plants are under discussion (up to 4000 MWe size) to be sited either at the minemouth, thus eliminating coal transport, OR on the coast, opening the possibility of importing coal
About 15 Mt/y of steam coal is imported now, and some estimates suggest that it will be 75 Mt/y by 2010
Intentions to introduce supercritical PC boilers
© IEA Clean Coal Centre www.iea-coal.org.uk
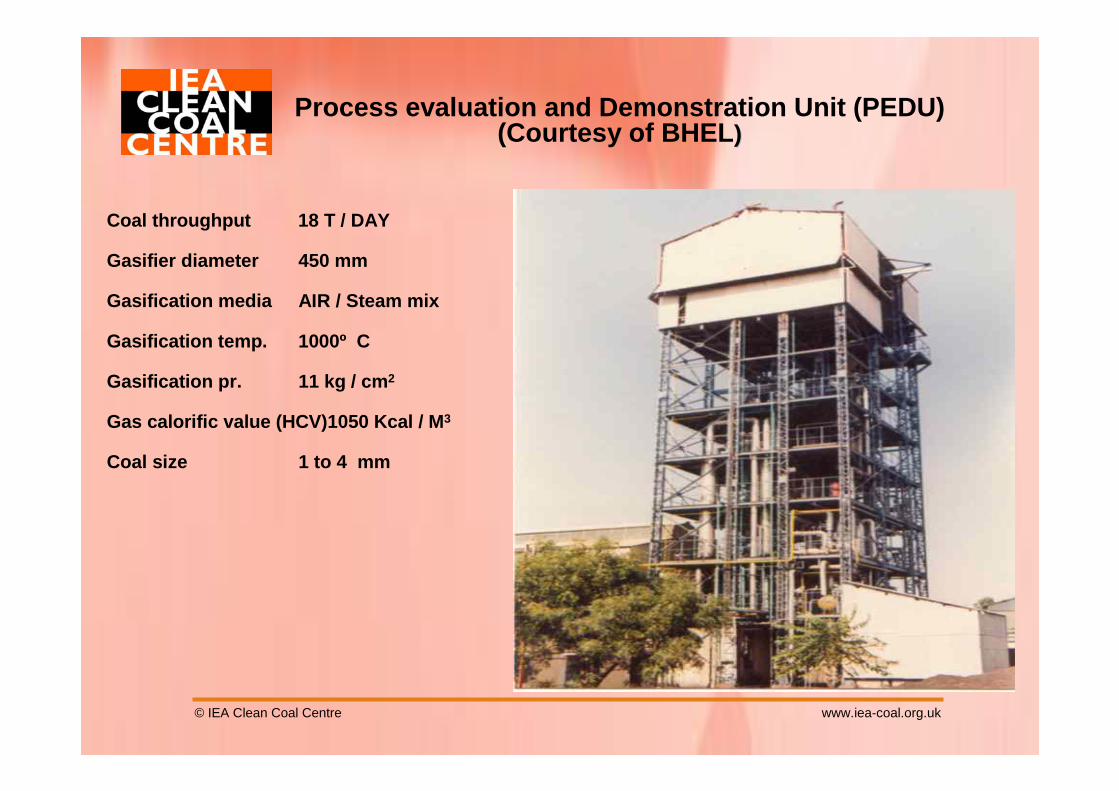
Coal throughput 18 T / DAY
Gasifier diameter 450 mm
Gasification media AIR / Steam mix
Gasification temp. 1000º C
Gasification pr. 11 kg / cm2
Gas calorific value (HCV)1050 Kcal / M3
Coal size 1 to 4 mm
Process evaluation and Demonstration Unit (PEDU)(Courtesy of BHEL))
© IEA Clean Coal Centre www.iea-coal.org.uk
THE ENDThank you for listening
Tel + 44 (0) 20 8780 2111
IEA Clean Coal Centre, Gemini House, 10-18 Putney Hill, London SW15 6AA
www.iea-coal.org.uk


