
iii
MODELLING TRACEABILITY OF KTMB TRAIN PASSENGER
ABDUL HADI BIN HASHIM
A project report submitted in fulfillment of the requirement for the award of the
Degree of Master of Mechanical Engineering
Faculty of Mechanical and Manufacturing Engineering
Universiti Tun Hussein Onn Malaysia
JULY 2015

vii
ABSTRACT
The main objective of this study was to develop a model for traceability of train
passengers. To achieve this objective, KTMB as a main national railway operator
had been used as a model for study. As there are many different types of rail
passenger transport services provided by KTMB, Ekspress Rakyat 1 & 2 had been
selected to serve as a model. Basis of this study was that there are no such models
ever developed for the existing railway system. The scope of the research was
focused between KL Sentral and Ipoh Station only. The software used to create the
model was ARENA Simulation Software (student version). ARENA software was
also able to create simulations and animations that were used in this study. Due to
data provided by KTMB was too general, interview with staff of KTMB like training
managers, station managers, trainers and drivers has been done to obtain more
detailed information. As a result, Modelling Traceability of Train Passenger was
managed to develop. The simulation results show that there are certain things that
need to be addressed by the KTMB. Among the things, there are stations which had
high volatility passengers. There are also stations which has a number of passengers
who boarded the train more than come down from the train at the same station. In
addition, there are also stations which show the number of passengers who boarded
the train in the opposite direction more than the other way around. With this model,
it’s hoped it will help the KTMB improve their passenger rail services. In addition,
this model can also be used as a guide for researchers in the future.

viii
ABSTRAK
Objektif utama kajian ini dijalankan adalah untuk menghasilkan satu model untuk
mengesan penumpang keretapi. Ke arah mencapai matlamat ini, KTMB selaku
peneraju utama sistem pengangkutan keretapi negara telah dipilih untuk dijadikan
model kajian. Memandangkan terdapat banyak jenis perkhidmatan keretapi
pengangkutan penumpang yang disediakan oleh KTMB, Ekspress Rakyat 1 & 2 telah
dipilih untuk dijadikan model. Asas kajian ini dijalankan ialah kerana tidak terdapat
model yang sebegini pernah dihasilkan untuk sistem keretapi sediada. Skop kajian
pula dihadkan antara Stesyen KL Sentral hingga Ipoh sahaja. Perisian yang
digunakan untuk membuat model ini ialah ARENA (versi pelajar). Perisian ARENA
ini juga mampu membuat simulasi beserta animasi yang turut digunakan dalam
kajian ini. Disebabkan data yang diberikan oleh KTMB terlalu umum, temubual
bersama staf-staf KTMB seperti pengurus latihan, pengurus stesyen, pelatih serta
pemandu telah dilakukan bagi mendapatkan maklumat yang lebih terperinci. Hasil
daripada itu, model pengesanan penumpang keretapi KTMB ini berjaya dihasilkan.
Keputusan simulasi menunjukkan terdapat beberapa perkara yang perlu diberi
perhatian oleh pihak KTMB. Antaranya, terdapat stesyen yang mempunyai kadar
turun naik penumpang yang tinggi. Terdapat juga stesyen yang mempunyai bilangan
penumpang yang naik lebih ramai berbanding yang turun di stesyen yang sama.
Selain itu, terdapat stesyen yang mempunyai perbezaan jumlah penumpang turun
naik yang agak ketara mengikut arah perjalanan di stesyen yang sama. Dengan
adanya model ini, diharapkan ia dapat membantu pihak KTMB menambahbaik
sistem perkhidmatan keretapi penumpang mereka. Selain itu, model ini juga boleh
dijadikan sebagai panduan kepada penyelidik di masa akan datang.

ix
TABLE OF CONTENTS
TITLE
DECLARATION
DEDICATION
ACKNOWLEDGEMENT
ABSTRACT
CONTENTS
i
ii
v
vi
vii
ix
LIST OF FIGURES
LIST OF TABLES
xii
xv
CHAPTER 1 INTRODUCTION
1.1 General background
1.2 Problem statement
1.3 Objective
1.4 Scope
1.5 Significance of study
1
1
2
3
3
3
CHAPTER 2 LITERATURE REVIEW
2.1 Description Of Keretapi Tanah Melayu
Berhad (KTMB)
2.2 Description of Traceability
2.3 Description of RFID
2.4 Description of GPS
2.5 Traceability System Incorporating 2D
Barcode And RFID Technology
2.6 RFID-Enabled Track And Traceability In
Job-Shop Scheduling Environment
4
4
6
8
9
10
12

x
2.7 A Smart Model For Urban Ticketing Based
On RFID Applications
2.8 Missouri Freight And Passenger Rail
Capacity Analysis
2.9 Modeling And Simulation Of Urban
Traffic Signals
2.10 Summary
13
14
14
15
CHAPTER 3 METHODOLOGY
3.1 Methodology for Modelling
3.1.1 System Study
3.1.2 Problem Identification
3.1.3 Data Collection
3.1.4 Assumption
3.1.4.1 Limitation of Project
3.1.5 Model Development
3.1.5.1 Modelling for Simulation of Train
3.1.5.2 Modelling for Ridership of
Ekspress Rakyat 2 (Eastbound)
3.1.5.3 Modelling for Ridership of
Ekspress Rakyat 1 (Westbound)
3.1.6 Model Verification
3.1.6.1 Train Movement Model
Verification
3.1.6.2 Ridership Model Verification
3.1.6.3 Model Animation
3.2 Summary
16
16
18
18
19
22
27
28
28
30
34
36
36
39
44
45
CHAPTER 4 RESULT AND DISCUSSION
4.1 Results for Model of Ekspress Rakyat 1
4.2 Results for Model of Ekspress Rakyat 2
4.3 Results for Animation of Ekspress Rakyat
1 & 2
46
46
51
56

xi
4.4 Summary
58
CHAPTER 5 CONCLUSION AND RECOMMENDATION
5.1 Conclusion
5.2 Recommendations
59
59
60
REFERENCES 61
APPENDIX 63

xii
LIST OF FIGURES
2.1
2.2
2.3
2.4
2.5
2.6
2.7
2.8
2.9
2.10
Sample of KTMB’s Intercity Trains
Rail track, stations and stops for KTM Intercity
and KTM Komuter
Traceability across the supply chain
Basic diagram of RFID principle
Sample diagram of GPS principle
Different batch encodings for product
traceability
A logical flow of OPT manufacturing processes
The proposed model structure by Gnoni, Rollo
and Tundo
Simulation model of the intersection
Traffic flow of the intersection
4
5
7
8
9
11
12
13
14
15
3.1
3.2
3.3
3.4
3.5
3.6
3.7
3.8
3.9
3.10
Methodology for Modelling
KTMB Network
KTM Intercity Train Schedule (North & South
Line)
Model of Train Movement from KL Sentral to
Ipoh
Model of Train Movement from Ipoh to KL
Sentral
Modules for Train at KL Sentral Station
Modules for Train at KL Station
Modules for Train at Tanjung Malim Station
Modules for Train at Kampar Station
Modules for Train at Batu Gajah Station
17
19
20
28
29
29
29
29
30
30

xiii
3.11
3.12
3.13
3.14
3.15
3.16
3.17
3.18
3.19
3.20
3.21
3.22
3.23
3.24
3.25
3.26
3.27
3.28
3.29
3.30
3.31
3.32
3.33
3.34
3.35
3.36
3.37
3.38
Modules for Train at Ipoh Station
Model of Train Ridership from KL Sentral to
Ipoh
Modules for previous Ridership at KL Sentral
Station
Modules for new Ridership at KL Sentral
Station (start)
Modules for Ridership at KL Station
Modules for Ridership at Tanjung Malim
Station
Modules for Ridership at Kampar Station
Modules for Ridership at Batu Gajah Station
Modules for Ridership at Ipoh Station (end)
Modules for previous Ridership at Ipoh Station
Modules for previous Ridership at Ipoh Station
Modules for Ridership at KL Sentral Station
(end)
Create “Ekspress Rakyat 1” module (Train)
Station “from South” module (Train)
Route “to KLS” module (Train)
Station “KLS” module (Train)
Process module (Train)
Route “KLS to KL” module (Train)
Create module (previous ridership)
Station module (previous ridership)
Route module (previous ridership)
Station “KLS” module (previous ridership)
Dispose module (previous ridership)
Create module
Process module
Decide module
Route module
Station module
30
31
31
32
32
33
33
34
34
35
35
35
36
37
37
37
38
38
39
39
40
40
40
41
42
42
43
43
xiv
3.39
3.40
3.41
Dispose module
Animation for Ekspress Rakyat 1
Animation for Ekspress Rakyat 2
44
45
45
4.1
4.2
4.3
4.4
4.5
4.6
4.7
4.8
4.9
4.10
4.11
4.12
4.13
Number Out of Entities
Entity Time
Entity Number
Scheduled Utilization
Resource Usage
Number Out of Entities
Entity Time
Entity Number
Scheduled Utilization
Resource Usage
Ekspress Rakyat 1
Ekspress Rakyat 2
Total Ridership by Station
46
47
48
49
50
51
51
53
54
55
56
56
57

xv
LIST OF TABLES
3.1
3.2
3.3
3.4
3.5
3.6
3.7
3.8
Number of Ridership (annual basis)
Total ridership per day (average)
Total Ridership of Ekspress Rakyat 1 (by
Station)
Total Ridership of Ekspress Rakyat 2 (by
Station)
Distribution of Ridership Fluctuate (Ekspress
Rakyat 1)
Distribution of Ridership Fluctuate (Ekspress
Rakyat 2)
Percentages of Ridership Fluctuate (Ekspress
Rakyat 1)
Percentages of Ridership Fluctuate (Ekspress
Rakyat 2)
21
22
23
24
25
25
26
26
4.1 Summary of Ridership 56

1
CHAPTER 1
INTRODUCTION
1.1 General background
In many countries both developed and developing, the railway system plays an
important role in many things. Now it looks like there was a race in railway
technology where some developed countries including China makes huge
investments to create the latest technology that relies on speed and comfort of each
rail system. According to reports the railway industry, today's fastest passenger
facilities and the latest was a high speed domestic train in China. But each country
proud with their HST and continuously strive to improve their train.
In Malaysia, as a developing country, railway system plays an important role
towards achieving Vision 2020. The railway system was used not only for passengers
but also for the transportation of goods. Therefore, a good rail transport systems must
be developed to keep up with demand and the rapid development towards year 2020.
Malayan Railway was the main railway operator in Peninsular Malaysia. Formerly it
was known as an agency under the Malayan Railway Administration, and then now
known as KTMB following the effects of corporatization of government-led
campaign in 1992. However, KTMB was still wholly owned by the federal
government. The history of coach system began during the British colonial era, when
the railway was originally built to transport tin. The train fare was quite reasonable,
but speed Intercity trains (intercity) lower in narrow path often leads KTMB
transport less competitive compared to other modes of transportation.
Despite all the efforts and improvements has been made since it was
established, the fact that passengers were still plagued with the same problems of
2
timeliness to the railway station. KTMB while also still faced similar problems of
passengers boarded the train without a ticket but safely reach their destinations.
So, this project was study the current train passenger traceability and
identifies the opportunity of improvements. Parameters such as utilization, working
time, schedule deviation, number of passengers and ticketing system has been use.
The others factor such as time of fluctuate passengers, peak time of service and load
capacity of power source has been considered.
Traceability was defined as the degree to which a relationship can be
established between two or more products of the development process, especially
products having a predecessor–successor or master–subordinate relationship to one
another; for example, the degree to which the requirements and design of a given
software component match [1]. Traceability implies keeping track of the
relationships between requirements, design artifacts, source code, test cases, etc. [1].
1.2 Problem statement
According to KTMB Annual Report 2012, the 2012 revenue for ETS had shown an
increase of 33.5% from RM23.9 million to RM31.9 million. The number of
passengers also increased to 33.3% from 0.9 million in 2011 to 1.2 million in 2012.
KTM Intercity was expected an increase in revenue and ridership should the level of
service especially in the area of punctuality can be improved.
Despite the increase of the ETS revenue and the number of passenger, KTM
Intercity revenue in 2012 showed a decrease of 11.1% compared to 2011 which is
from RM91.8 million in 2011 to RM81.6 in 2012. The number of passengers for the
year 2012 recorded a ridership of 3.1 million compared to 3.7 million in 2011 which
is a 16.2% reduction. However, the ETS had shown greater improvement overall
since the service was introduced in August 2010.
Looks at this situation, something should be done on KTM Intercity train
service (Normal Train). The main focus was to improve in terms of the ridership.
What can be done to convert a decrease of 16.2% to an increase of 16.2%. It was
because the issue of timeliness to catch a train. Or community trust issues on trains.
Or the problem of passengers traceability before, during and after boarded the train.

3
Results of interviews with KTMB staff shows; there was no existing model in
KTMB to track passenger travel in terms of passenger numbers fluctuate from station
to station. Therefore, the study on the current train passenger traceability system
should be implement to see either there are opportunity of improvements to be done
or not. Then, develop the model for traceability of KTMB ridership.
1.3 Objective
The objectives of this project are:
i. To identify the opportunity of improvements in terms of passenger
traceability.
ii. To develop the model for traceability of KTMB ridership.
1.4 Scope
i. The train route to be study was between Ipoh and KL Sentral.
ii. Only two model of KTM Intercity (Normal Train) to be studies which are
Ekspres Rakyat 1 and Ekspres Rakyat 2.
1.5 Significance of study
Identify the opportunity of improvement to model the traceability of the ridership for
KTMB Intercity (Normal Train). Its can help KTMB itself to simulate the forecast of
ridership using that model. It also can be used by other rail operator to simulate their
ridership and also for future research as a guide.
4
CHAPTER 2
LITERATURE REVIEW
In this chapter, a number of articles related to traceability systems in general and of
railway passengers in particular has been reviewed. First, description and operating
system of Keretapi Tanah Melayu Berhad (KTMB) were explained. Then, the
reviewed on the related previous articles were discussed includes the articles about
railway ticket system in general and of current system at Malaysia in particular and
also the articles about RFID, bar code system and GPS were discussed.
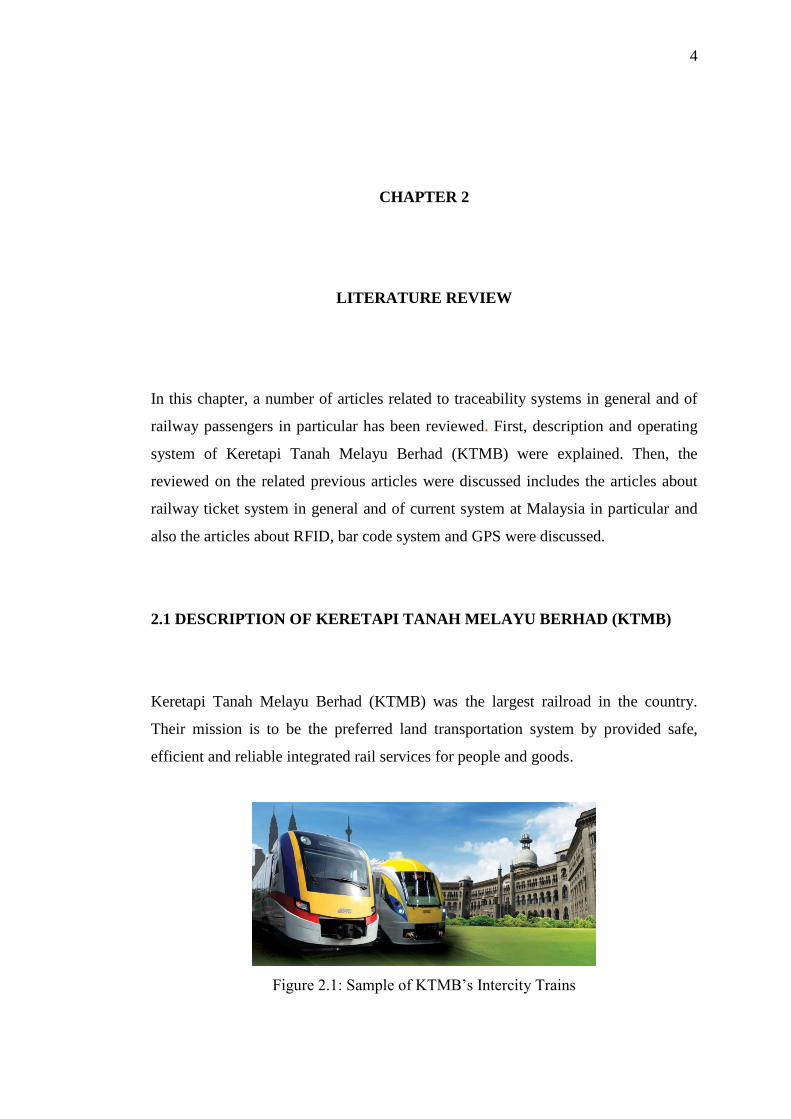
2.1 DESCRIPTION OF KERETAPI TANAH MELAYU BERHAD (KTMB)
Keretapi Tanah Melayu Berhad (KTMB) was the largest railroad in the country.
Their mission is to be the preferred land transportation system by provided safe,
efficient and reliable integrated rail services for people and goods.
Figure 2.1: Sample of KTMB’s Intercity Trains

5
The first railway track in Malaysia was built in 1885. This was a 12.8 km
length of road from the tin mining town of Taiping to Port Weld known today as
Kuala Sepetang [11,12]. This was followed by the establishment of the Keretapi
Tanah Melayu (KTM) in 1946 before it was privatized in 1992 and known as the
Keretapi Tanah Melayu Berhad (KTMB) [12]. Figure 2.1 shows the sample of
KTMB’s Intercity Trains. Railway service over 100 years old has gone through many
changes. Starts with coal locomotives, diesel engines and diesel power, to our
commuter service using electricity was first introduced in 1995. KTMB control 1791
km length, 1000 mm gauge railway network, 1655 km in Peninsular Malaysia [12]. It
consists of two main lines which are West coast line and East coast line and several
branch lines. Now, KTM offers four types of services include KTM Intercity, KTM
Cargo, KTM Commuter and KTM Distribution. Figure 2.2 shows rail track for
KTMB services which include KTM Intercity and KTM Komuter.
Figure 2.2: Rail track, stations and stops for KTM Intercity and KTM Komuter

6
In this project, the focus of the study was to KTM Intercity (Normal Train).
Intercity train service was a service that was introduced by KTM since more than a
decade ago. As introduce additional services to the people by give them choices in
terms of diversity coach and travel destinations include Peninsular Malaysia. Change
for change has been implemented to provide services in a comfortable and safe
journey to your destination of choice in the shortest time possible. KTM managed
multiple services under KTM Intercity brand. Most of these services operate from
Station Kuala Lumpur Sentral. However, there was a train service only runs along
the East Coast route between dense and Gemas and next headed to Singapore. There
was a cross-border rail services operate between Butterworth and Bangkok,
Thailand.
2.2 DESCRIPTION OF TRACEABILITY
Traceability has been defined variously. According to Ivan Santiago (2012)
traceability was defined as the extent to which a relationship can be established
between two or more of the product development process, especially products have a
predecessor-successor or master-slave relationship to one another; for example, the
extent of the requirements and design of software components given match. [1].
Traceability implies keeps track of the relationships between requirements, design
artifacts, source code, test cases, etc. [1].
According to the International Standards Organizations (ISO8492: 1995),
traceability was the ability to trace the history, application or location of an entity, by
means of recorded identifications [9]. Several organizations and researchers have
defined traceability further to their areas of considerations in the traceability, which
are as follows [2]:
• “The ability to follow or study out in detail, or step by step, the history of a
certain activity or a process” [13].
• “Traceability is the ability to track a product batch and its history through
the whole, or part, of a production chain from harvest through transport, storage,
processing, distribution and sales or internally in one of the steps in the chain” [14].

7
• “Traceability is a concept relating to all products and all types of supply
chain" [15].
Proper traceability systems also have the potential to reduce the possibility of the
supplier or suppliers responsible for product safety problems by provides your data
was documented effect to prove that they comply with the requirements of law and
not risk [2].
Figure 2.3: Traceability across the supply chain [10]
According to Yong-Shin Kang and Yong-Han Lee [5], traceability in logistics
was the ability of participants to track products throughout the supply chain by
means of either products and/or containers identifier in a backward and/or forward
direction. In today's competitive economic environment, traceability was an
important concept related to all products and all kinds of supply chains. To be more
specific, it can provide companies the basic information required for the realization
of supply chain optimization, product safety, better pond management, and better
customer service [5].
In terms of manufacturing perspective, Nair and Shah [7] has defined
traceability as knows what happens to the product through the manufacturing process
- from initial raw materials to final product, including detailed information about
operators who work on the product (or component built or mixed into the product),

8
equipment and tools used in the manufacturing process, work that has been done, and
had the status of production process control, among others [7].
2.3 DESCRIPTION OF RFID
RFID is an automatic identification field that has quietly been gaining momentum in
recent years and is now seen as a way to radically improve data handling process,
free in many ways to other data collection technologies such as bar coding. RFID
stands for Radio Frequency Identification Device that holds a small amount of data
that is unique; serial number or other unique attributes of the item. Data can be read
from a distance of not having contact or line of sight necessary [6].
The largest use of RFID is to trace and consumer goods supply chain. Track
shipment from the factory, containers in transit, unloading, the arrival of each
package, looking at the shelf where the package is stored, it is suspended, out of
stock, theft, light sensing RFID can detect if the container is opened [6].
Figure 2.4: Basic diagram of RFID principle

9
2.4 DESCRIPTION OF GPS
GPS is stands for Global Positioning System. According to Dr. Subra (2007), GPS is
a constellation of satellites orbiting the Earth that is retained by the United States
Government to determine the geographical position at and above the Earth's surface.
It consists of three segments which is user segment, control segment and space
segment [6]. The first GPS satellite was launched in 1978 and full constellation
achieved in 1994. This satellite built to last about 10 years and about 2,000 pounds,
17 feet across. The power of the transmitter is just 50 watts or less [6].
Figure 2.5: Sample diagram of GPS principle

10
2.5 TRACEABILITY SYSTEM INCORPORATING 2D BARCODE AND
RFID TECHNOLOGY [3]
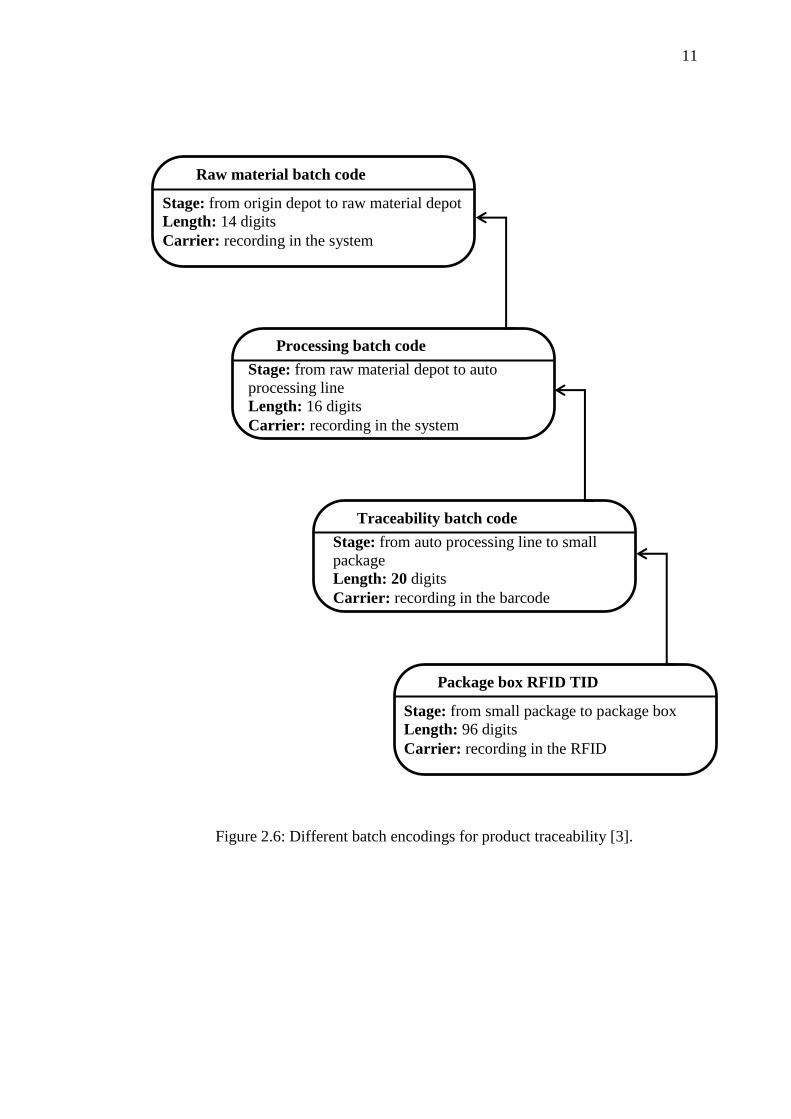
Based on article by Jian-Ping Qian and friends [3], 2D barcode can incorporate with
radio frequency identification (RFID) technology to develop the Traceability System.
They designed the encoding rules for the raw material, processing and traceability
batches. Then, label with the Quick Response Code (QR Code) has been attached to
a small package of products to connect them with their processing information, and
RFID tag has been attached to the box to record information logistics. They develop
a tracking system based on group identification and record keeping. The Traceability
System management and detection capacity was assessed using contrast experiment.
This experiment was divided into five parts, including recording of; raw material
data, data processing, package data, logistics data and tracking inquiries. The results
show that the system is dominant in the total consumption of five parts has been
reduced by 113%, and accuracy of five parts, which increased by 8% min. QR Codes
and RFID recognition accuracy was assessed using tests with different reading
distance. Costs and income variations in application systems have been analyzed by
the survey. Results showed that the total cost increased by 17.2% to apply the
system. Compared with the cost, increase sales revenue is obvious, and it reached
32.5%. Given the good results of the assessment, the system has good potential in
medium or large enterprise applications [3].
11
Figure 2.6: Different batch encodings for product traceability [3].
Raw material batch code
Stage: from origin depot to raw material depot
Length: 14 digits
Carrier: recording in the system
Processing batch code
Stage: from raw material depot to auto
processing line
Length: 16 digits
Carrier: recording in the system
Traceability batch code
Stage: from auto processing line to small
package
Length: 20 digits
Carrier: recording in the barcode
Package box RFID TID
Stage: from small package to package box
Length: 96 digits
Carrier: recording in the RFID

12
2.6 RFID-ENABLED TRACK AND TRACEABILITY IN JOB-SHOP
SCHEDULING ENVIRONMENT [4]
From the study by Jongsawas Chongwatpol and Ramesh Sharda [4], the paper study
about RFID-based traceability approach to improve production scheduling. This
study was conducted to explore the option of scheduling enabled by RFID-based
tracking system. Jongsawas and Ramesh proposes a visibility-based scheduling
information (VBS) new rules that use information generated from real-time tracking
system for work in process (WIPS) tracking, parts and components, and raw
materials to adjust production schedules. Then they evaluate the performance of
visibility-based visual information on classical scheduling rules. Simulation results
show that RFID-based scheduling rule produces better performance compared to
traditional scheduling methods with respect to the cycle time, machine utilizations,
arrears, and penalty costs. Jongsawas and Ramesh also note that the value of the
visibility of this information is more relevant when demand varies widely and/or
operating interference caused [4].
Figure 2.7: A logical flow of OPT manufacturing processes [4]

13
2.7 A SMART MODEL FOR URBAN TICKETING BASED ON RFID
APPLICATIONS [11]
In the paper of Gnoni, Rollo and Tundo (2009), the topic is to propose an integrated
model for managing ticketing in an inter-modal urban transport network. A model
based on the use of a variety of Radio frequency identification (RFID) in order to
detect and track people through transport system across the city [11]. Gnoni, Rollo
and Tundo point out that, movement of people and goods currently represents one
interesting field of application for innovative ICT tools as Radio Frequency
Technology (RFID). RFID technology is increasingly spreading in logistics
activities, such as warehouse management, supply chain tracking. RFID can support
a vehicle and the automatic identification system with reduced investment costs. In
this paper, Gnoni, Rollo and Tundo propose the Integrated Mobility System (IMS),
which aims to improve management performance tickets in public transport networks
based on RFID technology intensive applications. The authors conclude that the
RFID has been proven to be effective tools to develop intelligent transport systems
[11].
Figure 2.8: The proposed model structure by Gnoni, Rollo and Tundo [11]
14
2.8 MISSOURI FREIGHT AND PASSENGER RAIL CAPACITY ANALYSIS
[18]
This paper was study about freight and passenger rail capacity. The objective of this
study was to develop a list of prioritized rail enhancements that address the
performance of the railway passenger and freight trains on the Union Pacific from St.
Louis to Kansas City to improve the timeliness of service and reduce delay in the
delivery of freight. This study was used an integrated systems analysis and modeling
approach. From their analysis, they were generate a set of 6 primarily train
enhancement alternative and also recommendations respect to delay reduction and
capital investment.
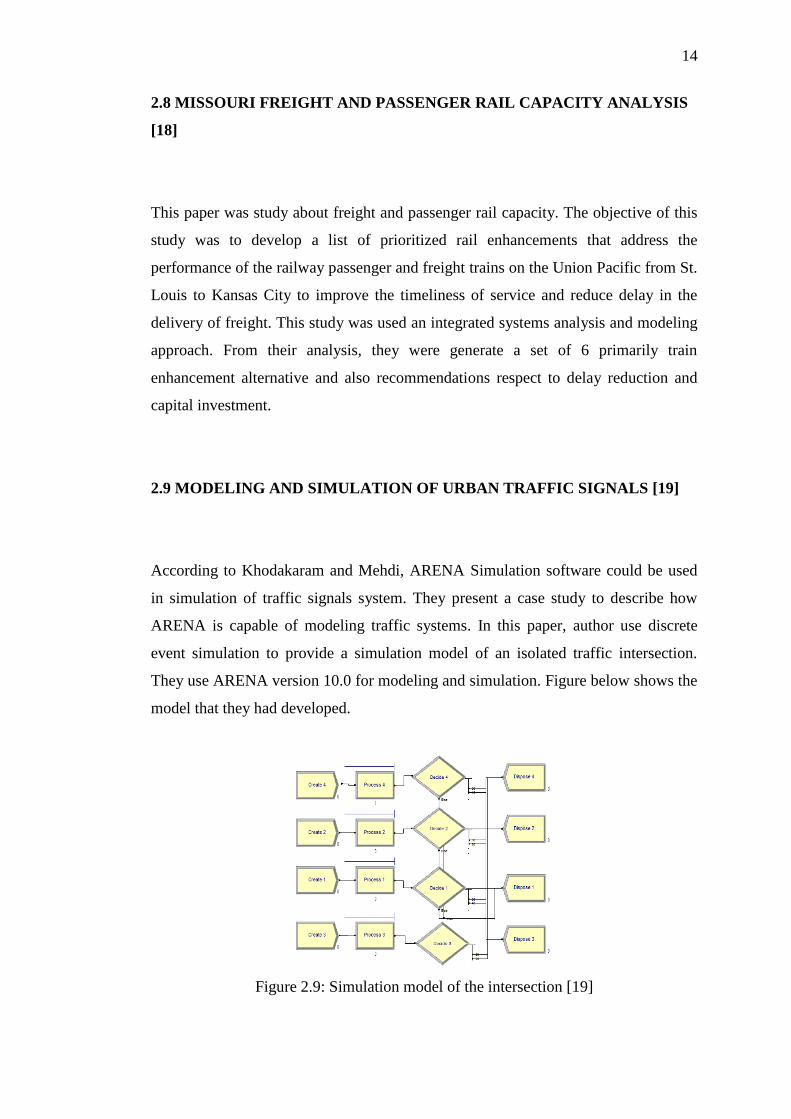
2.9 MODELING AND SIMULATION OF URBAN TRAFFIC SIGNALS [19]
According to Khodakaram and Mehdi, ARENA Simulation software could be used
in simulation of traffic signals system. They present a case study to describe how
ARENA is capable of modeling traffic systems. In this paper, author use discrete
event simulation to provide a simulation model of an isolated traffic intersection.
They use ARENA version 10.0 for modeling and simulation. Figure below shows the
model that they had developed.
Figure 2.9: Simulation model of the intersection [19]

15
They develop the model to simulate on one of the main intersections of the urban
traffic system of Bushehr, Iran which is consist of Emam, Bazargani, Bahonar and
Helali streets.
Figure 2.10: Traffic flow of the intersection [19]
The result of this study was used to improve the traffic flow at the intersection. It
shows that the proposed model can be used as a basis for analysis of different control
policies such as the timing of light periods of traffic lights.
2.10 SUMMARY
Based on a review of previous studies related to the topic of this project, there has
not been any research done on the traceability of train passenger in general and
particularly in Malaysia. In addition, there was no model ever produced to explain
about how the movement of train passenger at every station traced from the
beginning to the end of the trip. Besides that, ARENA software can be used to
generate models related to the movement of passengers, vehicles and traffic.
Therefore, this study was the starting point of research on the traceability of
passenger on public transport in general and trains in particular. ARENA software
would be used to generate an appropriate model.

16
CHAPTER 3
METHODOLOGY
3.1 Methodology for Modelling
In this project, Arena 12.0 software (student version) has been used for modelling
and simulation of the case study. Arena was a powerful modelling (and also
simulation) tool for creates animated and dynamics models [20]. It was very effective
and applicable instrument for modelling the systems of manufacturing material
process, call centers, telecommunication queuing system and etc.

17
Figure 3.1: Methodology for Modelling
START
System Study
Problem Identification
Data Collection
Assumption
Model Development for
Traceability of Ridership
Model Verification
Result
OK?
Analysis & Conclusion
END
Not
OK

18
3.1.1 System Study
At this stage, whatever system or service related to the ridership has been identified.
Then, any rooms for improvement were taken as an opportunity to do research.
KTMB services can divide into 5 unit/subsidiaries which are:
i. KTM Intercity: Providing passenger transport services intercuty in Peninsular
Malaysia.
ii. KTM Kargo: Provides freight services between designated areas in
Peninsular Malaysia.
iii. KTM Komuter: First electric train service in Malaysia, two routes; Batu
Caves - Port Klang and Tanjung Malim – Sungai Gadut, provides ladies
coach.
iv. KTM Distribution: door to door delivery of parcels and documents, station to
station delivery of parcels and documents, transportation of motorcycles,
flowers and perishables delivery & special projects.
v. KTM Parking: wholly owned subsidiary of Keretapi Tanah Melayu Berhad
(KTMB), was established in 1994 with the sole purpose of managing car
parks at selected train stations.
The study was focus on the KTM Intercity ridership.
3.1.2 Problem Identification
Generally, in the KTMB passenger train system, there was no model generated / used
to trace the movement of ridership. In the existing system only display the
information about the starts station and ends station of the ridership. Passenger
detection used only the conductor to be checked manually tickets on the train when
the train was runs. Therefore, the model for traceability of the ridership has been
developed using ARENA software.

19
3.1.3 Data Collection
During the early stages of this study, data collection was done by visited the official
website of KTMB, http://www.ktmb.com.my/. Although not much data from the
website which can be used in this study, there are still some data and information that
has been taken as a reference. Among the data and information obtained are KTM
intercity train schedule (North and South line), KTMB Network and the annual
report KTMB 2012.
Figure 3.2: KTMB Network
(Source: http://www.ktmintercity.com.my)

20
Figure 3.3: KTM Intercity Train Schedule (North & South Line)
(Source: http://www.ktmintercity.com.my)
21
Both data in previous figure (KTMB Network & KTM Intercity Train Schedule)
used to create the modules and parameters in ARENA software.
Then, to get more data about KTMB, researcher decides to go to KTMB Ipoh
Station and arrange an appointment with the Station Manager. A lot of general
information about KTMB had been collected as a result of the meeting. Among the
information available was about privatization KTM in 1992, double track projects
and also something about the history of KTM progress in Malaysia. Result from that,
he advice to go to their training center which is located at Batu Gajah (near Batu
Gajah Railway Station). The training center called MyRA (Malaysian Railway
Academy).
Here was the most information was collected, Malaysian Railway Academy
(MyRA). There, a person most helpful in provided information that needed was Mr.
Muslizam, Senior Manager MyRA part in training. He has agreed to provide any
information required in the project as long as it does not violate the rules of the
company. In exchange, he asked for a copy of the full report of this research to be
placed in their library in MyRA.
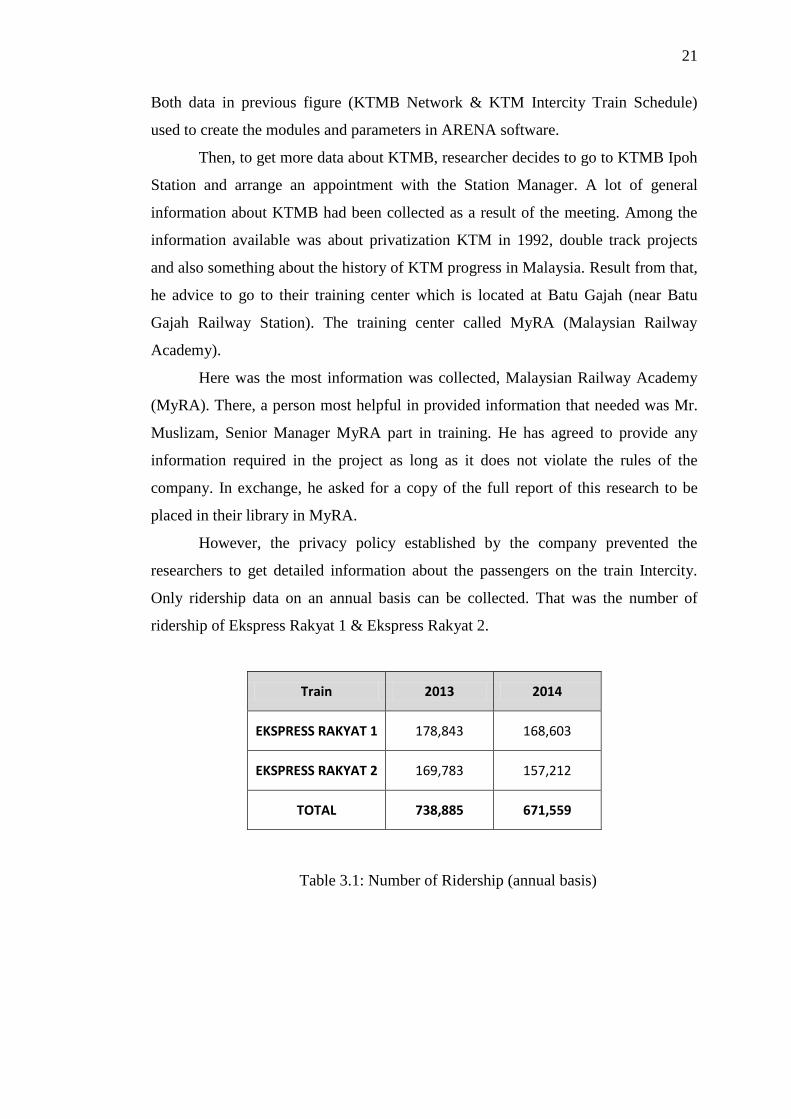
However, the privacy policy established by the company prevented the
researchers to get detailed information about the passengers on the train Intercity.
Only ridership data on an annual basis can be collected. That was the number of
ridership of Ekspress Rakyat 1 & Ekspress Rakyat 2.
Train 2013 2014
EKSPRESS RAKYAT 1 178,843 168,603
EKSPRESS RAKYAT 2 169,783 157,212
TOTAL 738,885 671,559
Table 3.1: Number of Ridership (annual basis)

22
3.1.4 Assumption
Considered the data obtained was too general, a calculation based on the assumption
needs to be done to get the best formula to produce more detailed data. The
assumptions made are based on information from the interview with Mr. Muslizam,
trainers, drivers, station master and station manager. As a result, some tables were
constructed to produce more detailed data.
Train
2014
Total Average (daily)
EKSPRESS RAKYAT 1 168,603 462
EKSPRESS RAKYAT 2 157,212 431
Table 3.2: Total ridership per day (average)
The data above show the total number of ridership used Ekspress Rakyat 1 &
Ekspress Rakyat 2 in 2013 and 2014 and its average per day. None of passenger data
by station was given. Therefore, based on data from the above table, the new table
was created with more detailed data. The table below shows the number of
passengers that volatility in every station along the way Ekspress Rakyat 1 and
Ekspress Rakyat 2.
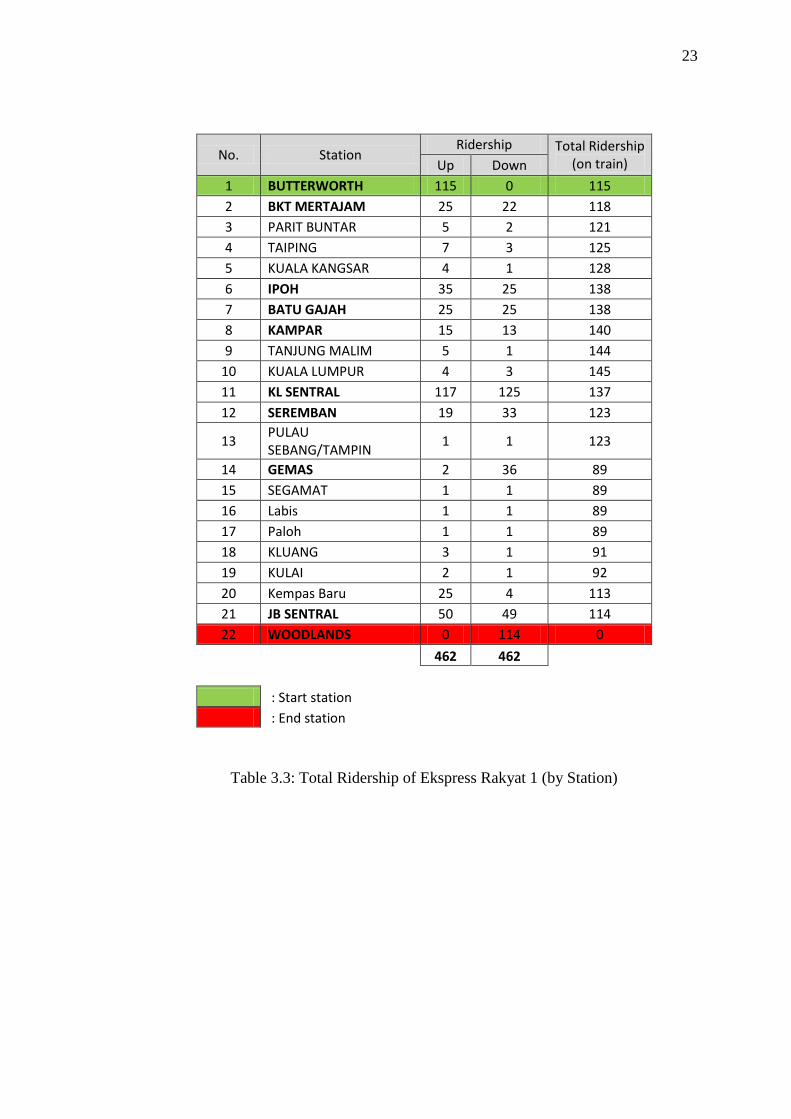
23
No. Station Ridership Total Ridership
(on train) Up Down
1 BUTTERWORTH 115 0 115
2 BKT MERTAJAM 25 22 118
3 PARIT BUNTAR 5 2 121
4 TAIPING 7 3 125
5 KUALA KANGSAR 4 1 128
6 IPOH 35 25 138
7 BATU GAJAH 25 25 138
8 KAMPAR 15 13 140
9 TANJUNG MALIM 5 1 144
10 KUALA LUMPUR 4 3 145
11 KL SENTRAL 117 125 137
12 SEREMBAN 19 33 123
13 PULAU SEBANG/TAMPIN
1 1 123
14 GEMAS 2 36 89
15 SEGAMAT 1 1 89
16 Labis 1 1 89
17 Paloh 1 1 89
18 KLUANG 3 1 91
19 KULAI 2 1 92
20 Kempas Baru 25 4 113
21 JB SENTRAL 50 49 114
22 WOODLANDS 0 114 0
462 462
: Start station : End station
Table 3.3: Total Ridership of Ekspress Rakyat 1 (by Station)
24
No. Station Ridership Total Ridership
(on train) Up Down
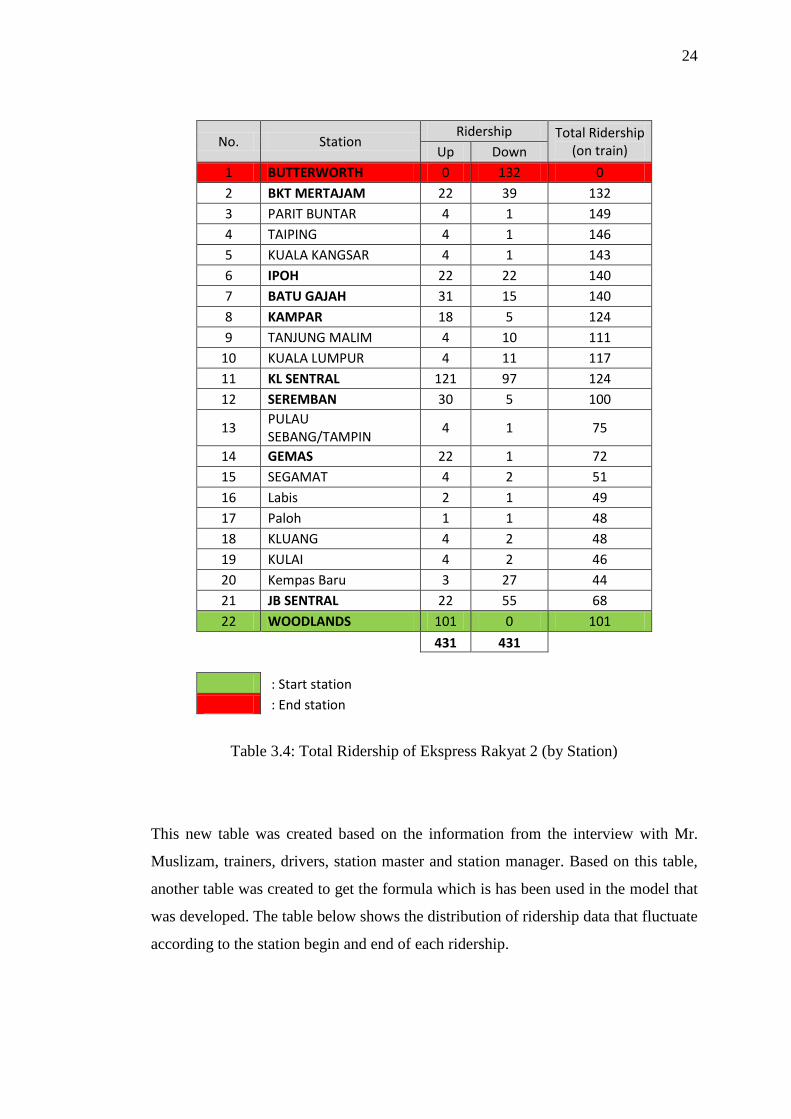
1 BUTTERWORTH 0 132 0
2 BKT MERTAJAM 22 39 132
3 PARIT BUNTAR 4 1 149
4 TAIPING 4 1 146
5 KUALA KANGSAR 4 1 143
6 IPOH 22 22 140
7 BATU GAJAH 31 15 140
8 KAMPAR 18 5 124
9 TANJUNG MALIM 4 10 111
10 KUALA LUMPUR 4 11 117
11 KL SENTRAL 121 97 124
12 SEREMBAN 30 5 100
13 PULAU SEBANG/TAMPIN
4 1 75
14 GEMAS 22 1 72
15 SEGAMAT 4 2 51
16 Labis 2 1 49
17 Paloh 1 1 48
18 KLUANG 4 2 48
19 KULAI 4 2 46
20 Kempas Baru 3 27 44
21 JB SENTRAL 22 55 68
22 WOODLANDS 101 0 101
431 431
: Start station : End station
Table 3.4: Total Ridership of Ekspress Rakyat 2 (by Station)
This new table was created based on the information from the interview with Mr.
Muslizam, trainers, drivers, station master and station manager. Based on this table,
another table was created to get the formula which is has been used in the model that
was developed. The table below shows the distribution of ridership data that fluctuate
according to the station begin and end of each ridership.

61
REFERENCES
1. Ivan Santiago. Model-Driven Engineering as a new landscape for traceability
management: A systematic literature review. Information and Software
Technology 54 (2012) 1340–1356. 2012.
2. Kraivuth Kraisintu & Ting Zhang. The Role of Traceability in Sustainable
Supply Chain Management. CHALMERS UNIVERSITY OF
TECHNOLOGY, Göteborg, Sweden. 2011.
3. Jian-Ping Qian and friends. A traceability system incorporating 2D barcode
and RFID technology for wheat flour mills. Computers and Electronics in
Agriculture 89. 76–85. 2012.
4. Jongsawas Chongwatpol and Ramesh Sharda. RFID-enabled track and
traceability in job-shop scheduling environment. European Journal of
Operational Research 227. 453–463. 2013.
5. Yong-Shin Kang and Yong-Han Lee. Development of generic RFID
traceability services. Computers in Industry 64. 609–623. 2013.
6. Dr. Subra Ganesan. RFID and GPS Technology and Applications. CSE
Department, Oakland University Rochester, MI 48309. USA. 2007.
7. Nair, B., Shah, M. Compliance and Traceability in Manufacturing. Aberdeen
Group, Boston. 2007.
8. Schwägele, F. Traceability from a European perspective. Meat Science, Vol
71, pp. 164-173. 2005.
9. ISO, E.S. (Ed.). European Committee for Standardization. Point 3.16. 1995.
10. GS1. The GS1 Traceability Standard: What you need to know. GS1, GS1,
Brussels. 2007.
11. M.Lowtan, D. I. of T. Rail System in Malaysia. (pp. 1–16). 2004.
12. Mahadzir, S. Keretapi Tanah Melayu [KTM]. Selangor, Malaysia. Cooray’s
House of Publication Sdn Bhd. 2007.

62
13. Webster's Dictionary. Webster's Dictionary, viewed 1 June 2011. 2011.
14. Moe, T. Perspectives on traceability in food manufacture. Trends in Food
Science & Technology, Vol 9, p. 211–214. 1998.
15. Regattieri, A, Gamberi, M and Manzini, R. Traceability of food products:
General framework and experimental evidence. Journal of Food Engineering,
Vol 81, pp. 347-356. 2007.
16. Francisco E. Martínez Martínez. Application of SIMAN ARENA Discrete
Event Simulation Tool in the Operational Planning of a Rail System.
University of Puerto Rico Mayagüez Campus. 2002.
17. M.A. Hofman, L.F. Madsen. Robustness in train scheduling. Master thesis,
IMM, DTU. 2005.
18. James S. & Charles Nemmers. Missouri Freight and Passenger Rail Capacity
Analysis. Final Report, Missouri Department of Transportation. 2007.
19. Khodakaram Salimifard and Mehdi Ansari. Modeling and Simulation of
Urban Traffic Signals. International Journal of Modeling and Optimization,
Vol. 3. 2013.
20. D. A. Takus and D. M. Profozich, ARENA Software Tutorial, in Proceedings
of Simulation Conference, Systems Modeling Corporation, 504 Beaver Street,
Sewickley, Pennsylvania 15143, U.S.A, Winter 1997, pp. 541-544. 1997.


