
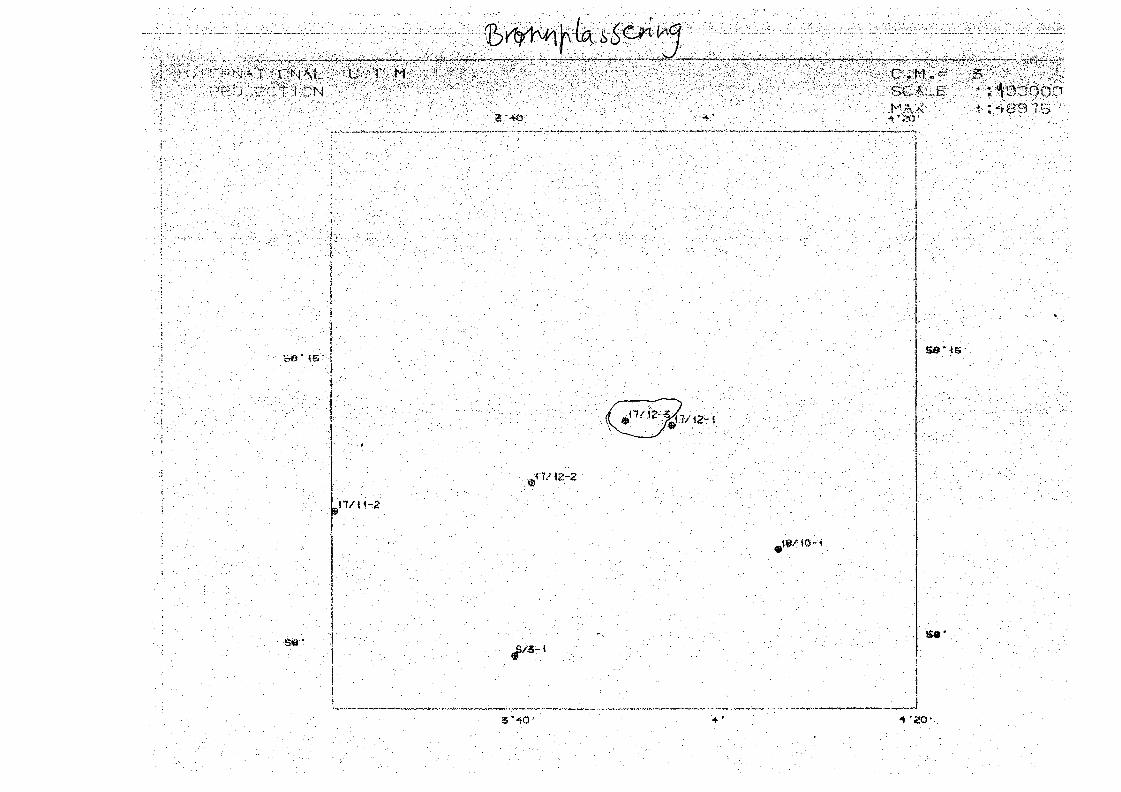
Source Rock Analyses of well 17/12-3
CLIENT
Philips Petroleum, Norway
CLIENT'S REF.:
Mr. Chumahusky
REPORT NO.:
0-262/1/80
IKU
INSTITUTT FORKONTINENTALSOKKELUNDERSØKELSER
Continental Shelf Institute
Håkon Magnussons gt. 1BPostboks 1883
7001 TrondheimTelefon: (075) 15660
Telex: 55548Telegram: "NORSHELF"

Confidential
INSTITUTT FOR KONTINENTALSOKKELUNDERSØKELSER
CONTINENTAL SHELF INSTITUTE
REPORT TITLE
Source Rock Analyses of well 17/12-3
CLIENT
Philips Petroleum, Norway
CLIENT'S REF.:
Mr. Chumahusky
REPORT NO.i
0-262/1/80
AUTHOR (S):
M. Bjorøy, N. Aarhus,J.0. Vigran, T. Vinge
DATE:
13.5.80NO. OF PAGES
48
PROJECT NO.
0-262NO. OF ENCLOSURE
DEPARTMENT:
Organic GeochemistryRESPONSIBLE SCIENTIST:
M. Bjorøy
SUMMARY:
See next page.2 2 MA/(980 '
EJtOUEDIBEKTORATET
KEY WORDS
Source Rock
Based on total organic carbon values and lithology, the analysed sequenseis divided into thirteen zones.Zones A,B,C,D,E,F,G and H, 1200 - 2100 m are all immature with a poorpotential as a source rock for oil and gas. Free HC in siltstones inzone B and C (1300 - 1560 in).Zone I, 2100 - 2240 m: Moderate mature, good potential as a source
rock for gas (oil).Zone J, 2240 - 2300 m : Moderate mature, rich potential as a sourcerock for oil and gas.Zone K and L, 2300 - 2640 m : Mature (oilwindow). Rich potential assource rocks for gas.Zone M: 2640 - 2720 m: Poor potential as source rock for gas.Maturity studies indicate a break of succession at approximately2300 m. Due to problem with cavings, maturity is uncertain forthe lower 400 m. Some readings indicate oilwindow maturity.
EXPERIMENTAL AND DESCRIPTION OF INTERPRETATION LEVELS
Total Organic Carbon (TOC).
Picked cuttings of the various lithologies in each sample were crushed in acentrifugal mill. Aliquotes of the samples were then weighted into Lecocruisibles and treated with hot 2N HC1 to remove carbonate and washed twicewith distilled water to remove traces of HC1. Thecrusibles were then placedin a vacuum oven at 50°C and evacuated to 20 mm Hg for 12 hrs. The sampleswere then analysed on a Leco E C 12 carbon determinator, to determine thetotal organic carbon (TOC).
Extractable Organic Matter (EOM)
From the TOC results samples were selected for extraction. Of the selectedsamples, approximately 100 gm of each was extracted in a flow throughsystem (Radke et al., 1978 (Anal. chem. 49, 663-665)) for 10 min. usingdichloromethane (DCM).as solvent. The DCM used as solvent was distilled inan all glass apparatus to remove contaminants.
Activated copper filings were used to remove any free sulphur from thesamples.
After extraction, the solvent was removed on a Buchi Rotavapor and trans-ferred to a 50 ml flask. The rest of the solvent was then removed and theamount of extractable organic matter (EOM) determined.
Chromatographic Separation.
The extractable organic matter (EOM) was separated into saturated fraction,aromatic fraction and non hydrocarbon fraction using a MPLC system withhexane as eluant (Radke et al., Anal. Chem, 1980). The various fractionswere evaluated on a Buchi Rotavator and transferred to glas-vials and driedin a stream of nitrogen. The various results are given in Table III-VI.
34/H/l/ma ,.'}£ •• .;' :T

-2-
Gas chromatographic analyses.
The saturated fraction was diluted with n-hexane and analysed on a HP 5730 Agaschromatograph, fitted with a 25 m 0V101 glasscapillary column and anautomatic injection system. Hydrogen (0.7 ml/min.) was used as carrier gasand the injection was performed in the splitt mode (1:20).
Vitrinite Reflectance.
Samples, taken at various intervals, were sent for vitrinite reflectancemeasurements at Geoconsultants, Newcastle-upon-Tyne. The samples weremounted in Bakelite resin blocks; care being taken during the setting ofthe plastic to avoid temperatures in excess of 100°C. The samples wherethen ground, initially on a diamond lap followed by two grades of corundumpaper. All grinding and subsequent polishing stages in the preparation werecarried out using isopropyl alcohol as lubricant, since water leads to theswelling and disintegration of the clay fraction of the samples.
Polishing of the samples was performed on Selvyt cloths using three gradesof alumina, 5/20, 3/50 and Gamma, followed by careful cleaning of thesurface.
Reflectance determinations were carried out on a Leitz M.P.V. microphoto-meter under oil immersion, R.I. 1.516 at a wavelength of 546 nm. The fieldmeasured was varied to suit the size of the organic particle, but wasusually of the order of 2 micron diameter.
The surface of the polished block was searched by the operator for suitableareas of vitrinitic material in the sediment. The reflectance of the organicparticle was determined relative to optical glass standards of known reflectantWhere possible, a minimum of twenty individual particles of vitrinite wasmeasured, although in many cases this number could not be achieved.
The samples were also analysed in UV light, and the colour of the fluoressingmaterial determined. Below, a scale comparing the vitrinite reflectancemeasurements and the fluorescence measurements are given.
34/H/2/ma

-3-
- VITRINITE REFLECTANCER.AVER. 546nm 1-516"
°/o CARBON CONTENT DAF.
LIPTINITE FLUOR.EXC. 400nmBAR. 530nm
nm
COLOUR
ZONE
0- 20
57
725 750
G
1 '
G/y
2
0- 30
62
790
Y
3
Y,
4
0- 40
70
820
I'0
L.O.
5
0-50I
73
840
.,
0-60i
76
M.O.
6
0- 70
79
860
D.O.
r
0- 80
80-5
890
0-90i
82-5
940
O/j,
8
1-00I
84
MO
I
85-5
R
9
NOTE LlPTINIT-E.NM = NUMERICAL MEASUREMENT OF OVERALL SPORE COLOUR AND. NOT PEAK FLUORESCENCE.WAVELENGTH .
RELATIONSHIP BETWEEN LIPTINITE FLUORESCENCE COLOUR, VITRINITE REFLECTANCEAND-CARBON CONTENT IS VARIABLE.WITH DEPOSITIONAL ENVIRONMENT AND"CATAGENIC HISTORY. THE ABOVE IS ONLY A GUIDE. tiPTINITE.WILL OFTENAPPEAR TO PROGRESS TO DEEP ORANGE COLOUR AND THEN'FADE RATHER THANDEVELOP O/R AND RED SHADE. TERMINATION OF.. FLUORESCENCE IS ALSO• VARIABLE. ' •
34/C/3/ma

- å -
Processing of Samples and Evaluation of Visual Kerogen
Crushed rock samples were treated with hydrochloric and hydrofluoric acidsto remove the minerals. A series of microscopic slides contain strew mountsof the residue:
T-slide represents the total acid insoluble residue.
N-slide represents a screened residue (15 meshes).
0-slide contains palynodebris remaining after flotation (Zn Br2) to remove
disturbing heavy minerals.X-slides contain oxidized residues, (oxidizing may be required due tosapropel which embeds palynofnorphs, or to high coalification preventing theidentification of the various groups).
T and/or 0 slides are necessary to evaluate kerogen composition/palynofacieswhich is closely related to sample lithology.
Screened or oxidized residues are normally required to consentrate thelarger fragments, and to study palynomorphs (pollen, spores and dino-flagellates) and cuticles for paleodating and colour evaluation.
So far visual evaluations of kerogen have been undertaken from residuesmounted in glycerine jelly, and studied by Leitz Dialux in normal light(halogene) using xlO and x63 objectives. By x63 magnification it ispossible to distinguish single particles of diameters about 2 and, ifwanted, to make a more refined classification of the screened residues(particles >15 ).
The colour evaluation is based on colour tones of spores and pollen(preferably) with support from other types of kerogen (woody material,cuticles and sapropel). These colours are dependant upon the maturity, butalso are under influence of the paleo-environment (lithology of the rock,oxidation and decay processes). The colours and the estimated colour indexof an individual sample may therefore deviate from those of the neighbouringsamples. The techniques in visual kerogen studies are adopted from (Staplin1969 and Burgess 1974).
34/H/3/ma

- 5 -
In interpretation of the maturity from the estimated colour indices wefollow a general scheme that is calibrated against vitrinite reflectance
values (R Q).
R^ 0.45
Colour index 2-
Maturity 1 Moderateintervals mature
Rock-Eva! Pyrolyses.
0.6
2
Mature
0.9
2+
(oil window)
1.0
3-
1.3
3 3+
Very mature
100 mg crushed sample was put into platinum crusible whose bottom and coverare made of sintered steal and analysed on a Rock-Eval pyrolyser.
34/H/4/ma

- 6 - j .
RESULTS AND DISCUSSION.
Based on the lithological variations and the organic carbon measurementson the various lithologies the analysed sequence of the well is dividedinto thirteen zones.
A: 1250 - 1300 m.B: 1300 - 1510 m.C: 1510 - 1560 m.D: 1580 - 1640 m.
E: 1640 - 1670 m.F : 1 6 7 0 - 1 7 1 0 m . • • • ' - •
G: 1730 - 1910 m.H: 1910 - 2100 m.I: 2100 - 2240 m.J: 2240 - 2300 m.K: 2300 - 2500 m.L: 2500 - 2640 m.M: 2650 - 2720 m.
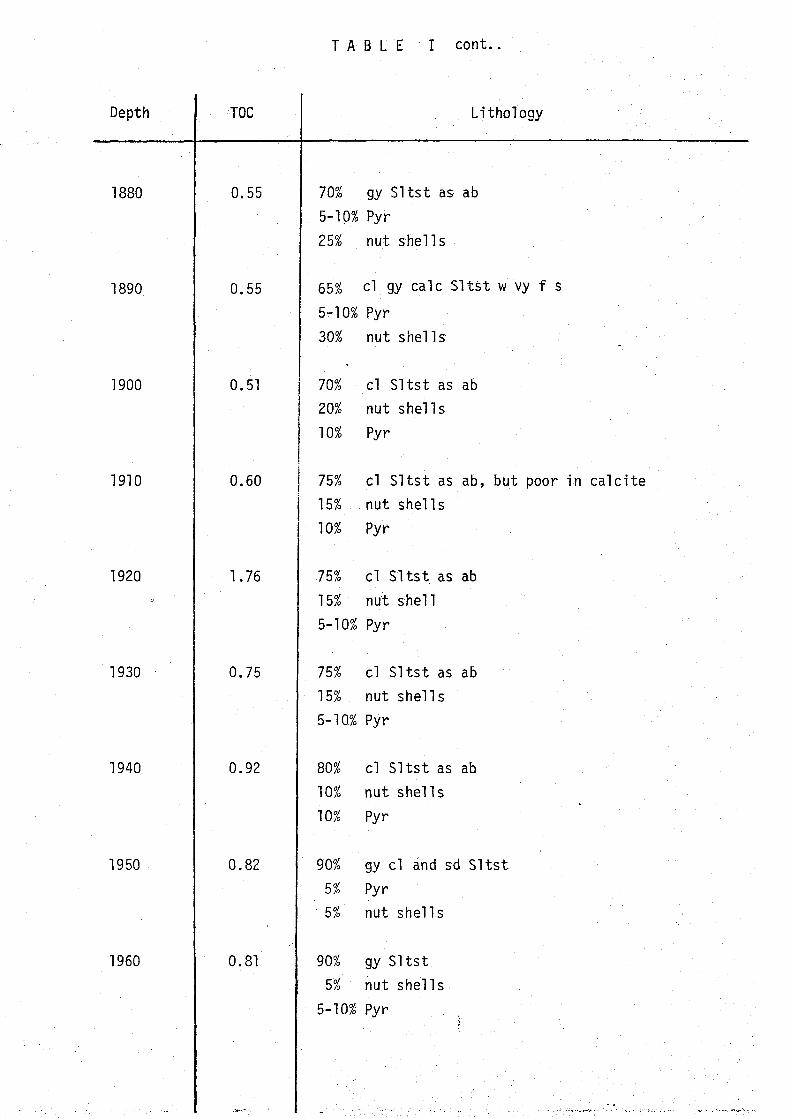
TotalOrganic Carbon (TOC).
Total organic carbon was measured on all the samples, except sandstonesamples, from 1250 m. Where more than one lithology was found in thesamples, TOC was measured on each lithology which was found to be 10% ormore of the whole sample.
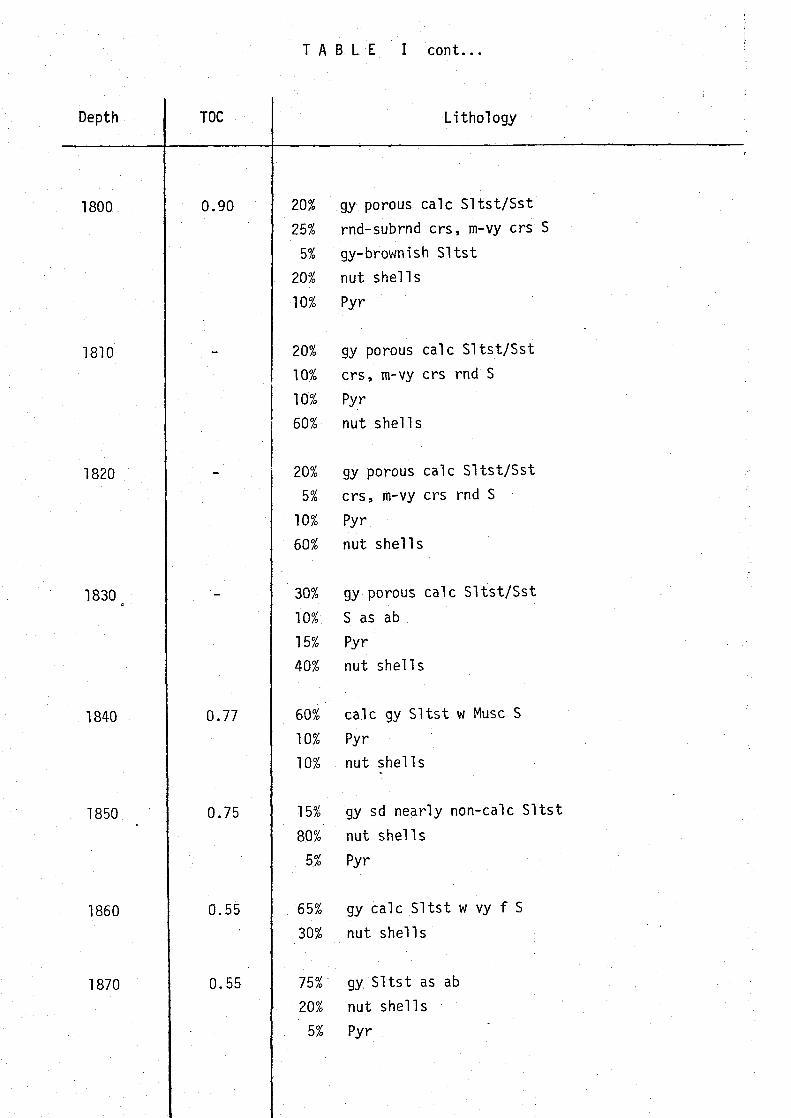
Zone A: 1250 - 1300 m: This zone contains some chalk, which was notmeasured since it is assumed that it is cavings. The TOC of the claystonein the zone varies considerably, 1.1 - 3.5 %.
Zone B: 1300 - 1510 m: The majority of the samples from this zonecontain a large proportion of cement. The rest of the material in thesamples is mainly siltstone, which is believed to be the true lithologyfor the zone. Siltstone cuttings were picked and analysed for organiccarbon. The TOC of the upper three samples drops sharply with increasingdepth (1.6 - 0.6 % TOC, Table 1), then increases slowly with increasingdepth down to 1510 m. The TOC values for most of the zone are 1 % or

• • • - 7 -
higher, which is high for siltstones. Coal is not recorded in the samples,and it is therefore assumed that the high TOC values might be due tomigrated hydrocarbons.
Zone C: 1510 - 1560 m: At 1520 m the TOC values increase sharply to 2.8 %9and this coincides with a change in lithology to calcareaus siltstone.The samples from both zones B and C were of rather poor quality.
Zone D: 1580 - 1640 m. Another zone with very poor quality samples. Onlya few samples contain enough material to do organic carbon analyses. Mostof the samples contained only mud additives. The few samples measured wereclaystone samples with organic carbon values in the 1.7 - 1,9 % region.
Zone E: 1640 - 1670 m: The TOC values increase sharply at 1640 m to 2.6 %.The quality of the samples are also found to be better than in the zoneabove.
Zone F: 1670 - 1710 m: Again a zone with mainly claystone, and the TOC valuesare found to be similar to the one measured in zone D.
Zone G: 1730 - 1910 m: At 1730 m, the lithology changes to siltstone. TheTOC values on these samples are found to be in the 0.5 - 1.0 % range. Someof the samples were of such a poor quality that organic carbon was notmeasured.
Zone H: 1910 - 2100 m: At 1920 m the TOC value increases sharply to 1.7 %.The next sample is again found to have a TOC value below 1 % but a steadyincrease in the TOC values are recorded with increasing depth. The wholezone is found to have a siltstone lithology.
Zone I: 2110 - 2240: This zone consists mainly of claystone, and again a
steady increase in the TOC values are recorded with increasing depth from
1.6 - 2.6 %.
Zone J: 2240 - 2300 m: At 2250 m a sharp increase is seen in the TOC values
to 6.3 %. This high TOC value is found throughout the whole zone.
Zone K: 2300 - 2500 m: At 2300 my the TOC value again drops to 3.4 %\ and
TOC values of 2.6 - 3.6 % are found for most of the claystone samples in

o•J
this zone. Some of the samples contain coal cuttings, and contaminationof small coal particles onto the claystone cuttings might give too highvalues.
Zone L: 2500 - 2640 m: From approximately 2500 m, a large proportion ofsiltstone with variable TOC values, are again found in the samples andthe interval 2500 - 2640 m is separated out due to this.
Zone M: 2650 - 2720 m: From 2650 m, a red claystone is found in thesamples together with a grey claystone. The red claystone is believed tobe the true lithology and the zone is separated from the zone above dueto this.
Extraction and Chromatographic Separation.
A large proportion of the samples was not suitable for extraction mainlydue to being very small quantities and containing a large percentage ofmud additives. Due to this no samples were extracted from the middlepart of the well, 1300 - 2100 m. This part contains thick siltstonesequences with high TOC values, and it would have been valuable for thefinal interpretation of the well with 3 - 5 extractions, and therbydetailed analyses of the hydrocarbons in the samples.
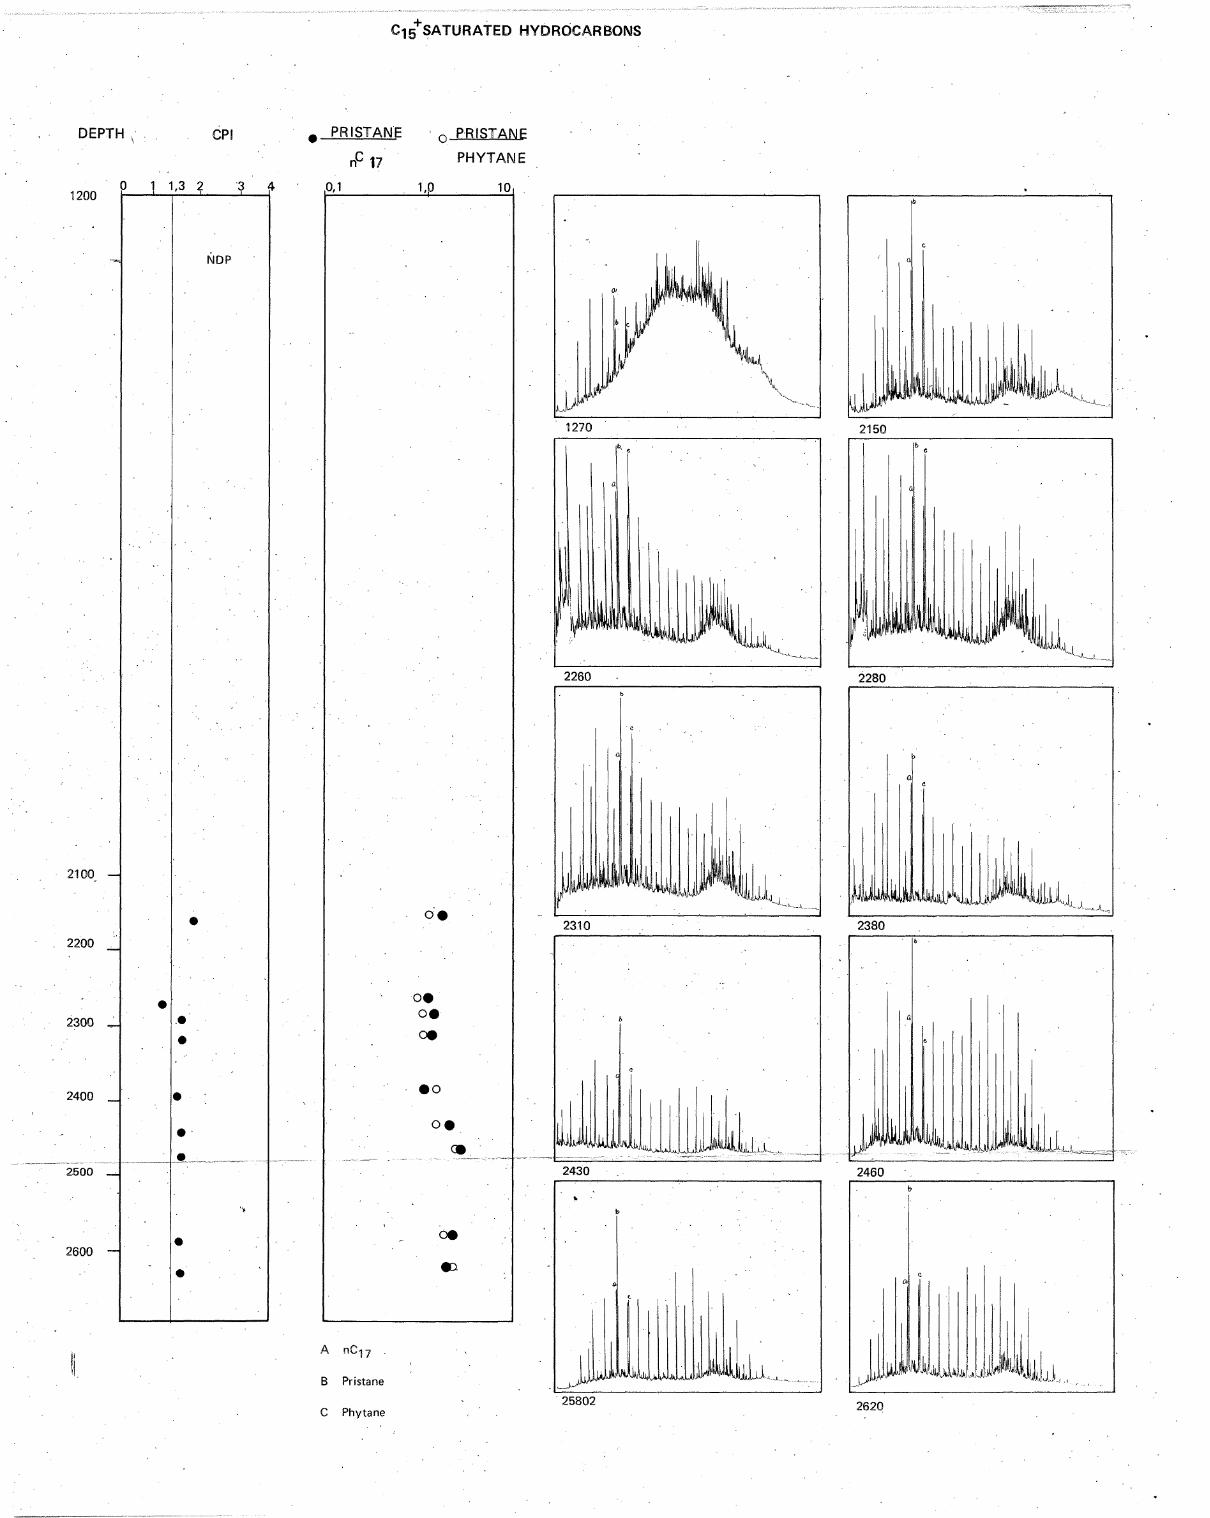
A: One sample, 1270 - 1300 m, from this zone was extracted showing a goodabundance of extractable hydrocarbons. The percentage of saturated hydro-carbons compared to the aromatic hydrocarbons is very high for this sample.The gas chromatogram of the saturated hydrocarbon fraction shows a largeunresolved envelope in the nG, - nC™ region and only negligible amountsof n-alkanes, clearly indicating bacteriological activity. nC,5 - nC 2 Q are,however, larger than what would be expected for such a sample, and it isbelieved that the sample might be contaminated with diesel.
Zone I: One sample, 2150 - 70 m, from this zone was extracted, showinga good abundance of extractable hydrocarbons and again sat/aro ratio israther high. The HC/TOC ratio is however very low, showing that this sampleonly contains small amounts of hydrocarbons compared to the amount of organiccarbon in the sample. The gas chromatogram of the saturated hydrocarbonfraction is typical for an immature terrestrial sample with a large

- 9 -
pristane/nC,7 ratio and high CPI value. The large amount of compounds inthe sterane/triterpane region also indicate a terrestrial origin of theorganic matter.
Zone J: Two samples 2266 m and 2280-90 m, from this zone were extractedand found to have a rich abundance of extractable hydrocarbons, and againthe sat/aro ratio is high. The HC/TOC ratio is, however, larger in boththese samples compared with the sample from zone I. The gas chromatogramsof the two saturated hydrocarbon fractions differ slightly, mainly in theheavy hydrocarbon region. The sample from 2260 m has a less pronouncedsterane/triterpane assemblage together with less pronounced heavy n-alkanesand a lower CPI value. These gas chromatograms indicate that the samplefrom 2260 m i s derived from amorphous kerogen while the one from 2280 -2290 m is from a terrestrial origin.
Zone K: Four samples, 2310 - 30 m, 2380 - 90 m, 2430 - 50 m and 2460 - 80 m,from this zone were extracted. The two uppermost and the lowermost samplesshow a fair/good abundance of extractable hydrocarbons while the sample from2430 - 50 m has a rich abundance of extractable hydrocarbons. Similarpattern is seen when the HC/TOC ratio is studied. It is also noticeable howthe sat/aro ratio drops sharply in the lowermost sample compared tothose above. The gas chromatograms of the saturated hydrocarbon fractionsvary slightly from sample to sample. The uppermost sample 2310 - 30 m issimilar to the lowermost sample in the zone above with pronounced steranes/triterpanes and a large CPI value. The next sample 2380 - 90 m also havepronounced steranes/triterpanes but with a lower CPI value than the sampleabove. The most striking difference is however in the pristane/nC,7 ratiowhich is lower than in the abovelying samples. In the next sample, 2430 - 50 m,the pristane/nC,7 ratio is again large, but now the steranes/triterpanesare far from as pronounced as in the samples above. The CPI value is, however,still large. The lowermost sample in this zone, 2400 - 80 m is found tohave a gas chromatogram similar to the one of the.sample from 2430 - 50 m.
Zone L: Two samples, 2580 - 2600 m and 2620 - 40 m, from this zone wereextracted and found to have a good/rich and good abundance of extractablehydrocarbons respectively. The gas chromatograms of the saturated hydro-carbon fraction both show the same feature with high pristane/nC,y ratios,high CPI values and relatively small amounts of steranes/triterpanes.

- lo - !
V i tri n i te Ref1ectance.
Twentyeight samples were examined in reflected light, and vitrinitereflectance measured. Below each sample is described and together withthe reflectance values, other information from the analyses are given.
770 m: Calcareous shale, Ro=0.37(21).
The sample has a moderate organic content with variable bitumen staining.Some cuttings intense, otherwise intertinite and reworked particles aredominant with only a trace of vitrinite particles and wisps. UV lightshows a yellow and yellow to orange fluorescence from spores and a loweinite content. "
930 m: Shale, Ro=0.40(16) and 0.65(1).The sample contains a large amount of bitumen wisps, otherwise a lowcontent of particles of inertinite and reworked material with aboutequal proportion of poor vitrinite particles. UV light shows a yellowfluorescence from spores and a low exinite content.
1070m: Light shale, Ro=0.46(5).
The sample contains some bitumen staining and wisps, otherwise a verylow content of reworked material and inertinite. Only a trace of poorvitrinite particles. UV light shows a yellow and yellow/orange fluorescencefrom spores and a low exinite content.
1190 m: Shale, Ro=0.32(20).The sample has a low organic content with plentiful bitumen wisps andstaining. A few particles of inertinite and reworked material with onlya trace of vitrinite. UV light shows a yellow and yellow/ orange fluor-escence from spore specks and a low einite content.
1250m: Light shale, Ro=0.38(19).The sample contains bitumen wisps and staining, otherwise a low contentof small inertinite and reworked particles with only traces of poorvitrinite. UV light shows a yellow and yellow/ orange fluorescence fromspores and hysterichospheres together with a low exinite content.
1290 m: Shale, Ro=0.39(20).The sample has a moderate organic content with bitumen staining andwisps. About equal proportion of vitrinite particles and wispy particles

- n - !
and inertinite and reworked particles. UV light shows a yellow andyellow/orange fluorescence from spores and hydrocarbon specks togetherwith a low exinite content.
1340 m: Siltstone, Ro=0.39(20).The sample shows a heavy bitumen staining, otherwise a moderate contentof inertinite and reworked particles. Only trace of poor vitrinite andwispy particles. UV light shows a yellow/orange and light orange fluor-escence from spores and hydrocarbon specks together with a low exinitecontent.
1400 m: Siltstone and carbonate, Ro-0.46(14).
The sample has a moderate organic content but almost wholly inertiniteand reworked particles. Only a trace of true vitrinite particles. Somebitumen staining is recorded. UV light shows a yellow/orange and lightorange fluorescence from spores and a Tow exinite content.
1500 m: Siltstone, shale and carbonate, Ro=0.37(20).The sample has a moderate organic content, mostly particles of inertiniteand reworked material. Only a trace of true vitrinite and some bitumenstaining. UV light shows a yellow and light orange fluorescence fromspores and hydrocarbon specks, together with a trace of exinite.
1620 m: Shale and carbonate, Ro=0.37(18) and Ro=0.54(3).The sample has a moderate to rich organic content with a large amount ofinertinite and reworked material with subordinate vitrinite particlesand wispy particles together with bitumen staining. UV light shows ayellow and Tight orange fluorescence from spores and hydrocarbon specks,together with a low exinite content.
1690 m: Shale, siltstone and carbonate, Ro=0.41(20).The sample has a low to moderate organic content with some bitumenstaining and wisps, otherwise particles of reworked material and inertinite
are dominant. A few vitrinite particles and wispy particles. UV lightshows a yellow/orange fluorescence fron spore specks and a trace of
exinite.

- 12 - !
1760 m: Limestone and subordinate shale, Ro=0.33(10).Limestone: Some local bitumen staining and inertinite particles.Shale: Moderate to rich in organic material with inertinite and reworkedparticles dominant. Only a trace of vitrinite particles. UV light showsa variable carbonate fluorescence and yellow spore specks together witha trace of exinite.
1850m: Shale, Ro=0.38(15) and Ro=0.66(l).The sample has a low organic content with a few particles of inertiniteand reworked material with only a trace of vitrinite particles andoccasional bitumen wisps. UV light shows a variable carbonate fluorescenceand yellow/orange spore specks together with a trace of exinite.
1900 m: Shale and carbonate, Ro=0.46(19) and Ro=0.65(l).The sample has a variable bitumen staining.Carbonate: Low organic content with a few good vitrinite wisps and someinertinite particles.Shale: Moderate content of inertinite and reworked material with tracesof vitrinite. UV light shows a dull yellow/orange plus light orangefluorescence from spore specks together with a trace of exinite.
1990 m: Calcareous shale, Ro=0.36(20).The sample has a low to moderate organic content with some bitumen wispsand staining. Inertinite and reworked particles are dominant. A fewwisps particles of vitrinite are recorded. UV light shows a yellow/orangeand light orange fluorescence from spores and a moderate exinite content.
2060 m: Shale, Ro=0.34(20).The sample has a low organic content with bitumen staining and wisps. Afew organic particles are recorded but almost entirely reworded material
and inertinite. Only a trace of true vitrinite wisps. UV light shows adull, light orange fluorescence from spores and a moderate exinitecontent.
2130 m: Shale, Ro=0.39(11).The sample has a low organic content with bitumen staining and wisps,otherwise reworked and inertinite particles are dominant with only atrace of vitrinite particles. UV light shows a dull light orange fluor-escence from spores and a moderate to rich exinite content.

- 1 3 -i
2200 m: Shale, Ro=0.39(11).
The sample has a low to moderate organic content with bitumen wisps andstaining. Particles of inertinite and reworked material are dominant.Only a trace of vitrinite particles. UV light shows a yellow to orangefluorescence from spores and a moderate to rich exinite content.
2240 m: Shale, Ro=0.44(8).The sample has a low organic content apart from considerable bitumenwisps and staining. Particles of inertinite and reworked material withonly traces of true vitrinite particles. UV light shows a yellow/orangefluorescence from spores and a moderate to rich exinite content.
2270 m: Shale, Ro=0.38(21).The sample shows an intense bitumen staining and wisps, otherwise moderatecontent of inertinite particles with subordinate vitrinite wispy particles.UV light shows a yellow to orange and light orange fluorescence fromspores and hydrocarbon specks together with a moderate to rich exinitecontent.
2340 m: Shale, Ro=0.45(20).The sample has a moderate organic content with variable bitumen stainingcutting to cutting, sometimes intense. Inertinite and reworded particlesare dominant. Only a trace of vitrinite wisps and particles, generallyassociated with bitumen rich cuttings. UV light shows a light orangefluorescence from spores and a moderate exinite content.
2400 m: Coal and shale, Ro=0.53(25).The coal is rather dirty, with about equal proportions of inertinite andvitrinite. The shale has a slight bitumen staining and inertinite particles,UV light shows a light orange and dull mid.orange fluorescence fromspores and a moderate exinite content.
2460 m: Shale and coal, Ro=0.48(24).Coal: Inertinite rich, rather dirty.Shale: Some good vitrinite wisps and stringers together with inertinite
particles and bitumen staining. UV light shows a light to mid.orangefluorescence from spores and a moderate exinite content.

- 14 - j
2530 ra: Shale, Ro=0.38(20).The sample is moderate to rich in organic material with an overallbitumen staining. Particles of inertinite and reworked material aredominant. Only a trace of vitrinite particles and wispy particles. UVlight shows a yellow/orange and light orange fluorescence from sporestogether with a moderate to rich exinite content.
2554 m: Coal and Carbargillite, Ro=0.54(16) and Ro=0.75(14).The sample is rich in organic material, mostly coal fregments. Thecarbargillite is mainly rich in internite. The cuttings are heavilybrecciated and badly oxidieed. UV light shows a light and mid. organefluorescence from spores, algae'and cuticles and a moderate exinitecontent.
2600 m: Shale, Ro=0.47(20).The sample is moderate to rich in organic material with heavy bitumenstaining and wisps. Some good vitrinite wisps and stringers with aboutequal proportion of inertinite and reworked particles. UV light shows alight orange fluorescence from algae and mid. orange spores, togetherwith a moderate exinite content.
2670 m: Shale, Ro=0.38(21).The sample contains bitumen wisps and staining, otherwise a moderateorganic content where inertinite and reworked particles are dominant.Subordinate vitrinite wispy particles. UV light shows a yellow/orangeand light orange fluorescence from spores and a moderate torich exinite content.
2720m: Grey and red shale, Ro=0.40(22).Red shale: Barren.Grey shale: Bitumen impregnation, rich in inertinite and good vitrinitewisps and particles. UV light shows a light orange fluorescence from algaeand mid. orange spores together with a moderate exinite content.
The vitrinite reflectance measurements show a low maturity gradient downto approximately 2300 m. The readings from 2300 m downwards are veryuncertain due to cavings. It is believed that the measurements at 2400 mmay be on true material, while the next two are on caved material. Thesample from 2554 m is mainly coal, which shows two distinct different

-15 -
readings. The lower one Ro=0.54 is believed to be on cavings while thehigher value Ro=0.75 is believed to be on true material. This would thenindicate a steeper gradient from 2400 m downwards than what was found inthe upper part of the well. It also indicates that there is a break insuccesion around 2300 m. The extrapolation taken for the lower 400 m ofthe well is highly tentative. Side wall cores in this interwall willprobably solve this problem.

Visual Kerogen Evalution
The total acid insoluble residues from 27 samples between 770 m and 2710 mwere investigated for evaluation of kerogen composition and colour of theorganic remains.
On the basis of kerogen composition we distinguish three main intervals.The residues between 770 m and 2350 m are representing marine depositswhich may be further subdivided on the basis of a more detailed study oftheir plant remains. From 2370 m to 2610 m we find an interval withvaried types of terrestrial material. At 2670 m and below, the residuescontain a mixture of marine and terrestrial remains, most of which isthought to be derived from caved material. A minor part are fairly darkcoaly fragments suggested to be indigenous or reworked.
In our interpretation of colours the term immature has be connected withcolour indices 2- and below. Accordingly all samples down to 2230 m areimmature.
770 m:The residue is dominated by sapropel which also embeds dinoflagellate cystsand tends to form aggregates.
Colour index: Indeterminate, immature (1+)
930 m to 1250 m:
The residues are rich in undissolved minerals. The organic material isdominantly amorphous. Screening reveals rich dinoflagellate cyst assem-blages and some dark coal particles.
Colour index: 1+/2-
1290 m to 1910 m:The rock samples contained very little material. Acid resistant mineralsdominate the residues before separation. Mud additives (walnut) andmaterial thought to be caved are present in the organic residues. Oxidizedresidues contain amorphous material as well as coal particles, probablyreworked, as dominant elements. From 1850 m the oxidized residues reflectmore deltaic conditions.
Colour index: 1+/2-

- 17 - ;
1990 m to 2230 m:
Amorphous material dominates, and partly forms aggregates. Dinoflagellatecysts, indeterminate finely dispersed herbaceous material and coalyparticles form minor elements.
Colour index: 1+/2-
2270 m and 2350 m:
SapropeT dominates, indeterminate herbaceous material is found in smallamounts. This interval is distinguished from the samples above because ofthe finely dispersed material (no aggregates) and because of the increasein coalification.
Colour index: 2
2410 m to 2610 m:
The unscreened residues contain variable amounts of sapropel which couldbe from caved, material. After oxidation typically deltaic assemblagesremain and are dminated by woody (coaly) material. Cuticles, indeterminateharbaceous material as well as spores and pollen occur in variableamounts and are well preserved. Some sapropelization has taken place andfungal hyphae as well as fungal spores were observed.
Colour index: 2
2670 m and 2710 m:
Sapropel dominates the total residues as well as the chemically oxidizedsamples, but the main part is believed to be derived from caved material.Black coal fragments, are particularly abundant at 2710 m, and probablyrepresent reworked material.
Colour index: Indeterminated

- 18 - ;
Rock-Eva! Pyrolysis.
Forty nine samples were pyrolysed on a Rock-Eval instrument, Table IX. Thesamples from the upper part of the well did not give sharp S? peaks, andthe maximum temperatures T m, . are therefore unreliable, i.e. to high.
max
The samples from zone A have low hydrogen and high oxygen indeces, typicalfor type III kerogen. The samples from zones B and C are mainly siltstone.These samples have high S, peaks and therby high production indeces, indicatingfree hydrocarbons in the samples.
The samples from zones D, E and F are again claystone. The hydrogen indecesare low for all of these samples indicating type III kerogen. Some of thesamples have large S, peaks indicating free hydrocarbons.
Zones G and H are siltstone samples. The S, peak and the production indexis far lower for these samples compared to the samples from zones B and C,indicating a far lower degree of free hydrocarbons in the samples. Thehydrogen index indicate these samples to be type III kerogen.
The claystone samples in zone I show slightly higher hydrogen indeces thanin the zones above, but they are still too low to be classified as kerogentype II. It might be a mixture of marine and terrestrial kerogen. Whenthe results are plotted, most of these samples are found to be locatedbetween the graphs for type III and type II kerogen.
The analysed samples from zone J do, however, show hydrogen and oxygenindeces typical for type II kerogen with hydrogen indeces in the 500region and oxygen indeces in the 25 region.
The samples from zone K and L have similar values to those from zone I,intermediate between kerogen type II and kerogen type III. Samples inthis interval are often classified as in the coal zone (Madec, IFP, PrivateComm). The only sample which might be classified as type II kerogen inthese two zones is the sample from 2580 m.
Samples from zone M were not analysed on the Rock-Eval instrument.
Rock-Eval measurements do also give a maturity parameter, by monitoringthe T of the Sp peak. As mentioned above, the samples from the upper

-19 -
part of the well did not give sharp S9 peaks, and the T values aretherefore unreliable. From approximately 2100 m, the S? peaks are sharpand the T reliable. The analyses show that down to approximately2400 .m, the samples are immature, i.e. T < 430 C, while the samplesfrom 2400 m downwards are mature.

-20-1
CONCLUSION.
Based on lithological variations and total organic carbon measurements (TOC)the analysed sequence of the well was divided into thirteen zones.
A: 1250 - 1300 m.B: 1300 - 1510 m.C: 1510 - 1560 m.D: 1580 - 1640 m.E: 1640 - 1670 m.F: 1670 - 1710 m.G: 1730 - 1910 m.H: 1910 - 2100 m.I: 2100 - 2240 m.J: 2240 - 2300 m.K: 2300 - 2500 m.L: 2500 - 2640 m.M: 2650 - 2720 m.
Samples in the upper part of the well were of very poor quality, almostwholly mud additives. Due to this, the detail analyses in this part of thewell are few.
In the rating of the various zones, total organic carbon measurements,extraction and chromatographic separation, and Rock-Eva! measurements areUSid in determining the richness of zones. The maturity is determinedfrom the vitrinite reflectance measurements, fluorescence in UV light, thecolour of kerogen in transmitted light and Rock-Eval pyrolysis. The typeof kerogen is determined by visual examination 1n transmitted light plusRock-Eval pyrolysis.
Based on these measurements the well is found to be immature down to 2100 mand moderate mature down to approximately 2300 m. At approximately 2300 mthe various maturity measurements indicate a break of succession. In thisinterval, i.e. below 2300 m, there were a lot of caved material and theresults are uncertain. However, the various readings indecate oil windowmaturity from approximately 2400 m.

- 21 - J
In the evaluation of the type of kerogen, Rock-Eval measurements andvisual kerogen examination gave different indications in the upper2100 m of the well. Rock-Eval pyrolyses indicate type III kerogen whilevisual examination shows the samples to contain mainly amorphous kerogen.Vitrinite reflectance measurements show samples in this interval tocontain a large proportion of reworked material. This will distort theresult. The reworked particles will not show up as a large proportion inthe visual kerogen examination, while it will completely distort theRock-Eval measurements.
Based on these results and the various richness parametres the followingrating as given.
Zones A-H, 1200-2100 m are all immature with a poor potential as sourcerocks for oil and gas. Free hydrocarbons are registered in the siltstonein zones B and C. It is not differentiated between the siltstone andclaystone in this evaluation due to the extensive reworking recorded.This, together with the free hydrocarbons have greatly increased the TOCvalues recorded. It is believed that the "true" kerogen will be a sourcefor oil and gas, while it is mainly reworking which give the type IIIreading on the Rock-Eval instrument.
Zone I, 2100-2240 m, has a slightly higher maturity than the abovelyingzones and a far higher richness potential. Both Rock-Eval pyrolysis andvisual kerogen examination agree that this zone will mainly produce gas.The zone is therefore rated to have a good potential as a source rockfor gas (oil).
Zone I, 2240-2300 m, is found to be moderate mature with a rich potentialas a source rock for oil and gas. This was the only zone which gave typicalkerogen type II readings on the Rock-Eval instrument.
Zone K and L, 2300-2640 m, are both found to have far higher maturity than
the zones above, tentatively set to oilwindow maturity, due to problems
with cavings and oxidation. Both zones are found to have rich potentials
as source rocks for gas.
In zone M, 2650 - 2720 m, typical red beds are encountered, and thiszone is rated to have a poor potential as a source rock for gas.
A B B R E V I A T I O N S
ababnang
bdBiotBivblblkbritbrn
CCalccalccarbcgiChkChiChtClclCistcmtconecontconvcrscrmcryst
dkdnsDoldoldownwdsk
Ech
ffibfisFidfragfriForamFos
Gastglac
= above= abundant= angular
= bedded= Biotite= Bivalve= blue= black= brittle= brown
= Coal= Calcite= calcareous= carbonaceous= Conglomerate= Chalk= Chlorite= Chert= Clay= clayey= Claystone= cement= concretion= contorted= convolute= coarse= cream= crystalline
= dark= dense= Dolomite= dolomitic= downwards= dusky
= Echinoid
= fine= fiberous= fissile= Feldspar= fragment= friable= Foraminifera= Fossils
= Gastropode= glacial
GlcglegnGranGrgrdgrnsGvlgvlgyGyp
hhdhom
ig111incrintbdirreg
Koal
lamLigliglithInslowLsItmmassmatrmetmdstmicmidMrlmrlmtlMuse
nod
obsoccolvOoloolorngotherw
= Glauconite= glauconitic= green= Granules= Granite= graded= grains= Gravels= gravelly= grey= Gypsum
= horrisontal= hard= homogenious
= igneous= Illite= increasing= interbeded= irregular
= Kaolin
= laminated= Lignite= lignitic= lithhic= lens(es)= lower= Limestone= light= medium= massive= matrix= matamorphic= mudstone= micaceous= middle= Marl= marly= mottled= Muscovite
= nodular
=. observed= occasional(ly)= olive= oolite= oolitic= orange= otherwise
paPblPkplast-predompurpPyrpyr
Qtzqtz
redrkrnd
SsdscSchsftShSidsksSitsitSltstsm.am.sphspicsrtSststrgsStylsuesurf
textTftftrsltrsp
V
violvn .vy
wwckstwh
= pale= Pebbles= pink= plastic= predominant= purple= Pyrite= pyritic
= Quartz= quartzitic
= red(dish)= rock= rounded
= Sand= sandy= scattered= Schiststone= soft= Shale= Siderite= slickenside= Silt•= silty
= Siltstone= small amounts= sphericity= spicules= sorted= Sandstone= strings= Stylolite= sucrose= surface
= tecture= Tuff= tuffaceous= translucent= transparent
= vertical= violet= vein= very
= with= wackestone= white
yel = yellow
Examples of quantitative expressions: (for silt)(sit) - slightly silty, sit - moderately silty, sit - very silty

T A B L E I
Depth
1250
1260
1270
1280
1290
1300
1320
1330
TOC
1.71
3.54
1.11
2.14
1.63
2.49
_
_
1.63
50%
40%
5%
50%
45%
5%
50%
37%
10%
50%
30%
15%
55%
10%
10%
20%
80%
9%
5%
5%
100%
Obs
50%
25%
15%
15%
Lithology
Chk
gy, gn and brn Cist, some s i t
chert
Chk
I t gy-gy-gybrn Cist, some s i t
dk gy s i t Clst
Chk w Gle
s i t gy, gn and brn Clst
Gle
some calc gyviol s i t Clst
Chk, some w Gle
I t gy- l t gn calc Clst
gyviol s i t Clst as ab
gy-gn-brn-pk some s i t Clst
chalk w (Gle)
Gle
gyviol s i t Clst as ab
Chk with and without Gle
I t gy calc ClstGle
cement
dk gy s i t Clst
cement
dk gy-gyviol sd and el Sltst
gy Sltst w Muse and Gle S
intrusive rock fragments w pyroxene and c l i n i zo i -si te phenocrystals

T A B L E I , c o n t . .
Depth
1340
1350
1360
1370
1380
1390
1400
1410
1420
TOC
1.04
0.62
0.73
0.83
0.90
1.05
1.00
1.10
30%
50%
10%
35%
35%
10%
20%-
90%
5%
70%
20%
5%
60%
30%
10%
50%
30%
5%
80%
19%
30%
60%
4.5%
45%
5%
Lithology
cement
porous gy calc S l t s t w Muse
Muse
cement
gy sd S l t s t w Sid?, Muse and
gy-gyviol el s i t s t
in t rus ive rock fragments as
gy sd S l t s t w Muse and Glc
cement
sd I t s t w unorientated Muse
cement
in t rus ive rock fragments as
sd Si ts as ab
Glc
cement
Glc
gy-gyvioi sd s i t s t as ab
in t rus ive rock fragments
sd S l t s t as ab , carb
Glc
gy-gyviol sd S l t s t as ab
Glc
calc carb gy sd S l t s t
Glc
cement
• -
and Glc S
Glc
ab
as ab
ab
e

T A B L E I . con t . .
Depth
1430
1440
1450
1460
1470
1480
1490
1500
1510
1520
TOC
1.02
1.17
0.96
1.31
_
1.27
0.96
1.43
1.32
2.83
20%
75%
90%
5%
40%
40%
10%
87%
10%
50%
50%
95%
70%
20%
10%
95%
40%
10%
5%
20%
5Q%
30%
5%
Lithology
sd Sltst as ab
Glc
calc carb glc gy Sltst w Muse S
Glc
gy sd Sltst as ab
Glcintrusive rock fragments
sd Sltst as ab
Glc
sd Sltst as ab
Glc
sd Sltst and Sltst as ab
sd Sltst as ab w Glc and Muse
GlcPyr
gy and dk gy (calc) Sltst and calc sd Sltst
gy sd Sltst
Glc
gy Lsnut shells
gy Sltst and some sd Sltst as ab
nut shells
cement

T A B L E I c o n t . .
Depth
1530
1540
1550
1560
1570
1580
1590
1600
TOC.
2.52
•
0.82
2.79
_.
1.73
-
1.88
Lithology
70% nut shells etc.
10% Glc
10% Pyr
5% gy porous sd Sl tst w Glc
5% gy Ls .
60% I t gy porous glc sd calc Sl tst ~
10%, calc sid brownish and greyish Ls20% nut shells
20% (calc) yelbrn sid Ls
30% Calc and sid? grains20% Pyr
80% calc carb gy-dk gy mic (d) Sl tst10% calc sid brn-dk brn Ls
5% Pyr
5% nut shells
_.
A few grains of gy Calc-cemented rock w variahle
clast ic content
85% calc s i t (sd) Cist:5% wh Calc
5% nut shells
Coarse fraction as at 1570 m
10% calc sid brn- l t brn Ls5% Pyr
80% s i t gy calc Cist
5% gy Ls
•
• •

T A B L E I cont . .
Depth
1610
1620
1630
1640
1650
1660
1670 °
1680
1690
17Q0
1710
TOC
-
-
2.66
2.40
2.33
2.85
1.72
1.66
1.49.
1.64
10%
5%
97%
9Q%
80%
20%
50%
5%
80%
12%
50%
20%
15%
85%
30%
20%
25%
90%
80%
.10.1.5%
Lithology
yelbrn sid Ls as at 1550mpyr
mud additives
mud additives
mud additives
gy-dk. gy calc sit (sd) Cist
gy sit (sd) Cistpyr
It gy-gy-dk gy sit carb Cist
nut shells
nut shells
gy-dk gy (It gy) Cist w Muse Sit (S)
gr brn sid Ls
gy, redbrn some sit Cist
It yelgy Ls
sit gy Cist
nut shells
mostly gy Cist, the darkest most silty (yelbrn)
mud additives
gy porous calc sd SI tstsid?

T A B L E I con t . .
Depth
1720
1730
1740
1750
1760
1770
1780.
1790
TOC
0.80
0.65
_
1.06
0.88
_
2.18
80%
20%
55%
20.%
25%
10%
10%"
70%
5%
5%
60%
5%
10%
10%
6Q%
10%
20%
10%
60%
30%
10%
10%
20%
60%
10%
15%
Lithology
mud additiyes;
calc sltst.
porous gy calc glc sd Sltstdk gy calc sd Sltst
nut shells
gy (calc) Sltst
Pyr
mud additives
Pyrsue (calc) carbonate
nut shells
gy porous calc Sst/Sltst
non-calc brn Cistgy porous calc Sst/Sltst
nut shelIs:
gybrn (calc) Sltstgy Sltst/Sst w unortentated grains, calc
Pyrnut shells
gy porous calc Sltst/Sst
brownish nearly non-calc Sltst
Pyrnut shells
porous gy calc Sltst/Sst with unorientated grainscrs, m rnd Qtz S
nut shells
T A B L E I cont . . .
Depth
1800
1810
1820
1830 o
1840
1850
1860
1870
TOC
0.90
_
_
0.77
0.75
0.55
0.55
20%
25%
5%
20%
10%
20%
10%
10%
60%
20%
5%
10%
60%
30%
10%
15%
40%
60%
10%
10%
15%
80%
5%
65%
30%
75%
20%
5%
Lithology
gy porous calc Sl ts t /Sst
rnd-subrnd crs, m-vy crs S
gy-brownish S l ts t
nut shells
Pyr
gy porous calc Sl ts t /Sst
c rs , m-vy crs rnd S
Pyr
nut shells
gy porous calc Sl ts t /Sst
crs , m-vy crs rnd S
Pyr
nut shells
gy porous calc Sl ts t /Sst
S as ab
Pyr
nut shells
calc gy S l t s t w Muse S
Pyr
nut shells
gy sd nearly non-calc S l ts t
nut shells
Pyr
gy calc S l ts t w vy f S
nut shells
gy S l t s t as ab
nut shells
Pyr '
T A B L E I cont..
Depth
1880
1890
1900
1910
1920
1930
1940
1950
1960
TOC
0.55
0.55
0.51
0.60
1.76
0.75
0.92
0.82
0.81
70%
5-10%
25%
65%
5-10%
30%
70%
20%
10%
75%
15%
10%
75%
15%
5-10%
75%
15%
5-10%
80%
10%
10%
90%
5%
5%
90%
5%
5-10%
Lithology
gy S l ts t as ab
Pyr
nut shells
cl gy calc S l ts t w vy f s
Pyr
nut shells
cl S l ts t as afa
nut shells
Pyr
cl S l ts t as ab, but poor in calc i te
nut shells
Pyr
cl S l t s t as ab
nut shell
Pyr
cl S l ts t as ab
nut shells
Pyr
cl S l ts t as ah
nut shells
Pyr
gy cl and sd S l ts t
Pyr
nut shells
gy S l ts t
nut shells
Pyr

T A B L E I cont . .
Depth
1970
1980
1990
2000
2010
2020
2030.
2040
2050
20.60
2070
2080
2090.
2100
TOC
0'.88
0.91
1.28
1.15
1.19
1.42
1.Q4
1.57
0.81
1.53
1.29
1.69.
1.63
1.63
Lithology
85% gy cl and sd S l t s t , some calc
5-10% Pyr
5-10% nut shel ls
S l t s t as ab
S l t s t as ab
S l t s t as ab
S l t s t as ab
5% brn (calc). s i t Cist
85% I t gy-gy-dk gy S l t s t w shel l fragments
10% nut shel ls
9.0% gy c l S l t s t w shel l fragments
I t gy-gy-dk. gy S l t s t as ab
85% gy cl S l t s t as ab
5% sue brn carbonate w Sid?
5% brn (calc} Cist
gy cT- S l ts t -as ab
gy cl S l t s t as ab
gy cl S l t s t as ab
gy c l S l t s t as ab .
gy c l S l t s t as ab

T A B L E I cont . .
Depth
2110
2120
2130
2140
2150
2160
2170
2180
2190
2200
2210
2220
2230
2240
2250
TOC
1.90
1.77
1.59
2.02
2.55
2.36
2.61
2.36
2.20
0.93
1.91
1.00
2.30
0.71
2.21
2.59
6.28
gy si
95%
Cist
Cist
97%
Cist
95%
95%
,80%
15%
801
20%
-
90%
10%
90%
1Q%
99%
99%
Lithology
t Cist nearly without Muse f S
gy s i t Cist without Muse S
as ab
as ab
gy f i s s i t Cist
as ab
I t gy-gy-dk gy f i s s i t Cist
Cist as ab
Cist as ab
calc gy Sl ts t w unorientatéd f S
gy-dk gy s i t f i s Cist
I t gy-gy porous Sl ts t w unorientatéd f S
Cist as ab
Sltst as ab
Cist as ab
Sltst as ab, Glc
dk gy ( f i s ) s i t Cist .
Cist as ab

T A B L E I c o n t . .
Depth
2260
2270
2280
2290
2300
2310
2320
c
2330
2340
2350
2360
2370
2380
2390.
2400
TOC
6.91
6.47
5.82
6.07
3.44
2.58
2.65
2.37
3.45
3.19
3.46
3.76
3.44
3.63
5.58
80%
20%
80%
19%
95%
5%
100%
79%
20%
Cist
99%
Cist
TO.0.%
100%
TQQ2
100%
98%
95%
5%
87%
10%
Lithology
Cist as ab
gy ( f is ) s i t Cist
Cist as ab
gy ( f is ) . .s i t Cist
gy-dk gy s i t ( f i s ) Cist w some C
tu f f w intercalated lenses of kaolinite
Cist as ab
Cist as ab
nut shells
as ab
Cist as: ab
as ab
gy-dk gy ( f i s ) s i t Cist
Cist as ab.
Cist as ab.
gy-dk gy s i t Clst-cl Sl ts t
gy-dk. gy 's l t Cist
dk gy-gy s i t Cist and cl Sl tst
I t gy f Sst
C
gy-dk gy non-fis s i t Cist

T A B L E I cont..
Depth
2410
2420
2430
TOC
10.67
3.44
3.68
87%
10%
85%
10%
5%
92%-
C
gy si
gy-dk
gy c i
c
gy-dk
t Cist
gy sit
Sltst
gy-bik
Lithology
Cist
sit Cist and cl Sltst
2440
2450
2460
2470
2480
2490
4.22
3.39
3.72
2.72
3.84
4.17
0.45
85% gy-dk gy, gn, blk, brn sit Cist and cl Sltst
10% wh f Sst
5% C
80%
5%
5%
60%
25%
10%
5%
Sltst,
Sst as
C
Cist
ab
sit Cist and
I t brn
C
Sst as
waxy
ab
as ab
cl Sl tst as ab
Sltst
60% Cist and Sltst as ab
25% waxy S l t s t as ab
10% C
50% gy-dk gy-dk b r n - b l k s i t C i s t and c l S l t s t
25% I t brn waxy Sltst
20% f-m Qtz/Fld Sst
40% dk gy-dk brn s i t C i s t and c l S l t s t
30% I t brn waxy Sltst
30% f - ra , c rs wh Sst
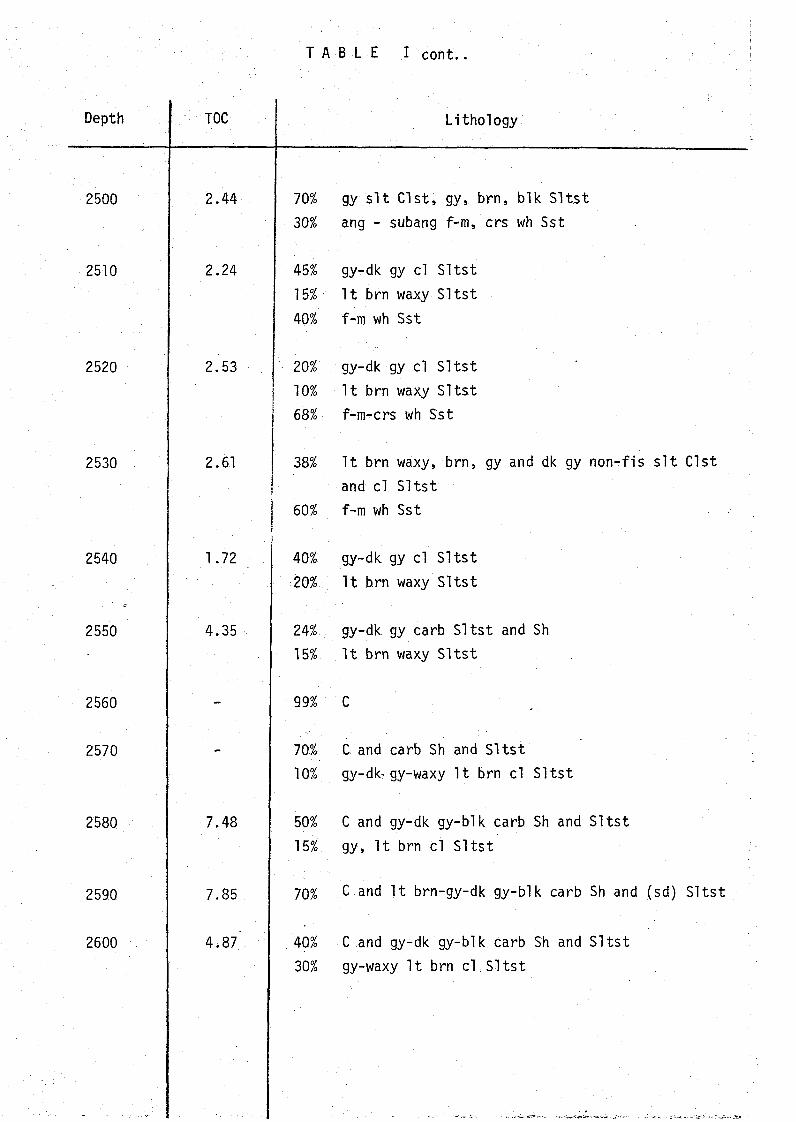
T AB LE I cont..
Depth
. 2500
2510
2520
2530
2540
2550
2560
2570
2580
2590
2600
TOC
2.44
2.24
2.53
2.61
1.72
4.35
-
7.48
7.85
4.. 87.'.
70%
30%
45%
15%
40%
20%
10%
68%
38%
60%
40%
20%
24%.
15%
99%
70%
10%
50%
15%,
70%
40%
30%
Lithology
gy s i t Cist, gy, brn, blk Sltstang - subang f-m, crs wh Sst
gy-dk gy cl SltstI t brn waxy Sltstf-m wh Sst
gy-dk gy cl SltstI t brn waxy Sltstf-ra-crs wh Sst
I t brn waxy, brn, gy and dk gy non-fis s i t Cistand cl Sltstf-m wh Sst
gy-dk gy cl SltstI t brn waxy Sltst
gy-dk gy carb Sltst and ShI t brn waxy Sltst
c
C and carb Sh and Sltstgy-dkr gy-waxy I t brn cl Sltst
C and gy-dk gy-blk carb Sh and Sltstgy, I t brn cl Sltst
C and I t brn-gy-dk gy-blk carb Sh and (sd) Sltst
C and gy-dk gy-blk carb Sh and Sltstgy-waxy I t brn cl Sltst

T A B L E I cont..
Depth
2610
2620
2630
2640
2650
°
2660
2670
2680
2690
2700
TOC
3.69
2.71
3.20
0.77
0.18
2.03
4.28
0.22
1.54
0.20
3.10
0.19
4.12
Lithology
50% gy-dk gy-blk carb Sh and Sl tst and some C
20% brn carb Cist w Muse Sit and vy f S
20% gy- l t brn waxy cl Sl ts t
60% gy-dk gy- l t brn s i t carb Cist
As above
Some yelgn Cist, some carb S l ts t , some C
L i t t l e material
Dried pk sd Cl
gy Sl tst w Muse S
gy-red Cist
50% I t gy-gy-dk gy (sit). Cist
25% earb Sh and C
10% red (s i t ) Cist interlayered w I t gy Cist
5% I t brn Cist
50% red flamy calc (s i t ) Cist
35% I t gy-gy-dk gy Cist, some C
70% I t gy-gy-dk gy ( s i t , carb) Cist
25% red calc Cist
50% red calc ( s i t , flamy} Cist
10% gy s i t Cist
35% red ( s i t , sd) Cist
15% gy (carb} Cist
50% dk. red calc ( s i t , sd, flamy) Cist
20% gy-dk gy- l t gn- l t brn ( s i t , sd) Cist and some C
•

TA B L E I cont..
Depth TOC Lithology
2710 0.16 25% dk red s i t (sd) Clst
3.22 15% gy-carb dk gy ( I t brn, I t gn) (s i t ) Clst
2720 0.19 40% dk red calc ( s i t , sd) Clst
2.83 101 I t brn waxy-gy-dk-gy-gn (s i t ) Clst

TABLE II
WEIGHT (mg) OF EOM AND CHROMATOGRAPHIC FRACTIONS
DepthRockextracted(g)
EOM(mg)
Sat.
(mg)
Aro. HC(mg)
NonCt! TOC
1270+90+1300m
2150+60+70m
2260m
2280+90m
2310+20+30m
2380+90m
2430+40+50m
2460+70+80m
2580+90+2600m
2620+30+40m
55,082,088,069,090,0
100,096,080,037,023,0
30,772,7
194,4146,9
39,051,470,346,049,013,1
15,5
18,8
56,8
36,2
11,1
15,2
51,6
6,78,63,5
4,0
7,0
18,8
14,1
5,1
8,6
14,2
9,6
10,6
2,3
19,525,875,650,316,223,865,816,319,2
5,8
11,246,998,896,622,827,6
4,529,729,8
7,3
1,359,508,177,022,693,613,652,852,422,99
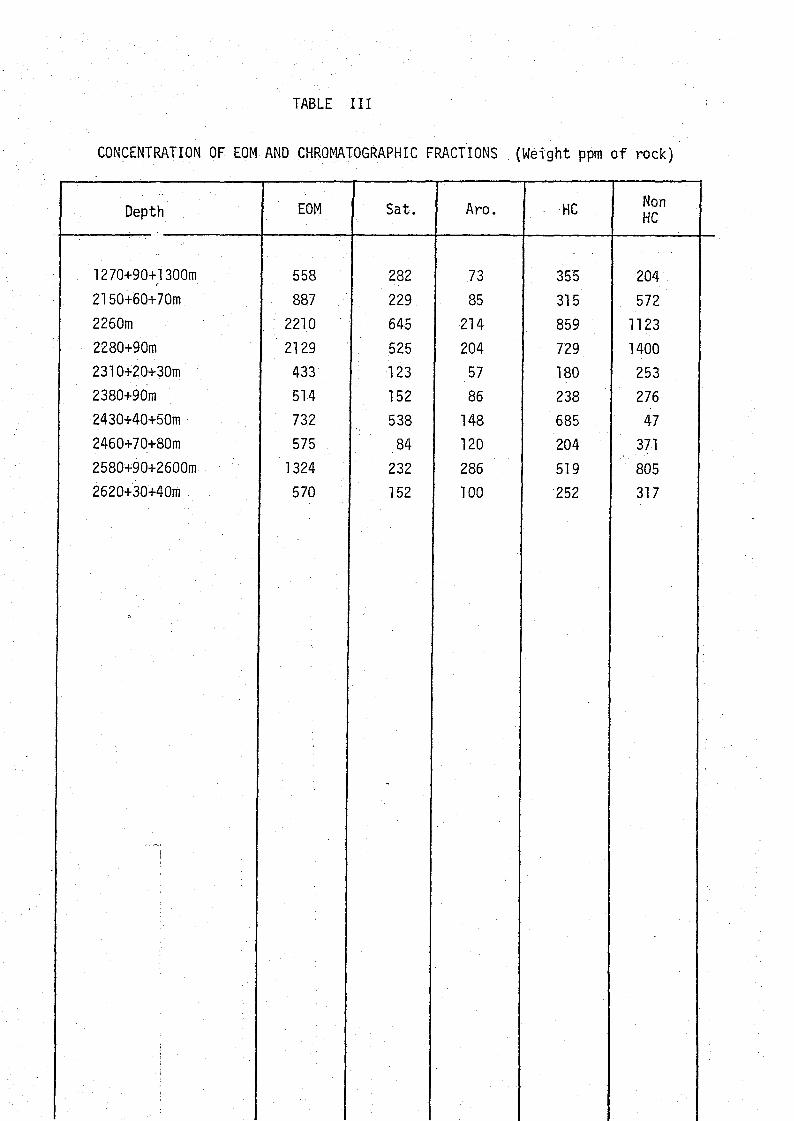
TABLE III
CONCENTRATION OF EOM AND CHR0MAT06RAPHIC FRACTIONS (Weight pptn of rock)
Depth
1270+90+1300m
2150+60+70m
2260m
2280+90m
2310+20+30m
2380+90m
2430+40+50m
2460+70+80m
2580+90+2600m
2620+30+40m
EOM
558
887
2210
2129
433
514
732
575
1324
570
Sat.
282229
645
525
123
152
538
84
232
152
7385
214
204
57
86
148
120
286
100
Aro. HC
355
315
859
729
180
238
685
204
519
252
NonHC
204
572
1123
1400
253
276
47371
805
317

TABLE IV
CONCENTRATION OF EOM AND CHROMATOGRAPHIC FRACTIONS (mg/g TOC)
Depth EOM ..Sat. Aro. HC NonHC
1270+90+1300m
2150+60+70m
2260m
2280+90m
2310+20+30m
2380+90m "
2430+40+50m
2460+70+80m
2580+90+2600m
2620+30+40m
41
9
27
30
16
14
20
20
55
19
21
2
8
7
5
4
15
3
10
5
5
1
3
3
2
2
4
4
12
3
26
3
11
10
7
7
19
7
21
8
15
6
14
20
9
8
1
13
33
11

TABLE V
COMPOSITION IN % OF THE MATERIAL EXTRACTED FROM THE ROCK
Depth (m) '[ Sat
EUMAro HC Sat.
Aro.Non HC HC
Non HC
1270+1290+1300
2150+60+70
2260
2280+90
2310+20+30
2380+90
2430+40+50
2460+70+80
2580+90+2600
2620+30+40
50
26
29
25
28
30
73
15
18
27
13
10
10
10
13
17
20
21
22
18
64
35
39
34
42
46
94
35
39
44
388
269
302
257
218
177
363
70
81
152
36
65
51
66
58
54
6
65
61
56
174
55
77
52
71
86
1462
55
64
80

TABLE VI
TABULATION OF DATAS FROM THE GASCHROMATOGRAMS
Depth (m)
1270
2150
2260
2280
2310
2380
2430
2460
2580
2620
1300
70
90
30
90
50
80
2680
40
Pristane/nC-jy
2.31
1.57
1.70
U76
1.20
2.63
3.20
2.91
2.54
Pristane/Phytane . CPI
NDP
1.49 2.1
1.02 1.1
1.24 1.7
1.28 1.6
1.42 1.5
1.97 1.7
3.29 1.7
2.39 1.6
2.86 1.6

TABLE VII
VITRINITE REFLECTANCE MEASUREMENTS
Depth (m)
770
930
1070
1190
1250
1290
1340
1400
1500
1620
1690
1760
1850
1900
1990
2060
2130
2200
2240
2270
2340
2400
2460
2530
2600
2670
2720
Vitriniterefleqtance
0.37(21)
0.40(16), 0.65(1)
0.46(5)
0.32(20)
0.38(19)
0.39(20)
0.39(20)
0.46(14)
0.37(20)
0.37(18), 0.54(3)
0.41(20)
0.33(10)
0.38(15), 0.66(1)
;0.46(19), 0.65(1)
O.°36(2O)
0.34(20)
0.39(11)
0.39(11)
0.44(8)
0.38(21)
0.45(20)
0.54(25)
0.48(24)
0.38(20)
0.47(20)
0.38(21)
0.40(22)
Fluorescencein UV light
Yellow!+ yellow/orange (3+4)
Yellow (3)
Yellow + yellow/orange (3+4)
Yellow + yellow/orange (3+4)
Yellow + yellow/orange (3+4)
Yellow + yellow/orange (3+4)
Yellow/orange + lightorange (4+5)
Yellow/orange + lightorange (4+5)
Yellow- light orange (3-5)
Yellow - light orange (3-5)
Yellow/orange (4)
Yellow (3)
Yellow/orange 4
Yellow/orange + light orange(4+5)
Yellow/orange + light orange (4+5).
Light orange (5)
Light orange (5)
Yellow/orange (4)
Yellow/orange (4)
Yellow/orange + light orange (4+5)
Light orange (5)
light orange + dull mid.orange (5+6)
Light - mid. orange (5+6)
Yellow/orange +light orange (4+5)
Mid. orange (6)
Yellow/orange + light orange (4+5)
Mid. orange (6)
Exinitecontent
LowLowLowLowLowLow
Low
LowTrace
LowTrace
Trace
Trace
Trace
Moderate
Moderate
Moderate-rich
Moderate-rich
Moderate-rich
Moderate-rich
Moderate
Moderate
Moderate
Moderate-rich
Moderate
Moderate-rich
Moderate .

TABLE V I I I
I KU Well number 17/12-3
/ Code/ / number
Sampledepth
770 m930 m
1070 m
1190 m
1250 m
1290 m
1330 m
1390 m
1510 m
1610 m
1690 m
1770 m1850 m
1870 m
1910 m
1990 m
2050 m
2130 m
2190 m
2230 m
VISUAL KEROGEN ANALYSIS
Composition of residue
Am'Cysts (W)Am, Cysts/WR!
Am, Cysts/WR!
Am, Cysts/WRl
AnvCysts/WR!
Am, Cysts/He, WR!
Am, Cysts/MR!
(Amj/WRi(Am)/WR!
Am/He
Am/W , •
(Am) , . ... -Am/WRi
Am/WRI
Am/WRi.. Am, Cysts/He, WR!
Am, Cysts/He,WR!
Ami cysts/Hev WRIAm, Cysts/He, WR1.
Am, Cysts/He, Poll-spor, WR!
Particlesize "
FFFFF
*
* ••••
*
*
*
: F
FFFF
• F :•
F-M
F-M
Presevation-palynomorphs
GGGG
G
-
F-G
i •
t •
•
NDPG
GG
. '•;,.' G . ; .;....
6 • : •'
G
G i
Thermal maturationindex
1 +
-1+./2-
1+/2-
1+/2-
1+/2-
1+/2-
NDP
^ _l+/2- __
Remarks (Trondheim 1980)
aggregates
aggregatesaggregates
Sapropel recorded as aggregates
Sapropel recorded as aggregates
mud additives or cavings sus-pected
mud additives or cavings su.s-: p,ected ;
.; Very small residue. Caved mat.
: \l^ry smal ij resi due'. Caved mat.
Susp. caved mat. dom.
Susp. caved mat.
Caved mat. susp. Mud add.
aggregates. Mud add.
Sapropel as aggregates .
Sapropel as aggregates
Sapropel as aggregates
Sapropel as aggregates

TABLE VIII
IKU Well number 17/12-3
/ Code/ number
Sampledepth ;
2270 m
2350 m
2410 m
2470 nv
2530 m
2610 m :
2670 m1
2710 m
VISUAL KEROGEN ANALYSIS ;
LomposTtion ot residue
He, Am =
Am, Cysts/He
Am/He, W
Am/He, W, WR! '}•
(Am) He, W, Poll-spor:,Cy ;
(Am) He |
(Am) He •:
(Am) W?R
Particlesize ,o
F [F :
. F :, M :
M i
• M •
M :
M ;
Presevation-palynomorphS:
G
FGG
G
j
Thermal maturationindex ;
2 ;
2
2
2
2
2 ;
2 j
2 2/2+
• i
Remarks (T,rondheim 1980) ;
Landderived mat. after ox.
Hyphae of fungi
Very small residue, caved mat.
•'••Very'^rtiall resi'due,;;cå'ved;;mat.
Very small residue, caved mat.s u s p . -.;.. ,-. "' -... • •
Very small residue, caved mat.susp.
(Am) The amorphousmaterial recorded2410 m to 2710 m isbelieved mainly to bederived from cavedmaterial
* screened residues

TABLE IX i
ROCK-EVAL PYROLYSES
1.
Depth
1250m
1270m
1280m
1300m
1330m
1340m
1330m
1410m
1440m
1460m
1500m
1520m
1560m
1580m
1600m
1640m
1660m
1670m
1680m
1920m
1960m
S i
0,21
0,35
0,52
0,25
0,26 .
0,540,74
0,58
0,24
.;0;26
0,37
-6>38
6,49.
0,89
; 0,51: 0,80.
' 0,36-
: 0:,94
0,38
0,22
0,49
S2
1,75
0,51 ;
1,70
1,58
0,79
0,33 :
0,12
0,30
0^17 ;
0,741,02
• 0 , 9 2
1,18
1,18
0,52
.. 2,00
0,41
1,37
1,1.20,50
0,51
S3
0,13
1,30
0,14
1,37 ;
1 ,111,10
2,221,93 ;
1,9? !1,98
2,Q8
2,06
2,612,07
2,16
;. .2,18
2,05
1,54
1,54
1,70
"1,66
corg
1,71
1,112,14
2,49
1,63
1,04
0,90
1,00 ;
1,17 i
1^31'
1,43
2,83
2,79
1,73
1,88
2,66
2,33
2,85
. 1,72
1,76
0,81
Hydrogen'Index'
102,34
45,95 .: 79,44
63,45
48,47
31,73
13,33
30,00 ;!l4l§3 !
71,33
32,51
42,29
68,21
27,66
75,19
! 17,60
1 48,0765,12
28,41
62,96
Oxygen ,Index ;
7,60
117,12
6,54
55,02
68,10
105,77
246',67 ;
193,00 '
168,38 ;
151,15 -
145,45
72,79
72,04
119,65
114,89
' • 81,95
87,98
54,04
89,53
96,59
204,94
Oil of gas ;content
(Si .+ S2) j
1,96
0,86.
2,22
1,83
1,05
0,87
0,86
0,88 |
0,4l ;•f ,00
1,39
7,30
1,67
2,07
1,03
2,80
•. 0,77
2,31
1,50
0,72
1,00
Production •Index
s lS l + S2 ;
0,11
0,41
0,23
0,14
0,25
0,62
0,86
6,66 ;
0,59
0,26
0,27
0,87
0,29
0,43
0,50
0,29
0,47 ;
0,410,25,
0,31
0,49
T °Cmax
423°
428°
430°4310
433°
430°
434°
426°
429°4250
4290
415°
427°
422°
422°
423°
433°435°
425°
431°
424°

2.
v
<$
TABLE IX
ROCK-EVAL PYROLYSES
Depth ;
1990m
^ 2 0 2 0 m
2.060m
2090m
2100m
2110m
2120m
__2140m
2160m
2180m
~2230m
"Sr2250m
2270m
2310m
2330m; 2350m
: 2370m
2390m
~~2420m
2440m
0,37 =
O',23
0,45'
0,32
0,36
0^4-
0,31 :
0,27
0,24 .
0,30
0,44.
1,43
1,90
1,61
0,32
0,29
0,52
0,41
0,40
0,48
0,55
rja1,43
1,68
2,52
2,53
2,93
2^73
: B,22
4,76
4,96
5,67
31,43
37,68
; 31,20
6,10
\ 3,55
6,39
9,34
7,207 > 3 4
7,65
•:* j
i ,7b1,81
1,79
1,75
1,47
1,46
; 1,49
• i , 5 1
. 1,53
: 1,51
1,62
1,63
1,66
; 1,58
1,66
1,32
1,32
1,35
1,33
1,37
1,33
c o rg
1,28
1,42
V,53
1,69
1,63
1,90
; 1,77! 2,02
• 2,36
2,36
2,21
6,28
6,47
6,07
2,58
2,37
3,19
3,76
3,63
3,44
4,22
HydrogenIndex
. • ' • • ' • • • '
102,34
100,70
109,80
149,11
155,21
154,21
154,24
2S8.42
201,69
210,17
256,56
. 500,48
= 582,38
514,00
, 236,43
' 149,79
248,40
198;35:
213,37
181,28
Oxygen •Index j
132,81
127,46
116,99
103,55
90,18
76,84
84,18
! 74,75 .
64,83
63,98
73,30
25,98
25,66
26,03
64,34
55,70
41,38
.. 35,90
36,64
39,83
31,52
Oil of gascontent
(Si + S2)
1,68
1,66
2,13
2,84
2,89
. 3,27
! 3,04
: 5,49
5,00
5,26
6,11
32,86
39,58
32,81
6,42
' 3,84
6,91
9,75
7,60
7,82
8,20
ProductionInde,x
s lSr -P S2
0,22
0,14
0,21
0,11
B,12o,ib
;• b,io; 0,05
0,05
0,06
0,07
0,04: 0,05
0,05
0,05
: 0,08
0,08
'•: 0,04
; : 0,05
0,06
0,07
T °C
430°431°432°
430°
431°
428°
430°
V 430°
428°
426°
426°
421°
420°
419°4190
430°
'. 427°
• 425° ::
430°
429°
430°

TABLE IX 3.
ROCK-EVAL PYROLYSES
Depth "org
HydrogenIndex
OxygenIndex
Oil of gascontent(Si + S2)
ProductionIndex T'max
2480m
2500m
2520m
2550m
2580m
2600m
2620m
.0,33
0,33
0,42
0,86
• 1 , 1 - 8
0*55
0,68
2,35
4,00
5,54
9,21
24,12
7,77
6,51
1,31
1,32
1,33
1,32
1,35
1,33
1,37
3,842,442,534,357,484,873,69
61,20
163,93
218,97
211,72
322,46
159,55
176,42
34,11
54,10 ;
52,57
30,34
18,05
27,31
37', 13
2,684,33.5,96
10,07
25,30
8,32
7,19
0,120,080,070,090,050,070,09
4350
431°
430°
432°
432°
431°
433°
t
0
1
\u
/
0
10
fa
h'
n>o
L
th
1/T7
d
/
/
p.-
Of
t» ^
0
i
>Å
V
p.
ft
i
if
'$
h
be
/
'/
'å
j
A/:
/?
f
e
i
%c
Xi
n
t
i
hV
n-j i
J */C?1
1 i\ l
%\to\
•If
-
AM,
Wo
%,(</
<i
^ i
Itm-
VJtA
Ilk
\
J
&*•
n-
ff ̂ ^
• • & » • '
3/S- \
5 •40'

TOTAL ORGANIC CARBON (TOO
Presentation of Analytical Data
DEPTH
0,1
1400 -
1905 -
noo -
2200 -
24 ̂ n -
250(
2800 -
TOC
, 0,2 0,3 0,4 0,6 0,8 1,0 2l i i i i
Poor
AA A
A
Fair
X
X X
X
X
X
X
X
X
X
Good
X
XX
X
A
4 6 8i i i
10
Rich
X
X
X
>
'-"-—«L
ZONE
B
D
G
H
K
M
%
• Grey Oaystone
A Red C'aystone
X Siitstone

MATURATION
DEPTH VITRINITE REFLECTANCE ZONE
0,1 0,2 0,45 0,6 0,8 1,0 1,3 2,0 4,0
700
800
900
1000
1100
! 200 —
1300
1400
1500 —
1600 —
7D0
1800
1900 —
2000
2100 —
2200
2300 —
2400
2500
2700
2800 —
Immature O ra
5 E
MatureOilwmdow
OrganicMeta- . |morphism;
1
I
1• •
B
D
G
H
K
M
VISUAL KEROGEN
COLORATION AND COMPOSITION OF ORGANIC RESIDUE
Maturation index Composition of organic residue
0 1 2 3 4 5 0 50 100
V
almost barren
caved mat
caved mat / aim. barren
caved mat M
caved mat
caved mat
^ True material
A Reworked material
• Caved material
Amorphous material,Sapropel
V;-.y.-;:;| Algal
\'''t''/'iV^/]Spores and pollen
Wood remains
Undifferentiated disperseherbaceous material
Black coal fragments

INTERPRETATION DIAGRAM
DEPTHMATURATION
C154" FRACTIONZONE
RATING
SUMMARY OF SOURCE POTENTIAL
20 40 60 80 100
'200
1300 -
1400
1500 -
1600 -
1700 -
1800 -
1900 "
2000 -
2100
2200 • -
2300 _
2400 -
2500
2600 -
2700 -
>800 -
o
o
• oo
o
o
.0
oo
Sat
EOMo% HC
o
EOM
Sat: Saturated HydrocarbonsHC: HydrocarbonsEOM: Extractable Orgdnic Matter
B
D
G
H
K
M
Maturity
(JO ro
S E
Richness Rating
-aooa rr
Immature
Poor potential as source
rocks for oii and gas .
Free HC in siltstones in
zones B and C.
Moderate mature
Good potential as a source
rock for gas (and oil)
Moderate mature
Rich potential as a source
rock for oil and gas.
Mature / oil window
Rich potential as source
rocks for gas.
Mature / oil window
Poor potential as a source
rock for gas.
C15 SATURATED HYDROCARBONS
DEPTH
3 1 1,3 2 3
2200
2300
2400 _
2500
2600
NDP
PRISTANE o PRISTANE
nC 17 PHYTANE
JLP_ 100,1
2280
2460b
I,i*) i i
m

Presentation of Analytical Data
ZONE DEPTH ABUNDANCE (Weight ppm of rock)
B
G
M
1200
1300
1400_
150^
1700_
18 30_
1900__
2000_
21OO_
2200_
2300
2400
2500
2600
10
Poor
102 2
Fair
x1Q2 5x
Good
102 103 1 (i
Rich
104 0,1
• L : iSat. Aro. NSO Asp
Sat
Aro
1
Sat: Saturated Hydrocarbons
Aro: Aromatic Hydrocarbons
NSO: Nitrogen, Sulphur and Oxygen containing compounds
10 0,1 1,0 5,0 10 100
PoorFair-goodRicH Stain
Asp: Asphaltenes
HC: C-| 5+ Hydrocarbons
TOC:Total Organic Carbon

1 7 / 1 2 - 3 Rock - Eval Pyrolysis
Depth Degreeofevolution
T " C Hydrogen Indexmg . HC / g . org . Carbon
Oxygen Index
mgCO / g . org . CarbonOil and gasContent { S1 S2 )
Kg . HC / ton of rock
Production Index
S1
410 450 490 200 400 600 50 100 150 2 4 6 8 10 12 14 0,2 0,6 1,0 1,4
1200 -
1300 —
1400 -
1500 -
1600 -
1700 -
1800 -
1900 -
2000 -
2100 —
2200 —
2300 —
2400 -
2500 —
2600 -
2700 -
2800 —
i i r i i i i i i r \ i i
-r
"1
\


