© 2015 International Monetary Fund
IMF Country Report No.15/182
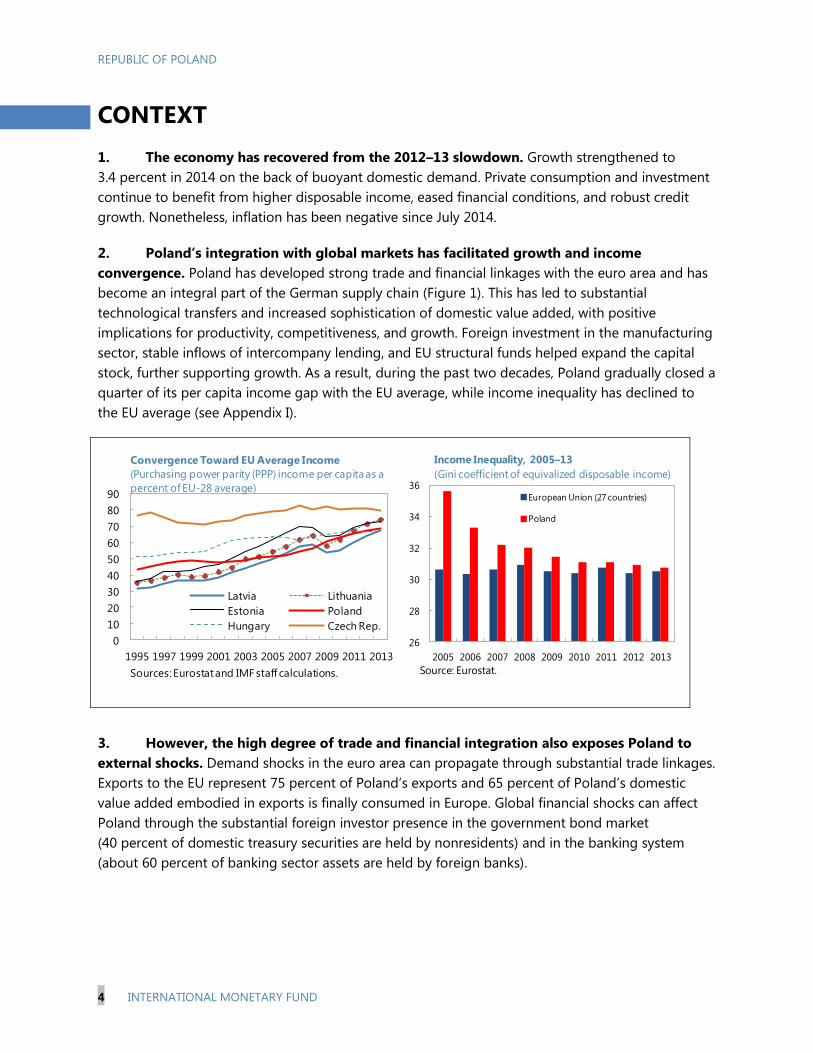
REPUBLIC OF POLAND 2015 ARTICLE IV CONSULTATION—PRESS RELEASE; STAFF REPORT; INFORMATIONAL ANNEX; AND STATEMENT BY THE EXECUTIVE DIRECTOR
The IMF’s transparency policy allows for the deletion of market-sensitive information and premature disclosure of the authorities’ policy intentions in published staff reports and other documents.
Copies of this report are available to the public from
International Monetary Fund Publication Services PO Box 92780 Washington, D.C. 20090
Telephone: (202) 623-7430 Fax: (202) 623-7201 E-mail: [email protected] Web: http://www.imf.org
Price: $18.00 per printed copy
International Monetary Fund Washington, D.C.
Under Article IV of the IMF’s Articles of Agreement, the IMF holds bilateral discussions with members, usually every year. In the context of the 2015 Article IV consultation with Poland, the following documents have been released and are included in this package: A Press Release summarizing the views of the Executive Board as expressed during its
July 10, 2015 consideration of the staff report that concluded the Article IV consultation with Poland.
The Staff Report prepared by a staff team of the IMF for the Executive Board’s consideration on July 10, 2015, following discussions that ended on May 18, 2015, with the officials of Poland on economic developments and policies. Based on information available at the time of these discussions, the staff report was completed on June 22, 2015.
An Informational Annex prepared by the IMF.
A Statement by the Executive Director for the Republic of Poland.
The documents listed below have been or will be separately released. Republic of Poland—Selected Issues
Country Report on Inflation—Selected Issues
July 2015
Press Release No. 15/335
FOR IMMEDIATE RELEASE
July 14, 2015
IMF Executive Board Concludes 2015 Article IV Consultation with the
Republic of Poland
On July 10, 2015, the Executive Board of the International Monetary Fund (IMF) concluded
the Article IV consultation1 with the Republic of Poland.
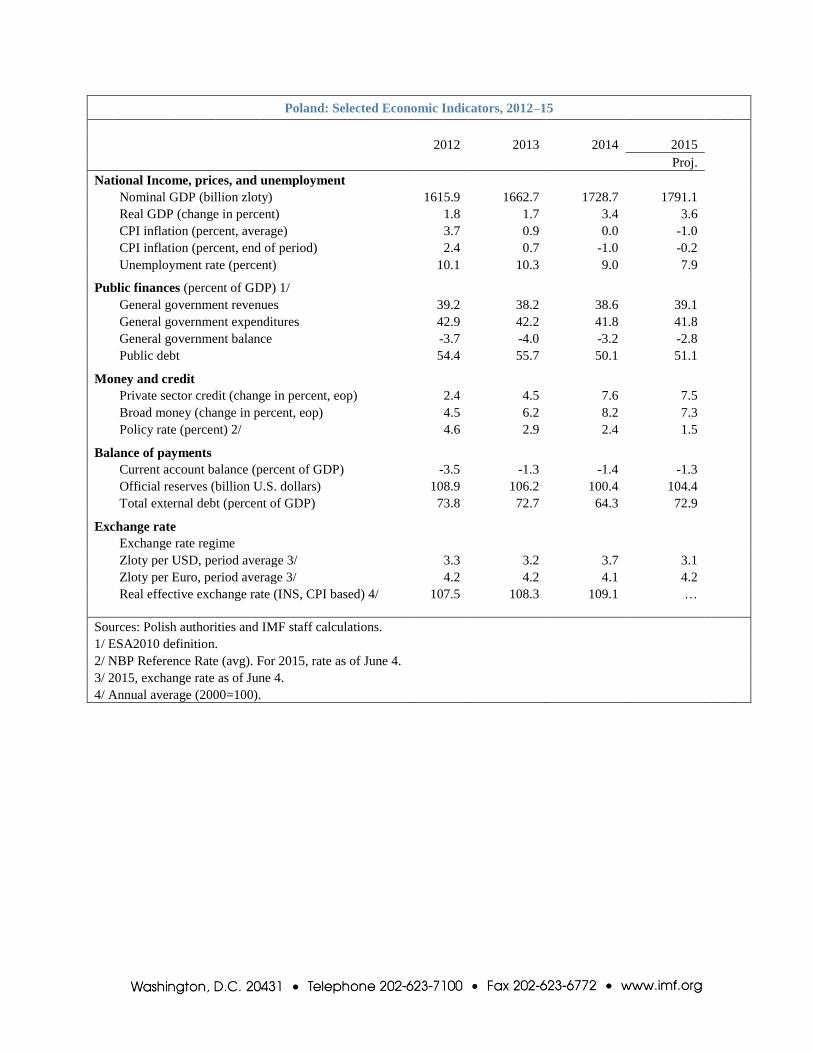
The economy has recovered from the 2012–13 slowdown. Growth accelerated to 3.4 percent
in 2014, and further to 3.6 percent in the first quarter of 2015, on the back of buoyant
domestic demand, supported by improving labor market and financial conditions. However,
inflation has remained negative since July 2014 owing to low commodity prices and weak
imported inflation. The current account deficit narrowed from 3.5 percent in 2012 to
1.4 percent in 2014, benefiting from strong exports.
The outlook is for continued robust growth and subdued inflation amid downside risks.
Economic expansion is expected to continue, with growth projected at 3.5 percent in 2015
and over the medium term. External downside risks include a surge in global financial
market volatility amid asymmetric monetary exit in advanced economies, continued
geopolitical tensions in the region, and renewed sovereign stress or protracted low growth in
the euro area. Domestically, inflation could fail to pick up owing to external factors or if low
inflation expectations become entrenched. On the upside, a stronger-than-expected recovery
in the euro area and low oil prices would further lift growth in Poland. Poland’s Flexible
Credit Line (FCL) arrangement with the IMF helps mitigate external downside risks.
Policies have focused on supporting growth and rebuilding policy buffers. Monetary policy
has remained accommodative helped by a cumulative 100 basis points cut in the policy
interest rate since October. Fiscal consolidation has advanced further, allowing Poland to exit
the Excessive Deficit Procedure (EDP) one year early. The general government deficit,
which declined to 3.2 percent of GDP last year, is expected to narrow further over the
medium term. The banking sector has remained well-capitalized and resilient to shocks,
1 Under Article IV of the IMF's Articles of Agreement, the IMF holds bilateral discussions with members,
usually every year. A staff team visits the country, collects economic and financial information, and discusses with officials the country's economic developments and policies. On return to headquarters, the staff prepares a report, which forms the basis for discussion by the Executive Board.
International Monetary Fund
Washington, D.C. 20431 USA
2
while reliance on foreign funding has declined. However, legacy vulnerabilities remain,
including a sizable stock of foreign-currency loans and the still-elevated nonperforming loan
(NPL) ratio.
Executive Board Assessment2
Executive Directors welcomed Poland’s recovery from the 2012–13 slowdown, supported by
very strong economic fundamentals and policies, which pave the way for continued robust
growth and further integration with European and global markets. Poland’s strong policy
framework has also increased the economy’s resilience. While the outlook is favorable,
downside risks remain—including from volatile global financial conditions, geopolitical
tensions, and sovereign stress in the euro area. Directors encouraged the authorities to further
strengthen policy buffers and advance structural reforms to mitigate risks and ensure a
durable and balanced recovery. They noted that the precautionary FCL arrangement
continues to provide important temporary insurance against external risks.
Directors welcomed the March policy interest rate cut, which should help limit the risk of
prolonged low inflation. While recognizing that low inflation so far did not appear to have
negative effects on the real economy, Directors agreed that there may be a need to ease
monetary policy further if inflation expectations continue to disappoint. Directors also
recommended moderate reserve accumulation to strengthen the resilience to shocks.
Directors commended the continued strong performance of the banking sector, which
remains well-capitalized, liquid, and profitable. They welcomed the new bankruptcy and
insolvency law and encouraged the authorities to expedite implementation of other key
financial sector reforms, including the adoption of comprehensive macroprudential and bank
resolution frameworks. Directors recommended continued efforts to address legacy
vulnerabilities from still-elevated levels of NPLs and the credit union segment, and supported
the authorities’ case-by-case approach to restructuring distressed Swiss-franc-denominated
mortgages.
Directors commended the authorities’ strong fiscal consolidation efforts, which allowed
Poland to exit the European Union’s EDP one year early. They considered that continued
gradual consolidation would create additional policy space to allow for a timely and effective
response to shocks without unduly weighing on growth. In this regard, Directors agreed that
the medium-term objective of a structural deficit of 1 percent of GDP remains appropriate,
and encouraged the authorities to identify specific expenditure savings and reduce the large
VAT revenue gap to ensure that this objective will be met. Over the longer run, continued
efforts to raise spending efficiency and reform of the special pension schemes would help to
address fiscal pressures from population aging.
Directors encouraged the authorities to continue to implement structural reforms to boost
productivity, safeguard competitiveness, and allow the economy to move up the value-added
2 At the conclusion of the discussion, the Managing Director, as Chairman of the Board, summarizes the views
of Executive Directors, and this summary is transmitted to the country's authorities. An explanation of any qualifiers used in summings up can be found here: http://www.imf.org/external/np/sec/misc/qualifiers.htm.

3
chain, thereby facilitating income convergence. They welcomed recent steps to streamline
the list of regulated professions, reduce labor market segmentation, and ease administrative
requirements for business start-ups. Directors advised that continued productivity gains
would require promoting innovation, encouraging greenfield investment, and better targeting
education and training to employer needs.
Poland: Selected Economic Indicators, 2012–15
2012 2013 2014 2015
Proj.
National Income, prices, and unemployment
Nominal GDP (billion zloty) 1615.9 1662.7 1728.7 1791.1
Real GDP (change in percent) 1.8 1.7 3.4 3.6
CPI inflation (percent, average) 3.7 0.9 0.0 -1.0
CPI inflation (percent, end of period) 2.4 0.7 -1.0 -0.2
Unemployment rate (percent) 10.1 10.3 9.0 7.9
Public finances (percent of GDP) 1/
General government revenues 39.2 38.2 38.6 39.1
General government expenditures 42.9 42.2 41.8 41.8
General government balance -3.7 -4.0 -3.2 -2.8
Public debt 54.4 55.7 50.1 51.1
Money and credit
Private sector credit (change in percent, eop) 2.4 4.5 7.6 7.5
Broad money (change in percent, eop) 4.5 6.2 8.2 7.3
Policy rate (percent) 2/ 4.6 2.9 2.4 1.5
Balance of payments
Current account balance (percent of GDP) -3.5 -1.3 -1.4 -1.3
Official reserves (billion U.S. dollars) 108.9 106.2 100.4 104.4
Total external debt (percent of GDP) 73.8 72.7 64.3 72.9
Exchange rate
Exchange rate regime
Zloty per USD, period average 3/ 3.3 3.2 3.7 3.1
Zloty per Euro, period average 3/ 4.2 4.2 4.1 4.2
Real effective exchange rate (INS, CPI based) 4/ 107.5 108.3 109.1 …
Sources: Polish authorities and IMF staff calculations.
1/ ESA2010 definition.
2/ NBP Reference Rate (avg). For 2015, rate as of June 4.
3/ 2015, exchange rate as of June 4.
4/ Annual average (2000=100).

REPUBLIC OF POLAND STAFF REPORT FOR THE 2015 ARTICLE IV CONSULTATION
KEY ISSUES
Context. The economy has recovered from the 2012–13 slowdown, supported by sound
policies and improving external conditions. The outlook is for robust growth and
subdued inflation but risks, although moderating, are tilted to the downside. Further
structural reforms and stronger policy buffers will mitigate risks and ensure that the
recovery is durable and balanced.
Interconnectedness. Poland’s strong interconnectedness with Europe through both
trade and financial linkages has facilitated growth and income convergence and reduced
inequality. However, it also exposes Poland to external shocks that can propagate
through substantial foreign participation in the government bond market and in the
banking system.
Monetary policy. The recent policy interest rate cuts should help gradually return
inflation to the target. However, the Monetary Policy Council (MPC) should stand ready
to further ease monetary policy if inflation expectations were to disappoint.
Financial sector policy. The financial sector remains profitable, well-capitalized, and
liquid. Credit growth is picking up in tandem with activity. Addressing legacy
vulnerabilities and completing financial sector reforms would further buttress financial
stability and support continued healthy credit expansion.
Fiscal policy. Gradual fiscal consolidation should continue to build policy buffers and
address long-term aging-related contingent liabilities. The authorities should identify
measures to underpin their fiscal plans.
Structural reforms. Over the past two decades, Poland succeeded in closing a quarter
of its per capita income gap with the European Union (EU) average. Further boosting
income levels and living standards requires structural reforms to move up the value-
added chain and facilitate labor mobility to higher productivity sectors.
June 22, 2015

REPUBLIC OF POLAND
2 INTERNATIONAL MONETARY FUND
Approved By Thanos Arvanitis
and Sanjaya Panth
Ms. Zakharova (Head), Ms. Christiansen, Mr. Ebeke (all EUR), and
Ms. Kyobe (SPR) visited Warsaw during May 7–18, 2015. The mission
met with senior government and central bank officials and
representatives from trade unions and the business community.
Mr. Roaf (Senior Regional Resident Representative), Mr. Sierhej, and
Mr. Krogulski (Resident Representative Office) participated in the
discussions. Mr. Morán Arce, Ms. Nguyen, Ms. Moraes Rego, and
Ms. Allison (all EUR) provided support from headquarters. Poland is an
Article IV country and maintains an exchange system free of
restrictions on the making of payments and transfers for current
international transactions, except for those solely for the preservation
of national or international security (Informational Annex: Fund
Relations). Data provision is adequate for surveillance (Informational
Annex: Statistical Issues).
CONTENTS
CONTEXT_________________________________________________________________________________________ 4
RECENT ECONOMIC DEVELOPMENTS __________________________________________________________ 6
OUTLOOK AND RISKS ___________________________________________________________________________ 9
POLICY DISCUSSIONS: ADVANCING REFORMS TO PROMOTE STABILITY AND INCOME
CONVERGENCE ________________________________________________________________________________ 16
A. Maintaining Accommodative Monetary Stance to Guide Inflation to Target __________________ 16
B. Financial Sector Policies and Reforms to Buttress Stability ____________________________________ 18
C. Continuing Fiscal Consolidation to Reinforce Policy Buffers ___________________________________ 21
D. Structural Reforms to Boost Productivity and Facilitate Convergence _________________________ 24
STAFF APPRAISAL _____________________________________________________________________________ 26
BOXES
1. External Sector Assessment ____________________________________________________________________ 9
2. Balance Sheet Effects from Lowflation _________________________________________________________ 13
3. Raising Productivity Growth in Poland: The Role of Structural Transformation ________________ 25
FIGURES
1. Integration with the Global Economy __________________________________________________________ 28
2. Financial Market Developments _______________________________________________________________ 29
3. Recent Economic and Labor Market Developments ___________________________________________ 30
4. Balance of Payments __________________________________________________________________________ 31

REPUBLIC OF POLAND
INTERNATIONAL MONETARY FUND 3
5. Recent Inflation Developments ________________________________________________________________ 32
6. Monetary Policy Developments _______________________________________________________________ 33
7. Banking Sector Capital and Asset Quality _____________________________________________________ 34
8. Credit Growth and Banking Sector Funding ___________________________________________________ 35
9. VAT Compliance _______________________________________________________________________________ 36
10. Prevalence of State-Owned Enterprises ______________________________________________________ 37
TABLES
1. Selected Economic Indicators, 2012–20 _______________________________________________________ 38
2. Balance of Payments on Transaction Basis, 2012–20 __________________________________________ 39
3. Risk Assessment Matrix ________________________________________________________________________ 40
4. Implementation of Past Fund Advice __________________________________________________________ 42
5. Financial Soundness Indicators, 2007–14 ______________________________________________________ 43
6. 2013 FSAP Recommendations and Current Status _____________________________________________ 44
7. Monetary Accounts, 2008–15 __________________________________________________________________ 46
8. General Government Statement of Operations, 2012–20 ______________________________________ 47
9. General Government Financial Balance Sheets, 2012–20 ______________________________________ 48
ANNEXES
I. External Debt Sustainability Analysis ___________________________________________________________ 49
II. Public Sector Debt Sustainability Analysis _____________________________________________________ 51
APPENDICES
I. Evolution of Income Inequality Following EU Accession ________________________________________ 59
II. Foreign Currency Mortgages __________________________________________________________________ 63
III. Efficiency of Public Expenditure _______________________________________________________________ 66
REPUBLIC OF POLAND
4 INTERNATIONAL MONETARY FUND
CONTEXT
1. The economy has recovered from the 2012–13 slowdown. Growth strengthened to
3.4 percent in 2014 on the back of buoyant domestic demand. Private consumption and investment
continue to benefit from higher disposable income, eased financial conditions, and robust credit
growth. Nonetheless, inflation has been negative since July 2014.
2. Poland’s integration with global markets has facilitated growth and income
convergence. Poland has developed strong trade and financial linkages with the euro area and has
become an integral part of the German supply chain (Figure 1). This has led to substantial
technological transfers and increased sophistication of domestic value added, with positive
implications for productivity, competitiveness, and growth. Foreign investment in the manufacturing
sector, stable inflows of intercompany lending, and EU structural funds helped expand the capital
stock, further supporting growth. As a result, during the past two decades, Poland gradually closed a
quarter of its per capita income gap with the EU average, while income inequality has declined to
the EU average (see Appendix I).
3. However, the high degree of trade and financial integration also exposes Poland to
external shocks. Demand shocks in the euro area can propagate through substantial trade linkages.
Exports to the EU represent 75 percent of Poland’s exports and 65 percent of Poland’s domestic
value added embodied in exports is finally consumed in Europe. Global financial shocks can affect
Poland through the substantial foreign investor presence in the government bond market
(40 percent of domestic treasury securities are held by nonresidents) and in the banking system
(about 60 percent of banking sector assets are held by foreign banks).
26
28
30
32
34
36
2005 2006 2007 2008 2009 2010 2011 2012 2013
European Union (27 countries)
Poland
Income Inequality, 2005–13
(Gini coefficient of equivalized disposable income)
Source: Eurostat.
0
10
20
30
40
50
60
70
80
90
1995 1997 1999 2001 2003 2005 2007 2009 2011 2013
Latvia Lithuania
Estonia Poland
Hungary Czech Rep.
Convergence Toward EU Average Income
(Purchasing power parity (PPP) income per capita as a
percent of EU-28 average)
Sources: Eurostat and IMF staff calculations.

REPUBLIC OF POLAND
INTERNATIONAL MONETARY FUND 5
Poland: Trade and Financial Linkages
A large share of trade is with Europe… …and the banking system is largely foreign owned.
Nonresidents hold a large share of domestic treasuries,…
…increasing the comovement of Polish yields with global markets.
4. So far, the economy has weathered well several bouts of market turbulence. Poland’s
very strong fundamentals and policies helped preserve investor confidence in the face of continuing
geopolitical tensions in the region and episodes of emerging market volatility (Figure 2). The large
share of the relatively stable intercompany loans in corporate debt, reduced reliance on parent bank
funding, and a stable and diversified investor base in the domestic government bond market have
helped mitigate the risks of capital flow reversals and dampened financial volatility. The Flexible
Credit Line (FCL) arrangement with the IMF has provided additional insurance against external
shocks.
5. Going forward, it will be important to continue building policy buffers to enhance
resilience to shocks and implement structural reforms to complete convergence.
10
15
20
25
30
35
40
45
2009 2010 2011 2012 2013 2014 2015
Owned by domestic banks (incl. MoF)
Owned by foreign investors
Poland: Ownership of Local Currency Government Bonds
(Percent of treasury securities outstanding)
Sources: Haver Analytics, National Authorities, and
IMF staff calculations.
DEU
27%
CIS
8%
CEE
7%GBR
7%CZE
7%
FRA
6%
RUS
5%
ITA
5%
NDL
4%
SWE
3%
UKR
3%
SVK
3%
HUN
3%
ESP
3%
BEL
2%
Others
11%
Export Shares (2014)
Source: IMF Direction of Trade and Statistics.
0
0.05
0.1
0.15
0.2
DEU U.S. ITA ESP PRT GRC
Conditional Correlations with Poland Yields, 2009–15
(Regression-based correlations )
Correlations are based on estimates from regressions of weekly
changes in Polish yields on changes in other countries' yields .
For ITA, ESP, PRT, and GRC, the regression controls for DEU
yields.
Sources: Haver analytics and IMF staff calculations.
Italy
13.1
Germany
10.3Netherlands
8.9
Spain
8.5
USA
5.7
France
4.7
Portugal
4.1
Other
8
Domestic
36.8
Bank Ownership Structure
(Percent of assets, 2013)
Sources: Polish Financial Supervision Authority (KNF) and IMF
staff calculations.

REPUBLIC OF POLAND
6 INTERNATIONAL MONETARY FUND
Policy buffers. Much has been achieved in strengthening policy buffers. However, further effort
is needed to create additional policy space to better cope with shocks. The fiscal deficit and
public debt have declined, and Poland has exited the Excessive Deficit Procedure (EDP) one year
earlier than expected. Nonetheless, public debt is still elevated. Continued gradual fiscal
consolidation is needed to put it on a robust downward path. International reserves have
increased and are broadly adequate on the IMF’s modified metric for assessing reserve
adequacy (ARA). Nonetheless, reserves continue to fall short on some metrics, including as a
share of short-term debt. Effective financial sector oversight promoted strong capitalization in
banks but work to adopt the bank resolution and macroprudential frameworks needs to be
finalized.
Completing convergence. Accelerating economic convergence will require structural reforms
to close productivity gaps, move up the value-added chain, and complete structural
transformation of the economy.
6. The near-term reform momentum is being dampened by political uncertainty. The
presidential elections in May were closely contested and ended with a decisive victory of the
opposition, Law and Justice (PiS) party candidate. Parliamentary elections are scheduled to take
place in the fall. In the meantime, and given the uncertainty and the ruling coalition’s slim
parliamentary majority, a slowdown of reform momentum is a risk.
RECENT ECONOMIC DEVELOPMENTS
7. Growth continues to strengthen. Real
GDP growth reached 3.4 percent in 2014, up
from 1.7 percent in 2013, supported by strong
domestic demand. Higher disposable income—
boosted by accelerating wages, falling
unemployment, and declining prices—has
buoyed private consumption. Investment has
benefited from robust credit growth on the back
of eased financial conditions. These trends have
continued into the first quarter of 2015, with
growth accelerating to 3.6 percent. High
frequency indicators, including strong Purchasing
Managers Index (PMI) readings, point to
continued healthy economic expansion (Figure 3,
Table 1).
8. Financial conditions have eased. A cumulative 100 basis points (bps) cut in the main policy
interest rate between October and March and low yields on local-currency government bonds
reduced borrowing costs. In April, Poland became the first emerging market to issue foreign-
currency denominated bonds at a negative yield helped by ample market liquidity following the
3.7
4.1
8.0
9.9
6.3
-1.2
Real growth rate of
private
consumption
Nominal wage
growth
Unemployment
rate (SA)
Real investment
growth
Private credit
growth
Inflation rate
2012Q4
2013Q4
2015Q1
Poland: Changes in Economic Indicators, 2012–15
Sources: Polish authorities, Eurostat, and IMF staff calculations.
REPUBLIC OF POLAND
INTERNATIONAL MONETARY FUND 7
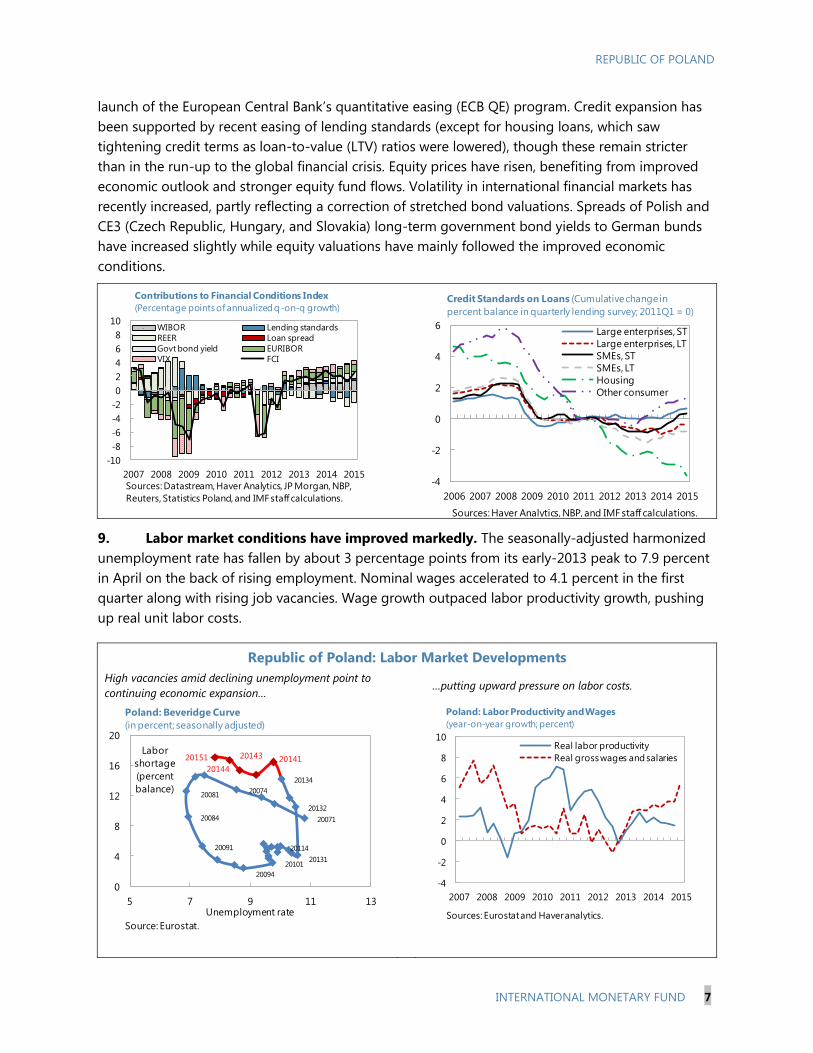
launch of the European Central Bank’s quantitative easing (ECB QE) program. Credit expansion has
been supported by recent easing of lending standards (except for housing loans, which saw
tightening credit terms as loan-to-value (LTV) ratios were lowered), though these remain stricter
than in the run-up to the global financial crisis. Equity prices have risen, benefiting from improved
economic outlook and stronger equity fund flows. Volatility in international financial markets has
recently increased, partly reflecting a correction of stretched bond valuations. Spreads of Polish and
CE3 (Czech Republic, Hungary, and Slovakia) long-term government bond yields to German bunds
have increased slightly while equity valuations have mainly followed the improved economic
conditions.
9. Labor market conditions have improved markedly. The seasonally-adjusted harmonized
unemployment rate has fallen by about 3 percentage points from its early-2013 peak to 7.9 percent
in April on the back of rising employment. Nominal wages accelerated to 4.1 percent in the first
quarter along with rising job vacancies. Wage growth outpaced labor productivity growth, pushing
up real unit labor costs.
Republic of Poland: Labor Market Developments
High vacancies amid declining unemployment point to
continuing economic expansion…
…putting upward pressure on labor costs.
20071
2007420081
20084
20091
20094
20101
20114
20131
20132
20134
2014120143
20144
20151
0
4
8
12
16
20
5 7 9 11 13
Labor
shortage
(percent
balance)
Unemployment rate
Poland: Beveridge Curve
(in percent; seasonally adjusted)
Source: Eurostat.
-4
-2
0
2
4
6
8
10
2007 2008 2009 2010 2011 2012 2013 2014 2015
Real labor productivity
Real gross wages and salaries
Poland: Labor Productivity and Wages
(year-on-year growth; percent)
Sources: Eurostat and Haver analytics.
-4
-2
0
2
4
6
2006 2007 2008 2009 2010 2011 2012 2013 2014 2015
Large enterprises, ST
Large enterprises, LT
SMEs, ST
SMEs, LT
Housing
Other consumer
Credit Standards on Loans (Cumulative change in
percent balance in quarterly lending survey; 2011Q1 = 0)
Sources: Haver Analytics, NBP, and IMF staff calculations.
-10
-8
-6
-4
-2
0
2
4
6
8
10
2007 2008 2009 2010 2011 2012 2013 2014 2015
WIBOR Lending standards
REER Loan spread
Govt bond yield EURIBOR
VIX FCI
Contributions to Financial Conditions Index
(Percentage points of annualized q-on-q growth)
Sources: Datastream, Haver Analytics, JP Morgan, NBP,
Reuters, Statistics Poland, and IMF staff calculations.
REPUBLIC OF POLAND
8 INTERNATIONAL MONETARY FUND
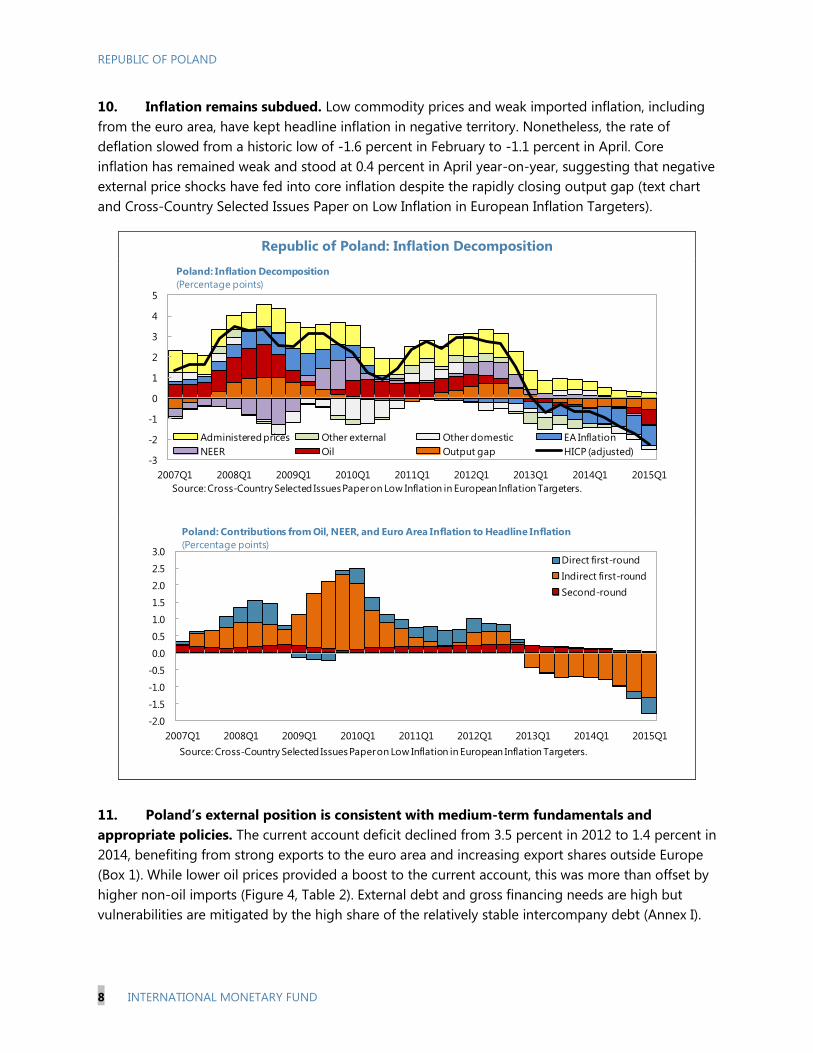
10. Inflation remains subdued. Low commodity prices and weak imported inflation, including
from the euro area, have kept headline inflation in negative territory. Nonetheless, the rate of
deflation slowed from a historic low of -1.6 percent in February to -1.1 percent in April. Core
inflation has remained weak and stood at 0.4 percent in April year-on-year, suggesting that negative
external price shocks have fed into core inflation despite the rapidly closing output gap (text chart
and Cross-Country Selected Issues Paper on Low Inflation in European Inflation Targeters).
Republic of Poland: Inflation Decomposition
11. Poland’s external position is consistent with medium-term fundamentals and
appropriate policies. The current account deficit declined from 3.5 percent in 2012 to 1.4 percent in
2014, benefiting from strong exports to the euro area and increasing export shares outside Europe
(Box 1). While lower oil prices provided a boost to the current account, this was more than offset by
higher non-oil imports (Figure 4, Table 2). External debt and gross financing needs are high but
vulnerabilities are mitigated by the high share of the relatively stable intercompany debt (Annex I).
-3
-2
-1
0
1
2
3
4
5
2007Q1 2008Q1 2009Q1 2010Q1 2011Q1 2012Q1 2013Q1 2014Q1 2015Q1
Administered prices Other external Other domestic EA Inflation
NEER Oil Output gap HICP (adjusted)
Poland: Inflation Decomposition
(Percentage points)
Source: Cross-Country Selected Issues Paper on Low Inflation in European Inflation Targeters.
-2.0
-1.5
-1.0
-0.5
0.0
0.5
1.0
1.5
2.0
2.5
3.0
2007Q1 2008Q1 2009Q1 2010Q1 2011Q1 2012Q1 2013Q1 2014Q1 2015Q1
Direct first-round
Indirect first-round
Second-round
Poland: Contributions from Oil, NEER, and Euro Area Inflation to Headline Inflation
(Percentage points)
Source: Cross-Country Selected Issues Paper on Low Inflation in European Inflation Targeters.

REPUBLIC OF POLAND
INTERNATIONAL MONETARY FUND 9
Box 1. External Sector Assessment
The external position in 2014 is broadly in line with medium-term fundamentals and appropriate policies,
though vulnerabilities exist. As of March 2015, it appears that the positive impact of lower oil prices on the
trade balance is being more than offset by strong domestic demand growth and rising import demand,
leaving the overall assessment of the external position unaffected.
Current account. The current account deficit declined from around 5 percent of GDP in 2010–11 to
1.4 percent of GDP in 2014. In 2015, the current account is projected to improve only marginally, despite the
improvement in the oil trade deficit (3.4 percent of GDP in 2013) which is more than offset by higher non-oil
imports due to strong domestic demand. The cyclically-adjusted current account balance is consistent with
fundamentals and desirable policies.
Real exchange rate. The real exchange rate is assessed to be broadly in line with fundamentals and
desirable policy settings. Alternative approaches suggest a modest undervaluation of between 2 and
11 percent (2 percent using the current account norm; the estimated undervaluation using the external
sustainability estimate of the real effective exchange rate (REER) gap is 6 percent; and the estimated
undervaluation using the REER index regression approach is 2 percent and 11 percent using the levels
approach). Capital inflows following ECB QE action could result in appreciation of the zloty, though the
50 bps policy interest rate cut in March could mitigate the impact.
Capital and financial account. Portfolio inflows into domestic bond and equity markets have weakened in
2014. There has also been a decrease in foreign direct investment (FDI) flows, primarily reflecting high
income repatriation, while EU funds—which finance the bulk of the current account—are stable. Although
part of the decline in net FDI inflows was associated with one-off factors, going forward, financing of the
widening current account could prove challenging should FDI inflows fall significantly below current
projections.
Foreign assets and liabilities. Substantial net international investment position (IIP) liabilities have
stabilized and stood at 60 percent of GDP in 2014. Associated vulnerabilities are mitigated by the large and
diversified share of FDI liabilities and related intercompany lending (over 40 percent of foreign liabilities are
FDI investments).
Reserve adequacy. Reserves are broadly adequate at about 114 percent of the IMF’s modified composite
reserve adequacy metric at end-2014.
OUTLOOK AND RISKS
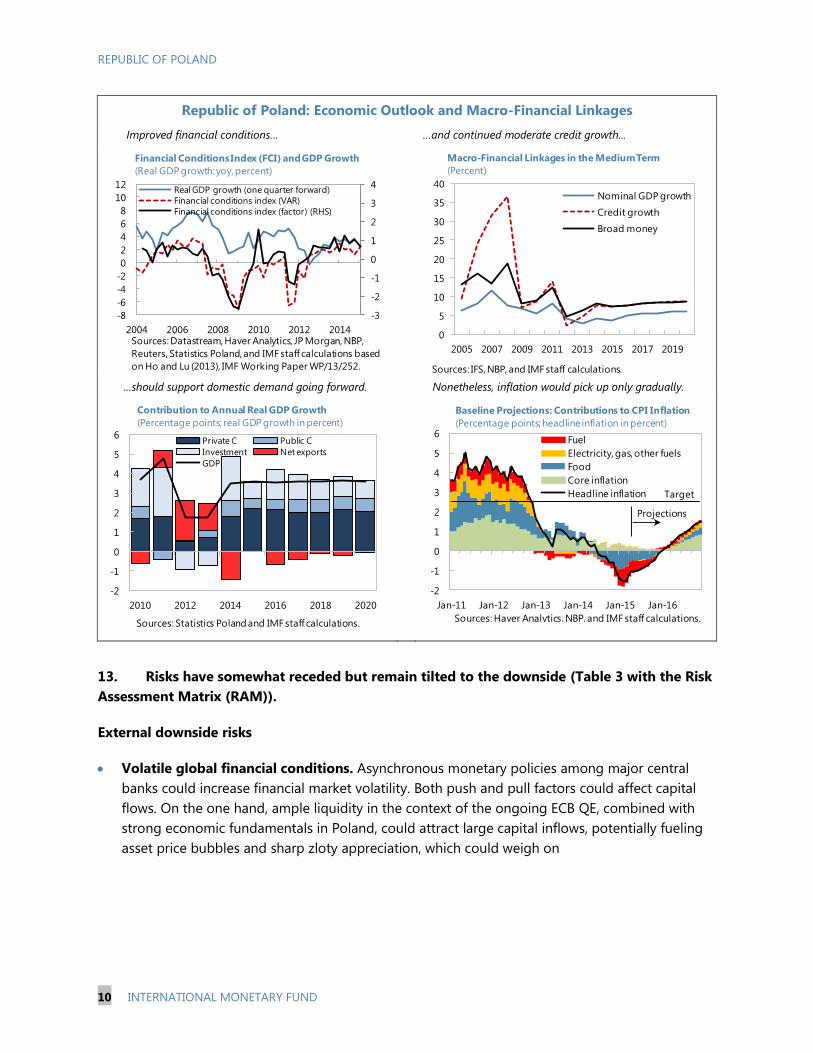
12. The outlook is for continued robust growth and subdued inflation. Healthy domestic
demand is expected to maintain growth at around 3½ percent in 2015. Private consumption and
investment will continue driving growth over the medium term, supported by falling unemployment,
robust wage growth, and a moderate pick-up in credit growth. On the supply side, given adverse
demographic trends, increasing labor participation (including of women), and boosting investment
and productivity will be key to sustaining strong growth (see also Section D). Poland should
continue to benefit from improved economic conditions in the euro area and higher EU structural
funds. The output gap is projected to close in 2016. Nonetheless, continued low commodity prices
and still-low imported inflation, combined with subdued inflation expectations, will contain inflation
below the target band (1.5 to 3.5 percent) until late-2016 (Chapter I of Selected Issues).
REPUBLIC OF POLAND
10 INTERNATIONAL MONETARY FUND
Republic of Poland: Economic Outlook and Macro-Financial Linkages
Improved financial conditions… …and continued moderate credit growth...
…should support domestic demand going forward. Nonetheless, inflation would pick up only gradually.
13. Risks have somewhat receded but remain tilted to the downside (Table 3 with the Risk
Assessment Matrix (RAM)).
External downside risks
Volatile global financial conditions. Asynchronous monetary policies among major central
banks could increase financial market volatility. Both push and pull factors could affect capital
flows. On the one hand, ample liquidity in the context of the ongoing ECB QE, combined with
strong economic fundamentals in Poland, could attract large capital inflows, potentially fueling
asset price bubbles and sharp zloty appreciation, which could weigh on
-3
-2
-1
0
1
2
3
4
-8
-6
-4
-2
0
2
4
6
8
10
12
2004 2006 2008 2010 2012 2014
Real GDP growth (one quarter forward)
Financial conditions index (VAR)
Financial conditions index (factor) (RHS)
Financial Conditions Index (FCI) and GDP Growth
(Real GDP growth: yoy, percent)
Sources: Datastream, Haver Analytics, JP Morgan, NBP,
Reuters, Statistics Poland, and IMF staff calculations based
on Ho and Lu (2013), IMF Working Paper WP/13/252.
0
5
10
15
20
25
30
35
40
2005 2007 2009 2011 2013 2015 2017 2019
Nominal GDP growth
Credit growth
Broad money
Macro-Financial Linkages in the Medium Term
(Percent)
Sources: IFS, NBP, and IMF staff calculations.
-2
-1
0
1
2
3
4
5
6
Jan-11 Jan-12 Jan-13 Jan-14 Jan-15 Jan-16
Fuel
Electricity, gas, other fuels
Food
Core inflation
Headline inflation
Baseline Projections: Contributions to CPI Inflation
(Percentage points; headline inflation in percent)
Projections
Target
Sources: Haver Analytics, NBP, and IMF staff calculations.
-2
-1
0
1
2
3
4
5
6
2010 2012 2014 2016 2018 2020
Private C Public C
Investment Net exports
GDP
Contribution to Annual Real GDP Growth
(Percentage points; real GDP growth in percent)
Sources: Statistics Poland and IMF staff calculations.

REPUBLIC OF POLAND
INTERNATIONAL MONETARY FUND 11
inflation. On the other hand, monetary policy
tightening in the United States (U.S.) could result in
capital outflows, zloty depreciation, and liquidity
shortages. Staff analysis (text chart) suggests that
the co-movement between Polish and U.S. yields
increases sharply during episodes of market stress.
However, risks of outflows are mitigated by a stable
and diversified investor base, Poland’s strong
economic fundamentals, flexible exchange rate,
and foreign exchange (FX) reserve buffers.
Sovereign stress (particularly in Greece) or a
protracted slowdown in the euro area. While
direct linkages with Greece are limited, market
pressure on the euro area from a protracted
turmoil in Greece could spillover into Poland.
Nonetheless, contagion to the rest of Europe and
Poland could be reduced by strong policy action
at the euro area level, including through liquidity
support and deployment of existing firewalls.
Moreover, correlation of Polish government
bond yields with Greece during periods of stress
has historically been limited. A protracted growth
slowdown in the euro area could adversely affect
Poland via strong trade and financial linkages.
Conflict in Russia and Ukraine. An intensification
of tensions could disrupt imported gas supplies to
Poland’s heavy industry. While direct financial links
are limited, spillovers could materialize through
confidence channels, precipitating capital outflows.
External upside risks
Stronger trading partner growth. A faster-than-
expected recovery in the euro area on the back of
ECB QE and low oil prices would help lift growth in Poland, given high synchronization of
Poland’s business cycle with Germany and the euro area.
0
0.2
0.4
0.6
0.8
DEU U.S. DEU U.S.
Normal times DEU shock U.S.shock
Poland's Yield Correlations with Germany and U.S.
(Correlations of changes in 10-year gov. yields; Daily data 2013–15)
Note: Normal times defined as absolute values of daily changes in
yields below 2 standard deviations in DEU and U.S. Shock represents
observations greater than 2 standard deviations in each of these
countries.
Sources: IMF staff calculations.
0
0.2
0.4
0.6
0.8
ESP ITA PRT GRC
Global financial shock
Country-specific financial shock
Correlations with Poland Yields during Stress Times, 2013–15
(Regression-based correlations )
Correlations are based on estimates from regressions of daily changes
in Polish yields on changes in other countries' yields while controlling
for DEU yields. Global and country-specific financial shocks represent
periods of changes in yields greater than 2 standard deviations in the
U.S. and each respective country.
Sources: Haver analytics and IMF staff calculations.
0
0.2
0.4
0.6
0.8
1
Euro area Germany
2000-07 2010-14
Poland: Synchronization of Growth Rates
(Correlation coefficients of quarterly growth rates)
Sources: Haver analytics and IMF staff calculations.
REPUBLIC OF POLAND
12 INTERNATIONAL MONETARY FUND
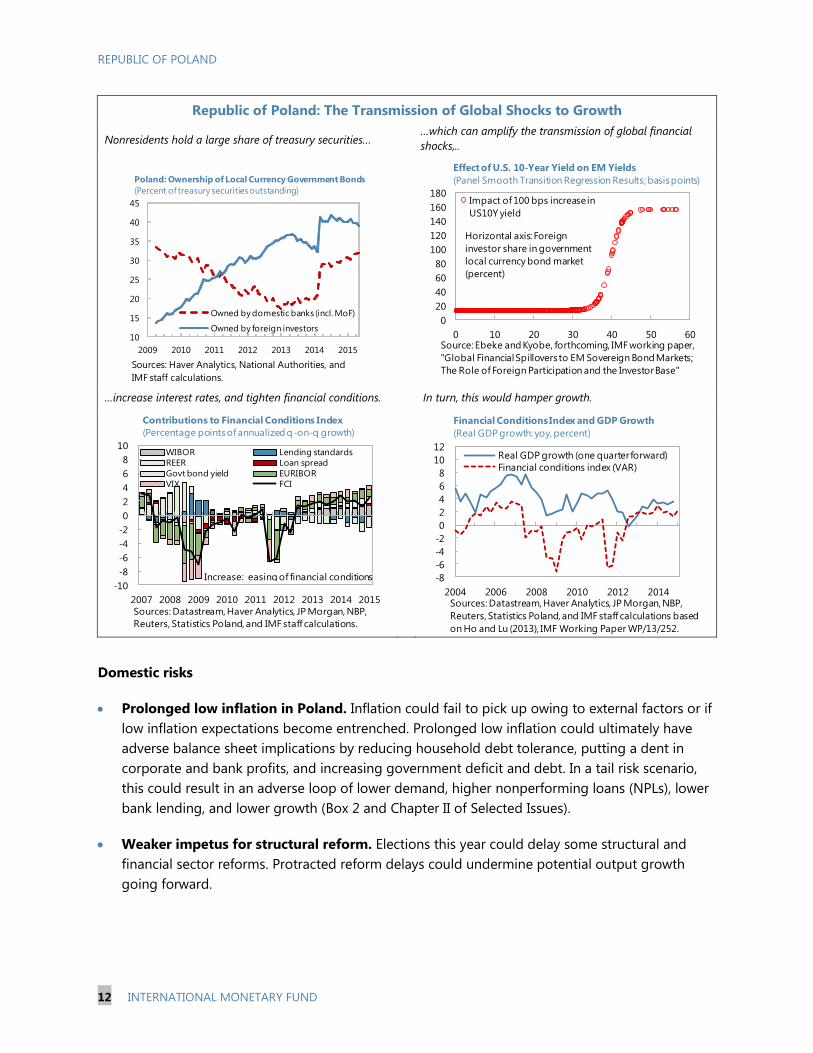
Republic of Poland: The Transmission of Global Shocks to Growth
Nonresidents hold a large share of treasury securities… …which can amplify the transmission of global financial
shocks,..
…increase interest rates, and tighten financial conditions. In turn, this would hamper growth.
Domestic risks
Prolonged low inflation in Poland. Inflation could fail to pick up owing to external factors or if
low inflation expectations become entrenched. Prolonged low inflation could ultimately have
adverse balance sheet implications by reducing household debt tolerance, putting a dent in
corporate and bank profits, and increasing government deficit and debt. In a tail risk scenario,
this could result in an adverse loop of lower demand, higher nonperforming loans (NPLs), lower
bank lending, and lower growth (Box 2 and Chapter II of Selected Issues).
Weaker impetus for structural reform. Elections this year could delay some structural and
financial sector reforms. Protracted reform delays could undermine potential output growth
going forward.
10
15
20
25
30
35
40
45
2009 2010 2011 2012 2013 2014 2015
Owned by domestic banks (incl. MoF)
Owned by foreign investors
Poland: Ownership of Local Currency Government Bonds
(Percent of treasury securities outstanding)
Sources: Haver Analytics, National Authorities, and
IMF staff calculations.
0
20
40
60
80
100
120
140
160
180
0 10 20 30 40 50 60
Impact of 100 bps increase in
US10Y yield
Effect of U.S. 10-Year Yield on EM Yields
(Panel Smooth Transition Regression Results; basis points)
Source: Ebeke and Kyobe, forthcoming, IMF working paper,
"Global Financial Spillovers to EM Sovereign Bond Markets;
The Role of Foreign Participation and the Investor Base"
Horizontal axis: Foreign
investor share in government
local currency bond market
(percent)
-10
-8
-6
-4
-2
0
2
4
6
8
10
2007 2008 2009 2010 2011 2012 2013 2014 2015
WIBOR Lending standards
REER Loan spread
Govt bond yield EURIBOR
VIX FCI
Contributions to Financial Conditions Index
(Percentage points of annualized q-on-q growth)
Sources: Datastream, Haver Analytics, JP Morgan, NBP,
Reuters, Statistics Poland, and IMF staff calculations.
Increase: easing of financial conditions -8
-6
-4
-2
0
2
4
6
8
10
12
2004 2006 2008 2010 2012 2014
Real GDP growth (one quarter forward)
Financial conditions index (VAR)
Financial Conditions Index and GDP Growth
(Real GDP growth: yoy, percent)
Sources: Datastream, Haver Analytics, JP Morgan, NBP,
Reuters, Statistics Poland, and IMF staff calculations based
on Ho and Lu (2013), IMF Working Paper WP/13/252.

REPUBLIC OF POLAND
INTERNATIONAL MONETARY FUND 13
Box 2. Republic of Poland: Balance Sheet Effects from Lowflation
Low inflation has so far had only limited economic impact in Poland. Strong economic activity on the
back of healthy domestic demand and robust credit growth suggests that lowflation has so far not fed into
the real economy. Private and public sector balance sheets are generally healthy and have weathered well
two years of below-target inflation. Household debt has increased, but remains below debt tolerance
thresholds. Public sector debt is on a declining path. Nonfinancial corporations and banks remain profitable.
However, prolonged low inflation could have negative economic repercussions. It could exacerbate
existing pockets of vulnerability, including the rising household debt burden. In a tail risk adverse scenario,
protracted lowflation could reduce household debt tolerance, put a dent in corporate and bank profits, and
increase government deficit and debt. Such a scenario could result in an adverse loop of lower household
consumption, weaker bank and corporate profits, declining investment, and lower domestic demand pulling
inflation down further (Box Figure).
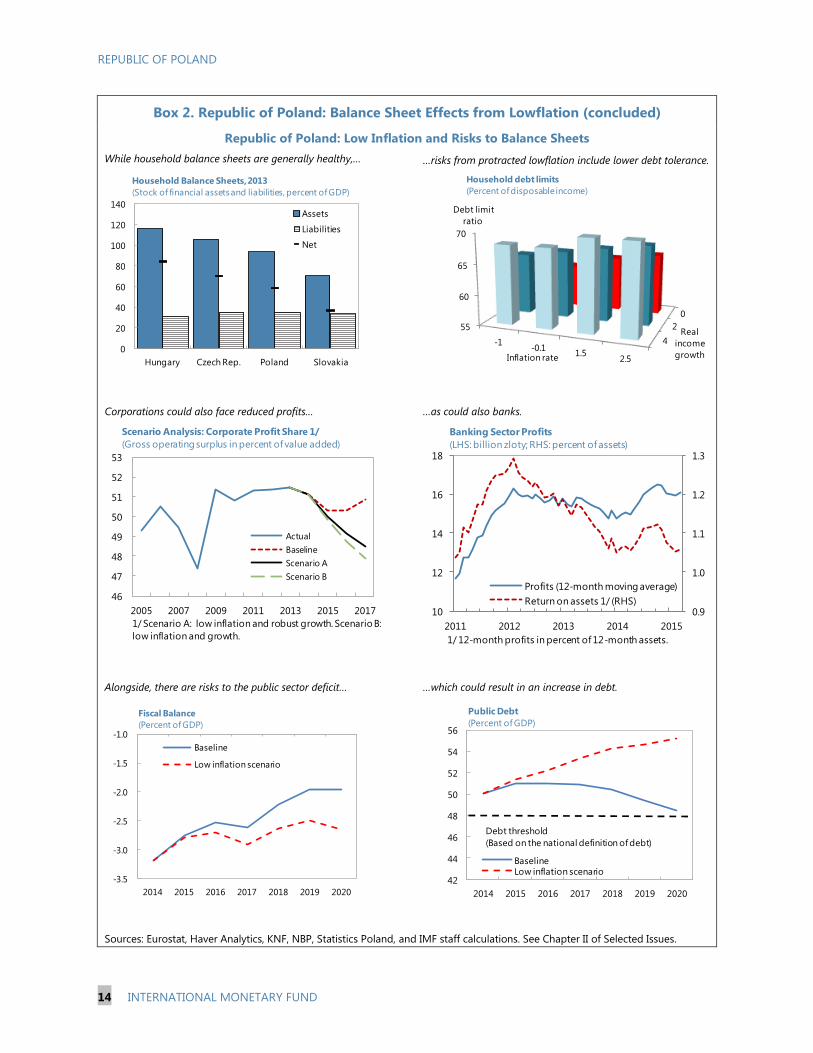
Households. In the near term, low inflation combined with continued healthy wage growth increases
disposable income, supporting private consumption. However, protracted lowflation could eventually
feed into wages and reduce households’ debt servicing capacity, ultimately resulting in lower
consumption and higher NPLs.
Nonfinancial corporations. In the short run, low inflation alongside still-sticky wages could reduce
corporate profits. In an adverse scenario of prolonged inflation and sluggish disposable income, lower
profits would induce firms to postpone investment, further reducing domestic demand.
Banks. In the near term, lower interest rates could squeeze bank interest-rate margins. In an adverse
scenario, lower demand for credit and rising NPLs would prompt banks to reduce credit supply.
Public sector. While so far deflation has had limited impact on fiscal revenue, prolonged lowflation
could reduce fiscal space and make it more difficult to achieve fiscal targets, potentially triggering
procyclical fiscal consolidation. In turn, this could further harm growth.
REPUBLIC OF POLAND
14 INTERNATIONAL MONETARY FUND
Box 2. Republic of Poland: Balance Sheet Effects from Lowflation (concluded)
Republic of Poland: Low Inflation and Risks to Balance Sheets
While household balance sheets are generally healthy,… …risks from protracted lowflation include lower debt tolerance.
Corporations could also face reduced profits… …as could also banks.
Alongside, there are risks to the public sector deficit… …which could result in an increase in debt.
Sources: Eurostat, Haver Analytics, KNF, NBP, Statistics Poland, and IMF staff calculations. See Chapter II of Selected Issues.
42
44
46
48
50
52
54
56
2014 2015 2016 2017 2018 2019 2020
BaselineLow inflation scenario
Public Debt
(Percent of GDP)
Debt threshold
(Based on the national definition of debt)
0
20
40
60
80
100
120
140
Hungary Czech Rep. Poland Slovakia
Assets
Liabilities
Net
Household Balance Sheets, 2013
(Stock of financial assets and liabilities, percent of GDP)
4
2
0
55
60
65
70
-1-0.1
1.52.5
Real
income
growth
Debt limit
ratio
Inflation rate
Household debt limits
(Percent of disposable income)
0.9
1.0
1.1
1.2
1.3
2011 2012 2013 2014 2015
10
12
14
16
18
Profits (12-month moving average)
Return on assets 1/ (RHS)
Banking Sector Profits
(LHS: billion zloty; RHS: percent of assets)
1/ 12-month profits in percent of 12-month assets.
46
47
48
49
50
51
52
53
2005 2007 2009 2011 2013 2015 2017
Actual
Baseline
Scenario A
Scenario B
Scenario Analysis: Corporate Profit Share 1/
(Gross operating surplus in percent of value added)
1/ Scenario A: low inflation and robust growth. Scenario B:
low inflation and growth.
-3.5
-3.0
-2.5
-2.0
-1.5
-1.0
2014 2015 2016 2017 2018 2019 2020
Baseline
Low inflation scenario
Fiscal Balance
(Percent of GDP)
REPUBLIC OF POLAND
INTERNATIONAL MONETARY FUND 15
14. Appropriate policy response will depend on the nature of the risks:
In the event of severe external pressure, policies should focus on preserving financial
stability. The exchange rate should be allowed to play its cushioning role, while being mindful
of the impact on FX denominated debt. Fiscal policy should allow automatic stabilizers to fully
operate around the consolidation measures. In the event of significant capital outflows,
Narodowy Bank Polski (NBP) should stand ready to provide liquidity, including in FX, to the
banking sector as needed. In the event of excessive capital inflows and zloty appreciation,
monetary policy should be eased and macroprudential policy should be tightened to manage
risks to the financial system, arising from asset price bubbles and excessive credit growth.
While prolonged lowflation is still a relatively low risk, its potential impact nonetheless
underscores the importance of closely monitoring developments. If inflation fails to pick up,
the NBP has ample policy space to cut rates further to avoid low inflation becoming entrenched
in expectations. That said, the potential impact of lowflation on bank profits should be
internalized in the authorities’ routine stress tests. Fiscal risks from lowflation should be
addressed by using conservative inflation projections in budget forecasts and identifying
contingency measures to respond to potential inflation surprises.
Authorities’ views
15. The authorities broadly shared staff’s views on economic outlook and risks. They
agreed that domestic demand will remain the primary driver of growth and that inflation will
gradually converge to target over the medium term, although the Ministry of Finance (MoF) thought
that inflation would pick up somewhat faster than in staff’s baseline forecast. On risks, the
authorities noted that Poland is well-positioned to manage excessive capital inflows or outflows
given its flexible exchange rate, stable and diversified investor base, and strong fundamentals. Risks
are further mitigated by a prudent debt management strategy, proactive pre-financing of this year’s
government external financing needs, and broadly adequate reserves. Contingency plans are in
place to ensure timely response to external shocks, including through the use of reserves to curb
excessive exchange-rate volatility and via emergency liquidity provision in zloty and FX to the
banking system as needed.
REPUBLIC OF POLAND
16 INTERNATIONAL MONETARY FUND
POLICY DISCUSSIONS: ADVANCING REFORMS TO
PROMOTE STABILITY AND INCOME CONVERGENCE
16. Maintaining reform momentum is key to ensuring a durable economic recovery.
Policies should focus on safeguarding economic stability and advancing structural reforms to
encourage continued economic convergence (Table 4).
A. Maintaining Accommodative Monetary Stance to Guide Inflation to
Target
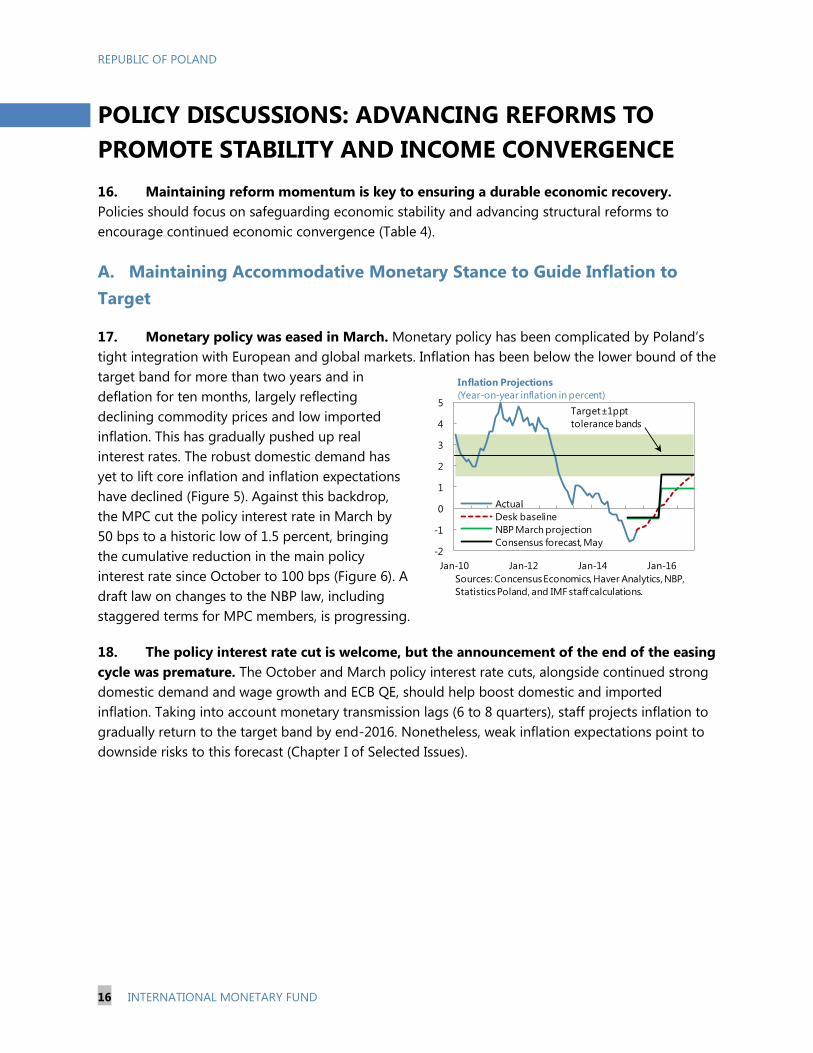
17. Monetary policy was eased in March. Monetary policy has been complicated by Poland’s
tight integration with European and global markets. Inflation has been below the lower bound of the
target band for more than two years and in
deflation for ten months, largely reflecting
declining commodity prices and low imported
inflation. This has gradually pushed up real
interest rates. The robust domestic demand has
yet to lift core inflation and inflation expectations
have declined (Figure 5). Against this backdrop,
the MPC cut the policy interest rate in March by
50 bps to a historic low of 1.5 percent, bringing
the cumulative reduction in the main policy
interest rate since October to 100 bps (Figure 6). A
draft law on changes to the NBP law, including
staggered terms for MPC members, is progressing.
18. The policy interest rate cut is welcome, but the announcement of the end of the easing
cycle was premature. The October and March policy interest rate cuts, alongside continued strong
domestic demand and wage growth and ECB QE, should help boost domestic and imported
inflation. Taking into account monetary transmission lags (6 to 8 quarters), staff projects inflation to
gradually return to the target band by end-2016. Nonetheless, weak inflation expectations point to
downside risks to this forecast (Chapter I of Selected Issues).
-2
-1
0
1
2
3
4
5
Jan-10 Jan-12 Jan-14 Jan-16
Actual
Desk baseline
NBP March projection
Consensus forecast, May
Inflation Projections
(Year-on-year inflation in percent)
Sources: Concensus Economics, Haver Analytics, NBP,
Statistics Poland, and IMF staff calculations.
Target±1ppt
tolerance bands
REPUBLIC OF POLAND
INTERNATIONAL MONETARY FUND 17
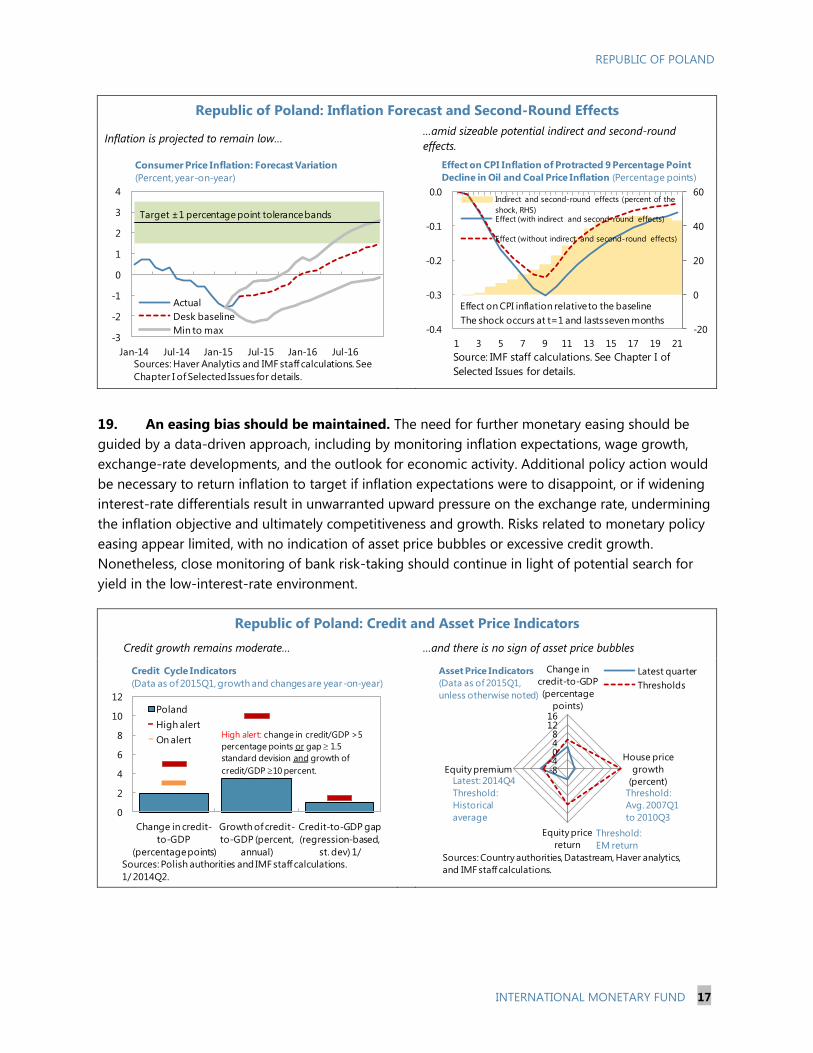
Republic of Poland: Inflation Forecast and Second-Round Effects
Inflation is projected to remain low… …amid sizeable potential indirect and second-round
effects.
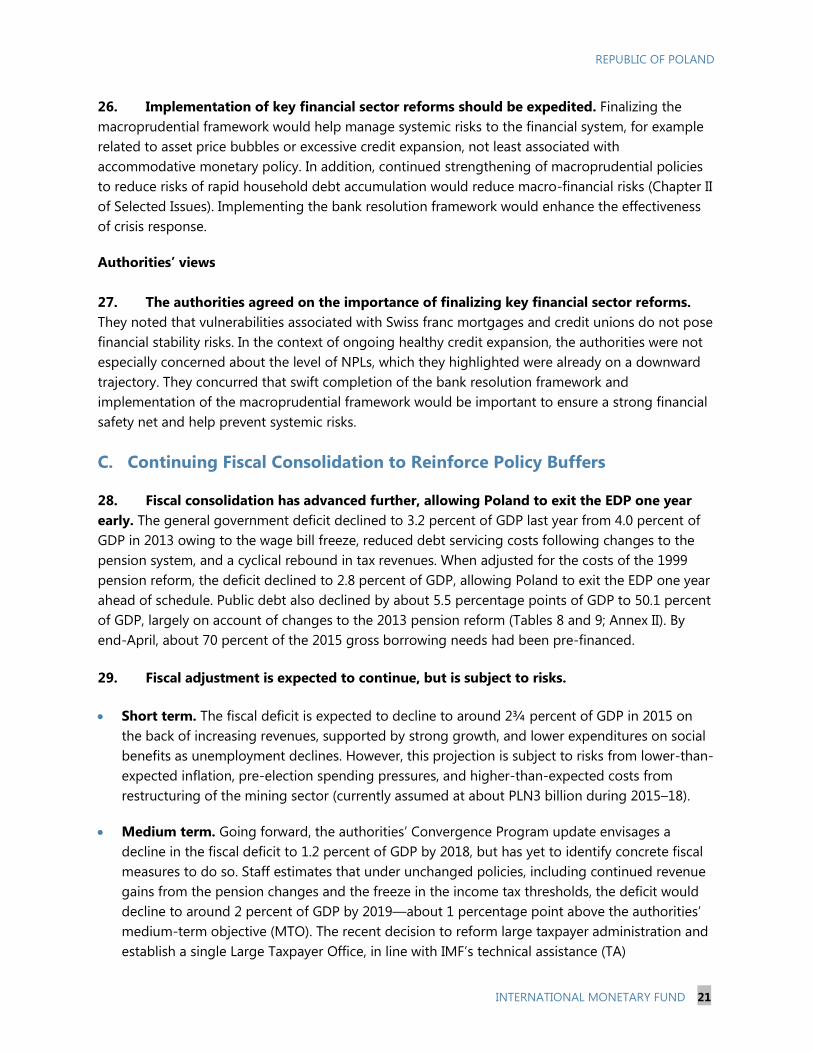
19. An easing bias should be maintained. The need for further monetary easing should be
guided by a data-driven approach, including by monitoring inflation expectations, wage growth,
exchange-rate developments, and the outlook for economic activity. Additional policy action would
be necessary to return inflation to target if inflation expectations were to disappoint, or if widening
interest-rate differentials result in unwarranted upward pressure on the exchange rate, undermining
the inflation objective and ultimately competitiveness and growth. Risks related to monetary policy
easing appear limited, with no indication of asset price bubbles or excessive credit growth.
Nonetheless, close monitoring of bank risk-taking should continue in light of potential search for
yield in the low-interest-rate environment.
Republic of Poland: Credit and Asset Price Indicators
Credit growth remains moderate… …and there is no sign of asset price bubbles
-3
-2
-1
0
1
2
3
4
Jan-14 Jul-14 Jan-15 Jul-15 Jan-16 Jul-16
Actual
Desk baseline
Min to max
Consumer Price Inflation: Forecast Variation
(Percent, year-on-year)
Sources: Haver Analytics and IMF staff calculations. See
Chapter I of Selected Issues for details.
Target ±1 percentagepoint tolerance bands
-20
0
20
40
60
-0.4
-0.3
-0.2
-0.1
0.0
1 3 5 7 9 11 13 15 17 19 21
Indirect and second-round effects (percent of the
shock, RHS)Effect (with indirect and second-round effects)
Effect (without indirect and second-round effects)
Effect on CPI Inflation of Protracted 9 Percentage Point
Decline in Oil and Coal Price Inflation (Percentage points)
Source: IMF staff calculations. See Chapter I of
Selected Issues for details.
Effect on CPI inflation relative to the baseline
The shock occurs at t=1 and lasts seven months
0
2
4
6
8
10
12
Change in credit-
to-GDP
(percentage points)
Growth of credit-
to-GDP (percent,
annual)
Credit-to-GDP gap
(regression-based,
st. dev) 1/
Poland
High alert
On alert
Credit Cycle Indicators
(Data as of 2015Q1, growth and changes are year-on-year)
Sources: Polish authorities and IMF staff calculations.
1/ 2014Q2.
High alert: change in credit/GDP >5
percentage points or gap 1.5
standard devision and growth of
credit/GDP 10 percent. -8-4048
1216
Change in
credit-to-GDP
(percentage
points)
House price
growth
(percent)
Equity price
return
Equity premium
Latest quarter
Thresholds
Sources: Country authorities,Datastream, Haver analytics,
and IMF staff calculations.
Asset Price Indicators
(Data as of 2015Q1,
unless otherwise noted)
Threshold:
EM return
Threshold:
Avg. 2007Q1
to 2010Q3
Latest: 2014Q4
Threshold:
Historical
average
REPUBLIC OF POLAND
18 INTERNATIONAL MONETARY FUND
20. Moderate reserve accumulation would be prudent. Reserves increased by 7 percent in
euro terms1 in 2014 and are broadly adequate at about 114 percent of the IMF’s modified ARA
metric. In light of downside external risks, continued moderate reserve accumulation would help
safeguard against external shocks.
Authorities’ views
21. The authorities broadly agreed with staff’s assessment. The authorities recognized the
downside risks to the inflation forecast. However, they stressed that, so far, low inflation had
supported domestic demand and growth and did not appear to have had negative effects on the
real economy. Some members of the MPC noted that the March announcement of the end to the
easing cycle would not preclude further adjustment should growth significantly underperform. At
the same time, the announcement would help maintain financial market stability by limiting
uncertainty about monetary policy.
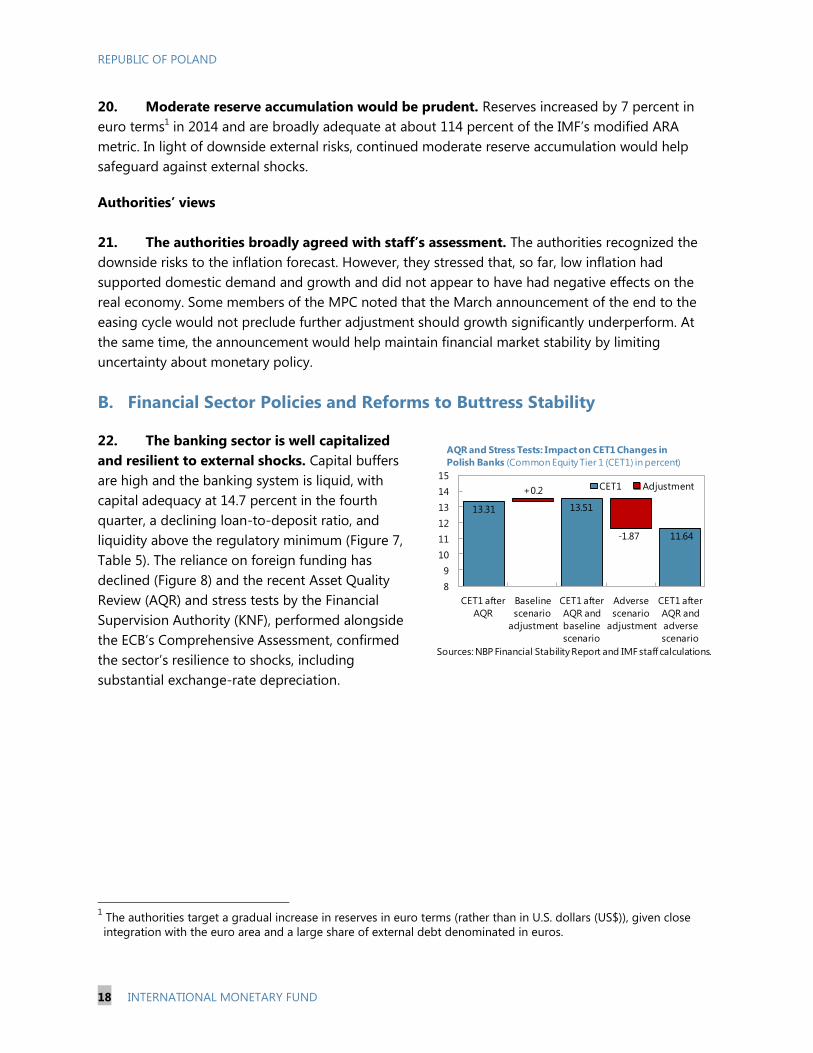
B. Financial Sector Policies and Reforms to Buttress Stability
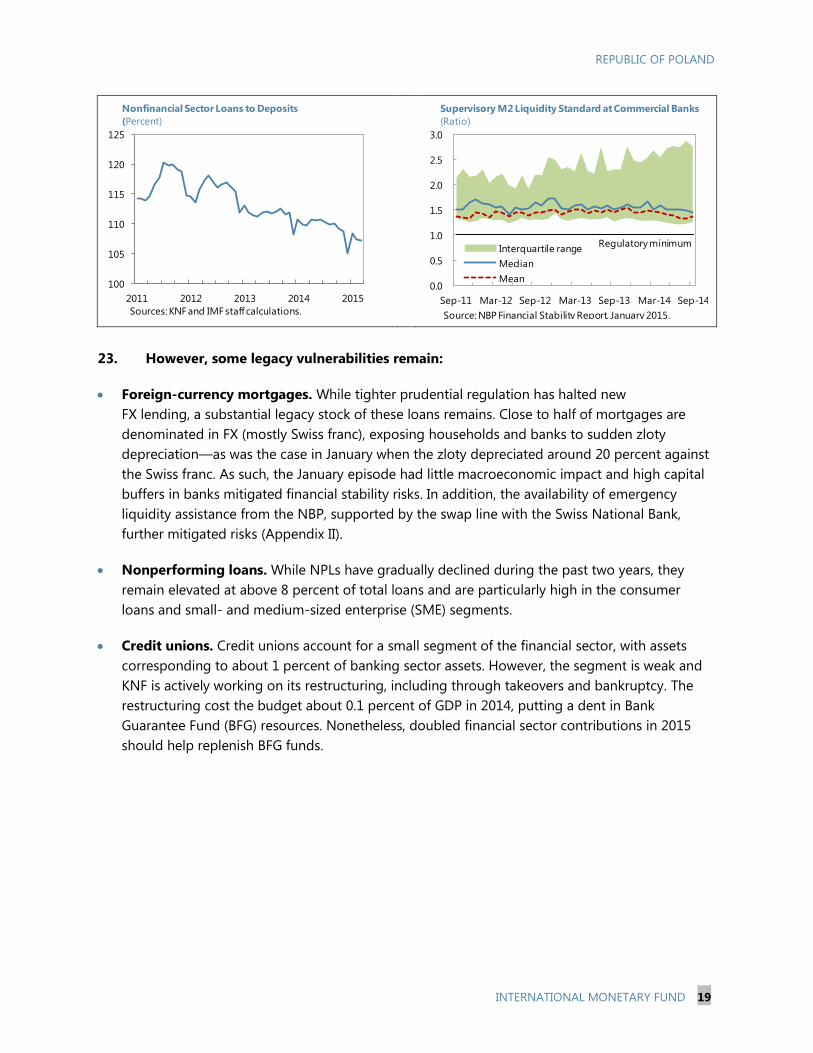
22. The banking sector is well capitalized
and resilient to external shocks. Capital buffers
are high and the banking system is liquid, with
capital adequacy at 14.7 percent in the fourth
quarter, a declining loan-to-deposit ratio, and
liquidity above the regulatory minimum (Figure 7,
Table 5). The reliance on foreign funding has
declined (Figure 8) and the recent Asset Quality
Review (AQR) and stress tests by the Financial
Supervision Authority (KNF), performed alongside
the ECB’s Comprehensive Assessment, confirmed
the sector’s resilience to shocks, including
substantial exchange-rate depreciation.
1 The authorities target a gradual increase in reserves in euro terms (rather than in U.S. dollars (US$)), given close
integration with the euro area and a large share of external debt denominated in euros.
8
9
10
11
12
13
14
15
CET1 after
AQR
Baseline
scenario
adjustment
CET1 after
AQR and
baseline
scenario
Adverse
scenario
adjustment
CET1 after
AQR and
adverse
scenario
CET1 Adjustment
AQR and Stress Tests: Impact on CET1 Changes in
Polish Banks (Common Equity Tier 1 (CET1) in percent)
Sources: NBP Financial Stability Report and IMF staff calculations.
+0.2
-1.87
13.31
11.64
13.51
REPUBLIC OF POLAND
INTERNATIONAL MONETARY FUND 19
23. However, some legacy vulnerabilities remain:
Foreign-currency mortgages. While tighter prudential regulation has halted new
FX lending, a substantial legacy stock of these loans remains. Close to half of mortgages are
denominated in FX (mostly Swiss franc), exposing households and banks to sudden zloty
depreciation—as was the case in January when the zloty depreciated around 20 percent against
the Swiss franc. As such, the January episode had little macroeconomic impact and high capital
buffers in banks mitigated financial stability risks. In addition, the availability of emergency
liquidity assistance from the NBP, supported by the swap line with the Swiss National Bank,
further mitigated risks (Appendix II).
Nonperforming loans. While NPLs have gradually declined during the past two years, they
remain elevated at above 8 percent of total loans and are particularly high in the consumer
loans and small- and medium-sized enterprise (SME) segments.
Credit unions. Credit unions account for a small segment of the financial sector, with assets
corresponding to about 1 percent of banking sector assets. However, the segment is weak and
KNF is actively working on its restructuring, including through takeovers and bankruptcy. The
restructuring cost the budget about 0.1 percent of GDP in 2014, putting a dent in Bank
Guarantee Fund (BFG) resources. Nonetheless, doubled financial sector contributions in 2015
should help replenish BFG funds.
2011 2012 2013 2014 2015
100
105
110
115
120
125
Nonfinancial Sector Loans to Deposits
(Percent)
Sources: KNF and IMF staff calculations.
0.0
0.5
1.0
1.5
2.0
2.5
3.0
Sep-11 Mar-12 Sep-12 Mar-13 Sep-13 Mar-14 Sep-14
Interquartile range
Median
Mean
Supervisory M2 Liquidity Standard at Commercial Banks
(Ratio)
Source: NBP Financial Stability Report, January 2015.
Regulatory minimum

REPUBLIC OF POLAND
20 INTERNATIONAL MONETARY FUND
Republic of Poland: Credit Union Capital and Deposits
Credit unions are heavily under-capitalized… …with the potential for eroding BFG resources.
24. Work to strengthen the financial safety net and supervision has continued, albeit with
delays. Progress has been made in implementing the 2013 Financial Sector Assessment Program
(FSAP) recommendations (Table 6). A draft law empowering the Financial Stability Committee to
carry out macroprudential oversight—allowing early detection and prevention of systemic risk—is
moving forward. However, preparation of legislation on the bank resolution framework that would
also cover credit unions has been delayed by legal challenges related to the role of the judiciary in
the resolution process. Elections this year risk delaying the adoption of final legislation.
25. Addressing legacy vulnerabilities will buttress financial stability and promote
continued healthy credit expansion.
Foreign-currency mortgages. Given limited macroeconomic or financial stability concerns, staff
supported the authorities’ approach of case-by-case restructuring of distressed Swiss franc
denominated mortgages following the recent Swiss franc appreciation. Implementing the
Financial Stability Committee’s recommendation for banks to pass on the negative Swiss franc
LIBOR rates to customers and not require additional collateral would allow burden sharing
between banks and mortgage holders.
Nonperforming loans. Changes in the consumer bankruptcy law have shortened the maximum
period to repay debt. A new bankruptcy and insolvency law, which eases restructuring and
insolvency procedures to encourage restructuring (instead of liquidation) of viable firms has
been finalized and is expected to take effect on January 1, 2016. These measures should help
lower the level of NPLs.
Credit unions. Staff supported the authorities’ ongoing work to restructure the credit union
segment.
0
2
4
6
8
10
12
14
16
18
20
2014 2015
Without rehabilitation program
Under rehabilitation program
BFG funds
Source:s KNF, BFG, and IMF staff calculations.
1/ Ex-ante guarantee funds in BFG; 2015 includes new
contributions but excludes valuation changes.
Credit Union Deposits and BFG Funds 1/
(PLN billion, beginning of period)
(estimate)
-8
-6
-4
-2
0
2
4
6
0.0
0.5
1.0
1.5
2.0
2.5
3.0
2013Q3 2013Q4 2014Q1 2014Q2 2014Q3 2014Q4
Funding gap reported by SKOKs (LHS)
KNF corrections (LHS)
CAR reported by SKOKs (RHS)
CAR adjusted for KNF corrections (RHS)
Sources: NBP, KNF, and IMF staff calculations.
1/ Required capital adequacy for credit unions (SKOKs):
5 percent; Funding gap: capital needed to reach this ratio.
Credit Union (SKOK) Funding Gap and Capital Adequcy 1/
(LHS: PLN billion; RHS: percent)
REPUBLIC OF POLAND
INTERNATIONAL MONETARY FUND 21
26. Implementation of key financial sector reforms should be expedited. Finalizing the
macroprudential framework would help manage systemic risks to the financial system, for example
related to asset price bubbles or excessive credit expansion, not least associated with
accommodative monetary policy. In addition, continued strengthening of macroprudential policies
to reduce risks of rapid household debt accumulation would reduce macro-financial risks (Chapter II
of Selected Issues). Implementing the bank resolution framework would enhance the effectiveness
of crisis response.
Authorities’ views
27. The authorities agreed on the importance of finalizing key financial sector reforms.
They noted that vulnerabilities associated with Swiss franc mortgages and credit unions do not pose
financial stability risks. In the context of ongoing healthy credit expansion, the authorities were not
especially concerned about the level of NPLs, which they highlighted were already on a downward
trajectory. They concurred that swift completion of the bank resolution framework and
implementation of the macroprudential framework would be important to ensure a strong financial
safety net and help prevent systemic risks.
C. Continuing Fiscal Consolidation to Reinforce Policy Buffers
28. Fiscal consolidation has advanced further, allowing Poland to exit the EDP one year
early. The general government deficit declined to 3.2 percent of GDP last year from 4.0 percent of
GDP in 2013 owing to the wage bill freeze, reduced debt servicing costs following changes to the
pension system, and a cyclical rebound in tax revenues. When adjusted for the costs of the 1999
pension reform, the deficit declined to 2.8 percent of GDP, allowing Poland to exit the EDP one year
ahead of schedule. Public debt also declined by about 5.5 percentage points of GDP to 50.1 percent
of GDP, largely on account of changes to the 2013 pension reform (Tables 8 and 9; Annex II). By
end-April, about 70 percent of the 2015 gross borrowing needs had been pre-financed.
29. Fiscal adjustment is expected to continue, but is subject to risks.
Short term. The fiscal deficit is expected to decline to around 2¾ percent of GDP in 2015 on
the back of increasing revenues, supported by strong growth, and lower expenditures on social
benefits as unemployment declines. However, this projection is subject to risks from lower-than-
expected inflation, pre-election spending pressures, and higher-than-expected costs from
restructuring of the mining sector (currently assumed at about PLN3 billion during 2015–18).
Medium term. Going forward, the authorities’ Convergence Program update envisages a
decline in the fiscal deficit to 1.2 percent of GDP by 2018, but has yet to identify concrete fiscal
measures to do so. Staff estimates that under unchanged policies, including continued revenue
gains from the pension changes and the freeze in the income tax thresholds, the deficit would
decline to around 2 percent of GDP by 2019—about 1 percentage point above the authorities’
medium-term objective (MTO). The recent decision to reform large taxpayer administration and
establish a single Large Taxpayer Office, in line with IMF’s technical assistance (TA)

REPUBLIC OF POLAND
22 INTERNATIONAL MONETARY FUND
recommendations, should help enhance domestic revenue mobilization and limit fiscal risks over
the medium term.
Poland: 2015 Convergence Program Update
30. Staff supported the authorities’ fiscal plans but stressed the need to underpin them
with specific measures. The planned fiscal consolidation should create sufficient policy space to
allow for timely and effective response to shocks, while putting public debt on a robust downward
trajectory.
Short term. The 2015 fiscal stance is appropriate, but contingency planning is needed to
mitigate fiscal risks. The planned gradual deficit reduction appropriately addresses the need to
put public debt on a robust downward path, while being mindful of not undermining growth.
The authorities should identify contingency measures in case risks materialize, including from
pre-election spending pressures and lower-than-expected inflation.
Medium term. Reaching the MTO would require additional effort. The authorities’ MTO of
1 percent of GDP structural deficit by 2019 remains an appropriate fiscal anchor, which would
further bolster debt sustainability. However, additional measures of about 1 percent of GDP
would be needed to reach this objective. Closing a third of the VAT compliance gap could
increase revenue by about 0.6 percent of GDP in the medium term (Figure 9). To this end, recent
IMF TA has recommended developing industry-based compliance projects and implementing
strategies to fight the grey economy. A follow-up TA is planned to support the improvement of
VAT administration, including through a VAT gap analysis. Consideration could be given to
reducing the number of VAT rates to improve compliance and lower the burden on tax
administration. Preventing the 2011 VAT increase from expiring in 2017 would help sustain
revenues until tax administration reforms are finalized. On the expenditure side, identifying
Percent of GDP 2014 2015 2016 2017 2018
Total revenues 38.6 38.8 38.5 37.9 37.8
Taxes 19.7 19.8 19.9 19.5 19.4
Indirect taxes 12.7 12.8 12.9 12.4 12.3
Direct taxes 7.0 7.0 7.1 7.1 7.1
Social contributions 13.2 13.5 13.4 13.2 13.1
Other revenues 5.7 5.5 5.2 5.2 5.3
Total expenditures 41.8 41.5 40.8 39.8 39.0
Compensation of employees 10.2 10.0 9.7 9.4 9.0
Intermediate consumption 6.0 6.0 5.9 5.8 5.7
Social benefits 16.3 16.2 16.1 15.8 15.4
Capital investments 4.4 4.5 4.5 4.3 4.2
Other expenditures 4.9 4.8 4.6 4.5 4.7
Net lending (+) / net borrowing (-) -3.2 -2.7 -2.3 -1.8 -1.2
Structural balance -2.7 -2.6 -2.2 -1.8 -1.2
Source: Ministry of Finance.

REPUBLIC OF POLAND
INTERNATIONAL MONETARY FUND 23
measures to support implementation of the stabilizing expenditure rule, including by drawing
on the ongoing review of selected spending categories, would strengthen its credibility.
Over the longer run, additional reforms would lessen the burden of aging-related costs.
Recent estimates by the IMF suggest that health expenditures will rise by some 1.7 percentage
points of GDP by 2030.2 In this context, improving expenditure efficiency would help generate
fiscal space to respond to long-term aging-related fiscal pressures (Appendix III). Promoting
voluntary savings through the third pillar would help reduce risks of old-age poverty, thereby
limiting contingent liabilities. Addressing imbalances in the special occupational pension
schemes remains essential.
Authorities’ views
31. The authorities broadly shared staff’s assessment and underscored the existence of
budgetary safeguards to manage fiscal risks. They noted that short-term fiscal risks, including
from lower-than-expected inflation, are manageable given upside risks to the growth forecast
underpinning the budget. Regarding medium-term fiscal adjustment, they were confident that strict
enforcement of the stabilizing expenditure
rule would support the achievement of the
MTO. They also noted that the large share
of discretionary expenditures in the budget
(estimated by staff at around one-third of
total expenditures) affords sufficient
flexibility to cut expenditure over time. On
the revenue side, the authorities agreed
with the need to reduce the VAT revenue
gap and were appreciative of the ongoing
IMF TA. They noted that the new tax code
recently proposed by the government aims
to further strengthen tax compliance. They
also acknowledged the need to reform
special pension schemes for farmers and
miners.
2 IMF, 2015, Fiscal Monitor: Now Is the Time. Fiscal Policies for Sustainable Growth, April 2015, International Monetary
Fund.
Social
benefits, 16.3
Wage bill,
10.2
Interest, 2.0
Consumption,
6.0
Investment,
excl. defense,
4.0
Other
expenditures,
1.2
Subsidies, 0.6
0
5
10
15
20
25
30
Non-discretionary expenditures Discretionary expenditures
Poland: Budget Flexibility
(Percent of GDP)
Sources: Ministry of Finance, and IMF staff estimates.
REPUBLIC OF POLAND
24 INTERNATIONAL MONETARY FUND
D. Structural Reforms to Boost Productivity and Facilitate Convergence
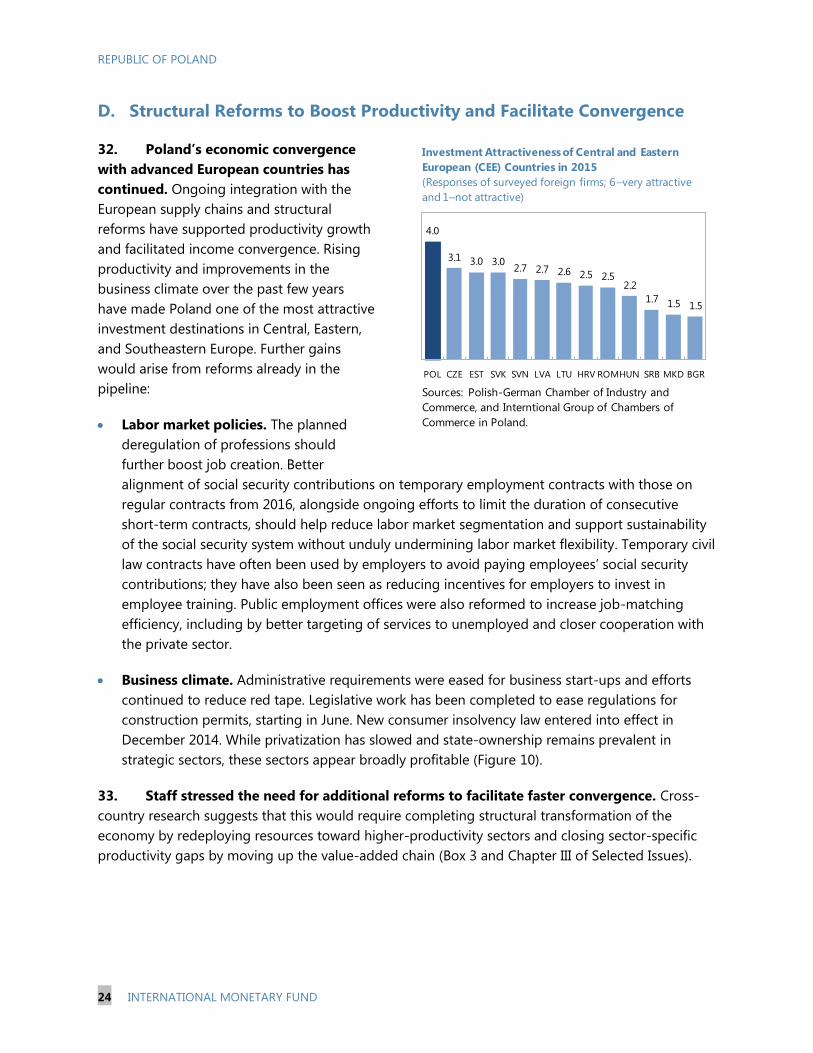
32. Poland’s economic convergence
with advanced European countries has
continued. Ongoing integration with the
European supply chains and structural
reforms have supported productivity growth
and facilitated income convergence. Rising
productivity and improvements in the
business climate over the past few years
have made Poland one of the most attractive
investment destinations in Central, Eastern,
and Southeastern Europe. Further gains
would arise from reforms already in the
pipeline:
Labor market policies. The planned
deregulation of professions should
further boost job creation. Better
alignment of social security contributions on temporary employment contracts with those on
regular contracts from 2016, alongside ongoing efforts to limit the duration of consecutive
short-term contracts, should help reduce labor market segmentation and support sustainability
of the social security system without unduly undermining labor market flexibility. Temporary civil
law contracts have often been used by employers to avoid paying employees’ social security
contributions; they have also been seen as reducing incentives for employers to invest in
employee training. Public employment offices were also reformed to increase job-matching
efficiency, including by better targeting of services to unemployed and closer cooperation with
the private sector.
Business climate. Administrative requirements were eased for business start-ups and efforts
continued to reduce red tape. Legislative work has been completed to ease regulations for
construction permits, starting in June. New consumer insolvency law entered into effect in
December 2014. While privatization has slowed and state-ownership remains prevalent in
strategic sectors, these sectors appear broadly profitable (Figure 10).
33. Staff stressed the need for additional reforms to facilitate faster convergence. Cross-
country research suggests that this would require completing structural transformation of the
economy by redeploying resources toward higher-productivity sectors and closing sector-specific
productivity gaps by moving up the value-added chain (Box 3 and Chapter III of Selected Issues).
4.0
3.1 3.0 3.02.7 2.7 2.6 2.5 2.5
2.2
1.7 1.5 1.5
POL CZE EST SVK SVN LVA LTU HRV ROMHUN SRB MKD BGR
Investment Attractiveness of Central and Eastern
European (CEE) Countries in 2015
(Responses of surveyed foreign firms; 6–very attractive
and 1–not attractive)
Sources: Polish-German Chamber of Industry and
Commerce, and Interntional Group of Chambers of
Commerce in Poland.

REPUBLIC OF POLAND
INTERNATIONAL MONETARY FUND 25
Box 3. Raising Productivity Growth in Poland: The Role of Structural Transformation
Countries that manage to sustain productivity gains enjoy
strong and durable growth. Increases in aggregate labor
productivity can originate from two main sources: sector-specific
productivity gains and reallocation of labor from low-
productivity sectors (e.g., agriculture) toward modern economic
activities—a process known as structural transformation.
Poland has benefited from both sector-specific productivity
gains and structural transformation. Over the past decade,
within-sector productivity gains have accounted for the bulk of
aggregate productivity growth, with the remaining one-fifth
coming from structural transformation. The manufacturing
sector, which has benefited from integration with Europe’s
supply chains, has been one of the main sources of increased
productivity at the sectoral level.
Sustaining productivity improvements would require
completing structural transformation, while
boosting within-sector productivity.
Continued structural transformation would
require facilitating labor mobility across sectors
and promoting economic diversification. Cross-
country econometric results show that securing
large greenfield investments, improving the
business climate, addressing labor market duality,
and tackling long-term unemployment are key
factors associated with structural change.
Further within-sector productivity
enhancement entails moving up the value-added
chain. Poland’s integration with the German
supply chain has resulted in welcome technology
transfers and has increased sophistication of
domestic value-added embodied in exports. Further advancement along the value-added chain would
require encouraging innovation and increasing investment in research and development—an area
where Poland still lags behind its peers. Better targeted vocational training would facilitate the
absorption of new technologies.
Labor market policies. Labor mobility to higher-productivity sectors can be facilitated by
further streamlining the list of regulated professions and better targeting education and training
to employer needs—an issue also highlighted by employer groups. Further development of the
rental market is needed to ease the geographical mobility of labor. Reducing labor market
segmentation would encourage investment in on-the-job training. Encouraging greater female
labor force participation is essential for maintaining employment levels in the face of adverse
demographic trends.
Business climate. Continued business climate improvements to encourage greenfield
investment, including by strengthening contract enforcement, would boost competitiveness.
2.4
0.7
2.5
0.7 -0.1
2.1
0.5
2.1
0.5
0.0
-1
0
1
2
3
4
5
Within Structural Within Structural Dynamic
realloc.
Method 1 Method 2
2001-07
2008-13
Poland: Decomposing aggregate labor productivity
(Average growth over seven years; in percent)
Source: IMF staff estimates.
0
20
40
60
80
100
Productivity in Poland Convergence to EU15
employment structure
Sectoral productivity
convergence
Productivity in EU15
Agriculture
Construction
Public sector
Industry
Market services
Note: Convergence to EU15 employment structure assumes adopting EU15 employment structure in
Poland with sectoral productivity levelsunchanged. Sectoral productivity convergence assumes
increase of sectoral productivities to EU15 levels with employment structure unchanged.
Illustrative scenarios of productivity convergence
(Productivity decomposition; percent of productivity in EU15)
Sources: Eurostat; IMF staff calculations.

REPUBLIC OF POLAND
26 INTERNATIONAL MONETARY FUND
Advancing along the value-added chain will require efforts to support innovation and research
and development.
Authorities’ views
34. The authorities acknowledged the importance of structural reform for growth and
income convergence and underscored several ongoing initiatives. They highlighted recent
measures to reduce labor market segmentation including by better aligning civil law and temporary
contracts with regular contracts. Efforts continue to increase female labor force participation,
including via affordable child care, subsidized telework, and programs aimed at reintegrating
women returning from maternity leave into the workforce. The authorities observed that the new
housing rental program financed by the Polish development bank BGK would help develop the
rental market and facilitate regional labor mobility. They noted ongoing efforts to promote
innovation via increased allocation of EU funds to innovation programs, including for SMEs and via
greater research and education synergies between universities and the private sector.
STAFF APPRAISAL
35. The economy has recovered from the 2012–13 slowdown, and the outlook is for
continued robust growth. Growth accelerated in the first quarter of this year on the back of strong
domestic demand, supported by improving labor market and financial conditions. Nonetheless,
deflation persists amid low commodity prices and weak imported inflation. Economic expansion is
expected to continue, with growth projected at around 3½ percent in 2015 and over the medium
term. This should help gradually return inflation to the target band by end-2016.
36. Risks have somewhat moderated, but remain elevated. On the external side, an abrupt
surge in global financial market volatility could propagate via the substantial foreign participation in
the government bond market and in the banking system. Continued geopolitical tensions could also
weigh on confidence. Nonetheless, these risks are mitigated by Poland’s stable and geographically
diversified investor base and declining reliance on foreign bank funding. Domestically, inflation
could fail to pick up owing to external factors or if low inflation expectations become entrenched.
Prolonged low inflation could ultimately squeeze profit margins with potential negative
repercussions for investment, employment, and growth. On the upside, a stronger-than-expected
recovery in the euro area and low oil prices could further lift growth in Poland.
37. Policies should continue to focus on preserving stability and supporting income
convergence. The economy has weathered well several bouts of market turbulence, benefitting
from very strong economic fundamentals and policies and the insurance provided by the FCL
arrangement with the IMF. Going forward, it will be important to continue building policy buffers to
enhance resilience to shocks and implementing structural reforms to lift income standards further.
38. Additional monetary policy easing could be needed. The March policy interest rate cut is
welcome and, alongside quantitative easing by the ECB, should help lift inflation and limit the risk of
prolonged low inflation. Additional policy interest rate cuts could be needed if inflation expectations
REPUBLIC OF POLAND
INTERNATIONAL MONETARY FUND 27
continue to disappoint, or if persistent zloty appreciation jeopardizes the inflation objective.
Moderate reserve accumulation would be prudent in light of downside external risks.
39. Financial sector performance is strong but key reforms should be completed. The well-
capitalized, liquid, and profitable banking system has remained resilient to shocks. Nonetheless,
prompt adoption of the bank resolution framework is essential for a strong and effective financial
safety net. Implementing a comprehensive macroprudential framework will help ensure early
detection and prevention of systemic risks. Restructuring of the weak but non-systemic credit union
segment should continue.
40. Gradual fiscal adjustment should continue. The authorities’ strong consolidation efforts in
recent years have allowed Poland to exit the EDP one year early—a welcome achievement. The fiscal
deficit is expected to decline further to around 2¾ percent of GDP in 2015. The medium-term
objective of 1 percent of GDP structural deficit remains an appropriate fiscal anchor to bolster fiscal
sustainability and rebuild policy space. Reaching this target would require additional measures of
about 1 percent of GDP. Identifying specific expenditure savings to support implementation of the
fiscal rule and reducing the large VAT revenue gap would be important measures in this regard.
41. Structural reforms would boost productivity and facilitate income convergence.
Reform efforts should continue focusing on moving up the value-added chain and redeploying
resources toward higher-productivity sectors. Promoting innovation, encouraging greenfield
investment, and better targeting education and training to employer needs would help achieve
these goals. Recent actions to reduce red tape, streamline the list of regulated professions, and
reduce labor market segmentation by better aligning civil law and regular contracts, are welcome in
this regard.
42. It is recommended that the next Article IV consultation be held on the standard 12-
month cycle.

REPUBLIC OF POLAND
28 INTERNATIONAL MONETARY FUND
Figure 1. Republic of Poland: Integration with the Global Economy
Sources: Polish authorities, IMF World Economic Outlook, Bank for International Settlements Triennial
Central Bank Survey, and IMF staff calculations.
30
40
50
60
70
80
90
100
1995 1997 1999 2001 2003 2005 2007 2009 2011 2013
Trade Openness
(Percent of GDP)
Sum of exports and imports of
goods and services
0
20
40
60
80
100
120
140
160
180
1995 1997 1999 2001 2003 2005 2007 2009 2011 2013
Financial Integration
(Percent of GDP)
Sum of foreign assets and liabilities
0.0 0.2 0.4 0.6 0.8 1.0
1998
2001
2004
2007
2010
2013
Share of Polish Zloty in Global Currency Market
(Percent of average daily turnover)
... supported by trade openness via supply-chains ...
...and financial integration.Consequently, zloty trade has become important.
36.4
17.1
11.28.5
6.6 6.2 5.0 4.5 3.90.5 0.0
0
10
20
30
40
Inve
stm
ent fu
nd
s
Om
nib
us
acc
ounts
Centr
al b
anks
Oth
ers
Pensi
on fu
nd
s
Banks
Insu
rance
…
Pub
lic
Inst
ituti
ons
No
n-f
inanci
al s
ect
or
Hed
ge fu
nd
s
Ind
ivid
uals
Institutional Distribution of non-residents
holdings (Percent of total domestic government
bonds; end-April 2015)
27.7
18.4
12.6
5.9 5.7 5.0 4.4 4.22.5 2.4
1.5 1.4 1.2 1.0
6.2
0
5
10
15
20
25
30
Unit
ed
Sta
tes
Luxe
mb
ourg
Jap
an
UK
No
rway
Thailand
Irela
nd
Germ
any
France
Neth
erl
and
s
Aust
ria
Unit
ed
Ara
b E
mirate
s
Sw
itze
rland
Aust
rali
a
Oth
ers
Breakdown of Foreign Investors in
the Local Government Bond Market
(Percent; data as of end-April 2015)
...a favorable institutional investor base profile reduces risks.While bond market exposure to the U.S. and Europe is large...
0
10
20
30
40
50
60
70
80
90
100
1995 1997 1999 2001 2003 2005 2007 2009 2011 2013
Latvia Lithuania
Estonia Poland
Hungary Czech Rep.
Convergence Toward EU Average Income
(PPP income per capita as a percent of EU-28 average)
The income convergence process is well underway ...
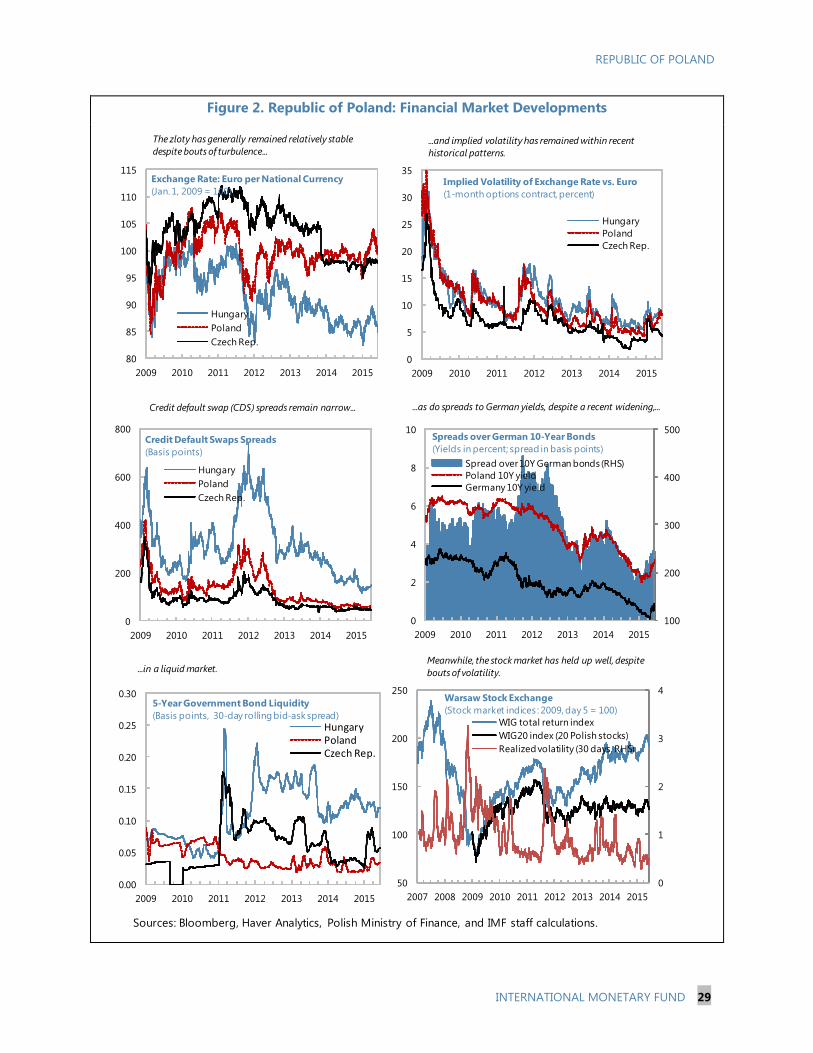
REPUBLIC OF POLAND
INTERNATIONAL MONETARY FUND 29
Figure 2. Republic of Poland: Financial Market Developments
Sources: Bloomberg, Haver Analytics, Polish Ministry of Finance, and IMF staff calculations.
80
85
90
95
100
105
110
115
2009 2010 2011 2012 2013 2014 2015
Exchange Rate: Euro per National Currency
(Jan. 1, 2009 = 100)
Hungary
Poland
Czech Rep.
0
5
10
15
20
25
30
35
2009 2010 2011 2012 2013 2014 2015
Hungary
Poland
Czech Rep.
Implied Volatility of Exchange Rate vs. Euro
(1-month options contract, percent)
The zloty has generally remained relatively stable
despite bouts of turbulence...
0
200
400
600
800
2009 2010 2011 2012 2013 2014 2015
Credit Default Swaps Spreads
(Basis points)
Hungary
Poland
Czech Rep.
Credit default swap (CDS) spreads remain narrow... ...as do spreads to German yields, despite a recent widening,...
...in a liquid market.Meanwhile, the stock market has held up well, despite
bouts of volatility.
...and implied volatility has remained within recent
historical patterns.
0
1
2
3
4
50
100
150
200
250
2007 2008 2009 2010 2011 2012 2013 2014 2015
WIG total return index
WIG20 index (20 Polish stocks)
Realized volatility (30 days, RHS)
Warsaw Stock Exchange
(Stock market indices : 2009, day 5 = 100)
100
200
300
400
500
0
2
4
6
8
10
2009 2010 2011 2012 2013 2014 2015
Spread over 10Y German bonds (RHS)
Poland 10Y yield
Germany 10Y yield
Spreads over German 10-Year Bonds
(Yields in percent; spread in basis points)
0.00
0.05
0.10
0.15
0.20
0.25
0.30
2009 2010 2011 2012 2013 2014 2015
HungaryPolandCzech Rep.
5-Year Government Bond Liquidity
(Basis points, 30-day rolling bid-ask spread)
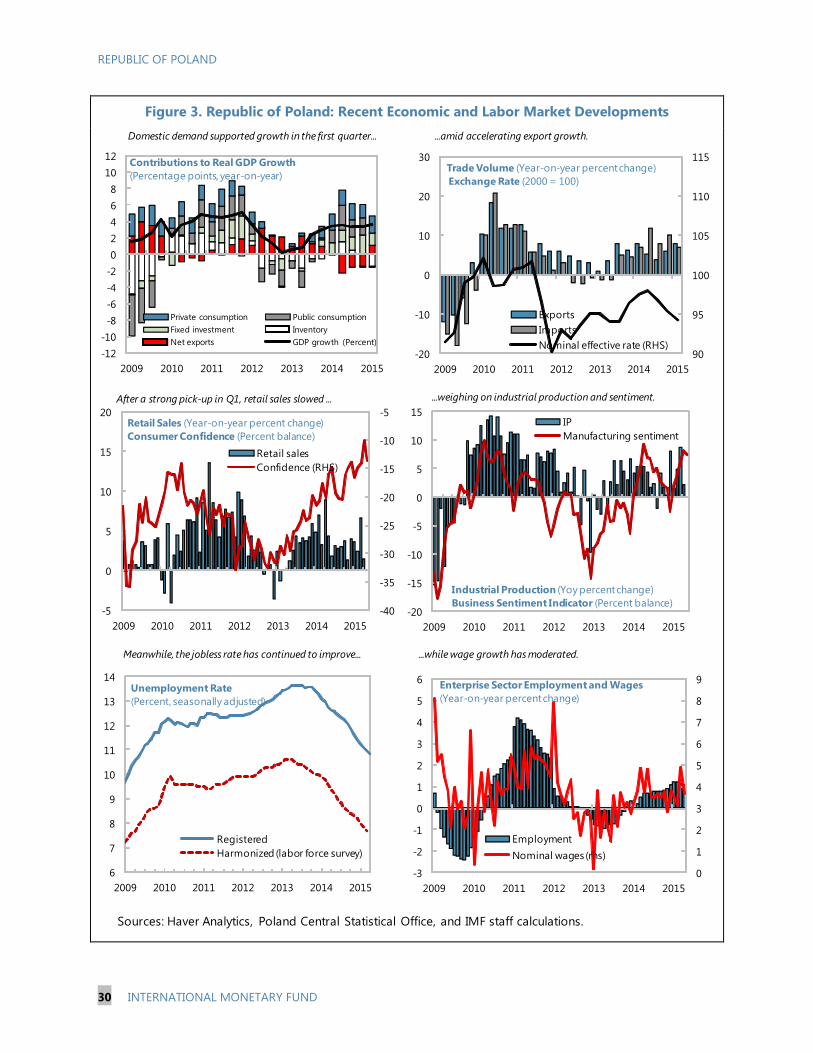
REPUBLIC OF POLAND
30 INTERNATIONAL MONETARY FUND
Figure 3. Republic of Poland: Recent Economic and Labor Market Developments
Sources: Haver Analytics, Poland Central Statistical Office, and IMF staff calculations.
90
95
100
105
110
115
-20
-10
0
10
20
30
2009 2010 2011 2012 2013 2014 2015
Trade Volume (Year-on-year percent change)
Exchange Rate (2000 = 100)
Exports
Imports
Nominal effective rate (RHS)
-40
-35
-30
-25
-20
-15
-10
-5
-5
0
5
10
15
20
2009 2010 2011 2012 2013 2014 2015
Retail Sales (Year-on-year percent change)
Consumer Confidence (Percent balance)
Retail sales
Confidence (RHS)
-20
-15
-10
-5
0
5
10
15
2009 2010 2011 2012 2013 2014 2015
Industrial Production (Yoy percent change)
Business Sentiment Indicator (Percent balance)
IP
Manufacturing sentiment
Domestic demand supported growth in the first quarter... ...amid accelerating export growth.
After a strong pick-up in Q1, retail sales slowed ... ...weighing on industrial production and sentiment.
Meanwhile, the jobless rate has continued to improve... ...while wage growth has moderated.
-12
-10
-8
-6
-4
-2
0
2
4
6
8
10
12
2009 2010 2011 2012 2013 2014 2015
Contributions to Real GDP Growth
(Percentage points, year-on-year)
Private consumption Public consumption
Fixed investment Inventory
Net exports GDP growth (Percent)
0
1
2
3
4
5
6
7
8
9
-3
-2
-1
0
1
2
3
4
5
6
2009 2010 2011 2012 2013 2014 2015
Enterprise Sector Employment and Wages
(Year-on-year percent change)
Employment
Nominal wages (rhs)
6
7
8
9
10
11
12
13
14
2009 2010 2011 2012 2013 2014 2015
Unemployment Rate
(Percent, seasonally adjusted)
Registered
Harmonized (labor force survey)
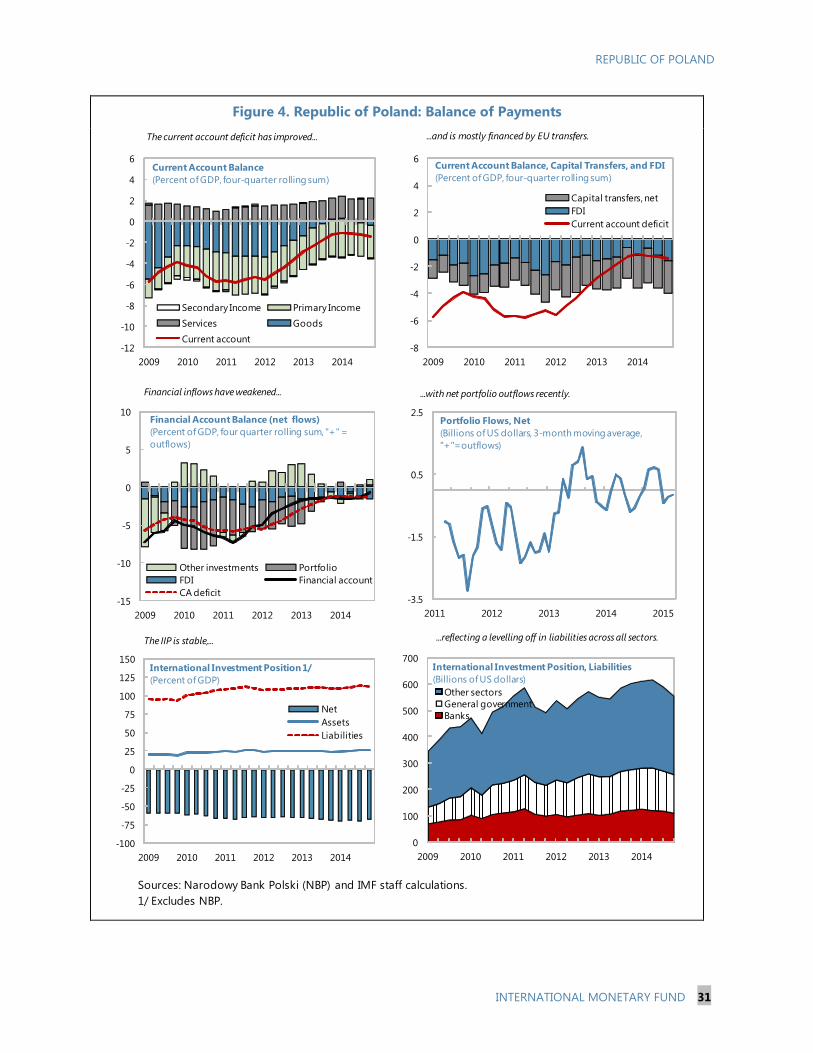
REPUBLIC OF POLAND
INTERNATIONAL MONETARY FUND 31
Figure 4. Republic of Poland: Balance of Payments
Sources: Narodowy Bank Polski (NBP) and IMF staff calculations.
1/ Excludes NBP.
-12
-10
-8
-6
-4
-2
0
2
4
6
2009 2010 2011 2012 2013 2014
Current Account Balance
(Percent of GDP, four-quarter rolling sum)
Secondary Income Primary Income
Services Goods
Current account-8
-6
-4
-2
0
2
4
6
2009 2010 2011 2012 2013 2014
Capital transfers, net
FDI
Current account deficit
Current Account Balance, Capital Transfers, and FDI
(Percent of GDP, four-quarter rolling sum)
-3.5
-1.5
0.5
2.5
2011 2012 2013 2014 2015
Portfolio Flows, Net
(Billions of US dollars, 3-month moving average,
"+"=outflows)
-100
-75
-50
-25
0
25
50
75
100
125
150
2009 2010 2011 2012 2013 2014
International Investment Position 1/
(Percent of GDP)
Net
Assets
Liabilities
0
100
200
300
400
500
600
700
2009 2010 2011 2012 2013 2014
International Investment Position, Liabilities
(Billions of US dollars)
Other sectors
General government
Banks
The current account deficit has improved... ...and is mostly financed by EU transfers.
Financial inflows have weakened... ...with net portfolio outflows recently.
The IIP is stable,... ...reflecting a levelling off in liabilities across all sectors.
-15
-10
-5
0
5
10
2009 2010 2011 2012 2013 2014
Financial Account Balance (net flows)
(Percent of GDP, four quarter rolling sum, "+" =
outflows)
Other investments Portfolio
FDI Financial account
CA deficit
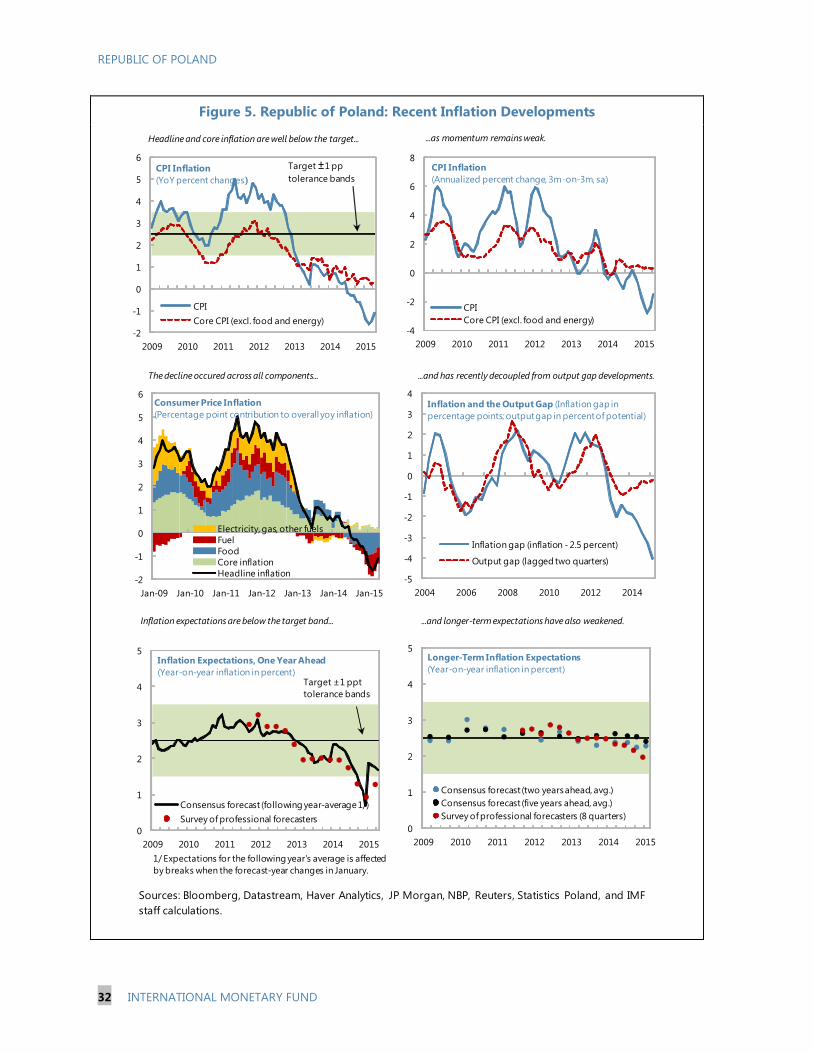
REPUBLIC OF POLAND
32 INTERNATIONAL MONETARY FUND
Figure 5. Republic of Poland: Recent Inflation Developments
Sources: Bloomberg, Datastream, Haver Analytics, JP Morgan, NBP, Reuters, Statistics Poland, and IMF
staff calculations.
Headline and core inflation are well below the target... ...as momentum remains weak.
The decline occured across all components...
...and longer-term expectations have also weakened.
...and has recently decoupled from output gap developments.
Inflation expectations are below the target band...
-2
-1
0
1
2
3
4
5
6
2009 2010 2011 2012 2013 2014 2015
CPI Inflation
(YoY percent changes)
CPI
Core CPI (excl. food and energy)
Target ±1 pp
tolerance bands
-2
-1
0
1
2
3
4
5
6
Jan-09 Jan-10 Jan-11 Jan-12 Jan-13 Jan-14 Jan-15
Electricity, gas, other fuels
Fuel
Food
Core inflation
Headline inflation
Consumer Price Inflation
(Percentage point contribution to overall yoy inflation)
-4
-2
0
2
4
6
8
2009 2010 2011 2012 2013 2014 2015
CPI
Core CPI (excl. food and energy)
CPI Inflation
(Annualized percent change, 3m-on-3m, sa)
-5
-4
-3
-2
-1
0
1
2
3
4
2004 2006 2008 2010 2012 2014
Inflation gap (inflation - 2.5 percent)
Output gap (lagged two quarters)
Inflation and the Output Gap (Inflation gap in
percentage points; output gap in percent of potential)
0
1
2
3
4
5
2009 2010 2011 2012 2013 2014 2015
Consensus forecast (following year-average 1/)
Survey of professional forecasters
Inflation Expectations, One Year Ahead
(Year-on-year inflation in percent)
1/ Expectations for the following year's average is affected
by breaks when the forecast-year changes in January.
Target ±1 ppt
tolerance bands
0
1
2
3
4
5
2009 2010 2011 2012 2013 2014 2015
Consensus forecast (two years ahead, avg.)
Consensus forecast (five years ahead, avg.)
Survey of professional forecasters (8 quarters)
Longer-Term Inflation Expectations
(Year-on-year inflation in percent)

REPUBLIC OF POLAND
INTERNATIONAL MONETARY FUND 33
Figure 6. Republic of Poland: Monetary Policy Developments
Sources: Bloomberg, Consensus Economics, Datastream, Haver Analytics, JP Morgan, NBP, Reuters,
Statistics Poland, and IMF staff calculations.
0
1
2
3
4
5
6
7
2009 2010 2011 2012 2013 2014 2015
Interest Rates
(End of period, percent)
3-month Wibid
Reference rate
Deposit rate
Lombard rate
The monetary easing cycle has fully transmitted to
the key interbank rate,......helping lending rates to decline.
However, the real policy rate remains high,...
If needed, there is nominal room to ease further.
...including relative to peers,...
...and when adjusting for risk.
-2
-1
0
1
2
3
4
2009 2010 2011 2012 2013 2014 2015
Real Policy Rate
(Percent)
Ex-post real policy rate
Ex-ante real policy rate
Ex-ante policy rate based on 12-month inflation
expectations (consumers)
Ex-post policy rate based on realized inflation
0
2
4
6
8
10
12
14
2009 2010 2011 2012 2013 2014 2015
Lending and Deposit Rates
(Percent) Lending margin
Deposit rate
Lending rate
-1
0
1
2
3
4
Jan-14 Apr-14 Jul-14 Oct-14 Jan-15 Apr-15
Ex-Post Real Policy Rates
(End of period, percent; based on HICP inflation)
Poland Czech Rep.
Hungary Romania
Euro area
-1
0
1
2
3
4
5
Jan-14 Apr-14 Jul-14 Oct-14 Jan-15 Apr-15
Nominal Policy Rates
(End of period, percent)
Poland Czech Republic
Hungary Romania
Euro area
-2
-1
0
1
2
3
4
Jan-14 Apr-14 Jul-14 Oct-14 Jan-15 Apr-15
Ex-Post Real Policy Rates, Risk-Adjusted (End of
period, percent; nominal rate minus inflation minus
CDS spreads)
Poland Czech Rep.
Hungary Romania

REPUBLIC OF POLAND
34 INTERNATIONAL MONETARY FUND
Figure 7. Republic of Poland: Banking Sector Capital and Asset Quality
Sources: KNF, NBP, and IMF staff calculations.
1/ 12-month profits in percent of 12-month assets.
2
4
6
8
10
12
14
2008 2009 2010 2011 2012 2013 2014 2015
Non-Performing Loans by Sector
(Percent of loans in given segment)
Total
Households
Corporates
0
25
50
75
100
2010 2011 2012 2013 2014 2015
Non-Performing Loans
(Billion zloty)
Large firms SMEs
Other household loans Consumer loans
Housing
0
5
10
15
20
Housing Consumer
loans
Other
household
loans
SMEs Large
enterprises
Nonfinancial Sector Impaired Loans
(Percent of loans in given segment)
Dec. 2010
Dec. 2012
Dec. 2014
Mar. 2015
Bank profits remain strong and capital adequacy high,... ...though profitability has recently weakened.
Non-performing loans (NPLs) are sticky...
...and remain high for SMEs and consumer loans,... ...accounting for the bulk of impaired loans.
Nonetheless, the foreign currency share of mortgages has declined.
10
12
14
16
18
0.0
0.5
1.0
1.5
2.0
2.5
2010 2011 2012 2013 2014 2015
Banking sector net profits (billion zloty)
CAR (RHS) (percent)CAR (CRD IV) (RHS) (Percent)
Monthly Banking Sector Net Profits and Capital
Adequacy Ratio
40
45
50
55
60
65
70
75
80
2008 2009 2010 2011 2012 2013 2014 2015
Share of Foreign Currency Denominated
Housing Loans
(Percent of total housing loans outstanding)
0.9
1.0
1.1
1.2
1.3
2011 2012 2013 2014 2015
11
12
13
14
15
16
17
18
Profits (12-month moving average)
Return on assets 1/ (RHS)
Banking Sector Profits
(LHS: billion zloty; RHS: percent of assets)

REPUBLIC OF POLAND
INTERNATIONAL MONETARY FUND 35
Figure 8. Republic of Poland: Credit Growth and Banking Sector Funding
Sources: Haver Analytics, International Financial Statistics, NBP, KNF, and IMF staff calculations.
-10
0
10
20
30
40
50
60
70
80
2009 2010 2011 2012 2013 2014 2015
Total
Corporates
Household mortgages
Consumer credit
Private Sector Credit Growth
(Year-on-year percent change)
Private sector credit expansion is healthy... ...with rising deposits an important funding source...
...by both households and nonfinancial corporations.
...as has also the reliance on parent bank funding... ...with reduced FX hedging needs.
2
3
4
5
6
7
8
9
2009 2010 2011 2012 2013 2014 2015
Share in total banking sector assets
Percent of GDP
Banking Sector, On-balance Sheet Open FX
Position (Percent)
-20
0
20
40
60
2009 2010 2011 2012 2013 2014
Net foreign assets
Net claim on government
Deposit growth
Others
Claims on private sector
Contribution to Private Sector Credit Growth
(Percentage points)
45
50
55
60
65
70
75
2009 2010 2011 2012 2013 2014 2015
Polish Banks' External Liabilities to Financial Sector
(Billions of US$)
6
7
8
9
10
11
12
13
14
15
16
2010 2011 2012 2013 2014
Percent of banking sector liabilities
Percent of GDP
Banking Sector Debt to Parents
(Percent)
Alongside, external financial liabilities have declined...
-10
-5
0
5
10
15
20
2011 2012 2013 2014 2015
Total
Nonfinancial corporations
Households
Private Sector Deposit Growth
(Year-on-year percent change)
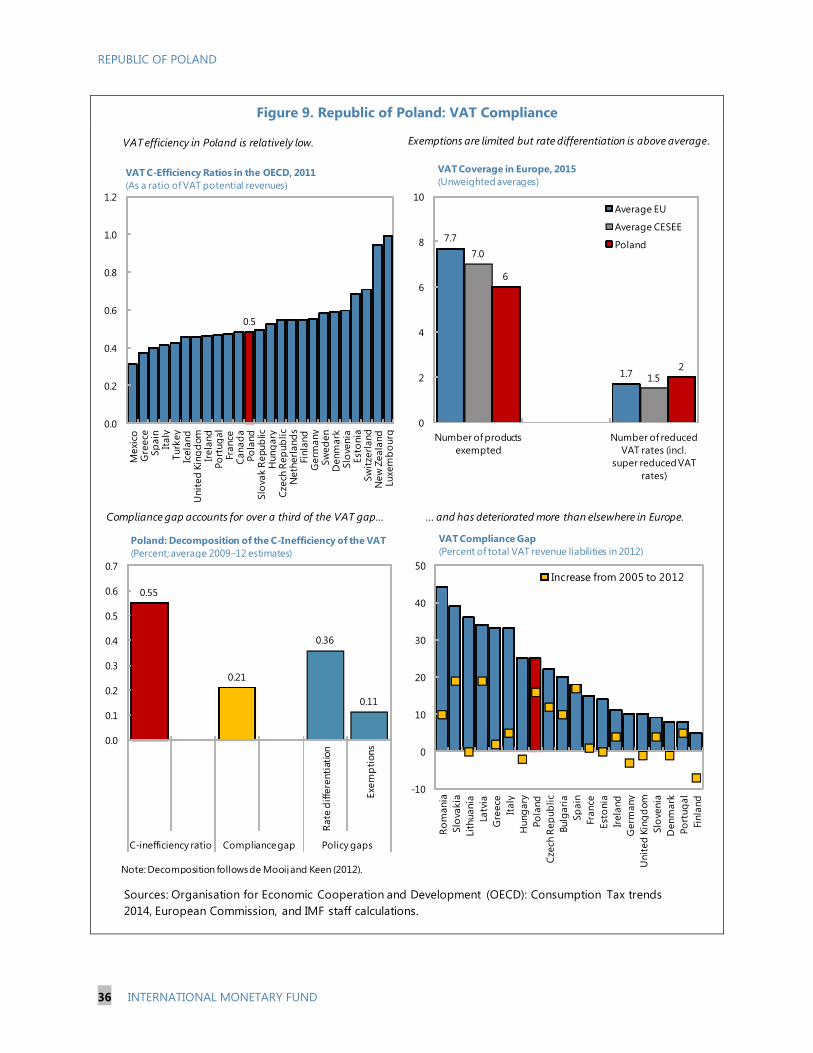
REPUBLIC OF POLAND
36 INTERNATIONAL MONETARY FUND
Figure 9. Republic of Poland: VAT Compliance
Sources: Organisation for Economic Cooperation and Development (OECD): Consumption Tax trends
2014, European Commission, and IMF staff calculations.
0.5
0.0
0.2
0.4
0.6
0.8
1.0
1.2
Mexi
coG
reece
Sp
ain
Italy
Turk
ey
Icela
nd
Unit
ed
Kin
gd
om
Irela
nd
Po
rtug
al
France
Canad
aPo
land
Slo
vak R
epub
licH
ung
ary
Cze
ch R
ep
ub
lic
Neth
erl
and
sFi
nla
nd
Germ
any
Sw
ed
en
Denm
ark
Slo
venia
Est
onia
Sw
itze
rland
New
Zeala
nd
Luxe
mb
ourg
VAT C-Efficiency Ratios in the OECD, 2011
(As a ratio of VAT potential revenues)
7.7
1.7
7.0
1.5
6
2
0
2
4
6
8
10
Number of products
exempted
Number of reduced
VAT rates (incl.
super reduced VAT
rates)
Average EU
Average CESEE
Poland
VAT Coverage in Europe, 2015
(Unweighted averages)
0.55
0.21
0.36
0.11
0.0
0.1
0.2
0.3
0.4
0.5
0.6
0.7
Rate
diffe
renti
atio
n
Exe
mp
tions
C-inefficiency ratio Compliance gap Policy gaps
Poland: Decomposition of the C-Inefficiency of the VAT
(Percent; average 2009–12 estimates)
Note: Decomposition follows de Mooij and Keen (2012).
-10
0
10
20
30
40
50
Ro
mania
Slo
vakia
Lith
uania
Latv
ia
Gre
ece
Italy
Hung
ary
Po
land
Cze
ch R
ep
ub
lic
Bulg
ari
a
Sp
ain
France
Est
onia
Irela
nd
Germ
any
Unit
ed
Kin
gd
om
Slo
venia
Denm
ark
Po
rtug
al
Finla
nd
Increase from 2005 to 2012
VAT Compliance Gap
(Percent of total VAT revenue liabilities in 2012)
VAT efficiency in Poland is relatively low. Exemptions are limited but rate differentiation is above average.
Compliance gap accounts for over a third of the VAT gap... ... and has deteriorated more than elsewhere in Europe.
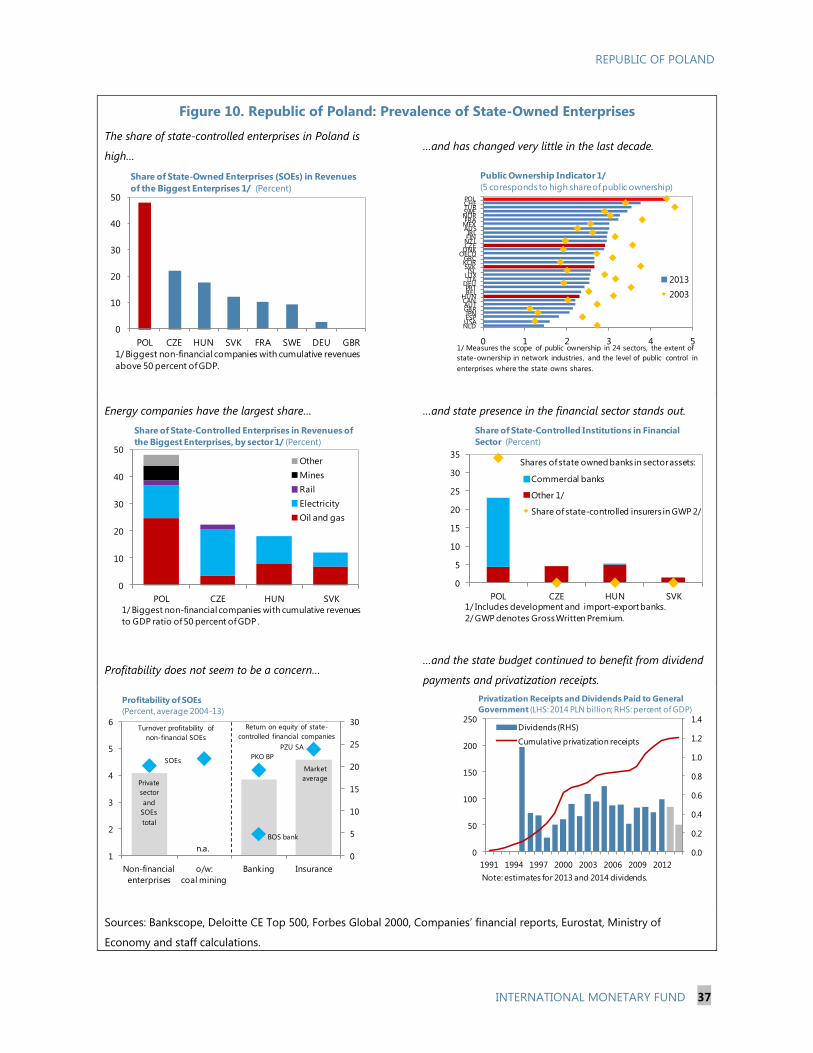
REPUBLIC OF POLAND
INTERNATIONAL MONETARY FUND 37
Figure 10. Republic of Poland: Prevalence of State-Owned Enterprises
The share of state-controlled enterprises in Poland is
high…
…and has changed very little in the last decade.
Energy companies have the largest share… …and state presence in the financial sector stands out.
Profitability does not seem to be a concern… …and the state budget continued to benefit from dividend
payments and privatization receipts.
Sources: Bankscope, Deloitte CE Top 500, Forbes Global 2000, Companies’ financial reports, Eurostat, Ministry of
Economy and staff calculations.
0
10
20
30
40
50
POL CZE HUN SVK FRA SWE DEU GBR
Share of State-Owned Enterprises (SOEs) in Revenues
of the Biggest Enterprises 1/ (Percent)
1/ Biggest non-financial companies with cumulative revenues
above 50 percent of GDP.
0 1 2 3 4 5
NLDUSAESPJPNGBRAUTCANHUN
BELPRT
DEUITA
LUXISL
SVKKORGRC
OECDDNKCZENZLFINIRL
AUSMEXFRA
NORSWETURCHEPOL
2013
2003
Public Ownership Indicator 1/
(5 coresponds to high share of public ownership)
1/ Measures the scope of public ownership in 24 sectors, the extent of
state-ownership in network industries, and the level of public control in
enterprises where the state owns shares.
0
10
20
30
40
50
POL CZE HUN SVK
Other
Mines
Rail
Electricity
Oil and gas
Share of State-Controlled Enterprises in Revenues of
the Biggest Enterprises, by sector1/ (Percent)
1/ Biggest non-financial companies with cumulative revenues
to GDP ratio of 50 percent of GDP .
0
5
10
15
20
25
30
35
POL CZE HUN SVK
Commercial banks
Other 1/
Share of state-controlled insurers in GWP 2/
Share of State-Controlled Institutions in Financial
Sector (Percent)
1/ Includes development and import-export banks.
2/ GWP denotes Gross Written Premium.
Shares of state owned banks in sector assets:
0
5
10
15
20
25
30
1
2
3
4
5
6
Non-financial
enterprises
o/w:
coal mining
Banking Insurance
PKO BP
BOS bank
PZU SA
Market
average
Profitability of SOEs
(Percent, average 2004-13)
Private
sector
and
SOEs
total
Turnover profitability of
non-financial SOEs
Return on equity of state-
controlled financial companies
n.a.
SOEs
0.0
0.2
0.4
0.6
0.8
1.0
1.2
1.4
0
50
100
150
200
250
1991 1994 1997 2000 2003 2006 2009 2012
Dividends (RHS)
Cumulative privatization receipts
Privatization Receipts and Dividends Paid to General
Government (LHS: 2014 PLN billion; RHS: percent of GDP)
Note: estimates for 2013 and 2014 dividends.
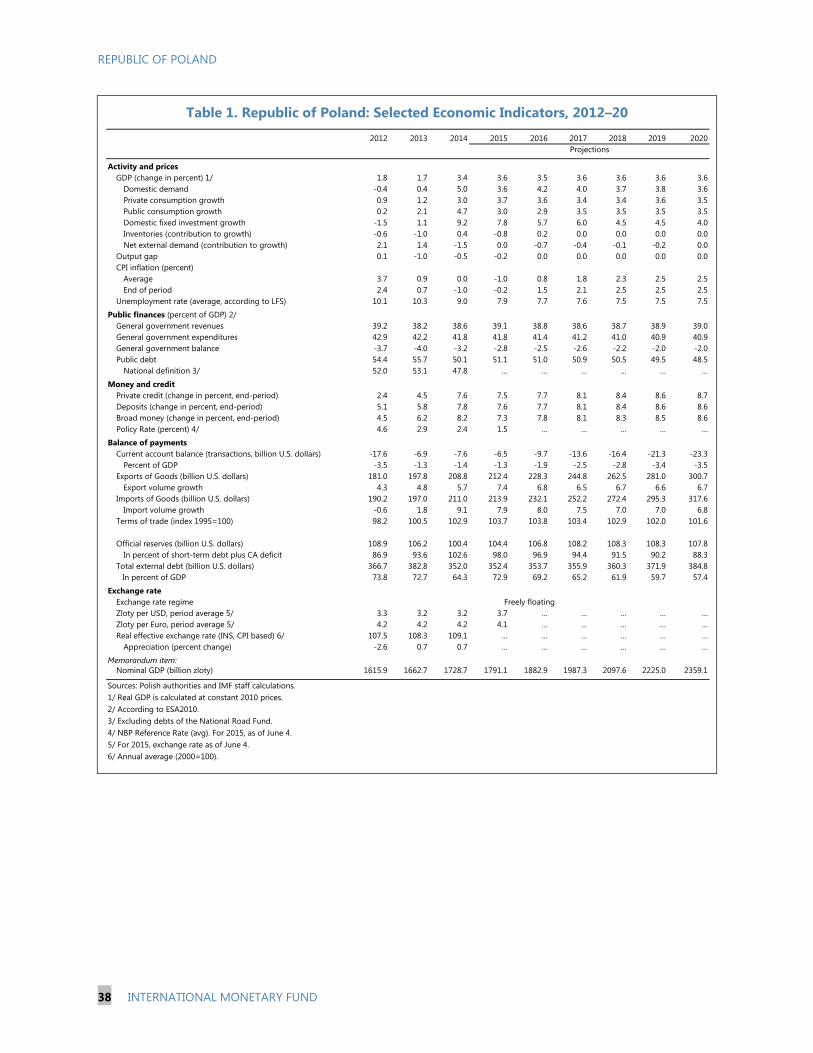
REPUBLIC OF POLAND
38 INTERNATIONAL MONETARY FUND
Table 1. Republic of Poland: Selected Economic Indicators, 2012–20
2012 2013 2014 2015 2016 2017 2018 2019 2020
Activity and prices
GDP (change in percent) 1/ 1.8 1.7 3.4 3.6 3.5 3.6 3.6 3.6 3.6
Domestic demand -0.4 0.4 5.0 3.6 4.2 4.0 3.7 3.8 3.6
Private consumption growth 0.9 1.2 3.0 3.7 3.6 3.4 3.4 3.6 3.5
Public consumption growth 0.2 2.1 4.7 3.0 2.9 3.5 3.5 3.5 3.5
Domestic fixed investment growth -1.5 1.1 9.2 7.8 5.7 6.0 4.5 4.5 4.0
Inventories (contribution to growth) -0.6 -1.0 0.4 -0.8 0.2 0.0 0.0 0.0 0.0
Net external demand (contribution to growth) 2.1 1.4 -1.5 0.0 -0.7 -0.4 -0.1 -0.2 0.0
Output gap 0.1 -1.0 -0.5 -0.2 0.0 0.0 0.0 0.0 0.0
CPI inflation (percent)
Average 3.7 0.9 0.0 -1.0 0.8 1.8 2.3 2.5 2.5
End of period 2.4 0.7 -1.0 -0.2 1.5 2.1 2.5 2.5 2.5
Unemployment rate (average, according to LFS) 10.1 10.3 9.0 7.9 7.7 7.6 7.5 7.5 7.5
Public finances (percent of GDP) 2/
General government revenues 39.2 38.2 38.6 39.1 38.8 38.6 38.7 38.9 39.0
General government expenditures 42.9 42.2 41.8 41.8 41.4 41.2 41.0 40.9 40.9
General government balance -3.7 -4.0 -3.2 -2.8 -2.5 -2.6 -2.2 -2.0 -2.0
Public debt 54.4 55.7 50.1 51.1 51.0 50.9 50.5 49.5 48.5
National definition 3/ 52.0 53.1 47.8 … … … … … …
Money and credit
Private credit (change in percent, end-period) 2.4 4.5 7.6 7.5 7.7 8.1 8.4 8.6 8.7
Deposits (change in percent, end-period) 5.1 5.8 7.8 7.6 7.7 8.1 8.4 8.6 8.6
Broad money (change in percent, end-period) 4.5 6.2 8.2 7.3 7.8 8.1 8.3 8.5 8.6
Policy Rate (percent) 4/ 4.6 2.9 2.4 1.5 … … … … …
Balance of payments
Current account balance (transactions, billion U.S. dollars) -17.6 -6.9 -7.6 -6.5 -9.7 -13.6 -16.4 -21.3 -23.3
Percent of GDP -3.5 -1.3 -1.4 -1.3 -1.9 -2.5 -2.8 -3.4 -3.5
Exports of Goods (billion U.S. dollars) 181.0 197.8 208.8 212.4 228.3 244.8 262.5 281.0 300.7
Export volume growth 4.3 4.8 5.7 7.4 6.8 6.5 6.7 6.6 6.7
Imports of Goods (billion U.S. dollars) 190.2 197.0 211.0 213.9 232.1 252.2 272.4 295.3 317.6
Import volume growth -0.6 1.8 9.1 7.9 8.0 7.5 7.0 7.0 6.8
Terms of trade (index 1995=100) 98.2 100.5 102.9 103.7 103.8 103.4 102.9 102.0 101.6
Official reserves (billion U.S. dollars) 108.9 106.2 100.4 104.4 106.8 108.2 108.3 108.3 107.8
In percent of short-term debt plus CA deficit 86.9 93.6 102.6 98.0 96.9 94.4 91.5 90.2 88.3
Total external debt (billion U.S. dollars) 366.7 382.8 352.0 352.4 353.7 355.9 360.3 371.9 384.8
In percent of GDP 73.8 72.7 64.3 72.9 69.2 65.2 61.9 59.7 57.4
Exchange rate
Exchange rate regime
Zloty per USD, period average 5/ 3.3 3.2 3.2 3.7 … … … … …
Zloty per Euro, period average 5/ 4.2 4.2 4.2 4.1 … … … … …
Real effective exchange rate (INS, CPI based) 6/ 107.5 108.3 109.1 … … … … … …
Appreciation (percent change) -2.6 0.7 0.7 … … … … … …
Memorandum item:
Nominal GDP (billion zloty) 1615.9 1662.7 1728.7 1791.1 1882.9 1987.3 2097.6 2225.0 2359.1
Sources: Polish authorities and IMF staff calculations.
1/ Real GDP is calculated at constant 2010 prices.
2/ According to ESA2010.
3/ Excluding debts of the National Road Fund.
4/ NBP Reference Rate (avg). For 2015, as of June 4.
5/ For 2015, exchange rate as of June 4.
6/ Annual average (2000=100).
Freely floating
Projections
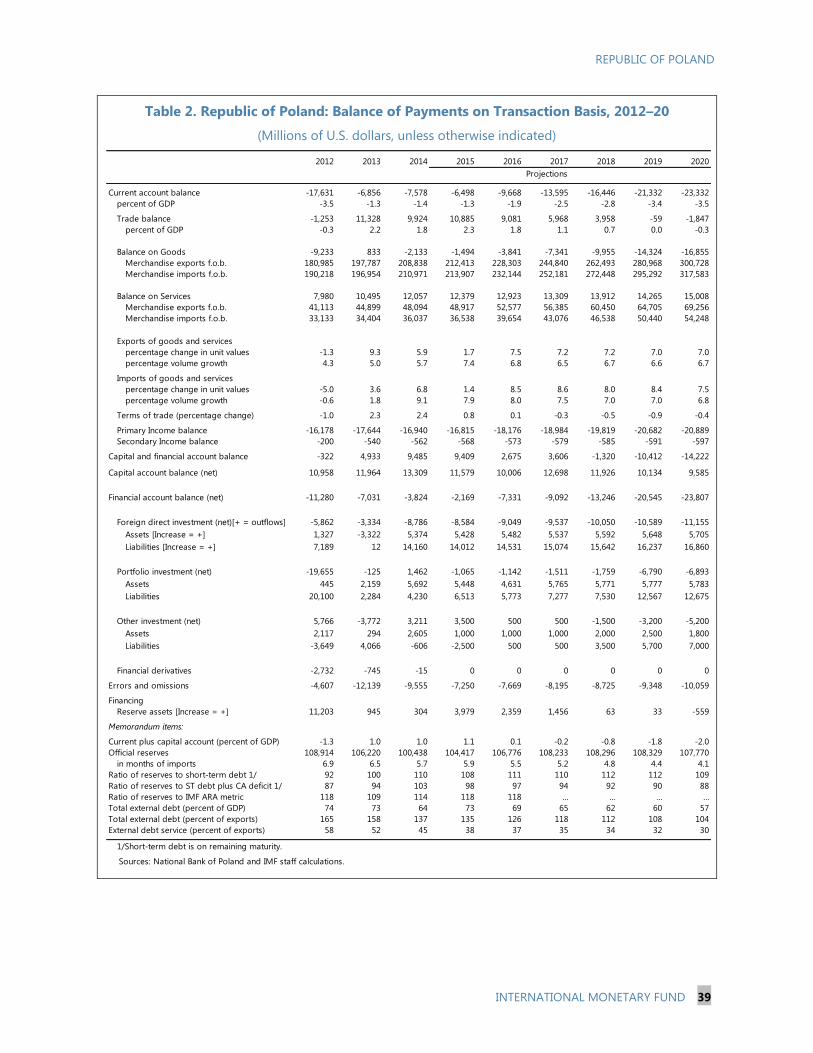
REPUBLIC OF POLAND
INTERNATIONAL MONETARY FUND 39
Table 2. Republic of Poland: Balance of Payments on Transaction Basis, 2012–20
(Millions of U.S. dollars, unless otherwise indicated)
2012 2013 2014 2015 2016 2017 2018 2019 2020
Current account balance -17,631 -6,856 -7,578 -6,498 -9,668 -13,595 -16,446 -21,332 -23,332
percent of GDP -3.5 -1.3 -1.4 -1.3 -1.9 -2.5 -2.8 -3.4 -3.5
Trade balance -1,253 11,328 9,924 10,885 9,081 5,968 3,958 -59 -1,847
percent of GDP -0.3 2.2 1.8 2.3 1.8 1.1 0.7 0.0 -0.3
Balance on Goods -9,233 833 -2,133 -1,494 -3,841 -7,341 -9,955 -14,324 -16,855
Merchandise exports f.o.b. 180,985 197,787 208,838 212,413 228,303 244,840 262,493 280,968 300,728
Merchandise imports f.o.b. 190,218 196,954 210,971 213,907 232,144 252,181 272,448 295,292 317,583
Balance on Services 7,980 10,495 12,057 12,379 12,923 13,309 13,912 14,265 15,008
Merchandise exports f.o.b. 41,113 44,899 48,094 48,917 52,577 56,385 60,450 64,705 69,256
Merchandise imports f.o.b. 33,133 34,404 36,037 36,538 39,654 43,076 46,538 50,440 54,248
Exports of goods and services
percentage change in unit values -1.3 9.3 5.9 1.7 7.5 7.2 7.2 7.0 7.0
percentage volume growth 4.3 5.0 5.7 7.4 6.8 6.5 6.7 6.6 6.7
Imports of goods and services
percentage change in unit values -5.0 3.6 6.8 1.4 8.5 8.6 8.0 8.4 7.5
percentage volume growth -0.6 1.8 9.1 7.9 8.0 7.5 7.0 7.0 6.8
Terms of trade (percentage change) -1.0 2.3 2.4 0.8 0.1 -0.3 -0.5 -0.9 -0.4
Primary Income balance -16,178 -17,644 -16,940 -16,815 -18,176 -18,984 -19,819 -20,682 -20,889
Secondary Income balance -200 -540 -562 -568 -573 -579 -585 -591 -597
Capital and financial account balance -322 4,933 9,485 9,409 2,675 3,606 -1,320 -10,412 -14,222
Capital account balance (net) 10,958 11,964 13,309 11,579 10,006 12,698 11,926 10,134 9,585
Financial account balance (net) -11,280 -7,031 -3,824 -2,169 -7,331 -9,092 -13,246 -20,545 -23,807
Foreign direct investment (net)[+ = outflows] -5,862 -3,334 -8,786 -8,584 -9,049 -9,537 -10,050 -10,589 -11,155
Assets [Increase = +] 1,327 -3,322 5,374 5,428 5,482 5,537 5,592 5,648 5,705
Liabilities [Increase = +] 7,189 12 14,160 14,012 14,531 15,074 15,642 16,237 16,860
Portfolio investment (net) -19,655 -125 1,462 -1,065 -1,142 -1,511 -1,759 -6,790 -6,893
Assets 445 2,159 5,692 5,448 4,631 5,765 5,771 5,777 5,783
Liabilities 20,100 2,284 4,230 6,513 5,773 7,277 7,530 12,567 12,675
Other investment (net) 5,766 -3,772 3,211 3,500 500 500 -1,500 -3,200 -5,200
Assets 2,117 294 2,605 1,000 1,000 1,000 2,000 2,500 1,800
Liabilities -3,649 4,066 -606 -2,500 500 500 3,500 5,700 7,000
Financial derivatives -2,732 -745 -15 0 0 0 0 0 0
Errors and omissions -4,607 -12,139 -9,555 -7,250 -7,669 -8,195 -8,725 -9,348 -10,059
Financing
Reserve assets [Increase = +] 11,203 945 304 3,979 2,359 1,456 63 33 -559
Memorandum items:
Current plus capital account (percent of GDP) -1.3 1.0 1.0 1.1 0.1 -0.2 -0.8 -1.8 -2.0
Official reserves 108,914 106,220 100,438 104,417 106,776 108,233 108,296 108,329 107,770
in months of imports 6.9 6.5 5.7 5.9 5.5 5.2 4.8 4.4 4.1
Ratio of reserves to short-term debt 1/ 92 100 110 108 111 110 112 112 109
Ratio of reserves to ST debt plus CA deficit 1/ 87 94 103 98 97 94 92 90 88
Ratio of reserves to IMF ARA metric 118 109 114 118 118 … … … …
Total external debt (percent of GDP) 74 73 64 73 69 65 62 60 57
Total external debt (percent of exports) 165 158 137 135 126 118 112 108 104
External debt service (percent of exports) 58 52 45 38 37 35 34 32 30
1/Short-term debt is on remaining maturity.
Sources: National Bank of Poland and IMF staff calculations.
Projections

Table 3. Republic of Poland: Risk Assessment Matrix1/
Risk Relative Likelihood and Transmission
Channels
Expected Impact of Risk Policy Recommendations
1. Side-effects from
global financial
conditions
High A surge in financial volatility could occur as
investors reassess underlying risk and move to safe-haven assets given slow and uneven growth as well as asymmetric monetary exit.
Both push and pull factors will affect capital flows in the months ahead.
Outflows: monetary policy tightening in the
U.S. could trigger capital outflows with high participation of foreign investors in the domestic bond market entailing a potential
transmission channel. Risks are mitigated by prudent public debt management.
Inflows: Ample liquidity in the context of the
ongoing quantitative easing by the European Central Bank (ECB QE), combined with strong economic fundamentals in Poland, could
attract excessively large capital inflows.
Medium Outflows:
Investors could reallocate assets away from Poland, resulting in capital flow reversals and zloty depreciation.
Liquidity in the FX derivatives market could be adversely affected, increasing banks’ hedging costs. Risks are
mitigated by strong liquidity positions in the banking sector.
Inflows:
Excess liquidity could increase exchange market pressure, exacerbate zloty appreciation and fuel asset
bubbles.
The exchange rate should be allowed to
float freely, but intervention could be used to dampen excessive volatility. Fiscal policy should allow automatic stabilizers to work
as needed.
Outflows: interest rate hikes could be used to stem capital outflow pressure.
The NBP should provide liquidity support (including in FX) if needed. The FCL arrangement could be used under
extreme circumstances.
Inflows: monetary policy should be eased to reduce interest-rate
differentials and macroprudential policy should be tightened to manage potential risks of asset price bubbles.
2. Protracted period of
slower growth in key
advanced and
emerging economies
3. Mounting conflict in
Russia and Ukraine
High In the euro area and Japan, weak demand and
persistently low inflation could lead to “new mediocre” growth.
Medium The mounting conflict could depress business
confidence and heighten risk aversion amid
disturbances in global financial, trade, and commodity markets.
Spillovers would materialize through trade,
financial, and confidence channels.
Medium Significant trade linkages with Europe
would weaken growth in Poland through lower exports and adverse confidence effects.
NPLs would increase as a result of the growth slowdown. Risks are mitigated by the banking sector’s strong capital
position.
Medium Gas supply disruptions would adversely
affect Poland, particularly heavy industry
(which is more reliant on imported gas).
Financial market/confidence effects could
lead to capital flow reversals and pressure on Polish financial markets. Risks are mitigated by Poland’s very strong
fundamentals and policies.
Monetary policy should be further eased.
Fiscal automatic stabilizers should be allowed to operate.
In the event of adverse growth effects,
monetary policy should be further eased, unless Poland is faced with strong capital outflows, and fiscal automatic stabilizers
should be allowed to operate.
The exchange rate should be allowed to float freely, but intervention could be used
to dampen excessive volatility.
REP
UB
LIC O
F P
OLA
ND
40
IN
TER
NA
TIO
NA
L MO
NETA
RY F
UN
D
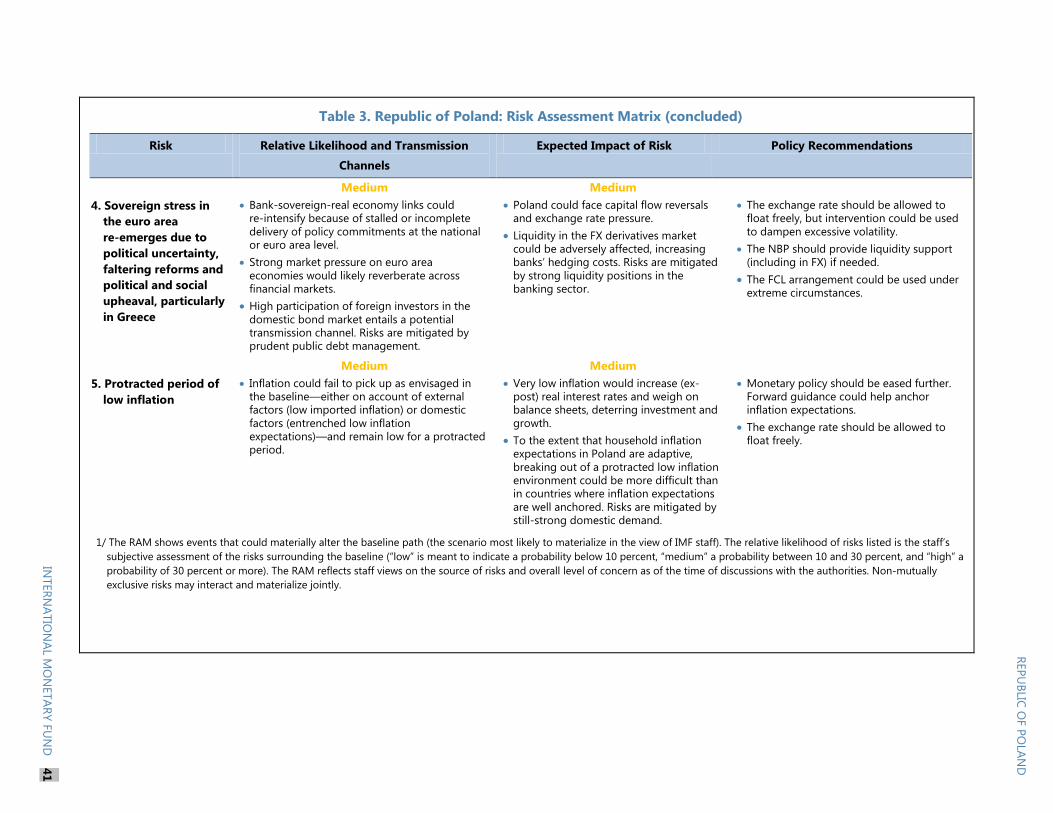
Table 3. Republic of Poland: Risk Assessment Matrix (concluded)
Risk Relative Likelihood and Transmission
Channels
Expected Impact of Risk Policy Recommendations
4. Sovereign stress in
the euro area
re-emerges due to
political uncertainty,
faltering reforms and
political and social
upheaval, particularly
in Greece
Medium
Bank-sovereign-real economy links could re-intensify because of stalled or incomplete
delivery of policy commitments at the national or euro area level.
Strong market pressure on euro area
economies would likely reverberate across financial markets.
High participation of foreign investors in the
domestic bond market entails a potential transmission channel. Risks are mitigated by prudent public debt management.
Medium
Poland could face capital flow reversals and exchange rate pressure.
Liquidity in the FX derivatives market could be adversely affected, increasing banks’ hedging costs. Risks are mitigated
by strong liquidity positions in the banking sector.
The exchange rate should be allowed to float freely, but intervention could be used
to dampen excessive volatility.
The NBP should provide liquidity support (including in FX) if needed.
The FCL arrangement could be used under extreme circumstances.
5. Protracted period of
low inflation
Medium
Inflation could fail to pick up as envisaged in the baseline—either on account of external factors (low imported inflation) or domestic
factors (entrenched low inflation expectations)—and remain low for a protracted period.
Medium
Very low inflation would increase (ex-post) real interest rates and weigh on balance sheets, deterring investment and
growth.
To the extent that household inflation expectations in Poland are adaptive,
breaking out of a protracted low inflation environment could be more difficult than in countries where inflation expectations
are well anchored. Risks are mitigated by still-strong domestic demand.
Monetary policy should be eased further. Forward guidance could help anchor inflation expectations.
The exchange rate should be allowed to float freely.
1/ The RAM shows events that could materially alter the baseline path (the scenario most likely to materialize in the view of IMF staff). The relative likelihood of risks listed is the staff’s
subjective assessment of the risks surrounding the baseline (“low” is meant to indicate a probability below 10 percent, “medium” a probability between 10 and 30 percent, and “high” a
probability of 30 percent or more). The RAM reflects staff views on the source of risks and overall level of concern as of the time of discussions with the authorities. Non-mutually
exclusive risks may interact and materialize jointly.
REP
UB
LIC O
F P
OLA
ND
INTER
NA
TIO
NA
L MO
NETA
RY F
UN
D
41
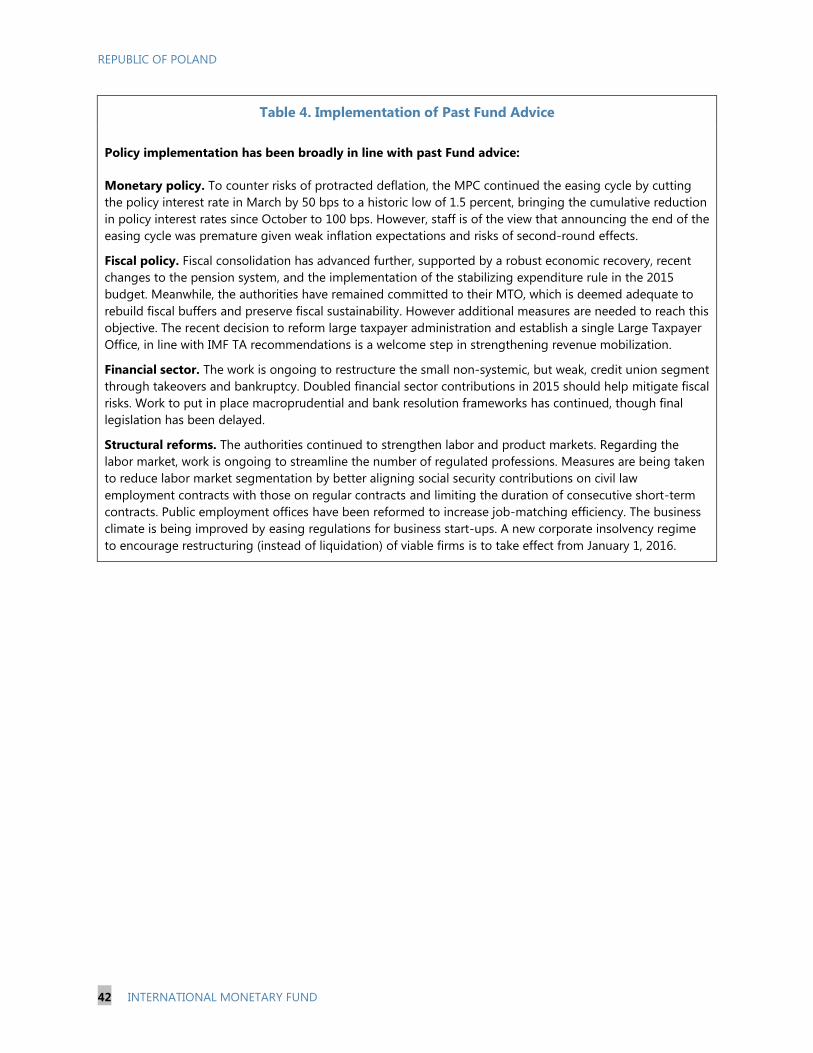
REPUBLIC OF POLAND
42 INTERNATIONAL MONETARY FUND
Table 4. Implementation of Past Fund Advice
Policy implementation has been broadly in line with past Fund advice:
Monetary policy. To counter risks of protracted deflation, the MPC continued the easing cycle by cutting
the policy interest rate in March by 50 bps to a historic low of 1.5 percent, bringing the cumulative reduction
in policy interest rates since October to 100 bps. However, staff is of the view that announcing the end of the
easing cycle was premature given weak inflation expectations and risks of second-round effects.
Fiscal policy. Fiscal consolidation has advanced further, supported by a robust economic recovery, recent
changes to the pension system, and the implementation of the stabilizing expenditure rule in the 2015
budget. Meanwhile, the authorities have remained committed to their MTO, which is deemed adequate to
rebuild fiscal buffers and preserve fiscal sustainability. However additional measures are needed to reach this
objective. The recent decision to reform large taxpayer administration and establish a single Large Taxpayer
Office, in line with IMF TA recommendations is a welcome step in strengthening revenue mobilization.
Financial sector. The work is ongoing to restructure the small non-systemic, but weak, credit union segment
through takeovers and bankruptcy. Doubled financial sector contributions in 2015 should help mitigate fiscal
risks. Work to put in place macroprudential and bank resolution frameworks has continued, though final
legislation has been delayed.
Structural reforms. The authorities continued to strengthen labor and product markets. Regarding the
labor market, work is ongoing to streamline the number of regulated professions. Measures are being taken
to reduce labor market segmentation by better aligning social security contributions on civil law
employment contracts with those on regular contracts and limiting the duration of consecutive short-term
contracts. Public employment offices have been reformed to increase job-matching efficiency. The business
climate is being improved by easing regulations for business start-ups. A new corporate insolvency regime
to encourage restructuring (instead of liquidation) of viable firms is to take effect from January 1, 2016.

Table 5. Republic of Poland: Financial Soundness Indicators, 2007–15
REP
UB
LIC O
F P
OLA
ND
INTER
NA
TIO
NA
L MO
NETA
RY F
UN
D
43
2007 2008 2009 2010 2011 2012 2013 2014 2015Q1
Capital adequacy 1/
Regulatory capital to risk-weighted assets 12.0 11.1 13.3 13.9 13.1 14.8 15.7 14.7
Regulatory Tier I capital to risk-weighted assets 11.8 10.0 12.0 12.5 11.7 13.1 14.1 13.5
NPLs net of provisions to capital 11.4 8.3 13.8 11.5 11.6 12.9 12.1 12.1
Bank capital to assets 8.0 7.5 8.1 8.2 7.8 8.7 9.1 8.9
Asset composition and quality
NPLs to gross loans (nonfinancial sector) 5.2 4.4 7.9 8.8 8.2 8.8 8.5 8.1 8.2
Sectoral distribution of loans to nonfinancial sector
Loans to households 59.3 62.0 65.3 68.0 66.4 65.7 66.1 65.6 65.8
Loans to non-financial corporations 40.3 37.6 34.3 31.5 33.1 33.7 33.3 33.7 33.6
Earnings and profitability
Return on average assets (after tax) 1.7 1.5 0.8 1.0 1.3 1.2 1.1 1.1 1.1
Return on average equity (after tax) 1/ 22.4 20.7 11.2 13.3 16.1 14.0 12.1 12.4
Interest margin to gross income 59.4 55.7 51.9 53.0 55.8 55.0 56.1 58.2 57.0Noninterest expenses to gross income 68.7 58.4 58.5 56.0 54.5 54.5 57.2 54.9 55.0
Liquidity
Liquid assets to total assets (liquid assets ratio) 17.1 17.0 20.3 20.8 19.5 20.9 21.4 20.6 20.3Liquid assets to total short-term liabilities 24.2 25.3 29.8 31.2 28.8 31.1 31.7 30.6 30.3Loans to deposits 98.0 112.6 109.2 114.5 119.8 117.7 115.7 112.9 112.8
Sensitivity to market risk
Net open positions in FX to capital 1/ 0.6 0.0 2.7 0.3 -0.3 0.2 -0.1 0.2
Sources: NBP and KNF.
Note: Data according to Financial Soundness Indicators (FSI), except for asset composition and quality (indicators not part of FSI reporting template).
1/ Data for domestic banking sector (since 2014: Bank Gospodarstwa Krajowego excluded). Since 2014: data on capital in accordance with
CRDIV/CRR (not yet available for 2015Q1 as of May 5, 2015).

REPUBLIC OF POLAND
44 INTERNATIONAL MONETARY FUND
Table 6. Republic of Poland: 2013 FSAP Recommendations and Current Status1/
Key Recommendations Status
Addressing impaired loans: (i) intensify oversight
of credit risk management and restructuring
practices; (ii) standardize and enhance transparency
of bank accounting practices; and (iii) standardize
debt-to-income (DTI) ratio calculation.
The Polish KNF intensified oversight of credit risk
management and restructuring practices through
an AQR, following ECB methodology for the euro
area AQR. This included on-site credit file review.
Following the AQR, KNF addressed a letter to
banks, highlighting expectations, including about
quality of data used for calculation of impairment
charges and use of models for exposure valuation.
This aimed at standardizing and enhancing
transparency of bank accounting practices.
DTI limits are set by the banks. Recommendations
specify how DTI ratios should be calculated. The
process of determining DTIs by banks is subject to
offsite and onsite examinations by KNF.
Strengthening banking supervision: (i) expand
the scope for KNF to issue legally binding
prudential regulations; (ii) allow KNF's Board to
delegate administrative and procedural decisions to
its management, increase KNF independence, and
address other governance issues; and (iii) increase
KNF flexibility to allocate budgetary and staff
resources and enhance its analytical capabilities.
Pending.
According to the Polish constitution, KNF cannot
issue legally binding, general acts (regulations).
However, KNF can issue recommendations
regarding risk management, specifying how banks
should mitigate risk.
Strengthening credit unions: (i) eliminate the dual
supervision; require a solvency ratio of 8 percent in
5 years; and clarify the governance of the
stabilization fund; (ii) develop an inclusive set of
SKOK regulations and apply accounting principles
for financial institutions to SKOKs; and (iii) develop
capital rehabilitation plans for financially weak
SKOKs.
Rehabilitation plans are being developed with
41 of 50 SKOKs obliged to prepare recovery plans.
Last year, 2 credit unions went bankrupt, 2 credit
unions were taken over by commercial banks, and
one merger took place.
Developing sound macroprudential policies:
(i) ensure the macroprudential supervisory law
provides for Systemic Risk Board’s (SRB)
independence (with a leading role for NBP),
accountability to Parliament, and power to make
recommendations coupled with an "act or explain"
mechanism; and (ii) develop clear macroprudential
policy objectives that are distinct from those of
monetary and microprudential supervisory policy.
A law on macroprudential supervision is
progressing. According to the draft law, a
macroprudential committee (comprising
chairpersons of the NBP, the Ministry of Finance,
KNF, and Bankowy Fundusz Gwarancyjny (BFG))
will be a designated authority in Poland. The draft
entrusts macroprudential supervision to the
Financial Stability Committee (FSC) and not to the
SRB as previously envisaged. As such, the FSC will
combine functions of macroprudential supervision
and crisis management. 1/
See “Republic of Poland: Financial System Stability Assessment,” IMF Country Report No. 13/221, 2013.
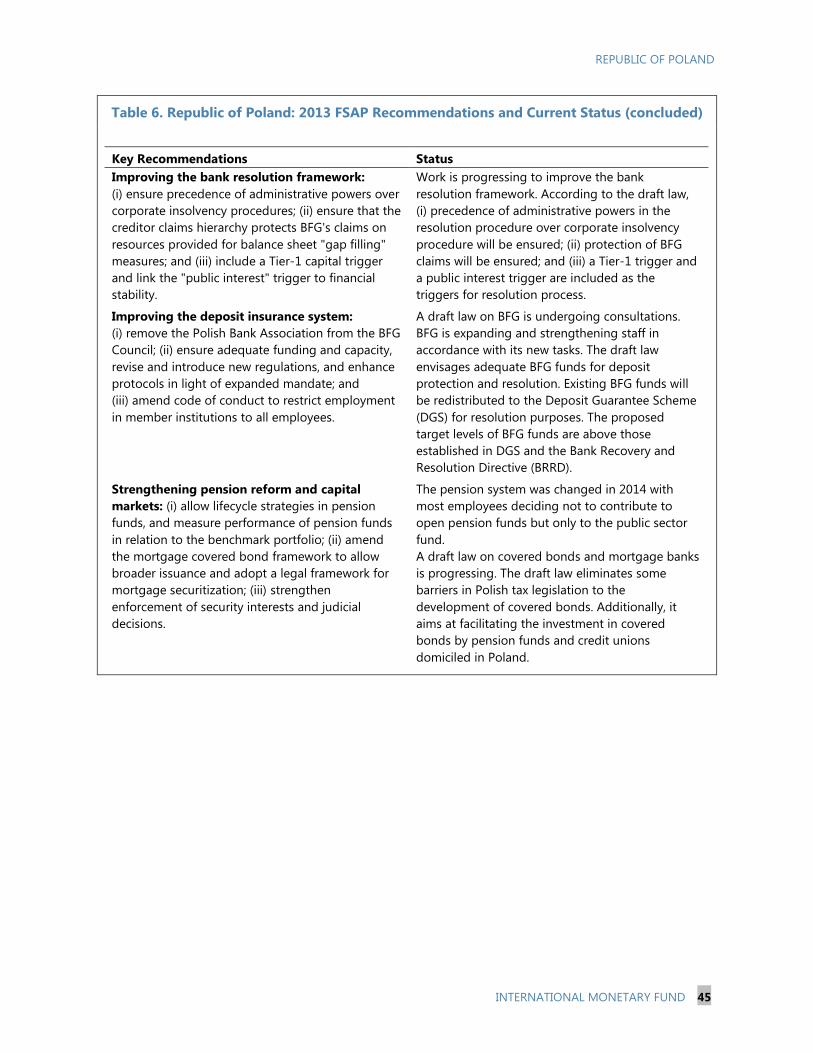
REPUBLIC OF POLAND
INTERNATIONAL MONETARY FUND 45
Table 6. Republic of Poland: 2013 FSAP Recommendations and Current Status (concluded)
Key Recommendations Status
Improving the bank resolution framework:
(i) ensure precedence of administrative powers over
corporate insolvency procedures; (ii) ensure that the
creditor claims hierarchy protects BFG's claims on
resources provided for balance sheet "gap filling"
measures; and (iii) include a Tier-1 capital trigger
and link the "public interest" trigger to financial
stability.
Work is progressing to improve the bank
resolution framework. According to the draft law,
(i) precedence of administrative powers in the
resolution procedure over corporate insolvency
procedure will be ensured; (ii) protection of BFG
claims will be ensured; and (iii) a Tier-1 trigger and
a public interest trigger are included as the
triggers for resolution process.
Improving the deposit insurance system:
(i) remove the Polish Bank Association from the BFG
Council; (ii) ensure adequate funding and capacity,
revise and introduce new regulations, and enhance
protocols in light of expanded mandate; and
(iii) amend code of conduct to restrict employment
in member institutions to all employees.
A draft law on BFG is undergoing consultations.
BFG is expanding and strengthening staff in
accordance with its new tasks. The draft law
envisages adequate BFG funds for deposit
protection and resolution. Existing BFG funds will
be redistributed to the Deposit Guarantee Scheme
(DGS) for resolution purposes. The proposed
target levels of BFG funds are above those
established in DGS and the Bank Recovery and
Resolution Directive (BRRD).
Strengthening pension reform and capital
markets: (i) allow lifecycle strategies in pension
funds, and measure performance of pension funds
in relation to the benchmark portfolio; (ii) amend
the mortgage covered bond framework to allow
broader issuance and adopt a legal framework for
mortgage securitization; (iii) strengthen
enforcement of security interests and judicial
decisions.
The pension system was changed in 2014 with
most employees deciding not to contribute to
open pension funds but only to the public sector
fund.
A draft law on covered bonds and mortgage banks
is progressing. The draft law eliminates some
barriers in Polish tax legislation to the
development of covered bonds. Additionally, it
aims at facilitating the investment in covered
bonds by pension funds and credit unions
domiciled in Poland.
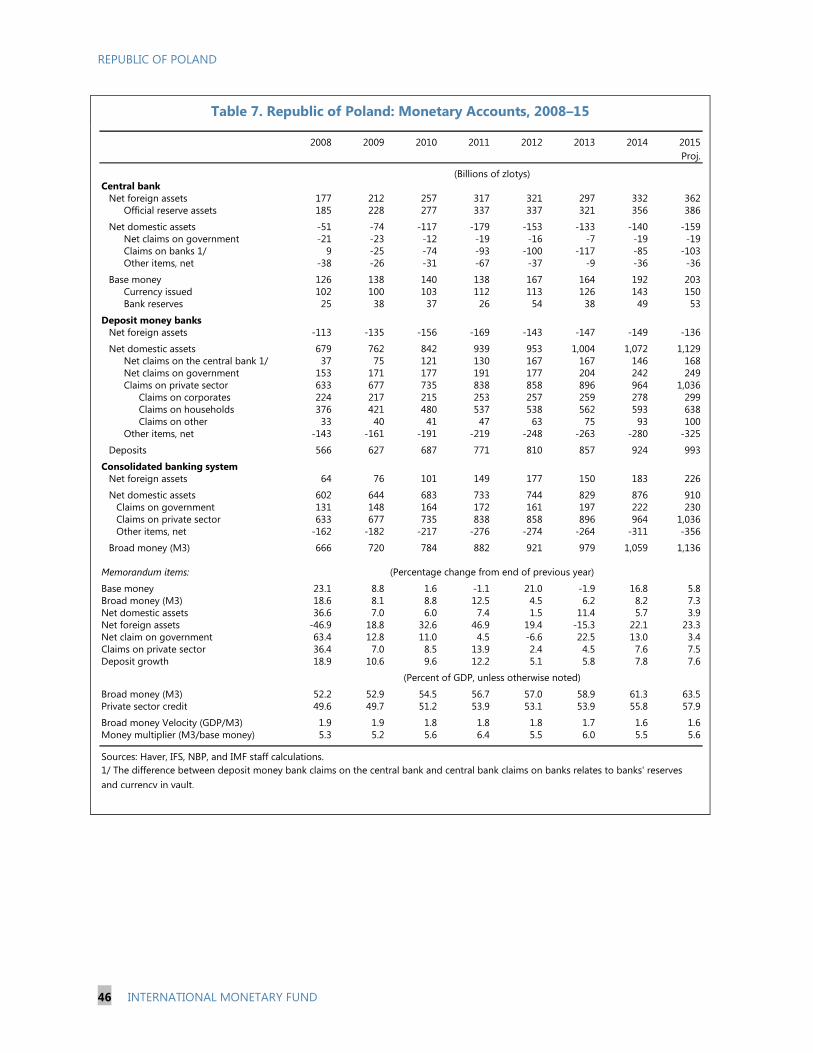
REPUBLIC OF POLAND
46 INTERNATIONAL MONETARY FUND
Table 7. Republic of Poland: Monetary Accounts, 2008–15
2008 2009 2010 2011 2012 2013 2014 2015
Proj.
Central bank
Net foreign assets 177 212 257 317 321 297 332 362
Official reserve assets 185 228 277 337 337 321 356 386
Net domestic assets -51 -74 -117 -179 -153 -133 -140 -159
Net claims on government -21 -23 -12 -19 -16 -7 -19 -19
Claims on banks 1/ 9 -25 -74 -93 -100 -117 -85 -103
Other items, net -38 -26 -31 -67 -37 -9 -36 -36
Base money 126 138 140 138 167 164 192 203
Currency issued 102 100 103 112 113 126 143 150
Bank reserves 25 38 37 26 54 38 49 53
Deposit money banks
Net foreign assets -113 -135 -156 -169 -143 -147 -149 -136
Net domestic assets 679 762 842 939 953 1,004 1,072 1,129
Net claims on the central bank 1/ 37 75 121 130 167 167 146 168
Net claims on government 153 171 177 191 177 204 242 249
Claims on private sector 633 677 735 838 858 896 964 1,036
Claims on corporates 224 217 215 253 257 259 278 299
Claims on households 376 421 480 537 538 562 593 638
Claims on other 33 40 41 47 63 75 93 100
Other items, net -143 -161 -191 -219 -248 -263 -280 -325
Deposits 566 627 687 771 810 857 924 993
Consolidated banking system
Net foreign assets 64 76 101 149 177 150 183 226
Net domestic assets 602 644 683 733 744 829 876 910
Claims on government 131 148 164 172 161 197 222 230
Claims on private sector 633 677 735 838 858 896 964 1,036
Other items, net -162 -182 -217 -276 -274 -264 -311 -356
Broad money (M3) 666 720 784 882 921 979 1,059 1,136
Memorandum items:
Base money 23.1 8.8 1.6 -1.1 21.0 -1.9 16.8 5.8
Broad money (M3) 18.6 8.1 8.8 12.5 4.5 6.2 8.2 7.3
Net domestic assets 36.6 7.0 6.0 7.4 1.5 11.4 5.7 3.9
Net foreign assets -46.9 18.8 32.6 46.9 19.4 -15.3 22.1 23.3
Net claim on government 63.4 12.8 11.0 4.5 -6.6 22.5 13.0 3.4
Claims on private sector 36.4 7.0 8.5 13.9 2.4 4.5 7.6 7.5
Deposit growth 18.9 10.6 9.6 12.2 5.1 5.8 7.8 7.6
Broad money (M3) 52.2 52.9 54.5 56.7 57.0 58.9 61.3 63.5
Private sector credit 49.6 49.7 51.2 53.9 53.1 53.9 55.8 57.9
Broad money Velocity (GDP/M3) 1.9 1.9 1.8 1.8 1.8 1.7 1.6 1.6
Money multiplier (M3/base money) 5.3 5.2 5.6 6.4 5.5 6.0 5.5 5.6
Sources: Haver, IFS, NBP, and IMF staff calculations.
1/ The difference between deposit money bank claims on the central bank and central bank claims on banks relates to banks' reserves
and currency in vault.
(Billions of zlotys)
(Percentage change from end of previous year)
(Percent of GDP, unless otherwise noted)
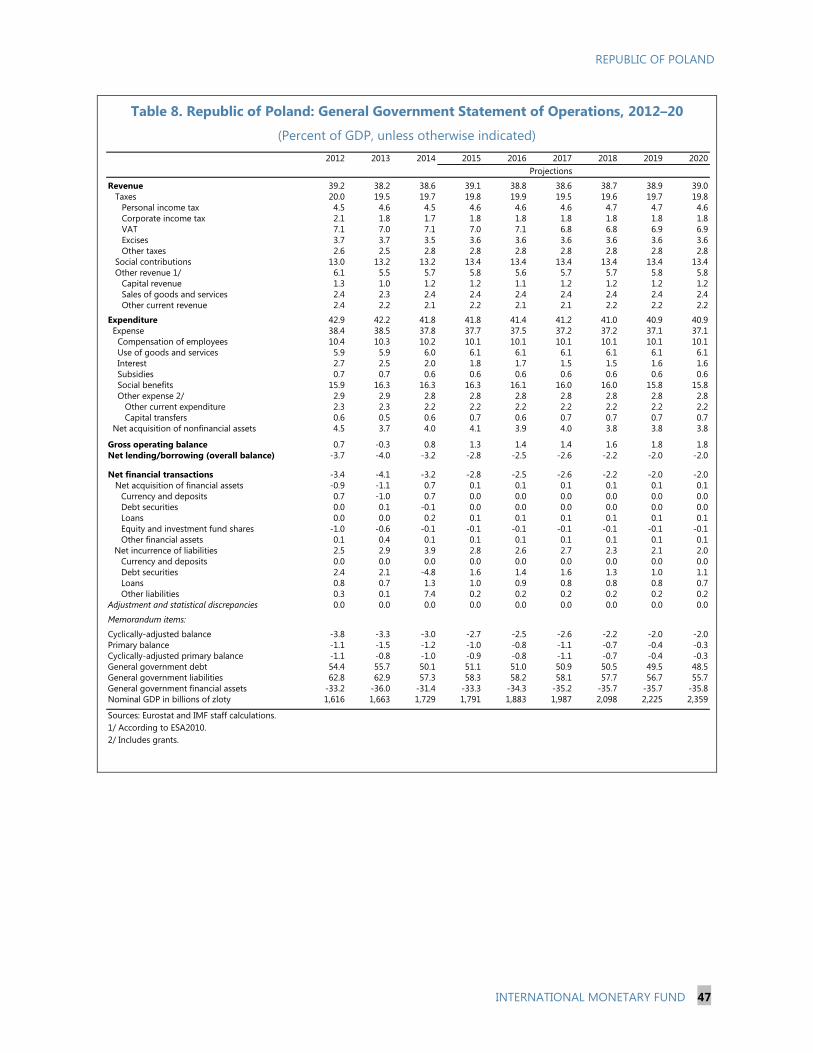
REPUBLIC OF POLAND
INTERNATIONAL MONETARY FUND 47
Table 8. Republic of Poland: General Government Statement of Operations, 2012–20
(Percent of GDP, unless otherwise indicated)
2012 2013 2014 2015 2016 2017 2018 2019 2020
Revenue 39.2 38.2 38.6 39.1 38.8 38.6 38.7 38.9 39.0
Taxes 20.0 19.5 19.7 19.8 19.9 19.5 19.6 19.7 19.8
Personal income tax 4.5 4.6 4.5 4.6 4.6 4.6 4.7 4.7 4.6
Corporate income tax 2.1 1.8 1.7 1.8 1.8 1.8 1.8 1.8 1.8
VAT 7.1 7.0 7.1 7.0 7.1 6.8 6.8 6.9 6.9
Excises 3.7 3.7 3.5 3.6 3.6 3.6 3.6 3.6 3.6
Other taxes 2.6 2.5 2.8 2.8 2.8 2.8 2.8 2.8 2.8
Social contributions 13.0 13.2 13.2 13.4 13.4 13.4 13.4 13.4 13.4
Other revenue 1/ 6.1 5.5 5.7 5.8 5.6 5.7 5.7 5.8 5.8
Capital revenue 1.3 1.0 1.2 1.2 1.1 1.2 1.2 1.2 1.2
Sales of goods and services 2.4 2.3 2.4 2.4 2.4 2.4 2.4 2.4 2.4
Other current revenue 2.4 2.2 2.1 2.2 2.1 2.1 2.2 2.2 2.2
Expenditure 42.9 42.2 41.8 41.8 41.4 41.2 41.0 40.9 40.9
Expense 38.4 38.5 37.8 37.7 37.5 37.2 37.2 37.1 37.1
Compensation of employees 10.4 10.3 10.2 10.1 10.1 10.1 10.1 10.1 10.1
Use of goods and services 5.9 5.9 6.0 6.1 6.1 6.1 6.1 6.1 6.1
Interest 2.7 2.5 2.0 1.8 1.7 1.5 1.5 1.6 1.6
Subsidies 0.7 0.7 0.6 0.6 0.6 0.6 0.6 0.6 0.6
Social benefits 15.9 16.3 16.3 16.3 16.1 16.0 16.0 15.8 15.8
Other expense 2/ 2.9 2.9 2.8 2.8 2.8 2.8 2.8 2.8 2.8
Other current expenditure 2.3 2.3 2.2 2.2 2.2 2.2 2.2 2.2 2.2
Capital transfers 0.6 0.5 0.6 0.7 0.6 0.7 0.7 0.7 0.7
Net acquisition of nonfinancial assets 4.5 3.7 4.0 4.1 3.9 4.0 3.8 3.8 3.8
Gross operating balance 0.7 -0.3 0.8 1.3 1.4 1.4 1.6 1.8 1.8
Net lending/borrowing (overall balance) -3.7 -4.0 -3.2 -2.8 -2.5 -2.6 -2.2 -2.0 -2.0
Net financial transactions -3.4 -4.1 -3.2 -2.8 -2.5 -2.6 -2.2 -2.0 -2.0
Net acquisition of financial assets -0.9 -1.1 0.7 0.1 0.1 0.1 0.1 0.1 0.1
Currency and deposits 0.7 -1.0 0.7 0.0 0.0 0.0 0.0 0.0 0.0
Debt securities 0.0 0.1 -0.1 0.0 0.0 0.0 0.0 0.0 0.0
Loans 0.0 0.0 0.2 0.1 0.1 0.1 0.1 0.1 0.1
Equity and investment fund shares -1.0 -0.6 -0.1 -0.1 -0.1 -0.1 -0.1 -0.1 -0.1
Other financial assets 0.1 0.4 0.1 0.1 0.1 0.1 0.1 0.1 0.1
Net incurrence of liabilities 2.5 2.9 3.9 2.8 2.6 2.7 2.3 2.1 2.0
Currency and deposits 0.0 0.0 0.0 0.0 0.0 0.0 0.0 0.0 0.0
Debt securities 2.4 2.1 -4.8 1.6 1.4 1.6 1.3 1.0 1.1
Loans 0.8 0.7 1.3 1.0 0.9 0.8 0.8 0.8 0.7
Other liabilities 0.3 0.1 7.4 0.2 0.2 0.2 0.2 0.2 0.2
Adjustment and statistical discrepancies 0.0 0.0 0.0 0.0 0.0 0.0 0.0 0.0 0.0
Memorandum items:
Cyclically-adjusted balance -3.8 -3.3 -3.0 -2.7 -2.5 -2.6 -2.2 -2.0 -2.0
Primary balance -1.1 -1.5 -1.2 -1.0 -0.8 -1.1 -0.7 -0.4 -0.3
Cyclically-adjusted primary balance -1.1 -0.8 -1.0 -0.9 -0.8 -1.1 -0.7 -0.4 -0.3
General government debt 54.4 55.7 50.1 51.1 51.0 50.9 50.5 49.5 48.5
General government liabilities 62.8 62.9 57.3 58.3 58.2 58.1 57.7 56.7 55.7
General government financial assets -33.2 -36.0 -31.4 -33.3 -34.3 -35.2 -35.7 -35.7 -35.8
Nominal GDP in billions of zloty 1,616 1,663 1,729 1,791 1,883 1,987 2,098 2,225 2,359
Sources: Eurostat and IMF staff calculations.
1/ According to ESA2010.
2/ Includes grants.
Projections
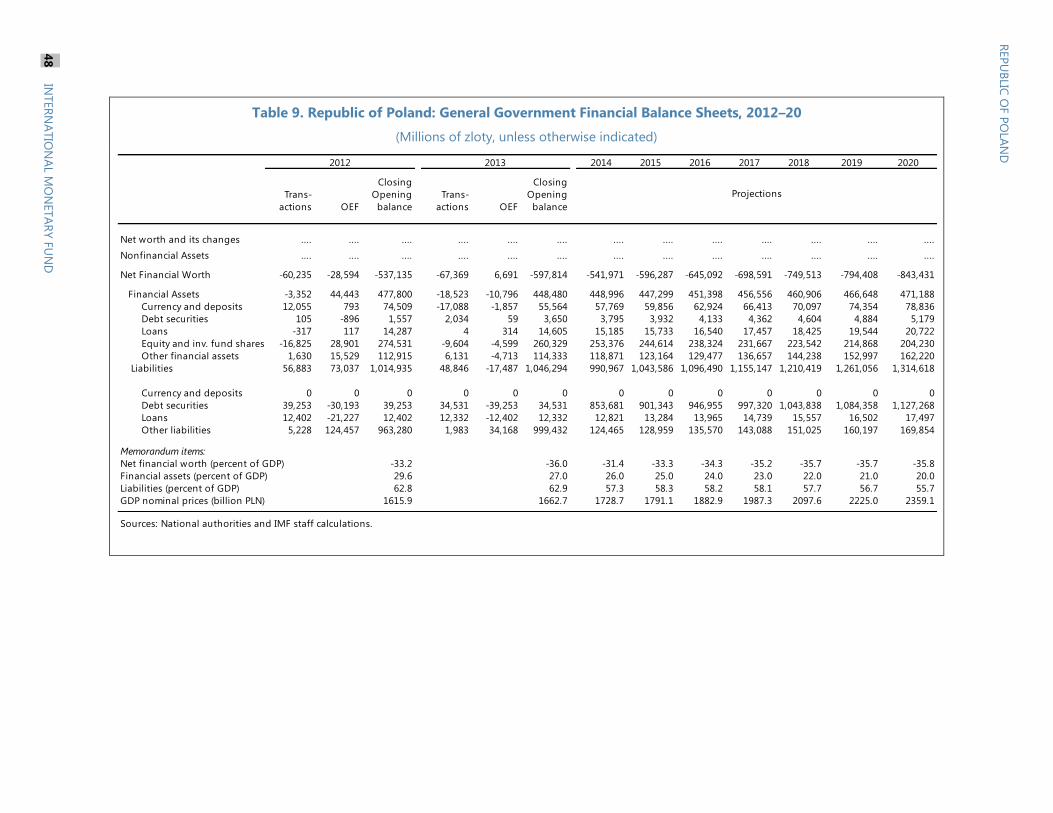
Table 9. Republic of Poland: General Government Financial Balance Sheets, 2012–20
(Millions of zloty, unless otherwise indicated)
REP
UB
LIC O
F P
OLA
ND
48
IN
TER
NA
TIO
NA
L MO
NETA
RY F
UN
D
2014 2015 2016 2017 2018 2019 2020
Trans-
actions OEF
Closing
Opening
balance
Trans-
actions OEF
Closing
Opening
balance
Net worth and its changes .... .... .... .... .... .... .... .... .... .... .... .... ....
Nonfinancial Assets .... .... .... .... .... .... .... .... .... .... .... .... ....
Net Financial Worth -60,235 -28,594 -537,135 -67,369 6,691 -597,814 -541,971 -596,287 -645,092 -698,591 -749,513 -794,408 -843,431
Financial Assets -3,352 44,443 477,800 -18,523 -10,796 448,480 448,996 447,299 451,398 456,556 460,906 466,648 471,188
Currency and deposits 12,055 793 74,509 -17,088 -1,857 55,564 57,769 59,856 62,924 66,413 70,097 74,354 78,836
Debt securities 105 -896 1,557 2,034 59 3,650 3,795 3,932 4,133 4,362 4,604 4,884 5,179
Loans -317 117 14,287 4 314 14,605 15,185 15,733 16,540 17,457 18,425 19,544 20,722
Equity and inv. fund shares -16,825 28,901 274,531 -9,604 -4,599 260,329 253,376 244,614 238,324 231,667 223,542 214,868 204,230
Other financial assets 1,630 15,529 112,915 6,131 -4,713 114,333 118,871 123,164 129,477 136,657 144,238 152,997 162,220
Liabilities 56,883 73,037 1,014,935 48,846 -17,487 1,046,294 990,967 1,043,586 1,096,490 1,155,147 1,210,419 1,261,056 1,314,618
Currency and deposits 0 0 0 0 0 0 0 0 0 0 0 0 0
Debt securities 39,253 -30,193 39,253 34,531 -39,253 34,531 853,681 901,343 946,955 997,320 1,043,838 1,084,358 1,127,268
Loans 12,402 -21,227 12,402 12,332 -12,402 12,332 12,821 13,284 13,965 14,739 15,557 16,502 17,497
Other liabilities 5,228 124,457 963,280 1,983 34,168 999,432 124,465 128,959 135,570 143,088 151,025 160,197 169,854
Memorandum items:
Net financial worth (percent of GDP) -33.2 -36.0 -31.4 -33.3 -34.3 -35.2 -35.7 -35.7 -35.8
Financial assets (percent of GDP) 29.6 27.0 26.0 25.0 24.0 23.0 22.0 21.0 20.0
Liabilities (percent of GDP) 62.8 62.9 57.3 58.3 58.2 58.1 57.7 56.7 55.7
GDP nominal prices (billion PLN) 1615.9 1662.7 1728.7 1791.1 1882.9 1987.3 2097.6 2225.0 2359.1
Sources: National authorities and IMF staff calculations.
Projections
2012 2013
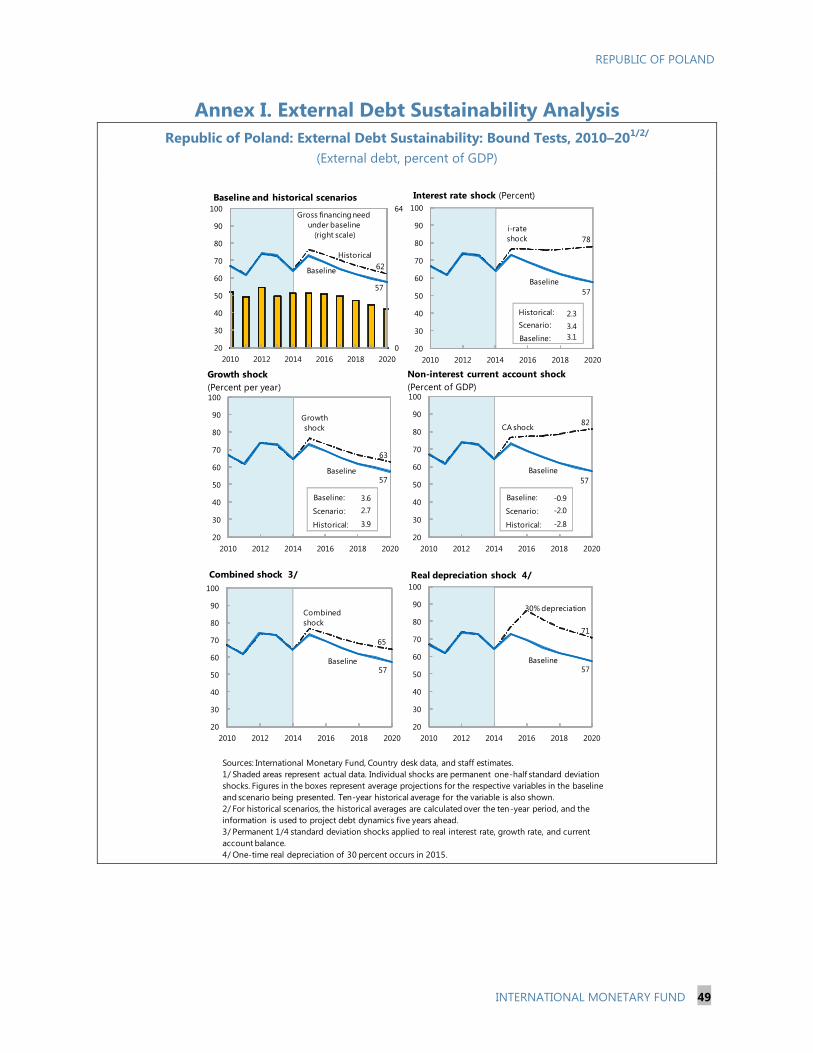
REPUBLIC OF POLAND
INTERNATIONAL MONETARY FUND 49
Annex I. External Debt Sustainability Analysis
Republic of Poland: External Debt Sustainability: Bound Tests, 2010–201/2/
(External debt, percent of GDP)
i-rate
shock 78
Baseline
57
20
30
40
50
60
70
80
90
100
2010 2012 2014 2016 2018 2020
Interest rate shock (Percent)
Sources: International Monetary Fund, Country desk data, and staff estimates.
1/ Shaded areas represent actual data. Individual shocks are permanent one-half standard deviation
shocks. Figures in the boxes represent average projections for the respective variables in the baseline
and scenario being presented. Ten-year historical average for the variable is also shown.
2/ For historical scenarios, the historical averages are calculated over the ten-year period, and the
information is used to project debt dynamics five years ahead.
3/ Permanent 1/4 standard deviation shocks applied to real interest rate, growth rate, and current
account balance.
4/ One-time real depreciation of 30 percent occurs in 2015.
Historical
62Baseline
57
0
64
20
30
40
50
60
70
80
90
100
2010 2012 2014 2016 2018 2020
Baseline and historical scenarios
CA shock 82
Baseline
57
20
30
40
50
60
70
80
90
100
2010 2012 2014 2016 2018 2020
65
Baseline57
20
30
40
50
60
70
80
90
100
2010 2012 2014 2016 2018 2020
Combined shock 3/
Combined
shock71
Baseline57
20
30
40
50
60
70
80
90
100
2010 2012 2014 2016 2018 2020
Real depreciation shock 4/
30% depreciation
Gross financing need
under baseline
(right scale)
Non-interest current account shock
(Percent of GDP)
Growth
shock
63
Baseline57
20
30
40
50
60
70
80
90
100
2010 2012 2014 2016 2018 2020
Baseline:
Scenario:
Historical:
3.1
3.4
2.3
Baseline:
Scenario:
Historical:
3.6
2.7
3.9
Baseline:
Scenario:
Historical:
-0.9
-2.0
-2.8
Growth shock
(Percent per year)
REP
UB
LIC O
F P
OLA
ND
REP
UB
LIC O
F P
OLA
ND
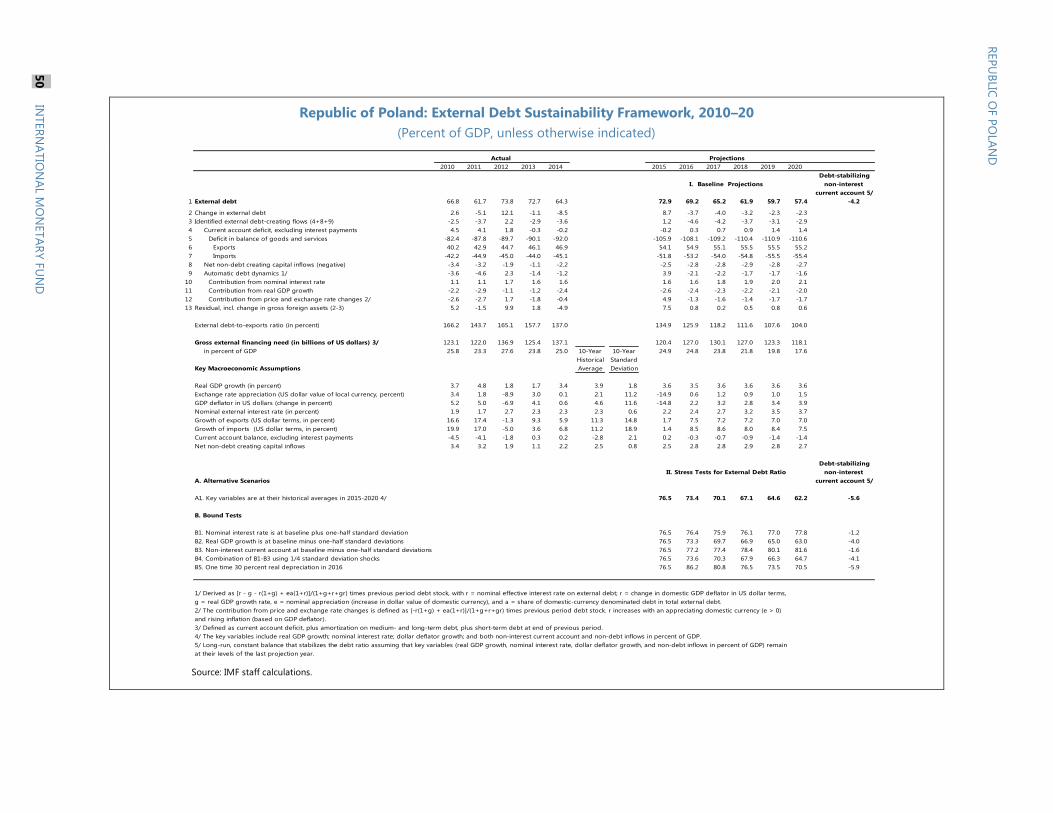
Republic of Poland: External Debt Sustainability Framework, 2010–20
(Percent of GDP, unless otherwise indicated)
Source: IMF staff calculations.
2010 2011 2012 2013 2014 2015 2016 2017 2018 2019 2020
Debt-stabilizing
non-interest
current account 5/
1 External debt 66.8 61.7 73.8 72.7 64.3 72.9 69.2 65.2 61.9 59.7 57.4 -4.2
2 Change in external debt 2.6 -5.1 12.1 -1.1 -8.5 8.7 -3.7 -4.0 -3.2 -2.3 -2.3
3 Identified external debt-creating flows (4+8+9) -2.5 -3.7 2.2 -2.9 -3.6 1.2 -4.6 -4.2 -3.7 -3.1 -2.9
4 Current account deficit, excluding interest payments 4.5 4.1 1.8 -0.3 -0.2 -0.2 0.3 0.7 0.9 1.4 1.4
5 Deficit in balance of goods and services -82.4 -87.8 -89.7 -90.1 -92.0 -105.9 -108.1 -109.2 -110.4 -110.9 -110.6
6 Exports 40.2 42.9 44.7 46.1 46.9 54.1 54.9 55.1 55.5 55.5 55.2
7 Imports -42.2 -44.9 -45.0 -44.0 -45.1 -51.8 -53.2 -54.0 -54.8 -55.5 -55.4
8 Net non-debt creating capital inflows (negative) -3.4 -3.2 -1.9 -1.1 -2.2 -2.5 -2.8 -2.8 -2.9 -2.8 -2.7
9 Automatic debt dynamics 1/ -3.6 -4.6 2.3 -1.4 -1.2 3.9 -2.1 -2.2 -1.7 -1.7 -1.6
10 Contribution from nominal interest rate 1.1 1.1 1.7 1.6 1.6 1.6 1.6 1.8 1.9 2.0 2.1
11 Contribution from real GDP growth -2.2 -2.9 -1.1 -1.2 -2.4 -2.6 -2.4 -2.3 -2.2 -2.1 -2.0
12 Contribution from price and exchange rate changes 2/ -2.6 -2.7 1.7 -1.8 -0.4 4.9 -1.3 -1.6 -1.4 -1.7 -1.7
13 Residual, incl. change in gross foreign assets (2-3) 5.2 -1.5 9.9 1.8 -4.9 7.5 0.8 0.2 0.5 0.8 0.6
External debt-to-exports ratio (in percent) 166.2 143.7 165.1 157.7 137.0 134.9 125.9 118.2 111.6 107.6 104.0
Gross external financing need (in billions of US dollars) 3/ 123.1 122.0 136.9 125.4 137.1 120.4 127.0 130.1 127.0 123.3 118.1
in percent of GDP 25.8 23.3 27.6 23.8 25.0 10-Year 10-Year 24.9 24.8 23.8 21.8 19.8 17.6
Historical Standard
Key Macroeconomic Assumptions Average Deviation
Real GDP growth (in percent) 3.7 4.8 1.8 1.7 3.4 3.9 1.8 3.6 3.5 3.6 3.6 3.6 3.6
Exchange rate appreciation (US dollar value of local currency, percent) 3.4 1.8 -8.9 3.0 0.1 2.1 11.2 -14.9 0.6 1.2 0.9 1.0 1.5
GDP deflator in US dollars (change in percent) 5.2 5.0 -6.9 4.1 0.6 4.6 11.6 -14.8 2.2 3.2 2.8 3.4 3.9
Nominal external interest rate (in percent) 1.9 1.7 2.7 2.3 2.3 2.3 0.6 2.2 2.4 2.7 3.2 3.5 3.7
Growth of exports (US dollar terms, in percent) 16.6 17.4 -1.3 9.3 5.9 11.3 14.8 1.7 7.5 7.2 7.2 7.0 7.0
Growth of imports (US dollar terms, in percent) 19.9 17.0 -5.0 3.6 6.8 11.2 18.9 1.4 8.5 8.6 8.0 8.4 7.5
Current account balance, excluding interest payments -4.5 -4.1 -1.8 0.3 0.2 -2.8 2.1 0.2 -0.3 -0.7 -0.9 -1.4 -1.4
Net non-debt creating capital inflows 3.4 3.2 1.9 1.1 2.2 2.5 0.8 2.5 2.8 2.8 2.9 2.8 2.7
Debt-stabilizing
non-interest
A. Alternative Scenarios current account 5/
A1. Key variables are at their historical averages in 2015-2020 4/ 76.5 73.4 70.1 67.1 64.6 62.2 -5.6
B. Bound Tests
B1. Nominal interest rate is at baseline plus one-half standard deviation 76.5 76.4 75.9 76.1 77.0 77.8 -1.2
B2. Real GDP growth is at baseline minus one-half standard deviations 76.5 73.3 69.7 66.9 65.0 63.0 -4.0
B3. Non-interest current account at baseline minus one-half standard deviations 76.5 77.2 77.4 78.4 80.1 81.6 -1.6
B4. Combination of B1-B3 using 1/4 standard deviation shocks 76.5 73.6 70.3 67.9 66.3 64.7 -4.1
B5. One time 30 percent real depreciation in 2016 76.5 86.2 80.8 76.5 73.5 70.5 -5.9
1/ Derived as [r - g - r(1+g) + ea(1+r)]/(1+g+r+gr) times previous period debt stock, with r = nominal effective interest rate on external debt; r = change in domestic GDP deflator in US dollar terms,
g = real GDP growth rate, e = nominal appreciation (increase in dollar value of domestic currency), and a = share of domestic-currency denominated debt in total external debt.
2/ The contribution from price and exchange rate changes is defined as [-r(1+g) + ea(1+r)]/(1+g+r+gr) times previous period debt stock. r increases with an appreciating domestic currency (e > 0)
and rising inflation (based on GDP deflator).
3/ Defined as current account deficit, plus amortization on medium- and long-term debt, plus short-term debt at end of previous period.
4/ The key variables include real GDP growth; nominal interest rate; dollar deflator growth; and both non-interest current account and non-debt inflows in percent of GDP.
5/ Long-run, constant balance that stabilizes the debt ratio assuming that key variables (real GDP growth, nominal interest rate, dollar deflator growth, and non-debt inflows in percent of GDP) remain
at their levels of the last projection year.
Actual
I. Baseline Projections
II. Stress Tests for External Debt Ratio
Projections
REP
UB
LIC O
F P
OLA
ND
50
IN
TER
NA
TIO
NA
L MO
NETA
RY F
UN
D

REPUBLIC OF POLAND
INTERNATIONAL MONETARY FUND 51
Annex II. Public Sector Debt Sustainability Analysis
Public debt is moderately high but sustainable. Its structure and risk profile in terms of interest,
rollover, and foreign currency risks is robust, and contingent liabilities are not deemed material. The
main risk to the debt outlook stems from a negative shock to GDP growth. In addition, a large share of
foreign investors in the domestic debt market entails a risk, albeit the favorable composition of the
investor base dominated by “real money” investors and the low share of debt at floating rates provide
some mitigating factors.
A. Baseline and Realism of Projections
Debt levels. The adoption of ESA2010 accounting standards resulted in a 1½ percentage point
decline in the recorded ratio of public debt to GDP to 55.7 percent at end-2013. A further one-off
drop to 50.1 percent of GDP in 2014 occurred as a result of the recent changes to the pension
system. Poland’s favorable public debt dynamics are underpinned by a decline in the primary deficit,
a favorable differential between projected GDP growth and the real interest rate, and the ongoing
effects of the changes to the pension system.
GDP growth. The projections assume continued robust GDP growth of around 3.6 percent during
2015–20. The output gap is expected to close next year. In recent years, staff projections of growth
have displayed small forecast errors, with some indication of a pessimistic bias relative to other
countries.
Fiscal adjustment. Under the baseline, the primary deficit is expected to decline from 1.2 percent of
GDP in 2014 to about balance during 2019‒20, reflecting modest fiscal measures already in the
pipeline, the changes to the pension system, and the gradual recovery in tax revenue (closer to
recent historical levels). In the recent past, staff forecast errors of the primary deficit in Poland have
not displayed an apparent bias and have been more conservative than for other countries. Overall,
the projected fiscal adjustment seems feasible, as indicated by cross country benchmarks.
Sovereign yields. The effective interest rate on public debt declined from 6.6 percent in 2005 to
5.9 percent in 2009 and further to about 5 percent in 2013, reflecting Poland’s strong fundamentals
and favorable global financial conditions. It is projected to decline to 3.6 percent by 2015. In recent
years, Poland has maintained access to capital markets on favorable terms, even during periods of
global financial distress. Yields on 10‒year bonds declined by 21 bps year-to-date to 2.31 percent in
March 2015, but have recently increased reflecting higher volatility in international market. In turn,
spreads over 10‒year German bonds reached 238 bps in June, while Emerging Market Bond Index
and CDS spreads increased to around 52.3 bps and 65 bps, respectively. While there is uncertainty
about the impact of the lift-off of U.S. interest rates on global market conditions, the pass-through
from interest increases to the budget would be very gradual, as about 80 percent of debt carries a
fixed interest rate and the average duration stands at about 5 years. Increases in Poland’s yields
could also be dampened by capital inflows in the domestic bond markets on the back of the ECB’s
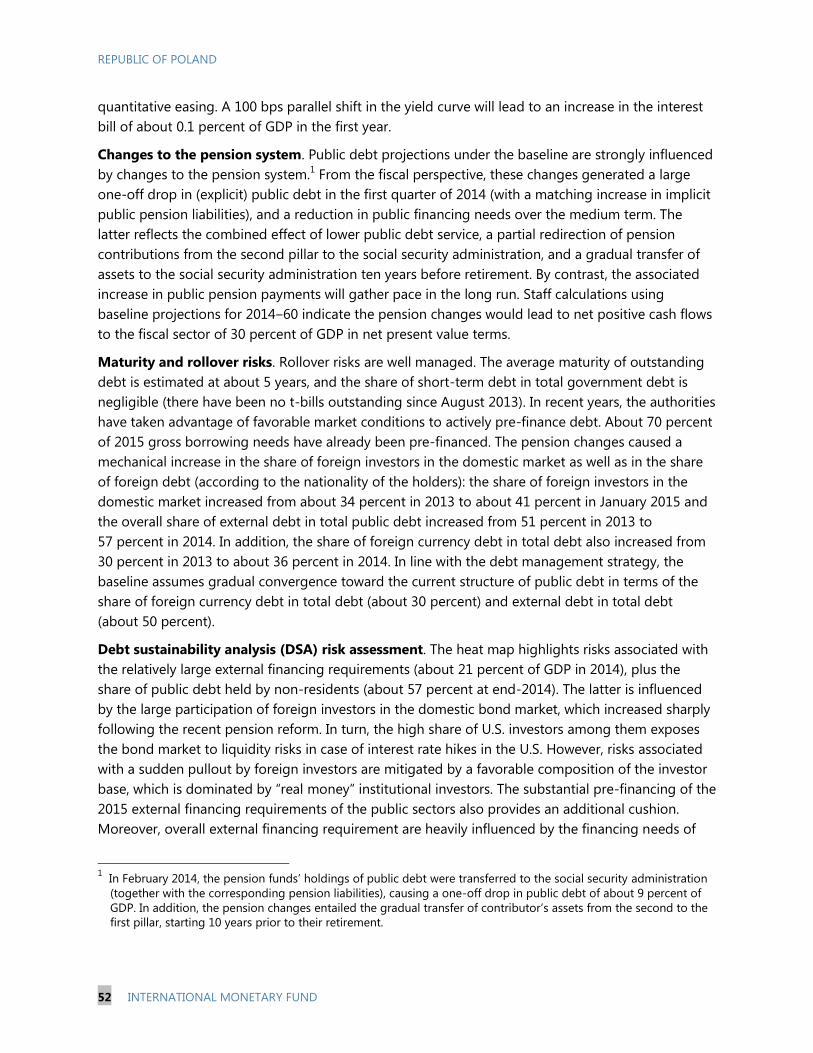
REPUBLIC OF POLAND
52 INTERNATIONAL MONETARY FUND
quantitative easing. A 100 bps parallel shift in the yield curve will lead to an increase in the interest
bill of about 0.1 percent of GDP in the first year.
Changes to the pension system. Public debt projections under the baseline are strongly influenced
by changes to the pension system.1 From the fiscal perspective, these changes generated a large
one-off drop in (explicit) public debt in the first quarter of 2014 (with a matching increase in implicit
public pension liabilities), and a reduction in public financing needs over the medium term. The
latter reflects the combined effect of lower public debt service, a partial redirection of pension
contributions from the second pillar to the social security administration, and a gradual transfer of
assets to the social security administration ten years before retirement. By contrast, the associated
increase in public pension payments will gather pace in the long run. Staff calculations using
baseline projections for 2014‒60 indicate the pension changes would lead to net positive cash flows
to the fiscal sector of 30 percent of GDP in net present value terms.
Maturity and rollover risks. Rollover risks are well managed. The average maturity of outstanding
debt is estimated at about 5 years, and the share of short-term debt in total government debt is
negligible (there have been no t-bills outstanding since August 2013). In recent years, the authorities
have taken advantage of favorable market conditions to actively pre-finance debt. About 70 percent
of 2015 gross borrowing needs have already been pre-financed. The pension changes caused a
mechanical increase in the share of foreign investors in the domestic market as well as in the share
of foreign debt (according to the nationality of the holders): the share of foreign investors in the
domestic market increased from about 34 percent in 2013 to about 41 percent in January 2015 and
the overall share of external debt in total public debt increased from 51 percent in 2013 to
57 percent in 2014. In addition, the share of foreign currency debt in total debt also increased from
30 percent in 2013 to about 36 percent in 2014. In line with the debt management strategy, the
baseline assumes gradual convergence toward the current structure of public debt in terms of the
share of foreign currency debt in total debt (about 30 percent) and external debt in total debt
(about 50 percent).
Debt sustainability analysis (DSA) risk assessment. The heat map highlights risks associated with
the relatively large external financing requirements (about 21 percent of GDP in 2014), plus the
share of public debt held by non-residents (about 57 percent at end-2014). The latter is influenced
by the large participation of foreign investors in the domestic bond market, which increased sharply
following the recent pension reform. In turn, the high share of U.S. investors among them exposes
the bond market to liquidity risks in case of interest rate hikes in the U.S. However, risks associated
with a sudden pullout by foreign investors are mitigated by a favorable composition of the investor
base, which is dominated by “real money” institutional investors. The substantial pre-financing of the
2015 external financing requirements of the public sectors also provides an additional cushion.
Moreover, overall external financing requirement are heavily influenced by the financing needs of
1 In February 2014, the pension funds’ holdings of public debt were transferred to the social security administration
(together with the corresponding pension liabilities), causing a one-off drop in public debt of about 9 percent of
GDP. In addition, the pension changes entailed the gradual transfer of contributor’s assets from the second to the
first pillar, starting 10 years prior to their retirement.

REPUBLIC OF POLAND
INTERNATIONAL MONETARY FUND 53
the private sector, which include a substantial share of cross-border, intercompany financing, which
tends to ameliorate the risk of a sudden stop.
Fan charts. The symmetric fan charts, which assume symmetric upside and downside risks, show
that public debt is more likely to enter a downward trajectory during the projection period. The
lower bands indicate that the debt-to-GDP ratio could drop to around 46 percent by 2020 with a
25 percent probability. On the other hand, the upper bands indicate that debt-to-GDP ratios could
surpass 60 percent by 2020 with a 10 percent probability. A more stringent exercise, however,
combining restrictions to the upside shocks to interest rates and GDP growth (200 bps and
1 percent, respectively), increases the probability of debt-to-GDP surpassing 55 percent in 2020 to
50 percent. This result is still commensurate with a sustainable debt path, but it illustrates the
degree of uncertainty around the baseline.
B. Shocks and Stress Tests
Primary balance shock. An assumed deterioration in the primary balance by 0.8 percentage points
during 2015–16 pushes up slightly the public debt-to-revenue ratio to about 135 percent during
2017–18 and opens up a gap of about 5 percentage points relative to the baseline. Gross financing
needs peak at about 10 percent of GDP in 2016 and converge to the baseline by 2020.
Growth shock. The stress scenario assumes a drop in GDP growth by 1.8 percentage points in two
consecutive years (2016‒17) relative to the baseline, combined with a 0.5 percent drop in inflation
and deterioration in the primary balance by 0.8 percent in 2016 and further by 1.8 percent in 2017.
Under these assumptions, public debt increases to about 55.7 percent of GDP in 2017 before
trending downward to about 53.2 percent of GDP by 2020. Gross financing needs increase to about
10 percent of GDP during 2016‒17, but then converge toward the baseline in the outer years.
Interest rate shock. A permanent 200 bps increase in the nominal interest rate starting in 2016
(equivalent to the difference between the maximum real interest rate during 2004‒14 and the
average real interest rate over the projection period), leads to an increase in the effective interest
rate on debt by 40 bps in 2017 (compared to the baseline) and further gradual increases to 130 bps
by 2020. Under this scenario, public debt dynamics deteriorate marginally relative to the baseline,
with debt remaining around 50 percent of GDP throughout the projection horizon.
Exchange rate shock: The combined shock also assumes an exchange rate depreciation of about
20 percent in 2016 (from 3.6 PLN/US$ to 4.3 PLN/US$), calibrated to emulate the maximum historic
movement of the FX rate over the last 10 years. Under this scenario, gross public debt increases by
1 percentage point to about 52 percent of GDP in 2016 before trending down to about 49 percent
by 2020. The resilience reflects the predominance of public debt in local currency.
Combined shock. Under the combined shock, the public-debt-to-GDP ratio jumps to about
59.3 percent in 2018 and declines gradually afterward. In turn, gross financing needs increase to
about 10.4 percent of GDP in 2017, and remain around 9 percent of GDP in the outer years.
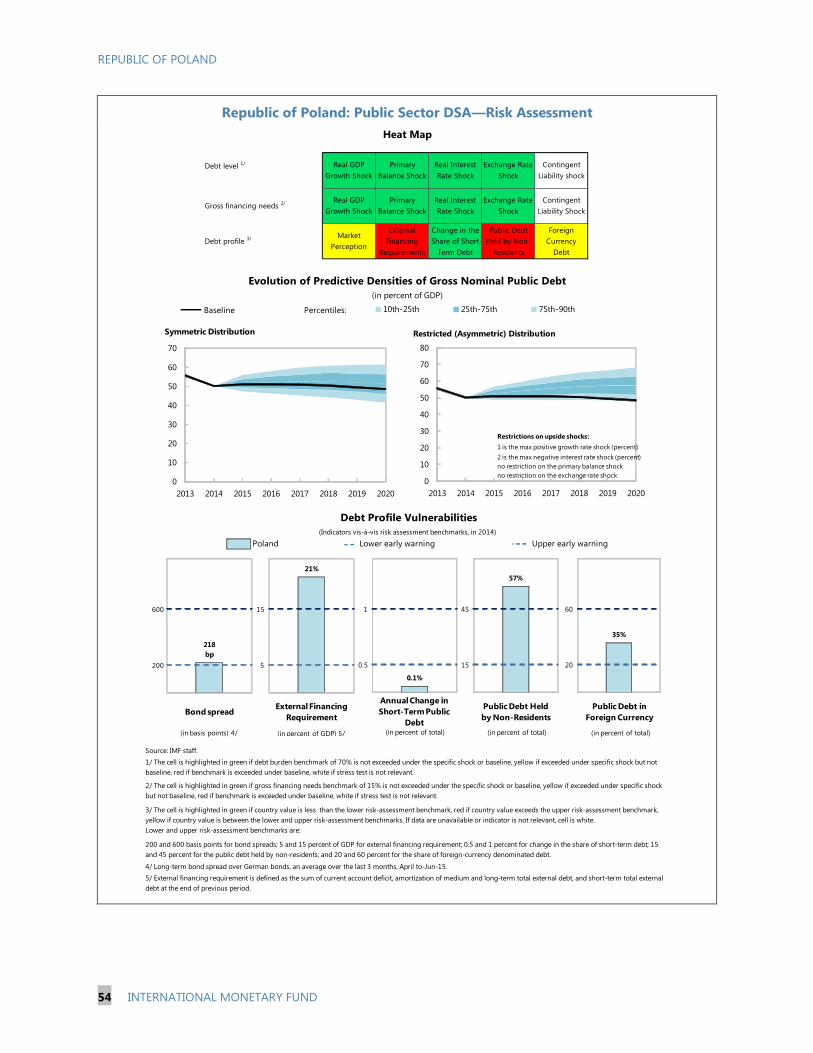
REPUBLIC OF POLAND
54 INTERNATIONAL MONETARY FUND
Republic of Poland: Public Sector DSA—Risk Assessment
Poland
Source: IMF staff.
1/ The cell is highlighted in green if debt burden benchmark of 70% is not exceeded under the specific shock or baseline, yellow if exceeded under specific shock but not
baseline, red if benchmark is exceeded under baseline, white if stress test is not relevant.
Real Interest
Rate Shock
External
Financing
Requirements
Real GDP
Growth Shock
Heat Map
Upper early warning
Evolution of Predictive Densities of Gross Nominal Public Debt
(in percent of GDP)
Debt profile 3/
Lower early warning
(Indicators vis-à-vis risk assessment benchmarks, in 2014)
Debt Profile Vulnerabilities
Gross financing needs 2/
Debt level 1/ Real GDP
Growth Shock
Primary
Balance Shock
3/ The cell is highlighted in green if country value is less than the lower risk-assessment benchmark, red if country value exceeds the upper risk-assessment benchmark,
yellow if country value is between the lower and upper risk-assessment benchmarks. If data are unavailable or indicator is not relevant, cell is white.
Lower and upper risk-assessment benchmarks are:
Change in the
Share of Short-
Term Debt
Foreign
Currency
Debt
Public Debt
Held by Non-
Residents
Primary
Balance Shock
Real Interest
Rate Shock
Exchange Rate
Shock
Contingent
Liability Shock
Exchange Rate
Shock
Contingent
Liability shock
5/ External financing requirement is defined as the sum of current account deficit, amortization of medium and long-term total external debt, and short-term total external
debt at the end of previous period.
4/ Long-term bond spread over German bonds, an average over the last 3 months, April to-Jun-15.
2/ The cell is highlighted in green if gross financing needs benchmark of 15% is not exceeded under the specific shock or baseline, yellow if exceeded under specific shock
but not baseline, red if benchmark is exceeded under baseline, white if stress test is not relevant.
200 and 600 basis points for bond spreads; 5 and 15 percent of GDP for external financing requirement; 0.5 and 1 percent for change in the share of short-term debt; 15
and 45 percent for the public debt held by non-residents; and 20 and 60 percent for the share of foreign-currency denominated debt.
Market
Perception
20
60
35%
1 2
200
600
218
bp
1 2
5
15
21%
1 2
0.5
1
0.1%
1 2
Bond spreadExternal Financing
Requirement
Annual Change in
Short-Term Public
Debt
Public Debt in
Foreign Currency
(in basis points) 4/ (in percent of GDP) 5/ (in percent of total) (in percent of total)
0
10
20
30
40
50
60
70
2013 2014 2015 2016 2017 2018 2019 2020
10th-25th 25th-75th 75th-90thPercentiles:Baseline
Symmetric Distribution
0
10
20
30
40
50
60
70
80
2013 2014 2015 2016 2017 2018 2019 2020
Restricted (Asymmetric) Distribution
1 is the max positive growth rate shock (percent)
2 is the max negative interest rate shock (percent)
no restriction on the primary balance shock
no restriction on the exchange rate shock
Restrictions on upside shocks:
15
45
57%
1 2
Public Debt Held
by Non-Residents
(in percent of total)
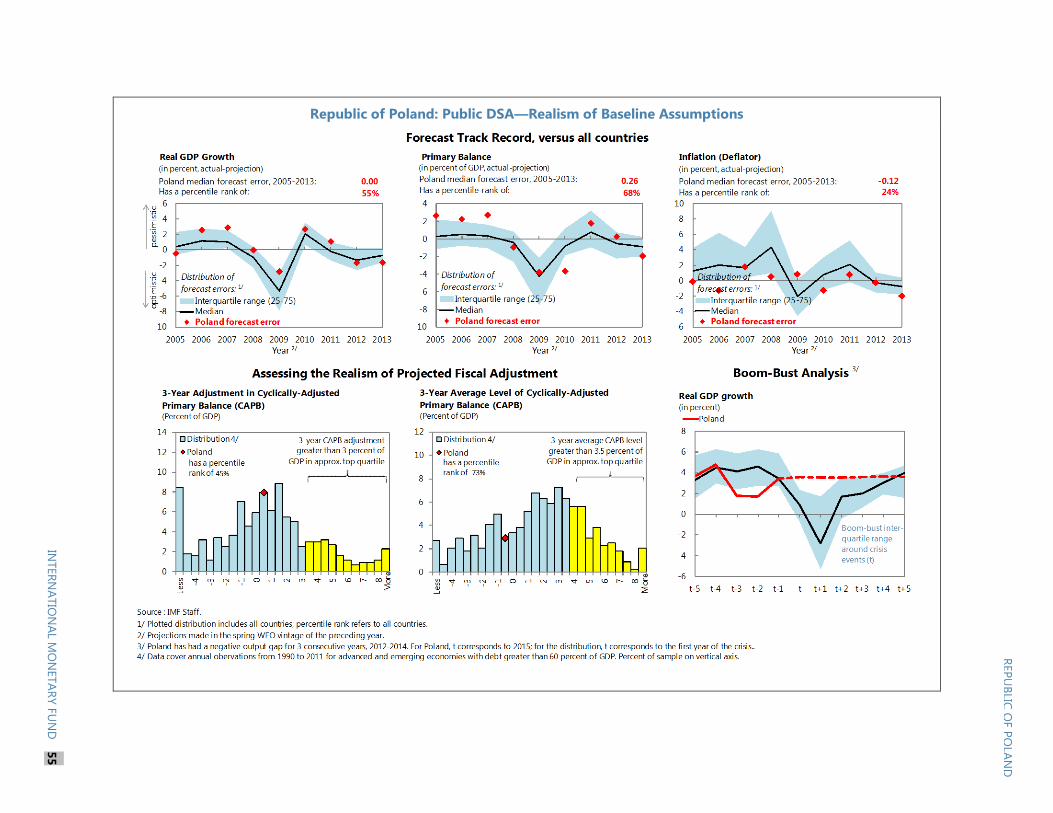
Republic of Poland: Public DSA—Realism of Baseline Assumptions
REP
UB
LIC O
F P
OLA
ND
INTER
NA
TIO
NA
L MO
NETA
RY F
UN
D
55

REPUBLIC OF POLAND
56 INTERNATIONAL MONETARY FUND
Republic of Poland: Public DSA—Baseline Scenario
(Percent of GDP, unless otherwise indicated)
As of June 05, 20152/
2013 2014 2015 2016 2017 2018 2019 2020 Sovereign Spreads
Nominal gross public debt 49.4 55.7 50.1 51.1 51.0 50.9 50.5 49.5 48.5 EMBIG (bp) 3/ 238
Public gross financing needs 15.1 10.8 8.1 10.0 9.1 7.8 7.8 7.5 6.8 5Y CDS (bp) 66
Real GDP growth (in percent) 4.3 1.7 3.4 3.6 3.5 3.6 3.6 3.6 3.6 Ratings Foreign Local
Inflation (GDP deflator, in percent) 3.0 1.1 0.5 0.0 1.5 1.9 1.9 2.3 2.3 Moody's A2 A2
Nominal GDP growth (in percent) 7.5 2.9 4.0 3.6 5.1 5.5 5.5 6.1 6.0 S&Ps A- A
Effective interest rate (in percent) 4/ 5.6 4.7 3.6 3.6 3.5 3.2 3.2 3.3 3.5 Fitch A- A
2013 2014 2015 2016 2017 2018 2019 2020 cumulative
Change in gross public sector debt 0.8 1.3 -5.6 0.9 0.0 -0.1 -0.4 -1.0 -1.0 -1.6
Identified debt-creating flows 0.2 1.4 -3.6 0.7 -0.3 -0.4 -0.7 -1.2 -1.1 -3.0
Primary deficit 2.2 1.5 1.2 1.0 0.8 1.1 0.7 0.4 0.3 4.3
Primary (noninterest) revenue and grants 39.5 38.2 38.6 39.1 38.8 38.6 38.7 38.9 39.0 233.1
Primary (noninterest) expenditure 41.7 39.7 39.9 40.1 39.7 39.6 39.4 39.3 39.3 237.4
Automatic debt dynamics 5/
-1.1 0.6 2.7 0.0 -0.8 -1.1 -1.1 -1.3 -1.2 -5.6
Interest rate/growth differential 6/
-0.8 1.0 -0.2 0.0 -0.8 -1.1 -1.1 -1.3 -1.2 -5.6
Of which: real interest rate 1.1 1.9 1.7 1.7 0.9 0.6 0.6 0.4 0.5 4.7
Of which: real GDP growth -1.9 -0.9 -1.8 -1.7 -1.7 -1.7 -1.7 -1.7 -1.7 -10.3
Exchange rate depreciation 7/
-0.3 -0.4 2.9 … … … … … … …
Other identified debt-creating flows -0.9 -0.7 -7.5 -0.3 -0.3 -0.3 -0.3 -0.3 -0.3 -1.8
Privatization (+ reduces financing needs) (negative) -0.7 -0.6 -0.1 -0.1 -0.1 -0.1 -0.1 -0.1 -0.1 -0.5
Contingent liabilities 0.0 0.0 0.0 0.0 0.0 0.0 0.0 0.0 0.0 0.0
Liabilities not included in debt 8/
-0.2 -0.1 -7.4 -0.2 -0.2 -0.2 -0.2 -0.2 -0.2 -1.2
Residual, including asset changes 9/
0.6 -0.1 -2.0 0.3 0.3 0.3 0.3 0.2 0.2 1.4
Source: IMF staff.
1/ Public sector is defined as general government.
2/ Based on available data.
3/ Long-term bond spread over German bonds.
4/ Defined as interest payments divided by debt stock (excluding guarantees) at the end of previous year.
5/ Derived as [(r - π(1+g) - g + ae(1+r)]/(1+g+π+gπ)) times previous period debt ratio, with r = interest rate; π = growth rate of GDP deflator; g = real GDP growth rate;
a = share of foreign-currency denominated debt; and e = nominal exchange rate depreciation (measured by increase in local currency value of U.S. dollar).
6/ The real interest rate contribution is derived from the numerator in footnote 5 as r - π (1+g) and the real growth contribution as -g.
7/ The exchange rate contribution is derived from the numerator in footnote 5 as ae(1+r).
8/ From 2014 onwards, reflects the transfer of pension fund assets and liabilities to the social security administration.
9/ Includes asset changes and interest revenues (if any). For projections, includes exchange rate changes during the projection period.
10/ Assumes that key variables (real GDP growth, real interest rate, and other identified debt-creating flows) remain at the level of the last projection year.
-1.4
balance 10/
primary
Debt, Economic and Market Indicators 1/
2004-2012
Actual
Projections
Contribution to Changes in Public Debt
Projections
2004-2012
Actual
debt-stabilizing
-15
-10
-5
0
5
10
2004 2005 2006 2007 2008 2009 2010 2011 2012 2013 2014 2015 2016 2017 2018 2019 2020
Debt-Creating Flows
Primary deficit Real GDP growth Real interest rate Exchange rate depreciation
Other debt-creating flows Residual Change in gross public sector debt
projection
(in percent of GDP)
-15
-10
-5
0
5
10
15
cumulative

REPUBLIC OF POLAND
INTERNATIONAL MONETARY FUND 57
Republic of Poland: Public DSA—Composition of Public Debt and Alternative Scenarios
Baseline Scenario 2015 2016 2017 2018 2019 2020 Historical Scenario 2015 2016 2017 2018 2019 2020
Real GDP growth 3.6 3.5 3.6 3.6 3.6 3.6 Real GDP growth 3.6 3.9 3.9 3.9 3.9 3.9
Inflation 0.0 1.5 1.9 1.9 2.3 2.3 Inflation 0.0 1.5 1.9 1.9 2.3 2.3
Primary Balance -1.0 -0.8 -1.1 -0.7 -0.4 -0.3 Primary Balance -1.0 -2.0 -2.0 -2.0 -2.0 -2.0
Effective interest rate 3.6 3.5 3.2 3.2 3.3 3.5 Effective interest rate 3.6 3.5 3.4 3.6 3.8 4.1
Constant Primary Balance Scenario
Real GDP growth 3.6 3.5 3.6 3.6 3.6 3.6
Inflation 0.0 1.5 1.9 1.9 2.3 2.3
Primary Balance -1.0 -1.0 -1.0 -1.0 -1.0 -1.0
Effective interest rate 3.6 3.5 3.2 3.2 3.3 3.5
Source: IMF staff.
Underlying Assumptions(in percent)
Alternative Scenarios
Composition of Public Debt
Baseline Historical Constant Primary Balance
44
46
48
50
52
54
56
58
2013 2014 2015 2016 2017 2018 2019 2020
Gross Nominal Public Debt
(in percent of GDP)
projection
0
2
4
6
8
10
12
2013 2014 2015 2016 2017 2018 2019 2020
Public Gross Financing Needs
(in percent of GDP)
projection
0
10
20
30
40
50
60
2004 2006 2008 2010 2012 2014 2016 2018 2020
By Maturity
Medium and long-term
Short-term
(in percent of GDP)
projection
0
10
20
30
40
50
60
2004 2006 2008 2010 2012 2014 2016 2018 2020
By Currency
Local currency-denominated
Foreign currency-denominated
(in percent of GDP)
projection
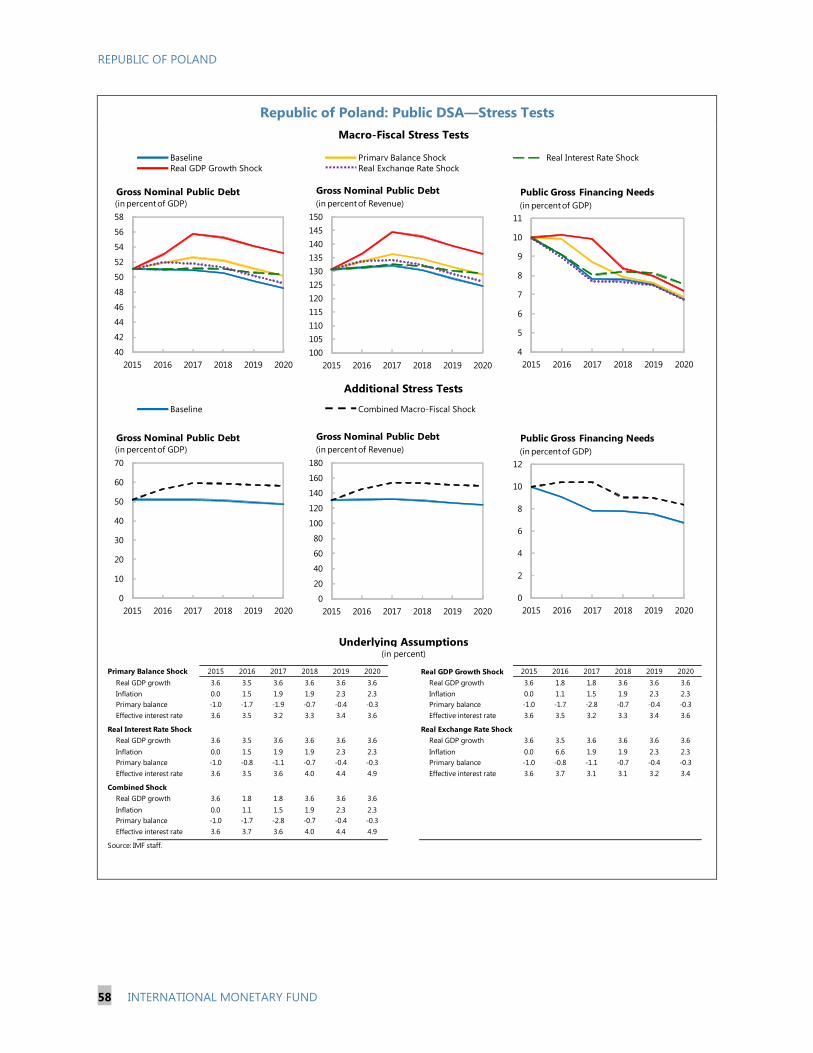
REPUBLIC OF POLAND
58 INTERNATIONAL MONETARY FUND
Republic of Poland: Public DSA—Stress Tests
Primary Balance Shock 2015 2016 2017 2018 2019 2020 Real GDP Growth Shock 2015 2016 2017 2018 2019 2020
Real GDP growth 3.6 3.5 3.6 3.6 3.6 3.6 Real GDP growth 3.6 1.8 1.8 3.6 3.6 3.6
Inflation 0.0 1.5 1.9 1.9 2.3 2.3 Inflation 0.0 1.1 1.5 1.9 2.3 2.3
Primary balance -1.0 -1.7 -1.9 -0.7 -0.4 -0.3 Primary balance -1.0 -1.7 -2.8 -0.7 -0.4 -0.3
Effective interest rate 3.6 3.5 3.2 3.3 3.4 3.6 Effective interest rate 3.6 3.5 3.2 3.3 3.4 3.6
Real Interest Rate Shock Real Exchange Rate Shock
Real GDP growth 3.6 3.5 3.6 3.6 3.6 3.6 Real GDP growth 3.6 3.5 3.6 3.6 3.6 3.6
Inflation 0.0 1.5 1.9 1.9 2.3 2.3 Inflation 0.0 6.6 1.9 1.9 2.3 2.3
Primary balance -1.0 -0.8 -1.1 -0.7 -0.4 -0.3 Primary balance -1.0 -0.8 -1.1 -0.7 -0.4 -0.3
Effective interest rate 3.6 3.5 3.6 4.0 4.4 4.9 Effective interest rate 3.6 3.7 3.1 3.1 3.2 3.4
Combined Shock
Real GDP growth 3.6 1.8 1.8 3.6 3.6 3.6
Inflation 0.0 1.1 1.5 1.9 2.3 2.3
Primary balance -1.0 -1.7 -2.8 -0.7 -0.4 -0.3
Effective interest rate 3.6 3.7 3.6 4.0 4.4 4.9
Source: IMF staff.
Macro-Fiscal Stress Tests
Baseline Primary Balance Shock
Real GDP Growth Shock
Real Interest Rate Shock
(in percent)
Real Exchange Rate Shock
Combined Macro-Fiscal Shock
Additional Stress Tests
Baseline
Underlying Assumptions
40
42
44
46
48
50
52
54
56
58
2015 2016 2017 2018 2019 2020
Gross Nominal Public Debt(in percent of GDP)
100
105
110
115
120
125
130
135
140
145
150
2015 2016 2017 2018 2019 2020
Gross Nominal Public Debt
(in percent of Revenue)
4
5
6
7
8
9
10
11
2015 2016 2017 2018 2019 2020
Public Gross Financing Needs
(in percent of GDP)
0
10
20
30
40
50
60
70
2015 2016 2017 2018 2019 2020
Gross Nominal Public Debt(in percent of GDP)
0
20
40
60
80
100
120
140
160
180
2015 2016 2017 2018 2019 2020
Gross Nominal Public Debt
(in percent of Revenue)
0
2
4
6
8
10
12
2015 2016 2017 2018 2019 2020
Public Gross Financing Needs
(in percent of GDP)

REPUBLIC OF POLAND
INTERNATIONAL MONETARY FUND 59
Appendix I. Evolution of Income Inequality
Following EU Accession1
Following accession to the EU, Poland experienced a notable reversal in the uptrend in income
inequality, with the Gini coefficient2 gradually declining to levels consistent with the EU average. EU
common agricultural policy appears to have played a role in this process by elevating incomes of
farmers, the poorest household group, relative to wealthier households. While social transfers help
to mitigate income inequality, their role is minor, and their efficiency could be enhanced without
increasing their size. Cross-country data show that pay discrimination of women in Poland is below
levels prevailing in most EU countries.
1. Income inequality trended up in the course of economic transformation, but this
trend was reversed after EU accession. Income inequality rose during the first fifteen years of
economic transformation (Figure AI.1). This is not surprising, given that the transformation
implied a switch from full employment and a relatively flat wage structure to a market system,
where entrepreneurship and skills are rewarded, but open unemployment emerges as well. This
uptrend reversed after Poland’s accession to the EU in 2004, although the degree of turnaround
differs, depending on data source. National statistics suggest a mild drop in inequality, while
data from international institutions point to a larger decline.3
Figure AI.1. Republic of Poland: Trends in Income Inequality
Sources: World Bank, GUS, Eurostat, and OECD.
1 Prepared by Robert Sierhej (Resident Representative Office in Warsaw).
2 In this note, we measure income inequality with Gini coefficients published by Central Statistical Office (GUS),
Eurostat, OECD, and World Bank, the latter consumption-based and others income-based.
3 Eurostat and OECD statistics start only in 2004–05, and data for the early years may suffer from a bias related to
initial problems with launching such surveys, which could exaggerate post-accession inequality decline.
29
30
31
32
33
34
35
36
37
38
39
2003 2004 2005 2006 2007 2008 2009 2010 2011 2012 2013
World Bank
GUS
Eurostat
OECD
Poland: Gini Coefficient 2003-2013
20
22
24
26
28
30
32
34
36
38
1985 1990 1995 2000 2005 2010
Poland: Gini coefficient 1985-2012
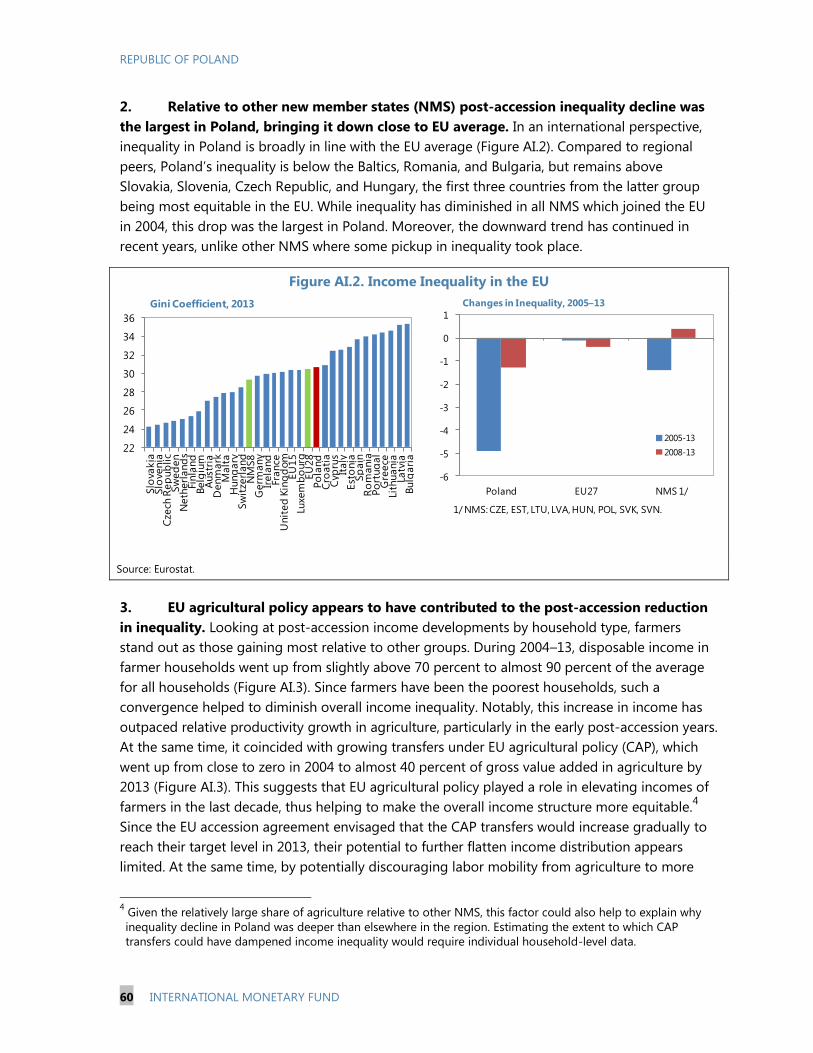
REPUBLIC OF POLAND
60 INTERNATIONAL MONETARY FUND
2. Relative to other new member states (NMS) post-accession inequality decline was
the largest in Poland, bringing it down close to EU average. In an international perspective,
inequality in Poland is broadly in line with the EU average (Figure AI.2). Compared to regional
peers, Poland’s inequality is below the Baltics, Romania, and Bulgaria, but remains above
Slovakia, Slovenia, Czech Republic, and Hungary, the first three countries from the latter group
being most equitable in the EU. While inequality has diminished in all NMS which joined the EU
in 2004, this drop was the largest in Poland. Moreover, the downward trend has continued in
recent years, unlike other NMS where some pickup in inequality took place.
Figure AI.2. Income Inequality in the EU
Source: Eurostat.
3. EU agricultural policy appears to have contributed to the post-accession reduction
in inequality. Looking at post-accession income developments by household type, farmers
stand out as those gaining most relative to other groups. During 2004–13, disposable income in
farmer households went up from slightly above 70 percent to almost 90 percent of the average
for all households (Figure AI.3). Since farmers have been the poorest households, such a
convergence helped to diminish overall income inequality. Notably, this increase in income has
outpaced relative productivity growth in agriculture, particularly in the early post-accession years.
At the same time, it coincided with growing transfers under EU agricultural policy (CAP), which
went up from close to zero in 2004 to almost 40 percent of gross value added in agriculture by
2013 (Figure AI.3). This suggests that EU agricultural policy played a role in elevating incomes of
farmers in the last decade, thus helping to make the overall income structure more equitable.4
Since the EU accession agreement envisaged that the CAP transfers would increase gradually to
reach their target level in 2013, their potential to further flatten income distribution appears
limited. At the same time, by potentially discouraging labor mobility from agriculture to more
4 Given the relatively large share of agriculture relative to other NMS, this factor could also help to explain why
inequality decline in Poland was deeper than elsewhere in the region. Estimating the extent to which CAP
transfers could have dampened income inequality would require individual household-level data.
22
24
26
28
30
32
34
36
Slo
vakia
Slo
venia
Cze
ch R
ep
ub
lic
Sw
ed
en
Neth
erl
and
sFi
nla
nd
Belg
ium
Aust
ria
Denm
ark
Malt
aH
ung
ary
Sw
itze
rland
NM
S8
Germ
any
Irela
nd
France
Unit
ed
Kin
gd
om
EU
15
Luxe
mb
ourg
EU
28
Po
land
Cro
ati
aC
ypru
sIt
aly
Est
onia
Sp
ain
Ro
mania
Po
rtug
al
Gre
ece
Lith
uania
Latv
iaBulg
ari
a
Gini Coefficient, 2013
-6
-5
-4
-3
-2
-1
0
1
Poland EU27 NMS 1/
2005-13
2008-13
Changes in Inequality, 2005–13
1/ NMS: CZE, EST, LTU, LVA, HUN, POL, SVK, SVN.
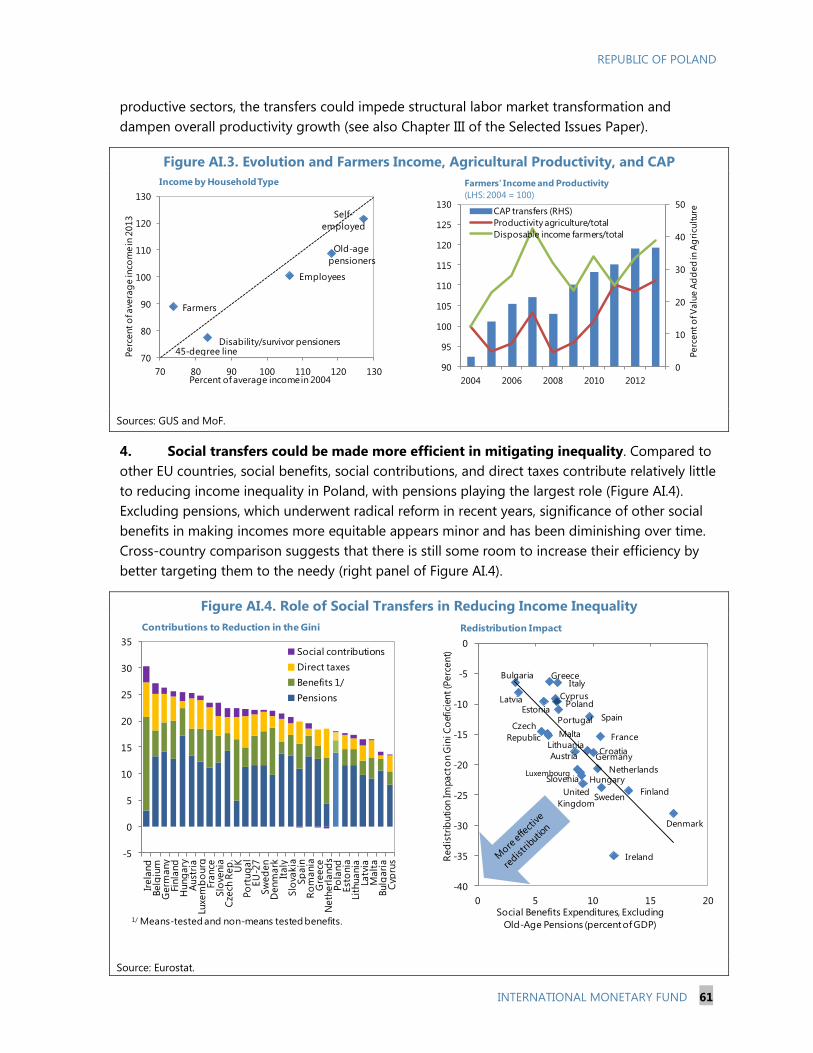
REPUBLIC OF POLAND
INTERNATIONAL MONETARY FUND 61
productive sectors, the transfers could impede structural labor market transformation and
dampen overall productivity growth (see also Chapter III of the Selected Issues Paper).
Figure AI.3. Evolution and Farmers Income, Agricultural Productivity, and CAP
Sources: GUS and MoF.
4. Social transfers could be made more efficient in mitigating inequality. Compared to
other EU countries, social benefits, social contributions, and direct taxes contribute relatively little
to reducing income inequality in Poland, with pensions playing the largest role (Figure AI.4).
Excluding pensions, which underwent radical reform in recent years, significance of other social
benefits in making incomes more equitable appears minor and has been diminishing over time.
Cross-country comparison suggests that there is still some room to increase their efficiency by
better targeting them to the needy (right panel of Figure AI.4).
Figure AI.4. Role of Social Transfers in Reducing Income Inequality
Source: Eurostat.
Employees
Farmers
Self-
employed
Old-age
pensioners
70
80
90
100
110
120
130
70 80 90 100 110 120 130
Perc
ent o
f ave
rag
e in
com
e in
2013
Percent of average income in 2004
Income by Household Type
Disability/survivor pensioners45-degree line
0
10
20
30
40
50
90
95
100
105
110
115
120
125
130
2004 2006 2008 2010 2012
Perc
ent o
f Valu
e A
dd
ed in
Ag
ricu
ltureCAP transfers (RHS)
Productivity agriculture/total
Disposable income farmers/total
Farmers' Income and Productivity
(LHS: 2004 = 100)
-5
0
5
10
15
20
25
30
35
Irela
nd
Belg
ium
Germ
any
Finla
nd
Hung
ary
Aust
ria
Luxe
mb
ourg
France
Slo
venia
Cze
ch R
ep
.U
KPo
rtug
al
EU
-27
Sw
ed
en
Denm
ark
Italy
Slo
vakia
Sp
ain
Ro
mania
Gre
ece
Neth
erl
and
sPo
land
Est
onia
Lith
uania
Latv
iaM
alt
aBulg
ari
aC
ypru
s
Social contributions
Direct taxes
Benefits 1/
Pensions
Contributions to Reduction in the Gini
1/ Means-tested and non-means tested benefits.
Bulgaria
Czech
Republic
Denmark
Germany
Estonia
Ireland
Greece
Spain
France
Croatia
Italy
CyprusLatvia
Lithuania
LuxembourgHungary
Malta
Netherlands
Austria
Poland
Portugal
Slovenia
FinlandSweden
United
Kingdom
-40
-35
-30
-25
-20
-15
-10
-5
0
0 5 10 15 20
Red
istr
ibution Im
pact
on G
iniC
oef
icie
nt
(Perc
ent)
Social Benefits Expenditures, Excluding
Old-Age Pensions (percent of GDP)
Redistribution Impact
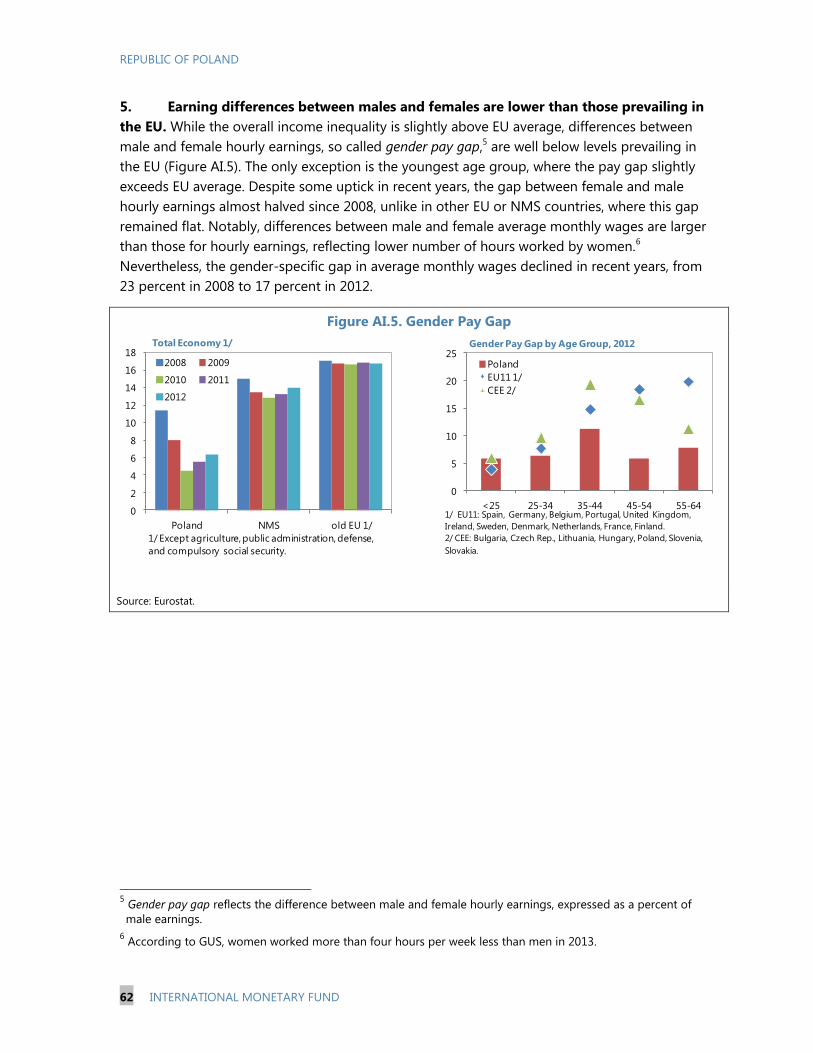
REPUBLIC OF POLAND
62 INTERNATIONAL MONETARY FUND
5. Earning differences between males and females are lower than those prevailing in
the EU. While the overall income inequality is slightly above EU average, differences between
male and female hourly earnings, so called gender pay gap,5 are well below levels prevailing in
the EU (Figure AI.5). The only exception is the youngest age group, where the pay gap slightly
exceeds EU average. Despite some uptick in recent years, the gap between female and male
hourly earnings almost halved since 2008, unlike in other EU or NMS countries, where this gap
remained flat. Notably, differences between male and female average monthly wages are larger
than those for hourly earnings, reflecting lower number of hours worked by women.6
Nevertheless, the gender-specific gap in average monthly wages declined in recent years, from
23 percent in 2008 to 17 percent in 2012.
Figure AI.5. Gender Pay Gap
Source: Eurostat.
5 Gender pay gap reflects the difference between male and female hourly earnings, expressed as a percent of
male earnings.
6 According to GUS, women worked more than four hours per week less than men in 2013.
0
2
4
6
8
10
12
14
16
18
Poland NMS old EU 1/
2008 2009
2010 2011
2012
Total Economy 1/
1/ Except agriculture, public administration, defense,
and compulsory social security.
0
5
10
15
20
25
<25 25-34 35-44 45-54 55-64
Poland
EU11 1/
CEE 2/
Gender Pay Gap by Age Group, 2012
1/ EU11: Spain, Germany, Belgium, Portugal, United Kingdom,
Ireland, Sweden, Denmark, Netherlands, France, Finland.
2/ CEE: Bulgaria, Czech Rep., Lithuania, Hungary, Poland, Slovenia,
Slovakia.
REPUBLIC OF POLAND
INTERNATIONAL MONETARY FUND 63
Appendix II. Republic of Poland: Foreign Currency Mortgages1
1. The Swiss National Bank (SNB) decision on January 15, 2015 to remove the cap on the
value of the Swiss franc resulted in a 20 percent depreciation of the zloty against the Swiss
franc. While the zloty has regained some ground since then, it remains some 10 percent below its
value before the SNB move. The SNB also lowered the marginal interest rate on central bank
deposits by 50 bps to -0.75 percent and the target range for the three-month Libor to between -
1.25 and -0.25 percent.
2. The depreciation of the zloty has raised concerns about foreign currency (FX) exposure
on household and bank balance sheets. For a given interest rate, the zloty depreciation increased
debt-servicing costs for more than half a million Polish households holding Swiss franc-
denominated mortgages. Although the tightening of prudential regulations in recent years
(including by requiring household FX earnings for FX mortgage eligibility and increasing risk weights
on FX mortgages) has brought Swiss franc-denominated mortgages down from around 11 percent
of GDP at the peak in November 2011 to 8.3 percent of 2014 GDP in March, they still account for
close to 40 percent of the mortgage portfolio (all foreign currency mortgages accounted for around
47 percent of the portfolio in March). And while NPL ratios for these mortgages are relatively low at
around 3.5 percent in March, many mortgages issued in the run-up to the crisis carry LTV ratios
above 100 percent (Figure AII.1). The high LTVs, combined with FX mismatches on household
balance sheets, pose credit risk to banks. And hedging of the bank open FX position partly through
short-term FX swaps presents liquidity risk.
3. The economic impact of the zloty depreciation appears to be limited:
Macroeconomic implications. Given that most Swiss franc-denominated mortgages have been
contracted at floating rates, the increase in debt servicing costs for households will be mitigated by
lower Swiss LIBOR rates, provided that it is passed on to mortgage holders. Furthermore, real wages
have increased by more than 10 percent since the beginning of 2008 when many mortgages were
issued, and the unemployment rate has declined markedly since its crisis peak. Overall, any impact
on consumption and economic growth would therefore be small.
Financial stability implications. Recent stress tests conducted by the KNF showed that bank capital
and liquidity buffers are sufficient to prevent a significant increase in systemic risk, even in the event
of zloty depreciation well beyond the recent shock.
4. Given limited macro or financial stability concerns, the authorities’ response focused
on mitigating the impact on distressed households. The FSC recommended that banks pass on
the negative Swiss franc interest rates to customers, narrow foreign-currency spreads, give potential
maturity extensions or payment holidays, offer provision-free conversions, do not require additional
1 Prepared by Lone Christiansen (EUR).

REPUBLIC OF POLAND
64 INTERNATIONAL MONETARY FUND
collateral, and take a case-by-case approach to the restructuring of distressed mortgages. This has
been supported by the banking association. The Polish authorities, including the Office of
Competition and Consumer Protection (UOKiK), are closely monitoring banks’ response. To increase
incentives to mitigate risks from distressed mortgages, the Ministry of Finance recently signed
regulation to exempt gains from mortgage credit restructuring and negative interest rates from
income taxation. Correspondingly, banks would be allowed to deduct these amounts from taxable
income.
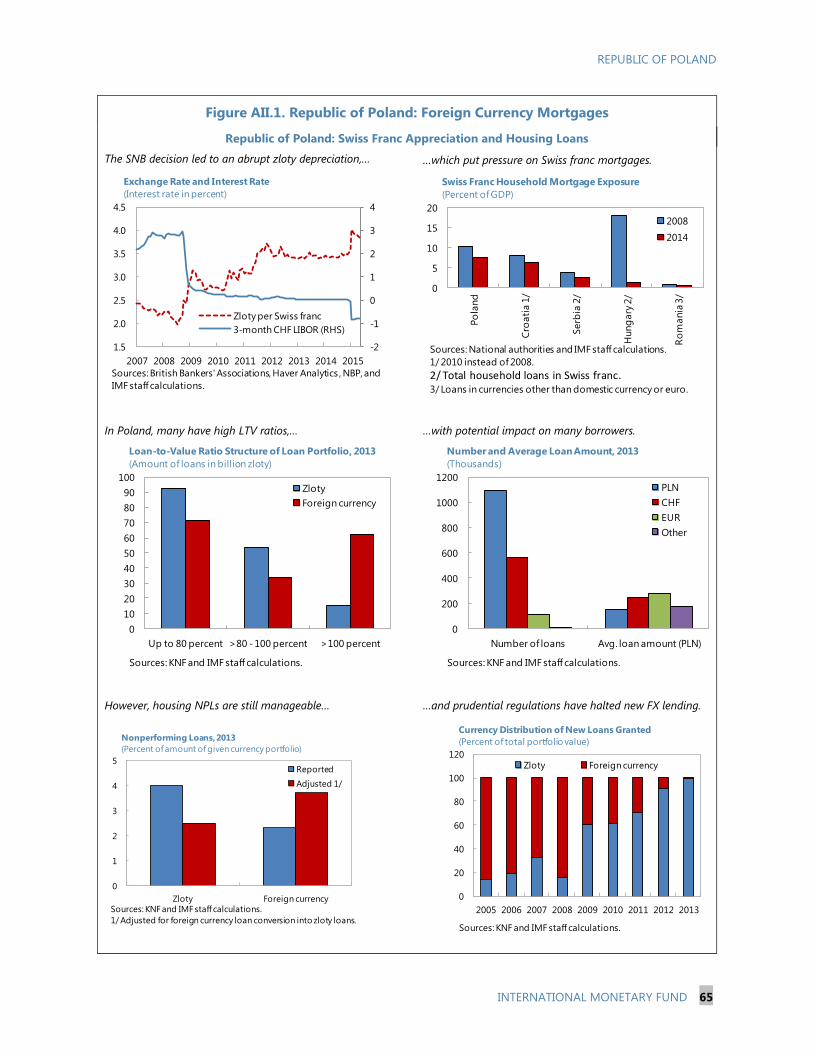
REPUBLIC OF POLAND
INTERNATIONAL MONETARY FUND 65
Figure AII.1. Republic of Poland: Foreign Currency Mortgages
Republic of Poland: Swiss Franc Appreciation and Housing Loans
The SNB decision led to an abrupt zloty depreciation,… …which put pressure on Swiss franc mortgages.
In Poland, many have high LTV ratios,… …with potential impact on many borrowers.
However, housing NPLs are still manageable… …and prudential regulations have halted new FX lending.
0
10
20
30
40
50
60
70
80
90
100
Up to 80 percent >80 - 100 percent >100 percent
Zloty
Foreign currency
Loan-to-Value Ratio Structure of Loan Portfolio, 2013
(Amount of loans in billion zloty)
Sources: KNF and IMF staff calculations.
0
200
400
600
800
1000
1200
Number of loans Avg. loan amount (PLN)
PLN
CHF
EUR
Other
Number and Average Loan Amount, 2013
(Thousands)
Sources: KNF and IMF staff calculations.
0
1
2
3
4
5
Zloty Foreign currency
Reported
Adjusted 1/
Nonperforming Loans, 2013
(Percent of amount of given currency portfolio)
Sources: KNF and IMF staff calculations.
1/ Adjusted for foreign currency loan conversion into zloty loans.
0
20
40
60
80
100
120
2005 2006 2007 2008 2009 2010 2011 2012 2013
Zloty Foreign currency
Currency Distribution of New Loans Granted
(Percent of total portfolio value)
Sources: KNF and IMF staff calculations.
-2
-1
0
1
2
3
4
1.5
2.0
2.5
3.0
3.5
4.0
4.5
2007 2008 2009 2010 2011 2012 2013 2014 2015
Zloty per Swiss franc
3-month CHF LIBOR (RHS)
Exchange Rate and Interest Rate
(Interest rate in percent)
Sources: British Bankers' Associations, Haver Analytics , NBP, and
IMF staff calculations.
0
5
10
15
20
Po
land
Cro
ati
a 1
/
Serb
ia 2
/
Hung
ary
2/
Ro
mania
3/
2008
2014
Swiss Franc Household Mortgage Exposure
(Percent of GDP)
Sources: National authorities and IMF staff calculations.
1/ 2010 instead of 2008.
2/ Total household loans in Swiss franc.3/ Loans in currencies other than domestic currency or euro.

REPUBLIC OF POLAND
66 INTERNATIONAL MONETARY FUND
Appendix III. Efficiency of Public Expenditure1
Poland’s public expenditure has declined in recent years and stands below the EU average, but fiscal
consolidation remains incomplete. Going forward, seeking further efficiency in the use of public
resources would be critical to facilitate the implementation of the stabilizing expenditure rule and
support sustainable growth. A cross-country analysis indicates that Poland’s efficiency in the provision
of public services, particularly in social protection and health, could be improved, potentially generating
modest expenditure savings over time.
1. During 2011–14, Poland accomplished substantial expenditure-based fiscal
consolidation. Since the start of the Excessive Deficit Procedure in 2011, the headline deficit was
reduced by about 1.7 percentage points to 3.2 percent of GDP in 2014. Against lackluster tax
collection, the adjustment was driven by cuts in current expenditure and a moderation of public
investment toward its historic average. Going forward, changes in the pension system implemented
in 2014 should further improve the fiscal aggregates, but additional consolidation of about 1 percent
of GDP will be necessary to achieve the MTO. Part of this adjustment will have to come from the
expenditure side, reflecting the design of the stabilizing fiscal rule implemented in 2013.
2. From a cross-country perspective, Poland’s public sector size is moderate. Poland’s
public expenditure averaged 43¼ percent of GDP during 2008‒13, which stands close to the Central
and Eastern Europe (CEE) average but below the public sector size in industrial EU countries. In per
capita terms, public expenditure in Poland is about one-fourth of the average for industrial EU
countries, reflecting differences in income levels. Across categories, Poland’s combined expenditure
in health, education, and social protection accounts for about 60 percent of total expenditure, and its
share in GDP has declined in recent years to about 26 percent, which stands well below the average
for industrial EU countries (30 percent).
1 Prepared by Francisco Vazquez (ICD).
0
10
20
30
40
50
60
EU-
Industrial
CEE Other
Industrial
Emerging
and
Developing
Poland
Health Education Social protection Other
Public Expenditures in Selected Categories
(Average, 2008–12; percent of GDP)
Sources: Eurostat, OECD, and IMF staff calculations.
0
5000
10000
15000
20000
25000
30000
2005 2006 2007 2008 2009 2010 2011 2012
EU-Industrial
CEE
Other Industrial
Emerging and Developing
Poland
Evolution of Public Expenditures
(Constant US$ per capita, 2010=100)
Sources: Eurostat, OECD, and IMF staff calculations.

REPUBLIC OF POLAND
INTERNATIONAL MONETARY FUND 67
3. The quality of Poland’s public services in health, education, and social protection has
improved over time, but there is room for further improvement in some areas (Figure AIII.1).
Health. Over the last two decades, Poland has achieved substantial improvements in health
outcomes: infant mortality rates have declined and
life expectancy has increased to almost 77 years,
which is still below the EU average (80½ years). At
the same time, comparator countries based on
similar per capita income, such as Mexico, Chile, and
Korea have achieved higher life expectancy than
Poland with lower public health expenditures.
Education. Poland stands among the countries
with the highest literacy ratios worldwide.
Performance in the Program for International
Student Assessment (PISA) exams has improved
considerably over time and compares favorably
to peers (Poland ranked 9 among the
62 countries covered in the 2012 assessment).2
At the same time, school enrollment and
completion rates in primary school remain low
compared to other countries, and the number of
repeaters in primary and secondary schools is
relatively large despite small class sizes. Poland also lags peer countries on adult participation in
lifelong learning, as well as in employability, signaling potential mismatches between the education
system and employer’s needs.
Social protection. When it comes to social transfers, the coverage and targeting of unemployment
and social assistance benefits could be improved, while spending on pensions remains high, partly
due to unreformed pension schemes for farmers and miners.
2 The PISA is a triennial OECD test of knowledge and skills of 15 year-old students. The PISA ranks countries according
to student’s performance in mathematics, reading, and science, using their mean scores in each area.
0
1
2
3
4
5
6
7
8
9
10
30
40
50
60
70
80
90
100
ZA
FR
US
UK
RB
RA
LTU
LV
AB
GR
RO
MTU
RH
UN
EST
SV
KPO
LH
RV
MEX
CZ
EU
SA
CH
LD
NK
CYP
PR
TSV
NFIN
BEL
DEU
GR
EA
UT
IRE
GB
RK
OR
MLT
LU
XN
DL
CA
NN
OR
SW
EFR
ASPN
ICL
ITA
CH
EJP
N
Life Expectancy
Public Health Expenditure (RHS)
Sources: World Bank and IMF staff calculations.
Life Expectancy and Public Health Expenditure
(Constant PPP USD per capita, average 2008–12)
Thousands
400 450 500 550 600
SGPHKGKORJPNFINESTLIE
CANPOLNDLCHE
IREVNMDEUAUSBELNZLGBRAUTCZEFRASVNDENNORLVAUSAITA
LUXSPNPRT
HUNICL
LTUHRVSWERUS
PISA Scores of Top Performers, 2012
(Average results)
Sources: OECD and IMF staff calculations.

REPUBLIC OF POLAND
68 INTERNATIONAL MONETARY FUND
Figure AIII.1. Republic of Poland: Selected Social Outcomes
60
70
80
90
1995 1997 1999 2001 2003 2005 2007 2009 2011
EU Industrial
EU Emerging
Other Industrial
Other Emerging and Developing
Evolution of Life Expectancy
(In years)
AUTBEL
BRABGR
CAN
CHLHRV
CYP CZE
DNK
EST
FIN
FRADEU
GRC
HUN
ISLIRL
ITAJPN
KOR
LVALTU
LUX
MLT
MEX
NLD
NOR
POL
PRT
ROMRUS
SVKSVN
ZAF
ESP
SWE
CHE
TURUKR
GBR
USA
0
1000
2000
3000
4000
5000
6000
7000
8000
9000
0 5 10 15
Health Expenditure and Hospital Services
(Average 2008–13)
Healt
h e
xpendit
ure
per c
ap
ita P
PP (U
SD
Hospital beds (per 1000 people)
World
Averages
80 85 90 95 100 105
CZEITA
KORSPNJPNLTUDEUNORUKRDNKGRESVKBGRHUN
FINICL
USASWECHLSVNESTLVARUSCHEPOLMEXHRVLUX
Primary Education Completion Rates 1/
(Average 2008–13, percent of relevant age group)
AUT
BRA
BGR
CHL
HRV
CYPCZE
EST
FIN
FRA
DEU
GRC
HUN
ITA JPN
KOR
LVALTU
LUXMLT
MEX
NLD
POL
PRT
ROM
RUS
SVK
SVN
ZAF
ESP
SWECHE
TUR
GBRUSA
5
10
15
20
25
30
5 10 15 20 25 30 35
Education, Pupils per Teacher
(Average 2008–13)
Seco
nd
ary
Primary
20
22
24
26
28
30
32
34
36
38
40
1996
1998
1999
2000
2001
2002
2004
2005
2006
2007
2008
2009
2010
2011
Gini
Percentile in world distribution
Poland: Income Distribution 1/
(1995–2011)
0
10
20
30
40
50
60
70
80
90
Coverage Social
Assistance
Coverage Social
Protection and
Labor
Coverage all Labor
Market
Poland: Coverage of Social Safety Net
(Percentile rank of Poland in world distribution, 2005–13)
World
Averages
Sources: World Bank,and IMF staff calculations. Sources: Eurostat, OECD, World Bank and IMF staff calculations.
Sources: World Bank and IMF staff calculations.
1/ Primary completion rate is measured as the gross intake ratio to the
last grade of primary education. It is calculated by taking the total
number of students in the last grade of primary school, minus the
number of repeaters in that grade, divided by the total number of
children of official graduation age.
Sources: World Bank and IMF staff calculations.
Sources: World Bank and IMF staff calculations.
1/ The percentile in the World distribution indicates the percent of
countries that have a more egalitarian income distribution than Poland
(measured by the Gini coefficient).
Sources: World Bank and IMF staff calculations.

REPUBLIC OF POLAND
INTERNATIONAL MONETARY FUND 69
4. A cross-country analysis indicates that the efficiency of Poland’s public spending can
be increased. The assessment is carried out by applying Data Envelopment Analysis (DEA) to cross-
country data on public resources devoted to education, health, and social protection, and a set of
measurable outcomes in these sectors. In particular, DEA uses the actual input-output conversion
rates of the sample countries to estimate the most efficient use of resources to produce measurable
outcome (i.e., an efficiency frontier in a technical sense).3 Each frontier determines the best outcome
that can be attained with a given set of inputs (or, alternatively, the minimum set of inputs required
to attain a target set of outputs). The relative efficiency of Poland’s public expenditures is then
determined by comparing its observed conversion rates with those attained by the countries on the
frontier. The distance to the frontier provides a first order estimate of the size of potential fiscal
savings while maintaining the observed quality of the public service.
Health. Poland spends around 4½ percent of GDP on health care, which stands below the average
for industrial EU countries (6.6 percent) and CEE countries (6.3 percent). In the analysis, the input is
measured using public health expenditures per capita (average 2008‒12 measured in constant
purchasing power parity (PPP) US$ to minimize
possible price distortions. In turn, the social outcomes
are measured by three indicators: life expectancy at
birth and mortality rates of both neonatal and children
under 5 years. The text figure shows the scatter plot of
life expectancy versus public health expenditures. The
efficient frontier is determined by Turkey, Switzerland,
and Japan. The analysis suggests that Poland is more
efficient than CEE countries but substantially less
efficient than industrial countries. Overall, the DEA
suggests that there is room to improve Poland’s
technical efficiency in the provision of health services.
Bridging half of the efficiency gap between Poland
and the group of countries on the efficiency frontier could, over time, generate some 0.4 percent of
GDP in savings, without compromising health outcomes. However, these results should be
interpreted with caution, since countries on the efficiency frontier operate different health care
systems and rely on different division of public-private responsibility for health care. Moreover, other
factors, such as per capita income, also play a role.
Education. Poland spends around 5½ percent of GDP on education, which stands close to the
average of industrial EU countries (5.6 percent) but above CEE countries (4.8 percent). In recent years,
Poland has made substantial efforts to improve the quality of education and modernize the curricula.
A reform of the vocational education system is also underway. Based on average data for 2008‒12,
Poland stands on the efficiency frontier if the public outcome is based on PISA scores only. However,
3 DEA is a linear-programming technique for frontier estimation that uses input-output data for individual decision
making units—in this case countries—to construct a piecewise-linear convex set encompassing the data. Similar
analyses have been carried out recently in the context of Fund’s surveillance for Slovakia (2012), Iceland (2013), and
Slovenia (2014).
AUTBEL
CHE
CZE
DEUDNK
ESP
EST
FIN
FRA
GBRGRC
HUN
IRL
ISLISR
ITAJPN
KOR LUXNLD NOR
POL
PRT
SVK
SVN
SWE
TUR
USA
73
74
75
76
77
78
79
80
81
82
83
84
0 1000 2000 3000 4000 5000
Efficiency of Health Expenditures
(Life expectancy and health expenditures per capita)
Sources: Eurostat, World Bank, OECD and IMF staff calculations.
Health Expenses, constant USD PPP per capita

REPUBLIC OF POLAND
70 INTERNATIONAL MONETARY FUND
other indicators, such as primary and secondary school enrollment, and primary completion rates still
fall short in cross-country comparison.
Social protection. Poland’s expenditure on social protection amounts to 15¾ percent of GDP, which
stands below the mean for industrial EU countries (17¾ percent of GDP) but well above CEE
countries (12¼ percent of GDP). Poland’s income
distribution has improved since 2004 (with a short-
lived reversion at the onset of the global financial
crisis), and compares well to other countries: Poland
ranks in lowest 30 percentile worldwide in terms of
income inequality, as measured by the Gini
coefficient. Yet, Poland lags peer countries in terms
of the coverage of social programs. The DEA
analysis uses social expenditures per capita as an
encompassing input (measured in constant, PPP-
adjusted US$) and the change in the Gini coefficient
attributable to social expenditures as an output
measure.4 The frontier is defined by Slovakia,
Hungary, and Sweden. The distributive impact of
social expenditure in Poland is comparable to that of Slovakia, but Poland spends slightly more in
this area. This suggests that Poland could achieve its income redistribution objectives more
efficiently, while potentially also generating modest expenditure savings over time. The DEA suggests
that bridging half of the efficiency gap between Poland and countries on the efficiency frontier could
over time generate some 0.4 percent of GDP in savings, without compromising income distribution
outcomes.
4 This variable, published by Eurostat, measures the difference in the Gini coefficient before and after social transfers
(including pensions).
AUT
BEL
CZE
DEU
DNK
ESP
ESTFIN
FRAGBR
GRC
HUN
IRL
ISR
ITA
JPN KOR
LUX
NLD
NOR
POL
PRT
SVK
SVN
SWE
USA
460
470
480
490
500
510
520
530
540
550
0 1000 2000 3000 4000 5000
Efficiency of Education Expenditure
(PISA scores and education expenditure per capita)
Sources: Eurostat, World Bank and IMF staff calculations.
Education Expenditure, constantPPP USD per capita.
AUT
BEL
CHE
CZE
DEUDNK
ESP
EST FIN
FRA
GBR
GRC
HUN
IRL
ISL
ISR
ITAJPNKOR
LUX
NLD
NORPOL
PRT
SVK
SVN
SWE
TUR
USA
96
98
100
102
104
106
108
110
112
114
0 1000 2000 3000 4000 5000
Efficiency of Education Expenditure (School enrollment in
primary education and education expenditures per capita)
Sources: Eurostat, World Bank, and IMF staff calculations.
Education Expenses, constant USD PPP per capita
AUTBEL
CHE
CZE
DEU DNK
ESPEST
FIN
FRA
GBRGRC
HUNIRL
ISLITA
LUXNLD
NORPOL
PRTSVK SVN
SWE
0
5
10
15
20
25
30
0 5000 10000 15000 20000
Efficiency of Social Spending
(Change in Gini coefficient and social expenditures)
Sources: Eurostat and IMF staff calculations.
Constant PPP USD per capita
REPUBLIC OF POLAND
INTERNATIONAL MONETARY FUND 71
5. Overall, there seems to be room to improve the efficiency of public expenditure in the
three areas under analysis and potentially generate expenditure savings over time:
Health. Recent reforms aimed at increasing managerial and financial accountability in the hospital
system were a step in the right direction. These need to be complemented, inter alia, with the
introduction of a robust costing system and a top-down assessment of infrastructure needs to help
guide investment and optimize the organization of health care providers, including hospitals.
Countries with well-performing health systems, have managed to balance market-based incentives
with strong regulations, monitoring mechanisms, and institutions to facilitate coordination and help
improve efficiency, while ensuring the delivery of high-quality health services (World Bank, 2014).
Education. There is scope for some consolidation of schools and classrooms, as the student
population in primary and secondary schools continues to fall in line with demographic trends. In
parallel, further efforts are needed to increase school enrollment and improve the matching between
the educational and vocational systems and the job market. Seeking a better alignment of lifelong
learning programs with labor market needs is also important to increase participation among the
adult population and the low-skilled workers.
Social protection. In turn, the efficiency of social expenditures can be increased by broadening the
coverage and adequacy of social assistance and improving targeting by reducing the leakage of
benefits to non-poor groups. Tackling reform in the special pension schemes for farmers and
miners—notably by seeking better alignment of benefits with those of the core pension system—
would also contribute to improving the efficiency of social expenditures.
REPUBLIC OF POLAND
72 INTERNATIONAL MONETARY FUND
References
Afonso A., L. Schuknecht, and V. Tanzi, 2006, “Public Sector Efficiency for New EU Member States and
Emerging Markets,” European Central Bank Working Paper Series, No.581.
Boulhol, H., et al., 2012, "Improving the Health-Care System in Poland," OECD Economics Department
Working Papers, No. 957, OECD Publishing.
Grigoli, F., 2012, “Public Expenditure in the Slovak Republic: Composition and Technical Efficiency,”
IMF Working Paper WP/12/173.
International Monetary Fund, 2004, “Public Expenditure Reform: Making Difficult Choices,” Fiscal
Monitor, April.
World Bank, 2014, “Poland, Improving the Financial Sustainability of the Hospital Sector: Towards a
Systemic Approach,” Policy Note.
Yong-bae Ji, and Choonjoo L., 2010 “Data Envelope Analysis,” The Stata Journal, 10,
No. 2, pp. 267–280.
Zhu, J., 2003, Quantitative Models for Performance Evaluation and Benchmarking, Springer
International Series in Operations Research and Management Science, New York.

REPUBLIC OF POLAND
STAFF REPORT FOR THE 2015 ARTICLE IV
CONSULTATION—INFORMATIONAL ANNEX
Prepared By
The European Department
FUND RELATIONS _______________________________________________________________________ 2
STATISTICAL ISSUES ____________________________________________________________________ 7
CONTENTS
June 22, 2015

REPUBLIC OF POLAND
2 INTERNATIONAL MONETARY FUND
FUND RELATIONS
(As of May 31, 2015)
Membership Status: Joined 6/12/1986; Article VIII
General Resources Account:
SDR Million Percent Quota
Quota 1,688.40 100.00
Fund Holdings of Currency 1,417.37 83.95
Reserve Tranche Position 271.04 16.05
Lending to the Fund
New Arrangement to Borrow 257.07
SDR Department:
SDR Million Percent Allocation
Net Cumulative Allocation 1,304.64 100.00
Holdings 946.65 72.56
Outstanding Purchases and Loans: None
Latest Financial Arrangements:
In Millions of SDR
Type Approval Date Expiration Date Amount Approved Amount Drawn
FCL 1/14/2015 1/13/2017 15,500.00 0.00
FCL 1/18/2013 1/17/2015 22,000.00 0.00
FCL 1/21/2011 1/17/2013 19,166.00 0.00
FCL 7/02/2010 1/20/2011 13,690.00 0.00
Projected Payments to Fund (SDR Million; based on existing use of resources and present
holdings of SDRs):
Forthcoming
2015 2016 2017 2018 2019
Principal
Charges/Interest 0.09 0.20 0.20 0.20 0.20
Total 0.09 0.20 0.20 0.20 0.20
REPUBLIC OF POLAND
INTERNATIONAL MONETARY FUND 3
Exchange Arrangements:
The zloty is freely floating.
Poland accepted the obligation of Article VIII, Sections 2, 3, and 4 on June 1, 1995. Poland maintains an
exchange system free of restrictions on the making of payments and transfers for current international
transactions, except for the exchange restrictions imposed by Poland solely for the preservation of
national or international security as introduced by the European Union (EU) within the framework of the
Common Foreign and Security Policy. The consolidated list of such sanctions is available at:
http://eeas.europa.eu/cfsp/sanctions/consol-list/index_en.htm.
Article IV Consultation:
The last Article IV consultation was concluded on June 23, 2014. In concluding the consultation,
Directors emphasized that Poland’s very strong fundamentals and economic policies had helped it
weather turmoil in financial markets and paved the way for the economic recovery. They noted that the
Precautionary Flexible Credit Line (FCL) arrangement has provided important insurance against external
risks. At the same time, they observed that external risks remained elevated. Directors advised a
measured pace for fiscal consolidation over the medium term to reduce the fiscal deficit and preserve
growth. They agreed that the medium-term objective of a structural deficit of 1 percent of GDP remains
appropriate and could be achieved through better expenditure prioritization, following a review of
public expenditures, and improved tax compliance and efficiency of tax administration. Directors urged
the authorities to address legacy flaws in the pension system and consider measures to deal with the
sharp drop in future replacement rates. They also advised continued monitoring of liquidity in the
government bond and equity markets, given the reduced presence of pension funds. On monetary
policy, Directors concurred that the monetary stance was broadly appropriate within the context of
limited inflationary pressures and subdued euro area inflation. However, a number of Directors called
for heightened vigilance, as policy interest rates could be further reduced if the recovery falters or if
revised projections indicate below-target inflation for a protracted period. In light of external risks,
Directors concurred that moderate reserve accumulation would be prudent. Directors commended the
resilience of the banking system, which remains well capitalized, profitable, and liquid. However, they
called for enhanced financial sector supervision by expediting the completion of the macroprudential
and bank resolution frameworks—including legislation to create a Systemic Risk Board. Directors
encouraged the authorities to deepen structural reforms to achieve more inclusive sustainable growth.
Resident Representative:
Mr. James Roaf replaced Mr. Mark Allen as the Senior Regional Resident Representative for Central and
Eastern Europe, effective August 8, 2013.

REPUBLIC OF POLAND
4 INTERNATIONAL MONETARY FUND
Republic of Poland: Technical Assistance from the Fund, 1992–2014
Department Subject/Identified Need Action Date Counterpart
MAE-
Coordinated
Periodic visits by experts from
central banks cooperating in
providing technical assistance
to the NBP under the
coordination of MAE
Experts' visits 1992–94 NBP
MAE Payments system, banking
supervision, monetary research
and analysis
Mission May 1992 NBP
MAE Review of progress in the
modernization of operational
functions
Mission October 1992 NBP
MAE Resident expert-Advisor to
President of NBP
November
1991–92
NBP
MAE Additional steps in the
modernization process of the
NBP
Mission April 1993 NBP
MAE Monetary programming and
operations, and payments
system
Mission November
1993
NBP
MAE Central bank modernization Mission August 1994 NBP
MAE/LEG Review of the exchange and
payments system
Mission February 1995 NBP/MoF
MAE Exchange rate system Mission March 1995 NBP
MAE Review of government
securities market, payments
system and public debt
management
Mission August 1995 NBP/MoF
MAE Asset consolidation exercise Expert visits Late 1995 NBP
FAD Tax administration (VAT)
Nine short-
term assign-
ments of field
experts
August 1992–
October 1994
MoF
FAD Tax administration Mission November
1992
MoF
STA Framework for monetary
statistics
Mission February 1993 NBP
STA Framework for monetary
statistics (follow-up)
Mission November
1993
NBP
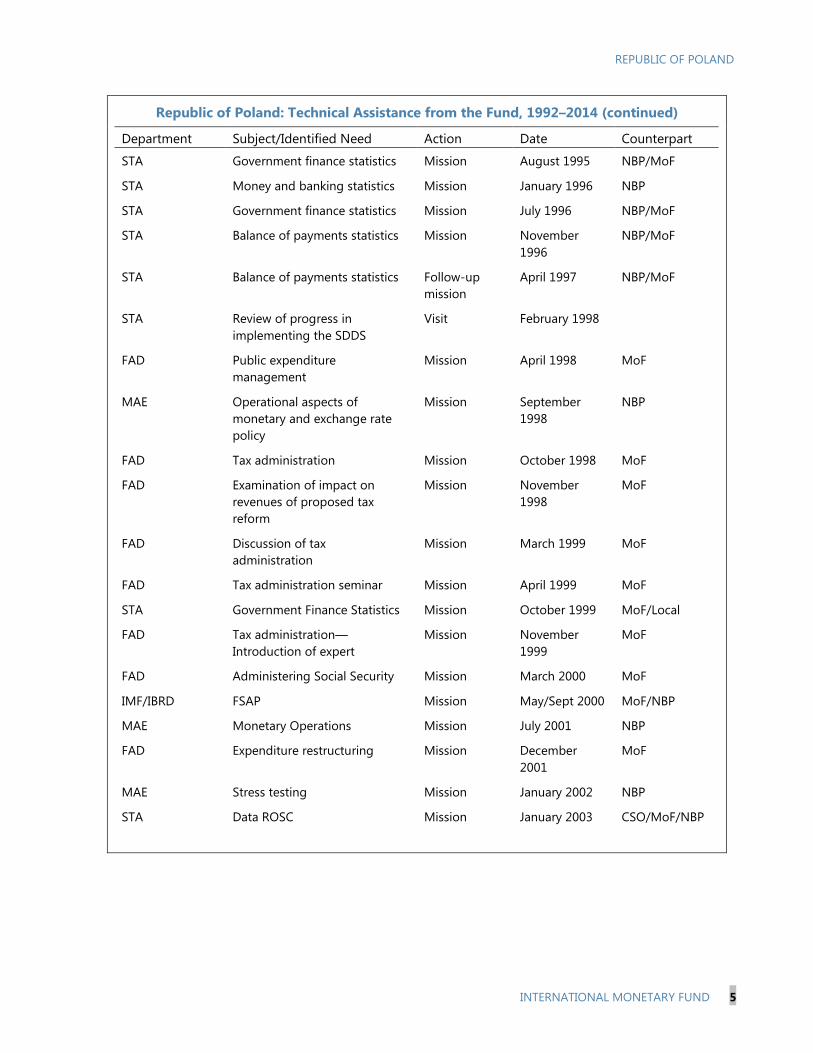
REPUBLIC OF POLAND
INTERNATIONAL MONETARY FUND 5
Republic of Poland: Technical Assistance from the Fund, 1992–2014 (continued)
Department Subject/Identified Need Action Date Counterpart
STA Government finance statistics Mission August 1995 NBP/MoF
STA Money and banking statistics Mission January 1996 NBP
STA Government finance statistics Mission July 1996 NBP/MoF
STA Balance of payments statistics Mission November
1996
NBP/MoF
STA Balance of payments statistics Follow-up
mission
April 1997 NBP/MoF
STA Review of progress in
implementing the SDDS
Visit February 1998
FAD Public expenditure
management
Mission April 1998 MoF
MAE Operational aspects of
monetary and exchange rate
policy
Mission September
1998
NBP
FAD Tax administration Mission October 1998 MoF
FAD Examination of impact on
revenues of proposed tax
reform
Mission November
1998
MoF
FAD Discussion of tax
administration
Mission March 1999 MoF
FAD Tax administration seminar Mission April 1999 MoF
STA Government Finance Statistics Mission October 1999 MoF/Local
FAD Tax administration—
Introduction of expert
Mission November
1999
MoF
FAD Administering Social Security Mission March 2000 MoF
IMF/IBRD FSAP Mission May/Sept 2000 MoF/NBP
MAE Monetary Operations Mission July 2001 NBP
FAD Expenditure restructuring Mission December
2001
MoF
MAE Stress testing Mission January 2002 NBP
STA Data ROSC Mission January 2003 CSO/MoF/NBP

REPUBLIC OF POLAND
6 INTERNATIONAL MONETARY FUND
Republic of Poland: Technical Assistance from the Fund, 1992–2014 (concluded)
Department Subject/Identified Need Action Date Counterpart
STA Government finance statistics
(GFSM 2001)
Mission October 2003 MoF
STA Government finance statistics
(GFSM 2001)
Mission January 2005 MoF
IMF/IBRD FSAP Update Mission April/May 2006 MoF/NBP
FAD Developing a multi-annual
fiscal framework
Mission June 2008 MoF
STA Errors and omissions in balance
of payments accounts
Mission July 2009 NBP
FAD Medium-term fiscal framework Mission April 2010 MoF
MCM Detailed assessment of
observance of BCP for effective
banking supervision
Mission Feb/March
2011
KNF
STA Errors and omissions in balance
of payments accounts
Mission June 2011 NBP
FAD Developing the fiscal regime
for oil and gas
Mission April 2012 MoF
MCM Macroprudential framework Mission May 2012 NBP
IMF/WB FSAP update Mission Feb/March
2013 MoF/ KNF/NBP
FAD Tax administration―
Modernization challenges and
strategic priorities
Mission November
2014 MoF
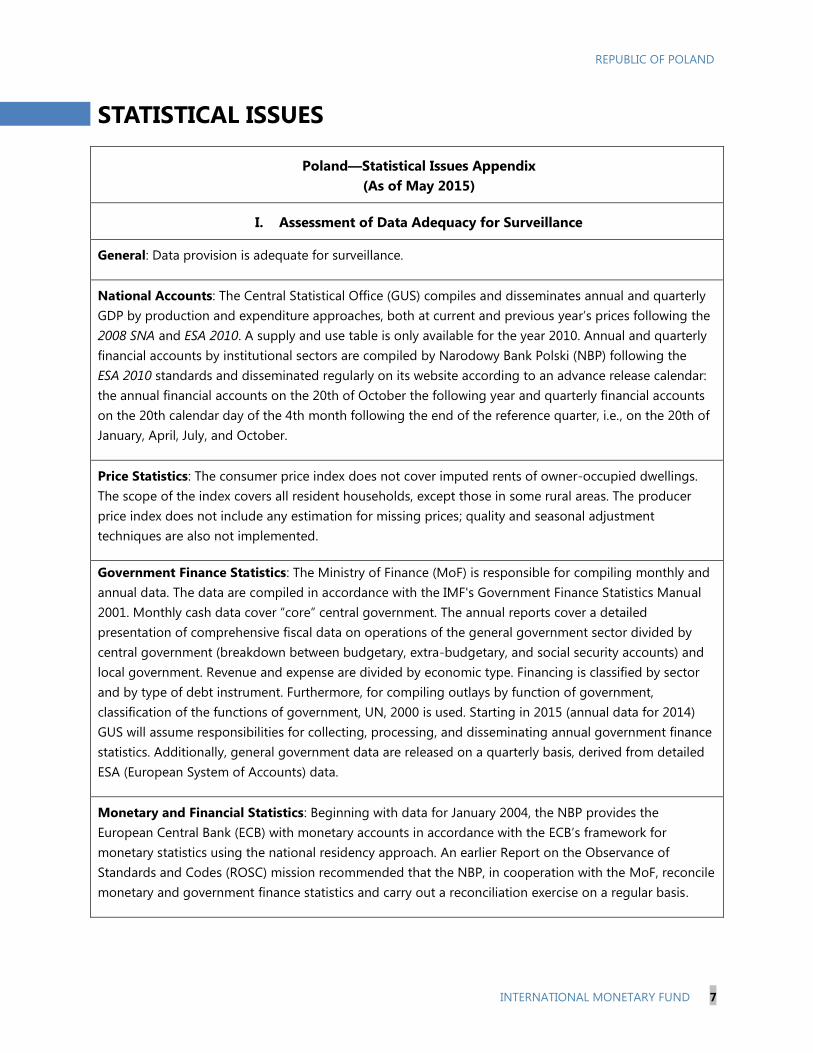
REPUBLIC OF POLAND
INTERNATIONAL MONETARY FUND 7
STATISTICAL ISSUES
Poland—Statistical Issues Appendix
(As of May 2015)
I. Assessment of Data Adequacy for Surveillance
General: Data provision is adequate for surveillance.
National Accounts: The Central Statistical Office (GUS) compiles and disseminates annual and quarterly
GDP by production and expenditure approaches, both at current and previous year’s prices following the
2008 SNA and ESA 2010. A supply and use table is only available for the year 2010. Annual and quarterly
financial accounts by institutional sectors are compiled by Narodowy Bank Polski (NBP) following the
ESA 2010 standards and disseminated regularly on its website according to an advance release calendar:
the annual financial accounts on the 20th of October the following year and quarterly financial accounts
on the 20th calendar day of the 4th month following the end of the reference quarter, i.e., on the 20th of
January, April, July, and October.
Price Statistics: The consumer price index does not cover imputed rents of owner-occupied dwellings.
The scope of the index covers all resident households, except those in some rural areas. The producer
price index does not include any estimation for missing prices; quality and seasonal adjustment
techniques are also not implemented.
Government Finance Statistics: The Ministry of Finance (MoF) is responsible for compiling monthly and
annual data. The data are compiled in accordance with the IMF's Government Finance Statistics Manual
2001. Monthly cash data cover “core” central government. The annual reports cover a detailed
presentation of comprehensive fiscal data on operations of the general government sector divided by
central government (breakdown between budgetary, extra-budgetary, and social security accounts) and
local government. Revenue and expense are divided by economic type. Financing is classified by sector
and by type of debt instrument. Furthermore, for compiling outlays by function of government,
classification of the functions of government, UN, 2000 is used. Starting in 2015 (annual data for 2014)
GUS will assume responsibilities for collecting, processing, and disseminating annual government finance
statistics. Additionally, general government data are released on a quarterly basis, derived from detailed
ESA (European System of Accounts) data.
Monetary and Financial Statistics: Beginning with data for January 2004, the NBP provides the
European Central Bank (ECB) with monetary accounts in accordance with the ECB’s framework for
monetary statistics using the national residency approach. An earlier Report on the Observance of
Standards and Codes (ROSC) mission recommended that the NBP, in cooperation with the MoF, reconcile
monetary and government finance statistics and carry out a reconciliation exercise on a regular basis.

REPUBLIC OF POLAND
8 INTERNATIONAL MONETARY FUND
I. Assessment of Data Adequacy for Surveillance (concluded)
Financial Sector Surveillance: In November 2009, NBP in cooperation with GUS, the Polish Financial
Supervision Authority (KNF) and MoF began reporting financial soundness indicators based on the IMF’s
Financial Soundness Indicators Compilation Guide. Data are reported on a quarterly basis with a lag of
approximately one quarter. NBP also implemented EU regulation 680/2014 which covers supervisory
reporting defined by the Implementing Technical Standards (ITS) prepared by the European Banking
Authority. The first data was collected for March 2014 for own funds and liquidity related reporting.
Financial reporting on a consolidated basis according to the ITS scheme was reported for the first time
for September 2014.
External Sector Statistics: Largely to improve data accuracy, the NBP fully depend on survey-based
source data, starting in the first quarter of 2010. STA undertook an evaluation mission to Poland in
July 2009, and followed up in June 2011 to assess further data improvements and anticipated revisions in
the external sector accounts. Due to the comprehensive work on improving the data sources, the errors
and omissions reduced from 4 percent of GDP in 2004 to around 2 percent of GDP in recent years, which
is comparable to the level in other European countries. Authorities are committed to further improving
the compilation system for the external sector statistics.
Poland, as all other EU countries, started disseminating balance of payments data in accordance with the
sixth edition of the IMF’s Balance of Payments and International Investment Position Manual (BPM6) and
external debt statistics in line with the 2013 External Debt Statistics: Guide for Compilers and Users (2013
EDS Guide).
Poland reports Coordinated Direct Investment Survey and Coordinated Portfolio Investment Survey data
to the IMF.
II. Data Standards and Quality
Subscriber to the Fund’s Special Data
Dissemination Standard (SDDS) since
April 17, 1996. Uses SDDS flexibility option on the
timeliness of the data on general government and
central government operations.
Data ROSC was published in 2003.
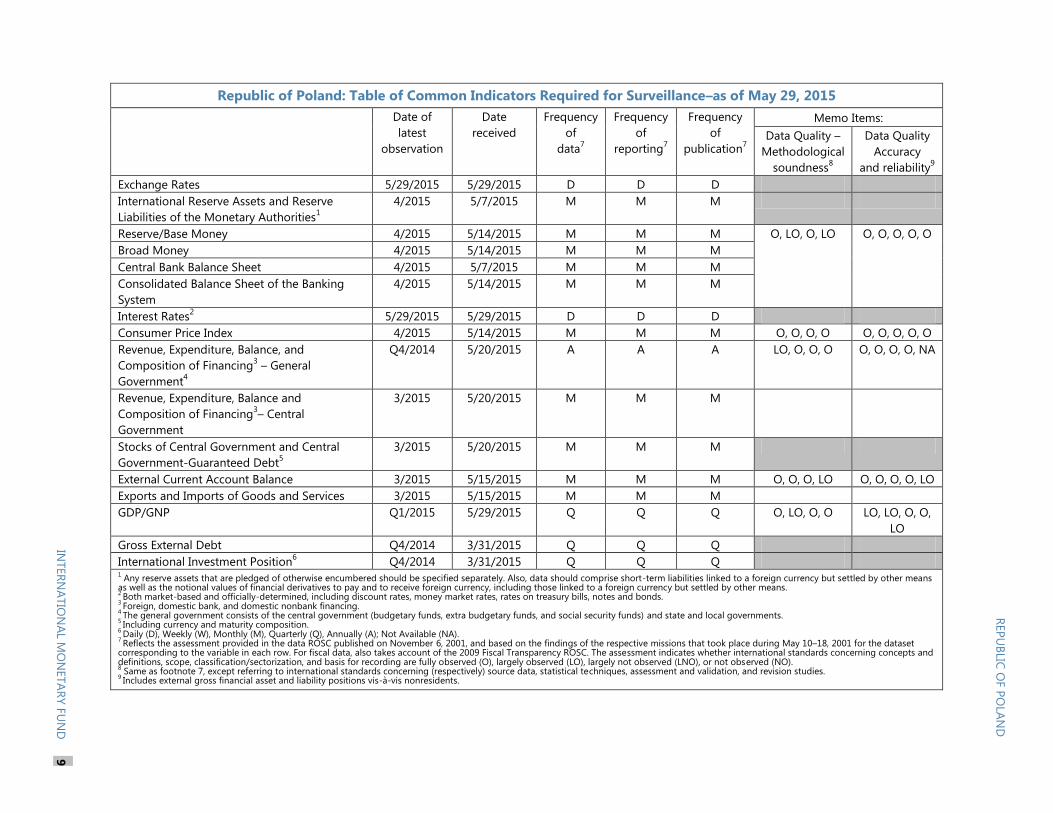
Republic of Poland: Table of Common Indicators Required for Surveillance–as of May 29, 2015
Date of
latest
observation
Date
received
Frequency
of
data7
Frequency
of
reporting7
Frequency
of
publication7
Memo Items:
Data Quality –
Methodological
soundness8
Data Quality
Accuracy
and reliability9
Exchange Rates 5/29/2015 5/29/2015 D D D
International Reserve Assets and Reserve
Liabilities of the Monetary Authorities1
4/2015 5/7/2015 M M M
Reserve/Base Money 4/2015 5/14/2015 M M M O, LO, O, LO O, O, O, O, O
Broad Money 4/2015 5/14/2015 M M M
Central Bank Balance Sheet 4/2015 5/7/2015 M M M
Consolidated Balance Sheet of the Banking
System
4/2015 5/14/2015 M M M
Interest Rates2
5/29/2015 5/29/2015 D D D
Consumer Price Index 4/2015 5/14/2015 M M M O, O, O, O O, O, O, O, O
Revenue, Expenditure, Balance, and
Composition of Financing3 – General
Government4
Q4/2014 5/20/2015 A A A LO, O, O, O O, O, O, O, NA
Revenue, Expenditure, Balance and
Composition of Financing3– Central
Government
3/2015 5/20/2015 M M M
Stocks of Central Government and Central
Government-Guaranteed Debt5
3/2015 5/20/2015 M M M
External Current Account Balance 3/2015 5/15/2015 M M M O, O, O, LO O, O, O, O, LO
Exports and Imports of Goods and Services 3/2015 5/15/2015 M M M
GDP/GNP Q1/2015 5/29/2015 Q Q Q O, LO, O, O LO, LO, O, O,
LO
Gross External Debt
Q4/2014 3/31/2015 Q Q Q
International Investment Position6 Q4/2014 3/31/2015 Q Q Q
1 Any reserve assets that are pledged of otherwise encumbered should be specified separately. Also, data should comprise short-term liabilities linked to a foreign currency but settled by other means
as well as the notional values of financial derivatives to pay and to receive foreign currency, including those linked to a foreign currency but settled by other means. 2 Both market-based and officially-determined, including discount rates, money market rates, rates on treasury bills, notes and bonds.
3 Foreign, domestic bank, and domestic nonbank financing.
4 The general government consists of the central government (budgetary funds, extra budgetary funds, and social security funds) and state and local governments.
5 Including currency and maturity composition.
6 Daily (D), Weekly (W), Monthly (M), Quarterly (Q), Annually (A); Not Available (NA).
7 Reflects the assessment provided in the data ROSC published on November 6, 2001, and based on the findings of the respective missions that took place during May 10–18, 2001 for the dataset
corresponding to the variable in each row. For fiscal data, also takes account of the 2009 Fiscal Transparency ROSC. The assessment indicates whether international standards concerning concepts and definitions, scope, classification/sectorization, and basis for recording are fully observed (O), largely observed (LO), largely not observed (LNO), or not observed (NO). 8 Same as footnote 7, except referring to international standards concerning (respectively) source data, statistical techniques, assessment and validation, and revision studies.
9 Includes external gross financial asset and liability positions vis-à-vis nonresidents.
INTER
NA
TIO
NA
L MO
NETA
RY F
UN
D 9
REP
UB
LIC O
F P
OLA
ND
Statement by Mr. Dominik Radziwill, Alternate Executive Director for Poland and
Ms. Joanna Osinska, Advisor to the Executive Director
July 10, 2015
The Polish economy has recovered from the temporary slowdown in 2012-13 and has
continued the progress in rebuilding policy buffers. Economic growth last year slightly
exceeded expectations, while continued fiscal consolidation efforts resulted in Poland’s exit
from the EU’s Excessive Deficit Procedure (EDP) one year ahead of schedule. External
position is consistent with fundamentals and appropriate policies. Financial sector remains
sound and resilient. Similarly to the developments in the rest of Europe, inflationary
pressures had subsided and in the second half of last year inflation turned negative.
Implementation of structural reforms has continued. Overall, the outlook is for robust growth
and gradual return of inflation towards the target over the medium term. At the same time,
risks remain tilted to the downside and dominated by external factors.
On behalf of our Polish authorities, we would like to thank staff for the constructive
consultations held in Warsaw and the timely and policy-relevant set of papers. The
authorities broadly agree with staff's assessment and policy recommendations.
Economic Outlook
Last year, real GDP growth was solid and amounted to 3.4 percent—twice as much as in
2013. The key factor behind this acceleration was domestic demand, which effectively
replaced net exports as the main growth engine (the latter was characteristic for periods of
weaker domestic demand, as in 2009 and 2012-13). Domestic demand was driven by higher
growth rate of private consumption and a boost in investment. Consumption was spurred by
rising employment, higher wages and low inflation, which translated into higher disposable
income. Investment benefitted from robust recovery in the credit growth on the back of eased
financial conditions. Relatively high competitiveness of Polish companies along with high
capacity utilization drove up investment demand.
Poland continues to rank among top EU growth performers. In the first quarter of 2015, real
GDP growth surprised on the upside by accelerating to 1.0 percent (q-o-q, sa) and its level
was 3.5 percent higher than a year ago. Domestic demand is expected to remain the main
growth driver this year, with overall economic growth performance in 2015 forecast to reach
at least 3.4 percent, before gradually rising to 4 percent in 2018. Looking ahead, economic
growth will be supported, among others, by increased inflow of the EU structural funds.
Poland is set to be the biggest beneficiary of the European multi-annual financial framework
for the years 2014-2020.
Along with economic growth, the labor market conditions have also been gradually
improving since mid-2013. Employment and activity rates have been increasing, while

2
unemployment has continued its downward trend, reaching 7.8 percent in May—well below
the EU average. This has been accompanied by steady growth in labor productivity.
External Sector
The current account (CA) deficit has been narrowing over the recent years. After reaching its
lowest level in over a decade at 1.3 percent of GDP in 2013, it remained unchanged last year.
In April, according to preliminary data, the CA deficit decreased to 0.6 percent of 12-month
GDP. Generally, since Q2 2013 exports have been supported by the rebound in the euro area
activity. The negative impact on the Polish trade from Russia/Ukraine crisis has been to a
large extent counterbalanced by redirection of exports towards other, more dynamic markets
as well as gains in price competitiveness. At the same time, imports have recently
strengthened due to the rapid acceleration of domestic demand. This has only partially been
mitigated by the positive effect of lower oil prices. The CA deficit continues to be
comfortably covered by the capital account surplus, driven mainly by stable inflow of the EU
funds.
External debt remains relatively stable at around 70 percent of GDP. Around two-thirds of
corporate external debt is either intercompany or trade credit, which substantially reduces the
roll-over risk. The official foreign reserves remain broadly adequate at about 114 percent of
the IMF’s modified composite reserve adequacy metric, as of end-2014. Their level has
slightly increased since the beginning of the year, in both EUR and USD-terms, to around
94 and 103 billion, respectively. In addition, Poland continues to benefit from the
precautionary Flexible Credit Line (FCL) arrangement with the Fund, since January this year
with a substantially lowered level of access—in line with the authorities’ request and their
exit strategy. The FCL provides an additional reserve buffer against external shocks and
helps strengthen investor confidence.
Fiscal Policy
The general government deficit last year was reduced to 3.2 percent of GDP—significantly
below the 3.9 percent level recommended for that year by the EU Council under the EDP
rules. In addition, taking into account the costs of the 1999 pension reform (still incurred in
the first half of 2014, despite the last year’s systemic changes), amounting to 0.4 percent of
GDP, the deficit was effectively reduced below the 3.0 percent of GDP reference value.
Consequently, it reached a level that enabled exit from the EDP—one year ahead of the
deadline set by the EU Council, and six years after the procedure for Poland had been
launched. General government debt also declined last year, to 50.1 percent of GDP, mainly
on account of the earlier changes in the pension system.1
1 Cf. our last year’s Buff statement for the Article IV consultation.

3
The correction of the excessive deficit creates some room for fiscal policy reflecting better
current economic situation. However, the authorities are committed to further reducing the
remaining imbalance in public finances, in a manner which would not pose a threat to
Poland’s medium-term growth prospects. Going forward, fiscal policy will be guided by
progressing towards the medium-term objective (MTO) of a structural deficit of 1 percent of
GDP. Achieving the MTO and keeping the government debt significantly below the
Maastricht reference value of 60 percent of GDP will, in particular, be ensured by full
compliance with the new stabilizing expenditure rule.2 Among structural fiscal measures, an
action plan aimed at improving tax compliance and effectiveness of tax administration has
been implemented since last year, which should help foster budget revenues already in the
near term.
Monetary Policy
Monetary policy in 2014 and early 2015 was conducted in an environment of low growth in
Poland’s main trading partners and falling commodity prices globally. Core inflation was
continuously low on the back of still negative output gap and moderate wage pressures. All
these factors have led to deflationary developments in the Polish economy. Average CPI
inflation for 2014 remained constant (0.0 percent).
Amid challenging external conditions, the Narodowy Bank Polski (NBP) strived to maintain
price stability, in line with its mandate, while at the same time supporting balanced economic
growth. Thus, the NBP cut the reference rate by 50 bps in 2014 and by another 50 bps in
2015, bringing its main policy rate to a new all-time low of 1.50 percent in March 2015. In
result, the policy rate has come down by a cumulative 325 bps since the onset of the easing
cycle in late 2012. Monetary policy easing has facilitated the gradual pick-up in economic
growth and continued improvement in labor market conditions.
Although CPI inflation has been negative since July 2014, deflation has eased somewhat over
the past few months. The Monetary Policy Council (MPC) expects that the gradual
acceleration of economic growth and good situation in the domestic labor market should
bring inflation back to the NBP’s target in the medium term. The MPC considers the current
level of NBP interest rates as consistent with ensuring price stability, while discouraging a
build-up of macroeconomic imbalances.
Financial Sector
The Polish financial sector has remained stable and resilient, supported by the economic
recovery. Banks maintain low leverage ratios, remain liquid, well-capitalized and highly
profitable. Despite record-low interest rates, the net profits of Polish banks have been stable
at the record high level since 2011. In line with recommendations issued by the Financial
2 Cf. our last year’s Buff statement for the Review under the FCL.

4
Supervisory Authority, banks maintained their capital buffers with the capital adequacy ratio
reaching 14.9 percent at the end of Q1 2015 and Tier 1 capital representing around
90 percent of total capital. At the same time, the liability structure of Polish banks has
improved as deposits have been growing faster than loans, reducing banks’ use of other
sources of funding. The reliance on parent bank funding has declined alongside the reduction
in the outstanding FX loans.
Credit flow to the economy has been growing at a steady pace, close to the nominal GDP
growth rate. As of May 2015, overall credit to the non-financial sector grew by 3.5 percent
(y-o-y, after exchange rate adjustment). This pace of credit growth does not create
imbalances in the economy, but also does not unnecessarily restrain economic growth.
Work is further progressing on measures to strengthen the financial sector and improve
supervision, including macroprudential and bank resolution frameworks. Regulatory and
supervisory actions to reduce the share of FX loans in new mortgage lending proved
successful with the FX mortgage portfolio in runoff mode since mid-2012. The effects of the
recent Swiss franc appreciation have been counterbalanced by lower Swiss interest rates,
thereby limiting the impact on debt service costs for borrowers. The authorities do not see the
remaining FX mortgage portfolio as a systemic problem, as both the banks and borrowers
have strong capital and income buffers to absorb shocks.
Loan-to-value limits for housing and commercial real estate loans, which came into force in
early 2014 and will be gradually tightened until 2017, should contribute to strong loan
quality going forward. While still high, the share of NPLs in non-financial sector have
slightly decreased over the past three years, on account of improving economic conditions
and sales of NPLs by some banks. The coverage of NPLs by provisions remains at a
comfortable level.
Structural Reforms
The authorities have continued to implement their structural reforms agenda. Based on a
number of integrated strategies, measures have been implemented to enhance growth
potential of the economy. These measures are aimed, among others, at improving the access
of companies to capital, stimulating entrepreneurship, strengthening business climate as well
as counteracting the adverse effects of progressing demographic changes on the labor market
and public finances. Among labor and product market policies: (i) the process of deregulation
of professions has continued; (ii) measures have been taken to reduce labor market
segmentation, including by better aligning civil law and temporary contracts with regular
contracts as well as limiting excessive use of fixed-term contracts; (iii) efforts have continued
to reduce the youth unemployment; (iv) a new housing rental program is in the pipeline to
help develop the rental market and facilitate regional labor mobility. Also, a pro-family
package—combining different benefits for families with children—is being carried out,
along measures to increase female labor force participation. This is expected to increase the
5
fertility rate and growth of labor supply in the long term. In addition, measures have also
been undertaken to further improve business environment and promote R&D and innovation.


