
PRELIMINARY – DO NOT CITE OR DISTRIBUTE WITHOUT PERMISSION
0
Impact of the Indiana Choice Scholarship Program: Achievement Effects for Students in
Upper Elementary and Middle School∗
R. Joseph Waddington Mark Berends Assistant Professor Professor of Sociology 131 Taylor Education Building 1017 Flanner Hall University of Kentucky University of Notre Dame Lexington, KY 40506 Notre Dame, IN 46556 [email protected] [email protected]
This manuscript is currently under review (revise-and-resubmit) at an academic journal.
Abstract
As one of the largest voucher programs in the U.S., the Indiana Choice Scholarship Program has over 34,000 students participating to date. This paper examines the impact of the voucher program for students in upper elementary and middle school who use a voucher to transfer from a public to a private school during the 2011-12 through 2014-15 school years—the first four years of the program. We analyze longitudinal data for students (grades 3-8) and use multiple approaches to estimate impacts of the voucher program due to the uniqueness of Indiana public and private schools taking the same standardized assessment over time. Overall, students who receive a voucher experience an average annual loss of 0.10 standard deviations in mathematics after attending a private school compared with matched public school students. The largest math losses occur during the first and second year that voucher students attend a private school. Voucher students remaining in private schools improve in math in later years. In English Language Arts (ELA), we find no statistically meaningful overall effects. However, special education voucher students experience an average annual loss of 0.13 standard deviations in ELA, while voucher students attending Catholic schools experience small annual gains in ELA. Across both subjects, voucher students who exit private schools and return to public schools experience modest-to-substantial achievement losses during their time in private schools. We situate these results in the context of Indiana’s voucher program and recent voucher research, and we conclude the paper by suggesting some future research that may help explain our findings.
∗Author order was determined randomly; each contributed equally to this paper. This paper was supported by Notre Dame's Center for Research on Educational Opportunity (CREO), Institute of Educational Initiatives, the Spencer Foundation, and the Walton Family Foundation. We are grateful to the Indiana Department of Education for providing access to the state administrative records and for supporting independent analyses. We are also grateful for the substantial feedback we have received from numerous colleagues over several versions of this paper. All opinions expressed in this paper represent those of the authors and not necessarily the institutions with which they are affiliated. All errors in this paper are solely the responsibility of the authors. For more information, please visit the CREO website at http://creo.nd.edu/people/faculty/mark-berends.

PRELIMINARY – DO NOT CITE OR DISTRIBUTE WITHOUT PERMISSION
1
Impact of the Indiana Choice Scholarship Program: Achievement Effects for Students in Upper Elementary and Middle School
Educational inequalities are increasing at a troublesome rate (Gamoran, 2015). Test score
trends in the U.S. reveal educational disparity by socioeconomic origins has become worse in the
last decade (Reardon, 2011; Reardon et al., 2015); students in poor families are more and more
likely to be segregated in poor neighborhoods (Sharkey, 2013); students who are poor, African
American, or Latino attend schools that have become more segregated over the past twenty-five
years (Orfield & Frankenberg, 2014); and middle- and high-income families are raising their
investment in their children’s education-related activities at a faster rate than poor families
(Kaushal, Magnuson, & Waldfogel, 2011). These increasing inequalities have disturbing
implications for the schooling options available to students from different socioeconomic and
racial/ethnic groups (Lareau & Goyette, 2014).
One controversial educational policy that seeks to address these problems is school
choice—specifically, school vouchers (or scholarships) provided to families so they can send
their children to the schools of their choice, whether public or private, religious or non-religious.
If voucher programs are succeeding, we would expect that participating students are
experiencing new opportunities to learn, increasing their achievement growth, and closing
socioeconomic and racial/ethnic achievement gaps. In this paper, we assess those expectations by
examining the impact of Indiana’s Choice Scholarship Program (ICSP)—the largest voucher
program of its type in the U.S.—on student math and English/Language Arts (ELA)
achievement. Despite the program’s large size, little is known about its effects on Indiana
schools and students.
This study aims to address this gap in a context where vouchers have not been randomly
assigned to families in Indiana. Instead, our analysis uses a rich set of longitudinal, student-level

PRELIMINARY – DO NOT CITE OR DISTRIBUTE WITHOUT PERMISSION
2
records for public and private school students in grades 3-8. We use a variety of estimation
strategies to examine the program’s impact on students receiving a voucher and switching from a
public to a private school during the first four years of the voucher program (2011-12 through
2014-15). This group of voucher students aligns with the initial eligibility requirements and
intent of the Indiana voucher program. Our research questions are as follows:
• What is the impact of receiving a voucher and switching to a private school on student
math and ELA achievement compared to peers remaining in public schools?
• What are the differences in voucher impacts over time since first receiving a voucher?
• What are the differences in voucher impacts across various subgroups of students (i.e., by
sex, race/ethnicity, English proficiency, or special education status) or private schools
(i.e., Catholic vs. Other Religious, or urban locale)?
Overall, we find that students who use a voucher to attend private schools experience
modest average annual achievement losses in mathematics and no effects in ELA. The losses in
mathematics are greatest for students in the first two years after receiving a voucher and dissipate
for those who remain in the program and attend private schools for three or four years. However,
these estimates are less precise because of the small number of students we can track for three or
four years. We also find significant differences across some subgroups of students. Students who
exit a private school after receiving a voucher and return to a public school experience the largest
losses in both subjects. Catholic school voucher students experience small gains in ELA.
Our research contributes to the existing school voucher literature in three distinct ways.
First, as stated above, Indiana’s statewide school voucher program is the nation’s most expansive

PRELIMINARY – DO NOT CITE OR DISTRIBUTE WITHOUT PERMISSION
3
in terms of enrollment and providing scholarships to both low- and modest-income families.1
Second, our study is one of only a handful that finds modest and statistically significant negative
effects of school vouchers on student achievement outcomes. Third, we examined the effects of a
voucher program that operates within a different context from other programs, whereby many
private schools were participating in statewide accountability testing prior to the implementation
of the voucher program. Finally, unlike other statewide studies that cover a shorter time frame
(Abdulkdiroglu et al., 2015, Figlio & Karbownik, 2016; Mills & Wolf, in press), we can examine
the impact for students who have received a voucher to attend private schools up to four years.
In what follows, we provide a brief background on the Indiana voucher program and the
evidence about the effects of vouchers on student achievement based on prior rigorous research.
We go on to describe the data and our approach to analyzing the effects of the first four years of
the statewide program. We conclude with the results and a discussion of their implications.
THE INDIANA CHOICE SCHOLARSHIP PROGRAM
Currently, sixteen states have voucher programs, and 178,261 students are using them to
attend private schools (EdChoice, 2017). In Indiana, which has the largest program, 34,299
students received a voucher during the 2016-2017 school year and 313 private schools
participated (76 percent of private sector schools statewide) (Indiana Department of Education,
2017). Authorized in 2011, the Indiana Choice Scholarship Program (ICSP) provides state
payments to qualifying Indiana families to help offset tuition at participating schools. When the
program began, students qualified for vouchers based on their prior enrollment in a public school
and their family’s total household income. The scholarship’s dollar amount is based on the
1 The State of Ohio has more students enrolled in voucher programs across the state. However, these students are
spread across five different programs, each with their own eligibility criteria and focus.

PRELIMINARY – DO NOT CITE OR DISTRIBUTE WITHOUT PERMISSION
4
public school corporation in which students live, with an average in grades 1-8 of about $4,700
(Indiana Department of Education, 2017). The program made available 7,500 vouchers for the
2011-2012 school year and 15,000 in 2012-2013. Starting in 2013-2014, the state removed the
cap on the number of eligible Indiana students who can receive a scholarship. It also expanded
the criteria for eligibility to include kindergarten students, siblings of voucher students, special
education students, and those located in the attendance zones of failing public schools.
Although researchers have studied the effects of various school voucher programs and
policies over the past two decades (for reviews see Austin & Berends, in press; Epple, Romano,
& Urquiola, 2015; Figlio, 2009; Shakeel, Anderson, & Wolf, 2016; Zimmer & Bettinger, 2015),
the Indiana voucher program is unique.2 Unlike other programs, the ICSP is aimed at both low-
and modest-income families. Low-income families may obtain vouchers for up to 90 percent of
tuition at a participating private school if their annual income is equal to or less than 100 percent
of the amount to qualify for free or reduced-price lunch (FRPL) under the National School
Lunch Program (Indiana Department of Education, 2017). For a four-person household, that
amount is $44,955. Moderate-income families may obtain 50 percent vouchers if their annual
income is equal to or less than 150 percent of the amount to qualify for FRPL; for a four-person
household, that amount is $67,433 (Indiana Department of Education, 2017).
2 With the new Trump administration and discussions about turning Title I money into vouchers and the possibility
of bundling state and federal education funds, states like Indiana may be poised to significantly expand their voucher
programs (Berends, in press). Thus, understanding the effects of Indiana’s student voucher use informs state and
national education policy at a critical time.

PRELIMINARY – DO NOT CITE OR DISTRIBUTE WITHOUT PERMISSION
5
VOUCHER RESEARCH ON STUDENT ACHIEVEMENT OUTCOMES
Voucher programs are typically aimed at low-income families to offer educational
opportunities they may not otherwise access: schools that better meet their children’s academic
needs. Proponents claim that, as more schools compete for students, all schools will become
more effective in encouraging positive student outcomes, especially for low-income students
(Chubb & Moe, 1990). Friedman (1955, 1962) was one of the first to use this market theory,
arguing that the cost of K-12 education should be covered by the government but parents should
be able to choose the schools their children attend, whether public or private. Toward this end,
Friedman promoted giving parents government vouchers as a way to accomplish a system of
education that was publicly financed but delivered privately and publicly.
Critics, however, raise questions about the empirical validity of the market theory’s key
assumptions about parents as consumers (demand-side), schools (supply-side), and the products
that a market in education would generate (Austin & Berends, in press; Finnegan, 2007; Henig,
1995; Hess, 2002, Levin, 1998). They emphasize that public schools support the “common
school” model that promotes civic and democratic values among its students. In this light, critics
argue, vouchers may increase already existing inequalities by skimming off the best students,
decrease support of public schools due to falling enrollments in an era of fiscal challenges, and
undermine our democracy. Moreover, students who transfer with vouchers may experience
achievement losses because student mobility is often associated with negative school outcomes,
independent of the quality of the school (Grigg, 2012; Schwartz, Stiefel, & Cordes, in press).
With the global expansion in the number of voucher programs, research addressing the
effects of these programs has increased as well (Berends, in press). Evidence can be drawn from

PRELIMINARY – DO NOT CITE OR DISTRIBUTE WITHOUT PERMISSION
6
both publicly- and privately-funded voucher programs in the U.S. and from international
research (Epple et al., 2015; Figlio, 2009; Shakeel et al., 2016; Zimmer & Bettinger, 2015).
A number of voucher studies have focused on specific cities—Milwaukee (Greene,
Peterson, and Du, 1998, 1999; Rouse, 1998; Witte, 2000; Witte et al., 2014), Charlotte (Cowen,
2008; Greene, 2001), Cleveland (Metcalf et al., 2002), Dayton (Howell & Peterson, 2006), New
York City (Barnard et al., 2003; Jin, Barnard, & Rubin, 2010; Krueger & Zhu, 2004) and
Washington, DC (Howell & Peterson, 2006; Wolf & McShane, 2013; Wolf et al., 2010, 2011,
2013). Generally, the experimental and quasi-experimental research in these cities shows either
modest positive effects on student test scores for certain subgroups of students and for certain
years of program participation, or no effects at all (Austin & Berends, in press; Epple et al.,
2015; Figlio, 2009; Zimmer & Bettinger, 2015).3
More recent statewide studies on the impact of voucher programs in Louisiana and Ohio
have shown negative effects on student achievement. Abdulkdiroglu et al. (2015) examined the
Louisiana Scholarship Program, analyzing data between 2008 (the first year of the program) and
2012. Following students who won and lost the lottery for a scholarship, Abdulkdiroglu et al.
found significant and large negative effects for students who participated in the first year of the
voucher program—with declines of 16 percentile points in math and 14 percentile points in
reading. The effects were consistent across income groups, geographic areas, and private school
characteristics (higher and lower proportion of white students, enrollment, achievement scores,
and whether the private school was Catholic).
3 The exception to these overall findings is a recent study in Washington, DC, on the DC Opportunity Scholarship
Program that found negative effects in mathematics after the first year of the program (Dynarski et al., 2017).

PRELIMINARY – DO NOT CITE OR DISTRIBUTE WITHOUT PERMISSION
7
Mills & Wolf (in press) investigated the Louisiana program through its second year,
reporting negative effects in both math and reading in year one, but less negative effects in year
two. Only the effects for mathematics were statistically significant. In mathematics in year two,
they found that students who won the voucher lottery and transferred to a public school scored
0.34 of a standard deviation below those students who lost the voucher lottery. “The magnitude
of these negative estimates,” the researchers wrote, “is unprecedented in the literature of random
assignment evaluations of school voucher programs” (p. 2).
These findings are consistent with what Figlio & Karbownik (2016) found in their
evaluation of the Ohio EdChoice Scholarship Program. The researchers used propensity score
matching to estimate the program’s effects because the program did not rely on a lottery to
provide scholarships. Analyzing student-level data between 2007 and 2010, with several
estimation specifications, they found significant negative effects on both reading and
mathematics scores: about -0.40 to -0.20 standard deviations in reading and -0.60 to -0.45
standard deviations in mathematics.
In our study of the ICSP, we also find negative effects in mathematics for students who
transfer from public to private schools with a voucher. However, our research differs from
evaluations of the Louisiana and Ohio statewide voucher programs in a number of ways. Unlike
Louisiana and Ohio, students in Indiana’s public and private schools have all taken the same
state tests for a number of years. Thus, our findings come from a state context where annual
testing in grades 3-8 is common across the board, particularly in a broad sample of over 300
voucher-participating private schools. In the year prior to the voucher program (2010-2011), the
average private school has achievement 0.1 to 0.2 standard deviations above the state mean in
both math and ELA. While average private school achievement varies substantially, there are

PRELIMINARY – DO NOT CITE OR DISTRIBUTE WITHOUT PERMISSION
8
many higher performing private schools participating in Indiana than in other states.4 In addition
to broader income eligibility in Indiana, students from all public schools are eligible as opposed
to just those enrolled in the lowest performing schools as in Ohio. While students in low- or
modest-income families may be eligible to receive a voucher, we focus on the lowest-income
students for estimation purposes and better comparisons of our findings with other contexts.
DATA AND MEASURES
Data Description
We use six years (2009-2010 school year through 2014-2015) of longitudinal, student-
level demographic and test score records for this study, obtained through a data-sharing
agreement with the Indiana Department of Education. The records contain information about
students attending public (traditional, charter, and magnet) and private schools (including
voucher and non-voucher students), which participate in the Indiana Statewide Testing for
Educational Progress Plus (ISTEP+) program. The ISTEP+ is aligned to the Indiana Academic
Standards and serves as the main accountability-linked assessment for Indiana students in grades
3-8. Testing has taken place each spring since 2009 in mathematics and English/language arts
(ELA) (Indiana Department of Education, 2011).5
Indiana is unique because many private schools participate in the ISTEP+ program and
other state reporting (304 schools statewide as of 2015). Participation in ISTEP+ testing is a
4 Most elite, non-sectarian private schools do not participate in the voucher program.
5 The ISTEP+ is vertically equated across grades and consists of multiple-choice, constructed-response, and
extended-response items scored using item response theory methods. Reliability coefficients range from 0.88 to 0.94
in ELA and 0.88 to 0.95 in math (Indiana Department of Education, 2011).

PRELIMINARY – DO NOT CITE OR DISTRIBUTE WITHOUT PERMISSION
9
requirement of all private schools participating in the voucher program.6 However, nearly all K-8
Catholic schools and over 80 other K-8 private schools, participated in statewide testing as part
of their accreditation process for several years prior to the start of the voucher program.
Additional private schools began taking the ISTEP+ after starting participation in the voucher
program. All students in private schools enrolling students with vouchers take the test, regardless
of whether an individual student received a voucher.
The robust annual participation in statewide testing and other reporting by private schools
offers several advantages. First, we can make apples-to-apples achievement comparisons
between voucher private and non-voucher public school students. Second, the number of
participating schools and the testing of non-voucher private school students allows us to better
describe the academic composition of the private school sector in Indiana. Third, because each
student’s testing records are longitudinally-linked, we can observe changes in an individual
student’s achievement over time, regardless of the sector in which they are enrolled.
Measures
The primary outcomes of interest are students’ annual ISTEP+ test scores in mathematics
and ELA. These are the two subjects tested annually during grades 3-8. We standardized each of
the scaled test scores relative to the mean and standard deviation of students statewide within
6 The Indiana Department of Education holds voucher program-participating private schools accountable through
their performance on the ISTEP+ assessment by restricting their ability to enroll students receiving vouchers should
the school have two consecutive years of poor testing performance.

PRELIMINARY – DO NOT CITE OR DISTRIBUTE WITHOUT PERMISSION
10
each subject, grade, and year of testing.7 The standardized measures allow us to draw
comparisons, in standard deviation (SD) units relative to the state average of all test takers.
We use several student-level demographic and background characteristics reported in the
IDOE data, including indicators of each student’s gender, race/ethnicity, free or reduced-price
lunch status, English Language Learner status (ELL), special education status, and grade level.
We created an indicator for grade retention from the previous year. We also observe whether a
student receives a voucher in each year. This allows us to construct an annual indicator of
voucher receipt and a measure of the total number of years a student received a voucher.
Along with voucher recipient status, we also observe the student’s school of record
within each year. The school records contain each school’s unique National Center for Education
Statistics (NCES) unique identification number. Using the NCES ID, we linked the schools to
the Common Core of Data (CCD) and the Private School Universe Survey (PSS) to augment and
enhance the available school-level data.8 We used these data to create binary indicators of the
school type (e.g., public, charter, magnet, Catholic, or other private) and private school locale
(urban, suburban, or town/rural). We manually enter this information for schools with missing
7 Although the ISTEP+ is vertically equated, we do not use scaled scores for our outcome as the variation in scales
differs between grade levels. This introduces additional measurement error; however, we adjust for differences
between years and across tests by controlling for grade-by-year fixed effects in all models.
8 The CCD contains annual demographic and background information for the universe of public schools. Similarly,
the biennial PSS contains similar information for private schools. We applied CCD data to all public schools for
each corresponding year, except 2014-2015, for which we use data from the 2013-2014 CCD. Similarly, we applied
PSS data from the most recent prior year to all private schools. Private schools in the IDOE data from 2011-2012
through 2014-2015 contain PSS information from 2011-2012, the last year of publicly available data.

PRELIMINARY – DO NOT CITE OR DISTRIBUTE WITHOUT PERMISSION
11
data. With the school identifiers, we created several aggregate measures using student-level data,
including average school math and ELA achievement as well as various counts of students.
With information about schools, we created two student mobility indicators to identify all
students who switch schools between years, regardless of whether a student changes school type
(e.g., public to private). The first indicates whether a student made a structural move due to
normal grade progression. The second indicates whether a student made a nonstructural move
(switching schools for any other reason; we do not observe the underlying reasons). Both
variables indicate a switch only in the school year immediately after the switch took place (t),
even though the switch takes place between years t and t-1. There is a negative association
between mobility and student achievement (see Schwartz, Steifel, & Cordes, in press), so these
indicators enable us to parse out the impact of switching schools from any voucher impacts.
ANALYTICAL SAMPLE AND ESTIMATION STRATEGY
Our main research question pertains to the academic achievement of voucher students
who attend private schools. In an ideal experimental setting, voucher-eligible students attending
public schools ideally would be randomly assigned an offer to receive a voucher. We could then
estimate unbiased intent-to-treat effects of being offered a voucher on student achievement by
comparing the achievement gains of students offered and not offered a voucher. We would then
also be able to use this assignment as an instrument in a two-stage least squares approach for
actual voucher use and attendance in a private school. Here, we could obtain the treatment-on-
the-treated effects of private school attendance on student achievement. Many voucher programs

PRELIMINARY – DO NOT CITE OR DISTRIBUTE WITHOUT PERMISSION
12
(e.g., Milwaukee, New York City, Washington, DC, Louisiana) either randomly assigned
vouchers or held voucher lotteries, enabling researchers to estimate causal effects.9
In Indiana, vouchers were not randomly assigned to students through the Indiana Choice
Scholarship Program. Thus, it is challenging to assess the causal effects of receiving a voucher
and attending a private school on student outcomes. Individual private schools participating in
the voucher program are not required to hold lotteries to determine enrollment, except for
oversubscribed schools. Most private schools had an excess supply of available seats over the
period of our study, and we found no private schools that implemented enrollment lotteries.10 We
do observe any student who receives a voucher and attend a private school in grades 3-8.11
Without a random assignment of vouchers or a natural experiment such as a lottery, any
assessment of the effects of Indiana’s voucher program is subject to selection bias. Choosing to
apply for and receiving a voucher depends on the active choices of parents and their children.
These choices typically depend on student background, parental preferences, motivation, and
available opportunities in public or other choice (e.g., charter, magnet) schools. For example, if
students with high aptitude or motivation apply for and receive a voucher, then the performance
of voucher students might appear better than non-voucher students because of potentially
unobserved background differences between students. Thus, we cannot simply compare the
achievement of voucher and non-voucher students.
9 Many recent evaluations of charter schools (e.g., Abdulkadiroglu et al., 2011; Angrist et al., 2012; Dobbie & Fryer,
2011; Clark et al., 2015) use a similar approach in instances where charter schools hold enrollment lotteries.
10 We contacted each of the five Catholic dioceses in the state, the Indiana Non-Public Education Association, and
the Indiana Department of Education to confirm this in the first years of the voucher program.
11 We observe very few voucher “decliners,” or students who apply for a voucher but do not receive one. From
principal and parent interviews, families only apply for vouchers if they know they meet the eligibility criteria.

PRELIMINARY – DO NOT CITE OR DISTRIBUTE WITHOUT PERMISSION
13
Given the availability of longitudinal data and the eligibility criteria of the Indiana
Choice Scholarship Program, we take several steps to mitigate selection bias. First, we describe
the process of creating a comparable sample of students who receive a voucher and attend a
private school and students who do not receive a voucher and remain enrolled in a public school.
Then, we describe multiple strategies used to estimate the effects of the voucher program on
student achievement. For both the sample construction and estimation strategies, we draw upon
important lessons from recent literature that uses non-experimental approaches to replicate the
experimental estimates of school choice evaluations (Anderson & Wolf, 2017; Bifulco, 2012;
Fortson, Gleason, Kopa, & Verbitsky-Savitz, 2014).
We implemented several data restrictions prior to sample construction (see Appendix A),
including requiring each student to have three years of valid test scores. After these restrictions,
we have a possible sample of 11,828 voucher students and 551,110 public school students.
Voucher Student Sample
A student must meet several eligibility criteria to qualify for a voucher in Indiana. One
criterion from the initial implementation of the policy was that a student had to be enrolled in a
public school (either traditional public, charter, or magnet) for at least one year immediately
prior to receiving a voucher. In our cleaned data, 4,415 students moved from a public to a private
school for the first time after receiving a voucher.12 Of the students who were once enrolled in a
private school without a voucher, 209 left for one year to attend a public school, and returned to
a private school after receiving a voucher.13 The other 7,204 students received a voucher while
12 Some of these students eventually exit a private school after receiving a voucher and return to a public school. We
include both students who remain in a private school and those who return to a public school in our analysis.
13 We believe these 209 students and their families made these decisions to become eligible for a voucher.

PRELIMINARY – DO NOT CITE OR DISTRIBUTE WITHOUT PERMISSION
14
previously enrolled in a private school, largely a result of expanded voucher eligibility criteria
beginning in the 2013-2014 school year.14
There are several advantages to focusing our analysis on the voucher students moving
from a public to a private school for the first time. First, this movement is typical of other
voucher programs, and most evaluations compare voucher and public school students. With
longitudinal records of public school students, we can draw comparisons of voucher students
switching to private schools with students remaining in public schools and not receiving a
voucher. Second, previous enrollment in a public school allows us to establish a baseline level of
student achievement before receiving a voucher and attending a private school. We could
establish a baseline prior to receiving a voucher for students previously enrolled in a private
school; however, these students have prior private school experience. We display comparisons of
all voucher and non-voucher private school students in Appendix Table 1. We find voucher
students who were always enrolled in private schools are much higher achieving and less
diverse.
The second eligibility criterion for all voucher students is based on family income. The
voucher income thresholds based on household size directly correspond to the thresholds for
reduced-price lunch eligibility (Indiana Department of Education, 2017). Students in families at
or below the income threshold for reduced-lunch eligibility can receive a “90 percent” or “full”
voucher for tuition at a private school. Students in families at or below 150 percent of the income
threshold for reduced-lunch eligibility can receive a “50 percent” or “half” voucher.
Because of the direct correspondence with reduced-price lunch eligibility, we focus on
the 3,913 voucher students switching from public to private schools that either receive a “full”
14 Of these students, 663 later attended public school while 6,541 were always enrolled in a private school.

PRELIMINARY – DO NOT CITE OR DISTRIBUTE WITHOUT PERMISSION
15
voucher or received free or reduced-price lunch in the year prior to receiving a voucher. We refer
to this group of voucher students as “low income.”15 We find non-low income voucher students
have much higher achievement before receiving a voucher and are less diverse.
Public School Comparison Student Sample
As our voucher student sample consists of students leaving public schools to attend
private schools, not all Indiana public schools are represented. One of the important takeaways
from the education within-study comparison literature and broader quasi-experimental literature
(for example, see Cook, Shadish, & Wong, 2008) is that treatment and comparison groups should
be drawn from the same geographic location (i.e., the same school). We further constrain our
public-school comparison sample to include only public school students in the same grade, year,
and school as a student who receives a voucher and attends a private school the following year.16
This process also establishes a baseline year from which we can draw comparisons between
voucher and public school students over time.
Because voucher eligibility is based on family income, we further constrain the public-
school comparison group to students who also receive free or reduced-price lunch in the baseline
or first post-baseline year. By constraining our sample, we can draw more relevant comparisons
between voucher students and non-voucher public students who would also be “voucher-
eligible.” In effect, this mitigates the unobserved influence that family income may have on
selecting to attend a private school. This leaves 121,524 low-income public school students in
15 As income fluctuates, we wanted to account for indications that a family is low-income in either the year before
receiving a voucher (baseline year) or the year after. We use a similar procedure for public school students.
16 Some public school students have peers who leave to attend a private school with a voucher across several grades
and years. To avoid replicating individual students in our sample, we randomly choose which of a given public
school student’s years serves as the baseline year.

PRELIMINARY – DO NOT CITE OR DISTRIBUTE WITHOUT PERMISSION
16
the same school as a voucher student who leaves to attend a private school in the subsequent
year. We provide a descriptive comparison of all public school students in Appendix Table 2.
Student Descriptive Characteristics
In Table 1, we describe the sample of 3,913 voucher and 121,524 public school low-
income students that were enrolled in the same public school and grade during the baseline year.
For each student, we have data from at least three years: pre-baseline, baseline, and at least one
year post-baseline. For our descriptive analysis and all subsequent empirical model estimates
with this sample, we weight the sample to compare equal numbers of voucher and public school
students within each public school, grade, and year at baseline.17
More than half of the low-income voucher students are racial or ethnic minorities, with a
slightly lower proportion of black students (0.230) and higher proportion of Latino/a students
(0.235) relative to their low-income public school peers (0.272 proportion of black students and
0.184 of Latino/a students). The proportion of voucher students classified as English Language
Learners is 0.124 and as special education students is 0.118 at baseline. In the voucher sample,
ELL students are overrepresented and special education students underrepresented compared to
the public school peer sample. Over half of the low-income voucher and public school students
are attending urban public schools at baseline.
In terms of academic achievement, low-income voucher students are lower achieving
compared to the state average by nearly one-fourth of a standard deviation (SD) in both math and
ELA. However, voucher students are higher achieving than their public school peers by about a
tenth of a SD in both subjects. Overall, the low average achievement and diversity of low-
17 Each voucher student has a weight of 1 and each public student has a weight of the total number of voucher
students divided by the total number of public students in each public school, grade, and year at baseline.

PRELIMINARY – DO NOT CITE OR DISTRIBUTE WITHOUT PERMISSION
17
income voucher students previously attending public schools suggests that private schools are
not “cream-skimming” the best students from public schools who are eligible for a voucher.
While Table 1 provides a comparison between low-income voucher and public school
students, it is also important to compare back to all other private school students for context (see
Appendix Table 1). Low-income voucher students switching from public to private schools tend
to be more demographically and academically diverse as well as lower achieving at baseline than
their non-low-income voucher peers making the same public to private schools. The differences
in demographic and academic composition is particularly stark when comparing to voucher
students always enrolled in a private school (receiving a voucher or not). Thus, low-income
voucher students are moving into environments substantially behind their peers in terms of
academic achievement (by up to a half of a SD).
Propensity Score Matching
Although we have specifically focused on low-income voucher and public school
students who are more closely aligned than a broader sample of public school students, we still
find a number statistically meaningful differences between the two groups at baseline. These
differences on several observable dimensions suggests that students in the two groups may also
differ on unobservable dimensions. If we do not fail to account for these differences at baseline,
our results may still be subject to selection bias.
Given that qualified students and their families choose to receive a voucher and switch to
a private school for many observed and unobserved reasons, we use propensity score matching
(PSM) to further align our treatment group of low-income voucher students and comparison
group of low-income students remaining in public schools. Pioneered by Rosenbaum & Rubin
(1983), PSM has grown in popularity across disciplines as a mechanism to account for selection

PRELIMINARY – DO NOT CITE OR DISTRIBUTE WITHOUT PERMISSION
18
bias in observational studies. It is one of the primary techniques used in the within-study
comparisons we previously described. In using PSM, we attempt to account for selection bias by
modeling a host of observable characteristics measured prior to treatment to predict the
likelihood, or propensity, of receiving a voucher to attend a private school. Then, we match low-
income voucher students who attend a private school with their low-income peers remaining in a
public school that share a similar propensity of receiving a voucher.
Our first step in the propensity score matching approach is to use a linear composite of
carefully chosen pre-treatment (baseline) covariates to predict voucher receipt. Following the
suggestions of the within-study comparison literature, we include pre-treatment measures of our
two primary outcome variables (math and ELA test scores) as predictors in the propensity score
model. We also include second and third order polynomials of test scores as well as achievement
in the pre-baseline year to account for any test score trends.
In addition to test scores, we also include baseline information about the student’s sex,
race/ethnicity, special education status, English Language Learner status, whether the student
was retained in the baseline year, whether the student attended a charter or magnet school, and
public school urban locale. We also include several interactions between the baseline
achievement variables and various demographic and academic background characteristics as well
as between race/ethnicity and several academic background characteristics. We account for
selection effects by grade and year.
We proceed by estimating a logistic regression model with these characteristics. The
fitted values for each student from this analysis serve as the probability, or propensity, that a
student receives a voucher and switches to a private school in the subsequent year. We note that
between the low proportion of voucher students relative to public students and already restricting

PRELIMINARY – DO NOT CITE OR DISTRIBUTE WITHOUT PERMISSION
19
our sample on the strongest predictor of voucher receipt – free or reduced price lunch receipt –
we find low overall propensities. We are still able to match students well as we describe below.
Next, we match voucher and public school students within each public school, grade, and
year at baseline based on each student’s propensity score. We match voucher students with up to
five public school students who share a propensity score within a likelihood caliper of ±0.003.
This value represents one-fifth of a propensity score SD in this sample. If there are no public
school comparison students within this caliper and school-grade-year strata, the voucher student
is left unmatched. Public school students are matched with replacement and can be matched to
multiple voucher students within the school-grade-year strata. With our matching procedure, we
matched 83.6 percent of low-income voucher students (3,276 total) to at least one low-income
public school peer (12,406 total) in their same school, grade, and baseline year. For all
descriptive and empirical analyses with the propensity score matched sample, we also construct
weights to enable us to compare equal numbers of voucher and public school students.18
After matching, we return to our descriptive results (Table 1) to check for balance
between the matched voucher and public students at baseline. Overall, we find excellent balance
across a host of covariates, with the only small significant difference in the proportion of ELL
students in each group. Perhaps most importantly, the baseline math and ELA achievement of
voucher and public students is roughly the same. While propensity score matching only mitigates
potential selection bias based on the observable dimensions upon which students are matched,
the lack of pre-treatment differences suggests that students are much more likely to be aligned 18 As before, each voucher student has a weight of 1. Because voucher students may be matched to multiple public
students and public students may be matched to more than one voucher student, the weight for a public school
student equals the total of voucher students to which a public school student is matched divided by the total number
public student matches for those voucher students in each public school, grade, and year at baseline.

PRELIMINARY – DO NOT CITE OR DISTRIBUTE WITHOUT PERMISSION
20
along unobservable dimensions as well. Therefore, we rely upon the propensity score matched
sample for our empirical models. We also include relevant dimensions of the unmatched and
matched voucher student sample in Appendix Table 3.
Estimation Strategies
Through our sample construction, particularly in creating the propensity score matched
sample, we have already dealt with many selection bias issues between voucher and private
school students. Despite having a comparable sample, a simple comparison of voucher and
public school student achievement may still be biased if we have not accounted for unobserved
factors that drive selection. We describe our estimation approaches that provide further
robustness and enhance the internal validity of our estimates.
OLS Regression
We begin with a OLS regression model with several covariates as shown below.
𝑌𝑌𝑖𝑖𝑖𝑖𝑖𝑖 = 𝛼𝛼 + 𝛽𝛽𝑉𝑉𝑉𝑉𝑉𝑉𝑉𝑉ℎ𝑒𝑒𝑒𝑒𝑖𝑖𝑖𝑖𝑖𝑖 + 𝛿𝛿𝐖𝐖𝑖𝑖 + 𝛿𝛿𝐗𝐗𝑖𝑖𝑖𝑖𝑖𝑖 + 𝜃𝜃𝑖𝑖𝑖𝑖 + 𝜐𝜐𝑖𝑖𝑖𝑖𝑖𝑖 (1) Here, the achievement level (𝑌𝑌) for each student (i) in grade (g) and year (t) is a function
receiving a voucher and attending a private school (𝑉𝑉𝑉𝑉𝑉𝑉𝑉𝑉ℎ𝑒𝑒𝑒𝑒𝑖𝑖𝑖𝑖𝑖𝑖). We control for a vector of
time-invariant (𝐖𝐖𝑖𝑖) student characteristics such as sex and race/ethnicity. We also control for
time-varying student and school characteristics (𝐗𝐗𝑖𝑖𝑖𝑖) that include: ELL and special education
status; structural and non-structural school changes in year (t) interacted with grade level (g);
public school type (e.g., charter or magnet vs. traditional public); and school locale (suburban or
town/rural vs. urban). Grade-by-year effects (𝜃𝜃𝑖𝑖𝑖𝑖) account for systematic differences across
exams and over time. The term 𝜐𝜐𝑖𝑖𝑖𝑖 represents school cluster-robust standard errors to account for
serial correlation amongst students within the same school and is used in all models. We estimate
separate models with math and ELA achievement levels.

PRELIMINARY – DO NOT CITE OR DISTRIBUTE WITHOUT PERMISSION
21
Our estimate of the voucher program effect (𝛽𝛽) will be unbiased if we have accounted for
all covariates that could explain differences between voucher and public students. By controlling
for many of the same covariates used in the propensity score matching model, we incorporate
additional robustness in case of misspecification in either the OLS or propensity score model.
However, we are investigating voucher impacts over time and our estimates may be biased if we
do not account for pre-treatment differences between voucher and public school students.
Difference-in-Differences
To account for pre-treatment differences, we can modify the OLS model (1) to include a
difference-in-differences (DD) estimate of voucher effects on achievement.
𝑌𝑌𝑖𝑖𝑖𝑖𝑖𝑖 = 𝛼𝛼 + 𝛽𝛽𝑉𝑉𝑉𝑉𝑉𝑉𝑉𝑉ℎ𝑒𝑒𝑒𝑒𝑖𝑖𝑖𝑖𝑖𝑖 + 𝜌𝜌𝑃𝑃𝑉𝑉𝑃𝑃𝑃𝑃𝑖𝑖𝑖𝑖𝑖𝑖 + 𝛾𝛾𝑉𝑉𝑉𝑉𝑃𝑃𝑉𝑉𝑉𝑉𝑖𝑖𝑖𝑖𝑖𝑖 + 𝛿𝛿𝐖𝐖𝑖𝑖 + 𝛿𝛿𝐗𝐗𝑖𝑖𝑖𝑖𝑖𝑖 + 𝜃𝜃𝑖𝑖𝑖𝑖 + 𝜐𝜐𝑖𝑖𝑖𝑖𝑖𝑖 (2) In (2), we include a new predictor (𝑃𝑃𝑉𝑉𝑃𝑃𝑃𝑃𝑖𝑖𝑖𝑖𝑖𝑖) which is a dichotomous indicator for all years after
baseline. This accounts for the underlying secular trends in achievement following treatment that
impact all students. The other new variable in (2) is the indicator (𝑉𝑉𝑉𝑉𝑃𝑃𝑉𝑉𝑉𝑉.𝑖𝑖𝑖𝑖𝑖𝑖). This accounts for
pre-treatment differences in achievement levels between voucher and public school students. Our
treatment variable (𝑉𝑉𝑉𝑉𝑉𝑉𝑉𝑉ℎ𝑒𝑒𝑒𝑒𝑖𝑖𝑖𝑖𝑖𝑖) is merely the interaction between the post and voucher student
indicators. Thus, 𝛽𝛽 is now the DD estimate, or the added impact on achievement for voucher
students when attending private schools after accounting for underlying trends over time and
starting-gate differences between voucher and public students.
Regarding internal validity, the balance between voucher and public students in the
matched sample combined with the DD model should lend itself to credible estimates of the
impact of receiving a voucher and attending a private school on a student’s achievement level.
However, this claim is only valid if there remains no other unobservables not accounted for in
the propensity score matching or DD models and if there are no pre-treatment trends.

PRELIMINARY – DO NOT CITE OR DISTRIBUTE WITHOUT PERMISSION
22
Fixed Effects
An analogue of the DD model is the student fixed effects (FE) model, show in (3) below.
𝑌𝑌𝑖𝑖𝑖𝑖𝑖𝑖 = 𝛼𝛼 + 𝛽𝛽𝑉𝑉𝑉𝑉𝑉𝑉𝑉𝑉ℎ𝑒𝑒𝑒𝑒𝑖𝑖𝑖𝑖𝑖𝑖 + 𝛿𝛿𝐗𝐗𝑖𝑖𝑖𝑖𝑖𝑖 + 𝜃𝜃𝑖𝑖𝑖𝑖 + 𝜇𝜇𝑖𝑖 + 𝜐𝜐𝑖𝑖𝑖𝑖𝑖𝑖 (3) The inclusion of the student-specific fixed effect (𝜇𝜇𝑖𝑖) accounts for unobserved, time-invariant
differences between students, thereby removing time-invariant student controls. In the FE model
𝛽𝛽 is the within-student difference in voucher student achievement before and after switching to a
private school. As we are estimating voucher impacts for students switching school sectors, the
FE model is well suited for identifying effects. However, it is subject to the same limitations as
the DD model, and less suitable for comparing voucher and public school student outcomes.
Accounting for Prior Student Achievement to Measure Achievement Gains
One underlying issue with the estimation of achievement levels in all models is that prior
test scores influence current achievement. We can account for each student’s achievement in the
prior year (𝑌𝑌𝑖𝑖𝑖𝑖𝑖𝑖−1) as a lag in each model.
𝑌𝑌𝑖𝑖𝑖𝑖𝑖𝑖 = 𝛼𝛼 + 𝛽𝛽𝑉𝑉𝑉𝑉𝑉𝑉𝑉𝑉ℎ𝑒𝑒𝑒𝑒𝑖𝑖𝑖𝑖𝑖𝑖 + 𝑌𝑌𝑖𝑖𝑖𝑖𝑖𝑖−1 + 𝛿𝛿𝐖𝐖𝑖𝑖 + 𝛿𝛿𝐗𝐗𝑖𝑖𝑖𝑖𝑖𝑖 + 𝜃𝜃𝑖𝑖𝑖𝑖 + 𝜐𝜐𝑖𝑖𝑖𝑖𝑖𝑖 (4)
𝑌𝑌𝑖𝑖𝑖𝑖𝑖𝑖 = 𝛼𝛼 + 𝛽𝛽𝑉𝑉𝑉𝑉𝑉𝑉𝑉𝑉ℎ𝑒𝑒𝑒𝑒𝑖𝑖𝑖𝑖𝑖𝑖 + 𝜌𝜌𝑃𝑃𝑉𝑉𝑃𝑃𝑃𝑃𝑖𝑖𝑖𝑖𝑖𝑖 + 𝛾𝛾𝑉𝑉𝑉𝑉𝑃𝑃𝑉𝑉𝑉𝑉𝑖𝑖𝑖𝑖𝑖𝑖 + 𝑌𝑌𝑖𝑖𝑖𝑖𝑖𝑖−1 + 𝛿𝛿𝐖𝐖𝑖𝑖 + 𝛿𝛿𝐗𝐗𝑖𝑖𝑖𝑖𝑖𝑖 + 𝜃𝜃𝑖𝑖𝑖𝑖 + 𝜐𝜐𝑖𝑖𝑖𝑖𝑖𝑖 (5)
𝑌𝑌𝑖𝑖𝑖𝑖𝑖𝑖 = 𝛼𝛼 + 𝛽𝛽𝑉𝑉𝑉𝑉𝑉𝑉𝑉𝑉ℎ𝑒𝑒𝑒𝑒𝑖𝑖𝑖𝑖𝑖𝑖 + 𝑌𝑌𝑖𝑖𝑖𝑖𝑖𝑖−1 + 𝛿𝛿𝐗𝐗𝑖𝑖𝑖𝑖𝑖𝑖 + 𝜃𝜃𝑖𝑖𝑖𝑖 + 𝜇𝜇𝑖𝑖 + 𝜐𝜐𝑖𝑖𝑖𝑖𝑖𝑖 (6)
Equations (4), (5), and (6) above represent the inclusion of prior achievement in to the OLS, DD,
and FE models, respectively. After accounting for prior achievement, we can describe our
estimates of the voucher program effects as value-added achievement gains. One issue with this
is that lagged prior achievement scores are endogenous, especially in the post-baseline years. We
deal with this issue in two ways. First, we follow the lead of Imberman (2011), whereby we refer
to the levels and gains estimates collectively as bounded estimates of the true voucher effect.
Second, we include a robustness check where we control for prior achievement only in the pre-

PRELIMINARY – DO NOT CITE OR DISTRIBUTE WITHOUT PERMISSION
23
treatment years (baseline and pre-baseline). We find no meaningful differences in our
estimates.19
The incorporation of prior achievement also provides an advantage in that we are now
able to test for the presence of differing pre-treatment trends between voucher and public
students. This pre-treatment phenomenon, known in the job-training literature as “Ashenfelter’s
Dip” (Ashenfelter 1978), suggests that a substantial drop student performance may be a signal to
parents to have their child change schools. If this were the case, some students may be more
likely to receive a voucher than others, yielding biased estimates.
With the DD model, we can explicitly test for differing pre-treatment trends in two ways.
First, in our preferred model (5), the indicator (𝑉𝑉𝑉𝑉𝑃𝑃𝑉𝑉𝑉𝑉.𝑖𝑖𝑖𝑖𝑖𝑖) now measures whether there are any
pre-treatment differences in achievement gains between voucher and public school students.
Second, as we parse out differences in voucher effects by year with the DD model, we include a
full “event study” set of estimates across all pre- and post-treatment years. If the (𝑉𝑉𝑉𝑉𝑃𝑃𝑉𝑉𝑉𝑉.𝑖𝑖𝑖𝑖𝑖𝑖)
indicator in the main DD model and pre-treatment event study estimates are not statistically
significant, this suggests we should not be concerned about pre-treatment trends. We also
conduct a host of other robustness checks, all displayed in Table 4 and described in Appendix B.
Because of how we defined our sample, all our estimates of the voucher program effect
on achievement rely on students who use a voucher to switch from public to private schools.
This limits the generalizability of our findings because we do not estimate voucher effects for
those who are always enrolled in private schools.20 Voucher students switching from public to
19 Our preferred model is the DD model. If we used the FE model, we would also provide Arellano-Bond estimates.
20 We do not to estimate voucher effects for students always enrolled in private schools because we do not want to
make strong assumptions about prior achievement or geographic matching without a comparison school context.

PRELIMINARY – DO NOT CITE OR DISTRIBUTE WITHOUT PERMISSION
24
private schools are different in terms of baseline characteristics from voucher students always
enrolled in private schools (see Appendix Table 1). Our approach also requires at least three
successive years of test score data, which excludes many students from the analysis. Thus, most
our estimates of voucher program impacts are constrained to students in grades 5 to 8.
RESULTS
Main Effects of Receiving a Voucher and Attending a Private School
We next describe the estimated effects of receiving a voucher and attending a private
school on academic achievement. In Tables 2 and 3, we display the results of the several models
we estimated for mathematics and English Language Arts (ELA), respectively, including our
preferred difference-in-difference (DD) model with the propensity score matched (PSM) sample.
Overall, based on the DD PSM model, students who switch from a public to a private school
with a voucher score 0.086 standard deviations (SD) lower in mathematics compared with their
public school peers. In addition, compared to voucher students’ achievement while in a public
school, voucher students experience an annual loss of 0.157 SD in math when enrolled in a
private school (PSM FE model 6).21 The estimates across our mathematics levels models range
from -0.151 SD in the all low-income FE model 3 to -0.063 SD in the OLS model 1 for all low-
income students, and the estimates in the mathematics gains models range from -0.168 SD in all
low-income FE model 6 to -0.096 SD in all low-income OLS model 1.
--- INSERT TABLE 2 HERE ---
In English Language Arts (ELA), there are no significant effects in our preferred DD
PSM levels or gains models. In the other models, there are generally tiny or insignificant effects
21 The fixed effects model inherently incorporates the post-baseline trends and voucher-public baseline/pre-baseline
differences as displayed in the difference-in-differences model.

PRELIMINARY – DO NOT CITE OR DISTRIBUTE WITHOUT PERMISSION
25
(see Table 2). Students who transfer to a private school with a voucher score -0.026 SD lower
(PSM FE model 6) and experience an annual loss of -0.029 SD (PSM FE model 6) when
attending a private school compared with their previous ELA scores in a public school. However,
both estimates are only marginally significant and very small (less than 1 percentile point). The
range in estimates for the ELA levels models is -0.044 to 0.064 SD.
--- INSERT TABLE 3 HERE ---
One of the important assumptions for the validity of the preferred DD estimates is the
lack of differing pre-treatment trends between voucher and public students. We find significantly
different pre-treatment trends in the broader unmatched sample. However, we do not find
statistically differing pre-treatment trends in our preferred propensity score matched sample. This
finding strengthens the credibility of both our DD results and our decision to match students.
Robustness Checks
We also estimated a series of robustness checks for the main mathematics and ELA
estimates from our preferred DD PSM levels and gains models in Table 4. We estimate eight
alternative models to assess the robustness of the main voucher effects. The robustness checks
include: (1) constraining our results to only those students making structural school changes (2)
removing mobility indicators; (3) removing special education status as a control; (4) using a gain
score as the dependent measure; (5) adding an additional control for prior achievement in the off
subject; (6) including only prior achievement during the pre-treatment period; (7) keeping
students who exited private schools in the treatment group; and (8) taking out the Indianapolis
urban area schools. We detail the rationale behind these robustness checks in Appendix B.
--- INSERT TABLE 4 HERE ---
PRELIMINARY – DO NOT CITE OR DISTRIBUTE WITHOUT PERMISSION
26
Compared with our preferred DD PSM mathematics estimates of -0.086 SD in the levels
model and -0.100 SD per year in the gains model, the other model specifications and sensitivity
analyses reveal estimates ranging from -0.182 to -0.079 SD in the levels models and from -0.123
to -0.071 SD in the gains models. Each of these estimates is statistically significant at the p≤0.05
level. This suggests that our preferred estimates in mathematics are robust, bounded in a range of
-0.182 to -0.071 SD. For ELA, the preferred DD PSM levels and gains estimates are nearly zero
and statistically insignificant. Except for one estimate (-0.057 SD; [p≤0.05] in the structural
changes only gains model), the robustness checks reveal that our preferred estimates are null and
not statistically significant. Thus, we conclude there is a null average impact of using a voucher
to attend a private school on student ELA scores.
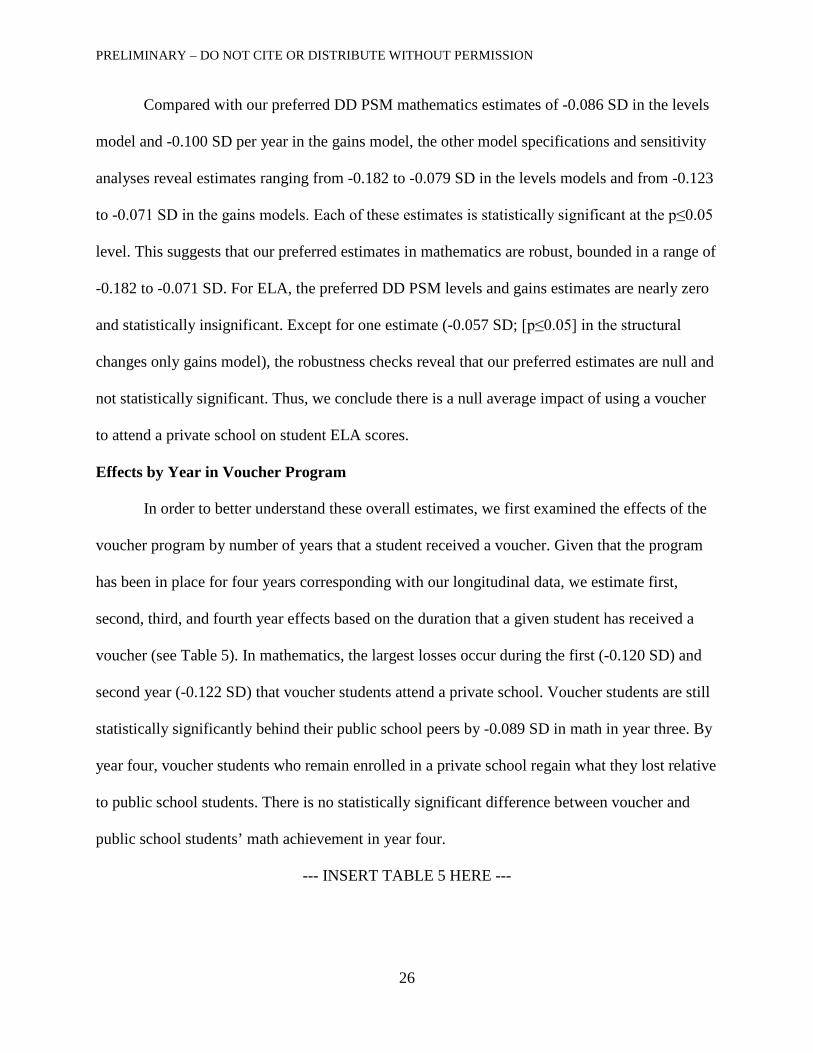
Effects by Year in Voucher Program
In order to better understand these overall estimates, we first examined the effects of the
voucher program by number of years that a student received a voucher. Given that the program
has been in place for four years corresponding with our longitudinal data, we estimate first,
second, third, and fourth year effects based on the duration that a given student has received a
voucher (see Table 5). In mathematics, the largest losses occur during the first (-0.120 SD) and
second year (-0.122 SD) that voucher students attend a private school. Voucher students are still
statistically significantly behind their public school peers by -0.089 SD in math in year three. By
year four, voucher students who remain enrolled in a private school regain what they lost relative
to public school students. There is no statistically significant difference between voucher and
public school students’ math achievement in year four.
--- INSERT TABLE 5 HERE ---

PRELIMINARY – DO NOT CITE OR DISTRIBUTE WITHOUT PERMISSION
27
In ELA, students experience significant losses in year two (-0.087 SD), but recoup those
losses in year 3 (gain of 0.065 SD) (see Table 5). These ELA results indicate some flipping
between voucher and public school students over the first couple of years from baseline. By year
four, voucher students have higher achievement (0.134 SD), although this is only marginally
statistically significant (p<0.10).
It is important to note that the year three and year four estimates in both subjects are
highly variable due to the relatively small number of voucher students we observe across three
and especially four years. A summary of the predicted DD mathematics and ELA achievement
trends between matched voucher and public students are portrayed Figures 1A and 1B.
--- INSERT FIGURES 1A & 1B HERE ---
Disaggregated Results by Student Group
We disaggregated the results further by student sex and race/ethnicity; student English-
Language Learner (ELL) and special education statuses; whether a student remains enrolled in a
private school; type of private school; and private school urban locale. We calculated these
estimates by introducing a full set of interaction terms between the indicators and the three DD
indicators in our preferred model. We represent the results as the additional achievement impact
of receiving a voucher and attending a private school for each subgroup.
We display these estimates for mathematics and ELA in Table 6. Across nearly all
subgroups of students in the disaggregated results, we find persistent, statistically significant
negative impacts of receiving a voucher on average annual mathematics levels and gains. For
ELA, we find a variation of positive and negative estimates of annual levels and gains.
--- INSERT TABLE 6 HERE ---

PRELIMINARY – DO NOT CITE OR DISTRIBUTE WITHOUT PERMISSION
28
The average effects of receiving vouchers on mathematics levels and gains are negative
for both males (-0.089 and -0.093 SD, respectively) and females (-0.085 and -0.107 SD,
respectively), with no statistical difference in these losses between males and females. The
effects on ELA by student sex were not statistically significant.
We next estimate voucher effects by student race/ethnicity. We find that white and black
students who receive vouchers and attend private schools score -0.097 and -0.126 SD lower in
mathematics in private schools, respectively, with annual losses of 0.094 SD for white students
and 0.156 SD for black students. On the other hand, Latino students experienced null math
losses. Overall, we find no statistical differences in impacts between all racial/ethnic groups. The
effects on ELA by student race/ethnicity were not statistically significant.
We also estimated the effects for voucher students by ELL status and special education
status. In mathematics, non-ELL voucher students score -0.103 SD below their peers in public
schools and experience annual losses of -0.109 SD. ELL students experienced null losses in both
math and ELA. Special education students receiving a voucher experience significant losses in
ELA of -0.130 SD in private schools.
As some students receiving a voucher and transfer to a private school eventually transfer
back to a public school, we include separate estimates of voucher “exiters” versus students who
continue receiving a voucher and remain enrolled in private schools. Students who received a
voucher and then returned to public school in a later year score -0.242 SD lower in mathematics
and -0.136 SD lower in ELA when enrolled in a private school. Voucher “exiters” also
experience significant annual losses in mathematics (-0.156 SD) and ELA (-0.074 SD). While
voucher “stayers” also experience significant losses in math, we note the significantly smaller
losses between “stayers” and “exiters” in math and the null losses in ELA.

PRELIMINARY – DO NOT CITE OR DISTRIBUTE WITHOUT PERMISSION
29
We also investigated voucher program effects by the type of private school in which a
student receiving a voucher enrolled and by private school urban locale. In ELA, voucher
students attending Catholic schools are estimated to score 0.071 SD above public school students
and experience annual gains of 0.034 SD compared with their public school peers. These
estimates are also statistically different from voucher students attending other private schools,
who experience significant losses in ELA. Examining impacts by private school locale, we find
significant annual mathematics losses whether a student attends a private school in an urban
(-0.077 SD), suburban (-0.115 SD), or town/rural (-0.133 SD) location.
DISCUSSION
Although this study was unable to make use of experimental data to investigate the
impacts of the Indiana voucher program on student achievement, it is one of the first to estimate
voucher effects with state administrative longitudinal records and a rigorous analytic approach.
Public and private school students in Indiana, including all students receiving a voucher and
attending a private school, have taken the same assessment for several years. This feature is a
significant benefit to researchers, allowing for apples-to-apples comparisons of student
achievement outcomes and the ability to capture year-to-year student achievement gains.
Generally, we find that voucher students attending private schools experienced similar
year-to-year achievement gains in ELA as they did in their public school but substantial annual
achievement losses in mathematics. This is one of a small number of studies to estimate such
losses, aligning with research on the Louisiana Scholarship Program (see Abdulkadiroglu,
Pathak, & Walters, 2015; Mills & Wolf, in press) and the Ohio EdChoice Scholarship Program
(Figlio & Karbownik, 2016). We find these general trends for both ELA and mathematics hold
when disaggregating the main effects by a number of student and school characteristics.

PRELIMINARY – DO NOT CITE OR DISTRIBUTE WITHOUT PERMISSION
30
Although we might have hypothesized differential effects for students of color, the oddity
is that we found similar results for white students. These findings raise questions about the
mechanisms that may explain these negative effects, such as the mathematics curriculum,
instruction, or teacher quality in private schools not being as robust as is found in public schools.
At the same time, these results could also point toward issues with changing schools and sectors.
Overall, voucher students are lower-achieving students from the public sector and enter
private schools substantially behind their private school peers. During the ICSP’s first few years
of implementation, many private schools lacked the capacity or experience in educating new
students who are academically behind. Whether this is due to curricular issues (e.g., lack of
alignment of the private and public school textbooks and other curricular materials), teachers’
ability to teach low-achieving students (e.g., using differentiated instructional techniques), or
other organizational and instructional conditions, we cannot determine solely using
administrative data. Thus, additional information, both qualitative and quantitative, is necessary.
Gathering and analyzing such information is part of our ongoing research agenda.
In our qualitative findings from case studies and over 100 interviews in thirteen private
schools during the first two years of ICSP implementation, principals and teachers reported that
voucher students were generally acclimating well—academically and socially—to their new
schools. Yet, principals and teachers also reported that some voucher students were academically
behind and struggling with new homework expectations. Principals and teachers were attempting
to address these issues while also noting that, because the first year of the voucher program was
implemented quickly, significant changes in instruction did not occur (Berends & Waddington,
2014). As expectations or norms may be different in private schools than public schools, voucher

PRELIMINARY – DO NOT CITE OR DISTRIBUTE WITHOUT PERMISSION
31
students attending private schools for the first time could be put at a disadvantage beyond
negative math scores.
Over time, voucher students may adjust to their new schools, and private schools may
make adjustments that better meet the educational needs of voucher students although our
findings cannot confirm this possibility with a high degree of precision. In mathematics, students
who remain in a private school with a voucher for three or four years make up what they initially
lost relative to their public school peers. In ELA, students experience losses in year two, but
recoup those losses in year three. By year four, voucher students have higher ELA achievement
than their public school peer, though this is only marginally statistically significant. The year
three and year four estimates in both subjects are highly variable due to the relatively small
number of voucher students we observe across three and especially four years.
These year three and four estimates may also point to student persistence, as the lowest
achieving students who receive a voucher and attend a private school tend to return to a public
school. Additional years of testing data and information from teachers and principals will shed
more light on these trends—and possible explanations for them—across years of the program.
In investigating how voucher effects may differ across types of private schools, we find
negative effects in mathematics for both Catholic and other private schools. However, we find
modest positive effects of Catholic schools and modest negative effects of other private schools
in ELA. The mathematics findings for Catholic schools mirror those we found in previous work
on student transfers from public to Catholic schools in Indianapolis (see Berends & Waddington,
in press). This is a relevant comparison as it takes place in the same state, includes a handful of
the same students, and the mechanism of switching from public to private schools is the same.
The negative relationship between mathematics achievement and Catholic school attendance has

PRELIMINARY – DO NOT CITE OR DISTRIBUTE WITHOUT PERMISSION
32
also been found in nationally representative data for elementary and middle school students
(Carbonaro, 2006; Reardon, Cheadle, & Robinson, 2009; Elder & Jepsen, 2014) and in data for
8th graders in Chicago (Hallinan & Kubitschek, 2012). That said, it remains important to explore
the variability of impacts between individual Catholic and other private schools. School-average
effects in both subjects range from annual losses of 0.30 SD in both subjects to gains of 0.20 SD
in math and 0.40 SD in ELA. These findings speak to the substantial degree of heterogeneity
within the private school sector. Some schools were more racially and ethnically diverse prior to
the implementation of the voucher program, and therefore may have been better equipped to
educate a demographically (and perhaps, academically) diverse group of students.
Our research has its limitations. Although our use of multiple estimation strategies
provides a strong methodological approach to examine impacts with longitudinal data, it has
drawbacks as described earlier in this paper. We are only drawing generalizations about students
using vouchers to switch from public to private schools. Under the original intent of the
program—to increase access to private schools for low-income public school families—our
preferred modeling strategy aligns well to estimate the program’s effects. However, after the law
changed in the 2013-14 school year no longer requiring voucher students to move from a public
to private school, over half of all students participating in the voucher program in 2014-15 never
attended an Indiana public school (Indiana Department of Education, 2017). For these students, it
is more challenging to establish an equivalent baseline and assess meaningful voucher effects.
Second, Indiana does not have a common assessment system in the pre-K through second
grade levels in public and private schools. Because we used third, fourth, or fifth grade as a
baseline for student achievement gains for most students, our research focuses on voucher
program effects in the upper elementary and middle school grades. In 2014-15, nearly 50 percent

PRELIMINARY – DO NOT CITE OR DISTRIBUTE WITHOUT PERMISSION
33
of the students receiving vouchers statewide were in the K-4 grade levels (Indiana Department of
Education, 2017), meaning that current ISTEP+ testing does not capture a significant number of
students receiving vouchers. As a result, we may never know whether the ICSP had a significant
impact (positive or negative) on students in earlier grade levels.
Finally, voucher programs are designed to provide new learning opportunities, for which
achievement gains should serve as a proxy for any program’s success for students and schools.
Although these outcomes are important for researchers, policymakers, and practitioners to
consider, parents make schooling decisions for their children based on a multitude of factors,
including academics, location, safety, and religion. Therefore, researchers need to examine
outcomes beyond test scores (e.g., educational attainment, engagement, social and emotional
learning, character, civic participation, and other non-academic outcomes). Additional data on
these other student outcomes needs to be collected and analyzed to provide a more complete
picture. To quote Figlio (2009, p. 322), “It is important to be cautious about claiming that school
vouchers are unsuccessful just because students who use them do not appear to be benefiting
along certain measureable dimensions.” In an era of expanding school choice, policymakers must
draw from recent findings about statewide voucher programs that there is more to learn about the
impacts of large-scale parental choice programs on American families.

PRELIMINARY – DO NOT CITE OR DISTRIBUTE WITHOUT PERMISSION
34
REFERENCES
Abdulkadiroglu, A., Pathak, P. A., & Walters, C. R. (2015). School vouchers and student achievement: Evidence from the Louisiana Scholarship Program. Cambridge, MA: National Bureau of Economic Research (Working Paper No. 21839).
Anderson, K. P., & Wolf, P. J. (2017). Evaluating school vouchers: Evidence from a within-
study comparison (EDRE Working Paper No. 2017-10). Economics Research Network, Department of Education Reform, College of Education and Health Professions, University of Arkansas, Fayetteville, AR.
Angrist, J. D., Dynarski, S., Kane, T. J., Pathak, P. A., & Walters, C. R. (2012). Student
achievement in charter schools. Who benefits from KIPP? Journal of Policy Analysis and Management, 31, 837-860.
Ashenfelter, O. (1978). Estimating the effect of training programs on earnings. The Review of
Economics and Statistics, 60, 47-57. Austin, M., & Berends, M. (In Press). School choice and the potential of research-practice
partnerships. In G. Schneider & G. K. Saw (Eds.), Handbook of the Sociology of Education in the 21st Century. New York: Springer.
Barnard, J. Frangakis, C., Hill, J., & Rubin, D. (2003). Principal stratification approach to broken
randomized experiments: A case study of school choice vouchers in New York City. Journal of the American Statistical Association, 98, 299-323.
Berends, M. (In Press). The evolving choice landscape in the U.S. In R. Papa and S. Armfield
(Eds.), Handbook of education policy. Hoboken, NJ: Wiley-Blackwell. Berends, M. & Waddington, R. J. (2014). Blending into my new school: The integration of
voucher students in Indiana private Schools. Paper to be presented at the annual meeting of the American Educational Research Association, Philadelphia, PA.
Berends, M., & Waddington, R. J. (In Press). School choice in Indianapolis: Effects of charter,
magnet, private, and traditional public schools. Education Finance and Policy. Bifulco, R. (2012). Can nonexperimental estimates replicate estimates based on random
assignment in evaluations of school choice? A within-study comparison. Journal of Policy Analysis and Management, 31, 729-751.
Carbonaro, W. (2006). Public-private Differences in Achievement among Kindergarten Students:
differences in Learning Opportunities and Student Outcomes. American Journal of Education 113, 31-65.a.
Chingos, M. M., & Peterson, P. E. (2012). The effects of school vouchers on college enrollment.
Washington, DC: Brown Center on Education Policy at the Bookings Institution.

PRELIMINARY – DO NOT CITE OR DISTRIBUTE WITHOUT PERMISSION
35
Chubb, J. E., & Moe, T. M. (1990). Politics, markets and American schools. Washington, DC:
Brookings Institution. Clark, M. A., Gleason, P. M., Tuttle, C. C., & Silverberg, M. K. (2015). Do charter schools
improve student achievement? Educational Evaluation and Policy Analysis, 37, 419-436. Cook, T., Shadish, W., & Wong, V. (2008). Three conditions under which experiments and
observational studies produce comparable causal estimates: New findings from within-study comparisons. Journal of Policy Analysis and Management, 27, 724-750.
Cowen, J. (2008) School choice as a latent variable: Estimating the “complier average causal
effect’ of vouchers in Charlotte. Policy Studies Journal, 36, 301-15. Cowen, J. M., Fleming, D. J., Witte, J. F., Wolf, P. J. & Kasida, B. (2013). School vouchers and
student attainment: Evidence from a state-mandated study of Milwaukee’s parental choice program. Policy Studies Journal, 41, 147-168.
Dobbie, W. & Fryer, R. G. (2011). Are high quality schools enough to close the achievement gap?
Evidence from a social experiment in Harlem. American Economic Journal: Applied Economics, 3, 158-187.
Dynarski, M., Rui, N., Webber, A., Gutmann, B., & Bachman, M. (2017). Evaluation of the DC
Opportunity Scholarship Program: Impacts after one year. (NCEE 2017-4022). Washington, DC: National Center for Education Evaluation and Regional Assistance, Institute of Education Sciences, U.S. Department of Education.
EdChoice (2017). School choice in America. Retrieved June 19, 2017 from:
https://www.edchoice.org/school-choice/school-choice-in-america/. Elder, T. & Jepsen, C. (2014). Are Catholic primary schools more effective than public primary
schools? Journal of Urban Economics, 80, 28-38. Epple, D., Romano, R.E., & Urquiola, M. (2015). School vouchers: A survey of the economics
literature. Cambridge, MA: National Bureau of Economic Research (Working Paper No. 21523).
Figlio, D. N. (2009). Voucher outcomes. In M. Berends, M. G. Springer, D. Ballou, & H. J.
Walberg (Eds.), Handbook of research on school choice (pp. 321-337). New York, NY: Routledge.
Finnegan, K. S. (2007). Charter school autonomy: The mismatch between theory and practice.
Educational Policy, 21, 503-526.

PRELIMINARY – DO NOT CITE OR DISTRIBUTE WITHOUT PERMISSION
36
Fortson, K., Gleason, P., Kopa, E., & Verbitsky-Savitz, N. (2014). Horseshoes, hand grenades, and treatment effects? Reassessing whether nonexperimental estimators are biased. Economics of Education Review, 44, 100-113.
Friedman, M. (1955). The role of government in education. In R. A. Solo (Ed.), Economics and
the public interest (pp. 123-144). New Brunswick, NJ: Rutgers University Press. Friedman, M. (1962). Capitalism and freedom. Chicago: Chicago University Press. Gamoran, A. (2015). The future of educational inequality in the United States: What went wrong,
and how can we fix it? New York: W.T. Grant Foundation. Greene, J. P. (2001). Vouchers in Charlotte: Vouchers and the test-score gap. Education Next, 1,
55-60. Greene, J. P., Peterson, P. E., & Du, J. (1998). School choice in Milwaukee: A randomized
experiment. In P. Peterson and B. Hassell (Eds.), Learning from school choice (pp. 335-356). Washington, DC: Brookings.
Greene, J. P., Peterson, P. E., & Du, J. (1999). Effectiveness of school choice: The Milwaukee
voucher experiment. Education and Urban Society, 31, 190-213. Grigg, J. (2012). School enrollment changes and student achievement growth; A case study in
educational disruption and continuity. Sociology of Education, 85, 388-404. Hallinan, Maureen T. & W. Kubitschek. (2012). A comparison of academic achievement and
adherence to the common school ideal in public and Catholic schools. Sociology of Education, 85, 1-22.
Henig, J. R. (1995). Rethinking school choice: Limits of the market metaphor. Princeton, NJ:
Princeton University Press. Hess, F. M. (2002). Revolution at the margins: The impact of competition on urban school
systems. Washington, DC: Brookings Institution. Howell, W. G., Peterson, P. E. (2006). The education gap: Vouchers and urban schools.
Washington, DC: Brookings Press. Howell, W. G., Wolf, P. J., Campbell, D. E., & Peterson, P. E. (2002). School vouchers and
academic performance: results from three randomized field trials. Journal of Policy Analysis and Management, 21, 191-217.
Imberman, S. (2011). Achievement and behavior in charter schools: Drawing a more complete
picture. The Review of Economics and Statistics, 93, 416-435. Indiana Department of Education (2011). 2011-2012 ISTEP+ program manual: Policies and
procedures for Indiana's assessment system. Indianapolis, IN: Author.

PRELIMINARY – DO NOT CITE OR DISTRIBUTE WITHOUT PERMISSION
37
Indiana Department of Education (2017). Choice scholarship program annual report:
Participation and payment data. Indianapolis, IN: Author (Office of School Finance). Jin, H., Barnard, J., & Rubin, D., B. (2010). A modified general location model for
noncompliance with missing data: Revisiting the New York City School Choice Scholarship Program using principal stratification. Journal of Educational and Behavioral Statistics, 35, 154–173.
Kashual, N., Magnuson, K., & Waldfogel, J. (2011). How is family income related to
investments in children’s learning? In G. Duncan and R. Murnane (Eds.), Whither Opportunity? (pp. 187- 205). New York: Russell Sage Foundation.
Koedel, C., Mihaly, K., & Rockoff, J. E. (2015). Value-added modeling: A review. Economics of
Education Review, 47, 180-195. Krueger, A. B., & Zhu, P. (2004). Another look at the New York City school voucher
experiment. American Behavioral Scientist, 47, 658-698. Lareau, A., & Goyette, K. (2014). (Eds.). Choosing homes, choosing schools. New York: Russell
Sage Foundation. Levin, H. M. (1998). Educational vouchers: Effectiveness, choice, and costs. Journal of Policy
Analysis and Management, 17, 392-91. Metcalf, K. K., West, S. D., Legan, N, Paul, K., & Boone, W. J. (2002). Evaluation of the
Cleveland Scholarship and Tutoring Program, 1998-2001. Summary report and technical report. Bloomington, IN: Indiana Center for Evaluation.
Mills, J. N. & Wolf, P. J. (In Press). Vouchers in the Bayou: The effects of the Louisiana
Scholarship Program on student achievement after 2 years. Educational Evaluation and Policy Analysis.
Orfield, G., & Frankenberg, E. (2014). Brown at 60: Great progress, a long retreat, and an
uncertain future. Los Angeles, CA: Civil Rights Project, University of California Los Angeles.
Reardon, S., Cheadle, J., & Robinson, J. (2009). The effect of Catholic schooling on math and
reading development in kindergarten through fifth grade. Journal of Research on Educational Effectiveness, 2, 45-87.
Reardon, S.F., Robinson-Cimpian, J.P., & Weathers, E.S. (in press). Patterns and trends in
racial/ethnic and socioeconomic academic achievement gaps. In H. A. Ladd & M. E. Goertz (Eds.), Handbook of research in education finance and policy (pp. 491-509). Mahwah, NJ: Lawrence Erlbaum Associates

PRELIMINARY – DO NOT CITE OR DISTRIBUTE WITHOUT PERMISSION
38
Rouse, C. E. (1998). Private school vouchers and student achievement: An evaluation of the Milwaukee Parental Choice Program. Quarterly Journal of Economics, 113, 553-602.
Schwartz, A. E., Stiefel, L, & Cordes, S. A. (In Press). Moving matters: The causal effect of
moving schools on student performance. Education Finance and Policy. Shakeel, M. D., Anderson, K. P., & Wolf, P. J. (2016). The participant effects of private school
vouchers across the globe: A meta-analytic and systematic review. Fayetteville, AR: University of Arkansas, Department of Education Reform (Working Paper 2016-07).
Sharkey, P. (2013). Stuck in place: Urban neighborhoods and the end of progress toward racial
equality. Chicago: University of Chicago Press. Witte, J. F. (2000). The market approach to education: An analysis of America’s first voucher
program. Princeton, NJ: Princeton University Press. Witte, J. F., Wolf, P. J., Cowan, J. M., Carlson, D., & Fleming, D. J. (2014). High stakes choice:
Achievement and accountability in the nation’s oldest urban voucher program. Educational Evaluation and Policy Analysis, 36, 437-456.
Wolf, P., Gutmann, B., Puma, M., Kisida, B., Rizzo, L, Eissa, N., & Carr, M. (2010). Evaluation
of the DC Opportunity Scholarship Program: Final Report (NCEE 2010-4018). Washington, DC: National Center for Education Evaluation and Regional Assistance, Institute of Education Sciences, U.S. Department of Education.
Wolf, P. J, Kisida, B., Gutmann, B., Puma, J., Rizzo, L., & Eissa, N. (2011). School vouchers in
the nation's capital. In M. Berends, M. Cannata, and E. B. Goldring (Eds.), School choice and school improvement (pp. 17-33). Boston, MA: Harvard Education Press.
Wolf, P. J, Kisida, B., Gutmann, B., Puma, J., Eissa, N., & Rizzo, L. (2013). School vouchers
and student outcomes: Experimental evidence from Washington, DC. Journal of Policy Analysis and Management, 32, 246-270.
Wolf, P. & McShane, M. (2013). Is the juice worth the squeeze? A benefit/cost analysis of the
District of Columbia Opportunity Scholarship Program. Education Finance and Policy, 8, 75-99.
Wolf, P. J., Witte, J. F., & Fleming, D. J. (2012). Special Education and the Milwaukee Parental
Choice Program (SCDP Milwaukee Evaluation Report #35). School Choice Demonstration Project, Department of Education Reform, College of Education and Health Professions, University of Arkansas, Fayetteville, AR.
Zimmer, R. & Bettinger, E. P. (2015). Beyond the rhetoric: Surveying the evidence on vouchers
and tax credits. In H. F. Ladd & M. E. Goertz (Eds.), Handbook of research in education finance and policy (pp. 444-467). New York: Routledge.

PRELIMINARY – DO NOT CITE OR DISTRIBUTE WITHOUT PERMISSION
39
Table 1. Descriptive Comparison of Voucher and Public School Students
All Low-Income Propensity Score Matched
Voucher Public Difference Voucher Public Difference Students 3,913 121,524 -- 3,276 12,406 -- Schools 268 926 -- 266 694 -- Female 0.525 0.503 0.018** 0.520 0.512 0.008 Black 0.230 0.272 -0.042*** 0.234 0.228 0.006 Latino/a 0.235 0.184 0.051*** 0.212 0.202 0.010 Other Race/Ethnicity 0.089 0.088 0.001 0.083 0.083 0.000 Baseline ELL 0.124 0.101 0.023*** 0.114 0.100 0.014* Special Education 0.080 0.118 -0.038*** 0.074 0.067 0.007 Retained 0.012 0.008 0.004* 0.005 0.006 -0.001 Attend Charter 0.120 0.120 0.000 0.085 0.085 0.000 Attend Magnet 0.030 0.031 -0.001 0.030 0.030 0.000 Suburban School 0.226 0.226 0.000 0.233 0.233 0.000 Town/Rural School 0.215 0.211 0.004 0.232 0.232 0.000 Mean Math Score -0.247 -0.354 0.106*** -0.246 -0.255 0.009 Mean ELA Score -0.225 -0.341 0.117*** -0.235 -0.246 0.011 Mean Math Gain -0.008 -0.028 0.020* -0.020 -0.013 -0.007 Mean ELA Gain -0.002 -0.025 0.023* -0.013 -0.007 -0.006 1st Yr. Post-Baseline Attend Catholic 0.538 -- -- 0.538 -- -- Attend Other Private 0.462 -- -- 0.462 -- -- Mean Math Score -0.362 -0.309 -0.053*** -0.359 -0.239 -0.120*** Mean ELA Score -0.209 -0.288 0.079*** -0.211 -0.226 0.016 Mean Math Gain -0.114 0.045 -0.159*** -0.114 0.015 -0.129*** Mean ELA Gain 0.012 0.055 -0.043*** 0.022 0.017 0.005
~p≤0.100; *p≤0.050; **p≤0.010; ***p≤0.001. Table displays voucher and public school students with at least two years of test scores at baseline. Number of schools reported as public schools at baseline and voucher private schools in first year post-baseline. Weighted proportions of students reported for demographic characteristics. Weighted ISTEP+ Math and ELA scores measured in standard deviation units, relative to the Indiana state mean and standard deviation within each grade and year. For demographic and academic background characteristics, statistically significant differences in proportions reported from weighted logistic regression of student characteristic with voucher student status. For test scores, statistically significant differences in means reported from OLS regression of student test score with voucher student status.

PRELIMINARY – DO NOT CITE OR DISTRIBUTE WITHOUT PERMISSION
40
Table 2. Main Effects of Indiana Voucher Program on Student Math Achievement
A. Math Achievement Levels All Low-Income Propensity Score Matched
OLS (1)
DD (2)
FE (3) OLS
(1) DD (2)
FE (3)
Received Voucher -0.063* -0.096** -0.151*** -0.087** -0.086* -0.143***
(0.030) (0.033) (0.016) (0.031) (0.034) (0.017) Post-Baseline -0.027 -0.022
(0.017) (0.021) Voucher Student 0.055*** 0.007 Base./Pre-Base. Diff (0.014) (0.015) Demographics Y Y N Y Y N Time-Var. Chars. Y Y Y Y Y Y Prior Year Ach. N N N N N N Grade-Year FE Y Y Y Y Y Y Student FE N N Y N N Y Observations N 455,331 455,331 455,331 60,933 60,933 60,933 Students N 122,896 122,896 122,896 15,682 15,682 15,682
B. Math Achievement Gains All Low-Income Propensity Score Matched
OLS (4)
DD (5)
FE (6) OLS
(4) DD (5)
FE (6)
Received Voucher -0.096*** -0.120*** -0.168*** -0.098*** -0.100*** -0.157***
(0.016) (0.021) (0.017) (0.017) (0.022) (0.018) Post-Baseline -0.002 -0.018
(0.012) (0.014) Voucher Student 0.032** 0.008 Baseline Difference (0.011) (0.011) Demographics Y Y N Y Y N Time-Var. Chars. Y Y Y Y Y Y Prior Year Ach. Y Y Y N N N Grade-Year FE Y Y Y Y Y Y Student FE N N Y N N Y Observations N 331,833 331,833 331,833 45,215 45,215 45,215 Students N 122,606 122,606 122,606 15,682 15,682 15,682
~p≤0.100; *p≤0.050; **p≤0.010; ***p≤0.001. ISTEP+ Math achievement measured in standard deviation units, relative to the Indiana state mean and standard deviation within each grade and year. Weights included. Robust standard errors, adjusted for the clustering of students within schools, are in parentheses.
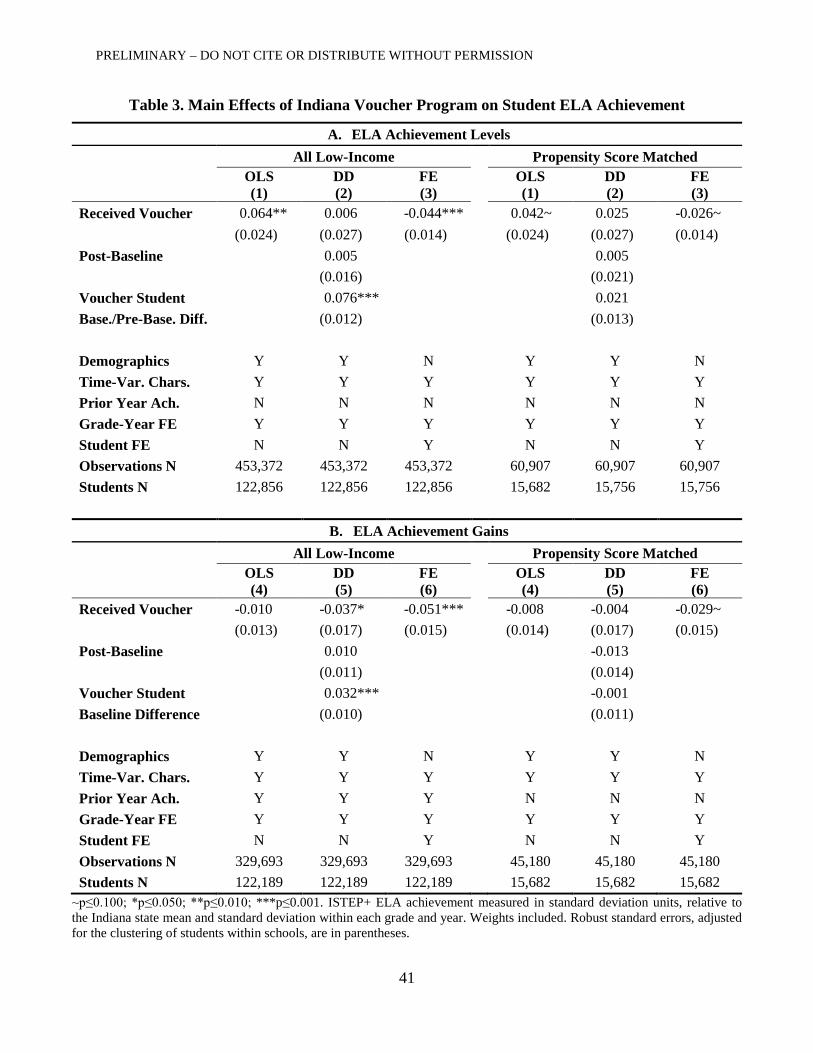
PRELIMINARY – DO NOT CITE OR DISTRIBUTE WITHOUT PERMISSION
41
Table 3. Main Effects of Indiana Voucher Program on Student ELA Achievement
A. ELA Achievement Levels All Low-Income Propensity Score Matched
OLS (1)
DD (2)
FE (3) OLS
(1) DD (2)
FE (3)
Received Voucher 0.064** 0.006 -0.044*** 0.042~ 0.025 -0.026~
(0.024) (0.027) (0.014) (0.024) (0.027) (0.014) Post-Baseline 0.005 0.005
(0.016) (0.021) Voucher Student 0.076*** 0.021 Base./Pre-Base. Diff. (0.012) (0.013) Demographics Y Y N Y Y N Time-Var. Chars. Y Y Y Y Y Y Prior Year Ach. N N N N N N Grade-Year FE Y Y Y Y Y Y Student FE N N Y N N Y Observations N 453,372 453,372 453,372 60,907 60,907 60,907 Students N 122,856 122,856 122,856 15,682 15,756 15,756
B. ELA Achievement Gains
All Low-Income Propensity Score Matched
OLS (4)
DD (5)
FE (6) OLS
(4) DD (5)
FE (6)
Received Voucher -0.010 -0.037* -0.051*** -0.008 -0.004 -0.029~
(0.013) (0.017) (0.015) (0.014) (0.017) (0.015) Post-Baseline 0.010 -0.013
(0.011) (0.014) Voucher Student 0.032*** -0.001 Baseline Difference (0.010) (0.011) Demographics Y Y N Y Y N Time-Var. Chars. Y Y Y Y Y Y Prior Year Ach. Y Y Y N N N Grade-Year FE Y Y Y Y Y Y Student FE N N Y N N Y Observations N 329,693 329,693 329,693 45,180 45,180 45,180 Students N 122,189 122,189 122,189 15,682 15,682 15,682
~p≤0.100; *p≤0.050; **p≤0.010; ***p≤0.001. ISTEP+ ELA achievement measured in standard deviation units, relative to the Indiana state mean and standard deviation within each grade and year. Weights included. Robust standard errors, adjusted for the clustering of students within schools, are in parentheses.

PRELIMINARY – DO NOT CITE OR DISTRIBUTE WITHOUT PERMISSION
42
Table 4. Robustness Checks of Main Effects
Math ELA
Levels Gains Levels Gains Preferred Model -0.086* -0.100*** 0.025 -0.004
(0.034) (0.022) (0.027) (0.017) Structural Changes Only -0.182*** -0.123*** -0.056 -0.057*
(0.053) (0.026) (0.042) (0.027) No Mobility Indicators -0.096** -0.100*** 0.017 -0.004
(0.034) (0.021) (0.027) (0.017) No Spec. Ed. Control -0.079* -0.098*** 0.031 -0.002
(0.035) (0.022) (0.028) (0.017) Gain Score Outcome -- -0.118*** -- -0.021
(0.019) (0.016) Off-Subject Prior Ach. -- -0.105*** -- -0.004
(0.022) (0.017) Prior Ach. Pre-Treat Only -- -0.083*** -- 0.028
(0.033) (0.026) Keep Exit Stud. in Treat. -0.101** -0.071*** 0.019 0.003
(0.033) (0.019) (0.027) (0.017) No Indianapolis Urban -0.083* -0.113*** 0.020 -0.017
(0.039) (0.025) (0.032) (0.021) ~p≤0.100; *p≤0.050; **p≤0.010; ***p≤0.001. All results displayed from preferred difference-in-differences model with propensity-score matched students. ISTEP+ Math and ELA achievement measured in standard deviation units, relative to the Indiana state mean and standard deviation within each grade and year. Propensity score matching weights included. Robust standard errors, adjusted for the clustering of students within schools, are in parentheses.

PRELIMINARY – DO NOT CITE OR DISTRIBUTE WITHOUT PERMISSION
43
Table 5. Annual Effects of Indiana Voucher Program on Student Achievement
Math ELA
Levels Gains Levels Gains Pre-Baseline Year 0.017 -- 0.006 --
(0.020) (0.018) Baseline Year 0.005 0.010 0.023 0.002
(0.016) (0.011) (0.015) (0.011) Rec. Voucher Year 1 -0.036 -0.120*** 0.071* 0.016
(0.036) (0.027) (0.029) (0.022) Rec. Voucher Year 2 -0.178*** -0.122*** -0.081* -0.087***
(0.041) (0.026) (0.035) (0.025) Rec. Voucher Year 3 -0.089~ -0.013 0.041 0.065*
(0.046) (0.033) (0.041) (0.029) Rec. Voucher Year 4 0.045 -0.011 0.134~ 0.080
(0.083) (0.079) (0.071) (0.063) ~p≤0.100; *p≤0.050; **p≤0.010; ***p≤0.001. All results displayed from preferred difference-in-differences model with propensity-score matched students. ISTEP+ Math and ELA achievement measured in standard deviation units, relative to the Indiana state mean and standard deviation within each grade and year. Propensity score matching weights included. Robust standard errors, adjusted for the clustering of students within schools, are in parentheses.

PRELIMINARY – DO NOT CITE OR DISTRIBUTE WITHOUT PERMISSION
44
Table 6. Mean Subgroup Effects of Indiana Voucher Program on Student Achievement
Math ELA
Levels Gains Levels Gains Male -0.089* -0.093*** 0.009 -0.022
(0.042) (0.028) (0.035) (0.024) Female -0.085* -0.107*** 0.039 0.013
(0.038) (0.025) (0.031) (0.020) White -0.097* -0.094* 0.010 0.010
(0.041) (0.026) (0.037) (0.024) Black -0.126* -0.156*** 0.015 -0.044
(0.060) (0.047) (0.049) (0.035) Latino -0.010 -0.038 0.053 0.015
(0.067) (0.037) (0.047) (0.030) Other Race/Eth. -0.109 -0.121* 0.037 -0.027 (0.094) (0.061) (0.078) (0.060) Non-ELL -0.103** -0.109*** 0.012 -0.009
(0.036) (0.023) (0.060) (0.018) ELL 0.012 -0.032 0.066 0.014
(0.073) (0.058) (0.057) (0.043) Non-Special Education -0.088* -0.101*** 0.029 -0.005(s)
(0.035) (0.022) (0.028) (0.018) Special Education -0.087 -0.091 -0.048 -0.130*(s)
(0.100) (0.089) (0.087) (0.061) Continue -0.069*(s) -0.094***(s) 0.043(s) 0.004(s)
(0.035) (0.022) (0.027) (0.017) Exit -0.242***(s) -0.156***(s) -0.136***(s) -0.074**(s)
(0.048) (0.033) (0.042) (0.027) Catholic -0.053 -0.079* 0.071*(s) 0.034*(s)
(0.037) (0.020) (0.029) (0.017) Other Private -0.132* -0.128*** -0.040(s) -0.055*(s)
(0.053) (0.035) (0.035) (0.025) Urban -0.078 -0.077* 0.026 0.009
(0.048) (0.034) (0.038) (0.024) Suburban -0.072 -0.115*** 0.063 0.018
(0.069) (0.034) (0.049) (0.031) Town/Rural -0.127* -0.133*** -0.030 -0.059
(0.063) (0.038) (0.057) (0.036) ~p≤0.100; *p≤0.050; **p≤0.010; ***p≤0.001. We estimate subgroup effects using the difference-in-differences model with a full set of interactions by subgroup and the three difference-in-differences estimators. (s)Indicates significant differences between subgroups (p≤0.050).

PRELIMINARY – DO NOT CITE OR DISTRIBUTE WITHOUT PERMISSION
45
Figures 1A & 1B. Predicted Achievement Levels over Time (Propensity Score Matched Students using Difference-in-Differences Preferred Model)
-.5-.2
50
.25
.5M
ean
Ach
ieve
men
t (S
D)
-1 0 1 2 3 4Years from Baseline
Voucher Public
Difference-in-Differences Time TrendPredicted Math Achievement
-.5-.2
50
.25
.5M
ean
Ach
ieve
men
t (S
D)
-1 0 1 2 3 4Years from Baseline
Voucher Public
Difference-in-Differences Time TrendPredicted ELA Achievement

PRELIMINARY – DO NOT CITE OR DISTRIBUTE WITHOUT PERMISSION
46
APPENDIX A DESCRIPTION OF DATA RESTRICTIONS FOR ANALYSIS
In the process of creating our analytical sample, we made several analytical decisions that
pared down the number of voucher and public school comparison students suitable for analysis.
We describe these decisions below and follow the number of total voucher students influenced
by our decisions in parentheses. We have no evidence that potential public school comparison
students were differentially excluded by these decisions.
Between the 2011-12 and 2014-15 school years, there were a total of 19,120 unique
students who received vouchers statewide in grades 3-8. We first removed any students whom
we observed with multiple observations within a given year or transferred schools within the
same year (29). We do not have information from IDOE that allows us to tell which school these
students attended first or in which one they were tested. Next, we removed all voucher students
(3,101) who had only one total year of testing data. These are mostly 3rd grade students receiving
a voucher in 2014-15. We also remove all students (3,371; mostly 4th graders) with only two
years of test data. As we later describe, we assess student achievement gains across at least two
years, which require at least three years of data. We remove all students (778) who are missing
both math and ELA test scores in any given year as they have a gap in their achievement
trajectories. Lastly, we remove all students who at some point attended alternative public schools
throughout the state (13).
Based on these decisions, we have 11,828 unique voucher students for whom we have at
least three consecutive years of test scores in our data. Similarly, there are 551,110 unique
students attending an Indiana public school (traditional public, charter, or magnet) with at least
three consecutive years of test scores in our data, never receive a voucher, and remain enrolled in
some form of a public school through the duration of our available data.

PRELIMINARY – DO NOT CITE OR DISTRIBUTE WITHOUT PERMISSION
47
APPENDIX B DESCRIPTION OF ROBUSTNESS CHECKS
Here, we detail the rationale behind each of the eight alternative models to assess the
robustness of the voucher main effects from the difference-in-differences preferred model with
the propensity score matched sample.
The first two checks involve student mobility. We first constrain our results to only those
students making structural school changes, as families who have higher motivation may be
making non-structural moves. For ELA gains, we find a small annual loss (-0.057 SD; p≤0.05)
and larger losses in math compared to our preferred model. The lower achievement of voucher
students only making structural moves suggests our hypothesis may be valid, though this is
unsurprising with a voucher program designed to encourage mobility. We note that this is the
only robustness check for which we observe substantial differences from our main effects. In a
second robustness check, we also remove the mobility indicators, which may mask part of the
private school effect, and find no differences.
In another robustness check, we remove the control for special education students. Prior
research indicated that students are less likely to be classified as special education once enrolled
in private schools (Wolf, Witte, & Fleming, 2012). We descriptively find a similar bias in
Indiana (though not for English Language Learner classification). To see if this difference in
classification impacts our findings, we remove the special education control. We find no
meaningful differences in these results and our preferred estimates, suggesting this indicator is
not generating additional bias. We leave the special education indicator in our main analysis.
The next three robustness checks all deal with controlling for prior achievement in the
gains models. In the first, we use the students gain score (current year achievement—prior year)
as the outcome. This is a common approach in the education literature (we use it in our previous

PRELIMINARY – DO NOT CITE OR DISTRIBUTE WITHOUT PERMISSION
48
work—see Berends & Waddington, in press), though remains part of an ongoing debate within
the education research community. For the second robustness check, we also include prior
achievement in the off subject as a control (e.g., prior math score for ELA gains model and vice
versa). This decision was influenced by the growing value-added modeling literature (for review
see Koedel, Mihaly, & Rockoff, 2015). For the third robustness check, we limit our control for
prior achievement from only the baseline and pre-baseline years. We created a new variable
where prior achievement is each student’s value in the pre-treatment years and zero thereafter.
This avoids the issue of controlling for post-treatment outcomes, which could potentially
introduce exogeneity into the estimates. Across each of these robustness checks, we find no
meaningful differences with our preferred model.
In our next robustness check, we keep students who exit private schools classified in the
treatment condition. There are unobserved reasons (time-varying confounding) that may
influence the decision to switch back to a public school. We estimate a separate model where
these students remain in the treatment condition even after exiting a private school to see if there
is a change in our findings. This stems from the work by Hernán, Brumback, & Robins (2000)
and Sobel (2012). Again, we find no meaningful differences compared with our preferred model
in terms of conclusions, though the estimated annual math loss has shrunk to 0.071 SD per year.
The final robustness check stems from our own prior work. We previously found that
students attending Catholic and other private schools in Indianapolis, of whom at least half are
voucher students, experience annual achievement losses in math (see Berends & Waddington, in
press). To ensure these students are not driving results, we remove all students in the
Indianapolis urban area from the analysis. We observe similar findings as our preferred model,
suggesting that the voucher student loss in math is statewide.

PRELIMINARY – DO NOT CITE OR DISTRIBUTE WITHOUT PERMISSION
49
Appendix Table 1. Comparison of All Voucher and Non-Voucher Private School Students
Voucher Students Non-Voucher Students
Pub.->Priv. Matched Low Inc.
Pub.->Priv. Unmatched
Low Inc.
Pub.->Priv. Non-Low
Inc.
Priv.->Pub. ->Priv. Priv.->Pub. Always
Private Catholic Other Private
Students 3,276 637 502 209 663 6,541 31,505 12,647 Female 0.520 0.553 0.471 0.559 0.501 0.508 0.495 0.505 Black 0.234 0.208 0.105 0.119 0.249 0.090 0.029 0.054 Latino/a 0.212 0.354 0.079 0.150 0.150 0.138 0.066 0.025 Other Race/Eth. 0.083 0.122 0.088 0.119 0.091 0.060 0.064 0.061 FRPL 0.854 0.895 0.387 0.571 0.696 0.479 0.140 0.158 ELL 0.114 0.176 0.052 0.027 0.104 0.071 0.049 0.026 Special. Ed. 0.074 0.112 0.140 0.036 0.135 0.092 0.087 0.079 Retained 0.005 0.047 0.062 0.000 0.000 0.003 0.012 0.018 Year Before Voucher (Baseline) Mean Math Score -0.246 -0.255 0.116 -0.232 -0.405 -0.029 -- -- Mean ELA Score -0.235 -0.172 0.199 -0.020 -0.319 0.094 -- -- All Years with Voucher All Years Mean Math Score -0.338 -0.332 0.046 -0.249 -0.601 -0.115 0.378 0.224 Mean ELA Score -0.194 -0.156 0.180 0.008 -0.418 0.026 0.490 0.355
Table displays voucher students with at least two years of test scores prior to receiving a voucher (at least three total years). Proportions of students reported for demographic characteristics. ISTEP+ Math and ELA scores measured in standard deviation units, relative to the Indiana state mean and standard deviation within each grade and year.

PRELIMINARY – DO NOT CITE OR DISTRIBUTE WITHOUT PERMISSION
50
Appendix Table 2. Comparison of All Voucher and Non-Voucher Private School Students
Matched Low Inc.
Same Schl.
Unmatched Low Inc.
Same Schl.
Non-Low Inc.
Same Schl.
All Other Public
Students Students 12,406 109,118 87,920 349,296 Female 0.512 0.500 0.496 0.495 Black 0.228 0.257 0.057 0.078 Latino/a 0.202 0.176 0.038 0.074 Other Race/Eth. 0.083 0.087 0.068 0.067 FRPL 0.854 0.926 0.112 0.529 ELL 0.100 0.102 0.032 0.059 Special. Ed. 0.067 0.127 0.128 0.163 Retained 0.006 0.007 0.007 0.022 Ever Att. Charter 0.109 0.084 0.030 0.029 Ever Att. Magnet 0.063 0.053 0.026 0.018 Baseline Year Mean Math Score -0.255 -0.339 0.379 -- Mean ELA Score -0.246 -0.348 0.343 -- All Years Mean Math Score -0.220 -0.303 0.371 0.067 Mean ELA Score -0.213 -0.305 0.343 0.057 Table displays public school students with at least three years of test scores and who have never received a voucher. Proportions of students reported for demographic characteristics. ISTEP+ Math and ELA scores measured in standard deviation units, relative to the Indiana state mean and standard deviation within each grade and year.

PRELIMINARY – DO NOT CITE OR DISTRIBUTE WITHOUT PERMISSION
51
Appendix Table 3. Additional Description of Voucher Students
All
Low-Income PS Matched
Total Students 3,913 3,276 Ever Enrolled in Catholic School 2,118 1,774 Ever Enrolled in Other Private School 1,819 1,522 Observed 2011-12 (1st Yr. of Voucher Program) 3,104 2,541 Observed 2012-13 3,730 3,110 Observed 2013-14 3,365 2,781 Observed 2014-15 2,711 2,224 Continue Receive Voucher & Remain Enrolled in Private Schl. 3,291 2,769 Stop Receiving Voucher & Remain Enrolled in Private School 28 19 Stop Receiving Voucher & Return to Public School 594 488 1 Total Year Receiving Voucher 1,758 1,545 2 Total Years Receiving Voucher 1,262 1,023 3 Total Years Receiving Voucher 698 556 4 Total Years Receiving Voucher 195 152 Year of First Voucher Receipt 2011-12 923 781 2012-13 1,124 932 2013-14 1,057 828 2014-15 809 735 Grade of First Voucher Receipt Grade 4 80 48 Grade 5 1,216 1,036 Grade 6 1,215 941 Grade 7 841 744 Grade 8 560 507 % Retained Upon Private School Entry 4.98% 4.79%
Table displays voucher students previously enrolled in a public school with at least two total years of test scores at baseline. Students continuing to receive voucher are students observed receiving a voucher through the final year of the available data (2014-15), eighth grade, or leaving the dataset (e.g., moving to another state). Students returning to public school are observed in a traditional public, charter, or magnet school in at least one year following receiving a voucher and enrolling in a private school.


