Sakalli: Impacts of climate change on net primary production
- 1 -
APPLIED ECOLOGY AND ENVIRONMENTAL RESEARCH 15(1):1-15. http://www.aloki.hu ● ISSN 1589 1623 (Print) ● ISSN 1785 0037 (Online)
DOI: http://dx.doi.org/10.15666/aeer/1501_001015
2017, ALÖKI Kft., Budapest, Hungary
IMPACTS OF CLIMATE CHANGE ON NET PRIMARY
PRODUCTION: A MODELLING STUDY AT PAN-EUROPEAN
SCALE
SAKALLI, A.
Faculty of Marine Sciences and Technology, Iskenderun Technical University
P.O. Box 31200 Iskenderun, Hatay, Turkey
e-mail: [email protected]; phone: +903266141693; fax: +903266141877
(Received 14th Jul 2016; accepted 29th Oct 2016)
Abstract. Identification of the net primary production capacity of European vegetated areas has been
becoming the meaning since last decades. Responses of carbon uptake by autotrophs and storage in
terrestrial ecosystems under environmental changes is quite important to understand and predict the
biogeochemical cycles, and thus the interactions between atmosphere and terrestrial biosphere in the
future. Remote sensing of the Earth systems has been having very important roles for calibration of the
modelling results during last 20 years. In this paper, we simulate the impacts of the climate change and
elevated CO2 in the atmosphere on net primary production by autotrophs by using Community Land
Model vers. 4.5 (CLM4.5) with remarkable high grid resolution (i.e. 25x25 km) at pan-European scale.
We especially focused on the time period in the future when the global warming reaches the 2ºC (i.e.
2034-2063) in Europe. The CLM4.5 model performs quite good in Western and Southern Europe.
Although the model predicts the NPP ca. 2 times higher than the remote sensed NPP by MODIS, the
analysis between in-situ data and CLM4.5 shows better correlation than between in-situ data and remote
sensed NPP in 19 study areas. Despite of the higher correlation of the model with in-situ data, it is still
needed long-term observation studies needed from different biome types and plant functional types.
Keywords: biogeochemical cycle, COP21, CLM4.5, MODIS, remote sensing
Introduction
Net Primary Production (NPP) is one of the most important keywords for
investigation of the climate change effect on carbon uptake and storage by
photosynthetic organisms. Numerous studies focused on determining the climate change
impacts on NPP in the terrestrial ecosystems (Melillo et al., 1993; Cao and Woodward,
1998; Bonan, 2008; Ummenhofer et al., 2015). Plant productivity is a very important
aspect in the global biogeochemical cycles especially in global carbon cycle due to the
absorption of a part of anthropogenic emitted CO2 from the atmosphere (Esser et al.,
2012). NPP is also a quite essential parameter for all ecosystems, since it can illustrate
the quality and quantity of absorbing the incoming solar energy, and also indicates the
fundamental energy source for all heterotroph organisms in the ecosystems. The
potential change in the primary production in the terrestrial and marine ecosystems
under global 2 ºC average temperature increase has been discussing since the last
decades (Chust et al., 2014; Guanter et al., 2014; Danelichen et al., 2015). Among
others, Kirschbaum (2000) studied the responses of vegetation growth, photosynthesis,
and respiration to the change climate from pre-industrial time (i.e. 1900) up to 2100. In
his study, it has been mentioned that a 2 ºC increase in global average temperature
affects the physiological and biological processes of various plant species that
especially distribute in a narrow temperature niches. On the other hand, a 20% of yield
increase in crop plants was reported under global average temperature increase up to 2
ºC within the fourth assessment report of the Intergovernmental Panel on Climate

Sakalli: Impacts of climate change on net primary production
- 2 -
APPLIED ECOLOGY AND ENVIRONMENTAL RESEARCH 15(1):1-15. http://www.aloki.hu ● ISSN 1589 1623 (Print) ● ISSN 1785 0037 (Online)
DOI: http://dx.doi.org/10.15666/aeer/1501_001015
2017, ALÖKI Kft., Budapest, Hungary
Change (IPCC) (Easterling et al., 2007). In the assessment report, it was also pointed to
a decline in crop yield with increasing temperature after 2 ºC increasing period. Wan et
al. (2005) quantified a similar impact of temperature increase in semi-natural vegetation
(i.e. grassland). In their field study, they monitored about 19% increase in above ground
net primary production under 2 ºC temperature warming. Certainly, not only the
temperature but also precipitation, solar energy, humidity and wind speed have
significant impacts on the NPP (Wan et al., 2005). In a Chihuahuan desert grassland,
Thomey et al. (2011) studied the effect of precipitation on net primary production. They
quantified a substantive increase in NPP due to an increase in precipitation in the study
areas. Approximately 1.3% of incoming solar energy is absorbed by plants during the
growing season. A substantial accumulation of net biomass takes in some vegetated
regions from decades to centuries, which indicates that such vegetated regions actually
points to net sink of carbon (Dixon et al., 1994). For instance, temperate and boreal
forests are the main green areas for sink of carbon in pan-European region. Kauppi et al.
(1992) referenced to a ~0.12 Pg C estimated annual carbon fluxes in that forests.
Estimation and measurement of NPP are carried out by various methods in the
terrestrial ecosystem (Lieth, 1975; Esser, 1998; Zhao et al., 2005). For such aims,
enhanced remote sensing of NPP has been widely using to study, quantify, and
understand the carbon uptake and storage capacity of the terrestrial ecosystems since
last decades (Liu et al., 1997; Turner et al., 2004; Maselli et al., 2013; Pachavo and
Murwira, 2014; Wang, 2016). Although remote sensing performs good results for NPP
at global or regional scale, the satellite or radars have some technical difficulties in
estimating of NPP under cloudy or snowy days. That leads often to under- or
overestimation of NPP in the terrestrial biosphere (Zhao et al., 2005, 2006, 2010; Pan et
al., 2006; Turner et al., 2006). Compared to the remote sensing methods, earth system
models can deliver often quite good results for NPP in terrestrial biosphere (Prieto-
Blanco et al., 2009; Donmez et al., 2011).
In this paper, we aimed to define the carbon storage capacity in high grid resolution
at pan-European scale, and investigate the behaviour of carbon sink areas under climate
change. Those produce new aspects to estimate of net carbon storage in European
terrestrial biosphere. This is an important issue to find out how will the carbon storage
capacity of terrestrial ecosystem be affected by changing the combination of the
relevant climate parameter in the 2 ºC global warming period in the future. It also gives
data about the carbon storage capacity of European vegetation in the future when the
global average temperature increases up to 2 ºC.
Also the main objectives of the study were: (i) to describe the spatio-temporal
heterogeneity in NPP by using remote sensed and modelled data, (ii) to quantify the
difference between the remote sensed and modelled NPP, (iii) to identify the
relationship between the climate conditions and modelled NPP, (iv) to indicate the
change in NPP during the 2 ºC global average temperature increase period.
Material and Methods
Model Initialization
For estimating of net primary production, the Community Land Model version 4.5
(CLM4.5) was established on 25x25 km grid resolution at pan-European scale. The
model was run with bias corrected climate data for 800 years in ad-hoc (accelerated
method) mode to get the main carbon pools of the terrestrial biosphere (e.g. soil
Sakalli: Impacts of climate change on net primary production
- 3 -
APPLIED ECOLOGY AND ENVIRONMENTAL RESEARCH 15(1):1-15. http://www.aloki.hu ● ISSN 1589 1623 (Print) ● ISSN 1785 0037 (Online)
DOI: http://dx.doi.org/10.15666/aeer/1501_001015
2017, ALÖKI Kft., Budapest, Hungary
carbon, vegetation carbon, total ecosystem carbon etc.) in steady state. The
accelerated method of the model, which based on the acceleration of decomposition
rates for a spin-up phase in CLM4.5, describes the steady state process of the model.
By this method, the main aim is an approximation of steady state conditions for the
CLM4.5 model by using specific characteristics of the model dynamics for producing
individual time processes via the model condition space, and methods of multivariate
minimization that repeatedly investigate multiple time processes by condition space in
searching of reasonable equilibrium solutions. The detailed description of the
algorithms for the ad-hoc method and steady state runs (spin-up) was published by
Thornton and Rosenbloom (2005).
We first run the model with the ad-hoc method for 800 years to get the carbon pools
in the ecosystems in equilibrium. Within this run, we used stable climate conditions that
were taken from the ensemble average of 30-year historical run of the used regional
climate model in monthly resolution. After reaching the carbon pools of the ecosystems
(i.e. carbon pools in soil and vegetation) the steady state we switched of the ad-hoc
method and run the model with the normal decomposition rates but the same climate
data up to 1950. Thereafter, we forced the model with bias corrected monthly climate
data from 1950 to 2100. For the future period (i.e. from 2004 to 2100), the bias
corrected climate data were simulated by used regional climate model under
consideration the Representative Concentration Pathway 4.5 (RCP4.5) (see Sec. 2.2).
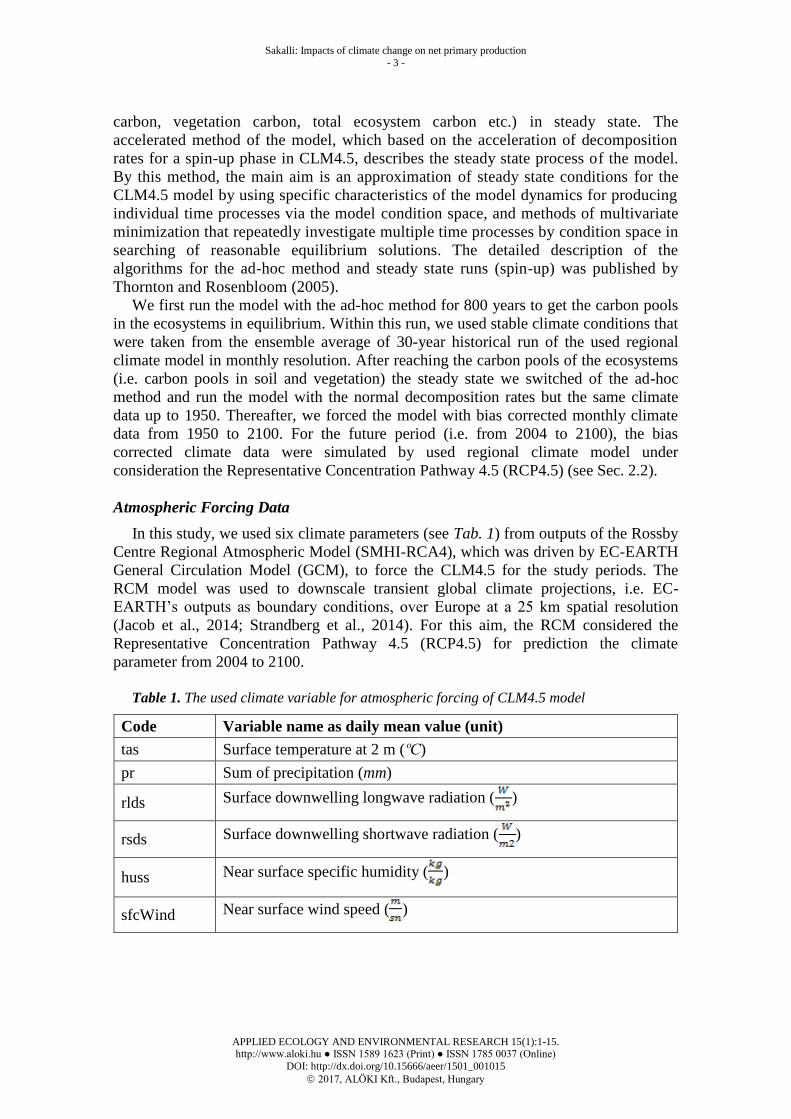
Atmospheric Forcing Data
In this study, we used six climate parameters (see Tab. 1) from outputs of the Rossby
Centre Regional Atmospheric Model (SMHI-RCA4), which was driven by EC-EARTH
General Circulation Model (GCM), to force the CLM4.5 for the study periods. The
RCM model was used to downscale transient global climate projections, i.e. EC-
EARTH’s outputs as boundary conditions, over Europe at a 25 km spatial resolution
(Jacob et al., 2014; Strandberg et al., 2014). For this aim, the RCM considered the
Representative Concentration Pathway 4.5 (RCP4.5) for prediction the climate
parameter from 2004 to 2100.
Table 1. The used climate variable for atmospheric forcing of CLM4.5 model
Code Variable name as daily mean value (unit)
tas Surface temperature at 2 m (ºC)
pr Sum of precipitation (mm)
rlds Surface downwelling longwave radiation ( )
rsds Surface downwelling shortwave radiation ( )
huss Near surface specific humidity ( )
sfcWind Near surface wind speed ( )

Sakalli: Impacts of climate change on net primary production
- 4 -
APPLIED ECOLOGY AND ENVIRONMENTAL RESEARCH 15(1):1-15. http://www.aloki.hu ● ISSN 1589 1623 (Print) ● ISSN 1785 0037 (Online)
DOI: http://dx.doi.org/10.15666/aeer/1501_001015
2017, ALÖKI Kft., Budapest, Hungary
Model Description
After spinning up of the model, we run it with required climate data from 1970 to
2100. According to the simulations which show the start of 2ºC global average
temperature increase in ca. 2030 and the end in ca. 2060, we take two 30 year periods
(1970-2000 and 2030-2060) for investigation the change of the NPP in past observed
period (1970-2000) and future projected period (2030-2060). The version of the model
uses the 17 plant functional types (PFTs) from the study of Lawrence & Chase (2007).
The NPP is formulated in the CLM4.5 as
(Eq.1)
where MR is for maintenance and GR is for growth respiration. Maintenance growth
respiration is mainly calculated by sum of carbon fluxes in leaf, fine root, live steam and
live root (see Eq. 1).
(Eq.2)
where CFleaf, CFfroot, CFlivestem, and CFlivecroot is maintenance respiration costs for
leaf, fine root, live stem, and live coarse root, respectively.
Growth respiration is also calculated as 30% of the total carbon in new growth
(Larcher, 1995 “Physiological Plant Ecology”).
(Eq.3)
In its simplest form, GPP is modelled in CLM4.5 by considering the carboxylation as:
(Eq.4)
The RuBP carboxylase (Rubisco) limited rate of carboxylation Ac (µmol CO2·m-2
·s -1
) is
. (Eq.5)
The light limited maximum rate of carboxylation that allows to regenerate RuBP Aj
(µmol CO2·m-2
·s-1
) is
(Eq.6)
The product-limited and PEP carboxylase-limited rate of carboxylation for C3 and
C4 plants Ap ( µmol CO2·m-2
·s -1
) is

Sakalli: Impacts of climate change on net primary production
- 5 -
APPLIED ECOLOGY AND ENVIRONMENTAL RESEARCH 15(1):1-15. http://www.aloki.hu ● ISSN 1589 1623 (Print) ● ISSN 1785 0037 (Online)
DOI: http://dx.doi.org/10.15666/aeer/1501_001015
2017, ALÖKI Kft., Budapest, Hungary
(Eq.7)
In the equations of the carboxylation, ci is the partial pressure of CO2 in internal leaf
(Pa), Oi is the partial of O2 (Pa), Kc and Ko are the Michaelis-Menten constants (Pa) for
CO2 and O2. is the CO2 compensation point. Vcmax is the maximum rate of C
assimilation (µmol·m-2
·s-1
). J stands for electron transport rate (µmol·m-2
·s-1
), Tp for
triose phosphate utilization rate (µmol·m-2
·s-1
). is the absorbed photosynthetically
active radiation (W·m-2
) and kp is the initial slope of C4 CO2 response curve. The
detailed description of the parameters can be found in the study by Oleson et al. (2013).
Model Simulations Design
The simulation of the NPP was continuously done by the model from 1950 to 2100.
We analyzed two 30-year time periods, i.e. 1971-2000 and 2031-2060 as historical and
future period, respectively. The selected 30-year time periods were chosen according to
the IPCC AR5 report (Kirtman et al., 2013), i.e. 1971-2000 as a base line for depicting
near term climate change affects, and the period in that the global average temperature
reached the 2 ºC in the RCP4.5 scenario, i.e. 2031-2060 as a base line for depicting
future climate change impacts on the NPP at pan-European scale.
Observation Data
The comparison and correlation analysis of the model results were done by using in-situ
measurement data from six different data sources. We selected the locations with the NPP
data from the data sources by considering the same biome and plant functional types (PFT)
similar as in grid cells of the CLM4.5 model. We also considered the time periods of the in-
situ measurements for comparison of the simulated and measured NPP in a grid cell.
Intercomparison of the Model
For intercomparison of the modelled NPP, we used the available monthly NPP data
from MODIS (Moderate Resolution Imaging Spectro-radiometer) satellite for the time
range between 2000 and 2014. The data were released within MOD17 project and
provided continuous estimates of NPP in ca. 4 km resolution across the Earth’s
vegetated land surface (Zhao and Running, 2010). We used bilinear interpolation
method of Climate Data Operators (CDO) to upscale MODIS results from 4x4 km to
model output grid resolution (i.e. 25x25 km) for this study (CDO, 2015). The detailed
description of the bilinear interpolation method and module is published by
Schulzweida (2015). The correlation analysis between the in-situ data, and predicted
and remote sensed data were carried out with IBM SPSS statistic software version 23.
Result and Discussion
Net primary production (NPP) was obtained from the MODIS sensor at 4 km spatial
resolution for the pan-European terrestrial surface. In Fig. 1-left, the original 4x4 km
resolution NPP and Fig. 1-right the from 4x4 km to 25x25 km up-scaled NPP are
shown. It is to see that the upscale method does not change the quality and distribution

Sakalli: Impacts of climate change on net primary production
- 6 -
APPLIED ECOLOGY AND ENVIRONMENTAL RESEARCH 15(1):1-15. http://www.aloki.hu ● ISSN 1589 1623 (Print) ● ISSN 1785 0037 (Online)
DOI: http://dx.doi.org/10.15666/aeer/1501_001015
2017, ALÖKI Kft., Budapest, Hungary
of the NPP data in domain of the study. As it is expected, the highest 15-year average
NPP value (~2200 from 2000 to 2014) was taken by MODIS in temperate
broadleafed and mixed forests in pan-European region (see Fig. 1). In temperate
biomes, the dominant plant species are generally Fagus spp., Quercus spp., Betula spp.
and Carpinus spp. (Schmithüsen, 1976; Olson et al., 2001). NPP was quantified
between 300 and 600 by the satellite in boreal forests of northern and eastern
Europe (see Fig. 1). A long the Mediterranean cost, where vegetated areas are
dominated by sclerophyllous shrub formation and evergreen seasonal dry forests with
Q. ilex ranges the NPP between 200 and 1050 (see Fig. 1).
In the Table 2, we summarize NPP values from seven different published sources
from different times for three main biome types of pan-European vegetated regions.
In that biome regions, the NPP values between 153 and 550 . Lieth (1975) was
published quite similar NPP value for regions with temperate broadleafed and mixed,
and boreal forests (see Tab. 2 col. 1). The value of NPP ranged from 600 to 2500
for temperate and 200 to 1500 in boreal biomes. Esser (2008) and Chapin et al.
(2011) published similar NPP data to the estimation of NPP by MODIS in temperate
and boreal regions (see Table 2 col. 2 and 5). Compared to considered data in the table,
Del Grosso et al. (2008) and Huston and Wolverton (2009) addressed the minimum
range for NPP in all three biome types (see Table 2 col. 3 and 4).
Figure 1. The spatial distribution of NPP averaged over the period of 2000-2014. The left sub-
figure represents NPP in 4x4 km resolution and the right shows the up-scaled NPP to 25x25 km
spatial resolution

Sakalli: Impacts of climate change on net primary production
- 7 -
APPLIED ECOLOGY AND ENVIRONMENTAL RESEARCH 15(1):1-15. http://www.aloki.hu ● ISSN 1589 1623 (Print) ● ISSN 1785 0037 (Online)
DOI: http://dx.doi.org/10.15666/aeer/1501_001015
2017, ALÖKI Kft., Budapest, Hungary
Table 2. Net Primary Production (in gC·m-2·yr
-1) from different sources for the three main
climate zones in pan-European region. The climate zones include broadleafed and
needleleaf with deciduous and evergreen plant functional types. The sources were
chronological order.
1 2 3 4 5 6 7
Temperate 600-2500 960-1280 400-800 625-779 1550 615-2200 550-1890
Boreal 200-1500 161-348 100-600 190-234 375 155-550 320-630
Mediterrenean 200-1000 ----- 50-600 ------ 1000 310-1030 355-980
Grassland 100-1500 58-1623 50-800 298-641 750-1080 150-1050 260-940
1. Lieth, H., 1975
2. Esser, G., 1998
3. Del Grosso et al., 2008
4. Huston and Wolverton, 2009
5. Chapin et al., 2011
6. MODIS, 2000-2014 this study
7. CLM4.5, 2000-2014 this study
In general, CLM4.5 model predicts the NPP quite similar to the MODIS estimations
in all 3 biome types in pan-European domain (see Table 2 col. 6). We compare the
distribution of 15 years’ average NPP in pan-European domain. In Figs. 2 and 3, we
illustrate the distribution of NPP by MODIS and CLM4.5 in pan-European domain.
Although the NPP by CLM4.5 and MODIS have similar pattern, there is particularly
some differences in temperate broadleafed and mixed forests. In Eastern Europe the
CLM4.5 predicts the NPP in most of the regions over 1000 , however the MODIS
supplies the NPP between 300 and 700 . We plotted spatial distribution of 15 years
(2000-2014) average of all six climate variables in the Fig. 4.
Figure 2. Spatial distribution of 15 years (2000-2014) average predicted by CLM4.5 and
observed by MODIS at pan-European level

Sakalli: Impacts of climate change on net primary production
- 8 -
APPLIED ECOLOGY AND ENVIRONMENTAL RESEARCH 15(1):1-15. http://www.aloki.hu ● ISSN 1589 1623 (Print) ● ISSN 1785 0037 (Online)
DOI: http://dx.doi.org/10.15666/aeer/1501_001015
2017, ALÖKI Kft., Budapest, Hungary
Figure 3. Spatial distribution of the difference between 15 years average of by MODIS
observed and by CLM4.5 predicted NPP at pan-European scale
Figure 4. Distribution of 15 years (2000-2014) average of six climate variables at pan-
European scale

Sakalli: Impacts of climate change on net primary production
- 9 -
APPLIED ECOLOGY AND ENVIRONMENTAL RESEARCH 15(1):1-15. http://www.aloki.hu ● ISSN 1589 1623 (Print) ● ISSN 1785 0037 (Online)
DOI: http://dx.doi.org/10.15666/aeer/1501_001015
2017, ALÖKI Kft., Budapest, Hungary
The multi regression analysis shows no correlation between the NPP and used six
climate parameter at the time range 2000-2014 (see Tab. 3). But, by visual comparison
the climate plots in the regions with high differences in NPP between the model and
obtained satellite data, it’s to see that the differences are mainly due to combination
effect of temperature and precipitation in eastern Europe (see Fig. 2).
Table 3. Multi regression correlation between predicted NPP and six climate variable at
the time range 2000-2014
NPP huss pr rlds rsds sfcWind
huss .270
pr -.044 -.125
rlds .374 .870** -.360
rsds .204 .653** -.562* .863**
sfcWind -.105 -.643** .421 -.740** -.907**
tas .329 .806** -.539* .904** .904** -.733**
**. Correlation is significant at the 0.01 level (2-tailed). *. Correlation is significant at the 0.05 level (2-tailed). N:15
That confirms that the NPP distinctions between the predicted and observed in the 4
regions are mainly depending on climate parameter and not on the parametrization of
NPP for PFTs in the model. It is quite important to mention that the differences between
the modelled and observed NPP does generally not mean that the quality of NPP
modelling has substandard quality. Zhao et al. (2006) published data about uncertainties
in quantifying the GPP (Gross Primary Production) and NPP by MODIS. They
highlighted that the quantifying of NPP includes more uncertainties then GPP by
MODIS. To clarify the origin of differences between CLM4.5 and MODIS, we
validated the NPP products (CLM4.5 and MODIS) with in-situ data of 19 study areas
from Oleksyn et al. (2000). They measured the NPP from Pinus sylvestris in 19 study
areas. We selected the predicted and from satellite obtained NPP values for each study
site. Since a grid cell of CLM4.5 can have several PFTs and P. silvestris is a needleleaf
tree and distributes in temperate and boreal zones, we selected the percentage of two
PFTs (i.e. Needleleaf Evergreen Temperate and Boreal Forests) for each grid cell,
where the in-situ studies were done, and multiplied with the total NPP value of each
25x25 km grid cell. In the Table 4, the study sites, the NPP values from the sources of
Oleksyn et al. (2000), CLM4.5 and MODIS 4x4 km resolution and the total percentage
of the two PFTs are presented. Comparing of the NPP values of in-situ studies with the
results of CLM4.5 and MODIS shows that the CLM4.5 has a better correlation with the
NPP from Oleksyn et al. (2000) than MODIS (see Table 4 col. 2, 5 and 6). The scatter
plot in Fig. 5 presents the correlation between in-situ and CLM4.5 and MODIS with
correlation coefficient R2. The correlation of NPP between CLM4.5 and in-situ studies
equates to 63% and between MODIS and in-situ studies ca. 1%, respectively (see Fig.
5). Certainly, it has to be mentioned that the correlation analysis includes in-situ data
from one plant species in different study areas and climate zones.

Sakalli: Impacts of climate change on net primary production
- 10 -
APPLIED ECOLOGY AND ENVIRONMENTAL RESEARCH 15(1):1-15. http://www.aloki.hu ● ISSN 1589 1623 (Print) ● ISSN 1785 0037 (Online)
DOI: http://dx.doi.org/10.15666/aeer/1501_001015
2017, ALÖKI Kft., Budapest, Hungary
Table 4. In-situ NPP data from 19 study sites that collected from Oleksyn et al. (2000),
predicted NPP for 25x25 km grid resolution and PFT's percentage of each grid according
to the PFT in the study sites, and the observed NPP by MODIS.
NPP (gCm-2yr
-1)
Lat, Lon
Oleksyn et
al. (2000)
CLM4.5
25x25 km PFT (%)
CLM4.5x
PFT
MODIS
4x4 km
53.60, 20.00 820 1222 0.65 794.3 642
53.20, 23.37 740 1172 0.91 1066.52 608
53.00, 13.90 1070 1062 0.43 456.66 711
52.50, 10.50 690 945 0.56 529.2 633
51.60, 20.20 870 1519 0.46 698.74 507
51.10, 17.92 980 1288 0.83 1069.04 530
50.80, 4.43 900 1302 0.78 1015.56 611
49.5,8.5 930 727 0.92 668.84 344
48.8,7.78 580 877 0.69 605.13 804
48.77,17.05 470 1333 0.34 453.22 306
47.30,16.47 940 1207 0.88 1062.16 701
44.1,17.35 220 1300 0.19 247 746
43.2,19.5 100 1456 0.16 232.96 672
40.0,31.17 80 854 0.08 68.32 439
60.25,29.9 260 766 0.51 390.66 413
60.18,15.87 180 626 0.29 181.54 572
59.97,33.50 350 928 0.61 566.08 490
58.83,29.12 410 942 0.56 527.52 477
55.75,26.67 700 1165 0.67 780.55 427
y=0,76x+151,65R²=0,63
y=0,05x+529,22R²=0,01
0
200
400
600
800
1000
1200
0 200 400 600 800 1000 1200
NPP(gC/(m
2.yr)
NPP(gC/(m2.yr)
CLM45 MODIS Linear(CLM45) Linear(MODIS)
Figure 5. Scatter plot for the correlation analysis between in-situ collected NPP data from
Oleksyn et al. (2000) and by CLM4.5 predicted, and by MODIS observed data. The lines show
the linear correlarion.

Sakalli: Impacts of climate change on net primary production
- 11 -
APPLIED ECOLOGY AND ENVIRONMENTAL RESEARCH 15(1):1-15. http://www.aloki.hu ● ISSN 1589 1623 (Print) ● ISSN 1785 0037 (Online)
DOI: http://dx.doi.org/10.15666/aeer/1501_001015
2017, ALÖKI Kft., Budapest, Hungary
This study shows that CLM4.5 model predicts NPP fairly good for 25x25 km spatial
resolution in pan-European scale. In 30 Nov. 2015, United Nations came together in
Paris (France) (United Nations Framework Convention on Climate Change, 21st
Conference of the Parties (COP 21)) to discuss the effect of 2 ºC average global
temperature increase on ecosystems, economies, human health and adjust preferences
for a road map for reducing anthropogenic factors, which caused the temperature
increase globally. In last decade, the meaning of 2 ºC global average temperature has
been increased and its effects on terrestrial biosphere, especially on carbon assimilation
processes, has become increasingly important for all nations. The future climate
predictions show that the 2 ºC average temperature increase in pan-European scale
under consideration the Representative Concentration Pathways 4.5 (RCP4.5) emission
scenario earliest in 2033 and latest 2065 (Kirtman et al., 2013). The RCP4.5 is
consistent with a possible change in future anthropogenic greenhouse gases emissions
(GHG). The RCP4.5 is named after the potential change of radiative forcing value +4.5
in 2100 relative to 1860 (pre-industrial) value (Meinshausen et al., 2011). The GHG
emissions within the RCP4.5 scenario peaks close to 2040, and then stats to decline up
to 2100. We decided to predict the NPP for 30-year period between 2034 and 2063 to
identify the climate change effect on net primary production of the vegetation in pan-
European scale. In the Fig. 6, we show the distribution of 30 years (2034-2063) average
of NPP, the change between 2000-2014 and 2034-2063 and also the trend of NPP
change up to 2100 in pan-European scale.
Figure 6. By CLM4.5 predicted NPP for the future period (2034-2063) (upper left), the
difference between 30 years (1971-2000) average of past period and future period (2034-2063)
(upper right), the percentage of the difference between two periods (bottom left), and the NPP
of the run of the model from 1971 to 2100 (bottom right).

Sakalli: Impacts of climate change on net primary production
- 12 -
APPLIED ECOLOGY AND ENVIRONMENTAL RESEARCH 15(1):1-15. http://www.aloki.hu ● ISSN 1589 1623 (Print) ● ISSN 1785 0037 (Online)
DOI: http://dx.doi.org/10.15666/aeer/1501_001015
2017, ALÖKI Kft., Budapest, Hungary
Generally, NPP shows an increasing up to 30% in pan-European scale during the peak
period of GHG emissions (2034-2063) (see Figs. 6 upper right and bottom left).
However, the future prediction of NPP shows a decreasing in most of the regions in
Germany, Italy and south-east Europe. The model illustrates up to 18% of reduction by
NPP in that regions (see Fig. 6 bottom left). It is quite important to investigate not only
spatial distribution of NPP but also inter-annual variability of NPP. The sub Fig. 6
(bottom right) shows the trend of average NPP variability from 1971 to 2100. NPP has a
distinct increasing trend between 1971-2100. From 1971 to 2100 there is almost 15% an
increase in NPP (see Fig. 6 bottom right).
Conclusion
This study compares predicted NPP by using CLM4.5 model with remotely sensed
NPP in pan-European scale with in-situ measured data. The comparison was done for
25x25 km high resolution gridded data sets. It reveals that there are differences between
modelled and observed NPP in eastern and middle Europe. NPP is either mis-quantified
by MODIS or mis-predicted by CLM4.5. Since we do not have field studies in the
regions, we could not detect the site of the failure in this study. But the high correlation
between by CLM4.5 predicted and observed data in 19 study locations indicates that the
model is most probably able to predict NPP in pan-European scale. According to the
results in past observed period, we assume that the prediction of NPP quite acceptable
for the future period. It shows that NPP will increase ca. 15% in average at pan-
European level. Furthermore, northern and high altitude regions show most response to
climate change with highest increase of NPP in the future period. Although NPP shows
an increasing trend in most of the vegetated areas at pan-European level, NPP will
minimally change in few regions e.g. in Germany, Italy and most of the Balkans.
Acknowledgments. The research has received funding from the European Community Seventh
Framework Program (FP7/2007-2013) under grant agreement Nr. 282746 (IMPACT2C).
REFERENCES
[1] Bonan, G.B. (2008): Forests and climate change: forcings, feedbacks, and the climate
benefits of forests. ‒ Science 320: 1444-1449.
[2] Cao, M., Woodward, F.I. (1998): Net primary and ecosystem production and carbon
stocks of terrestrial ecosystems and their responses to climate change. ‒ Global Change
Biology 4: 185-198.
[3] Chapin, F.S., Matson, P.A., Vitousek, P.M. (2011): Principles of Terrestrial Ecosystem
Ecology, 2nd
Edition, pp. 179. Springer New York, Dordrecht, Heidelberg, London. Doi:
10.1007/978-1-4419-9504-9
[4] Guillem, C., Allen, J.I., Bopp, L., Schrum, C., Holt, J., Tsiaras, K., Zavatarelli, M.,
Chifflet, M., Cannaby, H., Dadou, I., Daewel, U., Wakelin, S. L., Machu, E., Pushpadas,
D., Butenschon, M., Artioli, Y., Petihakis, G., Smith, C., Garçon, V., Goubanova, K., Le
Vu, B., Fach, B. A., Salihoglu, B., Clementi, E., Irigoien, X. Biomass changes and
trophic amplification of plankton in a warmer ocean. ‒ Global Change Biology 20(7):
2124-2139.
[5] Del Grosso, S., Parton, W., Stohlgren, T., Zheng, D., Bachelet, D., Prince, S., Hibbard,
K., Olson, R. (2008): Global potential net primary production predicted from vegetation
class, precipitation, and temperature: Erratum. ‒ Ecology 89(8): 2117-2126.
Sakalli: Impacts of climate change on net primary production
- 13 -
APPLIED ECOLOGY AND ENVIRONMENTAL RESEARCH 15(1):1-15. http://www.aloki.hu ● ISSN 1589 1623 (Print) ● ISSN 1785 0037 (Online)
DOI: http://dx.doi.org/10.15666/aeer/1501_001015
2017, ALÖKI Kft., Budapest, Hungary
[6] Dixon, R.K., Solomon, A.M., Brown, S., Houghton, R.A., Trexier, M.C., Wisniewski, J.
(1994): Carbon pools and flux of global forest ecosystem. ‒ Science 263: 185-190. Doi:
10.1126/science.263.5144.185
[7] Donmez, C., Berberoglu, S., Curran, P.J. (2011): Modelling the current and future
distribution of NPP in a Mediterranean watershed. ‒ International Journal of Applied
Earth Observation and Geoinformation 13(3): 336-345. Doi: 10.1016/j.jag.2010.12.005
[8] Easterling, W.E., Aggarwal, P.K., Batima, P., Brander, K.M., Erda, L., Howden, S.M.,
Kirilenko, A., Morton, J., Soussana, J.F., Schmidhuber J., Tubiello, F.N. (2007): Food,
fibre and forest products. ‒ In: Parry, M.L., Canziani, O.F., Palutikof, J.P., van der
Linden, P.J., Hanson, C.E. (Eds.) Climate Change 2007: Impacts, Adaptation and
Vulnerability. Contribution of Working Group II to the Fourth Assessment Report of the
Intergovernmental Panel on Climate Change, Cambridge University Press, Cambridge,
UK, 273-313.
[9] Esser, G. (1998): NPP Multi-Biome: Global Osnabruck Data, 1937-1981. Data set.
Available on-line [http://daac.ornl.gov] from Oak Ridge National Laboratory Distributed
Active Archive Center, Oak Ridge, Tennessee, U.S.A. doi:10.3334/ORNLDAAC/214
[10] Esser, G., Kattge, J., Sakalli, A. (2012): Feedback of carbon and nitrogen cycles enhances
carbon sequestration in the terrestrial biosphere. ‒ Global Change Biology 17(2): 819-
842. doi:10.1111/j.1365-2486.2010.02261.x.
[11] Huston, M.A., Wolverton, S. (2009): The global distribution of net primary production:
resolving the paradox. ‒ Ecological Monographs 79(3): 343-377. Doi: 10.1890/08-0588.1
[12] Kauppi, P.E., Mielikainen, K., Kuusela, K. (1992): Biomass and carbon budget of
European forests, 1971-1990. ‒ Science 256(5053): 70-4.
[13] Kirschbaum, M.U.F. (2000): Forest growth and species distribution in a changing
climate. ‒ Tree Physiology 20: 309-322
[14] Kirtman, B., Power, S.B., Adedoyin, J.A., Boer, G.J., Bojariu, R., Camilloni, I., Doblas-
Reyes, F.J., Fiore, A.M., Kimoto, M., Meehl, G.A., Prather, M., Sarr, A., Schär, C.,
Sutton, R., van Oldenborgh, G.J., Vecchi G., Wang, H.J. (2013): Near-term Climate
Change: Projections and Predictability. ‒ In: Stocker, T.F., D. Qin, G.-K. Plattner, M.
Tignor, S.K. Allen, J. Boschung, A. Nauels, Y. Xia, V. Bex and P.M. Midgley (eds.)
Climate Change 2013: The Physical Science Basis. Contribution of Working Group I to
the Fifth Assessment Report of the Intergovernmental Panel on Climate Change.
Cambridge University Press, Cambridge, United Kingdom and New York, NY, USA
[15] Koven, C.D., Riley, W.J., Subin, Z.M., Tang, J.Y., Torn, M.S., Collins, W.D., Bonan,
G.B., Lawrance, D.M., Swenson, S.C. (2013): The effect of vertically resolved soil
biogeochemistry and alternate soil C and N models on C dynamics of CLM4. ‒
Biogeosciences 10: 7109-7131. Doi: 10.5194/bg-10-7109-2013
[16] Lawrence, P.J., Chase, T.N. (2007): Representing a MODIS consistent land surface in the
Community Land Model (CLM 3.0). ‒ Journal of Geophysical Research 112(G01023): 1-
17. Doi: 10.1029/2006JG000168
[17] Lieth, H. (1975): Primary production of the major vegetation units of the world. ‒ In:
(Lieth, H., Whittaker, R.H. (eds.) Primary Productivity of the Biosphere. Ecological
Studies 14. Springer-Verlag, New York and Berlin. pp. 203-215.
[18] Liu, J., Chen, J.M., Cihlar, J., Park, W.M. (1997): A process based boreal ecosystem
productivity simulator using remote sensing inputs. ‒ Remote Sensing of Environment
62(2): 158-175. Doi: 10.1016/S0034-4257(97)00089-8
[19] Maselli, F., Marii, R., Chiesi, M. (2013): Use of lidar data to simulate forest net primary
production. ‒ International Journal of Remote Sensing 34(7): 2487-2501. Doi:
10.1080/01431161.2012.745019
[20] Meinshausen, M., Smith, S.J., Calvin, K., Daniel, J.S., Kaunuma, M.L.T., Lamarque, J-
F., Matsumoto K. et al. (2011): The RCP greenhouse gas concentrations and their
extensions from 1765 to 2300. ‒ Climatic Change 109: 213-241. DOI: 10.1007/s10584-
011-0156-z

Sakalli: Impacts of climate change on net primary production
- 14 -
APPLIED ECOLOGY AND ENVIRONMENTAL RESEARCH 15(1):1-15. http://www.aloki.hu ● ISSN 1589 1623 (Print) ● ISSN 1785 0037 (Online)
DOI: http://dx.doi.org/10.15666/aeer/1501_001015
2017, ALÖKI Kft., Budapest, Hungary
[21] Melillo, J.M., McGuire, A.D., Kicklighter, D.W., III Moore, B., Vorosmarty, C.J.,
Schloss, A.L. (1993): Global climate change and terrestrial net primary production. ‒
Nature 363: 234-240.
[22] Oleksyn, J., Reich, P.B., Rachwal, L., Tjoelker, M.G. (2000): Variation in aboveground
net primary production of diverse European Pinus sylvestris populations. ‒ Trees
Structure and Function 14(7): 415-421.
[23] Olson, D.M., Dinerstein, E., Wikramanayake, D.E., Burgess, N.D., Powell, G.V.N.,
Underwood, E.C., D’Amico, J.A. et al. (2001): Terrestrial Ecoregions of the World: A
New Map of Life on Earth. ‒ BioScience 51(11): 933–938.
[24] Pachavo, G., Murwira, A. (2014): Remote sensing net primary productivity (NPP)
estimation with the aid of GIS modelled shortwave radiation (SWR) in a Southern
African Savanna. ‒ International Journal of Applied Earth Observation and
Geoinformation 30: 217-226. Doi: 10.1016/j.jag.2014.02.007
[25] Pan Y., Birdsay, R., Hom, J., McCullough, K., Clark, K. (2006): Improved estimates of
net primary productivity from MODIS satellite data at regional and local scales. ‒
Ecological Applications 16(1): 125-132. Doi: 10.1890/05-0247
[26] Prieto-Blanco A, North, P.R.J, Barnsley, M.J, Fox, N. (2009): Satellite-driven modelling
of Net Primary Production (NPP): Theoretical analysis. ‒ Remote Sensing of
Environment 113: 137-147. Doi: 10.1016/j.rse.2008.09.002
[27] Running, S., Mu, Q., Zhao, M. (2015): MOD17A3H MODIS/Terra Net Primary
Production Yearly L4 Global 500m SIN Grid V006. NASA EOSDIS Land Processes
DAAC. http://doi.org/10.5067/MODIS/MOD17A3H.006
[28] Schmithüsen, J. (1976): Atlas zur Biogeographie. Meyer, Mannheim, Germany. ISBN: 3-
411-00303-0
[29] Schulzweida, U. (2015): Climate Data Operators (CDO) version 1.7 User’s Guide.
Available at https://code.zmaw.de/projects/cdo/embedded/cdo.pdf
[30] Thomey, M.L., Collins, S.L., Vargas, R., Johnson, J.E., Brown, R.F., Natwig, D.O.,
Friggens, M.T. (2011): Effect of precipitation variability on net primary production and
soil respiration in a Chihuahuan desert grassland. ‒ Global Change Biology 17: 1505-
1515. Doi: 10.1111/j.1365-2486.2010.02363.x
[31] Turner, D.P., Ollinger, S., Smith, M.-I., Krankina, O., Gregory, M. (2004): Scaling net
primary production to a MODIS footprint in support of Earth observing system product
validation. ‒ International Journal of Remote Sensing 25(10): 1961-1979. Doi:
10.1080/0143116031000150013
[32] Turner, D.P., Ritts, W.D., Cohen, W.B., Gower, S.T., Running, S.W., Zhao, M., Costa,
M.H., Kirschbaum, A.A., Ham, J.M., Saleska, S.R., Ahl, D.E. (2006): Evaluation of
MODIS NPP and GPP products across multiple biomes. ‒ Remote Sensing of
Environment 102(3-4): 282-292. Doi: 10.1016/j.rse.2006.02.017
[33] Ummenhofer, C.C., Xu, H., Twine, T.E., Girvetz, E.H., McCarthy, H.R., Chhetri, N.,
Nicholas, K.A. (2015): How climate change affects extremes in maize and wheat yield in
two cropping regions. ‒ Journal of Climate 28: 4653-4687. Doi: 10.1175/JCLI-D-13-
00326.1
[34] Wan, S., Hui, D., Wallace, L., Luo, Y. (2005): Direct and indirect effects of experimental
warming on ecosystem carbon processes in a tallgrass prairie. ‒ Global Biogeochemical
Cycles 19(GB2014): 1-13. Doi: 10.1029/2004GB002315
[35] Wang, C. (2016): A remote sensing perspective of alpine grasslands on the Tibetan
Plateau: Better or worse under “Tibet Warming”?. ‒ Remote Sensing Applications:
Society and Environment 3: 36-44. Doi: 10.1016/j.rsase.2015.12.002
[36] Zhao, M., Heinsch, F.A., Nemani, R.R., Running, S.W. (2005): Improvements of the
MODIS terrestrial gross and net primary production global data set. ‒ Remote Sensing of
Environment 95(2): 164-176. Doi: 10.1016/j.rse.2004.12.011

Sakalli: Impacts of climate change on net primary production
- 15 -
APPLIED ECOLOGY AND ENVIRONMENTAL RESEARCH 15(1):1-15. http://www.aloki.hu ● ISSN 1589 1623 (Print) ● ISSN 1785 0037 (Online)
DOI: http://dx.doi.org/10.15666/aeer/1501_001015
2017, ALÖKI Kft., Budapest, Hungary
[37] Zhao, M., Running, S.W., Nemani, R.R. (2006). Sensitivity of Moderate Resolution
Imaging Spectroradiometer (MODIS) terrestrial primary production to the accuracy of
meteorological reanalyses. ‒ Journal of Geophysical Research 111(G01002): 1-13.
[38] Zhao, M., Running, S.W. (2010): Drought-Induced reduction in global terrestrial net
primary production from 2000 through 2009. ‒ Science 329 (5994): 940-943. Doi:
10.1126/science.1192666


