U.S. Department of the InteriorU.S. Geological Survey
Scientific Investigations Report 2009–5197
In cooperation with the Illinois Center for Transportation, Illinois Department of Transportation, and the Illinois Department of Natural Resources—Office of Water Resources
Implementation and Evaluation of the Streamflow Statistics (StreamStats) Web Application for Computing Basin Characteristics and Flood Peaks in Illinois

Implementation and Evaluation of the Streamflow Statistics (StreamStats) Web Application for Computing Basin Characteristics and Flood Peaks in Illinois
By Audrey L. Ishii, David T. Soong, and Jennifer B. Sharpe
Scientific Investigations Report 2009–5197
U.S. Department of the InteriorU.S. Geological Survey
In cooperation with the Illinois Center for Transportation, Illinois Department of Transportation, and the Illinois Department of Natural Resources—Office of Water Resources
U.S. Department of the InteriorKEN SALAZAR, Secretary
U.S. Geological SurveyMarcia K. McNutt, Director
U.S. Geological Survey, Reston, Virginia: 2010
For more information on the USGS—the Federal source for science about the Earth, its natural and living resources, natural hazards, and the environment, visit http://www.usgs.gov or call 1-888-ASK-USGS
For an overview of USGS information products, including maps, imagery, and publications, visit http://www.usgs.gov/pubprod
To order this and other USGS information products, visit http://store.usgs.gov
Any use of trade, product, or firm names is for descriptive purposes only and does not imply endorsement by the U.S. Government.
Although this report is in the public domain, permission must be secured from the individual copyright owners to reproduce any copyrighted materials contained within this report.
Suggested citation:Ishii, A.L., Soong, D.T., and Sharpe, J.B., 2010, Implementation and evaluation of the Streamflow Statistics (Stream-Stats) Web application for computing basin characteristics and flood peaks in Illinois: U.S. Geological Survey Scien-tific Investigations Report 2009–5197, 25 p.
Also published as:Ishii, A.L., Soong, D.T., and Sharpe, J.B., 2010, Implementation and evaluation of the Streamflow Statistics (Stream-Stats) Web application for computing basin characteristics and flood peaks in Illinois: Illinois Center for Transportation Report FHWA-ICT-10-63, 39 p.
iii
Technical Report Documentation Page
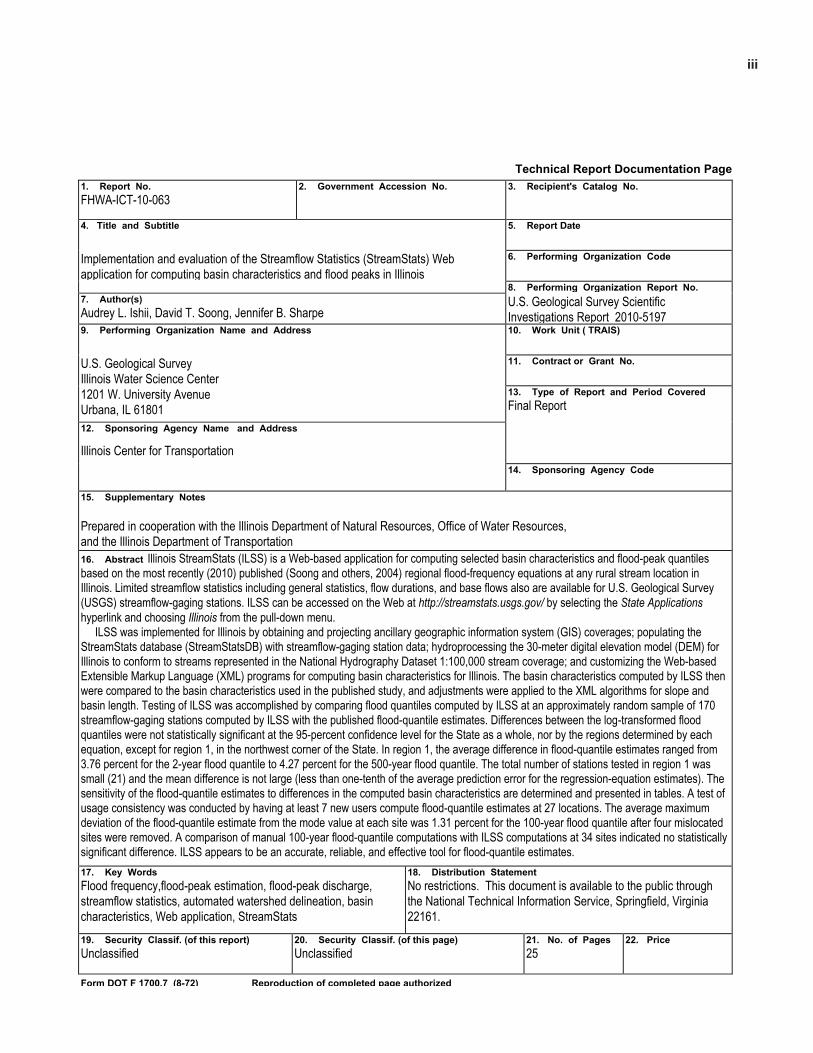
1. Report No. FHWA-ICT-10-063
2. Government Accession No. 3. Recipient's Catalog No.
4. Title and Subtitle 5. Report Date
Implementation and evaluation of the Streamflow Statistics (StreamStats) Web application for computing basin characteristics and flood peaks in Illinois
6. Performing Organization Code
8. Performing Organization Report No. 7. Author(s) Audrey L. Ishii, David T. Soong, Jennifer B. Sharpe
U.S. Geological Survey Scientific Investigations Report 2010-5197 9. Performing Organization Name and Address 10. Work Unit ( TRAIS)
U.S. Geological Survey Illinois Water Science Center
11. Contract or Grant No.
1201 W. University Avenue Urbana, IL 61801
13. Type of Report and Period Covered
Final Report
12. Sponsoring Agency Name and Address
Illinois Center for Transportation
14. Sponsoring Agency Code
15. Supplementary Notes
Prepared in cooperation with the Illinois Department of Natural Resources, Office of Water Resources, and the Illinois Department of Transportation 16. Abstract Illinois StreamStats (ILSS) is a Web-based application for computing selected basin characteristics and flood-peak quantiles based on the most recently (2010) published (Soong and others, 2004) regional flood-frequency equations at any rural stream location in Illinois. Limited streamflow statistics including general statistics, flow durations, and base flows also are available for U.S. Geological Survey (USGS) streamflow-gaging stations. ILSS can be accessed on the Web at http://streamstats.usgs.gov/ by selecting the State Applications hyperlink and choosing Illinois from the pull-down menu. ILSS was implemented for Illinois by obtaining and projecting ancillary geographic information system (GIS) coverages; populating the StreamStats database (StreamStatsDB) with streamflow-gaging station data; hydroprocessing the 30-meter digital elevation model (DEM) for Illinois to conform to streams represented in the National Hydrography Dataset 1:100,000 stream coverage; and customizing the Web-based Extensible Markup Language (XML) programs for computing basin characteristics for Illinois. The basin characteristics computed by ILSS then were compared to the basin characteristics used in the published study, and adjustments were applied to the XML algorithms for slope and basin length. Testing of ILSS was accomplished by comparing flood quantiles computed by ILSS at an approximately random sample of 170 streamflow-gaging stations computed by ILSS with the published flood-quantile estimates. Differences between the log-transformed flood quantiles were not statistically significant at the 95-percent confidence level for the State as a whole, nor by the regions determined by each equation, except for region 1, in the northwest corner of the State. In region 1, the average difference in flood-quantile estimates ranged from 3.76 percent for the 2-year flood quantile to 4.27 percent for the 500-year flood quantile. The total number of stations tested in region 1 was small (21) and the mean difference is not large (less than one-tenth of the average prediction error for the regression-equation estimates). The sensitivity of the flood-quantile estimates to differences in the computed basin characteristics are determined and presented in tables. A test of usage consistency was conducted by having at least 7 new users compute flood-quantile estimates at 27 locations. The average maximum deviation of the flood-quantile estimate from the mode value at each site was 1.31 percent for the 100-year flood quantile after four mislocated sites were removed. A comparison of manual 100-year flood-quantile computations with ILSS computations at 34 sites indicated no statistically significant difference. ILSS appears to be an accurate, reliable, and effective tool for flood-quantile estimates. 17. Key Words
Flood frequency,flood-peak estimation, flood-peak discharge, streamflow statistics, automated watershed delineation, basin characteristics, Web application, StreamStats
18. Distribution Statement No restrictions. This document is available to the public through the National Technical Information Service, Springfield, Virginia 22161.
19. Security Classif. (of this report) Unclassified
20. Security Classif. (of this page) Unclassified
21. No. of Pages
25
22. Price
Form DOT F 1700.7 (8-72) Reproduction of completed page authorized

iv

v
Contents
Abstract ..........................................................................................................................................................1Introduction.....................................................................................................................................................1Implementing Illinois StreamStats (ILSS) ..................................................................................................2
Data Preparation ...................................................................................................................................2Computer Code Development .............................................................................................................3Illinois StreamStats Database ............................................................................................................3
Evaluation and Adjustment of Basin Characteristics .............................................................................5Drainage Basin Area, Percent Water, Average Soil Permeability................................................5Basin Length ..........................................................................................................................................6Stream Slope .......................................................................................................................................10
Evaluation of Flood-Peak Quantiles ..........................................................................................................12Test of Illinois StreamStats Usage Consistency .....................................................................................17Sensitivity of Flood-Peak Quantiles ..........................................................................................................18Conclusions and Limitations ......................................................................................................................23Summary........................................................................................................................................................24Acknowledgments .......................................................................................................................................25References Cited..........................................................................................................................................25
Figures 1. Map showing hydrologic regions for flood-frequency regression equations of
rural streams in Illinois (Soong and others, 2004) ...................................................................4 2–13. Graphs showing— 2. Relation between Illinois StreamStats and published drainage areas—
logarithmically scaled axes ........................................................................................................7 3. Relation between Illinois StreamStats and published drainage areas—
arithmetically scaled axes ..........................................................................................................7 4–6. Relation between percent differences in published and Illinois StreamStats (ILSS)
values of drainage areas and published drainage areas: 4. Full scale ...............................................................................................................................8 5. Scale truncated to 100 square miles ................................................................................8 6. Scale truncated to 10 square miles ..................................................................................9 7. Relation between Illinois StreamStats basin length using 100-meter grid and the
published BasinSoft basin length ..............................................................................................9 8. Relation between Illinois StreamStats and published BasinSoft slope ............................10 9. Relation between adjusted slope residual (published BasinSoft-computed
stream slope (BS_SL) minus adjusted slope (SLadj), expressed as a percent [(BS_SL-SLadj)*100/BS_SL]), and published drainage area ...............................................11
10. Relation between adjusted slope residual (published BasinSoft-computed stream slope (BS_SL) minus adjusted slope (SLadj), expressed as a percent [(BS_SL-SLadj)*100/BS_SL]), and BasinSoft slope ..............................................................11

vi
11. Relation between StreamStats and Soong and others (2004) 100-year flood quantiles .......................................................................................................................................17
12. Relation between Illinois StreamStats (ILSS) and manually determined 100-year flood quantiles .............................................................................................................................18
13. Distribution of differences in basin characteristics between the published basin characteristics (2004_BC) and the Illinois StreamStats basin characteristics (ILSS_BC) for (a) drainage area, (b) average permeability, (c) percentage of open water and herbaceous wetland, (d) slope, and (e) basin length ........................................19
Tables 1. Differences between the published basin characteristics and the Illinois
StreamStats (ILSS) basin characteristics (published value minus ILSS value) ................6 2. Comparisons of published QT
2004 and Illinois StreamStats (ILSS) QTILSS flood
quantiles as proportional differences—([QT2004 – QT
ILSS] / QT2004) and differences
of the log-transformed quantiles (log [QT2004] – log [QT
ILSS])—for selected streamflow-gaging stations, all regions .................................................................................13
3–9. Comparisons of published QT2004 and Illinois StreamStats (ILSS) QT
ILSS flood quantiles as proportional differences—([QT
2004 – QTILSS] / QT
2004) and differences of the log-transformed quantiles (log [QT
2004] – log [QTILSS])—for streamflow-gaging
stations, sorted by region: 3. Region 1 ...............................................................................................................................13 4. Region 2 ...............................................................................................................................14 5. Region 3 ...............................................................................................................................14 6. Region 4 ...............................................................................................................................15 7. Region 5 ...............................................................................................................................15 8. Region 6 ...............................................................................................................................16 9. Region 7 ...............................................................................................................................16 10–14. Sensitivity of flood quantiles based on the published regression equations for
specified return-intervals, QT, to differences in drainage area for (a) regions 1, 3, and 5; (b) regions 2, 6, and 7; and (c) region 4, expressed as the ratio of the tested QT to the published QT , corresponding to percent of published—
10. Drainage area .....................................................................................................................20 11. Stream slope .......................................................................................................................21 12. Average permeability ........................................................................................................22 13. %Water. ...............................................................................................................................22 14. Basin length. .......................................................................................................................23

vii
Conversion Factors
Multiply By To obtain
Lengthinch (in.) 25.4 millimeter (mm)foot (ft) 0.3048 meter (m)mile (mi) 1.609 kilometer (km)meter (m) 3.281 foot (ft)
Areasquare foot (ft2) 0.09290 square meter (m2)square mile (mi2) 2.590 square kilometer (km2)acre 0.4047 square hectometer
Flow ratecubic foot per second (ft3/s) 0.02832 cubic meter per second
Slopefoot per mile (ft/mi) 0.1894 meter per kilometer
viii
Abbreviations, Acronyms, and Symbols
BCF basincharacteristicfile
BL basin length
BS BasinSoft
DA drainage area
DEM digital elevation model
DRGs digital raster graphics
ESRI Environmental Systems Research Institute, Inc.
GIS geographic information system
ICT Illinois Center for Transportation
IDNR–OWR IllinoisDepartmentofNaturalResources–OfficeofWaterResources
IDOT Illinois Department of Transportation–Bureau of Bridges and Structures
ILSS Illinois StreamStats
LFP longestflowpath
MCL main channel length
NED National Elevation Dataset
NHD National Hydrography Dataset
NLCD National Land Cover Data
NRCS Natural Resources Conservation Service
PermAvg average soil permeability
σ standarddeviation
SL slope
StreamStatsDB StreamStats database
USGS U.S. Geological Survey
USGS–ILWSC USGS–IllinoisWaterScienceCenter
%Water percentageofopenwaterandherbaceouswetland
WATSTORE WaterStorageRetrievalsystem
WBD WatershedBoundaryDataset
WDNR WisconsinDepartmentofNaturalResources
WSRT WilcoxonSignedRankTest
XML extensiblemarkuplanguage
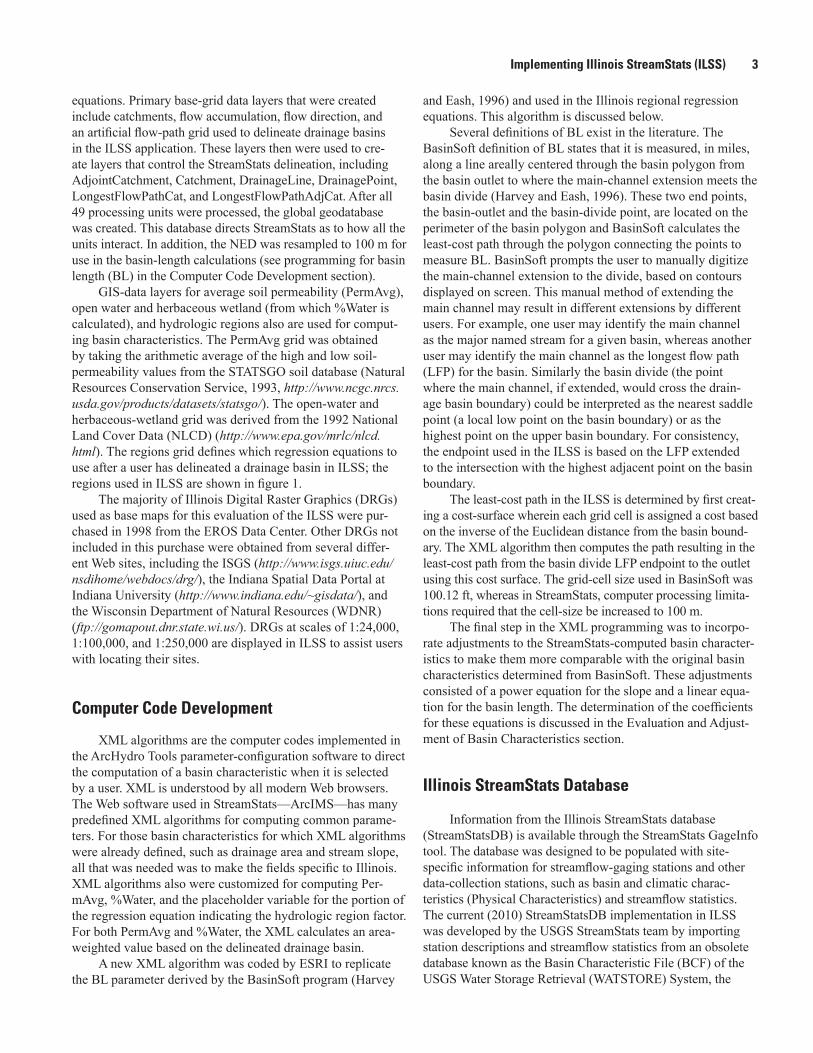
Implementation and Evaluation of the Streamflow Statistics (StreamStats) Web Application for Computing Basin Characteristics and Flood Peaks in Illinois
By Audrey L. Ishii, David T. Soong, and Jennifer B. Sharpe
Abstract IllinoisStreamStats(ILSS)isaWeb-basedapplication
forcomputingselectedbasincharacteristicsandflood-peakquantiles based on the most recently (2010) published (Soong andothers,2004)regionalflood-frequencyequationsatanyruralstreamlocationinIllinois.Limitedstreamflowstatisticsincludinggeneralstatistics,flowdurations,andbaseflowsalsoareavailableforU.S.GeologicalSurvey(USGS)streamflow-gagingstations.ILSScanbeaccessedontheWebathttp://streamstats.usgs.gov/ by selecting the State Applications hyperlinkandchoosingIllinoisfromthepull-downmenu.
ILSSwasimplementedforIllinoisbyobtainingandprojecting ancillary geographic information system (GIS) coverages;populatingtheStreamStatsdatabasewithstream-flow-gagingstationdata;hydroprocessingthe30-meterdigitalelevation model (DEM) for Illinois to conform to streams represented in the National Hydrographic Dataset 1:100,000 streamcoverage;andcustomizingtheWeb-basedExtensibleMarkup Language (XML) programs for computing basin char-acteristics for Illinois. The basin characteristics computed by ILSSthenwerecomparedtothebasincharacteristicsusedinthepublishedstudy,andadjustmentswereappliedtotheXMLalgorithmsforslopeandbasinlength.TestingofILSSwasaccomplishedbycomparingfloodquantilescomputedbyILSSatanapproximatelyrandomsampleof170streamflow-gagingstationscomputedbyILSSwiththepublishedfloodquantileestimates.Differencesbetweenthelog-transformedfloodquantileswerenotstatisticallysignificantatthe95-percentconfidencelevelfortheStateasawhole,norbytheregionsdeterminedbyeachequation,exceptforregion1,inthenorthwestcorneroftheState.Inregion1,theaveragediffer-enceinfloodquantileestimatesrangedfrom3.76percentforthe2-yearfloodquantileto4.27percentforthe500-yearfloodquantile.Thetotalnumberofstationsinregion1wassmall(21)andthemeandifferenceisnotlarge(lessthanone-tenthoftheaveragepredictionerrorfortheregression-equationestimates).Thesensitivityoftheflood-quantileestimatestodifferences in the computed basin characteristics are deter-mined and presented in tables. A test of usage consistency
wasconductedbyhavingatleast7newuserscomputefloodquantileestimatesat27locations.Theaveragemaximumdeviation of the estimate from the mode value at each site was1.31percentafterfourmislocatedsiteswereremoved.Acomparisonofmanual100-yearflood-quantilecomputationswithILSSat34sitesindicatednostatisticallysignificantdif-ference. ILSS appears to be an accurate, reliable, and effective toolforflood-quantileestimates.
IntroductionStreamflowstatisticssuchaspeak-dischargeestimatesfor
floodsofvariousfrequencies(floodquantiles)areusedwidelyinengineeringandscientificapplicationssuchasdeterminingfloodplains,designinghydraulicstructuressuchasbridgesand culverts, and the planning and management of the State’s waterresourcestoprotectwaterqualityandsupply.Whilerepresentativestreamflowrecordsareessentialforderivingreliableflowstatistics,streamflowrecordsaresite-specificinformation,whereastheneedforsuchinformationisregion-wide.TheU.S.GeologicalSurvey(USGS)hasdevelopedregional regression equations for estimating statistical stream-flowcharacteristicsatungagedsites,whichareusedtotransfersite-basedinformation,suchasstreamflowstatistics,tothosesites.Theequationsweredevelopedbyuseofregression- analysistechniquestorelatestreamflowcharacteristicstobasincharacteristics,whichcanbedeterminedthroughavariety of methods (Jennings and others, 1994). To apply the regional regression equations, the user must determine the samebasincharacteristicsforungagedsitesthatweredeter-mined for gaged sites and used in the regional regression equations. These characteristics are determined by a variety of methods such as the manual or digital measurement of maps; fromfieldsurveys;frompaperrecords;orbyothermethods,suchasgeographicinformationsystem(GIS)software.Suchstepsaretime-consumingorrequireconsiderableuserexper-tise, and the results can be inconsistent. A single, integrated application that provides an automated determination of the needed basin characteristics and solves the regional regression

2 Implementation and Evaluation of the Streamflow Statistics (StreamStats) Web Application for Illinois
equationstoprovidetheestimatedfloodquantilescanreducethe time required and the potential inconsistencies in the results.Tomeetthisneed,theUSGS,incooperationwiththeEnvironmental Systems Research Institute (ESRI), Inc., has developedStreamStats,anationalWeb-basedGISapplicationthatservesstreamflowstatisticsanddeterminesbasincharac-teristicsandfloodquantilesbasedonconsistentlyprocesseddatasetsandmethodsinutilizingtheflood-frequencyregionalregression equations (Ries and others, 2008).
TheUSGS–IllinoisWaterScienceCenter(USGS–ILWSC)usedbasincharacteristicsthatwerederivedfromGISdatalayersandfromtheapplicationofanArcINFO-basedprogram, BasinSoft (version 1.1, Harvey and Eash, 1996), to determine the current (2010) regional regression equations forestimatesoffloodquantilesforruralstreamsinIllinois.The regional analysis included the investigation of functional relationswithmorenumerous,consistentlydeterminedbasincharacteristicsthanwaspossibleinearlierinvestigations(Soongandothers,2004).However,theuseofGIS-baseddataandmethodsalsocreateddifficultiesforuserswhodonothave the resources to access the GIS databases and (or) soft-warefordeterminingtheseselectedbasincharacteristics.Theavailability of StreamStats provided the opportunity to satisfy thepublicneedfortheutilizationofGIStechniqueswithoutextensivesoftwareoruserexpertise;consequently,theUSGS–ILWSC,incooperationwiththeIllinoisCenterforTransporta-tion (ICT); the Illinois Department of Transportation–Bureau of Bridges and Structures (IDOT); and the Illinois Department ofNaturalResources–OfficeofWaterResources(IDNR–OWR),conductedthisstudytoimplementandevaluatetheStreamStats application for determining basin characteristics andflood-peakquantilesforruralstreamsinIllinois.
The purpose of this report is to describe the procedures used to develop Illinois StreamStats (ILSS) and the analy-ses performed to evaluate ILSS and present the results. This includesthepreparationoftheGIS-datalayersandWeb-basedExtensibleMarkupLanguage(XML)programming,thedevel-opmentofthestreamflow-statisticsdatabase,theevaluationand adjustment of the basin characteristics determined from ILSS,andtheevaluationoftheflood-peakquantilesfromILSS. The limitations of the application and the sensitivity to basin characteristics differences also are described.
Implementing Illinois StreamStats (ILSS)
StreamStatsisaUSGSWeb-basedapplicationthatmakestheprocessofcomputingstreamflowstatisticsfasterandmoreconsistent than previously used manual methods. StreamStats canbeaccessedontheWebathttp://streamstats.usgs.gov/. StreamStatsincludesfivemajorcomponents:(1)theuserinter-face,whichdisplaysthemapsandenablesuserstoselectthestreamlocationsforwhichinformationisdesired;(2)thedata-base,whichcontainspreviouslypublishedstreamflowstatistics
andotherdescriptiveinformationforstreamflow-gagingstations;(3)theautomatedGISprocesses,whichdeterminethedrainageboundariesandotherdrainage-basincharacteristicsbyutilizing the underlying preprocessed GIS database; (4) the GIS database,whichstoresthebase-mapdata;and(5)theimple-mentationoftheNationalStreamflowStatisticsprogram(Ries,2006),whichusestheregionalregressionequationsalongwiththebasin-characteristicsinputtocomputeandoutputthevari-ousstreamflowstatisticstotheuserdisplay.
The implementation of ILSS required the collection and processingofbaseGIS-datalayersforconsistencyinprojec-tion, hydroprocessing of the digital elevation model (DEM), development of ancillary data layers, programming algorithms for computing selected basin characteristics, comparing ILSS results—bothbasincharacteristicsandflood-peakquantiles—withthoseobtainedinthe2004analysis,andprovidingadjust-mentswhererequired.
Data Preparation
ProcessingofthreeprimaryGIS-datalayerswasneededto produce the ILSS data layers. In the present study, the 1:100,000-scaleUSGSNationalHydrographyDataset(NHD)(http://nhd.usgs.gov/)wasusedtodevelopadendriticstreamnetwork.Thisprocessinginvolvedtheremovalofbraidedstreams and reconnecting or removing disconnected stream segments. All elevation information used in ILSS, including flowdirectionandflowaccumulation,wasderivedfromtheUSGS1-arc-secondNationalElevationDataset(NED).The1-arc-secondNEDisanationalseamlessDEMwitharesolu-tion of 30 m (http://seamless.usgs.gov/viewer.htm).Thedown-loadedNEDblocksweremergedandreprojectedtotheAlbersEqual-AreaConicprojection.Aftertileedgeswereexaminedtomakesureelevationvalueswereconsistent,theNEDwasresampledtoa10-mresolutiongridfortheILSSproject.Ahydro-correctedDEMwasdevelopedfromtheNED.ThiswasdonebyfirstfillingdepressionsorsinksintheNED(areassur-roundedbyareasofhigherelevationvalues).Next,theNHDstreamswere“burned”intotheNEDtocreatewell-definedflowpathsthroughtheelevationdata.The“burning”processinvolvesartificiallyreducingtheelevationofDEMcellsthatareco-locatedwiththeNHDstreamlines.Theprocessingwasdonebythe8-digitHydrologicUnitCodewatershed.Thesedatalayers,alongwiththeNaturalResourcesConservationService(NRCS)WatershedBoundaryDataset(WBD)(http://www.ncgc.nrcs.usda.gov/products/datasets/watershed/),wereprocessed through the ESRI ArcHydro Tools (ESRI, Inc., 2005) interface to produce all the data layers used in ILSS.
Using ArcHydro Tools, Version 1.1—a set of utilities developed to operate in the ArcGIS environment (http://www.crwr.utexas.edu/gis/gishydro06/ArcHydro/ArcHydroTools/Doc/Arc%20Hydro%20Tools%20-%20Overview.pdf)—49 processingunits,basedontheWBD8-digithydrologicunits,werecreatedandadditionaldatalayersweregeneratedforeachprocessingunit.TheselayersweredevelopedtocalculatebasincharacteristicsusedintheIllinoisflood-peakregional
Implementing Illinois StreamStats (ILSS) 3
equations.Primarybase-griddatalayersthatwerecreatedincludecatchments,flowaccumulation,flowdirection,andanartificialflow-pathgridusedtodelineatedrainagebasinsintheILSSapplication.Theselayersthenwereusedtocre-ate layers that control the StreamStats delineation, including AdjointCatchment, Catchment, DrainageLine, DrainagePoint, LongestFlowPathCat,andLongestFlowPathAdjCat.Afterall49processingunitswereprocessed,theglobalgeodatabasewascreated.ThisdatabasedirectsStreamStatsastohowalltheunitsinteract.Inaddition,theNEDwasresampledto100mforuseinthebasin-lengthcalculations(seeprogrammingforbasinlength (BL) in the Computer Code Development section).
GIS-datalayersforaveragesoilpermeability(PermAvg),openwaterandherbaceouswetland(fromwhich%Wateriscalculated), and hydrologic regions also are used for comput-ingbasincharacteristics.ThePermAvggridwasobtainedbytakingthearithmeticaverageofthehighandlowsoil-permeability values from the STATSGO soil database (Natural Resources Conservation Service, 1993, http://www.ncgc.nrcs.usda.gov/products/datasets/statsgo/).Theopen-waterandherbaceous-wetlandgridwasderivedfromthe1992NationalLand Cover Data (NLCD) (http://www.epa.gov/mrlc/nlcd.html).Theregionsgriddefineswhichregressionequationstouse after a user has delineated a drainage basin in ILSS; the regionsusedinILSSareshowninfigure1.
The majority of Illinois Digital Raster Graphics (DRGs) usedasbasemapsforthisevaluationoftheILSSwerepur-chased in 1998 from the EROS Data Center. Other DRGs not includedinthispurchasewereobtainedfromseveraldiffer-entWebsites,includingtheISGS(http://www.isgs.uiuc.edu/nsdihome/webdocs/drg/), the Indiana Spatial Data Portal at Indiana University (http://www.indiana.edu/~gisdata/), and theWisconsinDepartmentofNaturalResources(WDNR)(ftp://gomapout.dnr.state.wi.us/). DRGs at scales of 1:24,000, 1:100,000, and 1:250,000 are displayed in ILSS to assist users withlocatingtheirsites.
Computer Code Development
XML algorithms are the computer codes implemented in theArcHydroToolsparameter-configurationsoftwaretodirectthecomputationofabasincharacteristicwhenitisselectedbyauser.XMLisunderstoodbyallmodernWebbrowsers.TheWebsoftwareusedinStreamStats—ArcIMS—hasmanypredefinedXMLalgorithmsforcomputingcommonparame-ters.ForthosebasincharacteristicsforwhichXMLalgorithmswerealreadydefined,suchasdrainageareaandstreamslope,allthatwasneededwastomakethefieldsspecifictoIllinois.XMLalgorithmsalsowerecustomizedforcomputingPer-mAvg,%Water,andtheplaceholdervariablefortheportionofthe regression equation indicating the hydrologic region factor. ForbothPermAvgand%Water,theXMLcalculatesanarea-weightedvaluebasedonthedelineateddrainagebasin.
AnewXMLalgorithmwascodedbyESRItoreplicatethe BL parameter derived by the BasinSoft program (Harvey
and Eash, 1996) and used in the Illinois regional regression equations.Thisalgorithmisdiscussedbelow.
SeveraldefinitionsofBLexistintheliterature.TheBasinSoftdefinitionofBLstatesthatitismeasured,inmiles,along a line areally centered through the basin polygon from thebasinoutlettowherethemain-channelextensionmeetsthebasindivide(HarveyandEash,1996).Thesetwoendpoints,thebasin-outletandthebasin-dividepoint,arelocatedontheperimeter of the basin polygon and BasinSoft calculates the least-costpaththroughthepolygonconnectingthepointstomeasure BL. BasinSoft prompts the user to manually digitize themain-channelextensiontothedivide,basedoncontoursdisplayedonscreen.Thismanualmethodofextendingthemainchannelmayresultindifferentextensionsbydifferentusers.Forexample,oneusermayidentifythemainchannelasthemajornamedstreamforagivenbasin,whereasanotherusermayidentifythemainchannelasthelongestflowpath(LFP) for the basin. Similarly the basin divide (the point wherethemainchannel,ifextended,wouldcrossthedrain-age basin boundary) could be interpreted as the nearest saddle point(alocallowpointonthebasinboundary)orasthehighest point on the upper basin boundary. For consistency, theendpointusedintheILSSisbasedontheLFPextendedtotheintersectionwiththehighestadjacentpointonthebasinboundary.
Theleast-costpathintheILSSisdeterminedbyfirstcreat-ingacost-surfacewhereineachgridcellisassignedacostbasedon the inverse of the Euclidean distance from the basin bound-ary. The XML algorithm then computes the path resulting in the least-costpathfromthebasindivideLFPendpointtotheoutletusingthiscostsurface.Thegrid-cellsizeusedinBasinSoftwas100.12ft,whereasinStreamStats,computerprocessinglimita-tionsrequiredthatthecell-sizebeincreasedto100m.
ThefinalstepintheXMLprogrammingwastoincorpo-rateadjustmentstotheStreamStats-computedbasincharacter-isticstomakethemmorecomparablewiththeoriginalbasincharacteristics determined from BasinSoft. These adjustments consistedofapowerequationfortheslopeandalinearequa-tionforthebasinlength.Thedeterminationofthecoefficientsfor these equations is discussed in the Evaluation and Adjust-ment of Basin Characteristics section.
Illinois StreamStats Database
Information from the Illinois StreamStats database (StreamStatsDB) is available through the StreamStats GageInfo tool.Thedatabasewasdesignedtobepopulatedwithsite-specificinformationforstreamflow-gagingstationsandotherdata-collectionstations,suchasbasinandclimaticcharac-teristics(PhysicalCharacteristics)andstreamflowstatistics.The current (2010) StreamStatsDB implementation in ILSS wasdevelopedbytheUSGSStreamStatsteambyimportingstationdescriptionsandstreamflowstatisticsfromanobsoletedatabaseknownastheBasinCharacteristicFile(BCF)oftheUSGSWaterStorageRetrieval(WATSTORE)System,the

4 Implementation and Evaluation of the Streamflow Statistics (StreamStats) Web Application for Illinois
12
4
3
4
5
6
7
91°
42°
41°
40°
39°
38°
37°
90° 89° 88°
Illi
nois
R.
B
d
ig Mud y R.
Sang oam n R.
Kankakee R.
Rock
R.
FoxR
.
Cache R.
Kask
Ras
kia.
LittleW
abashR.
Mackinaw R.
Vern
milioR.
Iro uq ois R.
LaM
oine R.
Spoo
n R.
Des Plaines R.
Pecatonica R.
Mississippi R.
Embar.
rR
as
Ohio R.
W
abas
h R.
ILLINOIS
IND
IAN
A
MISSOURI
KENTUCKY
IOWA
0
0
20
20
40
40
60
60
80
80
100 MILES
100 KILOMETERS
Base from U.S. Geological Survey digital data, 1:100,000Albers Equal-Area Conic projectionStandard parallels 33°N and 45°N, central meridian 89°W
Green R.
1EXPLANATION
Hydrologic region and identifier
Figure 1. Hydrologic regions for flood-frequency regression equations of rural streams in Illinois (Soong and others, 2004).
Evaluation and Adjustment of Basin Characteristics 5
contemporaneouswater-informationdatabase.TheBCFhasnotbeenupdatedsincethe1990s,andnotimetagswereasso-ciatedwithanyofthedataenteredintotheBCF.Asaresult,the information from the BCF is likely to be at least 10 years old.Consequently,thevaluesdonotnecessarilyagreewithmorerecentlypublishedvalues,orwiththevaluescomputedbyILSS.Theflow-durationandgeneralflowstatisticsbyStreamStatsDBwereobtainedfromWolock(2003a),andbase-flowstatisticswereobtainedfromWolock(2003b).Thefloodquantiles are from a variety of sources, including Soong and others (2004). The sources are documented on the StreamStats Webpages.
Evaluation and Adjustment of Basin Characteristics
ThesetsofBasinSoft-andGIS-map-derivedbasincharacteristics used in the regression equations for determin-ingfloodquantilespublishedinSoongandothers(2004)werecomparedwiththeapproximatelyequivalentbasincharac-teristicsavailablefromILSS.Todeterminewhetheradjust-mentstoILSScomputationsofbasincharacteristicswererequired,basincharacteristicswereobtainedfromILSSbeforethequantileregression-equationcomputationswereimple-mentedinILSS.TheILSSvalueswereobtainedbyidentify-ingstreamflow-gagingstationsonthedigital/basemapsandselecting the nearest road crossing as the starting point for the ILSSwatersheddelineation.Thepercentandabsolutediffer-encesbetweenthetwodatasetsforeachbasincharacteristicwerestatisticallyanalyzedbyuseofparametricandnon-para-metricsignificancetests.Thedistributionofthedifferencesdatasetgenerallywasnotperfectlynormal;therefore,non-parametrictestsmaybepreferredtodetectsignificantdiffer-encesinthetwodatasets.Bothparametricandnon-parametricsignificancetestswerecomputed,becausethepairedt-testisoftenconsideredsufficientlyrobusttodetectdifferencesevenwherenormalityinthedatasetsismoderatelyviolated(Berkand Carey, 2004). The distributions of the differences are shownintheSensitivityofFlood-PeakQuantilessection.Thedistributionsgenerallyweremildlyskewedand(or)toolep-tokurtic(mostvaluesnearthemeanwithfewextremevalues)to be considered normal.
Allbasincharacteristicsweretestedwithboththepara-metricpairedt-testandthenon-parametricWilcoxonsigned-ranktest(WSRT).Becauseofthelargerangeinvalues,thedifferencesofthelog-tranformedbasincharacteristicswerealsotestedfordrainagearea,slope,%Water,andPermAvg.Oftheoriginal288streamflow-gagingstationsusedintheflood-frequencyregressionanalysis,twodrainagebasinswereintheLakeMichiganwatershed,whichisnotimplementedinILSS,andthreeadditionaldrainagebasinswerefoundtohaveerrorsintheoriginaldataset,sothetestsutilized283streamflow-gagingstations.BasinLength,whichisappliedonlyinthe
region4partoftheState,wastestedat47streamflow-gagingstations.Thedifferencesofthelog-transformedvaluesarenotreportedbecausethetransformationwasnotsuitablefortherelativelysmallrangeandlinearrelationbetweentheILSSand published values for Basin Length. The results of the tests areshownintable1.
Pairedt-testp-valuesgreaterthan0.05indicatethatthemeandifferencebetweenthedatasetsisnotstatisticallysignificantatthe0.05significancelevel(referredtohereafterasthe“95-percentconfidencelevel”)(SchlotzhauerandLittel,1987).Wilcoxonsigned-ranktestp-valuesgreaterthan0.05indicatethatthemediandifferencebetweenthedatasetsisnotstatisticallysignificantatthe95-percentconfidencelevel(Helsel and Hirsch, 2002). Results of the tests and subsequent adjustments(whereperformed)aredescribedbelow.
Drainage Basin Area, Percent Water, Average Soil Permeability
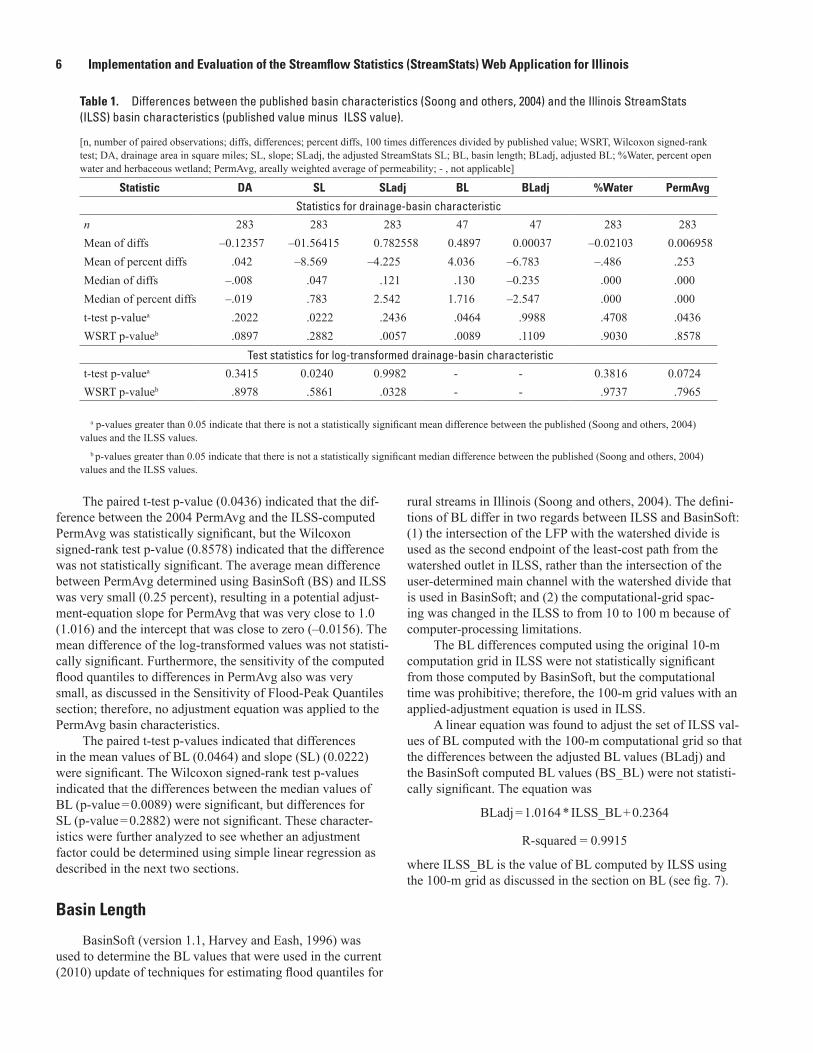
MeandifferencesbetweenthemeanvaluespublishedinSoong and others (2004) and those obtained from ILSS for drainagearea(DA)andpercentageofopenwaterandherba-ceouswetland(%Water)werenotstatisticallysignificant.Thescatterplotinfigure2demonstratestherelationbetweentheDA values published in Soong and others (2004) and those availablefromILSSonlogarithmicallyscaledaxes.Thesamerelationisshownonarithmeticallyscaledaxesinfigure3.ThescatterplotsforPermAvgand%Waterarenotshown,becausethesebasincharacteristicsarederiveddirectlyfromthewater-sheddrainagearea.DifferencesbetweentheSoongandothers(2004) published values and the values computed by ILSS as percentdifferencesareshowninfigure4.Percentdifferenceiscomputedas100*(2004_DA–ILSS_DA)/2004_DA,where2004_DA is the published value in Soong and others (2004) and ILSS_DA is the ILSS value. The same data are plotted on truncatedscalesinfigures5and6tobetterillustratetherela-tivesizeofthedifferenceforsmallerwatersheds.Thepercentdifferencesarelargerforsmallerwatersheds,especiallythoseunder 0.5 mi2. A major reason for this occurrence is that, for agivendifferencebetweenthevalues,thepercentdifferenceincreases as the magnitude of the initial value decreases. For example,adifferenceof0.1mi2is1percentwheretheinitialdrainage area is 10 mi2,butthedifferenceis10percentwherethe drainage area is 1 mi2.
It should be noted that the correctness of the drainage areaswasnotdetermined.Insomecases,ILSSmaycomputeamorecorrectdrainageareathanwasdeterminedbymanualmethods.ThesevalueswereobtainedfromILSSwithoutanyuser intervention. In practice, the user can use the EditBasin tooltoensurethatthewatershedisproperlyrepresentedwithconsiderationoflocalhydraulicflowcontrolssuchasroadsandculverts.Thecomputedbasincharacteristicsandfloodquantilesthenwillbeproducedfortheeditedwatershed.
6 Implementation and Evaluation of the Streamflow Statistics (StreamStats) Web Application for Illinois
Thepairedt-testp-value(0.0436)indicatedthatthedif-ferencebetweenthe2004PermAvgandtheILSS-computedPermAvgwasstatisticallysignificant,buttheWilcoxonsigned-ranktestp-value(0.8578)indicatedthatthedifferencewasnotstatisticallysignificant.TheaveragemeandifferencebetweenPermAvgdeterminedusingBasinSoft(BS)andILSSwasverysmall(0.25percent),resultinginapotentialadjust-ment-equationslopeforPermAvgthatwasverycloseto1.0(1.016)andtheinterceptthatwasclosetozero(–0.0156).Themeandifferenceofthelog-transformedvalueswasnotstatisti-callysignificant.Furthermore,thesensitivityofthecomputedfloodquantilestodifferencesinPermAvgalsowasverysmall,asdiscussedintheSensitivityofFlood-PeakQuantilessection;therefore,noadjustmentequationwasappliedtothePermAvg basin characteristics.
Thepairedt-testp-valuesindicatedthatdifferencesin the mean values of BL (0.0464) and slope (SL) (0.0222) weresignificant.TheWilcoxonsigned-ranktestp-valuesindicatedthatthedifferencesbetweenthemedianvaluesofBL(p-value=0.0089)weresignificant,butdifferencesforSL(p-value=0.2882)werenotsignificant.Thesecharacter-isticswerefurtheranalyzedtoseewhetheranadjustmentfactor could be determined using simple linear regression as describedinthenexttwosections.
Basin Length
BasinSoft(version1.1,HarveyandEash,1996)wasusedtodeterminetheBLvaluesthatwereusedinthecurrent(2010)updateoftechniquesforestimatingfloodquantilesfor
ruralstreamsinIllinois(Soongandothers,2004).Thedefini-tionsofBLdifferintworegardsbetweenILSSandBasinSoft:(1)theintersectionoftheLFPwiththewatersheddivideisusedasthesecondendpointoftheleast-costpathfromthewatershedoutletinILSS,ratherthantheintersectionoftheuser-determinedmainchannelwiththewatersheddividethatisusedinBasinSoft;and(2)thecomputational-gridspac-ingwaschangedintheILSStofrom10to100mbecauseofcomputer-processinglimitations.
TheBLdifferencescomputedusingtheoriginal10-mcomputationgridinILSSwerenotstatisticallysignificantfrom those computed by BasinSoft, but the computational timewasprohibitive;therefore,the100-mgridvalueswithanapplied-adjustmentequationisusedinILSS.
AlinearequationwasfoundtoadjustthesetofILSSval-uesofBLcomputedwiththe100-mcomputationalgridsothatthedifferencesbetweentheadjustedBLvalues(BLadj)andtheBasinSoftcomputedBLvalues(BS_BL)werenotstatisti-callysignificant.Theequationwas
BLadj=1.0164*ILSS_BL+0.2364
R-squared=0.9915
whereILSS_BListhevalueofBLcomputedbyILSSusingthe100-mgridasdiscussedinthesectiononBL(seefig.7).
Table 1. Differences between the published basin characteristics (Soong and others, 2004) and the Illinois StreamStats (ILSS) basin characteristics (published value minus ILSS value).
[n,numberofpairedobservations;diffs,differences;percentdiffs,100timesdifferencesdividedbypublishedvalue;WSRT,Wilcoxonsigned-ranktest;DA,drainageareainsquaremiles;SL,slope;SLadj,theadjustedStreamStatsSL;BL,basinlength;BLadj,adjustedBL;%Water,percentopenwaterandherbaceouswetland;PermAvg,areallyweightedaverageofpermeability;-,notapplicable]
Statistic DA SL SLadj BL BLadj %Water PermAvg
Statistics for drainage-basin characteristicn 283 283 283 47 47 283 283Mean of diffs –0.12357 –01.56415 0.782558 0.4897 0.00037 –0.02103 0.006958 Mean of percent diffs .042 –8.569 –4.225 4.036 –6.783 –.486 .253Median of diffs –.008 .047 .121 .130 –0.235 .000 .000 Median of percent diffs –.019 .783 2.542 1.716 –2.547 .000 .000t-testp-valuea .2022 .0222 .2436 .0464 .9988 .47080 .0436WSRTp-valueb .0897 .2882 .0057 .0089 .1109 .9030 .8578
Test statistics for log-transformed drainage-basin characteristic t-testp-valuea 0.3415 0.0240 0.9982 - - 0.3816 0.0724WSRTp-valueb .8978 .5861 .0328 - - .9737 .7965
ap-valuesgreaterthan0.05indicatethatthereisnotastatisticallysignificantmeandifferencebetweenthepublished(Soongandothers,2004)values and the ILSS values.
b p-valuesgreaterthan0.05indicatethatthereisnotastatisticallysignificantmediandifferencebetweenthepublished(Soongandothers,2004)values and the ILSS values.
Evaluation and Adjustment of Basin Characteristics 7
1
0.10
0.01
10
100
1,000
10,000
10.100.01 10 100 1,000 10,000
ILLINOIS STREAMSTATS DRAINAGE AREA, IN SQUARE MILES
PUBL
ISHE
D DR
AIN
AGE
AREA
, IN
SQU
ARE
MIL
ES
Line of perfect agreement
ILLINOIS STREAMSTATS DRAINAGE AREA, IN SQUARE MILES
PUBL
ISHE
D DR
AIN
AGE
AREA
, IN
SQU
ARE
MIL
ES
0
1,000
2,000
3,000
4,000
5,000
6,000
7,000
8,000
9,000
10,000
0 1,000 2,000 3,000 4,000 5,000 6,000 7,000 8,000 9,000 10,000
Line of perfect agreement
Figure 2. Relation between Illinois StreamStats and published drainage areas (Soong and others, 2004)—logarithmically scaled axes.
Figure 3. Relation between Illinois StreamStats and published drainage areas (Soong and others, 2004)—arithmetically scaled axes.

8 Implementation and Evaluation of the Streamflow Statistics (StreamStats) Web Application for Illinois
-80
-60
-40
-20
0
20
0
40
60
80
1,000 2,000 3,000 4,000 5,000 6,000 7,000 8,000 9,000 10,000
PUBLISHED DRAINAGE AREA, IN SQUARE MILES
DIFF
EREN
CE IN
PUB
LISH
ED A
ND
ILSS
VAL
UES
OF D
RAIN
AGE
AREA
, IN
PER
CEN
T(P
UBLI
SHED
VAL
UE–I
LSS
VALU
E/PU
BLIS
HED
VALU
E)*1
00
-80
-60
-40
-20
0
20
0
40
60
80
PUBLISHED DRAINAGE AREA, IN SQUARE MILES
DIFF
EREN
CE IN
PUB
LISH
ED A
ND
ILSS
VAL
UES
OF D
RAIN
AGE
AREA
, IN
PER
CEN
T(P
UBLI
SHED
VAL
UE–I
LSS
VALU
E/PU
BLIS
HED
VALU
E)*1
00
10 20 30 40 50 60 70 80 90 100
Figure 4. Relation between percent differences in published and Illinois StreamStats (ILSS) values of drainage areas and published drainage areas (Soong and others, 2004)—full scale.
Figure 5. Relation between percent differences in published and Illinois StreamStats (ILSS) values of drainage areas and published drainage areas (Soong and others, 2004)—scale truncated to 100 square miles.

Evaluation and Adjustment of Basin Characteristics 9
-80
-60
-40
-20
0
20
0
40
60
80
PUBLISHED DRAINAGE AREA, IN SQUARE MILES
DIFF
EREN
CE IN
PUB
LISH
ED A
ND
ILSS
VAL
UES
OF D
RAIN
AGE
AREA
, IN
PER
CEN
T(P
UBLI
SHED
VAL
UE–I
LSS
VALU
E/PU
BLIS
HED
VALU
E)*1
00
1 2 3 4 5 6 7 8 9 10
Figure 6. Relation between percent difference in published and Illinois StreamStats (ILSS) values of drainage areas and published drainage areas (Soong and others, 2004)—scale truncated to 10 square miles.
ILLINOIS STREAMSTATS BASIN LENGTH USING 100-METER GRID, IN MILES
PUBL
ISHE
D BA
SIN
SOFT
BAS
IN L
ENGT
H, IN
MIL
ES
0
10
20
30
40
50
60
70
80
0 10 20 30 40 50 60 70 80
y = 1.0164x + 0.2364R = 0.99152
Line of perfect agreement
Figure 7. Relation between Illinois StreamStats basin length using 100-meter grid and the published BasinSoft basin length (Soong and others, 2004).

10 Implementation and Evaluation of the Streamflow Statistics (StreamStats) Web Application for Illinois
Stream Slope
BasinSoft(version1.1,HarveyandEash,1996)wasusedtodeterminetheslopebasincharacteristicthatwasusedinthecurrent(2010)updateoftechniquesforestimatingfloodquan-tiles for rural streams in Illinois (Soong and others, 2004). The mainchannelwasdeterminedbyusingthe1:100,000-scaleNHDandmanuallyextendingtheapparentmainchanneltoanintersectionwiththewatersheddivide,anadjacentsaddlepointbetweenpeaks.Theslopewasdeterminedbydetermin-ing the elevation, in feet, at points of 10 and 85 percent along the main channel from the outlet, and dividing the difference inelevationby75percentofthetotalmain-channellength(whichisthedistancebetweenthe10and85percentpoints),in miles. The StreamStats method is based on an ArcIMS XML algorithm, the SL10-85,whichdeterminesthelongestflowpathfromtheoutlettothedividebyusingtheDEMtodeterminetheflowpathfromthewatershedoutlet,extendingupthelongestcontinuousflowpathtotheadjacentpeakpointonthewatersheddivide.Theslopeisdeterminedbydividingthe difference in elevation, in feet, at 10 and 85 percent of the distancefromtheoutlettotheintersectionoftheLFPwiththewatersheddivide,by75percentofthetotalLFPlength(thedistancebetweenthe10and85percentpoints),inmiles.
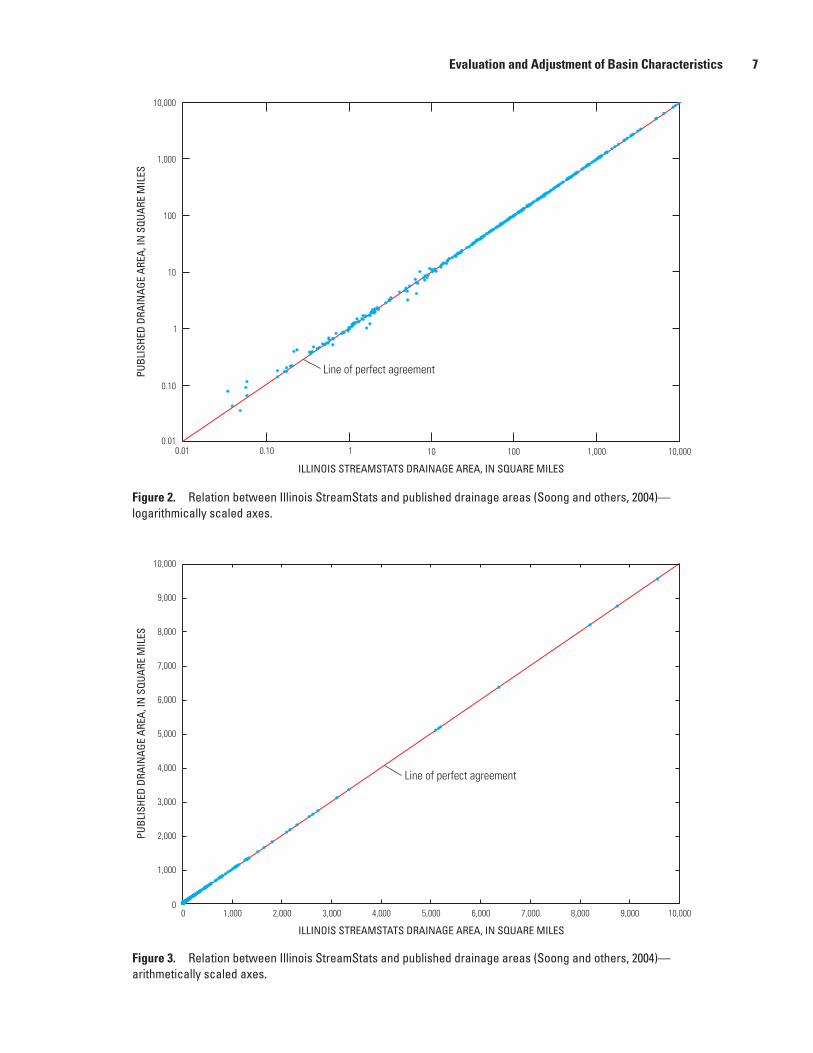
The distribution of the differences in SL displayed a skew,withlargervaluesofSLdeterminedbyILSSthanthosedeterminedusingBasinSoft.Thet-testfordifferencesinSL(table 1) indicated that differences in the means for both the valuesandlog-transformedvalueswerestatisticallysignificant(p-valueof0.0222and0.0240,respectively);thus,acorrectionwastried.Thebest-fitlinear-regressionequation(determined
bylinearregressiononlog-transformedvariables—seefig.8)wasdeterminedtobe
SLadj=1.0767*(ILSS_SL)**0.9486
R-squared=0.9529where SLadj is ILSS slope adjusted to be closer to the
BasinSoft slope, and ILSS_SL is the ILSS slope.
The residuals from the adjusted values as percent differ-enceswereplottedinrelationtothe2004valuesfordrainagearea (2004_DA) and BasinSoft slope (BS_SL) and no pattern wasapparent(figs.9and10);therefore,noregressionrela-tionutilizingthesebasincharacteristicswasconsidered.Theadjustmentequationremovedthestatisticalsignificanceofthedifferencesdeterminedbythepairedt-test,buttheadjustedvaluesweresignificantlydifferentfromthepublishedvaluesundertheWilcoxonsigned-ranktest.Similarresultswerefoundforthelog-transformedvalues.Themeanpercentdif-ferencebetweenthepublishedvaluesandtheadjustedvalueswas–4.22,comparedto–8.57forthemeandifferencefortheunadjustedvalues;however,themedianpercentdifferencedecreased from –0.783 to –2.54, indicating a slightly more skeweddistributionafteradjustment.Theadjusteddistributionwasfoundtobepreferableaccordingtothet-testassumptionof a normal distribution. Figure 8 demonstrates that there is askewinthedistributionoftheILSSslopescomparedtotheBasinSoft slopes, but the effect of this on the overall distribu-tionandrelevanceofthetestwasconsiderednominal.
1
0.10
10
100
1,000
10.10 10 100 1,000
ILLINOIS STREAMSTATS SLOPE, IN FEET PER MILE
PUBL
ISHE
D BA
SIN
SOFT
SLO
PE, I
N F
EET
PER
MIL
E
y = 1.0767x0.9486
2R = 0.9529
Line of perfect agreement
Figure 8. Relation between Illinois StreamStats and published BasinSoft slope (Soong and others, 2004).
Evaluation and Adjustment of Basin Characteristics 11
-50
-100
-150
-200
-250
-300
50
0
100
10.100.01 10 100 1,000 10,000
PUBLISHED DRAINAGE AREA, IN SQUARE MILES
DIFF
EREN
CE IN
PUB
LISH
ED B
ASIN
SOFT
-COM
PUTE
D SL
OPE
AND
ADJU
STED
SLO
PE(B
S_SL
–SLA
DJ) *
100/
BS_S
L, IN
PER
CEN
T
-50
-100
-150
-200
-250
-300
50
0
100
10.10 10 100 1,000
BASINSOFT-COMPUTED SLOPE, IN MILES
DIFF
EREN
CE IN
BAS
INSO
FT-C
OMPU
TED
SLOP
E AN
D AD
JUST
ED S
LOPE
(BS_
SL–A
DJ_S
L)/B
S_SL
, IN
PER
CEN
T
Figure 9. Relation between adjusted slope residual (published BasinSoft-computed stream slope (BS_SL) minus adjusted slope (SLadj), expressed as a percent [(BS_SL-SLadj)*100/BS_SL]), and published drainage area (Soong and others, 2004).
Figure 10. Relation between adjusted slope residual (published BasinSoft-computed stream slope (BS_SL) minus adjusted slope (SLadj), expressed as a percent [(BS_SL-SLadj)*100/BS_SL]), and BasinSoft slope.

12 Implementation and Evaluation of the Streamflow Statistics (StreamStats) Web Application for Illinois
The channel lengths of the BasinSoft main channel (MCL)andtheILSSLFPwereavailablefor47drainagebasinsinregion4.Theirmagnitudesdidnotdiffersignifi-cantly,althoughtheLFPgenerallywaslongerthantheMCL,indicating that the larger slopes in ILSS may not be a direct result of the length difference, but rather the elevation differ-ences as computed at points 10 and 85 percent along the LFP from the outlet. The automated method of selecting the inter-sectionoftheLFPwiththebasindividemaytendtoseekthehighpointonthedivide,whereasthemanualdeterminationofthemain-channelextensiontothebasindivideforIllinoistended to select the saddle; therefore, the ILSS may result in a higher85-percentelevationandalargervalueofSL.
The regression equation did not completely remove the statisticallysignificantdifferenceinthetwodatasetsaccordingtotheWilcoxonsigned-ranktest;however,thesampleof170adjusted slopes obtained from ILSS for the quantile test reported inthenextsectionwasnotsignificantlydifferentaccordingtotheWilcoxonsigned-ranktestnorthepairedt-testandalsowasnotsignificantlydifferentwhensortedbyregionandtested.
Evaluation of Flood-Peak QuantilesIngeneral,theusercannotassumethattheflood-peak
quantiles computed by ILSS and those published in Soong and others(2004)areidentical;however,areasonablesampleoftheflood-peakquantilescomputedbyILSSshouldbeunbiasedcomparedwiththepublishedregressionequationflood-peakquantiles,andthemeanofthedifferencesshouldnotbesignifi-cantlydifferentfromzeroatthe95-percentconfidencelevel.
Anapproximatelyrandomsampleof170streamflow-gagingstationswastestedforallquantilestoverifytheILSSapplication.Thesamplewasselectedbynumberingthe observations and using a random number set to select the sample.Thesamplewasincreasedbyaddingalllocationsin regions 1 and 7, because of the small sample size in those regions. All regions also had at least one station crossing the 8-digitHydrologicUnitCodeprocessingunits.Allstationsthat had drainage basins crossing more than one hydrologic regionwereremovedfromthiscomparison,becausethequantiles published in Soong and others (2004) used only theregionalregressionequationapplicableatthestreamflowstationanddidnotweightbypercentareainseparatehydro-logic regions. ILSS computes the quantiles in each region separatelyandprovidesaweighted-quantileestimateaswellas each regional quantile estimate in the output. For the test of quantileestimates,theselectionofstartingpointswasdeter-mined by obtaining a list of the latitude and longitude to the nearestsecondoftheintersectionoftheNHDstreamnetworkwiththedigitizeddrainagedivide.ThenearestroadcrossingtothisintersectionwasselectedinILSStodeterminethebasincharacteristicsandcomputethefloodquantiles.
Because of the very large range in quantile estimates, the significancetestingwasdoneonthreedatasets:thediffer-encesbetweenthepublishedquantileandtheILSSquantile(published quantile – ILSS quantile) referred to hereafter as the simple differences; the proportional differences resulting from dividing the simple differences by the published quantiles ([publishedquantile–ILSSquantile]/publishedquantile);andthedifferencesofthelog-transformedquantiles(log[publishedquantile]–log[ILSSquantile]).Theresultsofthesignificancetesting using the proportional differences and the differences ofthelog-transformedquantilesarepresentedintables2–9,alongwiththemeanandmedianstatisticsfortheproportionaldifferences.Thesignificancetestingutilizedboththet-testandtheWilcoxonSignedRankTest.Forthedatasetconsist-ingofsimpledifferences,neithertestindicatedanysignificantdifferencebetweenthemeansineitherintheoverallsampleortheindividualregions.However,thistestwasnotconsideredstrictly valid because of the large range in quantiles values; therefore, the simple differences results are not included in the followingtables.Thelogarithmictransformationsaddresstheproblem of the large range of values observed in the simple differences,whereasthestatisticsfortheproportionaldif-ferences provide a practical measure of the differences. The proportional differences are related to the differences of the log-transformedquantiles(A)bythefollowingequation:
2004
2004
( ) 1ILSS
T T
T
Q Q AeQ− −= −
where 2004
2004log log( ) log( )ILSSTT TILSS
T
QA Q QQ
= = −
Q isthefloodquantile, T isthet-yearrecurrenceinterval ILSS istheILSS-computedvalue,and 2004 is the value published in Soong and others
(2004).
Table 2 displays the results of the tests on the propor-tionalandlog-transformedquantilesfortheentiresample.Itwasfoundthattherewasnostatisticallysignificantdifferenceforanyquantilewhenalltheregionsweregroupedtogether.Ascatterplotofthepublished100-yearfloodquantileswiththoseobtainedfromILSSisillustratedinfigure11.Analyzingtheregionsseparatelyresultedinasmallbutsignificantdiffer-enceinthefloodquantilesforregion1only(table3);thetestsfortheotherregionsdidnotindicateastatisticallysignificantdifference (tables 4–9).
Evaluation of Flood-Peak Quantiles 13
Table 2. Comparison of published (Soong and others, 2004), QT2004, and Illinois StreamStats (ILSS), QT
ILSS, flood quantiles as proportional differences—([QT
2004 – QTILSS] / QT
2004) and differences of the log-transformed quantiles (log [QT
2004] – log [QTILSS])—for selected streamflow-gaging stations, all regions.
[n,numberofpairedobservations;WSRT,Wilcoxonsigned-ranktest]
StatisticRecurrence interval
2-year 5-year 10-year 25-year 50-year 100-year 500-year
Statistics for proportional differences
n 170 170 170 170 170 170 170
Mean –0.01260 –0.01455 –0.01666 –0.01707 –0.01923 –0.01742 –0.01962
Median .00632 .00863 .00835 .00803 .00819 .00942 .00908
t-testp-valuea .2563 .2272 .1829 .1909 .1536 .2035 .1739
WSRTp-valueb .2053 .2195 .3244 .2825 .3678 .2518 .2619
Test statistics for differences of the log-transformed quantiles
t-testp-valuea 0.6732 0.6574 0.5804 0.6263 0.5474 0.6930 0.6482
WSRTp-valueb .1531 .1759 .2459 .2044 .2739 .1835 .1919ap-valuesgreaterthan0.05indicatethatthereisnotastatisticallysignificantmeandifferencebetweenthepublished(Soongandothers,
2004) values and the ILSS values.b p-valuesgreaterthan0.05indicatethatthereisnotastatisticallysignificantmediandifferencebetweenthepublished(Soongandoth-
ers, 2004) values and the ILSS values.
Table 3. Comparison of published (Soong and others, 2004), QT2004, and Illinois StreamStats (ILSS), QT
ILSS, flood quantiles as proportional differences—([QT
2004 – QTILSS] / QT
2004) and differences of the log-transformed quantiles (log [QT
2004] – log [QTILSS])—for streamflow-gaging stations, sorted by region: Region 1.
[n,numberofpairedobservations;WSRT,Wilcoxonsigned-ranktest]
StatisticRecurrence interval
2-year 5-year 10-year 25-year 50-year 100-year 500-year
Statistics for proportional differences
n 21 21 21 21 21 21 21
Mean 0.037587 0.039758 0.038617 0.037923 0.038068 0.040158 0.042711
Median .02905 .02723 .02716 .02899 .0299 .03137 .03636
t-testp-valuea .0228 .025 .0381 .0487 .0525 .0473 .0422
WSRTp-valueb .0149 .0187 .0209 .035 .0425 .0317 .0286
Test statistics for differences of the log-transformed quantiles
t-testp-valuea 0.0182 0.02 0.029 0.0366 0.0393 0.035 0.0308
WSRTp-valueb .0149 .0187 .0187 .0167 .0258 .0187 .0209ap-valuesgreaterthan0.05indicatethatthereisnotastatisticallysignificantmeandifferencebetweenthepublished(Soongandothers,
2004) values and the ILSS values.b p-valuesgreaterthan0.05indicatethatthereisnotastatisticallysignificantmediandifferencebetweenthepublished(Soongandoth-
ers, 2004) values and the ILSS values.
14 Implementation and Evaluation of the Streamflow Statistics (StreamStats) Web Application for Illinois
Table 4. Comparison of published (Soong and others, 2004), QT2004, and Illinois StreamStats (ILSS), QT
ILSS, flood quantiles as proportional differences—([QT
2004 – QTILSS] / QT
2004) and differences of the log-transformed quantiles (log [QT
2004] – log [QTILSS])—for selected streamflow-gaging stations, sorted by region: Region 2.
[n,numberofpairedobservations;WSRT,Wilcoxonsigned-ranktest]
StatisticRecurrence interval
2-year 5-year 10-year 25-year 50-year 100-year 500-year
Statistics for proportional differences
n 40 40 40 40 40 40 40
Mean –0.06117 –0.06990 –0.07504 –0.07625 –0.08452 –0.08074 –0.09006
Median .01508 .01743 .01511 .02321 .01903 .02566 .02334
t-testp-valuea .108 .0938 .0817 .0912 .0708 .0887 .0733
WSRTp-valueb .9055 .9579 .8373 .979 .9369 .9673 .9474
Test statistics for differences of the log-transformed quantiles
t-testp-valuea 0.1948 0.1788 0.1601 0.1891 0.1471 0.1948 0.1662
WSRTp-valueb .9579 .9895 .902 .9055 .979 .902 .9055ap-valuesgreaterthan0.05indicatethatthereisnotastatisticallysignificantmeandifferencebetweenthepublished(Soongandothers,
2004) values and the ILSS values.b p-valuesgreaterthan0.05indicatethatthereisnotastatisticallysignificantmediandifferencebetweenthepublished(Soongandoth-
ers, 2004) values and the ILSS values.
Table 5. Comparison of published (Soong and others, 2004), QT2004, and Illinois StreamStats (ILSS), QT
ILSS, flood quantiles as proportional differences—([QT
2004 – QTILSS] / QT
2004) and differences of the log-transformed quantiles (log [QT
2004] – log [QTILSS])—for selected streamflow-gaging stations, sorted by region: Region 3.
[n,numberofpairedobservations;WSRT,Wilcoxonsigned-ranktest]
StatisticRecurrence interval
2-year 5-year 10-year 25-year 50-year 100-year 500-year
Statistics for proportional differences
n 34 34 34 34 34 34 34
Mean –0.00761 –0.01171 –0.01259 –0.01438 –0.01595 –0.01472 –0.01481
Median .00314 –.00052 .00212 .00102 –.00199 .00289 .00162
t-testp-valuea .6672 .5491 .5304 .4927 .4606 .5052 .5168
WSRTp-valueb .8123 .7065 .6684 .6094 .5997 .6557 .7442
Test statistics for differences of the log-transformed quantiles
t-testp-valuea 0.9094 0.8042 0.7915 0.7593 0.7296 0.7874 0.8089
WSRTp-valueb .8336 .7442 .6684 .6153 .6181 .6684 .757ap-valuesgreaterthan0.05indicatethatthereisnotastatisticallysignificantmeandifferencebetweenthepublished(Soongandothers,
2004) values and the ILSS values.b p-valuesgreaterthan0.05indicatethatthereisnotastatisticallysignificantmediandifferencebetweenthepublished(Soongandoth-
ers, 2004) values and the ILSS values.

Evaluation of Flood-Peak Quantiles 15
Table 6. Comparison of published (Soong and others, 2004), QT2004, and Illinois StreamStats (ILSS), QT
ILSS, flood quantiles as proportional differences—([QTT
2004 – QTILSS] / QT
2004) and differences of the log-transformed quantiles (log [QT
2004] – log [QTILSS])—for selected streamflow-gaging stations, sorted by region: Region 4.
[n,numberofpairedobservations;WSRT,Wilcoxonsigned-ranktest]
StatisticRecurrence interval
2-year 5-year 10-year 25-year 50-year 100-year 500-year
Statistics for proportional differences
n 32 32 32 32 32 32 32
Mean 0.014143 0.01712 0.018984 0.01889 0.022862 0.021554 0.022185
Median .006028 .008519 .008731 .007102 .00985 .007138 .006338
t-testp-valuea .2553 .2365 .2255 .2634 .1937 .2405 .2619
WSRTp-valuea .1892 .2605 .2851 .3452 .246 .3067 .3388
Test statistics for differences of the log-transformed quantiles
t-testp-valuea 0.1914 0.1675 0.1552 0.1768 0.1256 0.1548 0.1639
WSRTp-valueb .1755 .2373 .2685 .3067 .2079 .2709 .3203ap-valuesgreaterthan0.05indicatethatthereisnotastatisticallysignificantmeandifferencebetweenthepublished(Soongandothers,
2004) values and the ILSS values.b p-valuesgreaterthan0.05indicatethatthereisnotastatisticallysignificantmediandifferencebetweenthepublished(Soongandoth-
ers, 2004) values and the ILSS values.
Table 7. Comparison of published (Soong and others, 2004), QT2004, and Illinois StreamStats (ILSS), QT
ILSS, flood quantiles as proportional differences—([QT
2004 – QTILSS] / QT
2004) and differences of the log-transformed quantiles (log [QT
2004] – log [QTILSS])—for selected streamflow-gaging stations, sorted by region: Region 5.
[n,numberofpairedobservations;WSRT,Wilcoxonsigned-ranktest]
StatisticRecurrence interval
2-year 5-year 10-year 25-year 50-year 100-year 500-year
Statistics for proportional differences
n 20 20 20 20 20 20 20
Mean –0.05530 –0.05519 –0.06051 –0.06277 –0.06303 –0.06281 –0.06382
Median –.00446 –.00677 –.00852 –.00895 –.00985 –.00923 –.00997
t-testp-valuea .0983 .0966 .0832 .0752 .0748 .079 .0788
WSRTp-valueb .2069 .2837 .2121 .1925 .1564 .165 .1819
Test statistics for differences of the log-transformed quantiles
t-testp-valuea 0.1 0.098 0.0832 0.0745 0.0741 0.08 0.0811
WSRTp-valueb .2247 .2837 .2121 .1992 .1819 .165 .1819ap-valuesgreaterthan0.05indicatethatthereisnotastatisticallysignificantmeandifferencebetweenthepublished(Soongandothers,
2004) values and the ILSS values.b p-valuesgreaterthan0.05indicatethatthereisnotastatisticallysignificantmediandifferencebetweenthepublished(Soongandoth-
ers, 2004) values and the ILSS values.

16 Implementation and Evaluation of the Streamflow Statistics (StreamStats) Web Application for Illinois
Table 8. Comparison of published (Soong and others, 2004), QT2004, and Illinois StreamStats (ILSS), QT
ILSS, flood quantiles as proportional differences—([QT
2004 – QTILSS] / QT
2004) and differences of the log-transformed quantiles (log [QT
2004] – log [QTILSS])—for selected streamflow-gaging stations, sorted by region: Region 6.
[n,numberofpairedobservations;WSRT,Wilcoxonsigned-ranktest]
StatisticRecurrence interval
2-year 5-year 10-year 25-year 50-year 100-year 500-year
Statistics for proportional differences
n 15 15 15 15 15 15 15
Mean 0.014886 0.016165 0.014695 0.019418 0.015057 0.019857 0.017840
Median .022989 .026059 .02451 .030965 .027231 .033419 .028037
t-testp-valuea .5268 .5245 .5811 .4846 .6006 .5022 .5634
WSRTp-valueb .3591 .3591 .391 .3258 .3303 .3258 .3591
Test statistics for differences of the log-transformed quantiles
t-testp-valuea 0.4279 0.4192 0.4633 0.375 0.4709 0.3832 0.4301
WSRTp-valueb .2769 .3028 .2958 .2676 .2769 .2676 .2769ap-valuesgreaterthan0.05indicatethatthereisnotastatisticallysignificantmeandifferencebetweenthepublished(Soongandothers,
2004) values and the ILSS values.b p-valuesgreaterthan0.05indicatethatthereisnotastatisticallysignificantmediandifferencebetweenthepublished(Soongandoth-
ers, 2004) values and the ILSS values.
Table 9. Comparison of published (Soong and others, 2004), QT2004, and Illinois StreamStats (ILSS), QT
ILSS, flood quantiles as proportional differences—([QT
2004 – QTILSS] / QT
2004) and differences of the log-transformed quantiles (log [QT
2004] – log [QTILSS])—for streamflow-gaging stations, sorted by region: Region 7.
[n,numberofpairedobservations;WSRT,Wilcoxonsigned-ranktest]
StatisticRecurrence interval
2-year 5-year 10-year 25-year 50-year 100-year 500-year
Statistics for proportional differences
n 8 8 8 8 8 8 8
Mean 0.02548 0.02479 0.02104 0.02506 0.01963 0.024224 0.021489
Median –.01248 –.01393 –.01675 –.01317 –.01878 –.01443 –.01801
t-testp-valuea .3994 .4024 .4656 .3804 .4877 .3966 .4435
WSRTp-valueb .8438 .8438 .8438 .7422 .7422 .7422 .7422
Test statistics for differences of the log-transformed quantiles
t-testp-valuea 0.3778 0.3782 0.4332 0.356 0.4515 0.3685 0.4108
WSRTp-valueb .7422 .7422 .7422 .7422 .7422 .7422 .7422ap-valuesgreaterthan0.05indicatethatthereisnotastatisticallysignificantmeandifferencebetweenthepublished(Soongandothers,
2004) values and the ILSS values.b p-valuesgreaterthan0.05indicatethatthereisnotastatisticallysignificantmediandifferencebetweenthepublished(Soongandoth-
ers, 2004) values and the ILSS values.
Test of Illinois StreamStats Usage Consistency 17
Region1hadasmallstatisticallysignificantdifferencerangingfrom3.8percentforthe2-yearflood-quantileestimateto4.3percentforthe500-yearflood-quantileestimateatthe95-percentconfidencelevel.All21streamflow-gagingstationswereconsideredintheanalysis,becauseofthefewstream-flow-gagingstationsavailableinregion1.Thestatisticalsig-nificanceofthedifferencecouldbebychance,inlightofthesmall size of the sample. In any case, the difference is small (lessthanone-tenth)comparedtotheaveragepredictionerrorsofthe2-to500-yearregression-equationestimatesinthisregion,whichrangefrom39.5to54.9percentrespectively.
Test of Illinois StreamStats Usage Consistency
Typicalroad-crossingdesign-sitelocationswerecol-lectedfromtheIDOTdistrictofficesandcompiledintoatestdata set to test the consistency of ILSS usage. A list of 28 structureswascompiledwithlatitudeandlongitude,descrip-tion,andstructure-identificationnumber.Additionalstructuresweredistributed(notrepeated)amongthedistrictsincludedforoptionalextratesting;thelistwasdistributedtotheIDOT
districtoffices.Atleastsevenusersreturnedcompletedtests,andtheresultswerecompiled.Onestructure-sitedescrip-tionwasfoundtobeambiguousandwasremovedfromtheresults.Additionally,atleasttwousershadsomedifficultyfindingthecorrectsiteandselectedlocationsthatobviouslywereincorrect.Theseresultsalsowereremovedfromthefinalresults.Thefinalresultsincluded6or7resultsat27locations.Theaveragemaximumdeviationfromthemodevalueofthe100-yearfloodquantileresultateachsitewas1.31percent.Asaresultoftheraredifficultyinidentifyingthecorrectloca-tion,theIDOTStructureIdentificationManagementSystemshapefilewasaddedtotheILSSimplementation.Thisenablesthe user to select the coverage for display and use the ILSS Identifytooltodeterminewhetherthestructuresitehasbeencorrectlyidentified.
Some of the sites tested had completed manually computed quantileestimatesavailable.Figure12showsthecomparisonofthe34siteswithmanualanalysesthatweretestedwithILSS.The accuracy of the manually computed quantile estimates can-notbeevaluatedbecausetheywerenotrepeatedtests;however,apairedt-testbetweenthemanualcomputationsandILSS100-yearfloodquantileestimatesindicatednostatisticallysignificantdifferenceatthe95-percentconfidencelevel.
ILLINOIS STREAMSTATS FLOOD QUANTILE, IN CUBIC FEET PER SECOND
0
10,000
20,000
30,000
40,000
50,000
60,000
70,000
80,000
90,000
0 10,000 20,000 30,000 40,000 50,000 60,000 70,000 80,000 90,000
PUBL
ISHE
D FL
OOD
QUAN
TILE
(SOO
NG
AND
OTHE
RS, 2
004)
,IN
CUB
IC F
EET
PER
SECO
ND
Line of perfect agreement
Figure 11. Relation between StreamStats and Soong and others (2004) 100-year flood quantiles.
18 Implementation and Evaluation of the Streamflow Statistics (StreamStats) Web Application for Illinois
Sensitivity of Flood-Peak QuantilesAsensitivityanalysiswasperformedtodemonstratethe
deviationfromthe2004floodquantilesthatmaybeexpectedfor a range of differences in basin characteristics. To illustrate a range of potential differences, the proportional differences betweenthebasincharacteristicsdeterminedfromILSSandthose from Soong and others (2004) for a sample of the rural streamflow-gagingstationsusedintheflood-frequencyregres-sionequationsweredetermined.Thesamplesizewas271stations,exceptforbasinlength,whichused47stations.
The proportional difference in basin characteristic is expressedas ( ) 2004
2004
( )ILSSBC BCBCBC−
∆ = (1)where BC is a basin characteristic parameter, ∆ isthedifference, ILSS representstheILSS-computedvalue,and 2004 is the value published in Soong and others
(2004). Figures 13A through 13E are histograms of the propor-
tionaldifferencesinDA,SL,PermAvg,%Water,andBL.Interval of the histogram is set to 0.05, and three lines in each plot indicate the mean (center) and the range of ±1 standard deviation,σ.Therangeof±σincludesmorethan67percentof the differences, because the differences are not distributed
normally.Thepercentofvaluesincludedinthe±σareshownon each histogram.
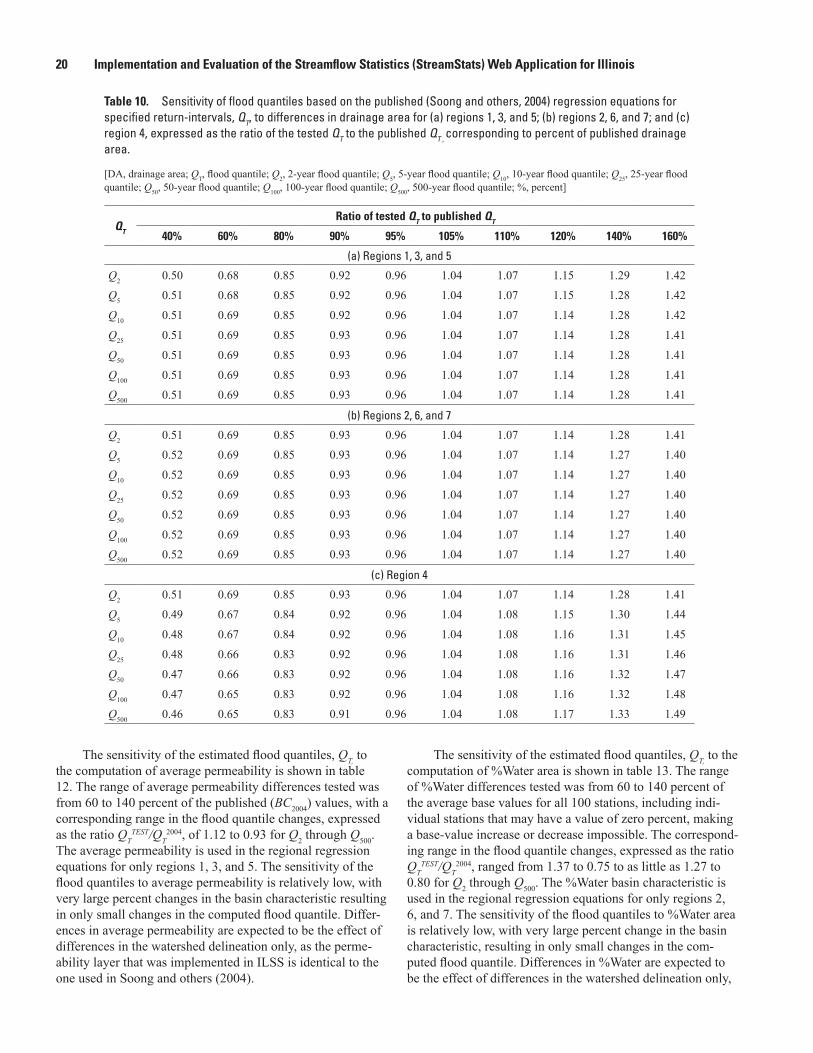
Thesensitivityoftheestimatedfloodquantiles,QT, to the totaldrainageareaisshownintable10.Therangeofdrain-age areastestedwasfrom40to160percentofthepublished(BC2004)values,withacorrespondingrangeinthefloodquantileschange,expressedastheratioofthetestedQT to the published QT (QT
TEST/QT2004) from 0.46 to 1.49 for Q100 and
Q500 in region 4 to as little as 0.52 to 1.40 for Q5 through Q500 in regions 2, 6, and 7. Drainage area is used in all regional regression equations.
Thesensitivityoftheestimatedfloodquantiles,QT, to thevalueofstreamormain-channelslopeisshownintable11.Therangeofslopestestedwasfrom60to140percentofthe published (BC2004)values,withacorrespondingrangeinthefloodquantilechanges,expressedastheratioQT
TEST/QT2004
from 0.76 to 1.19 for Q500 in region 1 to as little as 0.84 to 1.12 for Q2 in regions 2, 6, and 7. The stream slope characteristic usedinallregionalregressionequationswasthemain-channelslope, determined by dividing the elevation difference, in feet, by the distance, in miles, at points 10 and 85 percent from the outlet to the intersection of the main channel and the basin divide.Themain-channelslopewasdeterminedusingBasin-Soft,whichisusedasthepublished(Soongandothers,2004)slope value for the sensitivity analysis.
ILLINOIS STREAMSTATS 100-YEAR FLOOD QUANTILES
0
2,000
4,000
6,000
8,000
10,000
12,000
14,000
16,000
18,000
0 2,000 4,000 6,000 8,000 10,000 12,000 14,000 16,000 18,000
MAN
UALL
Y DE
TERM
INED
100
-YEA
R FL
OOD
QUAN
TILE
Line of perfect agreement
Figure 12. Relation between Illinois StreamStats (ILSS) and manually determined 100-year flood quantiles.
Sensitivity of Flood-Peak Quantiles 19
1
1
1
1
1
1
1
1
1
1
-0.8 -0.7 -0.6 -0.5 -0.4 -0.3 -0.2 -0.1 0.0 0.1 0.2 0.3 0.40
50
100
150
200
250
300
-2.8 -2.4 -2.0 -1.6 -1.2 -0.8 -0.4 0.0 0.40
10
20
30
40
50
-0.8 -0.6 -0.4 -0.2 0.0 0.2 0.4 0.60
50
100
150
200
Drainage AreaMean = 0.0015
± = 90.7percent of values
Percent WaterMean = -0.0064
± = 97.4percent of values
Basin LengthMean = 0.068
± = 72.3percent of values
Average PermeabilityMean = 0.0016
± = 90.4percent of values
Main Channel SlopeMean = -0.0423
± = 85.0percent of values
-0.20 -0.15 -0.10 -0.05 0.00 0.05 0.10 0.150
50
100
150
200
250
-0.6 -0.5 -0.4 -0.3 -0.2 -0.1 0.0 0.1 0.2 0.3 0.40
5
10
15
NUM
BER
OF E
VEN
TSN
UMBE
R OF
EVE
NTS
NUM
BER
OF E
VEN
TS
DIFFERENCE IN BASIN CHARACTERISTICS EXPRESSED AS(2004_BC – ILSS_BC) / 2004_BC
DIFFERENCE IN BASIN CHARACTERISTICS EXPRESSED AS(2004_BC – ILSS_BC) / 2004_BC
A B
C D
E
Figure 13. Distribution of differences in basin characteristics between the published (Soong and others, 2004) basin characteristics (2004_BC) and the Illinois StreamStats basin characteristics (ILSS_BC) for (a) drainage area, (b) average permeability, (c) percentage of open water and herbaceous wetland, (d) slope, and (e) basin length.
20 Implementation and Evaluation of the Streamflow Statistics (StreamStats) Web Application for Illinois
Thesensitivityoftheestimatedfloodquantiles,QT, to thecomputationofaveragepermeabilityisshownintable12.Therangeofaveragepermeabilitydifferencestestedwasfrom 60 to 140 percent of the published (BC2004)values,withacorrespondingrangeinthefloodquantilechanges,expressedas the ratio QT
TEST/QT2004, of 1.12 to 0.93 for Q2 through Q500.
The average permeability is used in the regional regression equations for only regions 1, 3, and 5. The sensitivity of the floodquantilestoaveragepermeabilityisrelativelylow,withvery large percent changes in the basin characteristic resulting inonlysmallchangesinthecomputedfloodquantile.Differ-encesinaveragepermeabilityareexpectedtobetheeffectofdifferencesinthewatersheddelineationonly,astheperme-abilitylayerthatwasimplementedinILSSisidenticaltotheone used in Soong and others (2004).
Thesensitivityoftheestimatedfloodquantiles,QT, to the computationof%Waterareaisshownintable13.Therangeof%Waterdifferencestestedwasfrom60to140percentofthe average base values for all 100 stations, including indi-vidual stations that may have a value of zero percent, making abase-valueincreaseordecreaseimpossible.Thecorrespond-ingrangeinthefloodquantilechanges,expressedastheratioQT
TEST/QT2004, ranged from 1.37 to 0.75 to as little as 1.27 to
0.80 for Q2 through Q500.The%Waterbasincharacteristicisused in the regional regression equations for only regions 2, 6,and7.Thesensitivityofthefloodquantilesto%Waterareaisrelativelylow,withverylargepercentchangeinthebasincharacteristic, resulting in only small changes in the com-putedfloodquantile.Differencesin%Waterareexpectedtobetheeffectofdifferencesinthewatersheddelineationonly,
Table 10. Sensitivity of flood quantiles based on the published (Soong and others, 2004) regression equations for specified return-intervals, QT, to differences in drainage area for (a) regions 1, 3, and 5; (b) regions 2, 6, and 7; and (c) region 4, expressed as the ratio of the tested QT to the published QT , corresponding to percent of published drainage area.
[DA, drainage area; QT,floodquantile;Q2,2-yearfloodquantile;Q5,5-yearfloodquantile;Q10,10-yearfloodquantile;Q25,25-yearfloodquantile; Q50,50-yearfloodquantile;Q100,100-yearfloodquantile;Q500,500-yearfloodquantile;%,percent]
QT
Ratio of tested QT to published QT
40% 60% 80% 90% 95% 105% 110% 120% 140% 160%
(a) Regions 1, 3, and 5
Q2 0.50 0.68 0.85 0.92 0.96 1.04 1.07 1.15 1.29 1.42
Q5 0.51 0.68 0.85 0.92 0.96 1.04 1.07 1.15 1.28 1.42
Q10 0.51 0.69 0.85 0.92 0.96 1.04 1.07 1.14 1.28 1.42
Q25 0.51 0.69 0.85 0.93 0.96 1.04 1.07 1.14 1.28 1.41
Q50 0.51 0.69 0.85 0.93 0.96 1.04 1.07 1.14 1.28 1.41
Q100 0.51 0.69 0.85 0.93 0.96 1.04 1.07 1.14 1.28 1.41
Q500 0.51 0.69 0.85 0.93 0.96 1.04 1.07 1.14 1.28 1.41
(b) Regions 2, 6, and 7
Q2 0.51 0.69 0.85 0.93 0.96 1.04 1.07 1.14 1.28 1.41
Q5 0.52 0.69 0.85 0.93 0.96 1.04 1.07 1.14 1.27 1.40
Q10 0.52 0.69 0.85 0.93 0.96 1.04 1.07 1.14 1.27 1.40
Q25 0.52 0.69 0.85 0.93 0.96 1.04 1.07 1.14 1.27 1.40
Q50 0.52 0.69 0.85 0.93 0.96 1.04 1.07 1.14 1.27 1.40
Q100 0.52 0.69 0.85 0.93 0.96 1.04 1.07 1.14 1.27 1.40
Q500 0.52 0.69 0.85 0.93 0.96 1.04 1.07 1.14 1.27 1.40
(c) Region 4
Q2 0.51 0.69 0.85 0.93 0.96 1.04 1.07 1.14 1.28 1.41
Q5 0.49 0.67 0.84 0.92 0.96 1.04 1.08 1.15 1.30 1.44
Q10 0.48 0.67 0.84 0.92 0.96 1.04 1.08 1.16 1.31 1.45
Q25 0.48 0.66 0.83 0.92 0.96 1.04 1.08 1.16 1.31 1.46
Q50 0.47 0.66 0.83 0.92 0.96 1.04 1.08 1.16 1.32 1.47
Q100 0.47 0.65 0.83 0.92 0.96 1.04 1.08 1.16 1.32 1.48
Q500 0.46 0.65 0.83 0.91 0.96 1.04 1.08 1.17 1.33 1.49
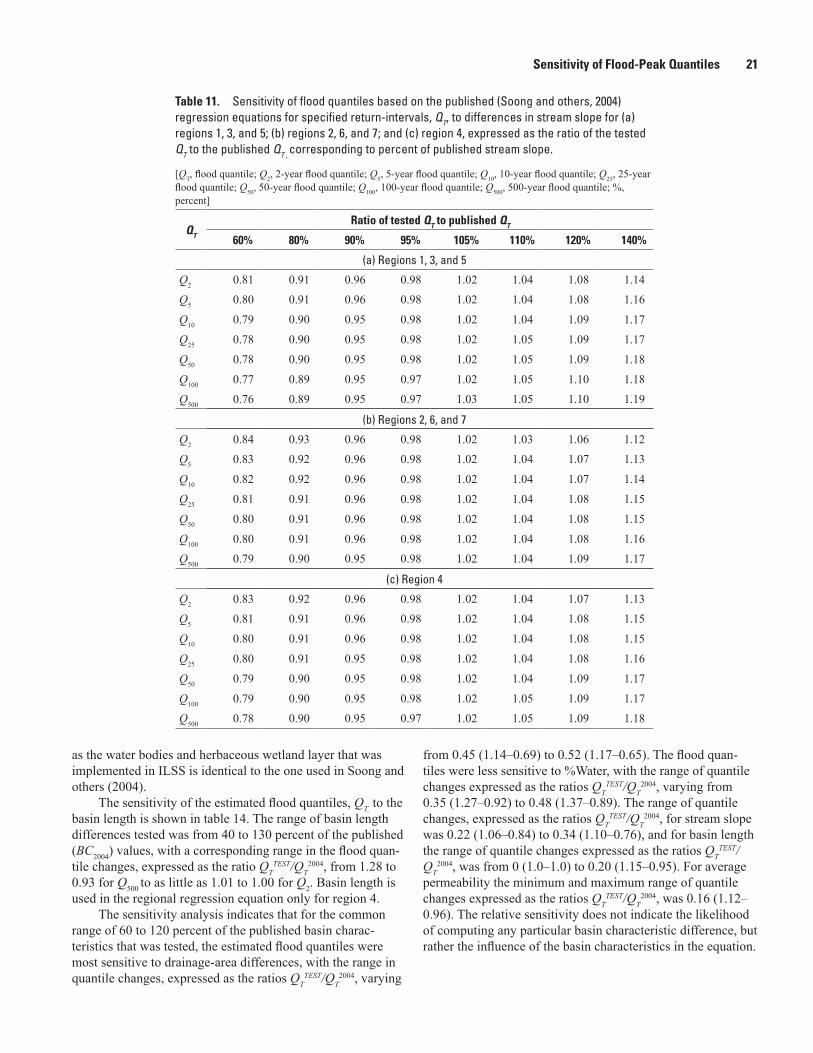
Sensitivity of Flood-Peak Quantiles 21
asthewaterbodiesandherbaceouswetlandlayerthatwasimplemented in ILSS is identical to the one used in Soong and others (2004).
Thesensitivityoftheestimatedfloodquantiles,QT, to the basinlengthisshownintable14.Therangeofbasinlengthdifferencestestedwasfrom40to130percentofthepublished(BC2004)values,withacorrespondingrangeinthefloodquan-tilechanges,expressedastheratioQT
TEST/QT2004, from 1.28 to
0.93 for Q500 to as little as 1.01 to 1.00 for Q2. Basin length is used in the regional regression equation only for region 4.
The sensitivity analysis indicates that for the common range of 60 to 120 percent of the published basin charac-teristicsthatwastested,theestimatedfloodquantilesweremostsensitivetodrainage-areadifferences,withtherangeinquantilechanges,expressedastheratiosQT
TEST/QT2004, varying
from0.45(1.14–0.69)to0.52(1.17–0.65).Thefloodquan-tileswerelesssensitiveto%Water,withtherangeofquantilechangesexpressedastheratiosQT
TEST/QT2004, varying from
0.35 (1.27–0.92) to 0.48 (1.37–0.89). The range of quantile changes,expressedastheratiosQT
TEST/QT2004, for stream slope
was0.22(1.06–0.84)to0.34(1.10–0.76),andforbasinlengththerangeofquantilechangesexpressedastheratiosQT
TEST/QT
2004,wasfrom0(1.0–1.0)to0.20(1.15–0.95).ForaveragepermeabilitytheminimumandmaximumrangeofquantilechangesexpressedastheratiosQT
TEST/QT2004,was0.16(1.12–
0.96). The relative sensitivity does not indicate the likelihood of computing any particular basin characteristic difference, but rathertheinfluenceofthebasincharacteristicsintheequation.
Table 11. Sensitivity of flood quantiles based on the published (Soong and others, 2004) regression equations for specified return-intervals, QT, to differences in stream slope for (a) regions 1, 3, and 5; (b) regions 2, 6, and 7; and (c) region 4, expressed as the ratio of the tested QT to the published QT , corresponding to percent of published stream slope.
[QT,floodquantile;Q2,2-yearfloodquantile;Q5,5-yearfloodquantile;Q10,10-yearfloodquantile;Q25,25-yearfloodquantile;Q50,50-yearfloodquantile;Q100,100-yearfloodquantile;Q500,500-yearfloodquantile;%,percent]
QT
Ratio of tested QT to published QT
60% 80% 90% 95% 105% 110% 120% 140%
(a) Regions 1, 3, and 5
Q2 0.81 0.91 0.96 0.98 1.02 1.04 1.08 1.14
Q5 0.80 0.91 0.96 0.98 1.02 1.04 1.08 1.16
Q10 0.79 0.90 0.95 0.98 1.02 1.04 1.09 1.17
Q25 0.78 0.90 0.95 0.98 1.02 1.05 1.09 1.17
Q50 0.78 0.90 0.95 0.98 1.02 1.05 1.09 1.18
Q100 0.77 0.89 0.95 0.97 1.02 1.05 1.10 1.18
Q500 0.76 0.89 0.95 0.97 1.03 1.05 1.10 1.19
(b) Regions 2, 6, and 7
Q2 0.84 0.93 0.96 0.98 1.02 1.03 1.06 1.12
Q5 0.83 0.92 0.96 0.98 1.02 1.04 1.07 1.13
Q10 0.82 0.92 0.96 0.98 1.02 1.04 1.07 1.14
Q25 0.81 0.91 0.96 0.98 1.02 1.04 1.08 1.15
Q50 0.80 0.91 0.96 0.98 1.02 1.04 1.08 1.15
Q100 0.80 0.91 0.96 0.98 1.02 1.04 1.08 1.16
Q500 0.79 0.90 0.95 0.98 1.02 1.04 1.09 1.17
(c) Region 4
Q2 0.83 0.92 0.96 0.98 1.02 1.04 1.07 1.13
Q5 0.81 0.91 0.96 0.98 1.02 1.04 1.08 1.15
Q10 0.80 0.91 0.96 0.98 1.02 1.04 1.08 1.15
Q25 0.80 0.91 0.95 0.98 1.02 1.04 1.08 1.16
Q50 0.79 0.90 0.95 0.98 1.02 1.04 1.09 1.17
Q100 0.79 0.90 0.95 0.98 1.02 1.05 1.09 1.17
Q500 0.78 0.90 0.95 0.97 1.02 1.05 1.09 1.18
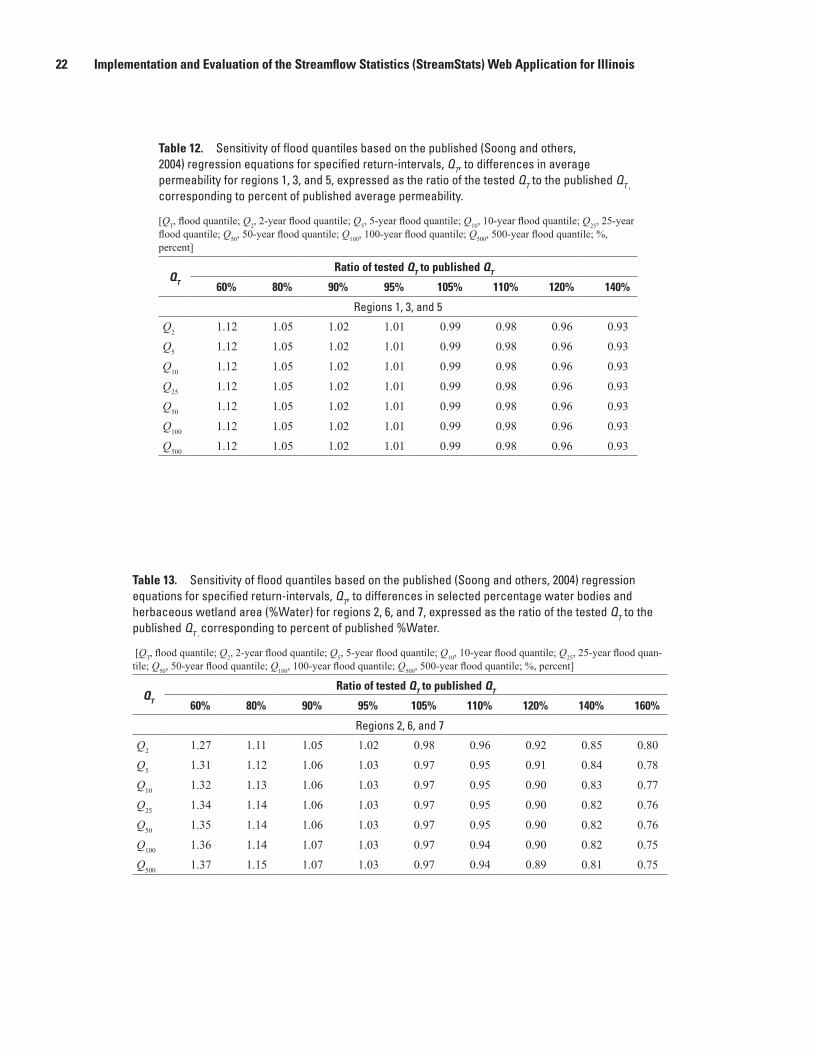
22 Implementation and Evaluation of the Streamflow Statistics (StreamStats) Web Application for Illinois
Table 12. Sensitivity of flood quantiles based on the published (Soong and others, 2004) regression equations for specified return-intervals, QT, to differences in average permeability for regions 1, 3, and 5, expressed as the ratio of the tested QT to the published QT , corresponding to percent of published average permeability.
[QT,floodquantile;Q2,2-yearfloodquantile;Q5,5-yearfloodquantile;Q10,10-yearfloodquantile;Q25,25-yearfloodquantile;Q50,50-yearfloodquantile;Q100,100-yearfloodquantile;Q500,500-yearfloodquantile;%,percent]
QT
Ratio of tested QT to published QT
60% 80% 90% 95% 105% 110% 120% 140%
Regions 1, 3, and 5
Q2 1.12 1.05 1.02 1.01 0.99 0.98 0.96 0.93
Q5 1.12 1.05 1.02 1.01 0.99 0.98 0.96 0.93
Q10 1.12 1.05 1.02 1.01 0.99 0.98 0.96 0.93
Q25 1.12 1.05 1.02 1.01 0.99 0.98 0.96 0.93
Q50 1.12 1.05 1.02 1.01 0.99 0.98 0.96 0.93
Q100 1.12 1.05 1.02 1.01 0.99 0.98 0.96 0.93
Q500 1.12 1.05 1.02 1.01 0.99 0.98 0.96 0.93
Table 13. Sensitivity of flood quantiles based on the published (Soong and others, 2004) regression equations for specified return-intervals, QT, to differences in selected percentage water bodies and herbaceous wetland area (%Water) for regions 2, 6, and 7, expressed as the ratio of the tested QT to the published QT , corresponding to percent of published %Water.
[QT,floodquantile;Q2,2-yearfloodquantile;Q5,5-yearfloodquantile;Q10,10-yearfloodquantile;Q25,25-yearfloodquan-tile; Q50,50-yearfloodquantile;Q100,100-yearfloodquantile;Q500,500-yearfloodquantile;%,percent]
QT
Ratio of tested QT to published QT
60% 80% 90% 95% 105% 110% 120% 140% 160%
Regions 2, 6, and 7
Q2 1.27 1.11 1.05 1.02 0.98 0.96 0.92 0.85 0.80
Q5 1.31 1.12 1.06 1.03 0.97 0.95 0.91 0.84 0.78
Q10 1.32 1.13 1.06 1.03 0.97 0.95 0.90 0.83 0.77
Q25 1.34 1.14 1.06 1.03 0.97 0.95 0.90 0.82 0.76
Q50 1.35 1.14 1.06 1.03 0.97 0.95 0.90 0.82 0.76
Q100 1.36 1.14 1.07 1.03 0.97 0.94 0.90 0.82 0.75
Q500 1.37 1.15 1.07 1.03 0.97 0.94 0.89 0.81 0.75
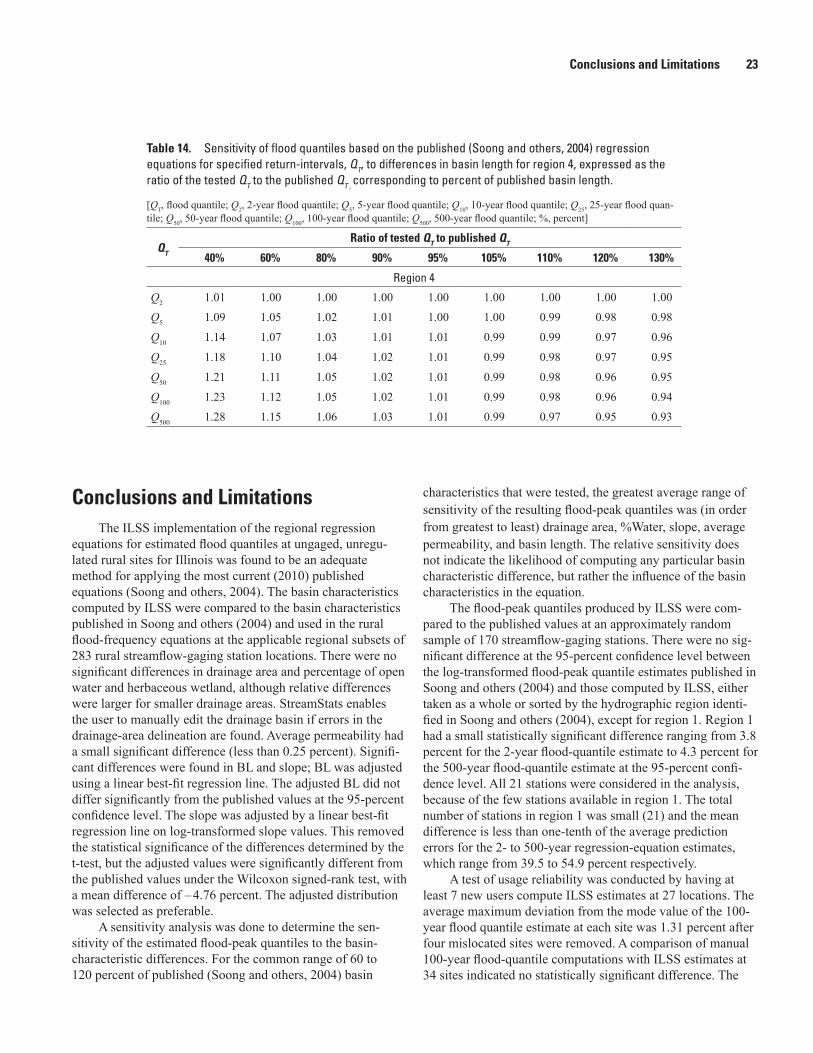
Conclusions and Limitations 23
Conclusions and LimitationsThe ILSS implementation of the regional regression
equationsforestimatedfloodquantilesatungaged,unregu-latedruralsitesforIllinoiswasfoundtobeanadequatemethod for applying the most current (2010) published equations (Soong and others, 2004). The basin characteristics computedbyILSSwerecomparedtothebasincharacteristicspublished in Soong and others (2004) and used in the rural flood-frequencyequationsattheapplicableregionalsubsetsof283ruralstreamflow-gagingstationlocations.Therewerenosignificantdifferencesindrainageareaandpercentageofopenwaterandherbaceouswetland,althoughrelativedifferenceswerelargerforsmallerdrainageareas.StreamStatsenablesthe user to manually edit the drainage basin if errors in the drainage-areadelineationarefound.Averagepermeabilityhadasmallsignificantdifference(lessthan0.25percent).Signifi-cantdifferenceswerefoundinBLandslope;BLwasadjustedusingalinearbest-fitregressionline.TheadjustedBLdidnotdiffersignificantlyfromthepublishedvaluesatthe95-percentconfidencelevel.Theslopewasadjustedbyalinearbest-fitregressionlineonlog-transformedslopevalues.Thisremovedthestatisticalsignificanceofthedifferencesdeterminedbythet-test,buttheadjustedvaluesweresignificantlydifferentfromthepublishedvaluesundertheWilcoxonsigned-ranktest,witha mean difference of – 4.76 percent. The adjusted distribution wasselectedaspreferable.
Asensitivityanalysiswasdonetodeterminethesen-sitivityoftheestimatedflood-peakquantilestothebasin-characteristic differences. For the common range of 60 to 120 percent of published (Soong and others, 2004) basin
characteristicsthatweretested,thegreatestaveragerangeofsensitivityoftheresultingflood-peakquantileswas(inorderfromgreatesttoleast)drainagearea,%Water,slope,averagepermeability, and basin length. The relative sensitivity does not indicate the likelihood of computing any particular basin characteristicdifference,butrathertheinfluenceofthebasincharacteristics in the equation.
Theflood-peakquantilesproducedbyILSSwerecom-paredtothepublishedvaluesatanapproximatelyrandomsampleof170streamflow-gagingstations.Therewerenosig-nificantdifferenceatthe95-percentconfidencelevelbetweenthelog-transformedflood-peakquantileestimatespublishedinSoong and others (2004) and those computed by ILSS, either takenasawholeorsortedbythehydrographicregionidenti-fiedinSoongandothers(2004),exceptforregion1.Region1hadasmallstatisticallysignificantdifferencerangingfrom3.8percentforthe2-yearflood-quantileestimateto4.3percentforthe500-yearflood-quantileestimateatthe95-percentconfi-dencelevel.All21stationswereconsideredintheanalysis,becauseofthefewstationsavailableinregion1.Thetotalnumberofstationsinregion1wassmall(21)andthemeandifferenceislessthanone-tenthoftheaveragepredictionerrorsforthe2-to500-yearregression-equationestimates,whichrangefrom39.5to54.9percentrespectively.
Atestofusagereliabilitywasconductedbyhavingatleast7newuserscomputeILSSestimatesat27locations.Theaveragemaximumdeviationfromthemodevalueofthe100-yearfloodquantileestimateateachsitewas1.31percentafterfourmislocatedsiteswereremoved.Acomparisonofmanual100-yearflood-quantilecomputationswithILSSestimatesat34sitesindicatednostatisticallysignificantdifference.The
Table 14. Sensitivity of flood quantiles based on the published (Soong and others, 2004) regression equations for specified return-intervals, QT, to differences in basin length for region 4, expressed as the ratio of the tested QT to the published QT , corresponding to percent of published basin length.
[QT,floodquantile;Q2,2-yearfloodquantile;Q5,5-yearfloodquantile;Q10,10-yearfloodquantile;Q25,25-yearfloodquan-tile; Q50,50-yearfloodquantile;Q100,100-yearfloodquantile;Q500,500-yearfloodquantile;%,percent]
QT
Ratio of tested QT to published QT
40% 60% 80% 90% 95% 105% 110% 120% 130%
Region 4
Q2 1.01 1.00 1.00 1.00 1.00 1.00 1.00 1.00 1.00
Q5 1.09 1.05 1.02 1.01 1.00 1.00 0.99 0.98 0.98
Q10 1.14 1.07 1.03 1.01 1.01 0.99 0.99 0.97 0.96
Q25 1.18 1.10 1.04 1.02 1.01 0.99 0.98 0.97 0.95
Q50 1.21 1.11 1.05 1.02 1.01 0.99 0.98 0.96 0.95
Q100 1.23 1.12 1.05 1.02 1.01 0.99 0.98 0.96 0.94
Q500 1.28 1.15 1.06 1.03 1.01 0.99 0.97 0.95 0.93

24 Implementation and Evaluation of the Streamflow Statistics (StreamStats) Web Application for Illinois
estimatesoffloodquantilescomputedbyILSSarebasedontheassumptionthatstreamflowatthesiteisnotappreciablyregulated.ILSSdoesnotreturnawarningofthepresenceofregulation or urbanization in a delineated drainage basin; con-sequently,theusershouldconsiderthispossibilitywhenusingthe tool. All other limitations described in Soong and others (2004) apply to ILSS.
The basin characteristics computed by ILSS should be compared to the range of basin characteristics used in develop-ingtheflood-frequencyregionalregressionequations.Thiscomparison is facilitated by the information provided in the ILSSoutput,showingtherange.Extrapolationsoutsidetherange of values should be avoided. Although, in general, the usermustdeterminewhetheradesiredsiteisoutsidetherangeof applicability of the regional regression equations (for rea-sons such as regulation or urbanization), the application is not implementedfortheIllinois,Mississippi,Ohio,andWabashRivers. The basin characteristics are based on the geospatial data sets and the computer algorithms as described in this report and are subject to the differences that are described in the sections on the evaluation and adjustment of basin charac-teristics. ILSS appears to be an accurate, reliable, and effective toolforflood-quantileestimatesandthedeterminationofaconsistent set of basin characteristics.
SummaryTheruralflood-frequencyequationsforIllinoiswere
implemented in a U.S. Geological Survey (USGS) StreamStats Web-basedapplication,theIllinoisStreamStats(ILSS),incoop-erationwiththeIllinoisCenterforTransportation,theIllinoisDepartment of Transportation, and the Illinois Department of NaturalResources–OfficeofWaterResources.ILSScomputesselectedbasincharacteristicsandflood-peakquantilesbasedonthe most recently (2010) published (Soong and others, 2004) regionalflood-frequencyequationsatanyruralstreamlocationinIllinois.Limitedstreamflowstatisticsincludinggeneralstatis-tics,flowdurations,andbaseflowsalsoareavailableforUSGSstreamflow-gagingstations.ILSScanbeaccessedontheWebathttp://streamstats.usgs.gov/ by selecting the State Applications hyperlinkandchoosingIllinoisfromthepull-downmenu.
ThebasincharacteristicsproducedbyILSSwerecom-pared to the basin characteristics published in Soong and others (2004)andusedintheruralflood-frequencyequationsat283ruralstreamflow-gagingstationlocationsbytestingforsignifi-cantdifferencesatthe95-percentconfidencelevelusingthepairedt-test.Therewerenosignificantdifferencesindrainageareaandpercentageofopenwaterandherbaceouswetland,althoughrelativedifferenceswerelargerforsmallerdrain-ageareas,wherelocalhydraulic-controlfeaturesarerelativelyimportant. StreamStats enables the user to manually edit the drainagebasin.Averagepermeabilityhadasmallsignificantdifference(lessthan0.25percent),andnocorrectionwas
considerednecessarybecauseoftheverylowsensitivityofthefloodquantiletothischaracteristic.Significantdifferenceswerefoundinbasinlengthandslope.Basinlengthwasadjustedusingalinearbest-fitregressionline.Theadjustedbasinlengthdidnotdiffersignificantlyfromthepublishedvalues.Theslopewasadjustedbyalinearbest-fitregressionlineonlog-transformedslopevalues.Theadjustedvalueswerenotsignificantlydif-ferentfromthepublishedvaluesaccordingtothepairedt-test,butdidhaveasignificantdifferenceaccordingtotheWilcoxonsigned-ranktest,withameandifferenceof4.22percent.
Asensitivityanalysiswasusedtodeterminethesensitivityofalargesample(271)oftheestimatedflood-peakquantilestothebasin-characteristicdifferences.Forthecommonrangeof60 to 120 percent of published (Soong and others, 2004) basin characteristicsthatweretested,thegreatestaveragerangeofsensitivityoftheresultingflood-peakquantileswas(inorderfromgreatesttoleast)drainagearea,%Water,slope,averagepermeability, and basin length. The relative range in sensitiv-ity does not indicate the likelihood of computing any particular basincharacteristicdifference,butrathertheinfluenceofthebasin characteristics in the regional regression equations.
Theflood-peakquantilesproducedbyILSSwerecom-paredtothepublishedvaluesatanapproximatelyrandomsampleof170streamflow-gagingstations.Therewerenosignificantdifferencesbetweenthelog-transformedflood-peakquantile estimates published in Soong and others (2004) and thosecomputedbyILSS,eithertakenasawholeorsortedbythehydrographicregionsidentifiedinSoongandothers(2004),exceptforregion1.Region1hadasmallstatisti-callysignificantdifferencerangingfrom3.76percentforthe2-yearflood-quantileestimateto4.27percentforthe500-yearflood-quantileestimateatthe95-percentconfidencelevel.All21stationswereconsideredintheanalysis,becauseofthefewstations available in region 1. The total number of stations in region1wassmall,andthemeandifferenceislessthanone-tenthoftheaveragepredictionerrorsforthe2-to500-yearregression-equationestimates,whichrangefrom39.5to54.9percent, respectively.
AtestoftheILSSusagereliabilitywasconductedbyhavingatleast7newuserscomputeflood-quantileestimatesat27locations.Theaveragemaximumdeviationofthe100-yearfloodquantileestimatefromthemodevalueateachsitewas1.31percentafterfourmislocatedsiteswereremoved.Acom-parisonofmanual100-yearflood-quantilecomputationswithILSSat34sitesindicatednostatisticallysignificantdifference.
ILSS appears to be an accurate, reliable, and effective toolforflood-quantileestimatesandthedeterminationofaconsistent set of basin characteristics.

References Cited 25
AcknowledgmentsThe authors thank the many Illinois Department of
Transportation (IDOT) and Illinois Department of Natural Resources–OfficeofWaterResources(IDNR–OWR)hydrau-licengineerswhohelpedwiththetestingandevaluationofthefunctionality of Illinois StreamStats. The authors thank Mat-thewR.O’Connor,IDOT,thechairoftheTechnicalReviewPanel (TRP) and the other TRP members including Arlan Juhl, IDNR-OWR,NeilVanbebber,IDOT,andMarkGadwedzinski,IDOT, for providing guidance and oversight for the project.
TheauthorsthankAnnHoltrop,formerlyoftheWater-shed Protection Section, Illinois Natural History Survey, IllinoisDepartmentofNaturalResources,whoprocessedthemajorityofthedendriticnetworkbyJune2006andgraciouslyprovided the data for use in this study.
The authors thank the U.S. Geological Survey (USGS) StreamStats team, especially Alan Rea, Kernell Ries, and DavidStewartwhoassistedwithtechnicalimplementationand testing issues. The authors thank Christine Dartiguenave andSreereshSreedharofESRI,Inc.,whocompletedtheXMLprogrammingforthebasin-lengthcharacteristics.Finally,theauthors thank Thomas Over and Timothy Straub of the USGS IllinoisWaterScienceCenter,andDavidEashoftheUSGSIowaWaterScienceCenterwhoofferedsuggestionsonthestatisticalanalysesandwatershed-geomorphologyissues.
References Cited
Berk,K.N.,andCarey,P.,2004,DataanalysiswithMicrosoftExcel:Brooks/Cole—ThomsonLearning,579p.
ESRI,Inc.,2005,ArcHydrotoolsoverview—Version1.1final,July2005,accessedApril8,2009,athttp://www.crwr.utexas.edu/gis/gishydro06/ArcHydro/ArcHydroTools/Doc/Arc%20Hydro%20Tools%20-%20Overview.pdf.
Harvey, C.A., and Eash, D.A., 1996, Description, instructions, andverificationforBasinSoft,acomputerprogramtoquan-tifydrainage-basincharacteristics:U.S.GeologicalSurveyWater-ResourcesInvestigationsReport95–4287,25p.
Helsel, D.R., and Hirsch, R.M., 2002, Statistical methods in waterresources:U.S.GeologicalSurveyTechniquesofWater-ResourcesInvestigations,book4(HydrologicAnaly-sis and Interpretation), chap. A3, 510 p.
Jennings,M.E.,Thomas,W.O.,Jr.,andRiggs,H.C.,1994,NationwidesummaryofU.S.GeologicalSurveyregionalregression equations for estimating magnitude and fre-quencyoffloodsforungagedsites,1993:U.S.GeologicalSurveyWater-ResourcesInvestigationsReport94–4002,194 p.
Natural Resources Conservation Service, 1993, State soil geo-graphic base (STATSGO): U.S. Department of Agriculture, Miscellaneous Publication No. 1492, 110 p., and computer data.
RiesIII,K.G.,2007,Thenationalstreamflowstatisticspro-gram:Acomputerprogramforestimatingstreamflowstatis-tics for ungaged sites: U.S. Geological Survey Techniques and Methods 4–A6, 37 p.
Ries, K.G., III, Guthrie, J.G., Rea, A.H., Steeves, P.A., Coles, J.D.,andStewart,D.W.,2008,StreamStats—AwaterresourcesWebapplication:U.S.GeologicalSurveyFactSheet FS 2008–3067, 6 p.
Schlotzhauer, S.D., and Littell, R.C., 1987, SAS system for elementary statistical analysis: Cary, N.C., SAS Institute, 410 p.
Soong, D.T., Ishii, A.L., Sharpe, J.B., and Avery, C.F., 2004, Estimatingflood-peakdischargemagnitudesandfrequen-cies for rural streams in Illinois: U.S. Geological Survey ScientificInvestigationsReport2004–5103,147p.
Wolock,D.M.,2003a,FlowcharacteristicsatU.S.GeologicalSurvey streamgages in the conterminous United States: U.S. GeologicalSurveyOpen-FileReport03–146,digitaldataset, accessed May 11, 2009, at http://water.usgs.gov/lookup/getspatial?qsitesdd.
Wolock,D.M.,2003b,Base-flowindexgridfortheconter-minousUnitedStates:U.S.GeologicalSurveyOpen-FileReport 03–263, digital data set, accessed May 11, 2009, at http://water.usgs.gov/lookup/getspatial?bfi48grd.

Ishii and others—Stream
flow Statistics (Stream
Stats) Web A
pplication for Illinois—Scientific Investigations Report 2009–5197


