
i
A PROJECT REPORT IN PARTIAL FULFILLMENT OF THE REQUIREMENT FOR THE DEGREE OF
MASTER OF TECHNOLOGY IN OPERATIONS MANAGEMENT
in
THE FACULTY OF ENGINEERING AND THE BUILT ENVIRONMENT
DEPARTMENT OF QUALITY AND OPERATIONS MANAGEMENT
IMPROVEMENTS OF QUALITY AND PERFORMANCE MANAGEMENT IN THE SOUTH AFRICAN POSTAL
SERVICES: CHALLENGES AND PROSPECTS
Thabiso John, Mokoena
We accept this report as conforming to the required standard
SUPERVISOR: Prof. C MBOHWA CO-SUPERVISOR:………………………………………………………………… EXTERNAL EXAMINER: ……………………………………………………….
THE UNIVERSITY OF JOHANNESBURG December 2012

ii
In presenting this report in partial fulfilment of the requirements for a degree at the University of Johannesburg, I agree that permission for extensive copying of this report for scholarly purposes may be granted by the head of my department or by his or her representatives. It is understood that copying or publication of this report for financial gain shall not be allowed without my written permission.
_____________________________________________________
Department of Quality and Operations Management The University of Johannesburg APB Campus P O Box 524 Auckland Park 2006 Johannesburg South Africa Contact details as on title page can be repeated Date Signature

iii
ABSTRACT This study entails and discusses the concepts of quality and performance management in the
postal and related services. Quality and Performance Management fundamentally form part of
critical strategic objectives and goals every organization set itself to successfully achieve; the
practice of quality has been around for a very long time and has become a widespread
phenomenon interpreted and implemented differently in the industry while performance
management emerged in the 1970’s and grew to be appreciated with time bringing measures to
quantify individual and organizational results. This study was aimed at determining the current
and past scenarios in the South African Post Office (SAPO) with regards to the organization’s
Quality and Performance Management efforts with the view of recommending improvements to
be adapted and implemented for strategic business growth.
The study was conducted at Capemail and Securemail which are two of other SAPO’s
operational divisions that processes and conveys large volumes in clients’ mail and parcels.
SAPO is in the process of organizational transformation where a number of projects are being
implemented including Change Management, ISO 9001:2008, ISO 14001:2004, Total
Operations Management Solutions, Productivity Engineering and others where most of these
projects failed to yield the intended value. The techniques deployed for the study involved
conducting observations in both Mail Centres, conducting informal interviews and distributing
questionnaires for data collection; data was further scrutinized and analyzed with Statkon’s
consultancy and statistical techniques were exploited to analyze it into meaningful information.
The actual statistical tools used for analysis involved descriptives, factor analysis, normalities,
comparisons and correlations; these were suffice to produce reliable and accurate data for the
results of the study. The objectives of the study was achieved in that management need to
seriously pay attention on factors such as empowering employees, enforcing and emphasizing
the culture of good quality practice, adapting advanced project implementation frameworks
benchmarking with industry competitors, standardizing processes and activities, encouraging the
culture of continuous improvement, provision of support to operational requirements financially
and otherwise, upgrading technology, viewing performance management from a holistic
perspective and linking it directly with day to day activities of the organization and objectives.

iv
These are some of the areas that need a critical review and improvement for quality and
performance management to be well managed and sustained going forward.

v
ACKNOWLEDGEMENTS
I would like to express my deepest gratitude to all those that participated in making this
Dissertation a success and reality; I would also in particular like to forward my greatest thank
you to Professor Mbohwa for being available at all times with guidance, encouragement, support,
motivation, inspiration and patience with me during this study.
Lastly I would like to humbly dedicate the achievement of this work to my late mother,
mmaLineo Lieketseng Mokoena, my late father Pini Aaron Mokoena and my late grandmother
Annah Mokoena.
A special warm dedication of this work is also forwarded to a lady close to my heart Lerato
Matshoe and my son Bokang Mokoena for their patience with me during challenging times
where I could not afford them attention; attaining the success of this research demanded a lot of
focusing without distraction.

vi
NOMENCLATURE
SAPO- South African Post Office QMS- Quality Management Systems QM- Quality Management STATS SA- Statistics South Africa QPM- Quality Performance Management ISO- International Organization for Standardization ICASA- Independent Communications Authority of South Africa DoC- Department of Communications MB- Mail Business COO- Chief Operations Officer TOMS- Total Operations Management Solution USA- United States of America IT- Information Technology CI- Continuous Improvement JIT- Just In Time QFD- Quality Function Deployment SAVE- Society of American Value Engineers EGB- European Governing Board PZB- Parasuraman, Zeithaml and Berry SERVQUAL- Service Quality Model NPO- National Postal Organization UPU- Universal Postal Union PIP- Performance Improvement Potentials PMS- Performance Management System PCA- Principal Component Analysis MSA- Measure of Sampling Adequacy ANOVA- Analysis Of Variance KMO- Kaizer Meyer-Oklin Sig- Significant df- Degrees of Freedom rho- Spearman Rank Order Correlation

vii
List of Contents CHAPTER 1 ......................................................................................................................................... 1 INTRODUCTION AND BACKGROUD........................................................................................... 1 1.0 Introduction ............................................................................................................................... 1
1.1 Statement of the problem .......................................................................................................... 1 1.2 Justification ................................................................................................................................ 3 1.3 Aim ............................................................................................................................................. 3
1.4 Objectives and Scope ................................................................................................................ 4 1.5 Summary of Chapters................................................................................................................ 5 CHAPTER 2 ......................................................................................................................................... 7
LITERATURE REVIEW ..................................................................................................................... 7 2.1 Quality........................................................................................................................................ 7 2.1.1.1 Approaches to quality .............................................................................................................. 7
2.1.2 ISO 9001: 2008 QMS as the concept of Quality Management ............................................ 11 2.1.2.1 The concept of ISO ................................................................................................................ 11 2.1.2.2 Discussions and arguments from previous ISO surveys ...................................................... 13
2.1.2.3. ISO 9001:2008 and organizational profits........................................................................... 13 2.1.2.4 Contributions of ISO on process improvements and customer satisfaction ....................... 14 2.1.3 Continuous Improvement in service organizations ............................................................... 16
2.1.3.1 The Just in Time Philosophy ................................................................................................. 17 2.1.3.2 Value Engineering .................................................................................................................. 20 2.1.4 Quality in the Services industry ............................................................................................. 22
2.1.5 Postal Services ........................................................................................................................ 26 2.1.5.1 The performance of Postal Organizations ............................................................................ 27 2.1.5.2 Quality in Postal Organizations ............................................................................................. 30
2.1.5.3 Strategies for Postal Business ................................................................................................ 33 2.2 Performance Management ...................................................................................................... 36 2.2.1 Selection of people .................................................................................................................. 38
2.2.2 Skills and ability ...................................................................................................................... 40 2.2.3 Organizational culture ............................................................................................................. 41 2.2.4 Motivation................................................................................................................................ 42
2.3 Summary of the chapter .......................................................................................................... 46 CHAPTER 3 ....................................................................................................................................... 48 METHODOLOGY ............................................................................................................................. 48
3.1 Methodology............................................................................................................................ 48 3.2 Research Objectives ................................................................................................................ 48 3.3 Research Design ...................................................................................................................... 49
3.3.1 Population ................................................................................................................................ 49 3.3.2 The sampling method .............................................................................................................. 50 3.3.3 Questionnaire Design .............................................................................................................. 50
3.4 Data Collection ........................................................................................................................ 51 3.4.1 Primary Data ............................................................................................................................ 52 3.4.2 Secondary Data........................................................................................................................ 52
3.5 Data Analysis........................................................................................................................... 53

viii
3.6 Limitations ............................................................................................................................... 54 CHAPTER 4 ....................................................................................................................................... 55
CASE STUDY- THE SOUTH AFRICAN POSTAL SERVICES .................................................. 55 4.1 A brief history and background of SAPO.............................................................................. 55 4.2 The processes and activities of SAPO ................................................................................... 56
4.3 Challenges in the South African Postal Services .................................................................. 59 4.4 Macro-environmental analysis for SAPO .............................................................................. 60 4.4.1 SAPO and the market environment........................................................................................ 60
4.4.2 SAPO and the macro-environment ........................................................................................ 61 4.4.3 Political variables .................................................................................................................... 61 4.4.4 Technological variables .......................................................................................................... 62
4.4.5 Social Variables ....................................................................................................................... 62 4.4.6 Economic Variables ................................................................................................................ 63 4.4.7 Physical variables .................................................................................................................... 64
4.5 Summary of the chapter .......................................................................................................... 64 CHAPTER 5 ....................................................................................................................................... 65 RESULTS AND DISCUSSIONS...................................................................................................... 65
5.1 Introduction ............................................................................................................................. 65 5.2 SECTION A: Descriptives ..................................................................................................... 65 5.3 Factor Analysis ........................................................................................................................ 68
5.4 Tests for Normality ................................................................................................................. 68 5.5 Comparisons ............................................................................................................................ 74 5.5.1 Age Group Analyses ............................................................................................................... 75
5.5.2 Level of Qualification Analyses ............................................................................................. 79 5.5.3 Job Level Analyses ................................................................................................................. 87 5.6 Tests of Normality and Correlations ...................................................................................... 91
5.7 Frequencies .............................................................................................................................. 95 5.8 Recommendations ................................................................................................................... 96 5.9 Suggestions for future work ................................................................................................. 101
CHAPTER 6 ..................................................................................................................................... 103 CONCLUSIONS .............................................................................................................................. 103 6.1 Quality Management ............................................................................................................. 106
6.2 Performance Management .................................................................................................... 107 LIST OF REFERENCES ................................................................................................................. 109 List of figures Figure 1.1 SAPO mandate and license agreement (Annual report, 2010:3) ..................................... 2
Figure 2.1: The structure of ISO 9000 series of standards .............................................................. 12 Figure 2.2: The eight principles of ISO 9001:2008 ......................................................................... 12 Figure 2.3: Model of a process based QMS (http://www.iso.org)................................................... 18
Figure 2.4: Program value and the systems engineering process in the life cycle. Adapted from Blanchard (2004). ............................................................................................................................... 21 Figure 2.5 Gap Model of Service Quality (PZB, 2006) ................................................................... 26
Figure 2.6: Percentage growth in domestic letter mail volumes (ICASA, 2010:28)...................... 28

ix
Figure 2.7: The postal death spiral (Ngunyen, 2008, p 13).............................................................. 32 Figure 2.8: The Postal Value Chain (NERA, 2004) ......................................................................... 34
Figure 2.9: The combined horizontal postal value chain (NERA, 2004) ........................................ 35 Figure 2.10: The Performance constraint Analysis model. (Abernathy (2010:9) .......................... 44 Figure 4.2: Reserved and unreserved mail products (SAPO, 2012) ................................................ 57
Figure 4.3 South African Post Office Annual Report 2010 (www.sapo.co.za) .............................. 61 Figure 4.4 South Africa’s unemployment rate (STATS SA, 2012) ................................................ 63 Figure 5.1 Demographics ................................................................................................................... 67
Figure 5.8 ............................................................................................................................................ 99 Figure 5.9: SAPO Process flow chart of Mail Business (SAPO, 2008).......................................... 99 Figure 5.10: Employee responses during informal interviews ...................................................... 101
List of tables Table 1.1: SA Post Office Financial performance for 2009/10 (SAPO, 2011) ................................ 3 Table 5.1 Demographics .................................................................................................................... 66 Table 5.2: Normality tests for two factors-F(I) Organizational Strategy, Performance and Leadership; F(II) Human Resource Factors. ..................................................................................... 69
Table 5.3: Normality tests for F(I) Importance of QPM; F(II) Customer Requirements; F(III) Nonconformance Management and F(IV) Employee Contribution to QM .................................... 70 Table 5.4: Normality tests for F(1) Performance Management and F(II) Change Management .. 72
Table 5.5: Normality tests for F(1) QMS Requirements and F(11) Employee Perceptions .......... 73 Table 5.6: Normality tests for F(I) Internal Structural Challenges; F(II) Wellbeing and Resource conditions; F(III) Indicators to Excellence; F(IV) Operational Standards...................................... 74
Table 5.7: The Age Group Descriptive table for comparisons. ....................................................... 76 Table 5.8 Test of Homogeneity of Variances ................................................................................... 77 Table 5.9: Age Group ANOVA for comparisons ............................................................................. 77
Table 5.10: Robust Tests for Age Group comparisons .................................................................... 78 Table 5.11: Level of Qualification Descriptives for Comparisons .................................................. 81 Table 5.12: Test of Homogeneity of Variances ................................................................................ 81
Table 5.13: Robust Test for Qualification Levels comparisons ...................................................... 81 Table 5.14: Level of Qualification ANOVA for comparisons ........................................................ 82 Table 5.15 and Figure 5.2: Means of Human Resource factor ........................................................ 83
Table 5.16 and Figure 5.3: Means of Project Management factor .................................................. 83 Table 5.17 and Figure 5.4: Means of Change Management factor ................................................. 84 Table 5.18 and Figure 5.5: Means of QMS Requirements factor .................................................... 85
Table 5.19 and Figure 5.6: Means of Employee Perception factor ................................................. 85 Table 5.20 and Figure 5.7: Means of Wellbeing and Resource Conditions factor......................... 86 Table 5.21 and Figure 5.8: Means of Operational Standards factor ................................................ 87
Table 5.22: Group statistic tests for job level analysis ..................................................................... 89 Table 5.23: Independent Samples Test.............................................................................................. 90 Table 5.24: Normality tests for all factors ........................................................................................ 92
Table 5.25: Non Parametric Correlation tests for all factors ........................................................... 93 Table 5.26: Summary frequencies for Performance Management .................................................. 95 Table 5.27: Summary frequency analysis for Quality Management ............................................... 96

1
CHAPTER 1
INTRODUCTION AND BACKGROUD
1.0 Introduction
To be recognized as a competitive business in today’s economies, a company has to provide a
product or service with assurance of quality to customers. Quality in any environment of work
activity is measured by reliability, durability, performance, conformance and features; a
combination of all of these factors establishes a price with integrity in the market. Businesses
need to continuously exploit their competitive edge in order to retain their client base and also to
attract new clients, failure to retain and attract new clients lead to disastrous consequences in the
survival of the business. Almost every organization or an institution recognized as such is
compelled to be ISO certified for continued survival in the competitive environment of today’s
business world. Being ISO certified means increased efficiency since processes are established
and documented allowing personnel to easily follow accessible guidelines, increased revenue due
to approved products offering assurance of meeting customers’ expectations therefore increased
customers, employee morale, international recognition and other benefits.
1.1 Statement of the problem
In accordance to its licence agreement and regulatory requirements, the South African Post
Office (Referred hereafter as SAPO) has a mandate to successfully achieve an annual target
delivery standard of 98% within the activities of delivering ordinary mail (this excludes fast
mail, speed services, and parcels). This commitment has been internally set as a delivery
standard that is being reviewed weekly to address concerns because in 2009/2010 financial year
the SAPO performance standard was fluctuating between 95 and 96% being unacceptable
according to the License Agreement and may lead to penalty consequences. Figure 1.1 details the
performance criteria set by Department of Communications (DoC) and Independent
Communications Authority of South Africa (ICASA) as the mother bodies of the organization.
One of the conditions of the license agreement set by ICASA is that SAPO must achieve an

2
expansion discovery of a minimum of one million new postal addresses in the Mail Business,
this means the business has to find one million houses as new business for deliveries per year,
failure to achieve the target results in penalty charges.
Figure 1.1 SAPO mandate and license agreement (Annual report, 2010:3)
This study seeks to identify challenges and opportunities experienced by the South African Post
Office while it is embarking on its strategic moves delegated from executive level, the focus of
these moves are the implementation of both ISO 9001 QMS and continuous improvement
strategies. One of the key challenges on the implementation of ISO is the size of the organization
nationwide and the amount of time required by the certification process on all of the company’s
Business Units; furthermore this study aims to develop an approach that will be most optimal for
the integration and pursuit of ISO and continuous improvement strategies simultaneously. This
means potential problem areas are to be identified on the processes, resources and other related
factors leading to recommendations being made.

3
1.2 Justification
The performance of SAPO in 2009/10 declined based on select financial indices. A summary of
the performance percentage decline is shown in Table 1.1.
Change R’000
2009/10 R’000
2008/09 R’000
Revenue* down (0.4%) (22,073) 5,552,757 5,574,830
Expenses down (2.1%) (113,095) 5,347,569 5,460,664 Net finance revenue down (22.4%) (117,893) 407,417 525,310
Profit before tax down (22.4%) (109,543) 378,698 488,241 Taxation down (34.5%) (43,231) (82,107) (125,338)
Net profit down (18.3%) (66,312) 296,591 362,903 Cash flow from operating activities down (93.7%) (608,723) 41,094 649,817 Profit margin (PBT)** down (23.2%) (2.2%) 7.2% 9.3% Net profit margin** down (19.1%) (1.3%) 5.6% 6.9% ROA (PBT) down (28.4%) (1.6%) 4.0% 5.6% ROA (NP) down (24.6%) (1.0%) 3.1% 4.2%
Table 1.1: SA Post Office Financial performance for 2009/10 (SAPO, 2011)
Former SAPO COO John Wentzel remarked that “The core business of the South African Post
Office, mail, showed a volume decline for the second consecutive year”. The South African
Post Office must comply with all international commitments to which the Government of South
Africa has bound itself or may bind itself in the future regarding postal services. It must also
exercise its rights and powers and perform its duties and obligations under the license, in a
manner that is consistent with any other international commitment to which South Africa is party
to. The information in Table 1.1 is a clear indication of the performance challenges faced by the
business of the organization attributable to both internal and external significant factors.
Consistency and continuous improvement on processes and operations are some of key areas that
need urgent improvement in order for the business to comply, survive and even grow profitably.
1.3 Aim
The aim of this project is to research on the improvements of quality and performance
management in the South African postal services. It seeks to identify and eradicate key
challenges that hamper the organization’s success.

4
1.4 Objectives and Scope
The objectives of the study are:
To determine the extent of quality and continuous improvement in the South African
Postal Services.
To identify challenges in the implementation of ISO and other related projects in SAPO.
To critically review approaches and methods used towards quality.
To recommend general improvement techniques and approaches that can be useful when
ISO and other projects are to be implemented successfully.
The study was limited to the above objectives focusing on the South African Postal Services. It
was focused on Securemail and Capemail, two (amongst others) of the organization’s Business
Units where strategic projects are being pursued, all relevant levels were involved in the study
including management, supervisors, controllers and personnel at the lower level. The main areas
of research were quality management, performance management, continuous improvement, ISO
9001:2008 and project management approaches. Both Capemail and Securemail are divisions
within SAPO that are fully committed to providing excellent service in the Mail Business
market, this is demonstrated by the ongoing progress on the implementation of ISO 9001:2008,
Total Operations Management Solutions (TOMS), Productivity reengineering, Change
Management, and other projects aimed at establishing and maintaining consistency in operations
while benchmarking with competitors in the communications sector on continuous improvement
programs and models.
SAPO is simply described by customers as an organization that takes mail from one point to the
other; internally SAPO is essentially viewed as an organization that involves 7 “end to end”
processes that are linked from the stage of acknowledging a valued product from the client to
ensuring that it reaches a desired destination successfully. ISO 9001:2008 requirements fulfill the
objectives of the both the divisions and all activities within SAPO, commitment starts from
customers’ interaction in retail outlets where mail is accepted and where customers’
requirements are identified and escalated to management for review and improvements, ISO is
further integrated and implemented in transport, revenue protection, mail processing and delivery

5
management operations including other support functions in the company. This study revealed
how imperative it is for continued customer satisfaction that the above mentioned activities be all
linked as a value chain that entails planning, quality, process management, communication,
customer involvement, and all other ISO requirements.
1.5 Summary of Chapters
This section of work presents the summary of the whole research in a structure of chapters
Chapter 2 Literature Review
This chapter detailed reviews from a variety of sources; it provided critical discussions on the
concept of quality management in general, how it has been applied across different industries,
the downfalls and opportunities of it including ISO and continuous improvement approaches to
total quality management. Performance management was also critically reviewed on how it has
been applied, managed properly and improved in the service industry. Both these concepts were
reviewed and related to the environment of postal services.
Chapter 3 Methodology
The methodology chapter critically analyzed and discussed the research methods that were
utilized to achieve the purpose and objectives of the study. The tools that were employed for the
study, its limitation and how they were countered have also been highlighted in this chapter.
Chapter 4 Case Study - The South African Postal Services
The discussion of the background of SA Post Office, the structure of processes, the manner in
which activities are carried out and linked as a value chain, the culture of the organization and
the performance of the business in relation to its industry were provided in this chapter. A
detailed discussion of the macro environmental analysis was also revealed.

6
Chapter 5 Results and Discussions
A detailed analyses and discussions of research results obtained from data that were collected in
conjunction with the research question were elaborated on this chapter. Recommendations were
also made for improvements and future studies to be conducted related to the subject in question.
Chapter 6 Conclusions
This chapter concluded the entire research project; discussions were provided indicating how the
objectives of the study were achieved and pinpointing some of the important results.

7
CHAPTER 2
LITERATURE REVIEW
A literature review is a “critical analysis of a segment of a published body of knowledge through
summary, classification, and comparison of prior research studies, reviews of literature, and
theoretical articles” (University of Wisconsin Writing Center; 2010).
Quality and performance management go beyond organizational capacity; the concepts are best
comprehended and appreciated when described in financial language and assimilate political,
economic, technological, operational and environmental disciplines.
2.1 Quality Quality as an organizational concept has been perceived to having many forms resulting to
different interpretations industry wide; the term has remained easily misunderstood although it is
a widespread phenomenon that critically needs to be understood in order to be improved for
business success, growth and competitiveness (Dale, Van der Wiele & Van Iwaarden, 2009:18).
The definition of quality must be such that it can be assessed and measured (Sower, 2011:5).
Evans and Lindsay (2008:12) suggest that there is no documented agreement throughout
available literatures on a universal definition of quality. It is therefore important that
organizations explore and appreciate quality across all disciplines and functions for business to
achieve high customer satisfaction and growth.
2.1.1.1 Approaches to quality According to Soltani, Lai, Javadeen and Gholipour (2008) the concept and definition of quality
remains broad and complex due to its changing nature of applicability and approaches in the last
five decades; to date some aspects of total quality management has proven to be beneficial but
few practitioners and academics can describe precisely what is meant by the term quality. While
the concept of quality remains unclearly defined, Soltani et al (2008) point out from number of
sources that its objectives are to meet and exceed customer expectations, to optimize

8
performance resulting to high competitiveness; they further discuss the definitions referred from
Dr Garvin below:
o The Transcendent Approach
Sower and Fair’s (2005:8) perception on the transcendent approach is that when quality is to be
considered, this approach proves to be the fundamentally most important one, particularly across
quality of breakthrough products and service design aspects. Constructs such as quality are
highly acknowledged by Philosophers that consider beauty to be logically primitive, it is fully
comprehended only after a person has been exposed to a number of objects displaying its
characteristics; that is for instance one customer may possibly say that their customer experience
was of better quality than the other but will not be able to clearly explain why. Schneider and
White (2004:10) however disapprove this view and further argue that from a research point of
view this approach proves to be useless mainly because quality cannot be understandable and
reliably measured from a philosophical context. Evans and Lindsay (2008:13) also point out their
belief that it cannot be significantly assumed and expected that managers or customers will
immediately know quality when they see it and that the definition is of little value to managers in
the industry. While quality offers a variety of measurable criteria such as criteria to excellence,
costs of quality and others; the transcendent approach provides no blueprint as to how quality
will be measured and controlled making it rather challenging to define this approach at
functional level while not much evidence exist on its practices in the industry.
o The product Based Approach
While it has been regarded as practical, the approach also consist of a number of challenges that
may not be appreciated by firms, some include the fact that improving quality resulting to
incurring additional costs; may be at times the only way given the saying that there is cost to
quality. It is very often that you find that quality is mistakenly considered and related to pricing.
Many have drawn assumptions that products or services of higher prices contain higher quality
(Evans & Lindsay, 2008:13). The product based approach emphasize quality as a measurable
construct as opposed to the transcended approach and authors indicate that product quality would
be fully defined if all related attributes were considered important during design and review.

9
o The user based approach
This approach simply means that products and services are regarded as having best quality when
end users consider them to best satisfy their needs. Schneider & White (2004:10) argue that
although product or service quality is considered high when customers say it is, this does not
imply that it conforms to technical criteria. Peters (1999:6) gives his opinion that to a great
extent, quality is indeed what the customer declares it is; he also strongly recommends that it is
essential that businesses define quality in the same way customers would and that quality as
regarded by customers is most important. A number of reviews conducted towards the end of
1980s have argued and emphasized that quality is of satisfactory standards on either products or
services when the customer’s expectations have been met or exceeded therefore customers have
to ultimately define quality. Hsieh, Rai, Petter and Zhang (2012:1066) remarked that an
increasing number of firms have resorted to implementing customer relationship management
systems in order to attain improved employee service quality and customer satisfaction.
With above discussions emerge interesting quality theories; there are particularly two questions
that emerge when considering this phenomenon; the first being whether or not its practical to
consider all varying individual preferences of customers and combine them to innovate one
meaningful definition of quality that will suit everyone (Kasper et al., 2006:178). A second
question of interest that needs to be considered is how customer’s continually changing priorities
and perceptions over time are to be coped and dealt efficiently with. The firm’s solution to the
first question named practicality can be determined by assuming that the best quality products
will only be those that satisfy the needs of the majority of consumers. . The second referring to
how consumer’s continual changing needs will always be satisfied can be approached better
when organizations regularly undertake to conduct their market research and align it with
innovation.
Considering the shortcomings discussed about the user-based approach, it is important to draw
conclusions from both arguments of the approaches’ shortfalls and benefits that the customer is
indeed the person who ultimately defines quality.

10
o The manufacturing-based approach
This approach provides product specifications therefore enabling simplicity on the identification
of variations by measuring quality throughout design of the product or service. In comparison to
the product based approach, this approach focus more on the quality of the product or service
during processing stages and provides opportunities and measures to viewing it from the
customer experience so as to reduce any unwanted outcomes for the final product. Its discussions
are related to concept design whereas the arguments and definitions of product based approach
focus on delivered product or service however both are significantly important to quality.
o The value based approach
Value based by definition is the degree of excellence achieved at acceptable price having taken
control of deviations at an acceptable cost. Hanna & Newman (2001) point out that according to
Juran (2002), for quality improvement to be understood, it should be communicated to
management in a financial language. Juran believes that costs to quality are measurable and that
quality improvement projects represent investment opportunities. Although this approach is not
sufficient alone to defining quality, it is yet a critical element to be considered in the overall
improvements of quality because consumers are willing to pay for a service if they view its value
as being higher than that of the available service itself; they make their own personal judgments
based on their different self criteria and they know if the price is worthy of the service they
receive.
The concept of quality expands beyond theoretical literature; although the quality guru’s
originate from the USA, the practice of quality became popular in the manufacturing industries
during the early 19th century where Japanese used it to rebuild their industry after World War II
and later was adapted to service fields. According to Foster (2004:67) America has given birth to
modern quality management while Oakland (2003:18) points out that success in Japanese
manufacturing was significantly contributed by American quality gurus. It has grown and has
been appreciated with a number of models, concepts and systems emerging such as total quality
management, criteria for excellence, ISO, statistical quality techniques and others that have
constantly improved product and service efficiency.

11
2.1.2 ISO 9001: 2008 QMS as the concept of Quality Management 2.1.2.1 The concept of ISO
The ISO 9001 quality management system standard, proposed by the International Organization
for Standardization (ISO) in 1987, is recognized as a representative of the first international
scheme for developing a quality management system. The standard’s main objective is to
advocate requirements for a quality management system for organizations that want to
demonstrate their ability to offer high-quality products consistently and increase customer
satisfaction (ISO, 2008). European manufacturers were the first to use the standards when
requesting that their suppliers follow these requirements and then obtain the corresponding
certification. With time the standards became applicable throughout the whole world as the most
commonly used set of quality management standards (Halloran, 2008). With the aim of
broadening the standard’s scope, it was revised in 2000 to follow a “process approach” and to
become an industry wide standard. The revision of the standard took place again in 2008 where
the focus was altered onto the organization’s processes and the linkages and interactions between
them.
ISO 9001:2008 is a Quality Management System (QMS) standard which forms part of the ISO
9000 series of standards. The ISO 9000 series are a set of generic standards that state the
requirements for an acceptable QMS in any applicable environment. The standards are of two
categories namely conformance and guidance. Figure 2.1 shows the structure of ISO 9000
standards.
ISO 9001 has demonstrated its success through acceptance and use of the standard by over 100
member countries world-wide; the standard provides empirical benefits such as acquiring
business with European countries; recognition by international community, better marketing
edge, improvement in quality and productivity, improved risk management, Legal compliance
and many others.

12
Guidance Standards Conformance standards
Figure 2.1: The structure of ISO 9000 series of standards (http://www.iso.org)
The standard comprises of eight principles which are together focused on strategic business
growth as shown in Figure 2.2:
1. Customer Focus 2. Leadership 3. Involvement of people Customer 4. Process approach Customer Requirements 5. Systematic approach to management Satisfaction 6. Factual approach to decision making 7. Mutually beneficial supplier relations 8. Continuous improvement Figure 2.2: The eight principles of ISO 9001:2008 (http://www.iso.org)
Above principles have been established by ISO as the guidelines towards the direction of total
quality management by organization that wish to gain growth in business through quality efforts.
All principles are clearly outlined and geared towards satisfaction of customer requirements; it is
realized that the sequence set by ISO may be important if the organization is to review its current
status quo for change because a step by step approach towards implementation will link all the
aspects involved in a defined order. For instance, continuous improvement cannot be effectively
fulfilled if all other principles have been put to practice.
Selection and use of the Standards
under ISO 9000 series
ISO 9000
ISO 9004 (-1, -2, -3, -4, -5, -7)
ISO 9001
ISO 9002
ISO 9003

13
2.1.2.2 Discussions and arguments from previous ISO surveys
Initial empirical surveys and case studies on development and implementation of ISO standards
(Boulter & Bendell, 2002; Martinez-Costa & Martinez-Lorente, 2003); have shown a real
improvement in the quality management systems of certified organizations. Companies are
helped by the standard in reorganizing their procedures and improving documentation and
efficiency of their quality systems (Magd & Curry, 2003). Martinez-Costa & Martinez-Lorente,
(2003) also note that with the use of ISO 9001:2000 audits as a tool for identifying weaknesses
in existing systems, and applying the plan-do-check-act principles, corrective actions are
identified and implemented. Quality has clearly emerged as a strategic competitive tool for
organization success in the manufacturing, service and government industries (Ruževičius,
2006). It is of great importance in today’s business environment that organizations do not ignore
the strategic implications of quality for their competitive position. Lee et al. (2003) made an
analysis on the implementation and performance results of ISO 9001:2008 in service
organizations and remarked that managers in organizations should realize that ISO 9001 is
capable of generating a competitive advantage only if top management is fully committed to the
program implementation from a strategic perspective. Merino-Diaz de Cerio (2003) also
concluded from a survey of Spanish firms that a significant relationship existed between the level
of implementation of quality management practices and improvement in operational performance
in terms of cost, quality and flexibility. ISO 9001 certification on its own does not guarantee a
competitive edge; there should be adherence to the standard in the firm through an external
coordination with suppliers and customers and integration with existing practices of the company
(Naveh and Marcus, 2005).
2.1.2.3. ISO 9001:2008 and organizational profits It is almost a common believe in many organizations by management that for high quality to be
achieved, there must be a lot of expenditure on resources and that costs will consequently be
increased. Lately, various studies have confirmed that ISO 9000 certification is too expensive,
time consuming, resource-consuming, formalized and impersonal and that the implementation
costs are greater than the benefits (Kaziliūnas, 2010). Literature has proven that with the
implementation of ISO 9001:2008 and commitment towards the QMS across all spheres of any

14
organizations, costs are significantly reduced and profits are realized leading to short – long term
business growth. In practice an effort to improve the quality of product and process designs and
to control processing effectively leads to fewer defective items, less scrap, reduced repairs, less
rework, fewer customer returns and lower allowances for blemished merchandise. Kaziliūnas
(2010) further review a number of authors’ work and observed the impact of ISO 9001
certification on business performance in the long term; the study that he reviewed focused on
comparing monthly stock returns, particularly the variability between those ISO 9001 certified
versus non-ISO 9001 certified firms that traded on the Istanbul Stock Exchange from January
1997 to September 2005. Drawing on annual two-year, three-year, four-year averages of monthly
stock returns, the results indicated that ISO 9001 certified firms generally had higher returns and
lower variability of returns than non-ISO 9001 certified firms. The control of quality as stated
and enhanced by ISO means that the output of any product or service shall be satisfactory in the
eyes of the customer at the first time without scrap or rework. Customer satisfaction achieved via
high quality systems and products ultimately lead to increased profits and long term business
growth.
2.1.2.4 Contributions of ISO on process improvements and customer satisfaction A Process can be defined as a series of activities connected to each other functionally, in order to
accomplish particular objective(s). ‘Process’ under ISO refers to a set of interrelated and
interacting activities that transform inputs into outputs. ISO 9001:2008 mandates an organization
to identify the processes needed for quality management and their application throughout the
organization. Furthermore, there are many clauses in the ISO 9001:2008 standards pertaining to
process management (viz., documentation requirements—4.2, control of documents—4.2.3,
design and development—7.3). These clauses best describe the essentiality of quality process
management. Figure 2.3 is a model of process based QMS to demonstrate how activities that are
well managed as processes have a connection to continued customer satisfaction.
This model reveals how management is responsible for ensuring communication with customers
both internally and externally. Communication may take place through product surveys, review
meetings and any other applicable form. Furthermore it is realized that the role of management

15
also involves ensuring that resources are available at all times so as the final product can be
achieved successfully at all times.
Figure 2.3: Model of a process based QMS (http://www.iso.org)
In practice this model identifies an organization as a cyclic system that consists of Management
responsibility; Resource management; product realization and measurement analysis and
improvement. The requirements of customers are identified and integrated to the product
realization stage; customers are also involved in measuring and improving the product leading to
continued satisfaction (http://www.iso.org).
Dr Joseph M. Juran (2002) also emphasized the importance of adapting continuous improvement
in the process by developing a Quality trilogy that was broken down into three elements namely:
quality planning, quality improvement and quality control (Charantimath, 2003:18). He states
further that management is more likely to buy into quality improvement when it is presented in a
financial language, quality projects should represent investment opportunities. It is important to
follow an approach that will reduce costs, increase customer service, product reliability and
optimize activities when projects are being implemented particularly those that effect changes on
processes.

16
2.1.3 Continuous Improvement in service organizations Continuous improvement is a sustainable journey that only an organization fully committed to
the challenges ahead shall embark unto; Phillip Crosby emphasize that to cause quality
improvement, the environment where transactions are always completed correctly each time,
where employees, suppliers and customers relationships are successful must be deliberately
created and continuously maintained (Foster:2004) . Continuous Improvement also often referred
in the industry by the Japanese word ‘Kaizen’; Kaizen refers to a progressive approach to
implementing change in the organization and it covers all functions and processes of the
organization. Young (2011:457) remarks that continuous improvement has been emphasized by
quality gurus that although the actual changes may be effected to technical processes; very often
the changes are applied on the behavior of human patterns therefore it becomes important that
active participation of those to be affected be encouraged while considering experts that will
effectively handle the dynamics of human behavior particularly when faced with change.
Continual Improvement starts with management and under their leadership works down through
the organization. Burge (2009:41) reveals challenges typically experienced by any organization
on its continuous improvement journey as follows.
o Customer Services: Where products and services have to always be provided on time as
promised to clients, furthermore striving to improve customer satisfaction through enhancing
product and service quality by means of benchmarking with competitors and conducting
customer feedback surveys.
o Performance excellence: A strong need to reducing process cycle times on operations by
removing unproductive activities and maximizing productivity across all functions involved
within the business; coordinating all organizational activities into a single manageable value
chain comprising of activities related to organizational quality objectives.
o Relationships: Good client relationships create customer loyalty, by establishing and
maintaining personal and friendly relationships. Mutually beneficial relationships with clients
can only be ensured if service quality goes beyond satisfaction; innovative teams need to
continually work over the edge to offer the best in the industry.

17
o Work Environment: An environment where employee training is optimized and where ethical
behavior will be encouraged must be enhanced, this will increase involvement and do away
with the negative stigma and error rates on operations will automatically be reduced.
o Opportunistic growth: Quality projects should be communicated in sales and profits
language, employees must be exposed to the impact their contribution will make in the
organization and opportunities must be identified and exploited in alignment to the growth of
the business.
Consolidating these challenges into one language and regarding them as opportunities rather will
bring a methodology that will change the business into a profitable organization where the
products and services offered will respond to the needs of customers, customer expectations and
customer requirements.
2.1.3.1 The Just in Time Philosophy
Just in time has always been perceived as a concept related to manufacturing firms only, Chan,
Yin and Chan (2010:6295) indicated that while JIT has been generally perceived as a production
philosophy aimed at achieving production targets at lowest inventory rates, it also significantly
carried with it three strong principles of waste elimination, continuous quality improvement and
total involvement of employees in production planning efforts. It is clear from the above that
research has been slower in shifting the concept of JIT beyond the manufacturing case; however
Gupta (2011:2216) argues that the majority that consider JIT as an inventory reduction system do
not regard it as applicable to service operations; JIT reach beyond reduced inventory levels
because it streamlines operations, eliminates wastefulness, it speedily responds and
accommodates changes in demand, encourages network integrations and faster changeovers
therefore resulting to accelerated product or service provision at reduced costs and more choice.
Alshbiel and Al-Awaqleh (2012) pointed out that the main objectives of implementing JIT are
remodeling firm structures, reducing preparation lead time, enhancing employee skills and
flexibility and total quality control; they further recommend that although JIT is a production
system, decision makers need to implement it due to its cost reduction, production quality and
financial performance benefits. A number of techniques and concepts that were developed for the
manufacturing environment have been successfully altered to benefit service firms. Gupta

18
(2012:2214) reveals some of the techniques that were introduced to service firms, they include
amongst others Quality Function Deployment (QFD), Statistical Process Control, Just In Time,
and Quality Circles all originated in manufacturing and then were adopted by some researchers
to fit service organizations. JIT concepts are generically process oriented and summarized by
Benson (1986), as follows:
total visibility – of equipment, people, material and processes;
synchronization and balance – of production to sales and supply to production;
respect for people – line operators are responsible for production, problem solving and
improvement;
flexibility – adapt production to customer needs;
continuous improvement – never satisfied with the process;
responsibility for the operation’s environment – those who design, manage and operate the
processes are responsible for the outcome;
holistic approach – company-wide philosophy of elimination of waste.
1. total visibility-It is evident that organizations can successfully integrate JIT projects into its
operations without failure if management were to be fully committed; visibility should be
encouraged to all employees including customers on all processes involved in the business,
this will improve the level of involvement where one function will know the contributions of
all other functions towards the final delivery of service. Visibility also eliminates isolation on
structures where every departmental manager has to look for their own cost center and
teamwork is consequently increased.
2. synchronization and balance- Matching output with customer demand helps optimizing
reliability towards customers; a good example where SA Post Office can implement a system
of communication both with internal and external customers where bulk mailers such as
Home Choice and Unisa provide pre-volume stats a day or two before the mail is handed to
the Post Office, this will allow for better preparations of stock in terms of mini-tainers, roll-

19
tainers, trays and all necessary containers including scheduling trucks in advance for
forecasted volumes to avoid unnecessary delays due to capacity constraints. This will
significantly reduce the operations lead time and customers will receive their items on time.
3. Flexibility-Aranda, Bustinza and Molina (2011:1849) pointed out that firms are compelled to
optimize their reaction capabilities to variable contingencies and situations particularly
regarding service quality improvements due to fast changing environments and new market
patterns. SAPO’s resources both capital and human need to be set such that the timing and
quantities are optimized to meet variable business requirements; working hours need to be
adjusted accordingly during high peak volumes and machinery need to be able to adjust to
accommodate the situations.
4. continuous improvement- An environment where people’s attitudes are positive should be
instilled at all times; employees need to feel as process owners and must never be satisfied
with the current operation but always strive for even better or ideal situations, they are the
first people to be empowered to recognize and do away with wasteful activities and resources
and identify small but effective improvements in processes.
5. holistic approach to elimination of waste- The JIT philosophy has to be adopted organization
wide if it is to be successfully implemented; inventory and purchasing functions will be
optimized therefore eliminating waste, a function called Supply Chain Management be
centralized to avoid duplicate transactions. Once centralized waste can be reduced through a
number of ways from dealing with only a few and nearby reliable suppliers who will ensure
that resources are available exactly on time when required, getting frequent deliveries on
stock in smaller or precise quantities, assisting suppliers to meet quality requirements by
constant involvement and communication and ensuring accurate distribution and logistics by
optimizing routes and reducing storage space.
6. respect for people- Customers are expected to directly be involved in the JIT approach and it
is therefore important that employees respect the work procedures and instruction by doing
exactly what is expected of them, this will ensure on time delivery and collection of mail to
and from customers. Operational personnel can express high regards to their work only if
leaders afford them respect likewise, where necessary personnel must be developed and must
be empowered by all means to convey that management trust and believe in them.

20
JIT pays attention to the process not the product, this concept is applicable to any cluster of
processes whether manufacturing or service. Service firms need to view JIT from a
manufacturing perspective and implement the practice into service; this can be attained through
extensive planning and service analysis where activities are assessed and priorities allocated in
terms of deliverables and project milestones while ensuring that resources required to carry out
activities are immediately accessible through JIT based systems.
2.1.3.2 Value Engineering
Ren Jie, Zhang Xiao-hua (2008) suggests that research on the effects of Value Engineering
showed that Value Engineering can enhance the interaction between technical and economic,
hard and soft technology; it assist in increasing economic performance value and helps to
improve management functions in enterprises. Value Engineering involve the use of multi-
disciplined teams to systematically apply methods that will determine the purpose and function
of a service or product, therefore establish its worth and bring forth alternatives of most needed
functions that are reliable and lowest in overall costs through their innovative thinking.
A Case of SA Post Office is used as a review example since the concept is object oriented and
not many applicable reviews were found. The SA Post Office comprise of seven end to end
processes, these processes are governed by ten business units or departments, each business unit
consist of a structure that will have managers and the managers are responsible for their own cost
centers and budgets accordingly. Projects are continuously being implemented in the
organization but there is a continuous challenge that only a few are completed successfully and
among the few only a handful achieves the maximum profit value. Some projects are
implemented nationally while most are implemented within the business units; projects driven in
the business units are dependent of the unit’s available budget derived from responsible
manager’s budget, this has created an environment of isolation where those implementing
projects are responsible for their own funds leading to poorly coordinated projects due to lack of
financial and operational support in the organization.

21
Figure 2.4 below is the model of value and systems engineering that can be adopted as a
guideline in SAPO environment when strategic projects are being implemented. Patanakul and
Shenhar (2009:342) discuss that the Society of American Value Engineers (SAVE) and the
European Governing Board of the value management training and certification system (EGB)
suggested “value” be defined as the relationship between the fulfillment of a need and the
resources invested to achieve it.
Figure 2.4: Program value and the systems engineering process in the life cycle. Adapted from Blanchard (2004).
Value can therefore be described at organizational level as a ratio of quality & cost, function &
cost, worth & cost, performance & resources, satisfaction of needs & use of resources, and
benefit & investment [Thiry, 2004b]. SAPO has vehicles both that are used across all regions
nationwide, these vehicles commercial and non-commercial and they are all leased from
companies such as Avis and Fleet Africa. The value of this fleet is not carefully handled because
currently there are contracts and agreements in place for these vehicles with suppliers; all of this
fleet has contracted kilometers per month where SAPO makes payments according to contracted

22
Kilometers. Value on fleet used need to be reengineered since a lot of kilometers are
underutilized while the costs remains the same regardless; furthermore when a specific fleet has
been over utilized there are penalties involved. A cost benefit analysis project need be
implemented where a need for purchasing and administering fleet that will be owned by the
organization may be a recommendation or review on the current agreements with suppliers.
Value engineering can also be a useful technique to reassess the amounts of expenditures
incurred by SAPO for outsourcing our core resources such as envelopes, mail bags, trays and
stamps from external firms instead of establishing a division internally that will manufacture and
maintain these resources including systems used in the company.
2.1.4 Quality in the Services industry Service quality has become a considerably significant aspect in the modern industrial experience;
it plays an imperative role to the industry in general whether service, manufacturing or
processing because even manufacturing firms at times find providing a service to their clients
somehow an activity integrated into their operation. Parasuraman and Ziethaml referred to as PZ
(2006) point out that the achievement of quality in products and services should be viewed as a
prerogative concern of the 20th century because while quality in physical goods is described,
measured and represented by those in the fields of marketing; service quality was poorly defined
and not researched. Due to competitiveness, continued customer satisfaction, survival and
growth of businesses; academics and industrialists acknowledged the importance of regarding
service as a measurable concept that can be viewed from the language of quality for continued
improvement. PZ (2006) define service quality as “the degree and direction of discrepancy
between customers’ service perceptions and expectations”, this implies that if a customer rates
the service superior than initially expected then it is said to be of high quality and likewise if the
expectation is higher than the actual perception, quality is of low standards. Furthermore the
ultimate perception of service quality lies with the customer and it is he who determines the level
of satisfaction (Hashim; Zaleha; Rasid and Ismail, 2011). Sichtmanm, Selansisky and
Diamantopoulos (2011:2) noted that superior service quality in firms engaging business with
international markets have been highly pronounced as a competitive advantage achievable
through maintaining quality management practices which result to service quality that exceed

23
that of competitors in foreign markets. La, Patterson and Styles (2009) remarked that
intangibility on service mean that there is no possibility that customer can inspect or evaluate the
service before purchase; therefore service quality evaluation can only happen during service
encounter. Li (2011:81-82) argue that service quality has the advantage of being difficult to
imitate as compared to product quality and price; that service quality was earlier described under
expectations versus performance gaps based on customers perceptions but later criticized due to
reliability and discriminant validity on its computational measure scores, however a
compromising approach of identifying specific aspects of service quality as antecedents to
overall service quality by combining expectations and perceptions into one measure was
observed as effective and practical. Li (2011:82) also identifies and briefly discussed drivers for
service quality below:
o Reliability- Implies consistency of performance and dependability; customers would measure
this dimension when they enter the premises of the service provider with expectations that have
been created by the service provider. Reliability will be affirmed when the promised service is
carried out with utmost accuracy.
o Assurance- Refers to service quality guarantee provided to customers by businesses through
knowledgeable personnel who demonstrate courtesy, professionalism, inspiration, trust and
confidence during service provision.
o Empathy- When the service provider demonstrates individualized attention, caring, and positive
attitude.
o Responsiveness- Willingness to help customers and prompt response to service without
instruction and force.
o Tangibles- All those physical attributes displayed by the appearance of facilities, equipment
personnel and other materials
Based on above dimensions, Lee, Chu and Chao (2011:1129) point out in reference to the
SERVQUAL model by PZB (1988) that studies revealed the tangible measure to be unnecessary
while other authors in the same study established a correlation between responsiveness and
assurance thus allowing for the constructs to be merged. Yavas (2000:41) concluded that service
quality is the source of customer satisfaction and that it would be a great mistake to design only

24
certain strategies in overcoming certain negative aspects of service quality as perceived by
customers. He was measuring service quality in Turkish Postal Services and indicates that
although improving tangible related dimensions due to increased customer complaints on poor
postal facilities would result to reduced complaints; it would not necessarily result to increased
customer satisfaction unless if the service itself provided is of high quality. Lee, et al.
(2011:1130) regard relationship quality as lucrative to making successful business deals; it also
builds trust and mutual familiarity between service firms and customers. They further remark
that good relationship quality practices lead to predictable customer reactions and sustain long-
term customer relationships rather than short-term transaction based ones. Nuviala, Cruses,
Turpin and Nuviala (2012:95) argue that although recent studies regarded certain facets of
employee to customer social interaction less significant; research does reveal tangible elements
of facilities as main determinants of perceived service quality including behavior and personnel
skills. It is therefore important to consider service quality dimensions holistically and consider
all aspects of concern equally imperative. Nuviala, et al. further discuss an additional variable to
the SERVQUAL model to be considered, they identify perceived value as an important factor in
the middle therefore bringing a balance between service quality and customer satisfaction since it
is affected by both; perceived value further influences the future intentions of customers. With
perceived value as an additional variable, three constructs being quality, satisfaction and value
are identified and discussed to have a purposeful influence towards the behavior and loyalty of
customers to the service of the business. By a typical description, value refers to the monetary
related worth of any product or service; It is therefore important that service providers view the
process from a customers’ point in determining whether the actual experienced service fits the
monetary value attached to it. Considering the three variables identified, discussions have been
made on whether or not there is a relationship between them and if tools could be available to
measure their extent and individual level of significance towards the final outcome of service
quality. While a few authors consider quality to be a determinant and influential factor to
satisfaction, others conclude that customer satisfaction should be regarded as an antecedent to
service quality. Zeithaml and Bitner (2008) argue that a significant distinction exist between
customer satisfaction and service quality; they further point out that satisfaction is an extensive
concept and service quality should only be regarded as a component to satisfaction when a
framework of satisfaction is developed.

25
Figure 2.5 below is a model by PZB (2006) based on SERVQUAL; this model has been further
developed from the original service quality gaps and was identified to measure between
customer expected and perceived service. It identifies and discusses four gaps named ‘The four
provider gaps’ below:
Gap 1: The gap said to occur when what customers actually expect is not the same as what
management think customers expect.
Gap 2: This gap exists when service standards of customers are not correlated to management’s
findings on customer expectations.
Gap 3: This refers to when the actual service performance does not meet performance standards
that have been set.
Gap 4: The gap is formed when the actual service performance of the firm does not match with
what the firm communicates externally about its service quality.
Gap 5: Refers to the gap between the service perception of a customer and the customer’s
expectation of the service.
The service quality gaps model becomes effectively useful when service providers continually
put measures to assess the extent of what they offer against what customers entirely regard what
they actually offer; to achieve this there is a serious need for firms to strengthen their marketing
research, encourage interactive horizontal communications both internally and externally by
removing structural barriers and constantly engaging with customers. Furthermore emphasize
commitment to quality programs by setting standards and goals of service quality, therefore
providing training and workshops and ensuring roles are clearly defined and teamwork strongly
maintained. Performance reviews should always be done through transactional surveys, brief
questionnaires, customer complaints analysis and other methods.
Having gone through the SERVQUAL literature and reviewing both theoretical and empirical
discussions; one can clearly establish that there are a number of loopholes on this field that needs
extended intensive research. Many authors seem to have expressed their views and arguments
that are well expressed but only a few have based these arguments from empirical data; those
that have explored empirically have also questioned service quality from limited angles,

26
Figure 2.5 Gap Model of Service Quality (PZB, 2006)
that is they have decided to use only certain measures for study while rejecting others without
proper justification or elaboration on the criterion used. Depending on the size and nature of the
business, service providers will attain best results if they define and customize tools to measure
and improve service quality in accordance to their organizations since literature doesn’t clearly
offer a comprehensive set of guidelines and there is also a wide variety of services industry wide.
2.1.5 Postal Services
The following section reviews papers and discussions from different literatures related to postal
services; their performance from an operational and financial perspective is revealed including
factors related to quality.
The postal business as a service provider consists a number of divisions offering variety of
services to clients; from a South African perspective, services found in the postal market include
and are limited to Mail Business, Consumer Service, Logistics, Banking and Financial Services.
According to SAPO annual report (2010:27) mail business contributed 69% of the group’s total

27
revenue; but uncertain markets influenced by increasing demands of digitalized options have
resulted to a progressive decline on mail volumes as a new reality (Accenture Research, 2011:1).
Mail business in this regard finds itself as the backbone of the postal services and needs to device
newly diversified strategies for survival, sustainability and growth.
2.1.5.1 The performance of Postal Organizations According to Ngunyen (2008:9) National Postal Organizations (referred hereafter as NPO) are
facing serious problems both internally and externally, internally NPO are challenged by
network constraints that may be characterized by cross accessibility, traffic peaks, and others
while also troubled with monopolistic dynamics characterized by issues such as poor
productivity, poor quality of service and others; externally NPO face serious problems of
existing substitute competition and newly emerging powerful competitors. Beko and Jagric
(2011:1125) also discuss that although NPO have the monopoly and state control advantage, the
current changes of mail deregulation and network complications are exposing the industry with
competitive pressures. Furthermore Beko and Jagric (2011:1127) while exploring factors
affecting demand for direct mail and direct mail delivery services in Slovenia, they look into
socio-economic demand factors and quality components demand factors and conclude that the
direct mail market faces competition with the total number of deliveries rising in the direct mail
market as opposed to the performance of real retail revenue. Direct mail marketing is a service
offered by postal organizations in both electronic and hard forms, this service is used by bulk
mailers to advertise to existing clients and further gain new customers on the market. In sourcing
new clients, bulk mailers engage NPO for procuring client profile databases (since NPO already
have them for address purposes) therefore communicate to customers by marketing their
products through electronic form such as multimedia messages, text messages, emails, etcetera
and also in hard letter format via registered letters, catalogues, pamphlets and others. NPO are
exposed to competitive pressures that are influenced by emergent technological opportunities
taken by industry competitors; it is therefore important that NPO detach the public government
driven enterprise stigma and start proactively engaging the economies for potential opportunities.
NERA consulting research (2004:9) point out that there is stagnancy in quantities of traditional
mail in a couple of European member states however opportunities also largely present
themselves in diversified non-universal markets of express and logistics services.

28
The postal service sector consists of a volatile market and electronic communications media have
imposed new problems in the postal markets threatening to do away with the industry. There is a
significant replacement of traditional mail by email, text and a whole other lot of messaging
methods of direct prompt communication (Independent Communications Authority of South
Africa also referred to as ICASA, 2010:27). ICASA (2010) further reports from its research
findings that postal operators are obliged to come up with innovative methods of providing
services to businesses and public at large; this means the postal industry has to overcome the
competitive challenges faced considering that a huge percentage of businesses have followed
latest technological forms ranging from electronic invoice systems, acceptance of electronic
payments, bills, notifications as replacements from traditional mailing and these are a huge
margin of postal volumes’ bulk.
Figure 2.6: Percentage growth in domestic letter mail volumes (ICASA, 2010:28)
Figure 2.6 above is a reflection of ICASA’s (2010:28) graphic comparison on international
trends in postal services where a number of countries were considered to be assessed on how
their mail volumes are performing for a period of two years. The selected countries come from
varying continents across the world, this allow for a more detailed trends to be observed since
variables such as level of economic development, geographic size, population, political agenda
and environmental state differ per country. The analysis indicates that there is a significant
decline on mail volumes particularly in a country such as Uganda for the selected period;
although there are specific factors that could have influenced the drop, the mail market is

29
generally not doing good since the percentage of decline is stronger than growth across these
countries. It is also demonstrated that there is opportunity for growth on emerging countries like
Brazil and Malaysia including South Africa; these countries have to effectively respond to
technological opportunities faced by traditional mail.
Based on their findings, Accenture Research, (2011:3) identify the critical trends in relation to
high performance in the postal market:
o Diversification- This refers to extending the revenue streams by expanding the postal
operator’s reach on products and services, the use of existing networks to further diversify
into other newer businesses including logistics and parcel services. Opportunities on
diversification can also be explored geographically by entering into new areas and
discovering new opportunities such as specialized cold storages.
o Digitalization- The adoption of opportunities in communications technology so as to offer
customers a variety of services such as digital mail and e-commerce solutions while
providing for the population that still have preference to traditional mail. German Deutsche
Post (DHL) has already launched its digital mail service named E-Postbrief and it has crossed
one million users benchmark.
o Service provider strategy- The use of relevant postal models to successfully implement
strategy, the ability to assess the markets for potential losses and gains and maintain
consistency in revenue growth and strong performance against unforeseen economic
circumstances such as global downturns.
o Cost Management- Maintaining efficiency and consciousness on cost management to attain
sustainability of business; focusing on areas such as employee costs, operational costs;
supply chain costs and process or asset reengineering. With unstable economic fluctuations,
customers shift to products and services that are convenient, speedy and cost effective
therefore postal organizations need the ability of adopting to new concepts while maintain
cost saving approaches.
Considering the arguments and discussions made by authors, it is evident that the postal market’s
performance is slowly declining particularly on the traditional mail business side; literature
however shows that not all is lost and newer approaches are being discovered to counter the

30
technological challenges faced by the industry. The regulatory dynamics will remain a challenge
particularly in those countries where government still has a great influence on the running of
postal organizations since flexibility to adopting new strategies will be limited.
2.1.5.2 Quality in Postal Organizations
While there is not much literature on quality (QMS) and performance management concepts in
postal services, a review on a number of discussions from different authors highlight issues in the
postal industry more related to the performance financially, operationally and economically. It is
therefore necessary to realize that quality management consequently forms part as a rather more
significantly contributing factor to the general achievement of successful performance; a further
review on topics within this relevant scope is revealed:
Quality in the postal business takes many forms; it can be viewed from the delivery speed,
reliability of the service provided, physical conditions and appeal of the mail item when received
by the client, frequency of collections and pickups, time spent waiting in queues, operating hours
or customer involvement and courtesy depending how the customer perceives it (Ngunyen,
2008). A study conducted by the Universal Postal Union (UPU, 2004) named Post 2004 revealed
that the world communication market saw only 20% of the margin on physical mail as opposed
to 75% on fax and telephone and 5% for electronic mail during the period of 1995; UPU (2004)
further concluded that the degree to which traditional postal services suffers was still open for
debate and further observation. It has been stated when assessing National Postal Organization’s
environment that current postal models are institutional and are conflicting with the current
environment therefore resulting to limited performance; these poor performances furthermore
hinder economic efficiency, productivity and quality nationally (UPU, 2004, 2006; Tim Walsh,
2002). To date the majority of postal organizations are still government owned making it even
more difficult to easily adjust flexibly both financially and operationally to current demands of
the competitive technologically driven environment. Governments around the globe have
embarked to obtaining new postal policy objectives due to concerning trends about postal losses,
budget deficits and poor quality performances (UPU, 2004; UPU - Strategic Planning Group,
2006, p. 42; EU's Postal Directive, 1997, 2002). Nguyen (2008) however remarked that
establishing postal services as governmentally driven organization brought forth the system that

31
sacrificed efficiency for effectiveness since low efficiency lead to poor performances financially,
thus forcing the government to reduce service quality to minimum levels and consequently
damaging its accountability.
Beko and Jagric (2011:1125) further pointed out that price and quality characterized by
timeliness, reliability and adaptability have become more increasingly emphasized intensifying
competition between mail service providers due to new modes of communication emerging into
the postal environment with attractive opportunities as opposed to traditional mail services that
are provided by national postal operators. Ngunyen (2008:21) further highlights under his
technological solutions discussions that UPU (2004) recommended that technological
restructuring should be included as one of the highest on the agenda of any postal organization
that plans to improve its services by means of business realignment including other approaches;
technology can improve internally by doing away with old paper structures and replacing with
newer IT infrastructures supported by advanced applications that will optimize processes and
synchronize data for different requirements while providing precise and accurate accounting.
Externally technology provides postal business with access to disseminating enhanced forms of
communication while providing value added services to customers with services such as track
and trace, online postage, hybrid mail, email services to public members and others. Ngunyen
(2008:22) also points out that the world bank and UPU highlighted that the economics and
diverse market preferences may hinder the postal business from providing an entirely universal
service unless communications technology is integrated into the postal service provisions in the
near future because the rapidly growing communications market will push postal organizations
beyond their core traditional business of tangible mail to change in order to enlarge their range of
service to be offered to customers. While technology has so much to offer, it also has its
criticisms of being expensive and catering for long term benefits only; it would arguably escalate
expenditure and consequently influence higher postal rates for services and this may only be
feasible in industrialized highly developed countries.
According to Ngunyen (2008:26) World Bank conducted a study in Trinidad and Tobago where
it was discovered that postal specialists were outsourced to assist in transforming the
organization into a commercialized business, the objective was that the government could later

32
privatize it if the strategy has proven success and a five year contract was given focusing on four
key performance goals of customer satisfaction: quality of service, universal delivery, total
revenue, net income. Almost all target areas were achieved resulting to increase in volumes,
delivery and revenues. Privatizing an industry bears long bureaucratic processes that needs to be
carefully considered, analyzed and accounted for because it involves ensuring the long term
economic, social and environmental sustainability of the business; dealing with organizational
cultural changes that will affect the quality and performance of the business; business process
restructuring that may come at costs of newer technology; loss of current markets; political
challenges and a number of other dynamics that will need intensive research before
implementation. Empirical studies also reveal that public postal organizations are more preferred
than private postal operators because the latter would sacrifice benefits of the public for
ambitious profit seeking goals.
The Postal Vicious Circle
Figure 2.7: The postal death spiral (Ngunyen, 2008, p 13)
According to figure 2.7 the postal environment’s circle of survival depends on four pillars; there
is an urgent need for technological resources to be improved in alignment to current needs of the
public, there is strong competition in the communications industry therefore customers’ demands
change. Swinand (2004) argued that service quality in the postal production processes was the

33
endogenous variable; he further states that the production process was captured well by the
production function econometric model because it also allowed the costs of improved service
quality to be estimated. There is also an urgent need to review current services offered to
customers; quality should be emphasized and strategic postal plans should integrate quality
objectives and plans be in place on how to achieve the objectives. With improved service quality
and enhanced technology, postal organizations will have a strong competitive edge and can
acquire more business to increase mail volumes therefore improving financial performances
internally. Without any of the above efforts, the postal environment is faced by a slow
deterioration circle that may lead to shutdown of the postal business driven by lack of service
quality, poor strategy, poor leadership and other factors.
2.1.5.3 Strategies for Postal Business
Performance in the postal industry is affected by factors such as changing demands by customers
influenced by current competition and economic drivers, regulatory dynamics having more to do
with tariff and access related matters; the combination of these challenges with internal
operational and structural issues have negative consequences in the survival and growth of the
postal sectors in current times. A number of strategies with potential to grow the performance of
the industry are however identified and discussed:
Vertical integration- According to NERA consulting (2004) vertical integration has been
identified as one of the most important strategic developments in the postal business. The
strategy extends postal organizations’ process capabilities by allowing operations to be
coordinated at more than one level of the distribution channels; Figure2.8 is an example of how
activities are coordinated at different channels of the postal chain where there is a high level of
flexibility in the postal operations where activities are catered as per customer needs and
products are prioritized accordingly; Domestic products are sorted and transported according to
the traditional channels while bulk mailers’ (business clients) products are processed on
dedicated services such as express services, direct distribution or normal stream.

34
Figure 2.8: The Postal Value Chain (NERA, 2004) Depending on the requirements of the customers, this strategy allow postal organizations to
collect products from manufactures, store them, package them and ensure correct addresses are
allocated on the products, later or immediately after this process the items are picked and
prepared for dispatch to the express services where they will be further fine sorted and delivered
directly to the customer specified destination or the retail Post office; the same channel is utilized
when clients wish to return the mail items and it’s called backward vertical integration. The
strategy comprises of a variety of logistics options that vary on prices for clients where they can
opt for rail, road or air.
Vertical integration allows postal organizations to gain more control on the value chain, the
products are no longer limited to mail items and the activities are no longer limited to collecting
and delivering; the value chain is extended to further activities such as parcel distribution and
activities such as packaging which forms part of manufacturing are integrated resulting to
sustainable growth of postal businesses. There is also cost control on the operations where the
customer determines the specifications when the operation is readily and flexibly available to
carry out the work; the strategy gives a competitive advantage since all activities are integrated
and there is no need to invite competitors in the value chain.
Horizontal integration- This strategy involves the acquisition of additional business activities at
the same level of the value chain. Postal organizations can achieve horizontal growth through

35
merging and acquisitions with firms offering the same services in the industry; a few generic
advantages of the strategy are economies of scale where more of the same postal products can be
offered at a greater geographically expanded scale, economies of scope where common resources
are shared to attaining more different end products and services, increased market power and
reduction in the costs incurred when trading at international level. The downside of the strategy
is identified when the anticipated industry gains do not materialize; this is however overcome
when management has done research to ensure that the imagined benefits will be realistically and
practically achieved.
Figure 2.9 illustrates a demand synergy between mail, express and logistics services within a
single chain; Mail operators will often find it manageable to integrate express and logistics
operations into their value chain since the postal operations are complex and consist with
elements of both structurally
Figure 2.9: The combined horizontal postal value chain (NERA, 2004)
Post offices can furthermore be utilized as retail offices for express services while additional
resources may need to be deployed into the logistics chain to extend the reach of customers. This
model guides that operations from the receiving inbounds will follow logistics systems and
processes may need to be reengineered to cater both express and mail products that are separated
at the later stages in the value chain.

36
2.2 Performance Management
The concept ‘Performance management’ emerged in the 1970s, however was never emphasized
as a recognized process until the latter half of the 1980s (Armstrong & Baron, 1998). The
understanding of performance management has grown from time to time and continues, this is
evident from the fact that it was perceived as a form of achievement rating in the sixties and
seventies; in the eighties and nineties changes effected when it was merged with management
philosophies such as Management by Objectives, Performance Appraisal, Performance Related
Pay, Behaviorally Oriented Rating Scales and others.
Authors to date differ in their understanding of performance management,
Fowler (1990) defines performance management as: “..the organization of work to achieve the
best possible results. From this simple viewpoint, performance management is not a system or
technique; it is a totality of day-to-day activities of all managers”.
Fletcher (1992) gathered a more detailed definition: “..an approach to creating a shared vision of
the purpose and aims of the organization, helping each individual employee understand and
recognize their part in contributing to them, and in so doing manage and enhance the
performance of both individuals and the organization.”
Storey and Sisson (1993) define performance management as: “..an interlocking set of policies
and practices which have as their focus the enhanced achievement of organizational objectives
through a concentration on individual performance.”
The following are characteristics of good performance management practices by Armstrong and
Baron (1998).
o It communicates a vision of its objectives to all its employees.
o It sets departmental, unit, team and individual performance targets that are related to wider
objectives.

37
o It conducts a formal review of progress towards these targets.
o It uses the review process to identify training, development and reward outcomes.
o It evaluates the whole process in order to improve effectiveness.
o It defines a managerial structure to look after all the characteristics above, so that individual
staff and managers are assigned specific responsibilities to manage the Performance
Management System.
Furthermore performance management organizations have the competitive advantage of
expressing targets in terms of measurable outputs, accountabilities and others while using formal
appraisal procedures as methods of conveying performance requirements communication.
Although performance management is significant, it is not a sufficient tool that can cover all
spheres of organizational development; it is imperative that quality and continuous improvement
becomes flexible allowing all techniques necessary to be implemented in order to achieve the
common organizational objective effectively and successfully. Everyone should be responsible
and shall have a part to play in making improvements, all employees must work together to
identify the steps needed to improve working practices.
The implementation of the strategy has to be applied such that it is a practical process approach
on an organizational level, Management have to identify the need for performance management
and the improvements the strategy will effect on the business; such need should be pinpointed by
various means such as customer surveys, benchmarking with industry competitors, analysis of
financial and performance reports and others. Once the need has been established, it should be
communicated in the organization at all levels including lower levels so that there will be support
and understanding about its significance. Prior to implementation, performance management
should be aligned with organizational goals and objectives, it is the responsibility of management
to ensure that all employees are excited about the improvements and not be resilient due to the
pressure and changes that may be experienced; this should be attained through the use of
performance management to review processes in order to identify training and development
opportunities as well as using the technique as a bases for rewarding outcomes.

38
Performance is often viewed and related in organizations to core activities and how effective
workers are carrying them out in relation to the goals set by the organization, it is narrowly
focused to personnel and whether they are able and capable to do the job they have been
appointed to do; The challenge with all organizations is always the implementation of strategy.
David Norton (1999), an American strategic consultant concludes that 90% of organizations are
unsuccessful to implement strategy; the implementation of any work improvement model is
highly dependent on the management’s total comprehension and key support to continuous
improvement initiatives in the work environment. The responsibility lies with management in the
organization to view all functions and related activities holistically as a value chain, viewing the
organization from this perspective means that all processes and activities are linked and that the
performance of any activity will affect the other positively or negatively.
In essence Performance management is the successful running of day to day activities by means
of influencing the mindset of the people towards achieving nothing else but results that are
desired and linked to organizational strategic objectives; this involves ensuring that resources are
well coordinated, activities are properly planned and organized and that all human related
requirements are sufficiently provided for and therefore a positive energy is instilled in order to
achieve strategic goals.
Performance management points out two factors named individual and organizational, it is upon
management to balance both the processes and systems with people optimally. Below are the
individual factors significant to performance management:
2.2.1 Selection of people
Recruitment and selection are some of the most crucial Human Capital responsibilities every
organization can make (Sutherland & Jordaan, 2004). Sutherland and Wöcke (2011:23) point out
a few arguments indicating that it is critical for organizational success that good decision making
is applied in appointing appropriate candidates however only a few organizations pay attention to
reviewing their efforts in recruitment and selection. They further note from Dale (2003) that the
wellbeing of personnel, product or service quality, organizational deliverables and other
organizational factors are affected by appointment decisions therefore managers need to consider

39
the importance of recruitment as it amongst the most important. Sutherland and Wöcke
(2011:29-30) also conclude from their empirical findings that recruitment and selection errors
remain high in the industry despite their negative impact towards reduced competitiveness and
increased costs; that management need to adopt best practices in selection and take full
responsibility.
Empirical literature reveals that profits need to be linked with every individual aspect in the
organization, it is imperative that organizations consider the aspect of selecting suitable people
who will perform responsibilities with utmost courtesy having organizational goals in their hearts
at all times as vital. Research has proven that the probabilities are possible that a candidate may
not be appropriately selected; Dale (2003), remarks that even those recruitment and selection
methods often considered best have a validity coefficient of 0.6 meaning that employment errors
are always likely to occur even though selection processes have been well designed and
executed. It is important that the industry directs efforts and attention to selection functions
because neglecting them bears serious consequences on the survival and growth of the business,
according to above authors the use of external recruitment brokers may have impacts to both pre
and post employment outcomes such as poor job satisfaction, poor commitment, poor motivation
and others.
The South African workforce is currently dominated by lack of attention to recruitment and
selection efforts, all employment related functions have been shifted to the labor broking
industry. Recent statistics reveal that the industry itself has grown rapidly consisting with over
6000 recruitment centers nationwide and yields over R26 billion annually, the factors leading to
such a shift of responsibility industry wide are understandable: organizations experience seasonal
changes in product demands, have a need for a flexible workforce, labour brokers offer an
incentive of training candidates, and the perception that labour brokers are better at managing
compliance with employees and the administration surrounding employment. Sutherland and
Wöcke (2011:25) point out that poor recruitment decisions have a potential of costing an
organization as up to five times the employee’s salary, the above mentioned factors are
reasonably understandable but do not justify the long term outcomes of organizational returns
declining and businesses liquidating due to lack of loyalty, low morale, job dissatisfaction,

40
customers expectations not being met and all other negative consequences related to poor
performance derived from individuals with a don’t care attitude at the workplace when they
could be averted.
2.2.2 Skills and ability
Research reveals that young skilled personnel are of great significance to the corporate world,
evidence is demonstrated from among others in the cognitive psychology literature (Hunt 1995,
Douchemane and Fontaine 2003). The literature suggests two types of intelligence:
o Fluid intelligence: the ability to develop new techniques for the solution of problems that are complex and unusual.
o Crystallized intelligence: the ability to bring previously acquired problem solving methods to bear on a current problem.
Arguments have been developed from different authors while considering the dynamics of
current and emerging economies regarding the importance and unimportance of skilled
workforce, Mcdonald and Temple (undated from the Australian University) point out that
although some authors argue that skilled labour shortage influenced by aging will not necessarily
be a problem since technology will balance the gap; the opportunity of future economic
competitiveness is driven and guaranteed by the country’s ability to develop and maintain
sufficient capacities of skilled labour because while technology become redundant in an
approximate period of ten years, employees amounting to 80 percent would have gained skills
and qualifications for that period.
An organization with low level percentage of skilled and capable workers has higher chances of
failure in the long run; processes may have back locks due to poor planning, errors on outputs
will be increased leading to consequently rising numbers on reworks, customer satisfaction is
more likely to be reduced, inconsistent quality on products or services and others that have an
effect on the survival and growth of business.

41
2.2.3 Organizational culture
Tom Watson Jr. 1962 said in a speech, at Columbia University: “The philosophy, spirit and
emotions, of an organization have much more influence on its achievements than economic or
technological resources, organizational structure, innovation, or their timing. All these have a
large impact on the success of a company. But they are outweighed by the degree, to which
employees believe in the precepts, the basic values and how sincere and are involved in their
application”.
Rijamampianina (2011), a Wits business school academic Professor defines culture as
“everything a group thinks, says, does and makes-its customs, ideas morals, habits, traditions,
languages, material artifacts and shared systems of attitudes and feelings that help create
standards for people to co-exist and which are acquired, developed and passed on by the group
of people, consciously or unconsciously, to subsequent generations”.
A firm’s culture is one amongst considerable factors that have direct impact in the performance
of businesses, it is upon management to ensure that positive mindsets are instilled throughout the
organization by implementing initiatives to assure workers that their role is of importance and
appreciated. Cultures vary from one organization to the other, they are often influenced by how
the firm itself is structured, they consists with attitudes positive or negative, they generally
represent the social, psychological and emotional wellbeing of people and the job itself. Isolated
departmental structures of work often lead to surroundings where people take care of their only
work; they develop isolated tendencies where workers point fingers to one another when
problems are experienced and often lead to hostile and conflict driven cultures. Management
have the ability of creating a user-friendly environment by being part of the team, this should be
achieved through eliminating the top-down structure where they are always in the offices
delegating rules, policies and responsibilities. Visits and informal meetings every once in a while
with personnel make them eager to participate, the internal environment should be such that all
members of a firm work as a single unit because, by ratio 100 % performance rate of one
function does not imply that the final product will be 100% satisfactory if other functions
perform at 45% quality rate.

42
2.2.4 Motivation
Motivation is one of the fundamental precepts that need to be always linked to organizational
goals, it is important that managers learn and understand employees’ needs at work in order to
manage motivation successfully. The theory of motivation consists of various methods that can
be applied to the organization depending on the needs of employees, below are some of the
important ways individual employees can be motivated briefly discussed by Qayyum and
Sukirno (2012):
o Be generous with praise. This is one simple thing to give, everyone wants to be praised
because it makes them feel part of the team, praise from the Senior Manager or even a
General Manager to lower operational sorters and mail processers in SAPO may go a lot
farther than any person can think. Visible improvements made by teams should be
recognized as this will build their performance drive, praise need also be given to individuals
in front of their colleagues when the manager is comfortable with delivering it on one-on-one
to employees.
o Get rid of the managers. Empower staff by means of giving them total control in projects
and remove the project lead; allowing staff to be custodians of their work without having all
workers to report to one person will give them a sense of ownership and responsibility where
positive changes will take place in terms of creativity, commitment by working extensive
hours, arriving early at work and identifying opportunities for improvements more often in
processes and work.
o Make your ideas theirs. People generally dislike being told what to do, rather communicate
in a manner that will sound more like they are bringing ideas onto the table. Instead of going
the direction of “I would like you to do it in this manner” A simpler approach will be “Do
you think it is a good idea if we do the task in this way?”
o Never criticize or correct. This approach is used to allowing personnel to improve on their
work and learn from their experiences and mistakes. It is very discouraging and de-
motivating for a person to be told that they did the job wrongly, it is always better to fix
errors by asking if that was the best way to approach a task or problem, if not why? Check if
there are ideas on how could they have done things differently, this direction brings solutions

43
from an angle of conversations with staff and not pointing fingers and forcing people to be
accountable where everyone becomes hostile and intimidated while at work.
o Make everyone a leader. Always give recognition where it’s due, best performers’ strength
must always be highlighted and they must be informed so as they are set as a great example
to others. They will consequently set and maintain standards very high as they are motivated
and eager to live up to their reputations as leaders. Others will inherently be inspired to join
the winning team and will always try their utmost best to do better on the job.
o Take an employee to lunch once a week. Depending on the nature and size of the
organization, an employee or group can be chosen for a little outing, this builds a team effort
and increases loyalty to employees as they develop the willingness to do better and impress
the boss.
A successful performance management framework involves a comprehensive, detailed and
practical approach to implementation; performance specialists need to take all necessary steps in
analyzing the structure, size, dynamics and type of organization a performance management
system is to be implemented. Abernathy (2010:6) describes a performance analysis and
improvement methodology as a process that involves the diagnosis of improvement
opportunities, identification of elements that bear constraints on performance and developing
improvement interventions that will effectively do away with the challenges constraining
performance. Ochurub, Bussin and Goosen (2012) emphasize that it is imperative that change
readiness is sufficiently assessed before a performance management system is implemented.
Abernathy (2010:6) further develops a four step process that he believes includes techniques
from industrial engineering, industrial psychology and organizational behavior management.
Step 1: Conduct and organization wide management practice survey- This step involves
deploying a team of specialists to conduct observations on organizational processes therefore
develop a survey questionnaire to be distributed across the organization in determining
performance monitoring systems in place, their downfalls and opportunities. The criteria used to
assess the current scenario of the organization varies from organization to organization; areas of
measurements can include work forecasting, work prospecting, work scheduling, work
distribution, flexi time, cross utilization, supply inventory management and others. This

44
approach is said to be having the advantage of narrowing the analysis areas and reducing time for
the overall improvement initiative.
Step 2: Conduct an objective analysis of performance improvement opportunities- This is an
object oriented approach where studies are conducted in a number of performance process or
product areas for pinpointing performance improvement potentials (PIP). A number of measures
are used including benchmark variability that considers a number of similar performance areas
from other business or plants consisting of similar processes, trend variability where current
organizational performances are compared to previous performances so as to establish
improvement potentials, cyclic variability that involves analyzing specific peak performance
cycles of the business and determining contributing factors that influence performance, and
exemplar variability where ratios and standard deviations are established on the best to average
performances of the business.
Step 3: Conduct a performance constraint analysis- This phase involves selecting a process as a
target area for performance improvement and conducting a constraint analysis to actuate the root
causes of the exceptions; this analysis involves a three way approach that looks more in depth on
the capability of the process, the opportunity and the context.
Figure 2.10: The Performance constraint Analysis model. (Abernathy (2010:9) The above model indicates the constraints to performance that are being assessed; the
opportunity refers to the extent of the availability of the work itself, how it is being controlled
and if there is a system in place being followed for work distribution. These aspects work in

45
conjunction with time where employee utilization, scheduling and attendance are optimized
accordingly. The capability constraint deals with employee competence, resources and the actual
processes; this approach guides with selection and training of personnel, the management of
resources and optimization of work methods.
Step 4: Select or Design a performance Improvement approach- This is the stage where an
improvement methodology is developed and implemented based on the results from the previous
three steps; each constraint category will be allocated an improvement technique where a step
by step implementation will take place to enhance the performance of the organization. Training
and development will be conducted where necessary.
This methodology is practical and cost effective, can be adopted by organizations successfully
however it relies more on the results gained from survey approaches in the organization; this can
be a downfall since it is also likely that respondents from the survey could have provided
unreliable results particularly when they do not see the value of what is being implemented;
therefore it is important for the technique to be flexible such that other approaches to gathering
organizational knowledge be used . It also does not state much about post implementation
monitoring and management of the system therefore more studies may be relevant to corroborate
its effectiveness and benefits of implementation. Ochurub, et al (2012: 2) point out that there is
no organization that can successfully introduce a performance management system
(PMS)without proper consultation, approval, involvement of employees and a proper human
capital strategy that will ensure that employees comprehend the change and the benefits thereof.
Ochurub, et al (2012:2) also highlight a number of literature trends arguing and indicating the
importance of introducing PMS as a strategic change that will improve productivity and
profitability of an organization only when employee readiness has been confirmed. They further
conclude that communication, involvement and inclusion are the most imperative foundations to
sustainable change management and implementation. Performance management objectives
should be linked to organizational vision and goals, a strategy to how it should be applied and
continually improved at the organizational level should be documented and communicated
across all functions. Furthermore systems need to be put in place to maintain performance driven
cultures; there must be ways in which management can always ensure that everyone clearly

46
understand the concept of performance management and their roles in achieving success from it.
Employees need to acknowledge the importance of measuring performance so that it can be
successfully managed; performance efforts should be in conjunction with quality management
practices and continuous improvements being communicated as a day to day language.
2.3 Summary of the chapter
Based on above review of literature, a number of key findings were identified to be most
important in relation to the research objectives, findings and conclusions. A summary discussion
follows:
Quality: With regards to quality it was found that quality of the product or service has to be
measurable in order for it to be improved and interpreted in the form of financial returns by
organizations. It was also further revealed that the final consumer plays a vital role in defining
the product or service quality. Customers were also identified as the most important contributors
to defining service quality since it is mostly measured based on their expectations versus
satisfaction.
ISO 9001:2008 QMS: Although the process and logistics of acquiring ISO certification by
organizations particularly larger ones such as SAPO is prolonged and costly; the benefits in the
medium to longer term of the business performance are significantly higher than in non ISO
certified firms. QMS further guides organizations with reorganizing procedures, managing
documentation, optimizing process efficiency, defining customer requirements, improving
quality of service and improved risk and compliance management leading to benefits such as
international business recognition, improved marketing approaches, competitive advantage
including others.
Continuous Improvement: A fully supported Continuous improvement effort by management
and total involvement of employees on organizational projects break down the barriers of
resistance, poor communication leading to successful implementation. Furthermore projects that
have proven significance in the manufacturing industry such as Just In Time, value engineering
have also proven success in the service fields when properly deployed following successfully
proven project frameworks towards implementation

47
Postal Services: The literature also revealed that the mail business division of the postal
environment is faced with business sustainability challenges; the challenges are imposed by
emergent electronic forms of communication where businesses migrate to using emails, text
messaging, internet advertising and others to communicate with their clients. Although faced
with these challenges NPO remain dominant in their markets due to monopolistic rights in most
countries to date; therefore an opportunity exist if they are to proactively readjust the business to
most relevant and contemporary strategies across the engineering, financial, economic and
human capital disciplines.
Performance Management: The interaction between individuals and an organization play a
significant role towards successful performance management strategies; all factors involved in
manufacturing a final products of providing a service need to be strongly linked to one another
and communicate with organizational objectives and business performance.

48
CHAPTER 3
METHODOLOGY
3.1 Methodology The research method is a strategy of enquiry which begins and takes progress from the
underlying assumptions of the subject in question to research design, and data collection (Myers,
2009). The study was conducted and the information gathered following a structured approach to
research; the methodology that was employed in this study was the mixed methods approach,
which involved both qualitative and quantitative methods (Creswell, 2003).A pre-study survey
was conducted by means of interviews and observation to gather a finer detail and understanding
of the organizational processes and to test and refine the research questionnaire.
The quantitative approach of the study involved conducting pilot studies thereby developing a
structured questionnaire which was distributed to sampled participants. Statistical techniques
were also applied in accurately analyzing data and determining significant factors of the study.
The qualitative aspect involved conducting observations and informal interviews to gather
respondents’ views about the organization’s quality efforts and performance management. The
combination of both methods was planned overcome the weakness of results that may come from
a single method and further to compare and corroborate results from both approaches.
3.2 Research Objectives The objectives of this study were:
To determine the extent of quality and continuous improvement in the South African
Postal Services.
To identify challenges in the implementation of ISO and other related projects in the
SAPO.
To critically review approaches and methods used towards quality.

49
To recommend general improvement techniques and approaches that can be useful when
ISO and other projects are to be implemented successfully.
The study achieved the intended objectives; the purpose was to apply critical analytical methods
into the operations, processes, business and culture of the organization so as to establish the
challenges that hamper progressive moves of the organization.
3.3 Research Design Research design is a master plan that puts the techniques and procedures used for data collection
and information analysis into specification (Zikmund, 2003:65). Yin (2003) further remarks that
“colloquially a research design is an action plan for getting from here to there, where here may
be described as the initial set of questions to be answered and there being some set of answers”.
A research questionnaire was designed with assistance from Statkon research consultants and the
questionnaire’s purpose was to collect data related to the research question and consisted of
demographics, performance management, ISO 9001:2008, quality management, continuous
improvement, challenges and level of quality as areas of investigation.
3.3.1 Population The population for the research were employees from the South African Post Office, This study
was focused on two Business Units from different regions being Securemail and Capemail, these
Business Units consist of several departments such as Mail Processing, Revenue Protection,
Transport and Logistics, Mail Delivery and others where organizational projects are continuously
being implemented in the Mail Business group’s division; for accuracy and reliability,
questionnaires were sent to different levels and functions of both these Business Units, that is
management, supervisors and controllers including personnel at the lower level. The entire
SAPO group comprise of approximately 22500 employees, this includes other divisions of the
group (Postbank, Retail and Logistics) and their subsidiaries where the study could not be
applicable. The targeted population of the study was Capemail which consist of approximately a
total of 1080 employees and Securemail which comprise of a total of 145 employees. The
selected sample of this population was 150 employees in total from both regions.

50
3.3.2 The sampling method (Hair et al., 2003: 333) define sampling as the process of making a selection of a small number
of respondents from a larger defined target population, with the assumption that the information
gathered from the small group will allow the researcher to make generalizations or judgments
concerning the larger group. The combination of probability, convenience and purposeful
sampling was used in that observations were made and questionnaires were distributed to
different various applicable departments where responses were most likely to be returned; as
indicated they included management and personnel across different levels.
Controllers and supervisors of relevant sections were sensitized with during observations and
arrangements were made with them for distributions of questionnaires at later stages;
questionnaires were then handed to relevant controllers and supervisors per relevant area of work
for completion and further distribution to employees. Depending on the size of the section,
purposeful numbers of questionnaires were allocated as per the number of employees on the
work area and those that indicated eagerness to participate and express their views. Email
distribution was mostly used for specialists and management to avoid the time it would take to
visit their individual offices. A total of 85 questionnaires were distributed to Capemail, Western
Cape region while 65 were mailed to Securemail in Jet Park, Gauteng region.
3.3.3 Questionnaire Design
A questionnaire is the research’s measuring instrument that utilizes the survey approach to
collecting information (Herbst, 2004). It should be comprehensive and able to convey the
intended question to the respondent; a good questionnaire design should consider and follow the
seven basic principles.
o Principle 1: Be clear and precise
o Principle 2: Response choices should not overlap and should be exhaustive
o Principle 3: Use natural and familiar language
o Principle 4: Do not use words or phrases that show bias
o Principle 5: Avoid double- barreled questions
o Principle 6: State explicit alternatives

51
o Principle 7: Questions should meet criteria of validity and reliability
The questionnaire for this study was developed in consultation with Statkon research consultants,
it consisted of Section A to Section F; the independent variables being tested were all related to
the status and improvements of quality and performance management in the South African Postal
Services. The questionnaire was designed in line with literature relevant to the study and
consisted of the following sections and their subsections:
o Section A- Demographics: Exploring respondents from different personal traits related to
their work functions in the organization.
o Section B- Performance Management: Exploring SAPO’s performance management
approaches from the perspective of strategy, performance, leadership and human resources as
subsections.
o Section C- Quality Management: Assessing quality from the views of customer requirements,
non-conformance management, employee’s involvement and importance of quality
performance management as sub sections of the questionnaire.
o Section D- Continuous Improvement: Exploring this practice from the project management
and change management perspective in SAPO.
o Section E- ISO 9001:2008: Looking at requirements of Quality Management System and
employees’ perceptions in relation to ISO 9001:2008
o Section F- Challenges and Level of Quality: Consisting of internal structural challenges with
Wellbeing and Resource challenges.
The sections of the questionnaire above are elaborated in summary with the grouped factors they
were generally exploring in the organization; the questions posed per section of the questionnaire
were more detailed and clear, they were closed ended and involved a five to six point scale
which measured the extent to which respondents viewed and rated the organization’s processes,
activities and resources in relation to the questions posed.
3.4 Data Collection The main techniques of collecting data for the study were literature reviews, interviews,
questionnaires, observations. Data that were collected involved both primary and secondary data.

52
3.4.1 Primary Data Primary data were collected from the organization using both quantitative and qualitative
techniques as per the type of data needed for suitable purpose; surveys and observations were
conducted and informal interviews were held with participants leading to a more relevant
questionnaire design at a later stage. Two divisions were covered for data collection, Securemail
based in Gauteng and Capemail based in Western Cape. A total of 150 questionnaires were
distributed to both the divisions; they were divided into 85 for Capemail as the bigger region and
65 for Securemail as the smaller. The challenge with this approach was to confirm if the
divisions were sufficient to serve as a representative of the sample size therefore allowing for
generalization of the research findings for the whole of the South Africa Post Office
(Walliman:2001). To overcome this, the organization’s previous performance reports, the policy
and objectives were used as reference and published empirical research papers on similar topics
were considered when drawing conclusions; furthermore over 100 questionnaires were
distributed to the divisions and according to Pallant (2005) a sample of more than 100
participants is statistically robust enough to make representation of the larger populations. A
questionnaire relevant to the study was developed post observations and reviews of papers for
the purpose of acquiring data in the regions; personal delivery was used for Capemail’s relevant
areas due to convenience and secured postal delivery method was used for Securemail
distributions.
3.4.2 Secondary Data. For secondary data, sources such as databases, published papers from academics and industry,
books, internet, journals and others were considered and used where applicable (Walliman,
2001). Educated and experienced judgements and industry expert opinions were also considered
as secondary data where relevant, although some were not published. Data on quality
management and performance management concepts was easily found on above mentioned
sources since the practices have been around for some time and models have been developed and
reviewed through time; it was challenging to gather and obtain secondary data on quality and
performance management directly related to the postal industry since most literatures reviewed
were around the regulatory factors affecting the existence of postal organizations. To overcome

53
this challenge, papers of relevant concepts were reviewed from related industries such as the
service industry; furthermore papers in the postal industry that were deemed to be focusing on
factors closer to the subjects in question were also considered.
3.5 Data Analysis Collected data were analyzed with the help of Statkon research consultants, an SPSSS Version
15 software packages were utilized to get all relevant and reliable data analyzed to meaningful
information. Data was analyzed into a number of categories for research discussions and
interpretation; Descriptive statistics were analyzed and discussed with their applicable frequency
tables, Factor analysis was also applied on the study to reveal and discuss subsets or groups of
questions and responses that indicated closer relationships amongst each other, statistical
reliabilities were verified throughout the entire results, normality of data were confirmed and
discussed for all applicable factors, comparisons and correlations were also conducted for the
research results and a number of relationships were discussed.
The statistical methods used for Factor Analysis consist of the Principal Component Analysis
(PCA) which was useful for data extraction and determination of factors from the raw data; the
Kaizer Meyer-Oklin Measure of Sampling Adequacy (MSA) was also applied to verify if data
were suitable for further use as per recommended criteria and Bartlett’s Sphericity test used for
confirming significance. Furthermore the Varimax and Kaizer normalization were also used to
rotate factors so as to identify those with highest loadings. For Normality tests, Shapiro-Wik tests
and Kolmogrov-Smirnov tests were considered to test the normality of data depending on the
values of variables on their degrees of freedom; measures such as the mean, variance, standard
deviation, median skewness and kurtosis were also considered for confirming normality of
results. Although not indicated on the results section, some of the methods that were also used to
verify normality included histograms, Q-Q plots and box plots. Comparison tests were also
conducted and both parametric and non-parametric considered although more of parametric was
used due to its robustness of the kind of distribution; Analysis Of Variance (ANOVA) and T
tests were also exploited for comparing groups. Correlation tests were conducted and non-
parametric tests methods were followed since most of the factors’ distribution scores were not
normal.

54
3.6 Limitations The challenges that were faced by this research involved time and financial constraints. Financial
constraints are expressed in the sense that there was a lot of paperwork involved in conducting
the research, some of paper reviews had to be printed for ease of reading and reference and
questionnaires printed for the study. There was also a need for electronic equipment and
travelling involved particularly when consulting with respondents, the institution and research
consultants; these activities demanded a good financial capability considering that the researcher
was based in Cape Town while enrolled in Johannesburg. Time refers to that in which the
research had to be completed within; it was a challenge to acquire time out from work so as to
focus more on the research and a schedule of research activities had to be adjusted. The study
also had to be limited to focusing on two divisions of the company as a representative for the
whole organization and as a result the scope of the research had been limited to cover the time
element.
The time constraint element was overcome by proper planning and putting proactive measures in
place in that appointments for interviews and consultations with relevant people in the
organization were arranged in advanced; extra hours during holidays, weekends were also
devoted in this regard. Travelling to destinations of the study was also planned for and all other
activities of the research were carried out in conjunction with the schedule to avoid unnecessary
delays on the progress. Financial constraints were overcome by allocating a specific personal
budget for the study that included travelling, equipment and everything else considering that
scholarships and bursaries did not materialize. Although the study had to be limited to two
divisions; the selected two form part of the organization’s eight super hubs that consist of all the
relevant activities involved in mail business as a whole therefore the results sufficiently
represented the entire organization.

55
CHAPTER 4
CASE STUDY- THE SOUTH AFRICAN POSTAL SERVICES
4.1 A brief history and background of SAPO
The history of Postal business in South Africa can be tracked back up to 1501 when Captain
Pedro D’Ataide of Portugal placed a letter in a milk-wood tree at Mossel Bay, Western Cape
with intentions to inform the other sailors both from Portugal and those that returned from India
about the disaster of heavy storms that had struck his fleet of three ships on the Atlantic Ocean
leaving no survivors. The fleet that was returning from India found the letter three months later
and delivered it to Portugal. The crew of ships used the postal practice throughout the period
1500 to the 1800 by means of placing letters under postal stones being found and delivered by
other ships; the necessary information such as the name of the ship, the captain and the dates
would be made available on the letters. During the period of 1781, mail workers handled mail
articles in Saldanha Bay, Simons Town and Robben Island while also keeping an eye for hostile
ships.
In 1792 March 2nd, Johan Isaac Rhenius the Acting governor issued a proclamation to establish a
post office in the Castle in Cape Town. Adriaan Vincent Bergh was appointed postmaster and
Aegidius Benedictus Ziervogel the first postman. Letters were accepted every morning between
09:00 and 10:00 at a cost of six “stuiwers” (half pennies). The services of postal business
continued from then throughout the years up to today offering a variety of distribution and
delivery services to the public having had achieved many highlights.
The South African Post Office Group is composed of four main business units, Mail Business,
Logistics, Retail and Consumer Services and Postbank financial services. These units function
independently of one another in the organization structurally and they are individually headed by
different group executives. The organization’s vision is “To be recognized among the leading

56
providers of postal and related services in the world” (SAPO: 2012). The objectives read as
follows:
o To achieve excellence in all our operations whilst being cost effective.
o To be Governments preferred partner in delivering government services to people.
o To be known as a trusted and well respected organization.
o To achieve customer intimacy by knowing what our customers need and desire and to use
this to grow our business.
o To build a high performance culture and develop skills throughout the organization.
o To be a caring corporate citizen by being environmentally and socially responsible.
4.2 The processes and activities of SAPO
Figure 4.1: Seven End to End Processes of SAPO (SAPO, 2010)

57
Figure 4.1 above indicates the framework of total activities that are typically involved in the
organization; as at can be seen, process one involves all the activities that that take place in
accepting mail from customers. This process takes a number of forms; customers can drop of
their ordinary mail items in the boxes located inside or outside post office outlets, secured post
boxes are also found on the street corners in the communities for ease of accessibility and in the
mail centers; it is important that customers always note the cut off times for posting mail in these
boxes since they form part of the organization’s delivery standards and they determine the period
to be taken by the mail moving in the value chain. Post office retail outlets are used as the main
platform for acceptance of all kinds of mail items from customers; these can include secured
mail, registered mail, parcels, fast mail, safemail, international mail and others. Figure...
indicates types of mail items that are processed and distributed by SAPO on day to day bases as
classified into reserved and unreserved types.
Figure 4.2: Reserved and unreserved mail products (SAPO, 2012)
Once the mail has been accepted, process two takes effect where the transport department arrives
in the post boxes and retail offices for collections; this process is structured and controlled since
there are specified times established for collections. Transport and logistics collect mail from all
the applicable areas and distribute to local mail centers for processing and sorting; process three
takes effect upon arrival of trucks in the mail centers where mail is received into the hubs and is

58
taken through a number of processes such as revenue protection, sorting before dispatch. Sorting
is classified into two categories of destination, sorting for local routes which involve strictly mail
that is to be delivered within the regional boundaries and sorting for national routes where mail is
intended for delivery in other provinces.
Mail is loaded to trucks in the outward section of the mail centers for delivery both to national
and local routes and transport is again involved for distribution in process four. Transport is
therefore responsible for delivery in the mail centers again for national routes and to depots for
local routes where mail will be sorted again and transported for final delivery to customers.
Above processes are governed by support functions and resources; main functions that oversee
these processes include Mail Processing, Transport and Logistics, Delivery Management,
International Business, ePostal, Philately, Securemail, Revenue Protection, National Control
Centre, Process Planning & Development and Sales. These functions are involved throughout all
stages of processing and distribution of mail and are referred to as the core divisions of Mail
Business; some of the activities within the value chain take place simultaneously and connects
these business units while others not. Operational activities interact with functions, resources and
systems to deliver the final product at defined quality to the customer. The operational resources
involved in the value chain include but are not limited to labour, containers such as (mail bags,
trays, rolltainers, minitainers, pallets, and others), fleet such as (trucks, panel vans, mini busses,
sedans, forklifts, scissors lifts, reach machines, and other), inserting machines, bulk printers,
sorting machines and a number of other resources. The organization has adopted and utilizes
systems such as Track and Trace, Isometrix, Transport Management Information System, Mail
Centre Information Systems, Cube, Sharepoint, Total Operations Management Solutions, and a
number of others directly related and aligned to operations. SAPO also relies on a dedicated team
of support functions that has entered into service level agreements with Mail Business (SAPO:
2008); the functions referred to are Retail, Information Technology, Human Resources, Supply
Chain Management, Finance, Internal Audit, Group Strategy, Security & Investigations, Risk
Management, Government Relations & Communications and Customer Relations. The
interaction of all these functions and related systems and resources remain vital to overseeing
operational processes and achieving successful delivery of products to clients.

59
4.3 Challenges in the South African Postal Services
The language of customers is universal and commonly applicable to any kind of business;
whether largest or smallest mailers, customers always want services and products that are
innovative, affordable, reliable and of highest quality with the ability to satisfy their individually
changing needs (Suleyman; 2011:4). The South African postal services is faced with a number
of challenges posing a threat to the survival and growth of the business; these challenges range
from external competition in the market to internal operational challenges that hamper the
progress of the organization drastically. According to Suleyman (2011:6) postal organizations
are faced with multiple numbers of strains that demand a rather aggressive and immediate
response in the industry to ensure customer needs are met. He further identifies the three main
threats to postal services as competition from alternative postal operators, intermodal
competition in the form of electronic communications and internal inefficiencies.
There is a significant decline on the business of SAPO particularly with regards to mail volumes,
as of January 2012 mail business contributed 64% of the total profits in the organization; this is
an indication that mail business is the division where the largest capital is acquired yet it is the
challenged area of business where volumes are declining, this dilemma remains a global
challenge industry wide in the postal business. The challenges are posed by external factors such
as competition and emerging markets; the physical mail system is slowly fading away in the eyes
of consumers and clients to the business such as banks and retailers are encouraging costumers to
resort to alternative forms of correspondence such as email, short message services, internet and
others.
Operational challenges also impact the organization significantly resulting to loss of clients,
business and employees; SAPO is faced with resource challenges lately where there are always
massive shortages of containers leading to delays of work that need to be processed. There are
also structural dynamics that have lead to poor interaction between business units where every
business unit take care only of its operations; a typical example is observed when mail
processing over loads containers and pallets without care to standard weight requirements when
its volume peak periods and therefore shifting the work to the next function which is transport.

60
These kinds of problems affect the total organization and cause delays and poor quality to the
service delivered to the customer. Furthermore employee morale is generally very low due to
poor wellbeing programs and downward coercive communication structures in the organization.
Such factors lead to employees with don’t care attitude and consequently cause high levels of
non-conformances such as mis-sorts, misroutings, delays, late deliveries, incorrect deliveries,
dumping of mail, incorrect labeling of products and a number of others related to processes.
There is further also a huge impact from demoralized employees through strikes, go slows and
labour turnover that affect the organization’s quality and overall performance.
4.4 Macro-environmental analysis for SAPO Today’s’ business environment comprises of a number of external forces that organizations need
to always critically consider if they are to implement and maintain strategic decisions; Bateman
and Snell (2002:46-47) describe the external environment as a firms outside relevant forces. The
macro environment refers to the external environment which every organization find it-self
operating under, it consists of variables such as political, technological, social, physical,
economical and international that have both direct and indirect impact in the survival of every
business to a certain extent depending on its nature and size.
The SA Post Office is a monopolistic firm in the South African government, it is an organization
known as a “parastatal” typical meaning of a government influenced organization. Externally it
is influenced by the market and the macro environment; the market consists of customers,
competitors, opportunities and threats while the latter consists of all macro variables that can
determine if there is a need for change or not. Existing competition is increasingly getting more
and more aggressive due to economies continued maturity and therefore it is critical for SAPO to
conduct a market analysis every now and then.
4.4.1 SAPO and the market environment In the market place SAPO comes in contact with customers, these are organizations and people
that have developed a relationship with mail business and have gained trust that their
requirements will be met satisfactorily. Customer needs and demands change with time and it is
upon SAPO to continually determine and identify changing needs and to seek new customers in

61
the market. Fleisher and Bensoussan (2003:2) suggest that competitive advantage is when the
organization has successfully managed to position itself in such a way that it gains advantage
over its competitors in the market (external environment). As a Logistics and distribution
business SAPO needs to have a strong marketing function to source and retain business and
operationally it is important to operate on a Just in Time strategy as key to meeting customer
expectations.
Although SAPO is a sole entity in the South African postal industry, there are a number of
related business competitors in the logistics and distribution industry. These competitors are
exploiting every opportunity available including technology to acquire new business; Post office
therefore finds itself in a position that it has to strive to for opportunities to retain current clients
while bringing new clients into the business by means of ensuring on time delivery and
collection of parcels and secured and reliable services.
4.4.2 SAPO and the macro-environment
The South African Post office covers more than 1.2 million square kilometers of area nationwide
in terms of distributions and deliveries. It consists with more than 2400 outlets excluding retail
agencies. The macro-environment variables have an influence in the way SAPO conduct
business politically, technologically, socially, economically, physically and internationally:
Figure 4.3 South African Post Office Annual Report 2010 (www.sapo.co.za)
4.4.3 Political variables
There is a strong influence from the Department of Communication (DoC) and ICASA. These
bodies as shareholders are the ones setting performance achievement targets for SAPO as per
license agreement. The organization strives to optimize all its functions so as to reach the targets.

62
Furthermore the DoC also controls and provides the budget annually and has a strong voice to
the priorities, expenditures and strategies made by the organization. It is important that the
organization complies with the regulations of the government such as code of practice, health
and safety, equity and equality.
4.4.4 Technological variables
South Africa is a developing country and is one of the most economically expanding in the
African continent; the use of advanced technology has been rapidly growing in order to compete
globally, it is evident from the implementation of large projects such as Gautrain, Bus Rapid
Transportation and world class built Stadia that technological advantages have been adopted in
the SA government. SAPO has to align itself and exploit opportunities in the technological
environment by identifying areas that can enhance logistics and communications in its industry, a
benchmark from players like Telkom expanding with communications networks by introducing
“Eita” as a new competitive brand should be considered.
It is upon SAPO to adapt to e-commerce concepts and recognize investment opportunities,
Postbank should be one of priority business areas where advanced technology can be invested so
that it is transformed and corporatized to merge with players like Absa, Standard, FNB, and other
banks in the land. Good business opportunities have emerged on the current sustainability
phenomena, opportunities can be adapted to the transport & logistics side of SAPO such as
implementing and using fleet that utilize Euro V emission technology standards and green
logistics as a marketing brand to acquire more business since it is currently important to clients
for a firm to be sustainable and eco-friendly.
4.4.5 Social Variables
As a developing economy, SA is faced with issues related to balancing the current population
with the industry. There is a strong need for creation of jobs for the people; among other factors
are skills shortages and the ratio of industry size versus the percentage of unemployed
individuals. According to Stats SA (2012:1) the level of unemployment as at January 2012 was
23.9% while the total population is estimated at 50, 59 million. There must be a balanced
compliance to the labour legislation and Employment Equity act within SAPO environment and
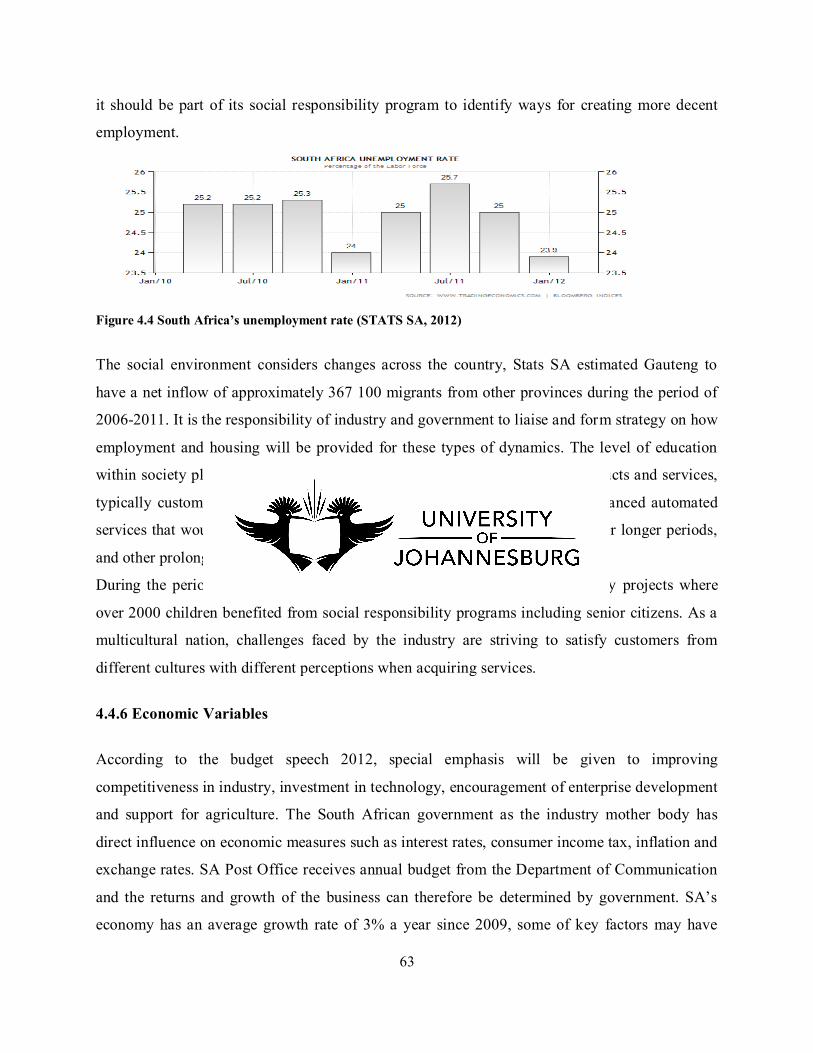
63
it should be part of its social responsibility program to identify ways for creating more decent
employment.
Figure 4.4 South Africa’s unemployment rate (STATS SA, 2012)
The social environment considers changes across the country, Stats SA estimated Gauteng to
have a net inflow of approximately 367 100 migrants from other provinces during the period of
2006-2011. It is the responsibility of industry and government to liaise and form strategy on how
employment and housing will be provided for these types of dynamics. The level of education
within society play a vital role in the direction SAPO has to take with its products and services,
typically customers falling under the age group of 16 to 35 would prefer advanced automated
services that would avoid standing in long queues, waiting for expected mail for longer periods,
and other prolonged manual activities.
During the period of 2011/12 financial year, SAPO undertook 100 community projects where
over 2000 children benefited from social responsibility programs including senior citizens. As a
multicultural nation, challenges faced by the industry are striving to satisfy customers from
different cultures with different perceptions when acquiring services.
4.4.6 Economic Variables
According to the budget speech 2012, special emphasis will be given to improving
competitiveness in industry, investment in technology, encouragement of enterprise development
and support for agriculture. The South African government as the industry mother body has
direct influence on economic measures such as interest rates, consumer income tax, inflation and
exchange rates. SA Post Office receives annual budget from the Department of Communication
and the returns and growth of the business can therefore be determined by government. SA’s
economy has an average growth rate of 3% a year since 2009, some of key factors may have

64
been the recession period that resulted such a slowdown; economic trends have impact on
consumer expenditure and as a result any organization becomes sensitive to negative flows of the
inflation rates.
4.4.7 Physical variables
The physical environment comprises of the resources organizations need to function, these
involve assets fixed or variable and how they are organized to optimize profits. SAPO and every
organization rely on sufficient and healthy supply of resources such as water for people. It is the
government’s responsibility to enhance decent sanitation, electricity and to enforce protection of
the environment including forests and oceans for sustainable economy.
4.5 Summary of the chapter
This chapter looked into the environment of SAPO where the background of the organization
from way back was established; the aim of the background was to provide an overview of how
the postal business became important to date on the day to day activities of people and the
corporate world and further the organization’s visions and objectives were defined. The
processes and activities of SAPO were also discussed to give a clearer picture of how the
business is structured and conducted internally. Special reference was made from Sulleyman
(2011) in highlighting the challenges faced by SA Postal Services having an impact to the quality
and performance of the organization. The macro-environmental analysis was also conducted
where SAPO and the market environment, the macro environment, the political variables, the
social variables, the technological variables, the economic and physical variables were revealed
with how they affect how SAPO conduct its business.
The following chapter signifies the importance of this research on its entirety by discussing key
findings and results of the study. Topics such as performance management, quality management,
continuous improvement and ISO 9001:2008 QMS are discussed based on the results from
respondents’ perspectives on the study.

65
CHAPTER 5
RESULTS AND DISCUSSIONS
5.1 Introduction
According to Adèr and Mellenbergh (2008), data analysis is one of the most critical elements of
research because this is the process of modeling and inspecting it so as it provides useful
information. This chapter scrutinizes and elaborates on the results of the research; responses in
the form of questionnaires have been captured and analyzed by Statkon consultants thereby
producing reliable results that were selected and reported according to the relevance of the study.
5.2 SECTION A: Descriptives
This following section discusses the demographics of respondents that participated in the study;
it is imperative for the results discussions that responses be grouped as per categories below
because it gives more meaning to the data being analyzed and further break down the data into a
number of variables to be measured and reported. Frequency tables are found that indicate
constructs such as gender, age group, ethnic group, employment status, level of education, job
level and type of work environment. A total of 102 respondents returned the questionnaires
distributed; the following analysis classifies and discusses them as per the selected applied
chosen criteria of demographics.
Table 5.1 indicates that of the total significant 61.8% responses were males as opposed to
female’s 38.2% with regards to gender. Based on the age group analysis, a group of 31-40 years
participated mostly on the study followed by those between 41-50 years with 39.2% and 32.4%
consecutively.

66
Frequency Percent Valid PercentCumulative
Percent
Male 63 61.8 61.8 61.8
Female 39 38.2 38.2 100.0
Total 102 100.0 100.0
Frequency Percent Valid PercentCumulative
Percent
Below 18years 2 2.0 2.0 2.0
18-25 years 9 8.8 8.8 10.8
26-30years 14 13.7 13.7 24.5
31-40years 40 39.2 39.2 63.7
41-50years 33 32.4 32.4 96.1
Above 50years old 4 3.9 3.9 100.0
Total 102 100.0 100.0
Frequency Percent Valid PercentCumulative
Percent
Black 47 46.1 47.5 47.5
White 8 7.8 8.1 55.6
Coloured 40 39.2 40.4 96.0
Asian/Indian 3 2.9 3.0 99.0
Other 1 1.0 1.0 100.0
Total 99 97.1 100.0
Missing System 3 2.9
102 100.0
Frequency PercentValid
PercentCumulative
PercentTemp Labour 13 12.7 13.1 13.1
Permanent Part Time 3 2.9 3.0 16.2
Permanent 83 81.4 83.8 100.0
Total 99 97.1 100.0
Missing System 3 2.9
102 100.0
Frequency PercentValid
PercentCumulative
PercentPrimary education (Grade 3-7)
1 1.0 1.0 1.0
Secondary education (Grade 8-11)
15 14.7 14.7 15.7
Matric 50 49.0 49.0 64.7
Certificate/Diploma 21 20.6 20.6 85.3
Degree 9 8.8 8.8 94.1
Post Graduate qualification
6 5.9 5.9 100.0
Total 102 100.0 100.0
Frequency PercentValid
PercentCumulative
PercentOperations 45 44.1 44.6 44.6
Supervisory 16 15.7 15.8 60.4
Advisory/Specialist 18 17.6 17.8 78.2
Management 11 10.8 10.9 89.1
Other 11 10.8 10.9 100.0
Total 101 99.0 100.0
Missing System 1 1.0
102 100.0
Frequency PercentValid
PercentCumulative
PercentOffice based 28 27.5 27.5 27.5
Operations 58 56.9 56.9 84.3
Field work 9 8.8 8.8 93.1
Other 7 6.9 6.9 100.0
Total 102 100.0 100.0
Total
EMPLOYMENT STATUS
Total
HIGHEST LEVEL OF EDUCATION
Valid
YOUR JOB LEVELValid
Valid
WOULD YOU DESCRIBE YOUR WORK ENVIRONMENT AS?
Valid
GENDERValid
AGE GROUPValid
ETHNIC GROUPValid
Total
Table 5.1 Demographics

67
People below 18 and above 50 years old showed the lowest response rate; this could have been
influenced by factors such as only a few people are employed below eighteen years and perhaps
employees over fifty are not really interested in participating on projects any longer. With
regards to ethnic group, black and coloured people responded most with 46.1% and 39.2%
respectively; this percentage can be assumed to have occurred because black and coloured
people are dominating in the organization. A total of 81.4% respondents were permanent
employees with regards to the employment status.
According to table 5.1, the study revealed 49% of respondents to be in possession of Matric
followed by certificate/diploma qualifications with 20.6% and 14.7% being those having
secondary education. Responses from operational employees were the most by 44.1% according
to the job level analysis; this is the area of work that consists of most employees in the
organization. Furthermore according to the work environment analysis, 56.9% respondents were
working in operations while 27.5% were from office based environment.
Figure 5.1 Demographics

68
5.3 Factor Analysis
The results from the study were subjected to factor analysis so as to determine if any
interrelations can be further extracted from the variables. SPSS version 15 was utilized and
Principal component Analysis (PCA) method was used to extract data and a number of factors
were determined from all questionnaires’ sections with four factors being the most from Section
C. The suitability of data for factor analysis was assessed before running PCA, the Kaizer
Meyer-Oklin Measure of Sampling Adequacy (KMO) was used to verify that values are above
the recommended value of .6 for all factors and furthermore Bartlett’s tests of Sphericity
confirmed to be significant. For Section B, KMO was .889 at .000 sig. value; for Section C,
KMO was confirmed to be .873 at .000 sig. value; for Section D, KMO became .817 at .000 sig
value; For Section E, KMO was .828 at .000 sig. value; for Section F part one, KMO was
adequate at .901 with .000 sig. value and for Section F part two, KMO was .800 and Bartlett’s
test of Sphericity reached statistical significance at .000 supporting the factorability of the
correlation matrix.
Extracted components from principal components analysis were also confirmed to be having
eigenvalues exceeding 1 as recommended. A total variance of 50.3% was explained for Section
B with two factors extracted; 66.2% for Section C with four factors extracted; 48.86% for
Section D with also two factors extracted; 58.21% for Section E with two factors; 58.66% for
Section F part one with two factors extracted as well and a total variance of 58.5% explained for
Section F part two with two factors extracted. The Varimax with Kaizer Normalization rotation
method was also used to identify highest loading factors for all sections of the questions and
Direct Oblimin rotation used for second order factor matrix rotation.
5.4 Tests for Normality
Normality tests were conducted and confirmed before proceeding with further analyses; it is vital
for statistical analyses that distributions be confirmed for normality because this determines
whether it is reliable, robust and justifiable for use.

69
Analysis of Section B from the Questionnaire
Normally Dist. Not Normally Dist.30 years or younger .932
31 - 40 years .243
Older than 40 years .008Below Matric .309Matric .098Tertiary Level .267Operations .364Supervisory to Management .218
30 years or younger .03631 - 40 years .137Older than 40 years .204Below Matric .710Matric .200Tertiary Level .003Operations .625Supervisory to Management .009
AGE GROUP
Org
aniz
atio
nal S
trat
egy,
Pe
rfor
man
ce a
nd
Lea
ders
hip
Hum
an R
esou
rce
Fact
ors
NORMALITY MATRIX (Sig.)FACTORS AND VARIABLES
AGE GROUP
HIGHEST LEVEL OF
EDUCATIONYOUR JOB
LEVEL
HIGHEST LEVEL OF
EDUCATIONYOUR JOB
LEVEL
Table 5.2: Normality tests for two factors-F(I) Organizational Strategy, Performance and Leadership; F(II) Human Resource Factors.
Table 5.2 indicates analyses performed for two factors named FI-Organizational strategy,
Performance and Leadership and FII-Human Resource Factors; three variables were used for
both factors being age group, highest level of education and job level to assess normality.
Shapiro-Wik tests were used to test normality where group values on the degrees of freedom (df)
are below 50 and Kolmogrov-Smirnov test was used for variables and subscales equal and above
the value of 50 such as matric under the level of education. For age group, the distribution scores
seemed normally distributed for both subscales 30 years or younger at .932 and 31 to 40 years at
.243 being values greater than the recommended significant value of .05 (sig. p ≥0.05); the
construct older than 40 years is however not normally distributed with the sig. value of .008
being lower than the significant value of .05 therefore violating the assumption of normality. The
scores for other variables on the first factor such as level of education and job level were
normally distributed with values greater than the significant .05.
With regards to human resource factors, the variable age group indicates the measure of 30 years
or younger distribution not normal at the sig. value .36 lesser than the assumed 05 (sig. (p)
≥0.05) for normality; the distributions of scores for other two subgroups 31 to 40 years and older

70
than 40 years indicate normality. A similar situation is observed with the variable highest level of
education revealing two subgroups normally distributed while the tertiary level scores were not
normally distributed at .003 suggesting violation of the assumption of normality. The job level
grouping also indicated the subgroup supervisory to management not normally distributed at sig.
value of .009.
Analysis of Section C from the Questionnaire
Normally Dist. Not Normally Dist.30 years or younger .00831 - 40 years .036Older than 40 years .005Below Matric .082Matric .001Tertiary Level .013Operations .005Supervisory to Management .00530 years or younger .42131 - 40 years .344Older than 40 years .001Below Matric .040Matric .200Tertiary Level .002Operations .062Supervisory to Management .02730 years or younger .03331 - 40 years .003Older than 40 years .010Below Matric .072Matric .019Tertiary Level .006Operations .047Supervisory to Management .01130 years or younger .00331 - 40 years .014Older than 40 years .022Below Matric .065Matric .001Tertiary Level .001Operations .076Supervisory to Management .001
YOUR JOB LEVEL
FACTORS AND VARIABLESNORMALITY MATRIX (Sig.)
Impo
rtan
ce o
f QPM
Cus
tom
er
Req
uire
men
ts
AGE GROUP
HIGHEST LEVEL OF
EDUCATIONYOUR JOB
LEVEL
Non
-con
form
ance
M
anag
emen
t
AGE GROUP
HIGHEST LEVEL OF
EDUCATION
YOUR JOB LEVELEm
ploy
ee C
ontr
ibut
ion
to Q
M
AGE GROUP
HIGHEST LEVEL OF
EDUCATIONYOUR JOB
LEVEL
AGE GROUP
HIGHEST LEVEL OF
EDUCATION
Table 5.3: Normality tests for F(I) Importance of QPM; F(II) Customer Requirements; F(III) Nonconformance Management and F(IV) Employee Contribution to QM

71
Table 5.3 reveals results for factors that were extracted from the data for analyses and
discussions; it is evident from the results that most of the above groups’ scores were not
normally distributed, Shapiro-Wik tests were used to test normality where group values on the
degrees of freedom (df) are below 50 and Kolmogrov-Smirnov test was used for variables and
subscales equal and above the value of 50. Every variable indicated a value lesser than the
recommended sig. (p ≥ .05) for normality within some of its subgroups thereby violating the
assumption of normality. A discussion of those indicating normal distribution include only
responses from employees with below matric at the scores of .082 on the variable of education
level for the first factor; The second factor named customer requirements indicated score not
normally distributed at sig. value .001 for employees older than 40 years on age group while
others demonstrated normality at sig. values of .421 and .344 respectively. The variable named
highest level of education also indicated scores not normally distributed for respondents with
below matric and tertiary level qualifications with distribution scores below the required sig.
value of (p ≥ .05), their sig. values read .040 and .002 respectively. The job level on the same
factor reveals supervisory to management responses indicating the sig. value .027 violating the
requirements of normality distribution (p ≥ .05) as well. The factor non-conformance
management indicates all groups as not normally distributed with distribution scores lower than
the required sig. value of (p ≥ .05) except for the subgroup below matric at sig. value .072 under
the highest level of qualification variable. With regards to employee contribution to quality
management, most distribution scores for subgroups are also not normally distributed but the
exception of two normally distributed is observed on the subscales of below matric and
operations employees at sig. values .065 and .076 respectively. Pallant (2005:57) remarks that it
is often common for studies with larger samples to have results not normally distributed.
Table 5.4 below indicates normal distribution for all the variables and subgroups of factor
performance management, Shapiro-Wik tests were utilized to test normality where group values
on the degrees of freedom (df) are below 50 and Kolmogrov-Smirnov test was used for variables
and subscales equal and above the value of 50; the scores have exceeded the required sig. value
(p ≥ .05). With regards to change management, scores are not normally distributed for subgroups
across different variables; older than 40 years is at sig. value of .029, matric is at sig. value of

72
.036, tertiary level reads sig. value of .037 and supervisory to management is at sig. value of
.033.
Analysis of Section D from the Questionnaire
Normally Dist. Not Normally Dist.30 years or younger .83931 - 40 years .885Older than 40 years .208Below Matric .272Matric .200Tertiary Level .200Operations .345Supervisory to Management .10830 years or younger .32331 - 40 years .075Older than 40 years .029Below Matric .986Matric .036Tertiary Level .037Operations .066Supervisory to Management .033C
hang
e M
anag
emen
t
AGE GROUP
HIGHEST LEVEL OF
EDUCATIONYOUR JOB
LEVEL
FACTORS AND VARIABLESNORMALITY MATRIX (Sig.)
Proj
ect M
anag
emen
t
AGE GROUP
HIGHEST LEVEL OF
EDUCATIONYOUR JOB
LEVEL
Table 5.4: Normality tests for F(1) Performance Management and F(II) Change Management
Table 5.5 below consists of normally distributed scores and those that were not normally
distributed on both the factors of the section; this section was exploring the QMS requirements
and employees’ perceptions with reference to ISO 9001:2008 implementation in the
organization. Shapiro-Wik tests were also used to test normality where group values on the
degrees of freedom (df) are below 50 and Kolmogrov-Smirnov test was used for variables and
subscales equal and above the value of 50. For highest level of education, two subscales were not
normally distributed with sig. values of .006 and .044 respectively. The job level also indicated
scores not normally distributed with supervisory to management subscale at sig. value of .002.
With regards to the second factor named employee perceptions, a total of six subscales were not
normally distributed from the from age group to the last variable job level below; all these above
mentioned measures were below the required sig. value (p ≥ .05) therefore violating the
assumption of normality.

73
Analysis of Section E from the Questionnaire
Normally Dist. Not Normally Dist.30 years or younger .40031 - 40 years .052Older than 40 years .191Below Matric .205Matric .006Tertiary Level .044Operations .332Supervisory to Management .00230 years or younger .15531 - 40 years .002Older than 40 years .009Below Matric .131Matric .003Tertiary Level .005Operations .011Supervisory to Management .001
QM
S R
equi
rem
ents AGE GROUP
HIGHEST LEVEL OF
EDUCATIONYOUR JOB
LEVEL
Empl
oyee
Per
cept
ions
AGE GROUP
HIGHEST LEVEL OF
EDUCATIONYOUR JOB
LEVEL
FACTORS AND VARIABLESNORMALITY MATRIX (Sig.)
Table 5.5: Normality tests for F(1) QMS Requirements and F(11) Employee Perceptions
Section F of the research questionnaire consisted of two parts, the first part measured the
challenges of the organization while the second part explored employees’ views on the level of
quality in the organization. Table 5.6 below has been integrated for summary and analysis
purposes however the first two factors represent part one while the last two represent part two.
Similarly to discussions above, Shapiro-Wik tests were used on the analysis below to test
normality where group values on the degrees of freedom (df) were below 50 while Kolmogrov-
Smirnov test was used for variables and subscales equal and above the value of 50. Table 5.6
further indicates a total of seven subscales that were not normally distributed having scores
below the recommended sig. value of (p ≥ .05) for normality criteria. While these scores
appeared from different factors and variables, it also observed that some factors and groups’
distributions were perfectly normally distributed; internal structural challenges factor is a good
example in this regard. In the case below, most subscales were normally distributed having
values higher than the required sig. value (p ≥ .05) as opposed to the few that were not normally
distributed.

74
Analysis of Section F from the Questionnaire
Normally Dist. Not Normally Dist.30 years or younger .84631 - 40 years .747Older than 40 years .495Below Matric .708Matric .200Tertiary Level .615Operations .461Supervisory to Management .64030 years or younger .01931 - 40 years .038Older than 40 years .080Below Matric .673Matric .099Tertiary Level .012Operations .004Supervisory to Management .17030 years or younger .81331 - 40 years .233Older than 40 years .320Below Matric .037Matric .041Tertiary Level .261Operations .146Supervisory to Management .675
30 years or younger .29731 - 40 years .323Older than 40 years .012Below Matric .123Matric .059Tertiary Level .123Operations .096Supervisory to Management .194
Indi
cato
rs to
Exc
elle
nce
AGE GROUP
HIGHEST LEVEL OF
EDUCATIONYOUR JOB
LEVEL
Ope
ratio
nal S
tand
ards
AGE GROUP
HIGHEST LEVEL OF
EDUCATIONYOUR JOB
LEVEL
Wel
lbei
ng a
nd
Res
ourc
e C
ondi
tions AGE GROUP
HIGHEST LEVEL OF
EDUCATIONYOUR JOB
LEVEL
FACTORS AND VARIABLESNORMALITY MATRIX (Sig.)
Inte
rnal
Str
uctu
ral
Cha
lleng
es
AGE GROUP
HIGHEST LEVEL OF
EDUCATIONYOUR JOB
LEVEL
Table 5.6: Normality tests for F(I) Internal Structural Challenges; F(II) Wellbeing and Resource conditions; F(III) Indicators to Excellence; F(IV) Operational Standards.
5.5 Comparisons This section focuses on establishing if differences existed between groups of respondents on how
they perceived subjects in question on the research. The analysis considered both parametric and
non-parametric tests for the techniques used depending on the normality of distribution scores
however more of parametric testing was applied for testing and comparing groups than the latter

75
since parametric tests are considered robust enough to be used resulting to reliable comparisons
even on distributions that are not normal. Approaches used in this section involve One-way
Analysis Of Variance (ANOVA) and T tests; both have been used where practical according to
analysis guidelines as per nature and sizes of groups measured.
5.5.1 Age Group Analyses
Table 5.7 below gives a clear summary representation of the number of respondents per groups;
the mean scores and standard deviations for all factors and groups are also indicated. All samples
have been confirmed to be correct and accurate therefore will not affect the results of subsequent
analyses.

76
Lower Bound Upper Bound30 years or younger 25 3.25 .685 .137 2.97 3.53 2 531 - 40 years 40 3.07 .817 .129 2.81 3.33 1 4Older than 40 years 37 3.15 .905 .149 2.85 3.46 1 5Total 102 3.14 .816 .081 2.98 3.30 1 530 years or younger 25 3.79 .616 .123 3.53 4.04 3 531 - 40 years 40 3.68 .807 .128 3.43 3.94 2 5Older than 40 years 37 3.42 .942 .155 3.10 3.73 1 5Total 102 3.61 .826 .082 3.45 3.78 1 530 years or younger 24 3.56 1.075 .219 3.10 4.01 1 531 - 40 years 40 3.81 .776 .123 3.56 4.05 2 5Older than 40 years 37 3.67 .867 .143 3.38 3.96 1 5Total 101 3.70 .883 .088 3.52 3.87 1 530 years or younger 24 3.29 .782 .160 2.96 3.62 1 531 - 40 years 40 3.39 .776 .123 3.14 3.64 1 5Older than 40 years 37 3.34 1.064 .175 2.98 3.69 1 5Total 101 3.35 .885 .088 3.17 3.52 1 530 years or younger 24 3.45 .849 .173 3.09 3.81 2 531 - 40 years 40 3.28 1.073 .170 2.93 3.62 2 5Older than 40 years 37 3.16 .980 .161 2.84 3.49 1 5Total 101 3.28 .986 .098 3.08 3.47 1 530 years or younger 24 3.13 .982 .200 2.71 3.54 1 431 - 40 years 40 3.32 .943 .149 3.02 3.62 1 5Older than 40 years 37 3.20 1.026 .169 2.86 3.54 1 5Total 101 3.23 .976 .097 3.03 3.42 1 530 years or younger 24 2.73 .701 .143 2.43 3.03 1 431 - 40 years 40 2.58 .723 .114 2.35 2.81 1 4Older than 40 years 37 2.78 .869 .143 2.49 3.07 1 4Total 101 2.69 .773 .077 2.54 2.84 1 430 years or younger 24 3.54 .611 .125 3.28 3.80 2 431 - 40 years 40 3.43 .620 .098 3.23 3.62 2 4Older than 40 years 37 3.45 .820 .135 3.17 3.72 1 5Total 101 3.46 .693 .069 3.32 3.60 1 530 years or younger 24 3.61 .733 .150 3.30 3.92 2 531 - 40 years 40 3.63 .871 .138 3.35 3.90 1 5Older than 40 years 37 3.56 .807 .133 3.29 3.83 2 5Total 101 3.60 .810 .081 3.44 3.76 1 530 years or younger 24 3.97 .767 .157 3.65 4.30 2 531 - 40 years 40 3.91 .844 .133 3.64 4.18 1 5Older than 40 years 37 3.70 .958 .158 3.38 4.02 1 5Total 101 3.85 .870 .087 3.68 4.02 1 530 years or younger 25 3.29 .830 .166 2.95 3.63 2 531 - 40 years 39 3.14 .941 .151 2.83 3.44 1 5Older than 40 years 37 3.06 .859 .141 2.77 3.34 1 5Total 101 3.15 .881 .088 2.97 3.32 1 530 years or younger 24 3.65 1.061 .217 3.20 4.10 1 531 - 40 years 39 3.52 1.028 .165 3.19 3.85 1 5Older than 40 years 37 3.54 1.049 .172 3.19 3.89 1 5Total 100 3.56 1.035 .103 3.35 3.77 1 530 years or younger 24 2.48 .648 .132 2.20 2.75 1 431 - 40 years 40 2.50 .915 .145 2.20 2.79 1 5Older than 40 years 37 2.62 .841 .138 2.34 2.90 1 4Total 101 2.54 .826 .082 2.37 2.70 1 530 years or younger 25 3.07 .833 .167 2.72 3.41 1 531 - 40 years 40 3.17 .830 .131 2.90 3.43 1 5Older than 40 years 37 2.98 .727 .119 2.74 3.22 2 4Total 102 3.07 .791 .078 2.92 3.23 1 5
Mean_Wellbeing and Resource conditions
Mean_Indicators to Excellence
Mean_Operational Standards
Mean_Employee Contribution to QM
Mean_Project Management
Mean_Change Management
Mean_QMS Requirements
Mean_Employees Perceptions
Mean_Internal Structural challenges
MaximumMean_Org Strategy, performance and leadership
Mean_Human resource
Mean_Importance of QPM
Mean_Customer Requirements
Mean_Non-conformance Management
Descriptives
N Mean Std. Deviation Std. Error
95% Confidence Interval for Mean
Minimum
Table 5.7: The Age Group Descriptive table for comparisons.

77
Levene Statistic df1 df2 Sig.
Mean_Human resource 4.554 2 99 .013
Mean_Customer Requirements 3.477 2 98 .035
Test of Homogeneity of Variances
Table 5.8 Test of Homogeneity of Variances
Sum of Squares df Mean Square F Sig.
Between Groups .508 2 .254 .377 .687
Within Groups 66.759 99 .674
Total 67.267 101
Between Groups 2.356 2 1.178 1.754 .178
Within Groups 66.504 99 .672
Total 68.860 101
Between Groups .954 2 .477 .607 .547
Within Groups 77.095 98 .787
Total 78.049 100
Between Groups .144 2 .072 .090 .914
Within Groups 78.261 98 .799
Total 78.405 100
Between Groups 1.218 2 .609 .621 .539
Within Groups 96.029 98 .980
Total 97.246 100
Between Groups .602 2 .301 .311 .733
Within Groups 94.716 98 .966
Total 95.318 100
Between Groups .839 2 .419 .698 .500
Within Groups 58.911 98 .601
Total 59.749 100
Between Groups .215 2 .107 .220 .803
Within Groups 47.783 98 .488
Total 47.998 100
Between Groups .097 2 .049 .073 .930
Within Groups 65.441 98 .668
Total 65.538 100
Between Groups 1.297 2 .649 .855 .429
Within Groups 74.375 98 .759
Total 75.672 100
Between Groups .797 2 .398 .508 .603
Within Groups 76.779 98 .783
Total 77.575 100
Between Groups .279 2 .139 .128 .880
Within Groups 105.695 97 1.090
Total 105.973 99
Between Groups .433 2 .217 .313 .732
Within Groups 67.798 98 .692
Total 68.231 100
Between Groups .690 2 .345 .546 .581
Within Groups 62.565 99 .632
Total 63.254 101
Mean_Wellbeing and
Resource conditions
Mean_Indicators to
Excellence
Mean_Operational
Standards
Mean_Employee
Contribution to QM
Mean_Project
Management
Mean_Change
Management
Mean_QMS
Requirements
Mean_Employees
Perceptions
Mean_Internal Structural
challenges
Mean_Org Strategy,
performance and
leadership
Mean_Human resource
Mean_Importance of
QPM
Mean_Customer
Requirements
Mean_Non-conformance
Management
ANOVA
Table 5.9: Age Group ANOVA for comparisons

78
Statistic df1 df2 Sig.Mean_Human resource Brown-Forsythe 1.887 2 95.398 .157Mean_Customer Requirements Brown-Forsythe .093 2 88.209 .911
Robust Tests of Equality of Means
Table 5.10: Robust Tests for Age Group comparisons
Parametric tests were used for age grouping comparisons above, although some of the groups
were not normally distributed as per normality tests; parametric techniques were used because
they are robust enough to be used and provide reliable results. A one-way between groups
analysis of variance was conducted to explore the impact of respondents’ age levels on how they
perceive different factors of the research questions related to Quality and Performance
Management. Subjects were categorized into three groups according to their age (Group 1: 30
years or younger; Group 2: 31 to 40 years and group 3: older than 40 years). The Levene’s
homogeneity of variance test was used to assess the extent of equality on variance scores across
all factors and their age groupings; table 5.8 is a summary indication of the factors that showed
inequality of variances at significant values of .013 for the human resource factor and .035 for
the customer requirements factor. These factors have violated the required Levene’s sig. value of
.05 for homogeneity of variances assumption therefore a further Robust Test of Equality of
Means at table 5.10 became necessary to test the differences. There were no significant
differences found on the mean scores of age groups for human resource factor at sig. value of
.157 and also for the customer requirements factor at sig. value of .911.
ANOVA tests were also conducted for variables proven equality of variances at table 5.9; test
were done for all factors to test if differences existed on the mean scores between the age groups
concerned; there was no significant difference found between groups for the factors since their
sig. values were greater than the required (p>.05). This means age was not a contributing factor
at all to how respondents perceived (Org Strategy, performance and leadership; Human
resource; Importance of QPM; Customer Requirements; Non-conformance Management;
Employee Contribution to QM; Project Management; Change Management; QMS
Requirements; Employees Perceptions; Internal Structural challenges; Wellbeing and Resource

79
conditions; Indicators to Excellence and Operational Standards) towards the improvements of
quality and performance management at South African Postal Services.
5.5.2 Level of Qualification Analyses
This section critically compares respondents’ views as per their levels of qualifications.

80
Lower Bound Upper BoundBelow Matric 16 2.81 .873 .218 2.35 3.28 1 4Matric 50 3.25 .639 .090 3.07 3.44 2 5Tertiary Level 36 3.14 .977 .163 2.81 3.47 1 5Total 102 3.14 .816 .081 2.98 3.30 1 5Below Matric 16 3.11 .732 .183 2.72 3.50 2 5Matric 50 3.69 .720 .102 3.48 3.89 2 5Tertiary Level 36 3.73 .935 .156 3.41 4.05 1 5Total 102 3.61 .826 .082 3.45 3.78 1 5Below Matric 16 3.46 .857 .214 3.01 3.92 1 5Matric 50 3.81 .795 .112 3.59 4.04 1 5Tertiary Level 35 3.64 1.006 .170 3.29 3.99 1 5Total 101 3.70 .883 .088 3.52 3.87 1 5Below Matric 16 3.15 .832 .208 2.70 3.59 1 4Matric 50 3.51 .894 .126 3.26 3.77 1 5Tertiary Level 35 3.20 .876 .148 2.90 3.50 1 4Total 101 3.35 .885 .088 3.17 3.52 1 5Below Matric 16 2.81 .860 .215 2.35 3.27 2 4Matric 50 3.45 .961 .136 3.17 3.72 1 5Tertiary Level 35 3.24 1.028 .174 2.89 3.60 1 5Total 101 3.28 .986 .098 3.08 3.47 1 5Below Matric 16 3.08 1.043 .261 2.53 3.64 1 4Matric 50 3.43 .919 .130 3.17 3.69 1 5Tertiary Level 35 3.00 .990 .167 2.66 3.34 1 4Total 101 3.23 .976 .097 3.03 3.42 1 5Below Matric 16 2.46 .938 .234 1.96 2.96 1 4Matric 50 2.91 .737 .104 2.70 3.12 1 4Tertiary Level 35 2.48 .666 .113 2.25 2.71 1 4Total 101 2.69 .773 .077 2.54 2.84 1 4Below Matric 16 2.90 .808 .202 2.47 3.33 1 4Matric 50 3.61 .505 .071 3.47 3.76 3 5Tertiary Level 35 3.50 .755 .128 3.24 3.76 2 5Total 101 3.46 .693 .069 3.32 3.60 1 5Below Matric 16 2.95 .869 .217 2.49 3.42 1 4Matric 50 3.75 .647 .092 3.57 3.93 2 5Tertiary Level 35 3.67 .869 .147 3.37 3.97 2 5Total 101 3.60 .810 .081 3.44 3.76 1 5Below Matric 16 3.21 1.101 .275 2.62 3.80 1 5Matric 50 4.00 .741 .105 3.79 4.21 2 5Tertiary Level 35 3.92 .817 .138 3.64 4.20 2 5Total 101 3.85 .870 .087 3.68 4.02 1 5Below Matric 16 2.85 1.137 .284 2.24 3.45 1 5Matric 50 3.28 .849 .120 3.04 3.52 1 5Tertiary Level 35 3.09 .773 .131 2.82 3.35 1 5Total 101 3.15 .881 .088 2.97 3.32 1 5Below Matric 16 2.75 1.214 .304 2.10 3.40 1 5Matric 50 3.67 .958 .136 3.40 3.95 1 5Tertiary Level 34 3.77 .890 .153 3.46 4.09 1 5Total 100 3.56 1.035 .103 3.35 3.77 1 5Below Matric 16 2.34 .859 .215 1.88 2.79 1 4Matric 50 2.61 .864 .122 2.37 2.86 1 5Tertiary Level 35 2.52 .760 .128 2.26 2.78 1 4Total 101 2.54 .826 .082 2.37 2.70 1 5Below Matric 16 2.53 .697 .174 2.16 2.90 2 4Matric 50 3.22 .705 .100 3.02 3.42 2 5Tertiary Level 36 3.11 .858 .143 2.82 3.40 1 5Total 102 3.07 .791 .078 2.92 3.23 1 5
Mean_Indicators to Excellence
Mean_Operational Standards
Mean_Project Management
Mean_Change Management
Mean_QMS Requirements
Mean_Employees Perceptions
Mean_Internal Structural challenges
Mean_Wellbeing and Resource conditions
Mean_Org Strategy, performance and leadership
Mean_Human resource
Mean_Importance of QPM
Mean_Customer Requirements
Mean_Non-conformance Management
Mean_Employee Contribution to QM
Descriptives
N MeanStd.
Deviation Std. Error95% Confidence Interval for Mean
Minimum Maximum

81
Table 5.11: Level of Qualification Descriptives for Comparisons
Levene Statistic df1 df2 Sig.Mean_Change Management 5.191 2 98 .007
Test of Homogeneity of Variances
Table 5.12: Test of Homogeneity of Variances
Statistic df1 df2 Sig.Mean_Change Management Brown-Forsythe 5.985 2 44.973 .005
Robust Tests of Equality of Means
Table 5.13: Robust Test for Qualification Levels comparisons
Analyses of the level of qualifications grouping are indicated from table 5.11 above; Parametric
tests were also justifiably used because of their robustness considering that some of the factors’
scores were not normally distributed. Sample values, mean scores and standard deviations were
confirmed accurate and correct therefore subsequent analyses further conducted. A one-way
between groups analysis of variance was again conducted to explore if there will be differences
influenced by respondents varied levels of qualifications on how they viewed subjects in
question. Three groups were identified for measurements (Group 1: below matric; Group 2:
matric and group 3: tertiary level). The Levene’s homogeneity of variance test was used to
examine the extent of equality on variance scores across all factors and their groups; only the
change management factor as indicated on table 5.12 resulted to inequality of variance at sig.
value of .007 which is lower than the recommended (p>.05). The Robust test of equality of
means was further carried out (table 5.13 refers) to scrutinize means and significant differences
were observed at sig. value of .005 resulting to further Dunnett’s T3 tests below. The ANOVA
tests were further used for all variables that showed equality of variances, table 5.14 below
indicates the tests conducted for differences on mean scores throughout all factors and their
respective qualification level groups; significant differences were found for a number of factors
such as: the human resource factor at sig. value of .029, project management at sig. value of
.015, change management at sig. value of .001, QMS requirements at sig. value of .002,
employee perceptions at sig. value of .004, wellbeing and resource conditions at sig. value of

82
.002 and operational standards factor at sig. value of .008; all these factors were statistically
different since they were lesser than the required (p>.05) therefore leading to multiple
comparison tests being conducted to identify specific groups that are different amongst each
other.
Sum of Squares df
Mean Square F Sig.
Between Groups 2.383 2 1.192 1.818 .168Within Groups 64.884 99 .655Total 67.267 101Between Groups 4.759 2 2.379 3.675 .029Within Groups 64.101 99 .647Total 68.860 101Between Groups 1.655 2 .827 1.061 .350Within Groups 76.394 98 .780Total 78.049 100Between Groups 2.768 2 1.384 1.793 .172Within Groups 75.637 98 .772Total 78.405 100Between Groups 4.932 2 2.466 2.618 .078Within Groups 92.314 98 .942Total 97.246 100Between Groups 4.262 2 2.131 2.294 .106Within Groups 91.056 98 .929Total 95.318 100Between Groups 4.875 2 2.437 4.353 .015Within Groups 54.875 98 .560Total 59.749 100Between Groups 6.293 2 3.147 7.394 .001Within Groups 41.705 98 .426Total 47.998 100Between Groups 7.998 2 3.999 6.810 .002Within Groups 57.540 98 .587Total 65.538 100Between Groups 7.903 2 3.952 5.714 .004Within Groups 67.769 98 .692Total 75.672 100Between Groups 2.479 2 1.240 1.618 .204Within Groups 75.096 98 .766Total 77.575 100Between Groups 12.704 2 6.352 6.606 .002Within Groups 93.269 97 .962Total 105.973 99Between Groups .952 2 .476 .693 .502Within Groups 67.280 98 .687Total 68.231 100Between Groups 5.829 2 2.914 5.024 .008Within Groups 57.425 99 .580Total 63.254 101
Mean_Indicators to Excellence
Mean_Operational Standards
Mean_Project Management
Mean_Change Management
Mean_QMS Requirements
Mean_Employees Perceptions
Mean_Internal Structural challenges
Mean_Wellbeing and Resource conditions
Mean_Org Strategy, performance and leadership
Mean_Human resource
Mean_Importance of QPM
Mean_Customer Requirements
Mean_Non-conformance Management
Mean_Employee Contribution to QM
ANOVA
Table 5.14: Level of Qualification ANOVA for comparisons

83
Lower Bound Upper Bound
Matric -.573 .231 .051 -1.15 .00Tertiary Level -.617* .242 .043 -1.22 -.02Below Matric .573 .231 .051 .00 1.15Tertiary Level -.044 .176 .969 -.48 .39Below Matric .617* .242 .043 .02 1.22Matric .044 .176 .969 -.39 .48
Matric
Tertiary Level
(I) rA4.2
Mean Difference
(I-J)Std.
Error Sig.
95% Confidence Interval
Below Matric
Multiple ComparisonsDependent Variable: Mean_SecB_F2 Scheffe
Table 5.15 and Figure 5.2: Means of Human Resource factor
Based on the significant difference found on the human resource factor ANOVA analysis, a
further post-hoc test was conducted to identify the exact differences across groups of employee
responses. The post-hoc comparison using Scheffe test on Table 5.15 indicated that the mean
scores for the below matric group (M=3.11, SD=.732) was statistically different from the tertiary
level group (M=3.73, SD=.935). The matric respondents group (M=3.69, SD=.720) did not
differ significantly to either below matric or tertiary level group of respondents. The mean plot at
figure 5.1 also indicates the significant difference below matric being the lowest and tertiary
group being highest; although there was a significant difference, the actual variability on mean
scores (3.11, 3.69, 3.73) was very little. It is therefore revealed that there was a difference
between respondents with below matric and tertiary qualifications on how they perceived human
resource factor’s impact towards performance management.
Lower Bound Upper Bound
Matric -.455 .215 .112 -.99 .08Tertiary Level -.023 .226 .995 -.58 .54Below Matric .455 .215 .112 -.08 .99Tertiary Level .432* .165 .036 .02 .84Below Matric .023 .226 .995 -.54 .58Matric -.432* .165 .036 -.84 -.02
Below Matric
Matric
Tertiary Level
Multiple ComparisonsDependent Variable: Mean_SecD_F1 Scheffe
(I) rA4.2
Mean Difference
(I-J)Std.
Error Sig.
95% Confidence Interval
Table 5.16 and Figure 5.3: Means of Project Management factor

84
The Scheffe’s post-hoc test was also conducted for the project management factor following the
significant difference identified; table 5,2 above show a significant difference on the mean scores
of matric respondents group (M=2.91, SD=.737) and respondents with tertiary level
qualifications (M=2.48, SD=.666) . Respondents with below Matric qualifications showed no
significant difference with either of the two groups. Although a significant difference was
observed, the actual difference was very small between mean scores (2.46, 2.48, 2.91) as can be
seen on the descriptive table and mean plot. With regards to responses, there was a difference on
how employees with matric viewed the project management factor’s influence towards
continuous improvement as opposed to those with tertiary level qualifications.
Table 5.17 and Figure 5.4: Means of Change Management factor
Table 5.17 and Figure 5.3 above provides results for the change management factor analysis; The
Dunnett’s T3 post-hoc test was used identify where differences lie because there was neither
equality on both variances and mean scores during initial tests conducted. A significant
difference on the mean scores of only below matric respondents group (M=2.90, SD=.808) and
respondents with matric qualifications (M=3.61, SD=.506) was found. The mean plot and mean
scores (2.90, 3.50, 3.61) show that although there was a difference between how those with
below matric viewed changed management as opposed to those with matric qualifications; the
actual difference was not large.

85
Table 5.18 and Figure 5.5: Means of QMS Requirements factor
The Scheffe’s post hoc test was conducted for the QMS requirements factor, table 5.18 reveals
significant differences of mean scores between below matric (M=2.95, SD=.869) and matric
(M=3.75, SD= .647) groups as well as significant difference between below matric and tertiary
level group (M=3.67, SD=.869) of respondents as per their qualifications. This indicates that
people with below matric qualifications viewed QMS requirements in relation to ISO 9001:2008
differently from those with matric and tertiary qualifications; it is also clear that those with
matric shared the same views with respondents that have acquired tertiary qualifications. Figure
5.4 also show that actual differences on mean scores were not very large at (2.95, 3.67, and 3.75)
although they were considered significant.
Table 5.19 and Figure 5.6: Means of Employee Perception factor
The Scheffe’s post hoc test was also used for the employee perception factor because initial tests
resulted to equality of variance leading to subsequent ANOVA analyses for the factor; a
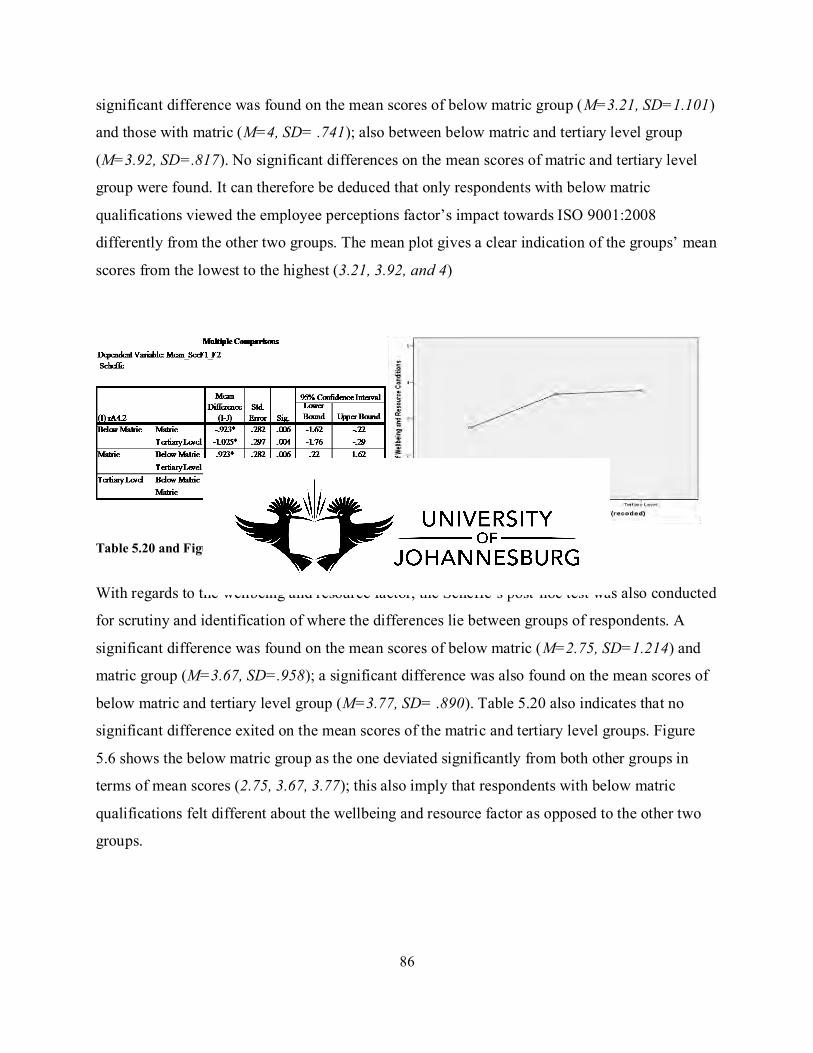
86
significant difference was found on the mean scores of below matric group (M=3.21, SD=1.101)
and those with matric (M=4, SD= .741); also between below matric and tertiary level group
(M=3.92, SD=.817). No significant differences on the mean scores of matric and tertiary level
group were found. It can therefore be deduced that only respondents with below matric
qualifications viewed the employee perceptions factor’s impact towards ISO 9001:2008
differently from the other two groups. The mean plot gives a clear indication of the groups’ mean
scores from the lowest to the highest (3.21, 3.92, and 4)
Table 5.20 and Figure 5.7: Means of Wellbeing and Resource Conditions factor
With regards to the wellbeing and resource factor, the Scheffe’s post-hoc test was also conducted
for scrutiny and identification of where the differences lie between groups of respondents. A
significant difference was found on the mean scores of below matric (M=2.75, SD=1.214) and
matric group (M=3.67, SD=.958); a significant difference was also found on the mean scores of
below matric and tertiary level group (M=3.77, SD= .890). Table 5.20 also indicates that no
significant difference exited on the mean scores of the matric and tertiary level groups. Figure
5.6 shows the below matric group as the one deviated significantly from both other groups in
terms of mean scores (2.75, 3.67, 3.77); this also imply that respondents with below matric
qualifications felt different about the wellbeing and resource factor as opposed to the other two
groups.

87
Table 5.21 and Figure 5.8: Means of Operational Standards factor
The operational standards factor also resulted to difference of mean scores on the ANOVA
analysis requiring the Scheffe’s post-hoc test to be conducted to identify where the differences
lie. It was observed that the mean scores for the below matric group (M=2.53, SD=.697) was
statistically different from the matric group (M=3.22, SD= .705) and the tertiary level group
(M=3.11, SD=.858); there was no significant difference found on the mean scores of matric and
tertiary level groups meaning only those with matric qualifications viewed the operational
standards factor’s contribution towards the level of quality differently from the other two groups.
Figure 5.7 gives a clear indication of the statistical differences on the mean scores for all the
groups (2.53, 3.11, and 3.22); the actual difference on the scores is little although the differences
seem wide on the plot.
Based on above results, it is indicated that people with below matric level of qualifications
showed differences from the other groups on several occasions; it is also important to note that
although they statistically differed from other groups, the actual difference on mean scores were
small and the differences could have been influenced by the sample size which happened to be
the smallest (below matric: N=16; matric: N=50; tertiary level: N= 35) from the total number of
responses.
5.5.3 Job Level Analyses
The job level analyses were conducted to determine if there will be differences on how the
respondents’ groups perceived the subjects in question. Parametric tests were also used for these
analyses because of their robustness considering that some of the factors’ scores were not

88
normally distributed. Sample sizes, mean scores and standard deviation values were confirmed
accurate and correct therefore subsequent analyses required to be further conducted.
Respondents’ groups were categorized into two named operations and supervisory to
management groups. Independent samples t-tests were considered for use in this regard because
only two groups of respondents were available for comparisons; two variables are available for
all analyses as required and recommended by Pallant (2005:206) being the groups and factors
tested.

89
Table 5.22: Group statistic tests for job level analysis
All samples, mean scores and standard deviation values were confirmed to be correct therefore
reliable for the independent samples test to be conducted.
An independent samples test was conducted as indicated on table 5.23 for all factors and their
job level groups; significant differences were found on the mean scores of few groups while
most indicated no significant differences as discussed below.

90
F Sig. Lower UpperEqual variances assumed .202 .654 -1.986 88 .050 -.304 .153 -.607 .000Equal variances not assumed -1.986 87.494 .050 -.304 .153 -.607 .000Equal variances assumed .241 .625 -3.047 88 .003 -.469 .154 -.775 -.163Equal variances not assumed -3.047 87.795 .003 -.469 .154 -.775 -.163Equal variances assumed .447 .505 -.990 87 .325 -.183 .185 -.550 .184Equal variances not assumed -.992 86.354 .324 -.183 .184 -.549 .184Equal variances assumed 1.336 .251 -.302 87 .764 -.057 .189 -.433 .319Equal variances not assumed -.302 84.749 .763 -.057 .189 -.433 .318Equal variances assumed .485 .488 -.242 87 .809 -.049 .201 -.448 .351Equal variances not assumed -.243 86.242 .809 -.049 .201 -.448 .350Equal variances assumed .245 .622 .505 87 .615 .098 .194 -.287 .483Equal variances not assumed .506 86.967 .614 .098 .194 -.287 .483Equal variances assumed .683 .411 .783 87 .436 .124 .158 -.191 .438Equal variances not assumed .783 86.828 .436 .124 .158 -.190 .438Equal variances assumed .481 .490 -.380 87 .705 -.053 .139 -.330 .224Equal variances not assumed -.380 86.999 .705 -.053 .139 -.330 .224Equal variances assumed .713 .401 -2.388 87 .019 -.382 .160 -.700 -.064Equal variances not assumed -2.383 83.546 .019 -.382 .160 -.700 -.063Equal variances assumed 2.664 .106 -1.150 87 .253 -.201 .175 -.548 .146Equal variances not assumed -1.152 85.352 .253 -.201 .174 -.547 .146Equal variances assumed 2.013 .160 .156 87 .877 .028 .182 -.334 .390Equal variances not assumed .156 80.888 .876 .028 .182 -.333 .390Equal variances assumed 9.288 .003 -.855 86 .395 -.181 .212 -.603 .240Equal variances not assumed -.863 75.653 .391 -.181 .210 -.600 .237Equal variances assumed 1.514 .222 -.652 87 .516 -.113 .173 -.456 .230Equal variances not assumed -.654 83.811 .515 -.113 .172 -.455 .230Equal variances assumed .133 .717 -.277 88 .782 -.044 .160 -.363 .274Equal variances not assumed -.277 87.583 .782 -.044 .160 -.363 .274
Independent Samples Test
t-test for Equality of Means
t dfSig. (2-tailed)
Mean Differenc
eStd. Error Difference
95% Confidence Interval of the Difference
Mean_Org Strategy, performance and leadership
Levene's Test for Equality of
Variances
Mean_Human resource
Mean_Importance of QPM
Mean_Customer Requirements
Mean_Non-conformance Management
Mean_Employee Contribution to QM
Mean_Project Management
Mean_Change Management
Mean_QMS Requirements
Mean_Employees Perceptions
Mean_Internal Structural challenges
Mean_Wellbeing and Resource conditions
Mean_Indicators to Excellence
Mean_Operational Standards
Table 5.23: Independent Samples Test
Table 5.23 shows the organizational strategy, performance and leadership factor’s Levene test
for equality of variances indicated the equality of variances at sig. value of .654 being larger than
the required (p>.05) for assuming equality of variances; furthermore there was a significant
difference on the mean scores of operations respondents (M= 3.06, SD=.697) and supervisors to
management [(M=3.36, SD=.752); t(88)= -1.986, p=.05]. This implies that there was a
difference on how operations employees viewed the organizational strategy, performance and
leadership factor towards performance management as opposed to supervisors and management.

91
The Levene’s test for equality of variances also showed equality of variances for the human
resource factor at sig value of .625; there was also a significant difference on the mean scores of
operations (M=3.47, SD=.748) and supervisors to management respondents [(M=3.94,
SD=.713); t(88)=-3.047, p=.003].These results indicated that both groups did not view the
human resource factor’s impact towards performance management the same.
The QMS requirements factor indicated equality of variances a sig. value of .401; there was
further a significant difference on the mean scores of operations (M=3.47, SD=.683) and
supervisory to management responses [(M=3.85, SD=.820); t(87)=-2.388, p=.019]. This reveals
that both groups did not regard QMS requirements’ influence to ISO 9001:2008 from the same
perspective.
The actual difference on the mean scores of all above factors and groups is very small although
there were significant differences observed across the groups in discussion. There was no
equality of variances observed for the wellbeing and resource conditions factor, the Levene’s test
for equality of variances resulted to the sig. value of .003 being lower than the required (p>.05)
for assuming equality. There was no significant difference on the mean scores of both operations
(M=3.56, SD=1.176) and supervisory to management [(M=3.74, SD=.759) t(75.653)=-8.63,
p=.391]. As indicated on table 5.23, other factors and groups resulted to both the equality of
variances and no significant difference on the mean scores of the groups implying that job level
had no impact on how they perceived respective factors in question.
5.6 Tests of Normality and Correlations
Table 5.24 below reflects the summary of normality tests that were conducted for all sections and
their factors; Kolmogrov-Smirnov tests were used because all factors’ degree of freedom values
were above the value of 50.
Most factors’ distribution scores were not normally distributed since their significant values were
below the required (p>.05) for assuming normality. The project management and internal
structural challenges factors resulted to non-significant values of .200 both being greater than the

92
recommended (p>.05) therefore indicating normal distributions.
Statistic df Sig. Statistic df Sig.Mean_Org Strategy, performance and leadership .092 102 .034 .971 102 .023
Mean_Human resource .112 102 .003 .968 102 .013Mean_Importance of QPM .170 101 .000 .924 101 .000Mean_Customer Requirements .110 101 .004 .948 101 .001
Mean_Non-conformance Management
.155 101 .000 .947 101 .000
Mean_Employee Contribution to QM
.139 101 .000 .922 101 .000
Mean_Project Management .068 101 .200* .981 101 .151Mean_Change Management .108 101 .005 .962 101 .005Mean_QMS Requirements .136 101 .000 .960 101 .004Mean_Employees Perceptions
.163 101 .000 .921 101 .000
Mean_Internal Structural challenges
.068 101 .200* .986 101 .390
Mean_Wellbeing and Resource conditions
.105 100 .009 .943 100 .000
Mean_Indicators to Excellence
.104 101 .009 .978 101 .082
Mean_Operational Standards.130 102 .000 .974 102 .043
Tests of NormalityKolmogorov-Smirnov Shapiro-Wilk
Table 5.24: Normality tests for all factors
Table 5.25 below represents the tests for correlation analysis across all factors of the research
questions; Non parametric correlation tests were considered best for analysis since most factors’
distribution scores were not normally distributed as per normality tests above. The Spearman
Rank Order Correlation (rho) was deemed applicable for the tests because a number of variables
were involved in the analysis. Applicable conditions of measure were considered and confirmed
to be correct and accurate such as sizes of coefficients (r) or sizes of absolute values, the
relationship between the variables in question, the sample sizes (N) and the level of significance
[sig. (2-tailed)] in this regard. For discussions, only the factors that have been highly correlated
and those with lowest correlations were highlighted below.

93
Mean_Org Strategy,
performance and
leadership
Mean_Human resourc
e
Mean_Importance of QPM
Mean_Custom
er Requirements
Mean_Non-
conformance
Management
Mean_Employ
ee Contribution to
QM
Mean_Project Manage
ment
Mean_Change
Management
Mean_QMS
Requirements
Mean_Employee
s Percepti
ons
Mean_Internal
Structural
challenges
Mean_Wellbeing
and Resource condition
s
Mean_Indicato
rs to Excelle
nce
Mean_Operati
onal Standar
ds
Correlation Coefficient 1.000 .724** .535** .703** .596** .544** .628** .625** .691** .440** -.295** -.124 .382** .190Sig. (2-tailed) .000 .000 .000 .000 .000 .000 .000 .000 .000 .003 .219 .000 .056N 102 102 101 101 101 101 101 101 101 101 101 100 101 102
Correlation Coefficient .724** 1.000 .497** .555** .623** .528** .500** .713** .706** .478** -.352** -.119 .447** .296**Sig. (2-tailed) .000 .000 .000 .000 .000 .000 .000 .000 .000 .000 .239 .000 .003N 102 102 101 101 101 101 101 101 101 101 101 100 101 102Correlation Coefficient .535** .497** 1.000 .434** .430** .327** .318** .656** .435** .449** -.165 .104 .119 .184Sig. (2-tailed) .000 .000 .000 .000 .001 .001 .000 .000 .000 .100 .304 .235 .066N 101 101 101 101 101 101 101 101 101 101 100 100 101 101Correlation Coefficient .703** .555** .434** 1.000 .648** .607** .696** .485** .621** .404** -.380** -.230** .470** .326**Sig. (2-tailed) .000 .000 .000 .000 .000 .000 .000 .000 .000 .000 .021 .000 .001N 101 101 101 101 101 101 101 101 101 101 100 100 101 101Correlation Coefficient .596** .623** .430** .648** 1.000 .508** .535** .669** .621** .412** -.473** -.161 .443** .363**Sig. (2-tailed) .000 .000 .000 .000 .000 .000 .000 .000 .000 .000 .109 .000 .000N 101 101 101 101 101 101 101 101 101 101 100 100 101 101Correlation Coefficient .544** .528** .327** .607** .508** 1.000 .620** .412** .477** .302** -.256** -0.167 .364** .159Sig. (2-tailed) .000 .000 .001 .000 .000 .000 .000 .000 .002 .010 .096 .000 .113N 101 101 101 101 101 101 101 101 101 101 100 100 101 101Correlation Coefficient .628** .500** .318** .696** .535** .620** 1.000 .452** .448** .224** -.372** -.312** .487** .112Sig. (2-tailed) .000 .000 .001 .000 .000 .000 .000 .000 .024 .000 .002 .000 .266N 101 101 101 101 101 101 101 101 101 101 100 100 101 101Correlation Coefficient .625** .713** .656** .485** .669** .412** .452** 1.000 .589** .509** -.350** -.011 .368** .351**Sig. (2-tailed) .000 .000 .000 .000 .000 .000 .000 .000 .000 .000 .911 .000 .000N 101 101 101 101 101 101 101 101 101 101 100 100 101 101Correlation Coefficient .691** .706** .435** .621** .621** .477** .448** .589** 1.000 .553** -.303** -.121 .447** .311**Sig. (2-tailed) .000 .000 .000 .000 .000 .000 .000 .000 .000 .002 .231 .000 .002N 101 101 101 101 101 101 101 101 101 101 100 100 101 101Correlation Coefficient .440** .478** .449** .404** .412** .302** .224** .509** .553** 1.000 -.009 .147 .196 .383**Sig. (2-tailed) .000 .000 .000 .000 .000 .002 .024 .000 .000 .927 .144 .050 .000N 101 101 101 101 101 101 101 101 101 101 100 100 101 101Correlation Coefficient -.295** -.352** -.165 -.380** -.473** -.256** -.372 -.350** -.303** -.009 1.000 .607** -.426** -.056Sig. (2-tailed) .003 .000 .100 .000 .000 .010 .000 .000 .002 .927 .000 .000 .575N 101 101 100 100 100 100 100 100 100 100 101 100 100 101Correlation Coefficient -.124 -.119 .104 -.230* -.161 -.167 -.312** -.011 -.121 .147 .607** 1.000 -.410** .024Sig. (2-tailed) .219 .239 .304 .021 .109 .096 .002 .911 .231 .144 .000 .000 .811N 100 100 100 100 100 100 100 100 100 100 100 100 100 100Correlation Coefficient .382** .447** .119 .470** .443** .364** .487** .368** .447** .196 -.426** -.410** 1.000 .446**Sig. (2-tailed) .000 .000 .235 .000 .000 .000 .000 .000 .000 .050 .000 .000 .000N 101 101 101 101 101 101 101 101 101 101 100 100 101 101Correlation Coefficient .190 .296** .184 .326** .363** .159 .112 .351** .311** .383** -.056 .024 .446** 1.000Sig. (2-tailed) .056 .003 .066 .001 .000 .113 .266 .000 .002 .000 .575 .811 .000N 102 102 101 101 101 101 101 101 101 101 101 100 101 102
Mean_Wellbeing and Resource conditions
Mean_Indicators to Excellence
Mean_Operational Standards
Mean_Employee Contribution to QM
Mean_Project Management
Mean_Change Management
Mean_QMS Requirements
Mean_Employees Perceptions
Mean_Internal Structural challenges
Mean_Org Strategy, performance and leadershipMean_Human resource
Mean_Importance of QPM
Mean_Customer Requirements
Mean_Non-conformance Management
Nonparametric CorrelationsSpearman's rho
Table 5.25: Non Parametric Correlation tests for all factors
A very strong positive correlation was observed between the organizational strategy,
performance and leadership factor and the human resource factor (r=.724, n=102, p< .05); this
indicates that there is a strong relationship between the two factors and respondents felt that both
organizational strategy, performance and leadership with human resources should be in line with
94
and equally integrated to performance management objectives and approaches in the
organization. A very strong positive correlation was also indicated between the human resource
and change management factor (r=.713, n=101, p<.05); this means that a good relationship exist
between performance management and continuous improvement (Section B and D of the
questionnaire) and further a positive outcome of one will consequently result to a positive
achievement of the other. Human resources are also strongly positively correlated with the QMS
requirements factor (r=.706, n=101, p<.05) indicating a good relationship between some aspects
of performance management and ISO 9001:2008. There was also a positive strong correlation
between the following factors: Importance of QPM and the change management factor (r=.656,
n=101, p<.05); customer requirements and organizational strategy, performance and leadership
(r=.703, n=101, p<.05); customer requirements and project management (r=.696, n=101, p<.05);
between nonconformance management and change management (r=.669, n=101, p<.05); QMS
requirements and organizational strategy, performance and leadership (r=691, n=101, p<.05).
Including these noted above, most of the factors indicated quite a strong positive relationship
between one another; this is a good indication as this shows that if improvements are to be
established organization wide, these factors should be considered equally important and it would
be not beneficial to overlook at the others while focusing on some.
A few factors also indicated weak negative correlations while none indicated strong negative
correlations; there was a small negative correlation between the organizational strategy,
performance and leadership and wellbeing and resource conditions factor (r=-0.124, n=100,
p>.05), there was also a weak negative correlation between change management and the
wellbeing and resource conditions factor (r=-.011, n=100, p>.05), there was further a weak
negative correlation between QMS requirements and well being and resource conditions (r=-
.121, n=100, p>.05), a weak negative correlation was also observed between the employees
perception and internal structural challenges factor (r=-.009, n=100, p>.05), the internal
structural challenges factor also had a weak correlation with importance of QPM at (r=-.165,
n=100, p>.05), there was furthermore a small correlation between the operational standards and
internal structural challenges factor (r=-.056, n=101, p>.05). Factors above have reached weak
correlations between each other and have also not been statistically significant since they
exceeded the required (p<.05) to reach statistical significance. The level of correlation between

95
the factors also indicate that although there is a relationship, it is very little therefore one factor
consequently will have a very small influence over the other; negative correlations also typically
indicate that respondents felt that regarding one factor as important does not necessarily result to
the importance of the other and certain areas of the organization can be improved while others
not.
5.7 Frequencies Section B: Performance Management
Strongly Disagree Disagree Neutral Agree
Strongly Agree Total
Count 9 11 13 44 25 102
Row N % 8.8% 10.8% 12.7% 43.1% 24.5% 100.0%
Count 8 18 14 52 9 101
Row N % 7.9% 17.8% 13.9% 51.5% 8.9% 100.0%
Count 16 24 29 27 6 102
Row N % 15.7% 23.5% 28.4% 26.5% 5.9% 100.0%
Count 9 23 29 34 7 102
Row N % 8.8% 22.5% 28.4% 33.3% 6.9% 100.0%
Count 6 17 19 47 12 101
Row N % 5.9% 16.8% 18.8% 46.5% 11.9% 100.0%
Count 13 10 17 37 23 100
Row N % 13.0% 10.0% 17.0% 37.0% 23.0% 100.0%
B13 There is sufficient communication on the importance of performance improvements in SAPO
Count 16 31 25 28 2 102
B10 Training and development is offered to improve employee performance efforts
B12 Employing appropriate people for the job contributes to improved work performance in SAPO
B3 You are encouraged to be involved to enhance SAPO’s performance efforts
B4 SAPO’s performance management is related to processes and activitiesB7 Management support better employee performances
B8 Management encourage better employee performances
To what extent do you agree with each of the following statements?
Table 5.26: Summary frequencies for Performance Management
Attention and focus need to be given to a number of factors in the SA Post Office; table 5.26
clearly indicates that not all employees are encouraged to enhance the organization’s
performance efforts while only a certain percentage agree that these efforts are aligned to
processes and objectives. It is also revealed that a significant amount of employees believe that
management does not support better employee performance while training and development is

96
not provided for all. Furthermore a percentage of employees believe that employing appropriate
personnel for the job will improve work performance while others think it’s not really important;
it is also established that most employees do not agree that there is sufficient communication
organization wide on the importance of performance improvements.
Section C: Quality Management
Strongly Disagree Disagree Neutral Agree
Strongly Agree Total
Count 4 10 18 49 20 101
Row N % 4.0% 9.9% 17.8% 48.5% 19.8% 100.0%
Count 4 10 26 43 18 101
Row N % 4.0% 9.9% 25.7% 42.6% 17.8% 100.0%
Count 8 11 15 48 18 100
Row N % 8.0% 11.0% 15.0% 48.0% 18.0% 100.0%
Count 10 15 25 43 7 100
Row N % 10.0% 15.0% 25.0% 43.0% 7.0% 100.0%
Count 7 22 18 41 12 100
Row N % 7.0% 22.0% 18.0% 41.0% 12.0% 100.0%
Count 12 22 19 37 11 101
Row N % 11.9% 21.8% 18.8% 36.6% 10.9% 100.0%
Count 11 24 18 37 10 100
Row N % 11.0% 24.0% 18.0% 37.0% 10.0% 100.0%
C17 Quality is regarded as highly important by everyone at work
C13 Non-conformances are always identified on time in SAPO
C14 Non-conformances are properly controlled in your organization
C10 Employees are involved on quality improvement initiatives
To what extent do you agree with each of the following statements?
C2 Quality management improves communication at work
C3 Quality helps managing resources more accurately in SAPOC4 Quality improves management’s commitment at work
Table 5.27: Summary frequency analysis for Quality Management
Table 5.27 also indicates how employees expressed their views regarding quality management in
the organization; as it can be seen communication, involvement of employees, non-
conformances and resources are key areas that need be given attention while quality management
is being emphasized as imperative for organizational success.
5.8 Recommendations
A number of techniques have been applied and illustrated on above results’ section to inquire
more in depth on the research question; a comprehensive review of literature have also been

97
conducted to support the research case and based on the findings the following recommendations
were drawn.
As per correlation analyses, all factors of the research questionnaire were tested to identify the
extent of relationships between them. Positive relationships were revealed between factors such
as human resources and organizational strategy, performance and leadership both being
indicators to performance management in the organization; results indicated that these factors
should be considered highly by management if they are to achieve successfully performance
driven cultures organization wide and further a performance management framework that will
integrate them for implementation will be effective and beneficial. An indication of a strong
positive correlation between the human resource and change management factors emphasized the
importance and need for the human capital function to regard change management as one of the
pivotal strategic objectives that should be added on their plans; change management programs
become part of the SAPO’s journey towards business excellence and the human resource
function plays a vital role in that regard therefore approaches of how the programs will be
integrated and managed in line with the organization’s direction must be put in place and results
monitored. Based on the results, it was also revealed that the human resource factor had a strong
positive relationship with QMS requirements; these factors were drawn from the performance
management and ISO 9001:2008 questionnaires respectively and therefore indicated that human
resource activities play a significant role in enabling better employee performances which
consequently result in positive contributions to the ISO 9001:2008 project implementation and
maintenance in the organization therefore the ISO project should also be integrated on HR plans
and objectives. Furthermore there was also a strong positive correlation between the Importance
of QPM and change management factor; these factors represented both quality management and
continuous improvement sections of the questionnaire, it is therefore recommended based on the
correlation that all quality efforts engaged by SAPO be measurable and results indicate ongoing
trends of continuous improvement while factors such as quality and performance alongside
change management are considered equally significant towards positive results of the
organization.
The customer requirements factor also resulted to a strong positive correlation with
organizational strategy, performance and leadership; positive results of this relationship become

98
practically and significantly attainable if SAPO can effectively define both its requirements and
those of its customers through efforts such as customer surveys, continuous review of service
level agreements with suppliers and customers, continuous market analyses and various
applicable means, and thereby aligning them with its performance objectives and strategy.
Factors such as customer requirements and project management, nonconformance management
and change management including QMS requirements and organizational strategy, performance
and leadership also resulted to positively strong correlations; this is a good indication and it is
therefore strongly recommended that the organization regards the impact of the interaction and
extent of influence these factors may have among each other towards the improvements of
quality and performance management.
The human resource factor have appeared to be correlated strongly and positively on many
occasions; this is an indication that no methodology can be implemented successfully without the
consent, excitement and involvement of knowledgeable employees from all levels therefore the
organization should consider personnel as the most powerful tool towards its success and
empower them accordingly.
A few negative correlations were also observed from the research findings, it is however
important to note that these variables were derived from different research areas such as
performance management, quality management, continuous improvement, ISO 9001:2008,
challenges and level of quality on the questionnaire. Negative but weak correlations were
revealed between internal structural challenges and employees perceptions, QMS requirements
and wellbeing and resource conditions, operational standards and internal structural challenges;
including other few. Since these concepts have indicated no correlated relationship under the SA
Post Office context, it is important that further research be conducted so as to establish if a
relation between them exists and if they can be aligned together for process optimization in other
service organizations.
It is also important that SA Post Office implement systems that will provide for and effectively
monitor the provision of all necessary resources while cultural change is being instilled from top
to bottom before improvement frameworks can be adopted; a lack of necessary resources to do
the job due to financial constraints far too often has been observed as a critical element that leads

99
to frustrations at managerial level and this goes down to employee level since support,
encouragement, development, recognition is consequently no longer given to employees.
Figure 5.8 below is a process flow diagram of Mail Business. It indicates all processes involved
from accepting mail items from the external customer to delivery of mail items to the external
customer; there is a strong link between every function, resource, activity and process to ensure
good quality of work is provided (SAPO, 2010). Continual improvement involves making
continual small improvements to a process rather than big changes at irregular intervals. This
requires close monitoring and control, changes to the uses of manpower, machinery, methods,
materials and money to improve business efficiency. SAPO must ensure that continuous
improvement takes place in every section of work by effectively implementing projects that are
to be successful nationwide.
Figure 5.9: SAPO Process flow chart of Mail Business (SAPO, 2008)
It is the responsibility of management to ensure that the staff from the forefront of the business
where mail items are accepted from clients are highly professional, there should be constant
communication with customers and friendly relationships maintained while making sure that
queues are reduced to avoid keeping customers lengthy hours in retail offices; this can be
Process 3:
Outward Processing of mail items at the mail centre
Process 1:
Acceptance of mail items at retail outlets
and posting boxes
Process 2:
Outward / outbound process of collecting mail items
Process 4:
National Transportation
Process 5:
Inward Processing of mail items
Process 6:
Regional Distribution items to retail outlets
Process7:
Delivery of mail items to customers

100
attained by providing interesting developmental training such as job rotation, taking employees
to quality, leadership and financial courses to enhance their skills and conduct at workplace. A
team of dedicated customer focused agents may also be put in retail offices, this will help with
identifying business improvement needs of customers while courtesy will also be encouraged
when complaints are dealt with promptly and corrective actions are put in place. It is discovered
also that mail distribution (transport) can play an imperative role if systems are developed to
ensure on time arrivals for both delivery and collection of mail in offices, this will increase the
level of reliability where customer expectations will be met. Quality can be improved and
maintained if all functions in the “7 end to end” processes of the value chain work as a unit
where all related activities are combined and teamwork is encouraged from the top the lowest
level of the business.
Furthermore the organization should implement a system of communication both with internal
and external customers where bulk mailers such as Home Choice and Unisa provide pre-volume
stats a day or two before the mail is handed to the Post Office, this will allow for better
preparations of resources in terms of mini-tainers, rolltainers, trays and all necessary containers
including scheduling trucks in advance for forecasted volumes to avoid unnecessary delays due
to capacity constraints. This will significantly reduce the operations lead time and customers will
receive their items on time.
SA Post Office has a Learning and development function (Learning Institute) responsible for
liaising with HCM in identifying the need for providing skills to the internal customers, courses
and programs aligned with industry demands are brought to employees attention by means of
internal advertisements and also immediate superiors identifying a need for skills as per job
requirements. Learning Institute plays a vital role in boosting personnel’s morale, enhancing
consistency on processes, encouraging participation and involvement and by generally creating a
competitive internal environment which is the requirements of quality management systems.
Figure 5.8 is a summary of responses from different employees at different levels of the
organization during informal interviews conducted with them regarding structure, change
management, leadership, strategy implementation and communication in connection to quality
and performance management.

101
Mail Business in a good environment to work in however we need to place additional focus on recognition of employees. It must be highlighted that the issuing of corporate clothing was a step in the right direction.
Mail business is reactive and not pro-active. We are siting with old executives who want thinks to e done there way because of their experience; they are not open to new ideas or initiatives. We are afraid to express oneself because we are not senior managers and above. Why still keep old people in this business and suppress new talent e.g- T&T; MDM and Mail processing others is history. We need to structure down Mail business in terms of business units that will give direction and create a room for improvement. FAILURE TO DO SO WE WILL ALWAYS SIT WITH EMPIRES( YOUR MONARCHY'S AND DICTATORS) Mail business is the back-bone of the organisation but I feel that is been managed like a no direction or leadership entity.
Let's zoom into staff morale Let's fix or improve on our service delivery and really take our business serious Let's revamp structures/processes and products that are not working anymore;
The biggest constraint in delivering change is PPD and it has to be restructured or re-organized;
We need to resolve our regional structures before we can embark on any change process. All support services in T&L must report to the Sen Manager only then will we have a common vision, goal, mission and strategy.
I think we need assistant from consultant or maybe a research should be done in order to be able to understand what could be the problem and how we can resolve the existing problem amongst the senior problem.
Continous feedback and free communication will make this Business stratergy work.
Yes I agree change starts with me and the attitude and mind set are the obstacles to change and I as a manager I need to allow upward communication so that I can listen and understand thier problems and we need to be proactive and communicate all developments in our BU irrespective of how small can be
Figure 5.10: Employee responses during informal interviews
It is strongly recommended that SA Post Office consider these above opinions highly since they
come from the ground and furthermore concerns expressed by employees represent the real day
to day challenges that organization faces leading to poor quality of services, continuously failing
projects, poor performance management approaches and others.
5.9 Suggestions for future work
Although the methodology was sufficient to provide for the opportunity to collect data that built
a strong research case that resulted to the findings of the current scenario on quality and
performance management in SAPO; it is recommended that future research be made on the
fundamentals adopting quality management and performance management systems in the postal
services since not much has been enquired to date on these research areas. This will give further
clarity if the concepts form part of the best practices the postal industry could adopt and
implement and will further provide more in depth empirical guidelines on the pitfalls and

102
opportunities. It is also suggested that additional qualitative tools be used to explore related
researches for comparisons and constructive criticism.

103
CHAPTER 6
CONCLUSIONS
Based on the study conducted, the findings and results discussed it can be deduced that the
objectives of the study have been achieved; the extent of quality and performance management
has been established in the organization. Furthermore the challenges in the approaches and
methods used to carry out activities, the structure and interaction of processes and functions and
how they affect the performance of the organization and the quality of service offered to
customers were also revealed leading to the following conclusions. Based on the literature
review, the results and discussions of the study; the objectives of the study were established to
have been achieved as per the following:
i. To determine the extent of quality and continuous improvement in the South African Postal
Services: Looking at the literature, Soltani et al (2008) pointed out that the objectives of
quality should be to meet and exceed customer expectations, to optimize performance
resulting to high competitiveness. They further refer to approaches to quality and indicate
that the transcended, the product based, the user based, the manufacturing-based and the
value based approaches when combined best define quality and how it should be regarded in
the industry. Ngunyen, (2008) described quality from a postal business point of view as
taking many forms; can be viewed from the delivery speed, reliability of the service
provided, physical conditions and appeal of the mail item when received by the client,
frequency of collections and pickups, time spent waiting in queues, operating hours or
customer involvement and courtesy depending how the customer perceives it. The results of
the study revealed communication, management’s commitment, resource management,
employee involvement and nonconformance management as factors that are not addressed
satisfactorily while having a significant impact to quality in the organization.
Based on the results of correlations in the study, factors such as importance of quality and
performance management, customer requirements, non-conformance management and employee
contribution to quality management represented the section of quality management on the
research questionnaire. These factors revealed that in SAPO a strong positive relationship existed

104
between them and factors such as change management, organizational strategy, performance and
leadership and project management. Based on above highlighted literature and results, it can be
deduced that quality and continuous improvement can effectively take place if all factors and
variables involved are regarded highly and engaged properly in the organization. This means
customer expectations, performance optimization, communication, resources, employees,
nonconformance, approaches to quality, functional factors including but not limited to delivery
speed, service reliability, appeal of mail items, frequency of collections, the lead time taken in
queues and customer involvement become crucial in achieving best quality and continuous
improvement practices in SA Postal Services.
ii. To identify challenges in the implementation of ISO and other related projects in the SAPO:
Burge (2009) was noted from the literature pointing out that Quality projects should be
communicated in sales and profits language, employees must be exposed to the impact their
contribution will make in the organization and opportunities must be identified and exploited
in alignment to the growth of the business. Section D of the research questionnaire was
focused on continuous improvement and consisted of project management related questions;
based on these questions it was found that 38.4% of the total respondents agreed that
strategic improvement projects were being implemented whereas 33.3% remained unsure and
15.2% disagreed; further 47.5% of total respondents in summing both disagreed and strongly
disagreed that the importance of strategic projects is communicated to all employees whereas
only 22.2% both agreed and strongly disagreed. It was also revealed that of the total, only
18.8% respondents both agreed and strongly agreed when combined that improvement
projects are always successfully implemented while a significant 52.5% both disagreed and
strongly disagreed. It was further discovered that 37% of the entire sample agreed and
strongly agreed that there is sufficient support to oversee improvement projects whereas 42%
disagreed and strongly disagreed when combined. Furthermore 31.7% of respondents
remained unsure to whether projects implemented lead to improvements, 35.6% agreed
whilst 22.8% disagreed. These results indicated sufficiently some of the key challenges
experienced by SAPO with regards to project implementation and management.
iii. To critically review approaches and methods used towards quality: Taking a retrospective
look at the results of the study once more, Section C of the research questionnaire was

105
focused on quality management. 48% of the total respondents agreed that quality efforts
improves management’s commitment at work whereas only 11% disagreed while 15% were
unsure; further it was also realized that 50% of respondents agreed that quality efforts
enhance the interaction of work processes at SAPO whereas 10% disagreed and 22%
remained unsure. 49.5% of the total sample agreed that work processes are continually being
optimized whereas 14.1% disagreed; it was also revealed that 41.6% of respondents agreed
that customer involvement was encouraged at work whereas 12.9% disagreed and 25.7%
were not clear. 49.5% of respondents indicated that customer complaints are promptly dealt
with while 11.1% disagreed. Having a look at Section E that discussed ISO 9001:2008; it
was observed that control of documents and records was perceived by most participants to be
in order, most of them also indicated that internal audits are conducted monthly and that
review meetings are conducted weekly. It was also interesting to realize that 36.4% of total
respondents indicated that inconsistent quality of services existed to a medium extent while
25.3% said to a small extent and 20.2% remarked to a large extent. Based on these results
SAPO was established to be following correct approaches to quality in principles although a
number of weaknesses existed on implementation.
The objectives of this study were achieved to a satisfactory level based on the discussions
highlighted above from the literature and research findings. One of the aims of this study was to
identify challenges experienced by SAPO on its strategic journey to success; the challenges vary
from competitive pressures in the industry, regulatory mandates by the organization’s
stakeholders, quality management, project implementation, structural challenges and internal
cultures.
o With regards to competitive industry pressure, the study has identified factors such as use of
old technology in the organization, lack of financial support to critical operational areas of the
business that need constant intervention. The current age pose a huge threat to the survival of the
postal industry, particularly mail business and it is important that an innovative strategic
management team continuously do research, benchmark and brainstorm on ways of bringing
SAPO at current technological speeds.

106
o The study also further identified factors hampering success of quality management in the
organization; it was revealed that inconsistency on processes and approaches to implementing
quality efforts are key areas nationally that affect SAPO. This leads to a number of operational
downfalls that affect the entire organization; a more structured framework to quality and project
implementation needs to be developed by the strategic team to guide the organization and a
significant margin of failures will be eliminated progressively going forward.
o Technology in the form of electronic communications has been identified as one of the most
important aspect that has taken charge in the current and future age consequently replacing a
traditional physical mailing system; this study was not aimed at enquiring this factor into its
greater depth therefore it is important that future studies can be conducted on how technology
can enhance and improve the quality and performance of postal organizations in order to reveal
and detail approaches to be used by SAPO in exploiting electronic communication for greater
prospects. Further research may also be conducted on the extent to which regulatory
requirements affect postal services in order to determine the possibilities of reviewing and
establishing more interactive performance driven criteria between organizations and stakeholders
considering the current technological dilemma faced by the industry.
6.1 Quality Management
Efforts to quality management have been observed to be progressively in motion in the
organization; it is the responsibility of everyone to realize that quality is everyone’s job and at
times there is a cost to quality. Management need to empower employees organization wide,
employees need to take ownership and responsibility of processes for quality and continuous
improvement to take place. The culture of good quality practice can be reinforced where
everyone appreciates the act of doing things right the first time always and giving the best
precision on their work.
A documented standardized structure or framework to project implementation is a tool for doing
away with unsuccessful projects; costs will be carefully controlled and risks will be identified on
time and proactively eliminated leading to winning projects in the organization. Consultations

107
and benchmarks with external industry experts where knowledge is limited internally would also
help in using correct approaches to projects and improvement implementation in the
organization. This is referred to in particular projects such as ISO 9001:2008 implementation that
begun in 2006 and hasn’t been completed organization wide to date; lack of knowledge and
experience from the champions lead to a very long time and money spent in the organization. It
is imperative that the organization carefully assess the size of the project very careful and
establish if the capacity to carry it out internally exist or not, this will be determined by the
project framework if it is to be adopted and where necessary consultants will be brought on
board to implement winning formulae.
The culture of continuous improvement needs to be strongly reinforced in the organization; the
majority of responses indicated that funds are not always available to optimize operations, that
there is not sufficient support to oversee successful implementation of projects from the higher
levels of the organization and employees are not always excited about continuous improvement.
This is an indication that basic principles of continuous improvement need to be urgently
addressed; the organization has an opportunity of looking at factors such instilling positive
cultures from upper levels to the operational levels. This can be attained if more availability and
time is dedicated to employees and operations where higher management make extra efforts to
involve employees, to hold improvement forums with them, to encourage ownership of the
organization from below to top, to recognize good performance and reward those that
demonstrate excellence. This will improve the communication and support from higher levels
because seniors will realize the importance of supporting projects in the operations where
necessary.
6.2 Performance Management
The performance of South African Post Office is generally well considering that the organization
attains and yields positive returns yearly on its business; a number of areas can be addressed to
improve performance management in the organization. The organization needs to view
performance management from the holistic perspective; it is important that the organizational
objectives and goals be attached to day to day activities of the organization. It is not helpful to

108
have profound and best objectives on display and paper if they are not practiced internally; that
defeats the entire purpose of their existence.
It is the responsibility of management to establish performance systems in the organization that
will appreciate and manage performance efforts holistically from all applicable corners;
performance management need not be viewed typically from employees’ activities but should be
perceived as an integration of employee efforts with resources, systems, culture and good
leadership practices where approaches are developed to linking all necessary aspects that will
pursue the organization to success.

109
LIST OF REFERENCES 1. Abernathy, W. B., (2010), A Comprehensive Performance Analysis and Improvement
Method. Performance Improvement, vol 49, No 5. 2. Accenture Research and Insights, (2011). Achieving high performance in the Postal Industry.
www.accenture.com. 3. Alshbiel, S.O., Al-Awaqleh, Q.A. (2012). JIT Production System and its Effect on Achieving
Competitive Advantage for Public Shareholding Industrial Company in Jordan. Vol 4,No 6. 4. Aranda, D.A., Bustinza, O.F. and Molina, V.B. (2011). Operations flexibility and outsoursing
benefits: an empirical study in service firms. Vol. 31, No. 11, 2011, 1849–1870 5. Armstrong, M. and Baron, A. (1998). Performance Management-the new realities. The
Institute for Personnel Development, London. 6. Bateman T.S. & Snell S.A., (2002). Management: competing in the new era. 5th ed. New
York. McGraw-Hill Higher Education. 7. Beko, J. and Jagric, T. (2011), Demand models for direct mail and periodicals delivery
services: Results for a transition economy. Applied Economics, 43, 1125–1138 8. Blanchard, B.S. (2004). System engineering management, Wiley, Hoboken, NJ. 9. Boron S, Murray K. (2004). Bridging the unsustainability gap: a framework for sustainable
development. Sustainable Development 12: 65–73. 10. Boulter, L. and Bendell, T. (2002), How can ISO 9000:2000 help companies achieve
excellence?, Measuring Business Excellence, 6(2), pp. 37-41. 11. Burge, R. C., (2009). The Baldridge Journey, Learning from one company’s quest for
excellence. www.iienet.org/magazine/feb09/quality 12. 13. Charantimath, P. M. (2003). Total Quality Management. Pearson Education India 14. Chan, H.K., Yin, S., & Chan, T.S. (2010). Implementing just-in-time-philosophy to reverse
logistics systems: a review. Vol. 48, No. 21, 1 November 2010, 6293–6313 15. Creswell, J. W. (2003). Research design: Qualitative, Quantitative and mixed method
approaches. Thousand Oaks, Ca: Sage. 16. Crew, M., & Kleindorfer, P. (2002). Postal and Delivery services: Delivering on
Competition. 17. Dale, B.G., Van Der Wiele, A., & Van Iwaarsen, J.D. (2009). TQM an overview. In: Dale,
B.G, Van Der Wiele, A. & Van Iwaarsen, J.D (eds.) Managing Quality. 5th ed. Malden, MA: Blackwell Publishing
18. Dale, M. (2003). Manager’s guide to recruitment and selection. Sterling: Kogan-Page. 19. Dyllick, T. (2001), Beyond the Business Case for Corporate Sustainability, 11, 130–141 20. Evans, J.R. & Lindsay, W.M. 2008. The management and control of quality. 7th ed. Masan,
OH: Thomson South-Western 21. Fleisher C.S. (2004). Competitive Intelligence Education: Competencies, Sources, and
trends. The information management Journal, March/April:56-62 22. Fowler A, (1993). Performance management: the MBO of the ‘90s’? In Personnel
Management. July 1990. 23. Foster, S. Thomas (2004). Managing Quality an Integrative Approach. Pearson Prentice Hall 24. Gupta, A. K., (2011), A Conceptual JIT Model of Service Quality. International Journal of
Engineering Science and Technology (IJEST), Vol. 3 No. 3 Mar 2011
110
25. Hanna, D. Mark and Newman, Rocky, W. (2001): Integrated Operations Management Adding Value for customers. Prentice Hall, Inc.
26. Hair, J.F., Bush, R.P. & Ortinau, D.J. (2003). Marketing Research with a changing Information Environment. New York: McGraw- Hill Irwn.
27. Halloran, P. M. (2008). An exploratory analysis of the implementation of the Malcom Baldridge Quality Framework of selected Illinois school districts: A case study of two Lincolin Foundation Quality Awards winners. Illinois State University
28. Hasim, H. Rasid, S. Z. and Ismail. W. K., (2011): Customer Service Quality in A Public Agency in Malaysia: Towards A Customer-Focused Public Organization. Australian Journal of Basic and Applied Sciences, 5(9): 1777-1783
29. Herbst, F. J. (2004). Lecture on questionnaire design, TWR MBA programme, South Africa. 30. Hsier, J.J., Rai, A., P, S., Zhang, T. (2012). Impact of User Satisfaction with Mandated CRM
Use on Employee Service Quality. MIS Quarterly Vol. 36 No. 4, pp. 1065-1080/December 2012
31. Hunt, E. (1995). ‘The role of intelligence in modern society’, American Scientist, July- August.
32. ICASA, (2010). Research Report on the economic regulatory framework for reserved postal services. Private Bag X10002, Sandton, 2146
33. ISO 9001:2008 (E). http://www.iso.org 34. Juran, J., M., (2002). Joseph M. Juran. I E 36, Fall 2002 35. Kaziliūnas, A. (2010). The Implementation of Quality Management Systems in Service
Organizations. Mykolas Romeris University, 2010, Nr. 34, p. 71–82 36. La, V.Q., Patterson, P.G. and Styles, C.W. (2009). “Client-Perceived Performance and
Value in Professional B2B Services: An International Perspective,” Journal of International
Business Studies, 40 (2), 274–300
37. Lee, G. Y., Chu, P. Y., and Chao, Y. (2011). Service quality, relationship quality, and customer loyalty in Taiwanese Banks. Journal of Social Behavior and Personality, 39(8), 1127-1140.
38. Lee, S.M., B.H. Rho and S.G. Lee, (2003). Impact of Malcolm Baldrige national quality award criteria on organizational quality performance. Int. J. Prod. Res., 41: 2003-2020.
39. Li, Y. (2011). Key service drivers for high-tech service brand equity: The mediating role of overall service quality and perceived value. Vol. 27, Nos. 1–2, February 2011, 77–99
40. Magd, H. Curry, A., (2003) "An empirical analysis of management attitudes towards ISO 9001:2000 in Egypt", The TQM Magazine, Vol. 15 Iss: 6, pp.381 – 390
41. Martínez–Costa, M. and Martínez–Lorente, A. (2003), Effects of ISO 9000 certification on firms’ performance: a vision from the market, TQM & Business Excellence, 14(10), pp. 1179-1191.
42. McDonald, P. and Temple, J. (2005). Young, Skilled workers and their importance to the economy in the context of ageing populations. The Australian National University
43. Merino-Diaz de Cerio, J., (2003). Quality management practices and operational performance: Empirical evidence for Spanish industry. Int. J. Prod. Res., 41: 2763-2786.
44. Myers, M. D., (2009). Qualitative Research in Business & Management. University of Auckland, New Zealand

111
45. Naveh, E., Marcus A. (2005). Achieving Competitive Advantage Through Implementing a Replicable Management Standard: Installing and Using ISO 9000. Journal of Operations Management, 24: 1-26
46. NERA Economic Consulting. (2004) http://www.nera.com 47. Nguyen, H.P. (2008), Contracting Practices in the United States Postal Services. Ohio: State
University 48. Nuviala, A., Cruces, A. G., Turpin, J. A., and Nuviala, R. (2012), Perceived Service Quality ,
Perceived Value and Satisfaction in groups of Sports Organizations in Spain. Kinesiology 44(2012) 1:94-103
49. Oakland, S. John (2003): TQM Text with Cases. Butterworth-Heinemann 50. Ochurub, M., Bussin, M., & Goosen, X. (2012). Organisational readiness for introducing a
performance management system. SA Journal of Human Resource Management/SA Tydskrif vir Menslikehulpbronbestuur, 10(1), Art. #389, 11 pages. http://dx.doi.org/10.4102/ sajhrm.v10i1.389
51. Pallant, J. (2005). SPSS Survival Manual: A step by step guide to data analysis using SPSS for windows (Version12). Allen & Unwin
52. Parasuraman, A. and V. Zeithaml (2006). Understanding and Improving Service Quality: A Literature Review and Research Agenda. In B. Weitz and R. Wensley (Ed.), Handbook of Marketing. London: Sage Publications.
53. Peters, V.J. (1999). Total service quality management. Managing Service Quality, 29(1):6-12.
54. Qayyum, A., Sukirno. (2012). An Empirical Analysis of Employee Motivation and the Role of Demographics: the Banking Industry of Pakistan. GBMR, Vol. 4, No. 1, 2012, pp. 1-4
55. REN Jie, ZHANG, Xiao-hua. (2008). Appliance of Value Engineering on the construction enterprise. Construction Economy, 6:50-51
56. Rijamampianina, R. (2011). Sculpting Global Leaders. Wits Business School Issue No. 6. 2011
57. Ruževičius J. (2006). Integration of Total Quality Management and Knowledge Management // Information sciences. Research papers, 2006, Vol. 37, p. 30 – 38. ISSN 1392-0561.
58. Schneider, B. & White, S.S. (2004). Service Quality: research perspectives. Thousand Oaks, CA: Sage.
59. Soltani, E., Lai, P.C., Javadeen, S.R., Gholipour, T.H. (2008). A review of the theory and practice of managing TQM: An integrative framework. Vol. 19, No. 5, May 2008, 461–479
60. South African Post Office, (2008), (2010), (2011) & (2012). www.postoffice.co.za 61. Sower, V.E (2011). Essentials of Quality. Hoboken, NJ: John Wiley & Sons, Inc. 62. Sower, V.E. & Fair, F.K. (2005). There is more to quality than continuous improvement
listening to Plato. The Total Quality Management Journal, 12(1):8-20 63. Statistics SA, (2012). www.statssa.gov.za/ 64. Storey J, Sisson K, (1993). Managing Human Resources and Industrial Relations. Open
University Press. Stewart V, 1990. The David Solution. Gower, Aldershot. 65. Suleyman, C. (2011). Competition in postal markets- a small consumer perspective.
Consumer Focus, www.consumerfocus.org.uk 66. Sutherland, M. & Jordaan, W. (2004). ‘Factors affecting the retention of knowledge
workers’, South African Journal of Human Resource Management, 2(2):63-72.

112
67. Sutherland, M. & Wöcke, A. (2011). The symptoms of and consequences to selection errors in recruitment decisions. Gordon Institute of Business Science, University of Pretoria, S.Afr.J.Bus.Manage.2011,42(4)
68. Swinand, G. (2004). “A Production Model of Service Quality at An Post,” in Competitive Transformation of the Postal and Delivery Sector, eds M.A. Crew and P.R. Kleindorfer, Boston, MA: Kluwer Academic Publishers.
69. Thiry, M, (2004b). “Value management,” The Wiley guide to managing projects, P.W.G. Morris and J.K. Pinto (Editors), Wiley, Hoboken, NJ, pp. 876–902.
70. Townsend. P.L & Gebhardt, J.E. 1988. Quality: 20-th Century snake-oil. Review of Business 3(9):6-11
71. University of Wisconsin Writing Center, (2010). http://www.writing.wisc.edu/ 72. UPU - Strategic Planning Group. (2006). The future of the postal sector in a changing global
environment. Universal Postal Union. 73. UPU. (2004). Guide to Postal Reform and Development. Universal Postal Union. 74. Walliman, N. (2001). Your Research Project: A Step by Step Guide for First Time
Researcher. Sage Publications. 75. Walsh, T. (2002). Postal Infrastructures and Economic Development. In M. Crew, & P.
Kleindorfer, Postal and Delivery services: Pricing, Productivity, Regulation, and Strategy (p. 355).
76. WB and UPU (Kumar Ranganathan, Rohini Dey). (1998). Redirecting Mail - Postal Sector Reform.
77. World Bank (Pierre Guislain). (2004). The Postal Sector in Developing and Transition Countries. Contributions to a Reform Agenda. World Bank.
78. Yavas, U. (2000). Service Quality in the Postal Services in Turkey: A Canonical Approach. Journal of Nonprofit & Public Sector Marketing, Vol. 7(3)
79. Young, M. (2011). The Continuous Improvement Grid: An Empirical Investigation into the Effectiveness of a System’s, and Action Research, Based Continuous Improvement Intervention, for ‘New’ Organization Development. Syst Pract Action Res (2011) 24:453–478
80. Zeithaml, V., M. Bitner and D.D. Gremler, (2008). Services Marketing: Integrating Customer Focus across the Firm. 5th Ed., Boston, MA: McGraw-Hill.
81. Yin, R. K., (2003). Case Study Research Design and Methods. SAGE Publications 82. Zikmund, G. William (2003); Business Research Methods. Thomson South-Western.


