
F-1
INDEX TO UNAUDITED CONDENSED CONSOLIDATED FINANCIAL STATEMENTS
Unaudited Condensed Consolidated Financial Statements of Tata Consultancy Services Limited Page
Unaudited Condensed Consolidated Statements of Financial Position as of September 30, 2016 and March 31, 2016 F-2
Unaudited Condensed Consolidated Statements of Profit or Loss and Other Comprehensive Income for
the three and six month periods ended September 30, 2016 and 2015
F-3
Unaudited Condensed Consolidated Statements of Changes in Equity for the six month periods ended
September 30, 2015 and 2016
F-4
Unaudited Condensed Consolidated Statements of Cash Flows for the six month periods ended
September 30, 2016 and 2015
F-5
Notes to the Unaudited Condensed Consolidated Financial Statements F-7

F-2
Note
As of
September 30, 2016
As of
March 31, 2016
ASSETS:
Current assets:
Cash and cash equivalents 3 431 950
Bank deposits 65 8
Trade receivables 4 3,761 3,634
Investments 5(a) 4,347 3,393
Unbilled revenue 707 603
Other current financial assets 6(a) 929 619
Current income tax assets 4 5
Other current assets 7(a) 289 331
Total current assets 10,533 9,543
Non-current assets:
Bank deposits 1 63
Investments 5(b) 39 52
Other non-current financial assets 6(b) 151 510
Non-current income tax assets 738 674
Deferred income tax assets (net) 403 435
Property, plant and equipment 8 1,765 1,780
Intangible assets 9 13 20
Goodwill 570 575
Other non-current assets 7(b) 96 117
Total non-current assets 3,776 4,226
TOTAL ASSETS 14,309 13,769
LIABILITIES AND EQUITY:
Liabilities:
Current liabilities:
Trade and other payables 10 958 1,138
Borrowings 6 25
Other current financial liabilities 11(a) 196 349
Unearned and deferred revenue 211 205
Employee benefit obligations 271 247
Other provisions 20 17
Current income tax liabilities 204 122
Other current liabilities 12(a) 275 247
Total current liabilities 2,141 2,350
Non-current liabilities:
Borrowings 9 12
Other non-current financial liabilities 11(b) 71 74
Employee benefit obligations 40 36
Other provisions 3 6
Deferred income tax liabilities (net) 147 122
Other non-current liabilities 12(b) 65 67
Total non-current liabilities 335 317
TOTAL LIABILITIES 2,476 2,667
Equity:
Share capital 44 44
Share premium 911 911
Retained earnings 13,230 12,499
Accumulated other comprehensive losses (2,405) (2,406)
Equity attributable to shareholders of the Company 11,780 11,048
Non-controlling interests 53 54
TOTAL EQUITY 11,833 11,102
TOTAL LIABILITIES AND EQUITY 14,309 13,769
(In millions of USD)
Tata Consultancy Services Limited
Unaudited Condensed Consolidated Statements of Financial Position
As of September 30, 2016 and March 31, 2016
See accompanying notes to consolidated financial statements

F-3
Note
Three month
period ended
September 30,
2016
Three month
period ended
September 30,
2015
Six month
period ended
September 30,
2016
Six month
period ended
September 30,
2015
Revenue from information technology services 4,374 4,156 8,736 8,193
Cost of information technology services 13 2,470 2,318 4,971 4,593
Gross profit 1,904 1,838 3,765 3,600
Operating expenses:
Selling, general and administrative expenses 13 766 713 1,534 1,413
Operating profit 1,138 1,125 2,231 2,187
Other income:
Finance and other income 14 82 64 169 136
Finance costs 15 (1) (1) (3) (2)
Other gains, (net) 16 76 40 134 90
Other income (net) 157 103 300 224
Profit before taxes 1,295 1,228 2,531 2,411
Income tax expense 17 309 296 605 571
Profit for the period 986 932 1,926 1,840
Other comprehensive income / (losses), net of taxes:
Items that will be reclassified subsequently to profit or loss:
Exchange differences on translation of financial statements
from functional currency to presentation currency
130 (278) (72) (405)
Net change in intrinsic value of derivatives designated as cash
flow hedges
(7) 3 (3) (14)
Net change in time value of derivatives designated as cash
flow hedges
(4) 3 2 (5)
Net gains on financial assets other than equity shares carried
at fair value through OCI
66 - 80 -
Items that will not be reclassified subsequently to
profit or loss:
Net losses on equity shares carried at fair value through OCI - - (3) -
Remeasurement of defined employee benefit plans (5) (4) (9) (6)
Total other comprehensive income / (losses), net of taxes 180 (276) (5) (430)
Total comprehensive income for the period, net of taxes 1,166 656 1,921 1,410
Profit for the period attributable to:
Shareholders of the Company 984 926 1,924 1,824
Non-controlling interests 2 6 2 16
986 932 1,926 1,840
Total comprehensive income attributable to:
Shareholders of the Company 1,161 655 1,915 1,395
Non-controlling interests 5 1 6 15
1,166 656 1,921 1,410
Weighted average number of shares used in computing basic and
diluted earnings per share
1,970,427,941 1,964,577,960 1,970,427,941 1,961,652,970
Basic and diluted earnings per share in USD 0.50 0.47 0.98 0.93
Tata Consultancy Services Limited
Unaudited Condensed Consolidated Statements of Profit or Loss and Other Comprehensive Income
For the three and six month periods ended September 30, 2016 and 2015
See accompanying notes to consolidated financial statements
(In millions of USD, except shares and per share data)

F-4
Intrinsic
value
Time
value
Balance as of April 1, 2015 1,958,727,979 44 428 10,670 (1,963) 11 (5) 1 9,186 146 9,332
Profit for the period 1,824 - - - - 1,824 16 1,840
Other comprehensive income (6) (404) (14) (5) - (429) (1) (430)
Total comprehensive income - - - 1,818 (404) (14) (5) - 1,395 15 1,410
Dividend (including tax on dividend of
$179 million)
- - (1,087) - - - - (1,087) (12) (1,099)
Purchase of non-controlling interests 11,699,962 - 484 (377) - - - - 107 (107) -
Balance as of September 30, 2015 1,970,427,941 44 912 11,024 (2,367) (3) (10) 1 9,601 42 9,643
Balance as of April 1, 2016 1,970,427,941 44 911 12,499 (2,407) 1 (8) 8 11,048 54 11,102
Profit for the period 1,924 - - - - 1,924 2 1,926
Other comprehensive income (10) (75) (3) 2 77 (9) 4 (5)
Total comprehensive income - - - 1,914 (75) (3) 2 77 1,915 6 1,921
Dividend (including tax on dividend of
$199 million)
- - (1,179) - - - - (1,179) (4) (1,183)
Purchase of non-controlling interests - - (4) - - - - (4) (3) (7)
Balance as of September 30, 2016 1,970,427,941 44 911 13,230 (2,482) (2) (6) 85 11,780 53 11,833
Tata Consultancy Services Limited
Unaudited Condensed Consolidated Statements of Changes in Equity
For the six month periods ended September 30, 2015 and 2016
(In millions of USD, except share data)
See accompanying notes to consolidated financial statements
Cash flow
hedging reserve
Number
of shares
Share
capital
Share
premium
Retained
earnings
Foreign
currency
translation
reserve
Investment
revaluation
reserve
Equity
attributable to
shareholders of
the Company
Non-
controlling
interests
Total
equity

F-5
Six month
period ended
September 30,
2016
Six month
period ended
September 30,
2015
Profit for the period 1,926 1,840
Adjustments to reconcile profit or loss to net cash provided by
operating activities:
Depreciation and amortisation 147 143
Gain on disposal of property, plant and equipment (1) -
Income tax expense 605 571
Gain on disposal of investments (28) (20)
Non-cash interest on put-call option liability 1 1
Bad debts, provision for trade receivables and advances (net) 9 12
Unrealised loss / (gain) 3 (7)
Operating profit before working capital changes 2,662 2,540
Net change in:
Trade receivables (155) (254)
Unbilled revenue (114) (48)
Other financial assets (26) (80)
Other assets 47 70
Trade and other payables (171) (423)
Unearned and deferred revenue 7 2
Other financial liabilities (13) 24
Other liabilities 64 60
Cash generated from operations 2,301 1,891
Taxes paid (574) (552)
Net cash provided by operating activities 1,727 1,339
Cash flows from operating activities:
Tata Consultancy Services Limited
Unaudited Condensed Consolidated Statements of Cash Flows
For the six month periods ended September 30, 2016 and 2015
(In millions of USD)

F-6
Six month
period ended
September 30,
2016
Six month
period ended
September 30,
2015
Bank deposits placed - (7)
Inter-corporate deposits placed (323) (20)
Purchase of investments carried at fair value through profit or loss* (6,911) (5,202)
Purchase of investments carried at fair value through OCI (121) -
Purchase of investments carried at amortised cost - (3)
Purchase of property, plant and equipment (157) (155)
Proceeds from bank deposits 5 215
Proceeds from inter-corporate deposits 336 141
Proceeds from disposal / redemption of investments carried at fair
value through profit or loss*
5,960 4,831
Proceeds from disposal / redemption of investments carried at fair
value thorugh OCI
51 -
Proceeds from disposal / redemption of investments carried at
amorised cost
74 -
Proceeds from disposal of property, plant and equipment 3 -
Proceeds from restricted cash 60 31
Net cash used in investing activities (1,023) (169)
Short-term borrowings (net) (17) (28)
Dividend paid to non-controlling interests (4) (8)
Dividend paid including dividend tax (1,179) (1,087)
Purchase of non-controlling interests (7) -
Repayment of finance lease obligations (5) (6)
Net cash used in financing activities (1,212) (1,129)
Net change in cash and cash equivalents (508) 41
Effect of foreign exchange on cash and cash equivalents (11) 13
Cash and cash equivalents, beginning of the period 950 298
Cash and cash equivalents, end of the period 431 352
Supplementary cash flow information:
2 1
Interest received 118 46
Dividend received - 1
Supplementary disclosure of non-cash investing activities:
Shares to be issued on merger of subsidiary - 484
Tata Consultancy Services Limited
Unaudited Condensed Consolidated Statements of Cash Flows
For the six month periods ended September 30, 2016 and 2015
See accompanying notes to consolidated financial statements
(In millions of USD)
Interest paid
Cash flows from financing activities:
Cash flows from investing activities:
* Purchase of investments carried at fair value through profit or loss include $32 million and $24 million as on
September 30, 2016 and 2015, respectively, and Proceeds from disposal / redemption of investments carried at fair value
through profit or loss include $34 million and $4 million as on September 30, 2016 and 2015, respectively, held by
TCS Foundation, formed for conducting corporate social responsibility activities of the Group.

Tata Consultancy Services Limited
Notes to Consolidated Financial Statements
F-7
1. Background and operations
Tata Consultancy Services Limited (the “Company”) and its subsidiaries (collectively “TCS Limited” or the “Group”) provide
consulting-led integrated portfolio of information technology (IT) and IT-enabled services delivered through a network of
delivery centers around the globe. The Group’s full services portfolio consists of Assurance Services, Business Intelligence &
Performance Management, Business Process Services, Consulting, Digital Enterprise, Eco-sustainability Services, Engineering
and Industrial Services, Enterprise Security & Risk Management, Enterprise Solutions, iON Small and Medium Businesses,
IT Infrastructure Services, IT Services and Platform Solutions.
The Company is a public limited company incorporated and domiciled in India. The address of its corporate office is
TCS House, Raveline Street, Fort, Mumbai 400001. As of September 30, 2016, Tata Sons Limited owned 73.26% of the
Company’s equity share capital and is the holding company.
2. Summary of significant accounting policies
a. Statement of compliance
These consolidated financial statements have been prepared in accordance with International Financial Reporting Standards
(IFRS), as issued by the International Accounting Standard Board (IASB).
b. Basis of preparation
The consolidated financial statements have been prepared on the historical cost basis except for certain financial instruments
which are measured at fair values.
c. Basis of consolidation
Tata Consultancy Services Limited consolidates all entities which are controlled by it.
The Company establishes control when; it has power over the entity, is exposed, or has rights, to variable returns from its
involvement with the entity and has the ability to affect the entity’s returns by using its power over the entity.
The results of subsidiaries acquired, or sold, during the year are consolidated from the effective date of acquisition and up to
the effective date of disposal, as appropriate.
All inter-company transactions, balances and income and expenses are eliminated in full on consolidation.
Changes in the Company’s interests in subsidiaries that do not result in a loss of control are accounted for as equity transactions.
The carrying amount of the Company’s interests and the non-controlling interests are adjusted to reflect the changes in their
relative interests in the subsidiaries. Any difference between the amount by which the non-controlling interests are adjusted
and the fair value of the consideration paid or received is recognised directly in equity and attributed to owners of the Company.
d. Business combinations
The Company accounts for its business combinations under acquisition method of accounting. Acquisition related costs are
recognised in profit or loss as incurred. The acquiree’s identifiable assets, liabilities and contingent liabilities that meet the
condition for recognition are recognised at their fair values at the acquisition date.
Purchase consideration paid in excess of the fair value of net assets acquired is recognised as goodwill. Where the fair value of
identifiable assets and liabilities exceed the cost of acquisition, the excess is recognised in determination of profit or loss after
reassessing the fair values of the net assets and contingent liabilities.
The interest of non-controlling shareholders is initially measured either at fair value or at the non-controlling interests’
proportionate share of the acquiree’s identifiable net assets. The choice of measurement basis is made on an acquisition-by-
acquisition basis. Subsequent to acquisition, the carrying amount of non-controlling interests is the amount of those interests
at initial recognition plus the non-controlling interests’ share of subsequent changes in equity of subsidiaries.

Tata Consultancy Services Limited
Notes to Consolidated Financial Statements
F-8
Business combinations arising from transfers of interests in entities that are under the common control are accounted at
historical cost. The difference between any consideration given and the aggregate historical carrying amounts of assets and
liabilities of the acquired entity are recorded in shareholders’ equity.
e. Use of estimates and judgments
The preparation of consolidated financial statements in conformity with the recognition and measurement principles of IFRS
requires management to make estimates and assumptions that affect the reported amounts of assets and liabilities, disclosures
of contingent liabilities at the date of the consolidated financial statements and the reported amounts of revenue and expenses
for the periods presented.
Estimates and underlying assumptions are reviewed on an ongoing basis. Revisions to accounting estimates are recognised in
the period in which the estimates are revised and future periods are affected.
Key source of estimation of uncertainty at the date of the consolidated financial statements, which may cause a material
adjustment to the carrying amounts of assets and liabilities within the next financial year, is in respect of impairment of
goodwill, useful lives of property, plant and equipment, valuation of deferred tax assets and contingent liabilities.
Provisions and contingent liabilities
A provision is recognised when the Group has a present obligation as a result of past event and it is probable than an outflow
of resources will be required to settle the obligation, in respect of which a reliable estimate can be made. Provisions (excluding
retirement benefits and compensated absences) are not discounted to its present value and are determined based on best estimate
required to settle the obligation at the balance sheet date. These are reviewed at each balance sheet date adjusted to reflect the
current best estimates. Contingent liabilities are not recognised in the financial statements. A contingent asset is neither
recognised nor disclosed in the financial statements.
f. Revenue recognition
TCS Limited earns revenue primarily from providing information technology and consultancy services, including services
under contracts for software development, implementation and other related services, licensing and sale of its own software,
business process services and maintenance of equipment.
TCS Limited recognises revenue as follows:
Revenue from bundled contracts that involve supplying computer equipment, licensing software and providing services is
allocated separately for each element based on their fair values.
Revenue from contracts priced on a time and material basis is recognised as services are rendered and as related costs are
incurred.
Revenue from software development contracts, which are generally time bound fixed price contracts, is recognised over the
life of the contract using the percentage-of-completion method, with contract costs determining the degree of completion.
Losses on such contracts are recognised when probable. Revenue in excess of billings is recognised as unbilled revenue in the
statement of financial position; to the extent billings are in excess of revenue recognised, the excess is reported as unearned
and deferred revenue in the statement of financial position.
Revenue from Business Process Services contracts priced on the basis of time and material or unit of delivery is recognised as
services are rendered or the related obligation is performed.
Revenue from the sale of internally developed and manufactured systems and third party products which do not require
significant modification is recognised upon delivery, which is when the absolute right to use passes to the customer and
TCS Limited does not have any material remaining service obligations.
Revenue from maintenance contracts is recognised on a pro-rata basis over the period of the contract.

Tata Consultancy Services Limited
Notes to Consolidated Financial Statements
F-9
Revenue is recognised only when evidence of an arrangement is obtained and the other criteria to support revenue recognition
are met, including the price is fixed or determinable, services have been rendered and collectability of the resulting receivables
is reasonably assured.
Revenue is reported net of discounts, indirect and service taxes.
g. Leases
Finance lease
Assets taken on lease by the Group in its capacity as lessee, where the Group has substantially all the risks and rewards of
ownership are classified as finance lease. Such leases are capitalised at the inception of the lease at lower of the fair value or
the present value of the minimum lease payments and a liability is recognised for an equivalent amount. Each lease rental paid
is allocated between the liability and the interest cost so as to obtain a constant periodic rate of interest on the outstanding
liability for each year.
Operating lease
Operating lease payments are recognised on a straight line basis over the lease term in the statement of comprehensive income.
h. Cost recognition
Costs and expenses are recognised when incurred and have been classified according to their primary functions in the following
categories
Cost of information technology services
These costs primarily include employee compensation of personnel engaged in providing services, travel expenses, employee
allowances, payroll related taxes, fees to external consultants engaged in providing services, cost of equipment and software
licences, depreciation and amortisation of production related equipment and software, facility expenses, communication costs
and other project related expenses.
Selling, general and administrative expenses
Selling costs primarily include employee compensation for sales and marketing personnel, travel costs, advertising, business
promotion expenses, allowances for delinquent receivables and other advances, facility expenses for sales and marketing offices
and market research costs.
General and administrative costs primarily include employee compensation for administrative, supervisory, managerial and
practice management personnel, depreciation and amortisation of non-production equipment and software, facility expenses
for administrative offices, communication costs, fees to external consultants and other general expenses.
i. Foreign currency
The functional currency of Tata Consultancy Services Limited and its Indian subsidiaries is the Indian Rupee (`) whereas the
functional currency of foreign subsidiaries is the currency of their countries of domicile. These consolidated financial
statements are presented in US Dollars ($) to facilitate the investors’ ability to evaluate TCS Limited’s performance and
financial position in comparison to similar companies domiciled in different foreign jurisdictions.
Foreign currency transactions are recorded at exchange rates prevailing on the date of the transaction. Foreign currency
denominated monetary assets and liabilities are restated into the functional currency using exchange rates prevailing on the
dates of statements of financial position. Gains and losses arising on settlement and restatement of foreign currency
denominated monetary assets and liabilities are included in the profit or loss.
Assets and liabilities of entities with functional currency other than presentation currency have been translated to the
presentation currency using exchange rates prevailing on the dates of statements of financial position. Statement of profit or

Tata Consultancy Services Limited
Notes to Consolidated Financial Statements
F-10
loss and other comprehensive income statement items have been translated using weighted average exchange rates. Translation
adjustments have been reported as foreign currency translation reserve in the statement of changes in equity.
j. Finance and other income
Dividend is recorded when the right to receive payment is established. Interest income is recognised using effective interest
method.
k. Income taxes
Income tax expense comprises current tax expense and the net change in the deferred tax asset or liability during the year.
Current and deferred tax are recognised in profit or loss, except when they relate to items that are recognised in other
comprehensive income or directly in equity, in which case, the current and deferred tax are also recognised in other
comprehensive income or directly in equity, respectively.
Current income taxes
The current income tax expense includes income taxes payable by Tata Consultancy Services Limited, its overseas branches
and its subsidiaries in India and overseas. The current tax payable by Tata Consultancy Services Limited and its subsidiaries
in India is Indian income tax payable for their worldwide income after taking credit for tax relief available for export operations
in Special Economic Zones (SEZs).
Current income tax payable by overseas branches of Tata Consultancy Services Limited is computed in accordance with the
tax laws applicable in the jurisdiction in which the respective branch operates. The taxes paid are generally available for set off
against the Indian income tax liability of Tata Consultancy Services Limited's worldwide income.
The current income tax expense for overseas subsidiaries has been computed based on the tax laws applicable to each subsidiary
in the respective jurisdiction in which it operates.
Advance taxes and provisions for current income taxes are presented in the statement of financial position after off-setting
advance tax paid and income tax provision arising in the same tax jurisdiction and where the relevant tax paying units intends
to settle the asset and liability on a net basis.
Deferred income taxes
Deferred income tax is recognised using the balance sheet approach. Deferred income tax assets and liabilities are recognised
for deductible and taxable temporary differences arising between the tax base of assets and liabilities and their carrying amount,
except when the deferred income tax arises from the initial recognition of goodwill or an asset or liability in a transaction that
is not a business combination and affects neither accounting nor taxable profit or loss at the time of the transaction.
Deferred income tax asset are recognised to the extent that it is probable that taxable profit will be available against which the
deductible temporary differences and the carry forward of unused tax credits and unused tax losses can be utilised.
Deferred income tax liabilities are recognised for all taxable temporary differences except in respect of taxable temporary
differences associated with investments in subsidiaries where the timing of the reversal of the temporary difference can be
controlled and it is probable that the temporary difference will not reverse in the foreseeable future.
The carrying amount of deferred income tax assets is reviewed at each reporting date and reduced to the extent that it is no
longer probable that sufficient taxable profit will be available to allow all or part of the deferred income tax asset to be utilised.
Deferred tax assets and liabilities are measured using substantively enacted tax rates expected to apply to taxable income in the
years in which the temporary differences are expected to be received or settled.
For operations carried out in SEZs, deferred tax assets or liabilities, if any, have been established for the tax consequences of
those temporary differences between the carrying values of assets and liabilities and their respective tax bases that reverse after
the tax holiday ends.

Tata Consultancy Services Limited
Notes to Consolidated Financial Statements
F-11
Deferred tax assets and liabilities are offset when they relate to income taxes levied by the same taxation authority and the
relevant entity intends to settle its current tax assets and liabilities on a net basis.
Deferred tax assets include Minimum Alternative Tax (MAT) paid in accordance with the tax laws in India, which is likely to
give future economic benefits in the form of availability of set off against future income tax liability. Accordingly, MAT is
recognised as deferred tax asset in the statement of financial position when the asset can be measured reliably and it is probable
that the future economic benefit associated with the asset will be realised.
The Group recognises interest levied and penalties related to income tax assessments in income tax expenses.
l. Financial instruments
Financial assets and liabilities are recognised when the Company becomes a party to the contractual provisions of the
instrument. Financial assets and liabilities are initially measured at fair value. Transaction costs that are directly attributable to
the acquisition or issue of financial assets and financial liabilities (other than financial assets and financial liabilities at fair
value through profit or loss) are added to or deducted from the fair value measured on initial recognition of financial asset or
financial liability.
Cash and cash equivalents
TCS Limited considers all highly liquid financial instruments, which are readily convertible into known amounts of cash that
are subject to an insignificant risk of change in value and having original maturities of three months or less from the date of
purchase, to be cash equivalents. Cash and cash equivalents consist of balances with banks which are unrestricted for
withdrawal and usage.
Financial assets at amortised cost
Financial assets are subsequently measured at amortised cost if these financial assets are held within a business whose objective
is to hold these assets in order to collect contractual cash flows and the contractual terms of the financial asset give rise on
specified dates to cash flows that are solely payments of principal and interest on the principal amount outstanding.
Financial assets at fair value through other comprehensive income
Financial assets are measured at fair value through other comprehensive income if these financial assets are held within a
business whose objective is achieved by both collecting contractual cash flows and selling financial assets and the contractual
terms of the financial asset give rise on specified dates to cash flows that are solely payments of principal and interest on the
principal amount outstanding.
The Company has made an irrevocable election to present in other comprehensive income subsequent changes in the fair value
of equity investments not held for trading.
Financial assets at fair value through profit or loss
Financial assets are measured at fair value through profit or loss unless it is measured at amortised cost or at fair value through
other comprehensive income on initial recognition. The transaction costs directly attributable to the acquisition of financial
assets and liabilities at fair value through profit or loss are immediately recognised in profit or loss.
Financial liabilities
Financial liabilities are measured at amortised cost using the effective interest method.
Equity instruments
An equity instrument is a contract that evidences residual interest in the assets of the company after deducting all of its
liabilities. Equity instruments recognised by the Company are recognised at the proceeds received net off direct issue cost.

Tata Consultancy Services Limited
Notes to Consolidated Financial Statements
F-12
Hedge accounting
TCS Limited designates certain foreign exchange forward, option and future contracts as hedge instruments in respect of foreign
exchange risks. These hedges are accounted for as cash flow hedges.
TCS Limited uses hedging instruments that are governed by the policies of the Company and its subsidiaries which are
approved by their respective Board of Directors, which provide written principles on the use of such financial derivatives
consistent with the risk management strategy of the Company and its subsidiaries.
The hedge instruments are designated and documented as hedges at the inception of the contract. The effectiveness of hedge
instruments to reduce the risk associated with the exposure being hedged is assessed and measured at inception and on an
ongoing basis. The ineffective portion of designated hedges are recognised immediately in the profit or loss.
The effective portion of change in the fair value of the designated hedging instrument is recognised in the other comprehensive
income and accumulated under the heading cash flow hedge reserve.
The Group separates the intrinsic value and time value of an option and designates as hedging instruments only the change in
intrinsic value of the option. The change in fair value of the time value and intrinsic value of an option is recognised in the
statement of other comprehensive income and accounted as a separate component of equity. Such amounts are reclassified into
the profit or loss when the related hedged items affect profit or loss.
Hedge accounting is discontinued when the hedging instrument expires or is sold, terminated or no longer qualifies for hedge
accounting. Any gain or loss recognised in other comprehensive income and accumulated in equity till that time remains and
is recognised in profit or loss when the forecasted transaction ultimately affects the profit or loss. When a forecasted transaction
is no longer expected to occur, the cumulative gain or loss accumulated in equity is transferred to the profit or loss.
m. Property, plant and equipment
Property, plant and equipment are stated at cost, less accumulated depreciation (other than freehold land) and impairment loss,
if any.
Depreciation is provided for property, plant and equipment so as to expense the cost over their estimated useful lives. The
estimated useful lives and depreciation method are reviewed at the end of each reporting period, with the effect of any changes
in estimate accounted for on a prospective basis. The estimated useful lives are as mentioned below:
Type of asset Method Useful lives
Buildings, including leasehold buildings Straight line Lower of lease period and 20 years
Computer equipments Straight line 4 years
Furniture, fixtures, office equipments and other assets Straight line 4-10 years
Leasehold improvements are amortised over the lease term. Assets held under finance leases are depreciated over the shorter
of the lease term and their useful lives. Depreciation is not recorded on capital work-in-progress until construction and
installation are complete and the asset is ready for its intended use. Capital work-in-progress includes capital advances.
n. Goodwill and intangible assets
Goodwill represents the cost of acquired business as established at the date of acquisition of the business in excess of the
acquirer’s interest in the net fair value of the identifiable assets, liabilities and contingent liabilities less accumulated impairment
losses, if any. Goodwill is tested for impairment annually or when events or circumstances indicate that the implied fair value
of goodwill is less than its carrying amount.
Intangible assets purchased including acquired in business combination, are measured at cost or fair value as of the date of
acquisition, as applicable, less accumulated amortisation and accumulated impairment, if any.

Tata Consultancy Services Limited
Notes to Consolidated Financial Statements
F-13
Intangible assets consist of customer-related intangibles, acquired contract rights, technology-related rights and rights under
licensing agreement and software licences. These are amortised on a straight line basis. Following table summarises the nature
of intangibles and the estimated useful lives.
Nature of intangible Useful lives
Customer-related intangibles 3 years
Acquired contract rights 3-12 years
Rights under licensing agreement and software licences Lower of licence period and 2-5 year
o. Impairment
A. Financial assets (other than at fair value)
The Group assesses at each date of statements of financial position whether a financial asset or a group of financial
assets is impaired. IFRS 9 (2014) requires expected credit losses to be measured through a loss allowance. The Group
recognises lifetime expected losses for all contract assets and / or all trade receivables that do not constitute a financing
transaction. For all other financial assets, expected credit losses are measured at an amount equal to the 12-month
expected credit losses or at an amount equal to the life time expected credit losses if the credit risk on the financial
asset has increased significantly since initial recognition.
B. Non-financial assets
(i) Tangible and intangible assets
Property, plant and equipment and intangible assets with finite life are evaluated for recoverability whenever there is
any indication that their carrying amounts may not be recoverable. If any such indication exists, the recoverable
amount (i.e. higher of the fair value less cost to sell and the value-in-use) is determined on an individual asset basis
unless the asset does not generate cash flows that are largely independent of those from other assets. In such cases,
the recoverable amount is determined for the cash generating unit (CGU) to which the asset belongs.
If the recoverable amount of an asset (or CGU) is estimated to be less than its carrying amount, the carrying amount
of the asset (or CGU) is reduced to its recoverable amount. An impairment loss is recognised in the profit or loss.
(ii) Goodwill
CGUs to which goodwill has been allocated are tested for impairment annually, or more frequently when there is
indication for impairment. If the recoverable amount of a CGU is less than its carrying amount, the impairment loss
is allocated first to reduce the carrying amount of any goodwill allocated to the unit and then to the other assets of the
unit pro-rata on the basis of the carrying amount of each asset in the unit.
p. Employee benefits
Defined benefit plans
For defined benefit plans, the cost of providing benefits is determined using the Projected Unit Credit Method, with actuarial
valuations being carried out at the date of each statement of financial position. Actuarial gains and losses are recognised in full
in the other comprehensive income for the period in which they occur. Past service cost both vested and unvested is recognised
as an expense at the earlier of (a) when the plan amendment or curtailment occurs; and (b) when the entity recognises related
restructuring costs or termination benefits.
The retirement benefit obligations recognised in the statement of financial position represents the present value of the defined
benefit obligations reduced by the fair value of scheme assets. Any asset resulting from this calculation is limited to the present
value of available refunds and reductions in future contributions to the scheme.

Tata Consultancy Services Limited
Notes to Consolidated Financial Statements
F-14
Defined contribution plans
Contributions to defined contribution plans are recognised as expense when employees have rendered services entitling them
to such benefits.
Compensated absences
Compensated absences which are not expected to occur within twelve months after the end of the period in which the employee
renders the related services are recognised as an actuarially determined liability at the present value of the obligation at the year
end.
q. Earnings per share
Basic earnings per share are computed by dividing profit or loss attributable to equity shareholders of
TCS Limited by the weighted average number of equity shares outstanding during the period. TCS Limited did not have any
potentially dilutive securities in any of the periods presented.
3. Cash and cash equivalents
Cash and cash equivalents consist of the following:
As of
September 30,
2016
As of
March 31,
2016
Cash at banks and in hand 379 515
Bank deposits (original maturity less than three months) 52 435
Total 431 950
Held within India 32 613
Held outside India 399 337
Total 431 950
(In millions of USD)
4. Trade receivables
Trade receivables consist of the following:
As of
September 30,
2016
As of
March 31,
2016
Trade receivables 3,853 3,721
Less: Allowance for doubtful trade receivables (92) (87)
Total 3,761 3,634
(In millions of USD)

Tata Consultancy Services Limited
Notes to Consolidated Financial Statements
F-15
5. Investments
Investments consist of the following:
(a) Investments – Current
As of
September 30,
2016
As of
March 31,
2016
Investments carried at fair value through profit or loss
Mutual fund units 1,232 258
1,232 258
Investments carried at fair value through OCI
Government securities 3,111 3,057
3,111 3,057
Investments carried at amortised cost
Certificate of deposits - 74
Corporate debentures and bonds 4 4
4 78
Total investments ˗˗ Current 4,347 3,393
(In millions of USD)
Mutual fund units include $42 million and $43 million as on September 30, 2016 and March 31, 2016, respectively, held by
TCS Foundation, formed for conducting corporate social responsibility activities of the Group.
(b) Investments – Non-current
As of
September 30,
2016
As of
March 31,
2016
Investments carried at fair value through profit or loss
Mutual fund units 9 9
9 9
Investments designated at fair value through OCI
Equity shares 22 26
22 26
Investments carried at amortised cost
Corporate debentures and bonds 2 2
Government securities 6 15
8 17
Total investments ˗˗ Non-current 39 52
(In millions of USD)

Tata Consultancy Services Limited
Notes to Consolidated Financial Statements
F-16
6. Other financial assets
Other financial assets consist of the following:
(a) Other current financial assets
As of
September 30,
2016
As of
March 31,
2016
Accrued interest 87 31
Employee loans and advances 103 154
Foreign exchange derivative assets 86 81
Inter-corporate deposits 602 260
Premises deposits 19 21
Restricted cash 18 66
Others 14 6
Total 929 619
(In millions of USD)
Others include an amount of $11 million for receivable towards sale of Government securities as of September 30, 2016.
(b) Other non-current financial assets
As of
September 30,
2016
As of
March 31,
2016
Accrued interest - 11
Employee loans and advances 1 1
Inter-corporate deposits 13 372
Premises deposits 114 98
Restricted cash - 13
Others 23 15
Total 151 510
(In millions of USD)
Restricted cash in current and non-current financial assets mainly includes margin money deposit for derivative contracts.
7. Other assets
Other assets consist of the following:
(a) Other current assets
As of
September 30,
2016
As of
March 31,
2016
Advances to suppliers 34 36
Indirect tax recoverable 55 51
Prepaid expenses 171 208
Others 29 36
Total 289 331
(In millions of USD)

Tata Consultancy Services Limited
Notes to Consolidated Financial Statements
F-17
(b) Other non-current assets
As of
September 30,
2016
As of
March 31,
2016
Prepaid expenses 47 68
Prepaid rent 34 36
Others 15 13
Total 96 117
(In millions of USD)
8. Property, plant and equipment
Property, plant and equipment consist of the following:
Freehold
land
Buildings Leasehold
improve-
ments
Computer
equipment
Furniture,
fixtures, office
equipments and
other assets
Total
Cost as of April 1, 2016 53 924 277 845 816 2,915
Additions - 68 8 69 34 179
Disposals - - (4) (7) (4) (15)
Translation exchange difference - (5) 1 (7) (5) (16)
Cost as of September 30, 2016 53 987 282 900 841 3,063
Accumulated depreciation as of
April 1, 2016
- (172) (148) (628) (463) (1,411)
Disposals - - 2 6 4 12
Depreciation for the period - (24) (14) (58) (44) (140)
Translation exchange difference - 1 - 5 3 9
Accumulated depreciation as of
September 30, 2016
- (195) (160) (675) (500) (1,530)
Net carrying amount as of
September 30, 2016
53 792 122 225 341 1,533
Capital work-in-progress 232
Total 1,765
(In millions of USD)

Tata Consultancy Services Limited
Notes to Consolidated Financial Statements
F-18
Freehold
land
Buildings Leasehold
improve-
ments
Computer
equipment
Furniture,
fixtures, office
equipments and
other assets
Total
Cost as of April 1, 2015 56 772 268 811 714 2,621
Additions - 196 28 100 149 473
Disposals - - (6) (25) (8) (39)
Translation exchange difference (3) (44) (13) (41) (39) (140)
Cost as of March 31, 2016 53 924 277 845 816 2,915
Accumulated depreciation as of
April 1, 2015
- (137) (128) (566) (409) (1,240)
Disposals - - 4 25 7 36
Depreciation for the year - (43) (31) (117) (82) (273)
Translation exchange difference - 8 7 30 21 66
Accumulated depreciation as of
March 31, 2016
- (172) (148) (628) (463) (1,411)
Net carrying amount as of
March 31, 2016
53 752 129 217 353 1,504
Capital work-in-progress 276
Total 1,780
(In millions of USD)
9. Intangible assets
Intangible assets consist of the following:
Customer-
related
intangibles
Acquired
contract
rights
Rights under
licensing
agreement and
software licences
Total
Cost as of April 1, 2016 14 57 22 93
Additions - - - -
Translation exchange difference - (4) - (4)
Cost as of September 30, 2016 14 53 22 89
Accumulated amortisation as of April 1, 2016 (12) (43) (18) (73)
Amortisation for the period (1) (5) (1) (7)
Translation exchange difference - 4 - 4
Accumulated amortisation as of September 30, 2016 (13) (44) (19) (76)
Net carrying amount as of September 30, 2016 1 9 3 13
(In millions of USD)

Tata Consultancy Services Limited
Notes to Consolidated Financial Statements
F-19
Customer-
related
intangibles
Acquired
contract
rights
Rights under
licensing
agreement and
software licences
Total
Cost as of April 1, 2015 14 58 23 95
Additions - - - -
Translation exchange difference - (1) (1) (2)
Cost as of March 31, 2016 14 57 22 93
Accumulated amortisation as of April 1, 2015 (9) (34) (17) (60)
Amortisation for the year (3) (10) (2) (15)
Translation exchange difference - 1 1 2
Accumulated amortisation as of March 31, 2016 (12) (43) (18) (73)
Net carrying amount as of March 31, 2016 2 14 4 20
(In millions of USD)
10. Trade and other payables
Trade and other payables consist of the following:
As of
September 30,
2016
As of
March 31,
2016
Accrued payroll 197 304
Trade payables 754 831
Others 7 3
Total 958 1,138
(In millions of USD)
11. Other financial liabilities
Other financial liabilities consist of the following:
(a) Other current financial liabilities
As of
September 30,
2016
As of
March 31,
2016
Capital creditors 38 50
Foreign exchange derivative liabilities 3 23
Liabilities for cost related to customer contracts 134 133
Liabilities for purchase of Government securities - 121
Others 21 22
Total 196 349
(In millions of USD)
(b) Other non-current financial liabilities
As of
September 30,
2016
As of
March 31,
2016
Capital creditors 1 9
Others 70 65
Total 71 74
(In millions of USD)
Others includes advance taxes paid of $34 million and $35 million as of September 30, 2016 and March 31, 2016,
respectively, by the seller of TCS e-Serve Limited which on refund by tax authorities, is payable to the seller.

Tata Consultancy Services Limited
Notes to Consolidated Financial Statements
F-20
12. Other liabilities
Other liabilities consist of the following:
(a) Other current liabilities
As of
September 30,
2016
As of
March 31,
2016
Advances received from customers 27 25
Indirect tax payable and other statutory liabilities 232 208
Others 16 14
Total 275 247
(In millions of USD)
(b) Other non-current liabilities
As of
September 30,
2016
As of
March 31,
2016
Operating lease liabilities 57 57
Others 8 10
Total 65 67
(In millions of USD)
13. Expenses by nature
Three month
period ended
September 30,
2016
Three month
period ended
September 30,
2015
Six month
period ended
September 30,
2016
Six month
period ended
September 30,
2015
Employee cost 2,282 2,084 4,571 4,175
Fees to external consultants 336 330 678 620
Facility expenses 138 131 276 258
Depreciation and amortisation 74 72 147 143
Cost of equipment and software licences 73 86 174 189
Travel expenses 105 104 214 198
Communication 40 41 84 85
Bad debts, provision for trade receivable and
advances (net)
2 5 9 12
Other expenses 186 178 352 326
Total 3,236 3,031 6,505 6,006
(In millions of USD)

Tata Consultancy Services Limited
Notes to Consolidated Financial Statements
F-21
14. Finance and other income
Three month
period ended
September 30,
2016
Three month
period ended
September 30,
2015
Six month
period ended
September 30,
2016
Six month
period ended
September 30,
2015
Dividend received - 1 - 1
Interest income on bank balances 3 56 11 115
Interest on financial assets carried at
amortised cost
19 6 37 18
Interest on financial assets carried at fair
value through OCI
59 - 120 -
Rental revenue 1 1 1 2
Total 82 64 169 136
(In millions of USD)
15. Finance costs (at effective interest rate method)
Three month
period ended
September 30,
2016
Three month
period ended
September 30,
2015
Six month
period ended
September 30,
2016
Six month
period ended
September 30,
2015
Interest on bank overdrafts and loans 1 1 1 1
Other interest expenses - - 2 1
Total 1 1 3 2
(In millions of USD)
16. Other gains, (net)
Three month
period ended
September 30,
2016
Three month
period ended
September 30,
2015
Six month
period ended
September 30,
2016
Six month
period ended
September 30,
2015
Net gains on disposal of property, plant and
equipment
- - 1 -
Net gains on investments carried at fair value
through profit or loss
14 11 27 20
Net gains on disposal of investments carried
at amortised cost
1 - 1 -
Net foreign exchange gains 59 31 101 62
Others 2 (2) 4 8
Total 76 40 134 90
(In millions of USD)
17. Income taxes
Three month
period ended
September 30,
2016
Three month
period ended
September 30,
2015
Six month
period ended
September 30,
2016
Six month
period ended
September 30,
2015
Current tax expense 304 289 590 571
Deferred tax expense 5 7 15 -
309 296 605 571
(In millions of USD)

Tata Consultancy Services Limited
Notes to Consolidated Financial Statements
F-22
18. Financial instruments
(a) Financial assets and liabilities
The carrying value of financial instruments by categories as of September 30, 2016 is as follows:
Fair
value
through
profit or
loss
Fair value
through other
comprehensive
income
Derivative
instruments
in hedging
relationship
Derivative
instruments
not in
hedging
relationship
Amortised
cost
Total
carrying
value
Financial assets:
Cash and cash
equivalents
- - - - 431 431
Bank deposits - - - - 66 66
Investments 1,241 3,133 - - 12 4,386
Other financial assets - - 20 66 994 1,080
Total 1,241 3,133 20 66 1,503 5,963
Financial liabilities:
Borrowings - - - - 15 15
Other financial liabilities - - - 3 264 267
Total - - - 3 279 282
(In millions of USD)
The fair value of investments is $4,387 million.
The carrying value of financial instruments by categories as of March 31, 2016 is as follows:
Fair
value
through
profit or
loss
Fair value
through other
comprehensive
income
Derivative
instruments
in hedging
relationship
Derivative
instruments
not in
hedging
relationship
Amortised
cost
Total
carrying
value
Financial assets:
Cash and cash
equivalents
- - - - 950 950
Bank deposits - - - - 71 71
Investments 267 3,083 - - 95 3,445
Other financial assets - - 17 64 1,048 1,129
Total 267 3,083 17 64 2,164 5,595
Financial liabilities:
Borrowings - - - - 37 37
Other financial liabilities - - 2 21 400 423
Total - - 2 21 437 460
(In millions of USD)
The fair value of investments is $3,446 million.
Fair value hierarchy:
The fair value hierarchy is based on inputs to valuation techniques that are used to measure fair value that are either
observable or unobservable and consists of the following three levels:
• Level 1 — Inputs are quoted prices (unadjusted) in active markets for identical assets or liabilities.

Tata Consultancy Services Limited
Notes to Consolidated Financial Statements
F-23
• Level 2 — Inputs are other than quoted prices included within Level 1 that are observable for the asset or liability,
either directly (i.e. as prices) or indirectly (i.e. derived from prices).
• Level 3 — Inputs are not based on observable market data (unobservable inputs). Fair values are determined in
whole or in part using a valuation model based on assumptions that are neither supported by prices from observable
current market transactions in the same instrument nor are they based on available market data.
The investments included in Level 2 of fair value hierarchy have been valued using quotes available for similar assets and
liabilities in the active market. The investments included in Level 3 of fair value hierarchy have been valued using the cost
approach to arrive at their fair value. The cost of unquoted investments approximate the fair value because there is a range
of possible fair value measurements and the cost represents estimate of fair value within that range.
The following table summarises financial assets and liabilities measured at fair value on a recurring basis and financial assets
that are not measured at fair value on a recurring basis (but fair value disclosure are required):
As of September 30, 2016: Level 1 Level 2 Level 3 Total
Financial assets:
Mutual fund units 1,241 - - 1,241
Equity shares - - 22 22
Corporate debentures and bonds - 6 - 6
Government securities 3,117 - - 3,117
Derivative financial assets - 86 - 86
Total 4,358 92 22 4,472
Financial liabilities:
Derivative financial liabilities - 3 - 3
Total - 3 - 3
(In millions of USD)
As of March 31, 2016: Level 1 Level 2 Level 3 Total
Financial assets:
Mutual fund units 267 - - 267
Equity shares - - 26 26
Corporate debentures and bonds - 6 - 6
Government securities 3,072 - - 3,072
Certificate of deposits - 74 - 74
Derivative financial assets - 81 - 81
Total 3,339 161 26 3,526
Financial liabilities:
Derivative financial liabilities - 23 - 23
Total - 23 - 23
(In millions of USD)
(b) Derivative financial instruments and hedging activity
TCS Limited’s revenue is denominated in foreign currency predominantly US Dollar, Sterling Pound and Euro. In addition
to these currencies, TCS Limited also does business in Australian Dollar, Singapore Dollar, Saudi Arabian Riyal, Danish
Kroner and Brazilian Real. Given the nature of the business, a large portion of the costs are denominated in Indian Rupee.
This exposes TCS Limited to currency fluctuations.
TCS Limited monitors and manages the financial risks relating to its operations by analysing its foreign exchange exposures
by the level and extent of currency risks.
Tata Consultancy Services Limited and its subsidiaries use various derivative financial instruments governed by policies
approved by the board of directors such as foreign exchange forward, option and future contracts to manage and mitigate its
exposure to foreign exchange rates. The counterparty is generally a bank. Tata Consultancy Services Limited and its
subsidiaries can enter into contracts for a period between one day and eight years.

Tata Consultancy Services Limited
Notes to Consolidated Financial Statements
F-24
Tata Consultancy Services Limited and its subsidiaries report quarterly to its risk management committee, an independent
body that monitors foreign exchange risks and policies implemented to manage its foreign exchange exposures.
The following are outstanding currency option contracts, which have been designated as cash flow hedges as of:
Foreign currency No. of contracts Notional amount
of currency
option contracts
(In millions)
Fair value
(In millions of USD)
Sterling Pound 33 495 14
Australian Dollar 9 90 1
Euro 21 351 5
Foreign currency No. of contracts Notional amount
of currency
option contracts
(In millions)
Fair value
(In millions of USD)
US Dollar 9 225 6
Sterling Pound 8 160 8
Australian Dollar 21 228 (2)
Euro 24 285 3
March 31, 2016
September 30, 2016
The movement in accumulated other comprehensive income for six month period ended September 30, 2016 and year ended
March 31, 2016 for derivatives designated as cash flow hedges is as follows:
Intrinsic
value
Time
value
Intrinsic
value
Time
value
Balance at the beginning of the period 1 (8) 11 (5)
(Gains) / Losses transferred to profit or loss on occurrence
of forecasted hedge transaction
(49) 17 (49) 48
Deferred tax on (gains) / losses transferred to profit or loss
on occurrence of forecasted hedge transaction
7 (2) 6 (6)
Change in the fair value of effective portion of cash flow
hedges
45 (15) 38 (52)
Deferred tax on fair value of effective portion of cash flow
hedges
(6) 2 (5) 7
Balance at the end of the period (2) (6) 1 (8)
(In millions of USD)
Year ended
March 31, 2016
Period ended
September 30, 2016
In addition to the above cash flow hedges, TCS Limited has outstanding foreign exchange forwards, currency option and
futures contracts with notional amounts aggregating $3,112 million and $3,343 million, whose fair value showed a net gain
of $63 million and $43 million as of September 30, 2016 and March 31, 2016, respectively. Although these contracts are
effective as hedges from an economic perspective, they do not qualify for hedge accounting.
Exchange gain of $71 million and $10 million on foreign exchange forward exchange contracts and currency option and
futures contracts have been recognised in earnings for three month periods ended September 30, 2016 and 2015, respectively.
Exchange gain of $105 million and exchange loss of $27 million on foreign exchange forward exchange contracts and
currency option and futures contracts have been recognised in earnings for six month periods ended September 30, 2016 and
2015, respectively.
Tata Consultancy Services Limited
Notes to Consolidated Financial Statements
F-25
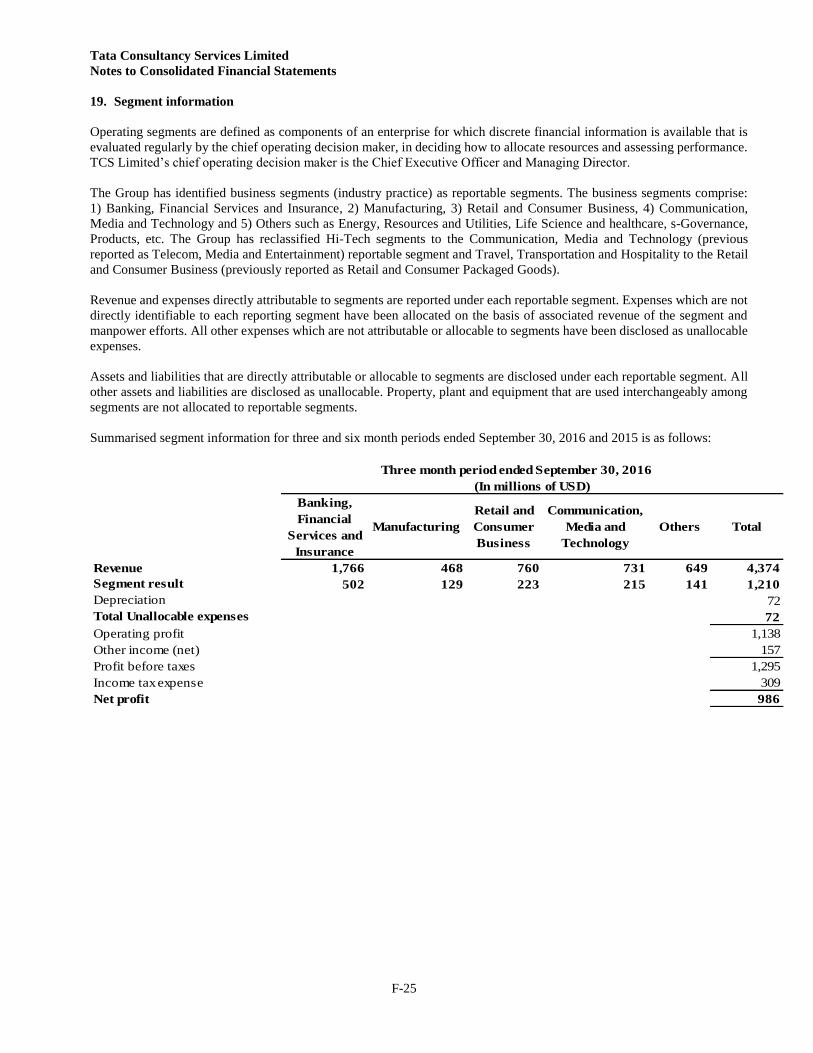
19. Segment information
Operating segments are defined as components of an enterprise for which discrete financial information is available that is
evaluated regularly by the chief operating decision maker, in deciding how to allocate resources and assessing performance.
TCS Limited’s chief operating decision maker is the Chief Executive Officer and Managing Director.
The Group has identified business segments (industry practice) as reportable segments. The business segments comprise:
1) Banking, Financial Services and Insurance, 2) Manufacturing, 3) Retail and Consumer Business, 4) Communication,
Media and Technology and 5) Others such as Energy, Resources and Utilities, Life Science and healthcare, s-Governance,
Products, etc. The Group has reclassified Hi-Tech segments to the Communication, Media and Technology (previous
reported as Telecom, Media and Entertainment) reportable segment and Travel, Transportation and Hospitality to the Retail
and Consumer Business (previously reported as Retail and Consumer Packaged Goods).
Revenue and expenses directly attributable to segments are reported under each reportable segment. Expenses which are not
directly identifiable to each reporting segment have been allocated on the basis of associated revenue of the segment and
manpower efforts. All other expenses which are not attributable or allocable to segments have been disclosed as unallocable
expenses.
Assets and liabilities that are directly attributable or allocable to segments are disclosed under each reportable segment. All
other assets and liabilities are disclosed as unallocable. Property, plant and equipment that are used interchangeably among
segments are not allocated to reportable segments.
Summarised segment information for three and six month periods ended September 30, 2016 and 2015 is as follows:
Banking,
Financial
Services and
Insurance
Manufacturing
Retail and
Consumer
Business
Communication,
Media and
Technology
Others Total
Revenue 1,766 468 760 731 649 4,374
Segment result 502 129 223 215 141 1,210
Depreciation 72
Total Unallocable expenses 72
Operating profit 1,138
Other income (net) 157
Profit before taxes 1,295
Income tax expense 309
Net profit 986
Three month period ended September 30, 2016
(In millions of USD)

Tata Consultancy Services Limited
Notes to Consolidated Financial Statements
F-26
Banking,
Financial
Services and
Insurance
Manufacturing
Retail and
Consumer
Business
Communication,
Media and
Technology
Others Total
Revenue 3,528 922 1,541 1,457 1,288 8,736
Segment result 974 255 431 417 297 2,374
Depreciation 143
Total Unallocable expenses 143
Operating profit 2,231
Other income (net) 300
Profit before taxes 2,531
Income tax expense 605
Net profit 1,926
As of September 30, 2016
Segment assets
Allocable assets 1,965 490 803 815 1,035 5,108
Unallocable assets 9,201
Total assets 14,309
Segment liabilities
Allocable liabilities 233 24 64 63 90 474
Unallocable liabilities 2,002
Total liabilities 2,476
Six month period ended September 30, 2016
(In millions of USD)
Banking,
Financial
Services and
Insurance
Manufacturing
Retail and
Consumer
Business
Communication,
Media and
Technology
Others Total
Revenue 1,683 406 735 684 648 4,156
Segment result 508 111 210 194 170 1,193
Depreciation 68
Total Unallocable expenses 68
Operating profit 1,125
Other income (net) 103
Profit before taxes 1,228
Income tax expense 296
Net profit 932
Three month period ended September 30, 2015
(In millions of USD)

Tata Consultancy Services Limited
Notes to Consolidated Financial Statements
F-27
Banking,
Financial
Services and
Insurance
Manufacturing
Retail and
Consumer
Business
Communication,
Media and
Technology
Others Total
Revenue 3,320 805 1,436 1,366 1,266 8,193
Segment result 998 214 404 385 321 2,322
Depreciation 135
Total Unallocable expenses 135
Operating profit 2,187
Other income (net) 224
Profit before taxes 2,411
Income tax expense 571
Net profit 1,840
As of September 30, 2015
Segment assets
Allocable assets 1,950 397 689 732 943 4,711
Unallocable assets 7,261
Total assets 11,972
Segment liabilities
Allocable liabilities 230 24 51 56 107 468
Unallocable liabilities 1,861
Total liabilities 2,329
Six month period ended September 30, 2015
(In millions of USD)
20. Commitments and contingencies
Commitments and contingent liabilities are as follows:
Capital commitments
As of September 30, 2016, $269 million was contractually committed for purchase of property, plant and equipment.
Contingencies
Direct tax matters
As of September 30, 2016, the Company and its subsidiaries in India have contingent liability in respect of demands from
direct tax authorities in India, which are being contested by the Company and its subsidiaries in India on appeal amounting
$1,118 million. In respect of tax contingencies of $48 million, not included above, the Company is entitled to an
indemnification from the seller of TCS e-Serve Limited.
Indirect tax matters
Tata Consultancy Services Limited and its subsidiaries in India have ongoing disputes with Indian tax authorities mainly
relating to treatment of characterisation and classification of certain items. As of September 30, 2016,
Tata Consultancy Services Limited and its subsidiaries in India have demands on appeal amounting to $38 million from
various indirect tax authorities in Indian jurisdiction, which are being contested by the Company and its subsidiaries in India.
In respect of indirect tax contingencies of $1 million, not included above, the Company is entitled to an indemnification from
the seller of TCS e-Serve Limited.

Tata Consultancy Services Limited
Notes to Consolidated Financial Statements
F-28
Other claims
TCS Limited has examined the social security and tax aspects of contracts with legal entities which provide services to an
overseas subsidiary and, based on legal opinion, concludes that the subsidiary is in compliance with the related statutory
requirements.
As of September 30, 2016, claims aggregating $982 million against the Group (individually insignificant) have not been
acknowledged as debts.
In October 2014, Epic Systems Corporation (referred to as Epic) filed a legal claim against the Company in the Court of
Western District Madison, Wisconsin for alleged infringement of Epic’s intellectual property. In April 2016, the Company
received an unfavorable jury verdict awarding damages totalling $940 million to Epic which the trial judge has indicated his
intent to reduce. On the basis of legal opinion and legal precedence, the Company expects to defend itself against the claim
and believes that the claim will not sustain.
The Group periodically receives notices and inquiries from income tax authorities related to the Group's operations in those
jurisdictions. The Group has evaluated these notices and inquiries and has concluded that any consequent income tax claims
or demands by the income tax authorities will not succeed on ultimate resolution.
21. Subsequent events
The Board of Directors at its meeting held on October 13, 2016 has recommended an interim dividend of $0.10 (`6.50) per
equity share.


