(1) of (16) IC : PTiasFIEL1 E
1.0 INTRODUCTION
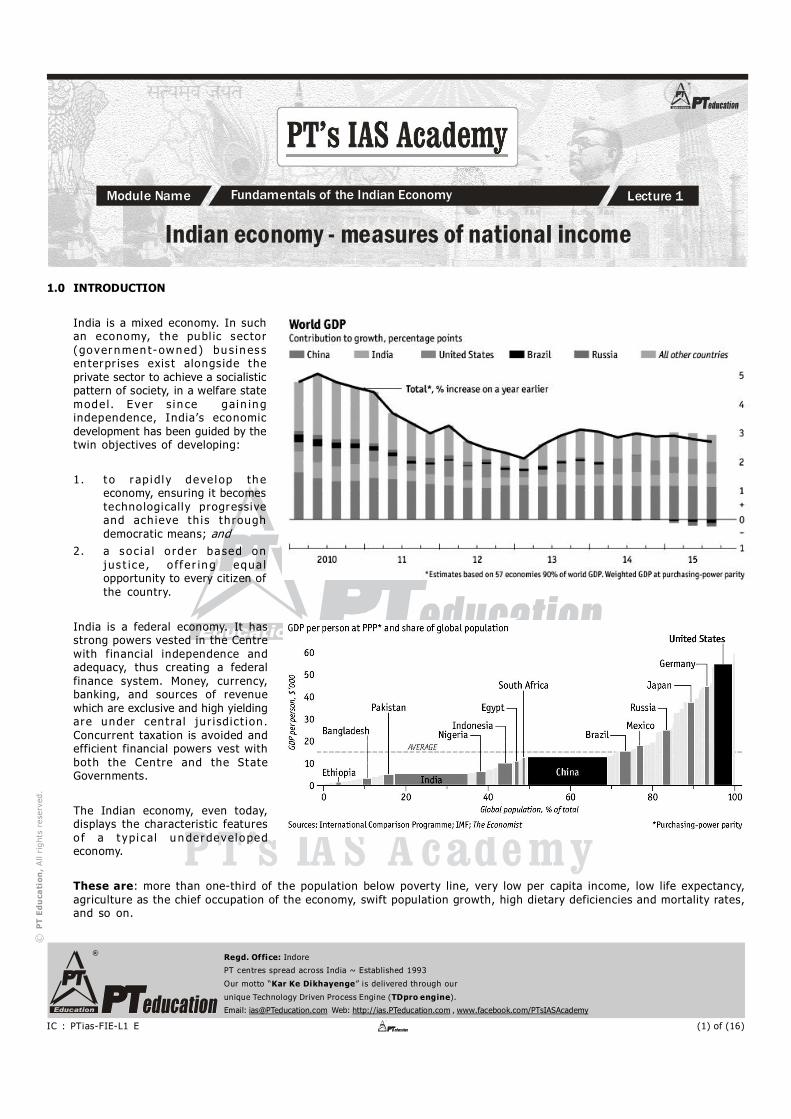
India is a mixed economy. In such an economy, the publ ic sector (gover nmen t owned) bu s i n es s en terpr ises exis t alongs ide the private sector to achieve a socialistic pattern of society, in a welfare state mode l . E ver s i n ce gai n in g independence, India’s economic development has been guided by the twin objectives of developing:
1. t o r ap i d l y deve l op th e economy, ensuring it becomes technologically progressive and ach ieve th is th rough democratic means; and
2. a s o c i a l o rde r based on j us t ic e , o f f e r in g equa l opportunity to every citizen of the country.
India is a federal economy. It has strong powers vested in the Centre with financial independence and adequacy, thus creating a federal finance system. Money, currency, banking, and sources of revenue which are exclusive and high yielding are under cen t ra l ju r i sdict ion . Concurrent taxation is avoided and efficient financial powers vest with both the Centre and the State Governments.
The Indian economy, even today, displays the characteristic features o f a t ypi cal u nder devel oped economy.
These are: more than onethird of the population below poverty line, very low per capita income, low life expectancy, agriculture as the chief occupation of the economy, swift population growth, high dietary deficiencies and mortality rates, and so on.
Regd. Office: Indore
PT centres spread across India ~ Established 1993
Our motto “Kar Ke Dikhayenge” is delivered through our
unique Technology Driven Process Engine (TDpro engine).
Email: [email protected] Web: http://ias.PTeducation.com , www.facebook.com/PTsIASAcademy
PT Education, All rights reserved.
PT’s IAS Academy
Indian economy - measures of national income Module Name Fundamentals of the Indian Economy Lecture 1

(2) of (16) IC : PTiasFIEL1 E
2.0 TRADITIONAL DEFINITIONS OF NATIONAL INCOME
Over the years, many economists have tried to define national income, its various dimensions and uses and suggested ways to estimate it. The two basic methods that have evolved are the Income Method and the Expenditure method. Some important definitions are:
Marshall: "The labour and capital of a country acting on its natural resources produce annually a certain net aggregate of commodities, material and immaterial including services of all kinds. This is the true net annual income or revenue of the country or national dividend."
Pigou: "National income is that part of objective income of the community, including of course income derived from abroad, which can be measured in money."
Fisher: "The national dividend or income consists solely of services as received by ultimate consumers, whether from their material or from their human environments. Thus, a piano, or an overcoat made for me this year is not a part of this year's income, but an addition to the capital. Only the services rendered to me during this year by these things are income."
2.1 Keynesian Approach to National Income
The Keynes ian model assumes that the aggregate supply curve is perfectly elastic up to the full employment level of output after which it becomes perfectly inelastic. Hence price level, until the full employment level, will be determined solely by the height of the supply curve. Hence, the price variable gets less attention while entire focus is on the determination of equilibrium level of income, which is determined solely by the aggregate demand.
Aggregate Demand i n a Two Sector Economy The postulates are 1. The prices are constant or invariable 2. Given the price level, the firms are willing
to sell any amount of the output at that price level
3. The short run aggregate supply curve is perfectly elastic or flat 4. Investment is assumed to be autonomous and thus independent of the income level
5. There exist only two sectors in the economy, the households and the firms
Aggregate demand is the total amount of goods demanded in an economy. The aggregate demand function can be expressed as:
AD = C + I where, C = aggregate demand for consumers goods, and I = aggregate demand for investment goods
Determination of equilibrium income or output in a Two Sector Economy
In the most basic terms, an economy can be said to be in equilibrium when the production plans of the firms and the expenditure plans of the households are realized.
Below are the assumptions of the analysis: 1. There exist only two sectors of the economy. There is no government sector and foreign sector.
2. All the factors of production are owned by the households who sell the factor services to earn an income. With a part of this income, they purchase goods and services and save the rest.
3. As there is no government in the economy there are no taxes and subsidies and no government expenditure. 4. As there are no foreign sectors in the economy, there are no exports and imports and external inflows and outflows. 5. As far as the firms are concerned there are no undistributed profits.
6 . All the prices are constant and do not change. 7. The technology and the supply of capital are given.

(3) of (16) IC : PTiasFIEL1 E
2.1 Keynes suggested three approaches to national income
Income expenditure approach: According to this approach, national income is equal to t ot a l expend i t u r e on con sumpt i on and investment goods.
Factor income approach: According to this approach, national income is measured as the aggregate of incomes received by all the factors of production.
Sales proceeds minus cost approach: According to this approach, national income is defined as the aggregate sales proceeds minus cost.
2.2 Modern Approach to National Income
Modern economists consider three aspects of national income and emphasise the fundamental identity between these three aspects. These three aspects are:
1. product aspect
2. income aspect, and 3. expenditure aspect
In one of the publications of the United Nations, national income has been defined in three ways:
(1) 'Net National Product' as the aggregate of
the net value added is all branches of economic activity during a specified period, together with the net income from abroad.
(2) 'Sum of the distributive shares' as the aggregate of national income accrued to the factors of production (in the form of wages, profits, interest, rent, etc) in a specified period.
(3) 'Net National Expenditure' as the sum of expenditure on final consumption of goods and services, plus domestic and foreign investments.
Modern economists consider national income as a flow of output, income and expenditure. When goods are produced by the firms, the factors of production are paid incomes in the form of wages, profits, interest, rent, etc. These income receipts are spent by the household sector on consumption goods and their savings are mobilised by the producers for investment spending.
Thus, there is a circular flow of production, income and expenditure, Obviously, income, output and expenditure flows are always equal per unit of time. Thus, there is a tripple identity: Output = Income = Expenditure.
1.(a) 2.(a) 3.(b) 4.(c) 5.(c) 6.(d) 7.(d) 8.(c) 9.(a) 10.(d)
11.(b) 12.(c) 13.(d) 14.(d) 15.(d) 16.(a) 17.(c) 18.(a) 19.(a) 20.(a)
Answer key (DPQ) – Indian economy measures of national income (2016 figures not yet available)

(4) of (16) IC : PTiasFIEL1 E
2.3 The three methods of measuring National Income
The three commonly used techniques of measuring National Income are (i) Product method, (ii) Income method and (iii) Expenditure method.
(i) Product Method: Under this method National Income is measured at the production stage. The monetary value of total output produced in the economy during the year is calculated. Only the market value of only final goods and services is taken into account in calculating national income through product method. The value of intermediate goods is not considered. Inclusion of the value of intermediate goods results in double counting which leads to overestimation of national income. The price of bread (final goods) already includes the costs of wheat, flour and sugar (intermediate goods) because these costs have been paid during the production process.
(ii) Income Method: Under the income method, incomes earned by the factors of production land, labour, capital and organization are totalled up. Factor incomes are considered in measuring national income. This method is also known as distributive share method or factor payment method. In this method, total income generated in the production of goods and services is taken into account. In other words, rent plus wages plus interest plus profit will be equal to national income. Transfer payments however are excluded.
(iii) Expenditure Method: The expenditure method takes into account the aggregate of all the final expenditure on gross domestic product in an economy during a year. This method is based on the assumption that in an economy Total Income = Total Expenditure. In other words, the expenditure method measures the disposal of gross domestic product. This method is also known as 'consumption and investment method' or 'income disposal method'. Final expenditure is the expenditure on final product. The total income generated in the economy is used for purchasing either consumption goods or investment goods. As such, total final expenditure or national expenditure (Y) equal to the sum total of final expenditure incurred on consumption goods (C) and investment goods (I).
Symbolically, Y = C + I.
Final consumption expenditure includes (a) personal consumption expenditure, and (b) government final consumption expenditure (government's purchase of goods and services).
Final investment expenditure includes (a) gross domestic private investment, and (b) net foreign investment or net export of goods and services.
2.4 Various measures used
Gross Domestic Product at Market Price (GDP at MP): Gross Domestic Product at Market Price is the money value of the final goods and services produced within the domestic territory of a country during a year. Gross Domestic Product is obtained by multiplying all goods and services produced with their prices.
Symbolically, GDP = P x Q Where, GDP at MP is Gross Domestic Product at Market Price, P is market price and Q is final goods and services.
Gross Domestic Product includes three types of final goods and services: 1. Consumer goods and services to satisfy immediate wants of the people 2. Capital goods consist ing of fixed capital formation, residential
construction, and inventories of finished and unfinished goods, and 3. Goods and services produced by the government.
Gross National Product at Market Price (GNP at MP): Gross National Product at Market Price is the money value of all final goods and services produced annually in a country plus net factor income from abroad. GNP is
a broader concept than GDP. GNP is GDP plus net factor income from abroad.

(5) of (16) IC : PTiasFIEL1 E
Symbolically, GNP at MP = GDP at MP + Net Factor Income from abroad. Net factor income from abroad is the difference between the factor income earned by our residents from foreign countries and the factor income earned by the foreigners in our country.
Net National Product at Market Price (NNP at MP): Net National Product at Market Price is Gross National Product at Market Price less depreciations of fixed capital or consumption of fixed capital. By deducting the value of depreciation of fixed capital from the value of Gross National Product in a year, we get the value of Net National Product.
Symbolically, NNP at MP = GNP at MP – Depreciation
Net Domestic Product at Market Price (NDP at MP): Net Domestic Product at Market Price is the difference between Net National Product at Market Price and net factor income from abroad.
Symbolically, NDP at MP = NNP at MP – Net Factor Income from Abroad
Net Domestic Product at Factor Cost (NDP at FC): Net Domestic Product at Factor cost or Domestic Income is the income earned by the factors of production in the form of wages, profits, rent, interest, etc within the territorial limits of the country.
Net Domestic Product at Factor Cost (NNP at FC) or Domestic Income = Rent, including imputed rent + Compensation of Employees or Wages and Salaries + Interest + Dividend + Reserve Fund of the Firms or Corporate Saving + Corporate or Other Direct Taxes + Mixed Income of the Self Employed + Profits of Government Enterprises + Property Income of the Government + Savings of NonDepartmental Undertakings.
Gross Domestic Product at Factor Cost (GDP at FC): Gross Domestic Product at Factor Cost is obtained by adding depreciation or consumption of fixed capital to the Net Domestic Product at Factor Cost.
Symbolically, GDP at FC = NDP at FC + Depreciation
Gross National Product at Factor Cost (GNP at FC): Gross National Product at Factor cost is obtained by adding net factor income from abroad to the Gross Domestic product at Factor Cost.
Symbolically, GNP at FC GDP at FC + Net Factor Income From Abroad
Net National Product at Factor Cost or National Income (NNP at FC, or NI): Net National Product at Factor Cost or National Income is the total earnings of all factors of production in the form of wages, profits, rent, interest, etc. plus net factor income from abroad. In other words, if net factor income from abroad is added to the Net Domestic Product at Factor Cost, we get Net National Product at Factor Cost.
Symbolically, NNP at FC or NI = NDP at FC + Net Income from Abroad. (Net National Product at Factor Cost or National Income can also be calculated by deducting depreciation from Gross National Product at Factor Cost.
Symbolically, NNP at FC or NI = GNP at FC Depreciation
Per Capita Income: Per capita income means income per head. Per capita income refers to the average income of the normal residents of a country during any particular year. It is equal to national income divided by total population.
Personal Income: The income earned by the personal sector, i.e., households and unincorporated business is personal income. Personal income includes transfer payments like welfare payments, pensions, unemployment etc.
Disposable Personal Income: That part of the personal income which the households can spend the way they like is called disposable personal income. It refers to the purchasing power of the households.
Disposable Income = Personal Income Direct Taxes The entire amount of disposable income is not spent on consumption. A part of it is saved. Thus, Disposable Income = Consumption Expenditure + Saving

(6) of (16) IC : PTiasFIEL1 E
3.0 BASE YEAR
Base Year: In order to enable a proper comparison between economic fundamentals in different years, it is important to fix a year as a reference year. A base year is a reference year with respect to which GDP numbers for the following as well as preceding years are computed. This is mainly due to the changes in the pattern of consumption and production in a particular economy. Reference to a base year is usually made when the GDP figures for any particular year are discussed.
Why a change in the Base Year was needed: The reason for periodically changing the base year of the national accounts is to take into account the structural changes which have taken place in the economy and to depict a true picture of the economy through macro aggregates like GDP, consumption expenditure, capital formation etc. For examining the performance of the economy in real terms through the macroeconomic aggregates like Gross Domestic Product (GDP), national income, consumption expenditure, capital formation etc., estimates of these aggregates are prepared at the prices of selected year known as base year. The estimates at the prevailing prices of the current year are termed as "at current prices", while those prepared at base year prices are termed "at constant prices". The comparison of the estimates at constant prices, which means "in real terms", over the years gives the measure of real growth.
The first national income estimates published in 1956 took FY 1949 as the base year. Since then there have been seven changes. The base years of the National Accounts Statistics series have been shifted from 194849 to 196061 in August 1967; from 196061 to 197071 in January 1978; from 197071 to 198081 in February 1988; and from 198081 to 1993 94 in February 1999. Thereafter it was changed to 200405 in 2006. The last time it was changed was in the year 2015 in which the base year of national accounts was changed from 200405 to 201112.
In 2015, many sectors such as IT, ecommerce, mobile telephony contribute majorly to our economy. In 200405 they did not occupy such a significant part. Thus, if the base year was not changes, India would have ended up showing wrong GDP figures, since majority of economic activities driving sectors were not represented in the year 200405. Therefore, the Indian Government decided to change the base year to 201112. The revised base year will lead to all such sectors coming into play, and the GDP number will increase as the total output from these sectors will be added, which was not the case earlier.
The Central Statistics Office (CSO) of the Ministry of Statistics and Programme Implementation on 29 January 2016 released the first revised estimates of national income, consumption expenditure, saving and capital formation for 201415.
Besides, the CSO also released second revised estimates of the years 201112 to 201314 (with base year 201112).
Highlights of revised estimates for FYs 201415 & 201314
1. Gross Domestic Product: Nominal Gross Domestic Product or GDP at current prices for the year 201415 was estimated at 124.88 lakh crore rupees while that for the year 201314 was estimated at 112.73 lakh crore rupees, exhibiting a growth of 10.8 per cent during 201415 as against 13.3 per cent during 201314.
2. Real GDP or GDP at constant (201112) prices for the years 201415 and 201314 stands at 105.52 lakh crore rupees and 98.39 lakh crore rupees, respectively, showing growth of 7.2 per cent during 201415, and 6.6 per cent during 201314.
3. The previous Real GDP estimates for FY 201415 and 201314 was 7.3 and 6.9 respectively.
4. Per capital income: Per capita net national income at current prices was estimated at 79412 and 86879 rupees respectively for the years 201314 and 201415.
5. Correspondingly, per capita private final consumption expenditure (PFCE) at current prices, for the years 201314 and 201415 was estimated at 52022 and 56772 respectively.
6. Industrywise contribution: Percentage shares of different sectors of the economy in gross value addition (GVA) at current prices were – primary sector (20.04), secondary (27.36) and tertiary (52.60).
7. Percentage changes in GVA in 201415 at constant (201112) prices over the FY 201314 were primary sector (1.3 percent), secondary (5.4) and tertiary (10.3).
8. The growth in real GVA during 201415 has been higher than that in 201314 mainly due to higher growth in mining and quarrying (10.8 percent), hotels & restaurants (10.7), public administration and defence (9.8) and other services (11.4 percent).
9. Saving: Rate of Gross Saving to gross national disposable income (GNDI) for the year 201415 is estimated as 32.3 per cent, the same as in 201314.
10. The highest contributor to the Gross Saving is the household sector, with a share of 57.8 per cent in the year 2014 15.
11. Capital formation: The rate of gross capital formation (GCF) to GDP declined from 34.7 per cent during 201314 to 34.2 per cent in the year 201415.

(7) of (16) IC : PTiasFIEL1 E
4.0 NOMINAL AND REAL GDP
The most fundamental difference between these two approaches is that effect of inflation is not considered in the computation of Nominal GDP whereas Real GDP is computed after adjustments on account of inflation. In other words, Nominal GDP is the aggregate output measured at current prices whereas Real GDP is the aggregate output measured at the prices of the base year.
Nominal GDP = ∑ p t q t where p refers to price, q is quantity, and t indicates the year in question (usually the current year).
However, it can be misleading to do a direct comparison of a GDP of say $0.5 trillion in 2008 with a GDP of $100 billion in 1990. This is because of inflation. The value of one dollar in 1990 was far greater than the value of a dollar in 2008. In other words, prices in 1990 were different from prices in 2008. Therefore, for comparing the economic output over such a long period, GDP is to be calculated by using prices for a particular base year.
Nominal GDP adjusted for pr ice changes (inflation or deflation), is known as the Real GDP. It can be calculated using the following formula:
Real GDP = ∑ p b q t where b denotes the base year.
To effectively compare the real GDP of two years, one can construct an index using a base year.
The nominal GDP figures are used to determine the total value of the products and services manufactured in a country during a particular year. However, when one wants to compare GDP in one year with past years to study trends in economic growth, real GDP is used.
By definition (since real GDP is calculated using prices of a given "base year"), real GDP has no meaning by itself unless it is compared to GDP of a different year.
If a set of real GDPs from various years are calculated, each calculation uses the quantities from its own year, but all use the prices from the same base year. The differences in those real GDPs will, therefore, reflect merely differences in volume.
An index called the GDP deflator can be obtained by dividing, for each year, the nominal GDP by the real GDP. It gives an indication of the overall level of inflation or deflation in the economy.
GDP deflator for year t = GDP t / Real GDP t

(8) of (16) IC : PTiasFIEL1 E
4.1 GDP Deflator
The concept of GDP deflator has been developed by economists to facilitate comparison between Real GDP and Nominal GDP. The GDP deflator is simply nominal GDP in a given year divided by real GDP in that given year and then multiplied by 100.
The GDP deflator is also called implicit price deflator and is a measure of inflation. Simply put, it is the ratio of the value of goods and services an economy produces in a particular year at current prices to that at prices prevailing during any other reference (base) year. This ratio basically shows to what extent an increase in GDP or gross value added (GVA) in an economy has happened on account of higher prices, rather than increased output. Since the deflator covers the entire range of goods and services produced in the economy as against the limited commodity baskets for the wholesale or consumer price indices, it is seen as a more comprehensive measure of inflation.
GDP Deflator in India increased to 117.80 Index Points in 2015 from 114.40 Index Points in 2014. GDP Deflator in India averaged 127.69 Index Points from 2005 until 2015, reaching an all time high of 171.30 Index Points in 2013 and a record low of 100 Index Points in 2005. GDP Deflator in India is reported by the Ministry of Statistics and Programme Implementation (MOSPI).
5.0 MEASUREMENT OF NATIONAL INCOME IN INDIA
Historical Background: The development of official estimates of national income and related aggregates to meet the requirements of planning and policy purposes began after Independence. Recognizing the need for providing estimates of national income on a regular basis, Government of India set up a High Powered Expert Committee in 1949 known as 'National Income Committee under the Chairmanship of Prof. P.C. Mahalanobis. It was for the first time that this Committee provided the estimates of national income for the entire Indian Union.
The estimates of national income and details of methodology adopted by the Committee were published in the First and Final reports of the National Income Committee brought out in April 1951 and February 1954 respectively. Following the methodology recommended by the National Income Committee, the Central Statistical Office (CSO) prepared the first official estimates of national income with base year 194849 at constant prices.
The CSO published these estimates at constant (194849) prices alongwith the corresponding estimates at current prices and the accounts of the Public Authorities in the publication, "Estimates of National Income" in 1956. With the gradual improvement in the availability of basic data over the years, a comprehensive review of methodology for national accounts statistics has constantly been undertaken by the CSO with a view to updating the data base and shifting the base year to a more recent year. As a result, base years of the National Accounts Statistics series were shifted from 194849 to 196061 in August 1967, from 196061 to 197071 in January 1978, from 197071 to 198081 in February 1988, from 1980 81 to 199394 in February 1999, from 199394 to 19992000 in January 2006 and from 19992000 to 200405 on 29th January 2010. Alongwith the shifting of base years of national accounts series, the CSO also had been making improvements in the compilation of national accounts series, in terms of coverage of activities, incorporation of latest datasets and latest international guidelines.
Latest Release: On 29th January 2016, The Central Statistics Office (CSO), Ministry of Statistics and Programme Implementation has released the First Revised Estimates of National Income, Consumption Expenditure, Saving and Capital Formation for the financial year 201415 (with Base Year 201112) as per the revised policy. They have been compiled using industrywise/institutionwise detailed information instead of the benchmarkindicator method used at the time of release of Provisional Estimates on 29th May, 2015. The estimates of GDP and other aggregates for the years 201112 to 2013 14 have also undergone revision due to use of latest available data on agricultural production and industrial production especially those based on the provisional results of Annual Survey of Industries (ASI): 201314.
Gross Domestic Product: Nominal GDP or GDP at current prices for the year 201415 is estimated as Rs. 124.88 lakh crore while that for the year 201314 is estimated as Rs. 112.73 lakh crore, exhibiting a growth of 10.8 per cent during 201415 as against 13.3 per cent during 201314. Real GDP or GDP at constant (201112) prices for the years 201415 and 201314 stands at Rs.105.52 lakh crore and Rs. 98.39 lakh crore, respectively, showing growth of 7.2 per cent during 201415, and 6.6 per cent during 201314.
Industrywise Analysis: The changes in the Gross Value Added (GVA) at basic prices in different sectors of the economy at current and constant (201112) prices are presented in Statements 4.1 and 4.2 respectively. At the aggregate level, nominal GVA at basic prices increased by 10.5 per cent during 201415, as against 12.7 per cent during 201314. In terms of real GVA, i.e., GVA at constant (201112) basic prices, there has been a growth of 7.1 per cent in 201415, as against growth of 6.3 per cent in 201314.

(9) of (16) IC : PTiasFIEL1 E
The shares of different sectors of economy in the overall GVA during 201112 to 201415 and corresponding annual growth rates are mentioned below:
201112 201213 201314 201415 201213 201314 201415
Primary 21.75 21.35 21.18 20.04 1.2 4 1.3 Secondary 29.28 28.63 27.96 27.36 4 5.3 5.4 Tertiary 48.97 50.02 50.86 52.6 8.1 7.8 10.3 All 100 100 100 100 5.4 6.3 7.1
Total 81.07 92.1 103.81 114.72 85.47 90.84 97.27
at current prices at constant prices
Sector Percentage share in GVA at current prices
Percentage change in GVA at constant (201112) prices over
the previous year
Aggregate GVA (Rs. in lakh crore)
The growth in real GVA at during 201415 has been higher than that in 201314 mainly due to higher growth in 'mining and quarrying' (10.8%), 'electricity, gas, water supply & other utility services' (8.0%), 'trade, repair, hotels & restaurants' (10.7 %), 'financial services' (7.9%), 'public administration and defence' (9.8%), and 'other services' (11.4%).
At constant prices, in the primary sector (comprising agriculture, forestry, fishing and mining & quarrying), 'agriculture, forestry & fishing' has shown a decline of 0.2 per cent while 'mining and quarrying' increased by 10.8 per cent during 2014 15 as against the growth of 4.2 and 3.0 per cent, respectively during the year 201314. The growth of secondary sector (comprising manufacturing, electricity, gas, water supply & other utility services, and construction) is 5.4 per cent and that of tertiary (services) sector is 10.3 per cent during 201415, as against a growth of 5.3 per cent and 7.8 per cent, respectively, in the previous year.
Net National Income: Nominal Net National Income (NNI) at current prices for the year 201415 stands at Rs. 110.08 lakh crore as against Rs. 99.34 lakh crore in 201314, showing an increase of 10.8 per cent during 201415 as against an increase of 13.2 per cent in the previous year.
Gross Nat ional Disposable Income: Gross National Disposable Income (GNDI) at current prices is estimated as Rs. 127.46 lakh crore for the year 201415, while the estimate for the year 201314 stands at Rs. 115.29 lakh crore, showing a growth of 10.6 per cent as against 13.2 per cent in the year 201314.
Saving: Gross Saving during 201415 is estimated as Rs. 41.17 lakh crore as against Rs. 37.25 lakh crore during 201314. Rate of Gross Saving to GNDI for the year 201415 is estimated as 32.3 per cent, the same as in 201314. The highest contributor to the Gross Saving is the household sector, with a share of 57.8 per cent in the year 201415.
However, the share has declined from 63.4 per cent in 201314 to 57.8 in 201415. This decline can be attributed to the decline in household savings in physical assets, which has declined from Rs. 14.61 lakh crore in 201314 to Rs. 13.79 lakh crore in 201415. On the other hand, the share of Non Financial Corporations has increased from 32.7 per cent in 201314 to 37.2 per cent in 201415. The share of Financial Corporations increased marginally from 7.9 per cent in 201314 to 8.2 per cent in 201415, while the dissaving of General Government has decreased from 4.0 per cent in 201314 to 3.2 per cent in 201415.
Capital Formation: Gross Capital Formation (GCF) at current and constant prices is estimated by two approaches 1. through flow of funds, derived as Gross Saving plus net capital inflow from abroad; and 2. by the commodity flow approach, derived by the type of assets.

(10) of (16) IC : PTiasFIEL1 E
The estimates of GCF through the flow of funds approach are treated as the firmer estimates, and the difference between the two approaches is taken as "errors and omissions". However, GCF by industry of use and by institutional sectors does not include "valuables", and therefore, these estimates are lower than the estimates available from commodity flow approach.
Gross Capital Formation (GCF) at current prices is estimated as Rs.42.76 lakh crore for the year 201415 as compared to Rs. 39.12 lakh crore during 201314. The rate of GCF to GDP declined from 34.7 per cent during 201314 to 34.2 per cent in the year 201415. The rate of GCF excluding valuables to GDP stands at 33.3 per cent and 32.7 per cent for the years 201314 and 201415 respectively. The rate of capital formation in the years 201112 to 201415 has been higher than the rate of saving because of net capital inflow from Rest of the World (ROW).
In terms of the share to the total GCF (at current prices), the highest contributor is NonFinancial Corporations, with the share rising steadily from 45.7 per cent in 201112 to 52.0 per cent in 201415 (Statement 9). Share of household sector in GCF is also significant, but has declined from 43.4 per cent in 201112 to 33.9 per cent in 201415. The share of General Government in GCF has increased from 9.6 per cent in 201112 to 12.9 per cent in 201415.
Within the Gross Capital Formation at current prices, the Gross Fixed Capital Formation (GFCF) amounted to Rs. 38.44 lakh crore in 201415 as against Rs. 35.64 lakh crore in 201314. The rate of GFCF to GDP at current prices was 30.8 per cent in 201415 as compared to 31.6 per cent in 201314. The change in stocks of inventories, at current prices, increased from Rs. 1.80 lakh crore in 201314 to Rs. 2.21 lakh crore in 201415, while the valuables increased from Rs. 1.63 lakh crore in 201314 to Rs. 1.93 lakh crore in 201415.
The rate of Gross Capital Formation to GDP at constant (201112) prices has decreased marginally from 36.2 per cent in 201314 to 35.9 per cent in 201415.
Consumption Expenditure: Private Final Consumption Expenditure (PFCE) at current prices is estimated at Rs. 71.93 lakh crore for the year 201415 as against Rs. 65.08 lakh crore in 201314. In relation to GDP, the rates of PFCE at current prices during 201314 and 201415 are estimated at 57.7 per cent and 57.6 per cent respectively.
At constant (201112) prices, the PFCE is estimated as Rs. 55.20 lakh crore and Rs. 58.64 lakh crore, respectively for the years 201314 and 201415 respectively. The corresponding rates of PFCE to GDP for the years 201314 and 2014 15 are 56.1 per cent and 55.6 per cent respectively.
Government Final Consumption Expenditure (GFCE) at current prices is estimated as Rs. 13.65 lakh crore for the year 2014 15 as against Rs.11.53 lakh crore during 201314. At constant (201112) prices, the estimates of GFCE for the years 2013 14 and 201415 stand at Rs.9.77 lakh crore and Rs.11.03 lakh crore respectively.
Estimates at per capita level: Per Capita Income, i.e., Per Capita Net National Income at current prices, is estimated as Rs.79,412 and Rs. 86,879 respectively for the years 201314 and 201415. Correspondingly, Per Capita PFCE at current prices, for the years 201314 and 201415 is estimated at Rs. 52,022 and Rs.56,772 respectively.
Summary of Revision in the GDP Estimates: The use of latest available data from various agencies and company wise revalidation of the industrywise and institutionwise (public/private) classification of companies in the MCA21 database have resulted in some changes in both the levels of GVA and growth estimates for all the years.

(11) of (16) IC : PTiasFIEL1 E
6.0 CIRCULAR FLOW OF INCOME
The circular flow of income is a theory that descr ibes the movement of expenditure and income throughout the economy. Major exchanges are represented as flows of money, goods and services, etc. between economic agents (households and businesses). The f lows of money and goods exchanges in a closed circuit and correspond in value, but run in the opposite direction. This theory forms the basis for measurement of National Income and macroeconomics. Each transaction in an economy involves a buyer and a seller. Households spend money for buying goods and services produced.
Thus, from the buyers' side comes the flow of money demand. In other words, we have expenditure s ide transaction. On the sellers ' s ide, money payments go to factor owners in the form of rent, wages, etc. Firms s pend money fo r buy i ng i n pu t services. Thus, we have incomeside transaction from the seller's side. These two are obverse and reverse of the same coin. This is called circular flow of income and expenditure.
Goods and services flow from firms to households via the product market in return for the money payment for these goods and services by firms. Households supply factor inputs to firms via the factor markets. In return, households receive money from firms in the form of rent, wages, etc. These income payments to households on hiring input services must be identical to the firms' income. This is the essence of the circular flow of income in a twosector economy where there is no governmental activity and the economy is a closed one. Adding these, we have
Y = C + I
where Y stands for national income, C for private consumption spending, and I for private investment spending.
In a threesector (closed) economy, the government intervenes. This intervention benefits of the general people and firms by higher spending but also imposes taxes on them to finance its spending. If we add government activities (levying of taxes, T and incurring expenditures, G), we have
Y = C + I + G
Households receive money income from firms and government by selling input services. Part of this income is used to pay taxes to the government. Government receives taxes from both households and firms. Government spends by utilising its tax revenues. Households save in the financial market. These two, saving and taxes, constitute leakages in the circular flow. Thus circular flow of money income depends upon consumption spending of households, investment spending of business firm and government's plans to tax and spend.
A foursector economy is called an open economy in the sense that the country gets money by sending its goods outside i.e., exports (X), and spends money by buying foreignmade goods and services i.e., imports (M). In other words, in an open economy, there occurs a trading relationship between nations. Adding (XM) in the above equation, we get
Y = C + I + G + (X – M)

(12) of (16) IC : PTiasFIEL1 E
7.0 THE GLOBAL ECONOMY IN 2015, 2016, 2017
In the year 2015, some economies strengthened, while some, particularly emerging and developing economies, were weakened by plummeting commodity prices and by tightened financial conditions.
Global growth, currently estimated at 3.1 percent in 2015, is projected at 3.4 percent in 2016 and 3.6 percent in 2017. The pickup in global activity is projected to be more gradual than predicted in October 2015, especially in emerging market and developing economies.
In advanced economies, a modest and uneven recovery is expected to continue, with a gradual further narrowing of output gaps. The picture for emerging market and developing economies is diverse but in many cases challenging. The slowdown and rebalancing of the Chinese economy, lower commodity prices, and strains in some large emerging market economies will continue to weigh on growth prospects in 201617. The projected pickup in growth in the next two yearsdespite the ongoing slowdown in Chinaprimarily reflects forecasts of a gradual improvement of growth rates in countries currently in economic distress, notably Brazil, Russia, and some countries in the Middle East, though even this projected partial recovery could be frustrated by new economic or political shocks.
In some countries, beyond these very general trends, there is an overlay of political or geopolitical tension that magnifies the purely economic challenges. How these tensions play out in 2016 will be a major determinant of regional and global macroeconomic outcomes.
Risks to the global outlook remain tilted to the downside and relate to ongoing adjustments in the global economy: a generalized slowdown in emerging market economies, China's rebalancing, lower commodity prices, and the gradual exit from extraordinarily accommodative monetary conditions in the United States. If these key challenges are not successfully managed, global growth could be derailed.
7.1 Recent Developments
In 2015, global economic activity remained subdued. Growth in emerging market and developing economieswhile still accounting for over 70 percent of global growthdeclined for the fifth consecutive year, while a modest recovery continued in advanced economies. Three key transitions continue to influence the global outlook:
1. the gradual slowdown and rebalancing of economic activity in China away from investment and manufacturing toward consumption and services,
2. lower prices for energy and other commodities, and 3. a gradual tightening in monetary policy in the United States in the context of a resilient U.S. recovery as several
other major advanced economy central banks continue to ease monetary policy.
Overall growth in China is evolving broadly as envisaged, but with a fasterthanexpected slowdown in imports and exports, in part reflecting weaker investment and manufacturing activity. economy is slowing as it transitions from investment and manufacturing to consumption and services. But the global spillovers from China's reduced rate of growth, through its diminished imports and lower demand for commodities, have been much larger than we would have anticipated. Serious challenges to restructuring remain in terms of stateowned enterprise balance sheet weaknesses, the financial markets, and the general flexibility and rationality of resource allocation. Growth below the authorities' official targets could again spook global financial marketsbut then again, timehonored methods of enforcing growth targets could simply extend economic imbalances, spelling possible trouble down the road.
These developments, together with market concerns about the future performance of the Chinese economy, are having spillovers to other economies through trade channels and weaker commodity prices, as well as through diminishing confidence and increasing volatility in financial markets. Manufacturing activity and trade remain weak globally, reflecting not only developments in China, but also subdued global demand and investment more broadlynotably a decline in investment in extractive industries. In addition, the dramatic decline in imports in a number of emerging market and developing economies in economic distress is also weighing heavily on global trade.

(13) of (16) IC : PTiasFIEL1 E

(14) of (16) IC : PTiasFIEL1 E
~

(15) of (16) IC : PTiasFIEL1 E
1. A growing country is best defined as one with a/an (a) rising GNP at constant prices (b) rising GNP at current prices (c) constant GNP at constant prices (d) None of these
2. A major part of a country's output is normally used for (a) private consumption (b) public consumption (c) investment (d) exports
3. A major trade partner of India in the preindependence period was (a) USA (b) UK (c) USSR (d) Australia
4. A market economy is one in which (a) products are sold (b) products and factors are bought (c) products and factors are bought and sold (d) All the above
5. The role of the Planning Commission from 1950 to 2014, was primarily (a) collection, planning, allocation of financeial resources (b) planning and allocation of entire government budget (c) broad planning and allocation of financial resources to
several stakeholders (d) supervising the entire funds disbursement process of
the governments of India, and the various States
6. When the process of liberalisation was initiated in 1991, the biggest change that happened was that the (a) Indian State left large ground vacant to be filled by
notorious private sector players (b) public sector was substantially reduced in scope (c) private sector was made supreme (d) State’s role as the only, and primary, driver of
economic policy implementation was significantly reduced
7. One of the topmost agenda items for Prime Minister Modi seems to be (a) to remove all rules and regulations in business (b) getting nonresident Indian diaspora to invest (c) getting Indians to invest abroad in a big way (d) getting foreign investments to kickstart the economy
8. Which of these problems has the world economy been going through since 2008? (a) inflationary problems in the Rich World (b) zero growth in Europe (c) very slow or negative growth in the Rich Western world (d) very rapid growth in China, and consequent inflation
9. On which of these indices does India fare really badly? (a) HDI (b) FII in stock markets (c) Space research (d) All the above
10. Why was it decided to scrap the Planning Commission of India? (a) The Planning Commission became extremely corrupt (b) The pressure from the WB and IMF forced it (c) The rate of GDP growth was not as per expectations (d) Ground realities have changed in Indian economy,
needing a fresh approach now
11. Which of the following is/are true? I . First scientific estimate of National income was done
V.K.R.V. Rao in (193132). II. Postindependence, the est imation was done by
Government of India in 194849. (a) Only II (b) Both of the above (c) Only I (d) Neither of the above
12. Which of the following is/are true? I . Dadabhai Naoroji first estimated the National income
of India in 186768. II. The estimation was made in his book “Poverty and the
Unbritish rule in India”. (a) Only I (b) Only II (c) Both of the above (d) Neither of the two
13. Which of the following is/are true with respect to calculation of national income? I . Intermediate goods are included in national income. II. Transfer payments and gifts are also included in
national income calculation. (a) Only I (b) Only II (c) Both of the above (d) Neither of the two
DAILY PRACTICE QUIZ Module Name Fundamentals of the Indian Economy
Lecture 1 Indian economy -
measures of national income
¿ Suggested Time : 10 min Total questions : 20
(16) of (16) IC : PTiasFIEL1 E
14. Which of the following is/are true?
I . National income is the total value of final goods and services produced by the normal residents during an accounting year, after adjusting depreciation.
II. Domestic income is total value of final goods and services produced within a domestic territory during an accounting year, after adjusting depreciation. (a) Only I (b) None (c) Only II (d) Both of the Above
15. Which of the following is/are true?
I . National Income Committee was set up in 1949. II. P C Mahalanobis was the chairman of National Income
Committee. (a) Only I (b) None (c) Only II (d) Both of the Above
16. Which of the following is/are true I . Increase in Repo rate decreases the money supply in
the country. II. Increase in Reverse repo rate increases the money
supply. (a) Only I (b) Only II (c) Both of the above (d) Neither of the two
17. Which of the following is/are true?
I . Work done by housewives is not included in national income.
II. IPO (initial public offering) is included in national income. (a) Only I (b) Only II (c) Both I and II (d) Neither of the two
18. Consider the following statements. Which of them is/are correct ? I . Mining and quarrying comes under primary sector.
II. Gas and water supply is the tertiary sector. (a) Only I (b) None (c) Only II (d) Both of the Above
19. Consider the following statements with respect to National Income. I . In income method, the factors of production viz. rent,
wages, interest and profits are added.
II. Production method is also called value added method. III. Expenditure method of national income use the formula
Y=C+I+G (X+M) (a) I and II (b) I, II and III (c) Only III (d) None
20. which of the following pairs are correctly matched?
1. National income Domestic income+/– NFIA 2. GNP GDP+/–NFIA 3. NNP GNP – depreciation
4. GDP GNP + depreciation (a) 1, 2 and 3 (b) 1, 2, 3 and 4 (c) 2, 3 and 4 (d) None
Please make sure that you mark the answers in th is scoresheet with an HB penci l/pen. The marking of answers must be done in the st ipulated t ime for the test. Do not take extra t ime over and above the t ime limit.
1 a b c d e
2 a b c d e
3 a b c d e
4 a b c d e
5 a b c d e
6 a b c d e
7 a b c d e
8 a b c d e
9 a b c d e
10 a b c d e
11 a b c d e
12 a b c d e
13 a b c d e
14 a b c d e
15 a b c d e
16 a b c d e
17 a b c d e
18 a b c d e
19 a b c d e
20 a b c d e
SCORE SHEET


