
Indonesian Reform on
Social Security Programs

2
Rudi S. Prawiradinata
Budi Hidayat B M Tri Lestari Atika Adyas
I B Nugraha
Sumarjono
Budi Hidayat BM Tri Lestari Atikah Adyas
Rudi S P Sumarjono
I B Nugraha
Indonesian Reform on Social
Security Programs

Indonesia overview
3
Population 237 million (2008
Rate of birth 2.27 (2005 data)
Life expectancy at birth 70

Existing (social security) systems
Formal sector Informal sector
Public
Sector
Private
Sector
Nonpoor Poor
Health x x x
Pensions x
Old-age saving x x
Worker accident x
Death benefit x x
Severance x
4

Number Private Pension Fund 2004 – 2008
Year 2004 2005 2006 2007 2008
Defined Benefit Employer Pension Funds
262 250 235 226 216
Defined Contribution Employer Pension Funds
32 36 37 36 39
Financial Institution Pension Funds 27 26 25 26 26
Total 321 312 297 288 281

Social insurance reform
6

Social insurance reform -Year 2004
New regulation about national social
security - Law 40 Year 2004 (SJSN Law)
5 programs
◦ Pension: Lifetime income
◦ Old-age Savings: Modest lump-sum at retirement
◦ Death: Modest lump-sum on death of worker or
pensioner
◦ Health: All needed health care services
◦ Worker accident: Similar to current programs
Challenge: Harmonize with existing programs
7

Some notes on the SJSN Law
The law is silent on the programs that what it should be look like
◦ Benefits
◦ Contributions
Administrator(s) of social security programs
◦ To implement the SJSN law, some regulations should be established (some in the process)
Governance of implementation of social security program is not clear enough
Informal sector issues
Supervisory issues8

Administrator
9
Civil Military Formal Informal
Servants Sector Sector
Ta
s
pe
n
A
sa
br
i
Ja
ms
os
te
k
As
ke
s
J
a
m
k
e
s
m
a
s
CURRENT
PROPOSED
Civil Military Formal Informal
Servants Sector Sector
Administrator for Retirement Programs,
Government and Military Supplements
Administrator for Insurance Programs,
Government and Military Supplements
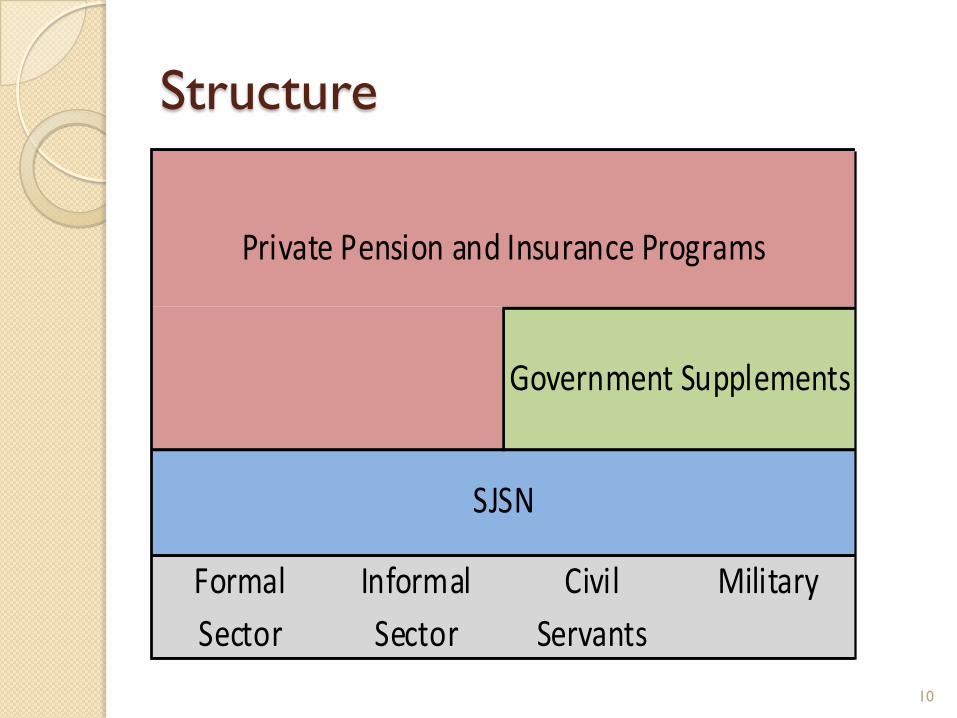
Structure
10
Formal Informal Civil Military
Sector Sector Servants
Private Pension and Insurance Programs
SJSN
Government Supplements

Administration, governance, & informal sector issues
11
Administrations One or two administrations needed
Not-for-profit trust structure appropriate
Variety of transition options possible
Governance◦ All decisions in best interests of members
◦ DJSN is “trustee” for the system Political body, Policy decisions, and Protect interests of members
Oversight of BPJS and system operations
◦ Single supervisory agency should oversee BPJS technical operations
Informal Sector Issues◦ Measuring income & Collecting contributions
◦ Affordability - Pay both employer and employee contributions
◦ Cost to the State budget
◦ Adjustments to existing social welfare programs

Proposal of solution
12

Cost Constraints
Program Cost as % of Covered Wages
Health 4.0% - 6.0%
Worker Accident 0.25% - 0.50%
Pension 5.0% - 6%
Old-Age Savings 3.0% - 4%
Death Benefits 0.25% - 0.50%
Total for SJSN Benefits 12.5% - 17.0%
13

Design and Pricing – Demographics
Take into account population aging
◦ Significantly lower birth rates +
◦ Longer life expectancy =
◦ Aging population
Particularly important for pensions and
health
◦ Pensions: Contributions from workers pay
benefits for retirees
14

Design and Pricing – Demographics
0%10%
20%
30%
40%
50%
60%
70%
80%
90%
100%
2007 2010 2020 2030 2050 2070
Year
Population by Age Ranges
60 +
15 - 59
0 - 14
15
10.0
20.0
30.0
40.0
50.0
60.0
70.0
80.0
90.0
2007 2010 2025 2050 2080
Dependent ratio aver year
20,000.0
40,000.0
60,000.0
80,000.0
100,000.0
120,000.0
2007 2010 2020 2030 2050 2070
Beneficiaries
Contributors
Population aging higher ratio of beneficiaries to contributors
Cost increases sharply over time
Pensions
Eligibility = retirement, death or total and
permanent disability
Retirement age = 60
Retirement Benefit = 0.5% of average
wages for each year of contributions
Inflation indexing after retirement
16

Pensions: Design Options
Retirement
age
Past service
credit
Social pension Contribution
Rate
60 None No 5.27%
60 -> 65 None No 4.48%
60 -> 65 None Yes 4.64%
60 -> 65 15 years No 5.69%
60 -> 65 15 years Yes 5.85%
60 -> 65 All years No 6.02%
60 -> 65 All years Yes 6.18%
17
2010 2020 2030 2050 2070
% of GDP 0.0% 0.1% 0.5% 2.0% 2.9%
% of wages 0.0% 0.2% 1.7% 6.3% 9.8%
Pensions: Cost of Base Plan
Retirement age: Age 60 with 15 years of contributions
Benefit formula: 0.5% of final average earnings for each year of contributions
Past service credit: None ; Social pension for elderly: None
Minimum benefit: None ; Average cost = 5.27% of wages

Pensions: Financing Issues
Funding options
◦ Pay-as-you-go increasing costs over time
◦ Level funding large reserves
◦ Mixed approach
Issues
◦ Individual equity
◦ Reserve management
◦ Politics of cost increases or benefit reductions
18
Old-Age Savings
Cost of program
◦ Contribution rate (3% suggested)
◦ Cost as % of GDP =1.05% in all years
Individual’s benefit depends on:
◦ Wages and the pattern of wage changes
◦ Rate of return on investments
◦ Periods of absence from the labor force
◦ Investment management and administrative
expenses
19

Old-Age Savings: Benefit Projections
Assumptions
◦ Contribution rate: 3.0%
◦ Inflation: 4%
◦ Real rate of wage growth: 3%
◦ Real rate of return on investments: 4%
◦ Years of contributions: All
◦ Expenses: None
◦ Pre-retirement withdrawals: None
20

Benefits
Years of
Contribution
Salary
Multiple
5 1.9
10 3.9
15 6.0
20 8.2
25 10.5
30 13.0
35 15.5
40 18.2
21
Total Assets
Year % of GDP
5 5.2%
10 10.1%
15 14.4%
20 18.0%
Old-Age Savings

SJSN Prerequisites
Assign SIN to everyone
Improved contribution and data collection
Finalize BPJS legal structure and
governance
Supervision and control of BPJS
Benefit program design and pricing
22

SJSN Prerequisites
Implementing laws, regulations and
decrees
Provider reimbursement paradigm and
negotiations, quality control (health)
Office of the Actuary
Capacity building
Public education program
23

Agenda
Phase 1: Design and Governance (2009
through mid-2010)
Phase 2: Infrastructure and institutional
development (mid-2010 through 2013)
Phase 3: Coverage expansion, by program
and covered groups (2014 through ??)
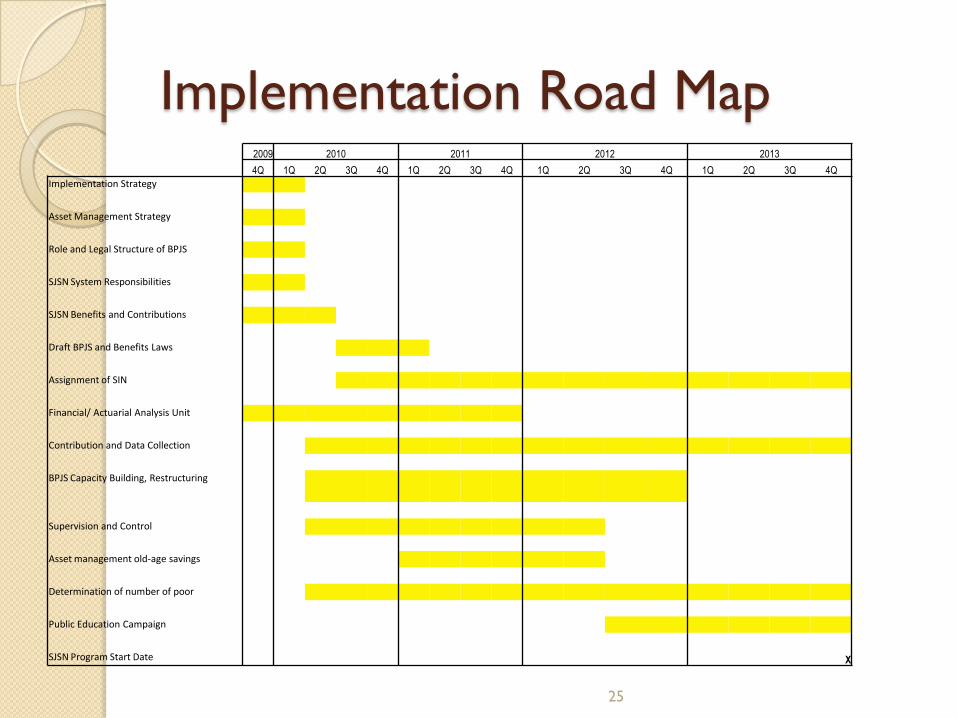
Implementation Road Map
25
2009 2010 2011 2012 2013
4Q 1Q 2Q 3Q 4Q 1Q 2Q 3Q 4Q 1Q 2Q 3Q 4Q 1Q 2Q 3Q 4Q
Implementation Strategy
Asset Management Strategy
Role and Legal Structure of BPJS
SJSN System Responsibilities
SJSN Benefits and Contributions
Draft BPJS and Benefits Laws
Assignment of SIN
Financial/ Actuarial Analysis Unit
Contribution and Data Collection
BPJS Capacity Building, Restructuring
Supervision and Control
Asset management old-age savings
Determination of number of poor
Public Education Campaign
SJSN Program Start Date X

Summary
Start with desired contribution rate, back
into affordable benefits
Many informal sector issues to address
May prerequisites to system start-up
26

Thank You
27

Phase 1: Design and Governance
Benefits and contribution rates
Harmonization with existing programs
Assignment of responsibilities for
◦ Contribution and data collection and enforcement
◦ Administration of the five SJSN programs
◦ Supervision and control of BPJS technical operations
◦ Financial and actuarial analysis
◦ Political and technical supervision of implementation
Asset management paradigm for old-age savings program

Phase 1: Design and Governance
Final resolution of BPJS legal issues
Legal form of BPJS and Social Security Funds
Specific roles and responsibilities of
◦ DJSN
◦ Secretariat of DJSN
◦ Ministry of Finance
◦ Menko Kesra
◦ BPJS, etc.
Last step: Implementing laws and regulations
29

Phase 2: Infrastructure
Development For each institution with a major role in
the SJSN system
◦ Organizational structure
◦ Job descriptions
◦ Staffing plan
◦ Operational and capital budget
◦ Business processes
◦ IT systems
For existing institutions, restructuring and retraining to meet new responsibilities

Phase 2: Infrastructure
Development Single individual number assignments
Identification of number of poor
Negotiation of contracts with regional
health care providers
Implementation of old-age savings asset
management paradigm
Public education campaign

Phase 3: Coverage Expansion
Start date of new system
Expansion of system
◦ By SJSN program
◦ By type of covered worker


