CIGRE US National Committee
2014 Grid of the Future Symposium
Initial Field Trials of Distributed Series Reactors and
Implications for Future Applications
Ian Grant
Tennessee Valley Authority
Presented by: BRUCE ROGERS, Director, Technology Innovation, TVA
I GRANT Tennessee Valley Authority
USA
J COUILLARD Smart Wire Grid Inc.
USA
J SHULTZ Tennessee Valley Authority
USA
F KREIKEBAUM Smart Wire Grid Inc.
USA
S OMRAN Virginia Tech
USA
R BROADWATER Electrical Distribution Design (EDD)
USA
1

Distributed Series Reactor
2

Background
The Distributed Series Reactor is a self contained device, powered by induction
from a transmission line conductor, that increases the series impedance of a
circuit by injecting series reactance.
The concept was first demonstrated in 2002 – 2003 and has been
demonstrated in pilot installations on HV transmission lines.
3

Equivalent Circuit
4
With secondary winding shorted,
injection is negligible

DSR Characteristics (typical)
5
Model Rated
Current
(A)
Injection
Mode
Inductance
at Rated
Current
(μH)
Reactance added per DSR* (p.u.)
115 kV 138 kV 161 kV 230 kV
750 750 47 1.34e-4 9.30e-5 6.84e-5 3.35e-5
1000 1000 42 1.20e-4 8.31e-5 6.11e-5 2.99e-5
1500 1500 37 1.05e-4 7.32e-5 5.38e-5 2.64e-5
For a 161 kV line, assume 5 spans per mile and a device at each end of each span i.e. 10 devices per mile. Approximate impedance increase = 20%

Example Application in Meshed Grid
6
39 BUS SYSTEM – Baseline MW:
1904 MW
– Increase in ATC
possible: 638 MW (33.5%)
– Increase in line availability
from 59% to 93%
G1
G8
G10
2
30
1
G2
G3
G9
G4G5
G6
G7
39
9
87
5
4
3
18
37
25
17
26 28 29
38
24
27
15
14
12
13
10
11
32 34
20
19
21 22
35
23
36
16
6
31

Communication and Control
7
Manual or automatic control through preset trigger points (e.g. line current), Power Line Carrier, Cell phone Individual information display available in control center for each DSR

Pilot Test at TVA
8
100 DSRs installed on 17 spans of 21 mile 161 kV line at TVA
Approximately 10 minutes to install each DSR

Prototype DSR Installation at TVA
TVA - 14.5 Miles of ACSR 795.0-26/7
9
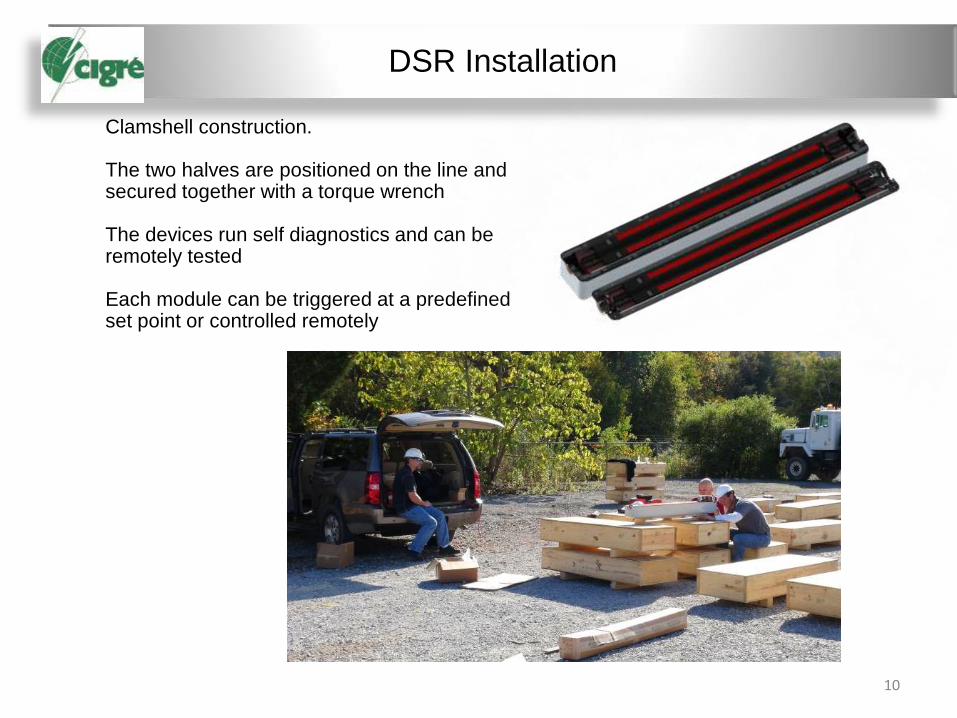
DSR Installation
Clamshell construction. The two halves are positioned on the line and secured together with a torque wrench The devices run self diagnostics and can be remotely tested Each module can be triggered at a predefined set point or controlled remotely
10

Pilot Test Results
11
• Total Impedance Increase (33 DSRs / Phase @ 47 µH / DSR): .226 % (degree of control limited by number of available devices and a test line that was longer than optimal for the demonstration) • Devices performed as expected over 4-step range • Devices also successfully used to adjust phase imbalance • Single point failure of communication system identified for necessary design upgrade • DSRs presently considered unsuitable for bundled conductor use, although technically feasible

Future Applications
12
• Success of pilot opens path to more critical applications • Simplest application is reduction of maximum contingency load for postponement of line uprate • Ability to quickly relocate DSRs reduces cost to individual projects • Extreme case for portion of HV grid to have dynamically assigned line loading for selected goals, e.g. minimize system losses • Future designs may provide capacitive injection to reduce reactive impedance • Future designs with high speed controls may be low cost alternative to FACTS

The IEEE 39 bus standard test system converted to a three phase system with 345kV lines
13

Structure Type: 3L11Utility: Houston Lighting & Power Company
Reference: EPRI, Transmission Line Reference Book - 345kV and above
The 345kV Line Configuration
14

Unbalanced:
Positive Sequence:
Positive Sequence Z is derived from the Unbalanced Model Z using the
symmetrical components transformation
Line Impedance Models
15
75
900
1950
3525
5550
675
1650
3750
0
1000
2000
3000
4000
5000
6000
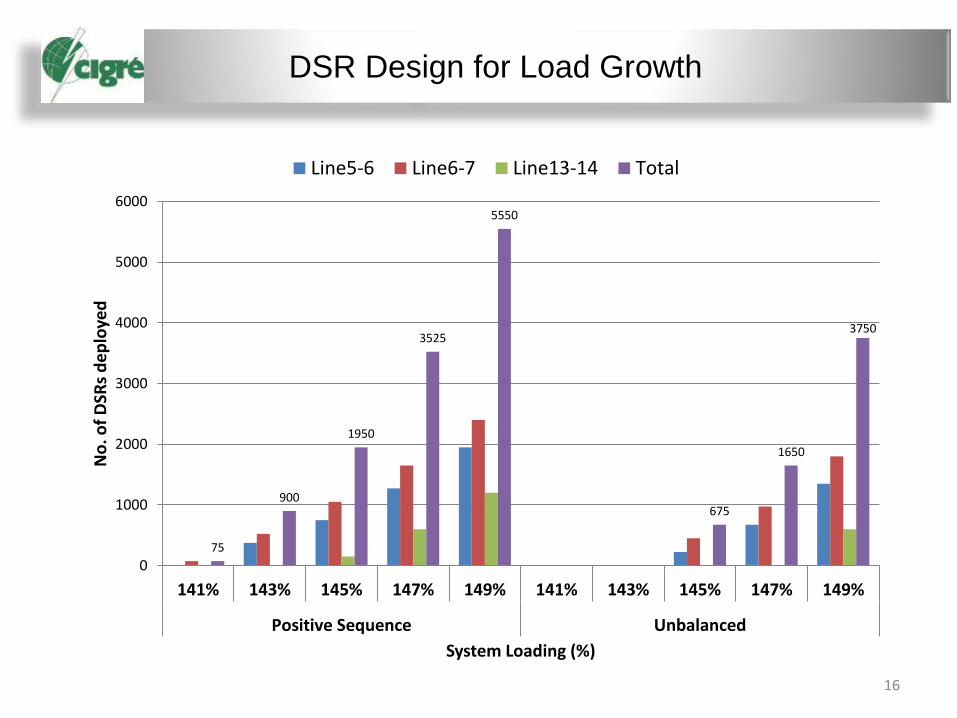
141% 143% 145% 147% 149% 141% 143% 145% 147% 149%
Positive Sequence Unbalanced
No
. of
DSR
s d
ep
loye
d
System Loading (%)
Line5-6 Line6-7 Line13-14 Total
DSR Design for Load Growth
16
0
5
10
15
20
25
30
35
40
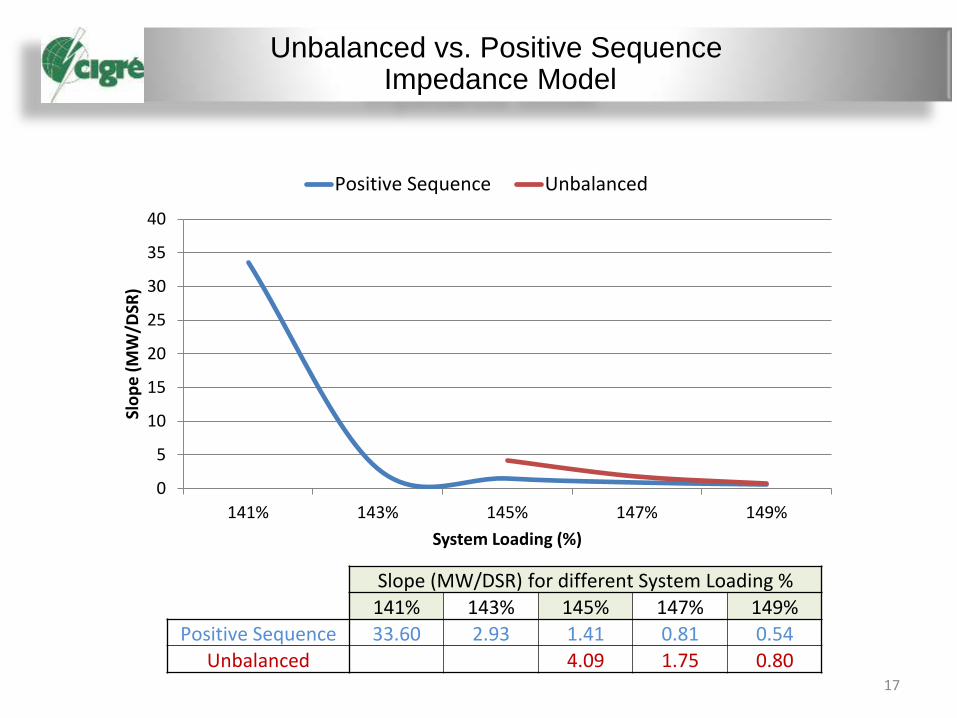
141% 143% 145% 147% 149%
Slo
pe
(M
W/D
SR)
System Loading (%)
Positive Sequence Unbalanced
Slope (MW/DSR) for different System Loading %
141% 143% 145% 147% 149%
Positive Sequence 33.60 2.93 1.41 0.81 0.54 Unbalanced 4.09 1.75 0.80
Unbalanced vs. Positive Sequence Impedance Model
17

DSR Design for Single Contingency:
Unbalanced Impedance Model
18

DSRs Deployed and Load Supplied
19

Lines with DSRs Reinforced
Lines
1500 DSR
on line5-6 75 DSR on
line13-14
The Selected Design at 140% System Loading
20

DSR Design vs. Line Reinforcement
for Single Contingency and Load
Growth: Economic Evaluation
21

• Determine the maximum MW supplied to
load while handling all single
contingencies
– Case1: Three Lines Reinforced with No DSR
– Case2: Three Lines Reinforced with DSR
• Economic assessment of both cases
Economic Evaluation
22

• Case1: With Three Lines Reinforced
• 125% loading is reached
• Case2: With Three Lines Reinforced and
DSRs Deployed
• 140% loading is reached and selected as a
desired DSR Design due to its technical merits
– Fewer number of DSRs deployed.
– Least % change in lines impedance.
Economic Evaluation Results
23

Reinforced Line Length (miles)
Line2-3 37
Line6-7 29
Line15-16 29
• Cost of 345 kV, single circuit = 1298 $k /mile
• Total length of the reinforced lines = 95 miles.
Case % Loading Max MW supplied
MW increase
Base 100% 6309.4 Case1 125% 7886.6 1577.2
Case2 140% 8833.1 946.5
• Max MW supplied at different % loading:
Data for the Economic Study
24

• Cost of 95 miles of line =
95 x 1298 k$ = 123.31 $M
• Cost for 1577.2 MW of load increase =
123.31 $M
• Cost per MW of load increase for
reinforcing lines =
123.31 $M/1577.2 MW = 78,182 $/MW
Line Reinforcement Cost
25

• For the selected DSR design, a loading of 140% is achieved using 1575 DSR modules.
• DSR worth in terms of transmission line value:
– Cost of 946.5 MW of load increase =
946.5 MW x 78,182.8 $/MW = 74 $M
– Thus the equivalent value of 1 DSR =
74 $M/1575 DSRs = 46,984 $/DSR
DSR Design Cost: Unbalanced Model
26

Questions
27


