
INSTITUTIONALSTATISTICS
BOOK2012/13

QUICK FACTS
STUDENT DATA FACULTY DATA
Enrolment - 2012/13 (as at Nov 1) Full-time Faculty - 2012/13
Full-time Undergraduate 6,348 Professors 90Part-time Undergraduate 1,550 Associate Professors 160Full-time Graduate 752 Assistant Professors 64Part-time Graduate 20 Lecturers 9
Headcount - Fall/Winter 8,670 Total 323(excludes Faculty of Medicine)
Full-time Equivalent (2012/13) 9,668(excludes Faculty of Medicine) FINANCIAL DATA - 2011/12
Operating Revenue ($ millions)
Source of Operating RevenueDegrees Awarded (Calendar Year 2012) -Government Grants 64.078(excludes Faculty of Medicine) -Fees 49.896
-Other 3.451Bachelors 2,253Certificate 42 Total Operating Revenue 117.425Diploma 84
Masters 210 Operating Expenses ($ millions)-Salaries & Benefits 84.940
Doctorates 20 -Non-Salary Items 28.317
Total 2,609 Total Operating Expenses 113.257
2
LAKEHEAD UNIVERSITY
INSTITUTIONAL STATISTICS BOOK
2012/13
TABLE OF CONTENTS
PAGE PAGE
QUICK FACTS . . . . . . . . . . . . . . . . . . . . . 2
SECTION 1 GENERAL SECTION 3 FACULTY
Mission Statement . . . . . . . . . . . . . . . . . . . . . . . 6 Full-Time Faculty Appointments by Department . . . . . . . . 39Honorary Degrees . . . . . . . . . . . . . . . . . . . . . . . . 7 Full-Time Faculty - Distribution by Rank & Appointment . . . 40
Fellows, Distinguished Alumni, Researchers & Instructors . 8 Full-Time Faculty - Distribution by Gender & Appointment . . 41Organization - Board, Senate & Committees . . . . . . . . . 9 Full-Time Equivalent Course Enrolments . . . . . . . . . . . . 42Academic Faculties, Departments & Schools . . . . . . . . . . 11Library Collections, Circulation & Reference Statistics . . . . 12B.I.U. Weight per FTE . . . . . . . . . . . . . . . . . . . . . . 13 SECTION 4 FINANCIALGlossary of Acronyms . . . . . . . . . . . . . . . . . . . . . . 14
Revenue by Source & Type of Fund . . . . . . . . . . . . . . . 45SECTION 2 STUDENT DATA Expenses by Object & Type of Fund . . . . . . . . . . . . . . 46
Operating Income & Expenditures . . . . . . . . . . . . . . . 47FTE / BIU History . . . . . . . . . . . . . . . . . . . . . . . 17 Revenue from Research Grants & Contracts . . . . . . . . . . 48Degrees Awarded by Program . . . . . . . . . . . . . . . . . 18Full-Time Enrolment by Majors (Fall / Winter) . . . . . . . . 26Part-Time Enrolment by Majors (Fall / Winter) . . . . . . . . 27 SECTION 5 SPACEEnrolment by Gender, Registration Status & Level . . . . . . 28Enrolment by Gender . . . . . . . . . . . . . . . . . . . . . . 29 University Land (in Hectares) . . . . . . . . . . . . . . . . . 50Enrolment by Level & Registration Status . . . . . . . . . . . 30 Distribution of Physical Space . . . . . . . . . . . . . . . . . 51Age Distribtuion of Registered Applicaants . . . . . . . . . . 31 Residence Accommodation . . . . . . . . . . . . . . . . . . . 52Geographic Distribution of Full-Time Registrants . . . . . . . 32 Lakehead University Campus MapsApplicant / Registrant Data . . . . . . . . . . . . . . . . . . 33 Thunder Bay . . . . . . . . . . . . . . . . 53Applications - All Ontario . . . . . . . . . . . . . . . . . . . . 34 Orillia . . . . . . . . . . . . . . . . . . . . 54Registrations - All Ontario . . . . . . . . . . . . . . . . . . . 35Applications - Northwestern Ontario . . . . . . . . . . . . . 36 HIGHLIGHTS OF LAKEHEAD UNIVERSITY'S ECONOMICRegistrations - Northwestern Ontario . . . . . . . . . . . . . 37 IMPACT ON THE CITY OF THUNDER BAY. . . . . . 55
4
SECTION 1 - GENERAL Lakehead University Mission Statement Honorary Degrees, Fellows, Distinguished Alumni, Distinguished Researchers, Distinguished Instructors Lakehead University Organization (Board of Governors, Senate and Committees) Academic Faculties, Departments and Schools Library Collections, Circulation and Reference Statistics BIU Weight/FTE Glossary of Acronyms

Lakehead University, as a comprehensive university, is committed to excellence and innovation in undergraduate and
graduate teaching, service, research and other scholarly activity. As part of this commitment, Lakehead University
is dedicated to a student-centred learning environment. Lakehead University values its people and the diversity of
their ideas, contributions and achievements. Lakehead University is dedicated to working with Aboriginal peoples in
furthering their educational aspirations. Building on its accomplishments and partnerships and recognizing its role
in Northwestern Ontario and Central Ontario, Lakehead University reaches out regionally, nationally and
internationally.
Lakehead University is committed to educating students who will be recognized for leadership and independent
critical thinking and who are aware of social and environmental responsibilities.
LAKEHEAD UNIVERSITY MISSION STATEMENT
6
HONORARY DEGREES
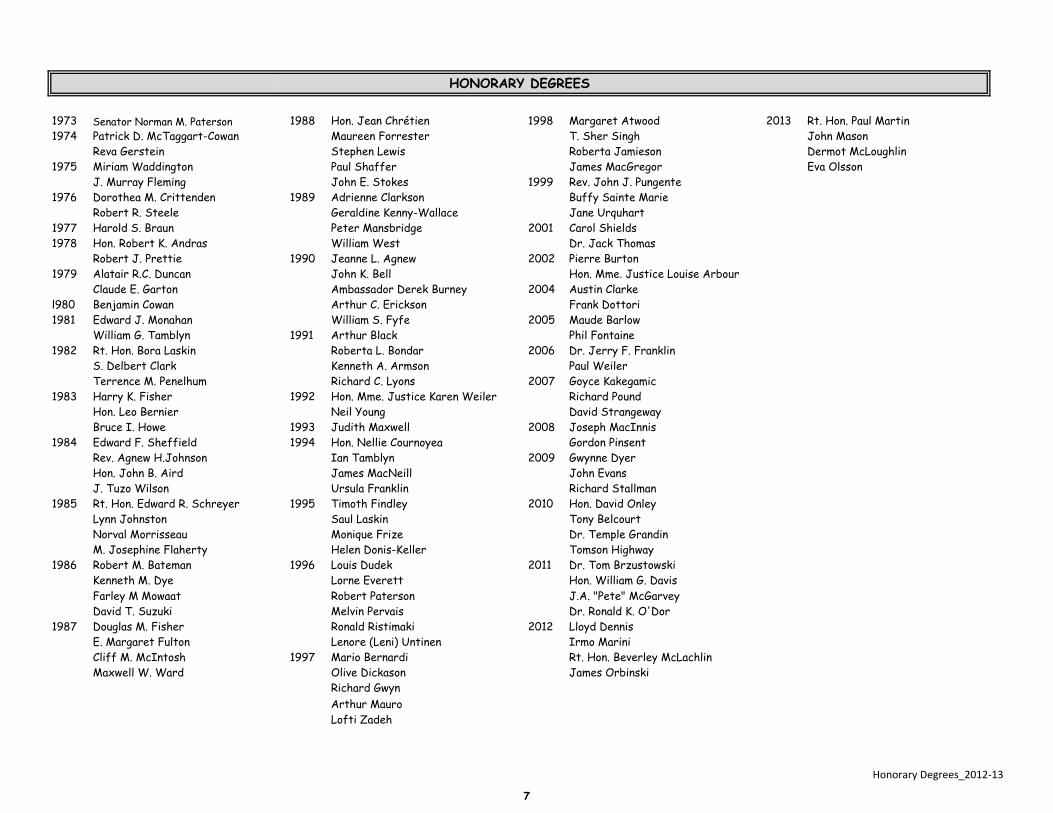
1973 Senator Norman M. Paterson 1988 Hon. Jean Chrétien 1998 Margaret Atwood 2013 Rt. Hon. Paul Martin1974 Patrick D. McTaggart-Cowan Maureen Forrester T. Sher Singh John Mason
Reva Gerstein Stephen Lewis Roberta Jamieson Dermot McLoughlin1975 Miriam Waddington Paul Shaffer James MacGregor Eva Olsson
J. Murray Fleming John E. Stokes 1999 Rev. John J. Pungente1976 Dorothea M. Crittenden 1989 Adrienne Clarkson Buffy Sainte Marie
Robert R. Steele Geraldine Kenny-Wallace Jane Urquhart1977 Harold S. Braun Peter Mansbridge 2001 Carol Shields1978 Hon. Robert K. Andras William West Dr. Jack Thomas
Robert J. Prettie 1990 Jeanne L. Agnew 2002 Pierre Burton1979 Alatair R.C. Duncan John K. Bell Hon. Mme. Justice Louise Arbour
Claude E. Garton Ambassador Derek Burney 2004 Austin Clarkel980 Benjamin Cowan Arthur C. Erickson Frank Dottori1981 Edward J. Monahan William S. Fyfe 2005 Maude Barlow
William G. Tamblyn 1991 Arthur Black Phil Fontaine1982 Rt. Hon. Bora Laskin Roberta L. Bondar 2006 Dr. Jerry F. Franklin
S. Delbert Clark Kenneth A. Armson Paul WeilerTerrence M. Penelhum Richard C. Lyons 2007 Goyce Kakegamic
1983 Harry K. Fisher 1992 Hon. Mme. Justice Karen Weiler Richard PoundHon. Leo Bernier Neil Young David StrangewayBruce I. Howe 1993 Judith Maxwell 2008 Joseph MacInnis
1984 Edward F. Sheffield 1994 Hon. Nellie Cournoyea Gordon PinsentRev. Agnew H.Johnson Ian Tamblyn 2009 Gwynne DyerHon. John B. Aird James MacNeill John EvansJ. Tuzo Wilson Ursula Franklin Richard Stallman
1985 Rt. Hon. Edward R. Schreyer 1995 Timoth Findley 2010 Hon. David OnleyLynn Johnston Saul Laskin Tony BelcourtNorval Morrisseau Monique Frize Dr. Temple GrandinM. Josephine Flaherty Helen Donis-Keller Tomson Highway
1986 Robert M. Bateman 1996 Louis Dudek 2011 Dr. Tom BrzustowskiKenneth M. Dye Lorne Everett Hon. William G. DavisFarley M Mowaat Robert Paterson J.A. "Pete" McGarveyDavid T. Suzuki Melvin Pervais Dr. Ronald K. O'Dor
1987 Douglas M. Fisher Ronald Ristimaki 2012 Lloyd DennisE. Margaret Fulton Lenore (Leni) Untinen Irmo MariniCliff M. McIntosh 1997 Mario Bernardi Rt. Hon. Beverley McLachlinMaxwell W. Ward Olive Dickason James Orbinski
Richard GwynArthur MauroLofti Zadeh
Honorary Degrees_2012‐13
7
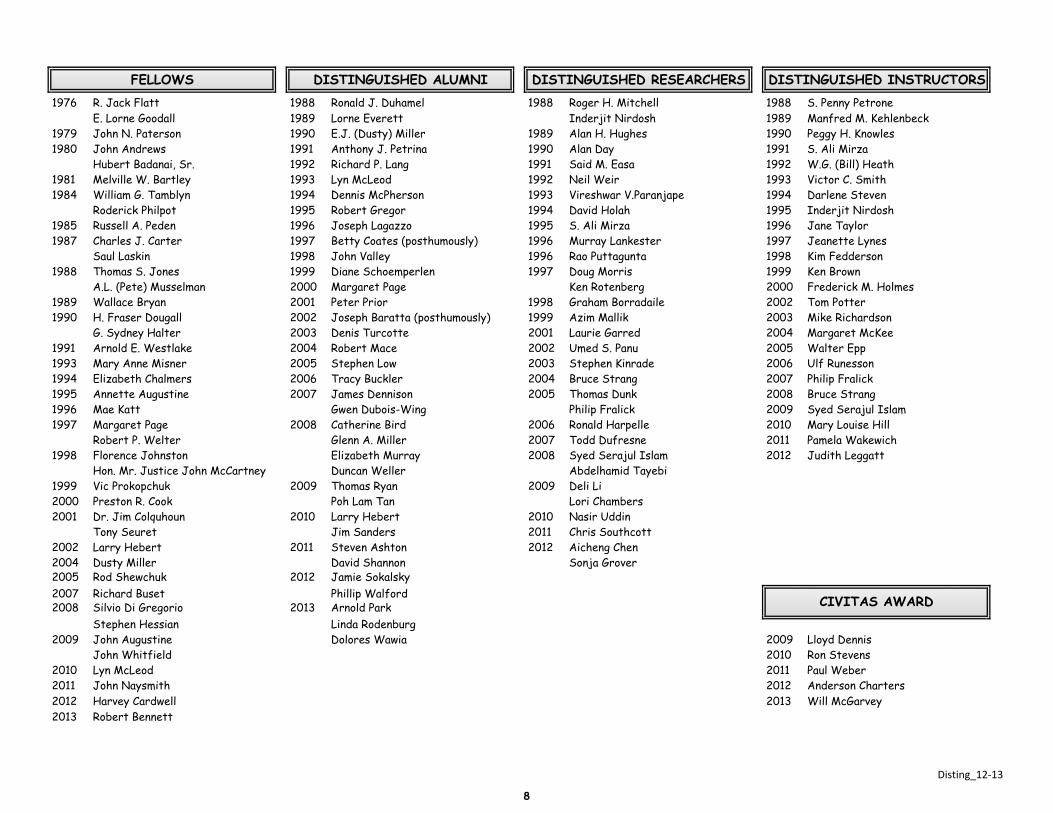
FELLOWS DISTINGUISHED ALUMNI DISTINGUISHED RESEARCHERS DISTINGUISHED INSTRUCTORS1976 R. Jack Flatt 1988 Ronald J. Duhamel 1988 Roger H. Mitchell 1988 S. Penny Petrone
E. Lorne Goodall 1989 Lorne Everett Inderjit Nirdosh 1989 Manfred M. Kehlenbeck1979 John N. Paterson 1990 E.J. (Dusty) Miller 1989 Alan H. Hughes 1990 Peggy H. Knowles1980 John Andrews 1991 Anthony J. Petrina 1990 Alan Day 1991 S. Ali Mirza
Hubert Badanai, Sr. 1992 Richard P. Lang 1991 Said M. Easa 1992 W.G. (Bill) Heath1981 Melville W. Bartley 1993 Lyn McLeod 1992 Neil Weir 1993 Victor C. Smith1984 William G. Tamblyn 1994 Dennis McPherson 1993 Vireshwar V.Paranjape 1994 Darlene Steven
Roderick Philpot 1995 Robert Gregor 1994 David Holah 1995 Inderjit Nirdosh1985 Russell A. Peden 1996 Joseph Lagazzo 1995 S. Ali Mirza 1996 Jane Taylor1987 Charles J. Carter 1997 Betty Coates (posthumously) 1996 Murray Lankester 1997 Jeanette Lynes
Saul Laskin 1998 John Valley 1996 Rao Puttagunta 1998 Kim Fedderson1988 Thomas S. Jones 1999 Diane Schoemperlen 1997 Doug Morris 1999 Ken Brown
A.L. (Pete) Musselman 2000 Margaret Page Ken Rotenberg 2000 Frederick M. Holmes1989 Wallace Bryan 2001 Peter Prior 1998 Graham Borradaile 2002 Tom Potter1990 H. Fraser Dougall 2002 Joseph Baratta (posthumously) 1999 Azim Mallik 2003 Mike Richardson
G. Sydney Halter 2003 Denis Turcotte 2001 Laurie Garred 2004 Margaret McKee1991 Arnold E. Westlake 2004 Robert Mace 2002 Umed S. Panu 2005 Walter Epp1993 Mary Anne Misner 2005 Stephen Low 2003 Stephen Kinrade 2006 Ulf Runesson1994 Elizabeth Chalmers 2006 Tracy Buckler 2004 Bruce Strang 2007 Philip Fralick1995 Annette Augustine 2007 James Dennison 2005 Thomas Dunk 2008 Bruce Strang1996 Mae Katt Gwen Dubois-Wing Philip Fralick 2009 Syed Serajul Islam1997 Margaret Page 2008 Catherine Bird 2006 Ronald Harpelle 2010 Mary Louise Hill
Robert P. Welter Glenn A. Miller 2007 Todd Dufresne 2011 Pamela Wakewich1998 Florence Johnston Elizabeth Murray 2008 Syed Serajul Islam 2012 Judith Leggatt
Hon. Mr. Justice John McCartney Duncan Weller Abdelhamid Tayebi1999 Vic Prokopchuk 2009 Thomas Ryan 2009 Deli Li2000 Preston R. Cook Poh Lam Tan Lori Chambers2001 Dr. Jim Colquhoun 2010 Larry Hebert 2010 Nasir Uddin
Tony Seuret Jim Sanders 2011 Chris Southcott2002 Larry Hebert 2011 Steven Ashton 2012 Aicheng Chen2004 Dusty Miller David Shannon Sonja Grover2005 Rod Shewchuk 2012 Jamie Sokalsky2007 Richard Buset Phillip Walford2008 Silvio Di Gregorio 2013 Arnold Park
Stephen Hessian Linda Rodenburg2009 John Augustine Dolores Wawia 2009 Lloyd Dennis
John Whitfield 2010 Ron Stevens2010 Lyn McLeod 2011 Paul Weber2011 John Naysmith 2012 Anderson Charters2012 Harvey Cardwell 2013 Will McGarvey2013 Robert Bennett
CIVITAS AWARD
Disting_12‐13
8
EMPLOYEE RELATIONS/
HARASSMENT/DISCRIMINATION Sherry Herchak, Co-ordinator
FACULTY RELATIONS Amber McCart, H.R. Officer
HEALTH & SAFETY Ursula MacDonald, H.R. Officer
Advanced Institute for Globalization and Culture
Centre for Education and Research on Aging and Health (CERAH) Ian Newhouse, Director
Centre for Northern Studies Harvey Lemelin, Director
Lakehead University Centre for Tourism and Community Development Norm McIntyre, Director (Acting)
Centre for Rural and Northern Health Research (CRaNHR) Bruce Minore, Research Director
Centre of Excellence for Children and Adolescents with Special Needs Edward Rawana, Director
Interdisciplinary Program on Safe Driving Michel Bédard, Director (Acting)
Lakehead Social History Institute Michel Beaulieu, Beth Beoegh, Co-Directors
Lakehead University Centre for Health Care Ethics (CHCE) Jaro Kotalik, Director
Lakehead University Biotechnology Research Program Heidi Schraft, Director
Lakehead University Centre for Analytical Services (LUCAS) Al Mackenzie, Director
Aquatic Toxicology Research Centre (ATRC) Peter Lee, Academic Director
Forest Resources and Soil Testing Laboratory (FoReST) Nancy Luckai, Lense Meyer, Co-Directors
Lakehead University Environmental Laboratory (LUEL) Peter Lee, Director
Lakehead University Instrumentation Laboratory (LUIL) Al Mackenzie, Manager
Lakehead University Genetics Services (LUGS) Carney Matheson, Director
Lakehead University Mineralogical and Experimental Laboratory Andrew Conly, Director
Lakehead University Nutrient Ecology Laboratory (LUNE) Ellie E. Prepas, Director
Lakehead University Wood Science Testing Laboratory (LUWSTL) Mathew Leitch, Director
LEVTEK Dary Rathje, Manager
Paleo-DNA Laboratory Al Mackenzie, Director
Lakehead Materials Characterization Services (LUMCS) A. Chen, S. Kincade, R. Mawhinney
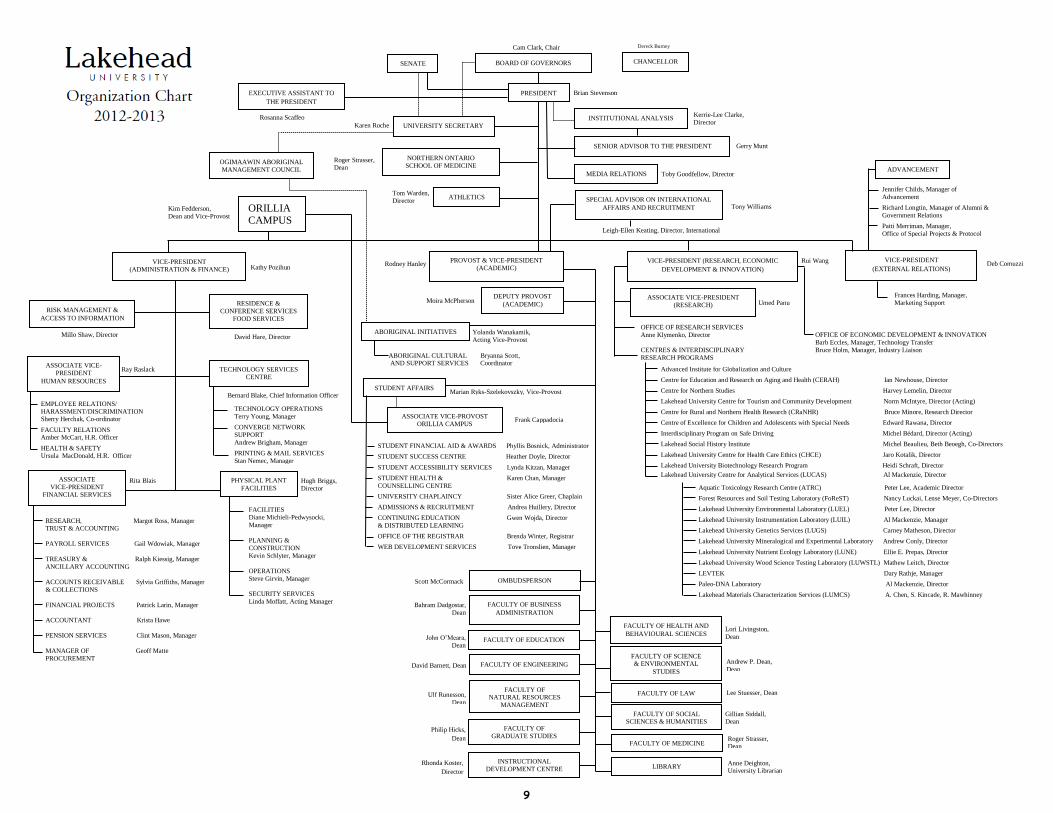
Cam Clark, Chair
Dereck Burney
Arthur Mauro
Brian Stevenson
Rosanna Scaffeo
Karen Roche
Kerrie-Lee Clarke,
Director
Gerry Munt
Toby Goodfellow, Director
Tony Williams
Leigh-Ellen Keating, Director, International
Tom Warden,
Director
Roger Strasser, Dean
Kim Fedderson,
Dean and Vice-Provost
Kathy Pozihun
Rodney Hanley
Rui Wang
Deb Comuzzi
Millo Shaw, Director
Ray Raslack
Rita Blais
Hugh Briggs,
Director
Bernard Blake, Chief Information Officer
David Hare, Director
Moira McPherson
Umed Panu
Frank Cappadocia
Marian Ryks-Szelekovszky, Vice-Provost
Yolanda Wanakamik,
Acting Vice-Provost
Scott McCormack
Bahram Dadgostar,
Dean
John O’Meara,
Dean
David Barnett, Dean
Ulf Runesson,
Dean
Philip Hicks,
Dean
Rhonda Koster,
Director
Lori Livingston,
Dean
Andrew P. Dean,
Dean
Lee Stuesser, Dean
Gillian Siddall, Dean
Roger Strasser, Dean
Anne Deighton, University Librarian
CHANCELLOR BOARD OF GOVERNORS SENATE
INSTITUTIONAL ANALYSIS
MEDIA RELATIONS
NORTHERN ONTARIO
SCHOOL OF MEDICINE
SPECIAL ADVISOR ON INTERNATIONAL
AFFAIRS AND RECRUITMENT
ATHLETICS
OGIMAAWIN ABORIGINAL
MANAGEMENT COUNCIL
PRESIDENT
SENIOR ADVISOR TO THE PRESIDENT
UNIVERSITY SECRETARY
EXECUTIVE ASSISTANT TO
THE PRESIDENT
VICE-PRESIDENT
(ADMINISTRATION & FINANCE)
PROVOST & VICE-PRESIDENT
(ACADEMIC)
VICE-PRESIDENT (RESEARCH, ECONOMIC
DEVELOPMENT & INNOVATION) VICE-PRESIDENT
(EXTERNAL RELATIONS)
ASSOCIATE
VICE-PRESIDENT
FINANCIAL SERVICES
ASSOCIATE VICE-
PRESIDENT
HUMAN RESOURCES
RESIDENCE &
CONFERENCE SERVICES
FOOD SERVICES
TECHNOLOGY SERVICES
CENTRE
PHYSICAL PLANT
FACILITIES
RISK MANAGEMENT &
ACCESS TO INFORMATION
ORILLIA CAMPUS
DEPUTY PROVOST
(ACADEMIC)
ABORIGINAL INITIATIVES
STUDENT AFFAIRS
ASSOCIATE VICE-PROVOST
ORILLIA CAMPUS
OMBUDSPERSON
FACULTY OF BUSINESS
ADMINISTRATION
FACULTY OF EDUCATION
FACULTY OF ENGINEERING
FACULTY OF NATURAL RESOURCES
MANAGEMENT
FACULTY OF
GRADUATE STUDIES
INSTRUCTIONAL
DEVELOPMENT CENTRE
FACULTY OF HEALTH AND
BEHAVIOURAL SCIENCES
FACULTY OF SCIENCE & ENVIRONMENTAL
STUDIES
FACULTY OF SOCIAL SCIENCES & HUMANITIES
FACULTY OF MEDICINE
LIBRARY
ASSOCIATE VICE-PRESIDENT
(RESEARCH)
ADVANCEMENT
FACILITIES
Diane Michieli-Pedwysocki,
Manager
PLANNING &
CONSTRUCTION
Kevin Schlyter, Manager
OPERATIONS
Steve Girvin, Manager
SECURITY SERVICES
Linda Moffatt, Acting Manager
ABORIGINAL CULTURAL Bryanna Scott, AND SUPPORT SERVICES Coordinator
TECHNOLOGY OPERATIONS
Terry Young, Manager
CONVERGE NETWORK
SUPPORT
Andrew Brigham, Manager
PRINTING & MAIL SERVICES
Stan Nemec, Manager
RESEARCH, Margot Ross, Manager TRUST & ACCOUNTING
PAYROLL SERVICES Gail Wdowiak, Manager
TREASURY & Ralph Kiessig, Manager
ANCILLARY ACCOUNTING
ACCOUNTS RECEIVABLE Sylvia Griffiths, Manager
& COLLECTIONS
FINANCIAL PROJECTS Patrick Larin, Manager
ACCOUNTANT Krista Hawe
PENSION SERVICES Clint Mason, Manager
MANAGER OF Geoff Matte
PROCUREMENT
Frances Harding, Manager,
Marketing Support
OFFICE OF RESEARCH SERVICES
Anne Klymenko, Director
CENTRES & INTERDISCIPLINARY
RESEARCH PROGRAMS
OFFICE OF ECONOMIC DEVELOPMENT & INNOVATION
Barb Eccles, Manager, Technology Transfer
Bruce Holm, Manager, Industry Liaison
STUDENT FINANCIAL AID & AWARDS Phyllis Bosnick, Administrator
STUDENT SUCCESS CENTRE Heather Doyle, Director
STUDENT ACCESSIBILITY SERVICES Lynda Kitzan, Manager
STUDENT HEALTH & Karen Chan, Manager
COUNSELLING CENTRE
UNIVERSITY CHAPLAINCY Sister Alice Greer, Chaplain
ADMISSIONS & RECRUITMENT Andrea Huillery, Director
CONTINUING EDUCATION Gwen Wojda, Director
& DISTRIBUTED LEARNING
OFFICE OF THE REGISTRAR Brenda Winter, Registrar
WEB DEVELOPMENT SERVICES Tove Tronslien, Manager
Jennifer Childs, Manager of
Advancement
Richard Longtin, Manager of Alumni &
Government Relations
Patti Merriman, Manager,
Office of Special Projects & Protocol
FACULTY OF LAW
9
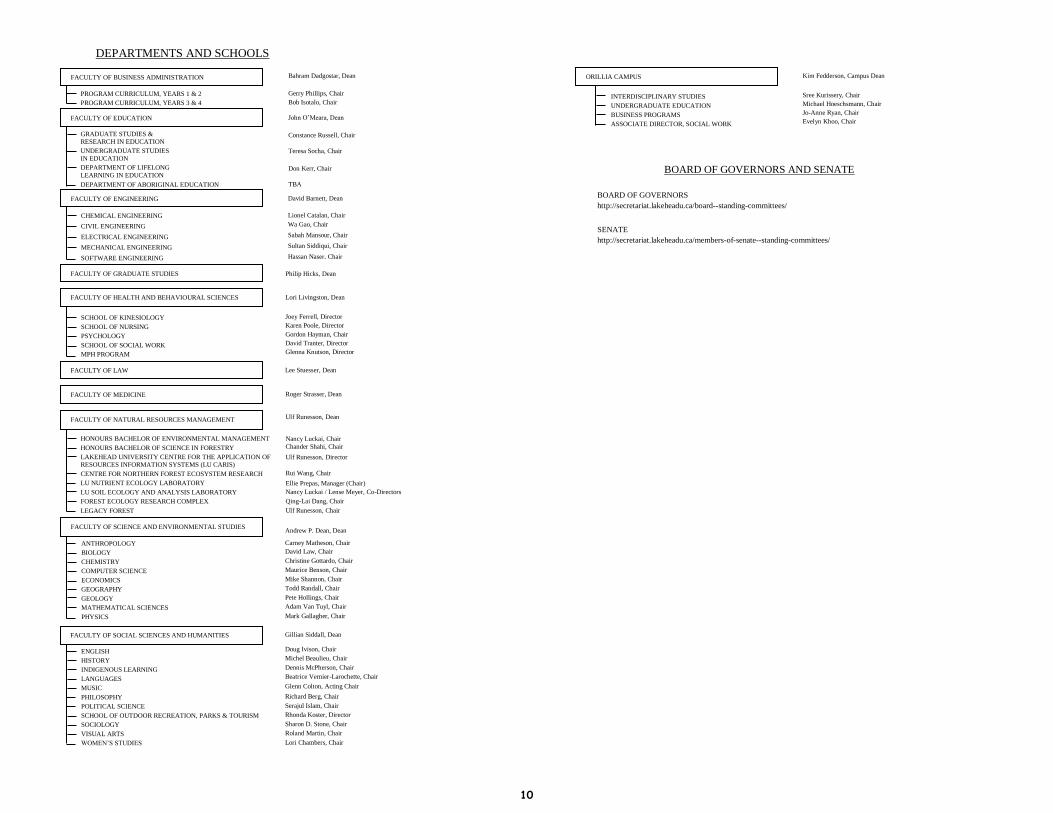
DEPARTMENTS AND SCHOOLS
PROGRAM CURRICULUM, YEARS 1 & 2
PROGRAM CURRICULUM, YEARS 3 & 4
GRADUATE STUDIES &
RESEARCH IN EDUCATION
UNDERGRADUATE STUDIES
IN EDUCATION
DEPARTMENT OF LIFELONG
LEARNING IN EDUCATION
DEPARTMENT OF ABORIGINAL EDUCATION
CHEMICAL ENGINEERING
CIVIL ENGINEERING
ELECTRICAL ENGINEERING
MECHANICAL ENGINEERING
SOFTWARE ENGINEERING
SCHOOL OF KINESIOLOGY
SCHOOL OF NURSING
PSYCHOLOGY
SCHOOL OF SOCIAL WORK
MPH PROGRAM
HONOURS BACHELOR OF ENVIRONMENTAL MANAGEMENT
HONOURS BACHELOR OF SCIENCE IN FORESTRY
LAKEHEAD UNIVERSITY CENTRE FOR THE APPLICATION OF
RESOURCES INFORMATION SYSTEMS (LU CARIS)
CENTRE FOR NORTHERN FOREST ECOSYSTEM RESEARCH
LU NUTRIENT ECOLOGY LABORATORY
LU SOIL ECOLOGY AND ANALYSIS LABORATORY
FOREST ECOLOGY RESEARCH COMPLEX
LEGACY FOREST
ANTHROPOLOGY
BIOLOGY
CHEMISTRY
COMPUTER SCIENCE
ECONOMICS
GEOGRAPHY
GEOLOGY
MATHEMATICAL SCIENCES
PHYSICS
ENGLISH
HISTORY
INDIGENOUS LEARNING
LANGUAGES
MUSIC
PHILOSOPHY
POLITICAL SCIENCE
SCHOOL OF OUTDOOR RECREATION, PARKS & TOURISM
SOCIOLOGY
VISUAL ARTS
WOMEN’S STUDIES
INTERDISCIPLINARY STUDIES
UNDERGRADUATE EDUCATION
BUSINESS PROGRAMS
ASSOCIATE DIRECTOR, SOCIAL WORK
Bahram Dadgostar, Dean
Gerry Phillips, Chair
Bob Isotalo, Chair
John O’Meara, Dean
Constance Russell, Chair
Teresa Socha, Chair
Don Kerr, Chair
TBA
David Barnett, Dean
Lionel Catalan, Chair
Wa Gao, Chair
Sabah Mansour, Chair
Sultan Siddiqui, Chair
Hassan Naser, Chair
Philip Hicks, Dean
Lori Livingston, Dean
Joey Ferrell, Director
Karen Poole, Director
Gordon Hayman, Chair
David Tranter, Director
Glenna Knutson, Director
Lee Stuesser, Dean
Roger Strasser, Dean
Ulf Runesson, Dean
Nancy Luckai, Chair
Chander Shahi, Chair
Ulf Runesson, Director
Rui Wang, Chair
Ellie Prepas, Manager (Chair)
Nancy Luckai / Lense Meyer, Co-Directors
Qing-Lai Dang, Chair
Ulf Runesson, Chair
Andrew P. Dean, Dean
Carney Matheson, Chair
David Law, Chair
Christine Gottardo, Chair
Maurice Benson, Chair
Mike Shannon, Chair
Todd Randall, Chair
Pete Hollings, Chair
Adam Van Tuyl, Chair
Mark Gallagher, Chair
Gillian Siddall, Dean
Doug Ivison, Chair
Michel Beaulieu, Chair
Dennis McPherson, Chair
Beatrice Vernier-Larochette, Chair
Glenn Colton, Acting Chair
Richard Berg, Chair
Serajul Islam, Chair
Rhonda Koster, Director
Sharon D. Stone, Chair
Roland Martin, Chair
Lori Chambers, Chair
Kim Fedderson, Campus Dean
Sree Kurissery, Chair
Michael Hoeschsmann, Chair
Jo-Anne Ryan, Chair
Evelyn Khoo, Chair
FACULTY OF BUSINESS ADMINISTRATION
FACULTY OF SCIENCE AND ENVIRONMENTAL STUDIES
FACULTY OF EDUCATION
FACULTY OF ENGINEERING
FACULTY OF NATURAL RESOURCES MANAGEMENT
FACULTY OF LAW
FACULTY OF GRADUATE STUDIES
FACULTY OF HEALTH AND BEHAVIOURAL SCIENCES
FACULTY OF SOCIAL SCIENCES AND HUMANITIES
FACULTY OF MEDICINE
ORILLIA CAMPUS
BOARD OF GOVERNORS AND SENATE
BOARD OF GOVERNORS
http://secretariat.lakeheadu.ca/board--standing-committees/
SENATE
http://secretariat.lakeheadu.ca/members-of-senate--standing-committees/
10
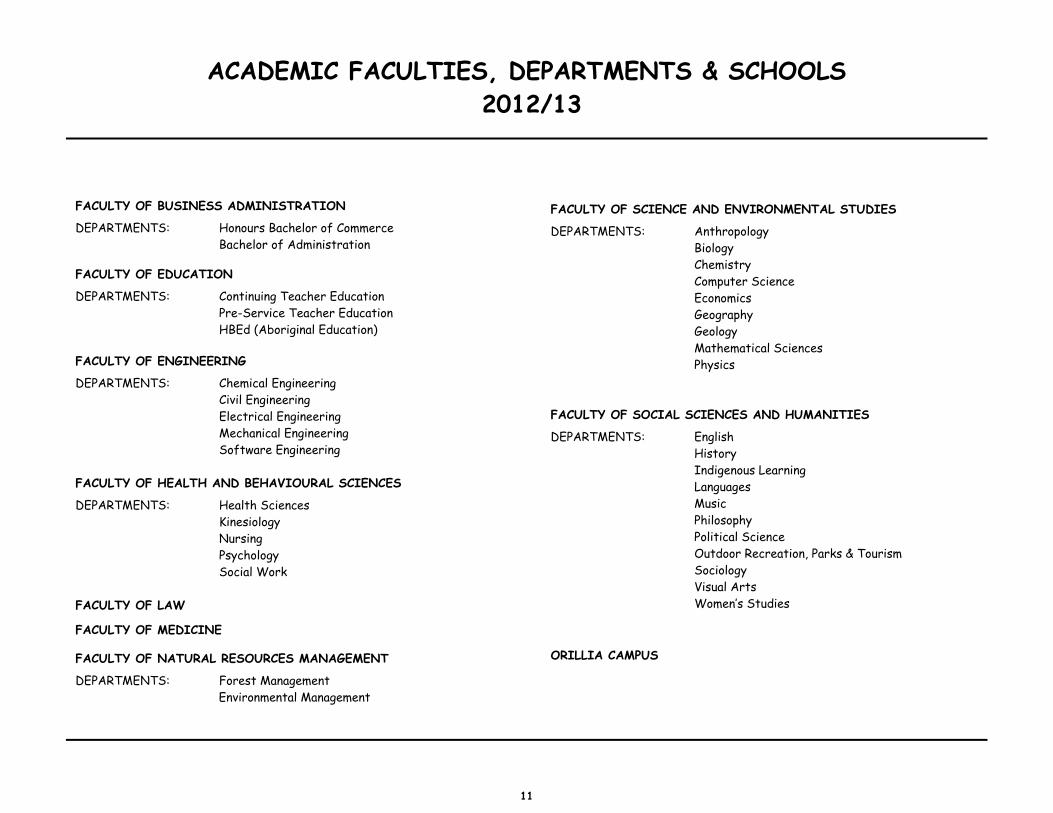
ACADEMIC FACULTIES, DEPARTMENTS & SCHOOLS 2012/13
FACULTY OF BUSINESS ADMINISTRATION
DEPARTMENTS: Honours Bachelor of Commerce Bachelor of Administration
FACULTY OF EDUCATION
DEPARTMENTS: Continuing Teacher Education Pre-Service Teacher Education HBEd (Aboriginal Education) FACULTY OF ENGINEERING
DEPARTMENTS: Chemical Engineering Civil Engineering Electrical Engineering Mechanical Engineering Software Engineering FACULTY OF HEALTH AND BEHAVIOURAL SCIENCES
DEPARTMENTS: Health Sciences Kinesiology Nursing Psychology Social Work FACULTY OF LAW
FACULTY OF MEDICINE
FACULTY OF NATURAL RESOURCES MANAGEMENT
DEPARTMENTS: Forest Management
FACULTY OF SCIENCE AND ENVIRONMENTAL STUDIES
DEPARTMENTS: Anthropology Biology Chemistry Computer Science
Economics Geography Geology Mathematical Sciences Physics FACULTY OF SOCIAL SCIENCES AND HUMANITIES
DEPARTMENTS: English History Indigenous Learning Languages Music Philosophy Political Science Outdoor Recreation, Parks & Tourism Sociology Visual Arts Women’s Studies
ORILLIA CAMPUS
Environmental Management
11

COLLECTIONS, CIRCULATION AND REFERENCE STATISTICS:
LAKEHEAD UNIVERSITY LIBRARY RESOURCES
2003/04 2004/05 2005/06 2006/07 2007/08 2008/09 2009/10 2010/11 2011/12 *
COLLECTION STATISTICS
Book Titles - Electronic 3,055 11,733 12,806 16,301 32,272 67,042 80,030 91,334 96,578 - Print 378,668 383,737 394,417 397,083 407,672 415,431 421,464 422,211 429,922
Serial Titles - Electronic 8,500 15,389 20,614 27,059 33,396 37,925 42,196 42,763 42,766 - Print 3,802 3,485 1,767 2,029 2,139 2,157 2,053 1,770 1,734
Microforms 915,402 916,384 917,633 919,174 920,162 944,465 964,465 946,333 947,687
CIRCULATION STATISTICS
Circulated Items 139,727 134,089 105,436 95,046 87,345 102,634 92,418 102,290 84,682 Electronic Reserve Hits 54,902 52,944 235,666 46,997 N/A N/A N/A N/A N/A
REFERENCE STATISTICS
Reference Queries 26,113 23,443 23,272 23,774 23,820 23,733 23,400 22,667 29,397
INTERLIBRARY LOANS
Items Borrowed 6,646 6,857 8,994 8,128 7,444 6,927 6,722 4,820 5,161 Items Loaned 4,196 4,251 5,112 3,604 3,900 4,136 4,604 4,074 3,748
LIBRARY INSTRUCTION
Number of Presentations 169 178 203 159 142 140 126 162 165 Number of Participants 2,416 2,868 3,225 4,102 3,488 3,221 2,992 3,116 3,171
* Includes Orillia libraries.
Library_2011-1212
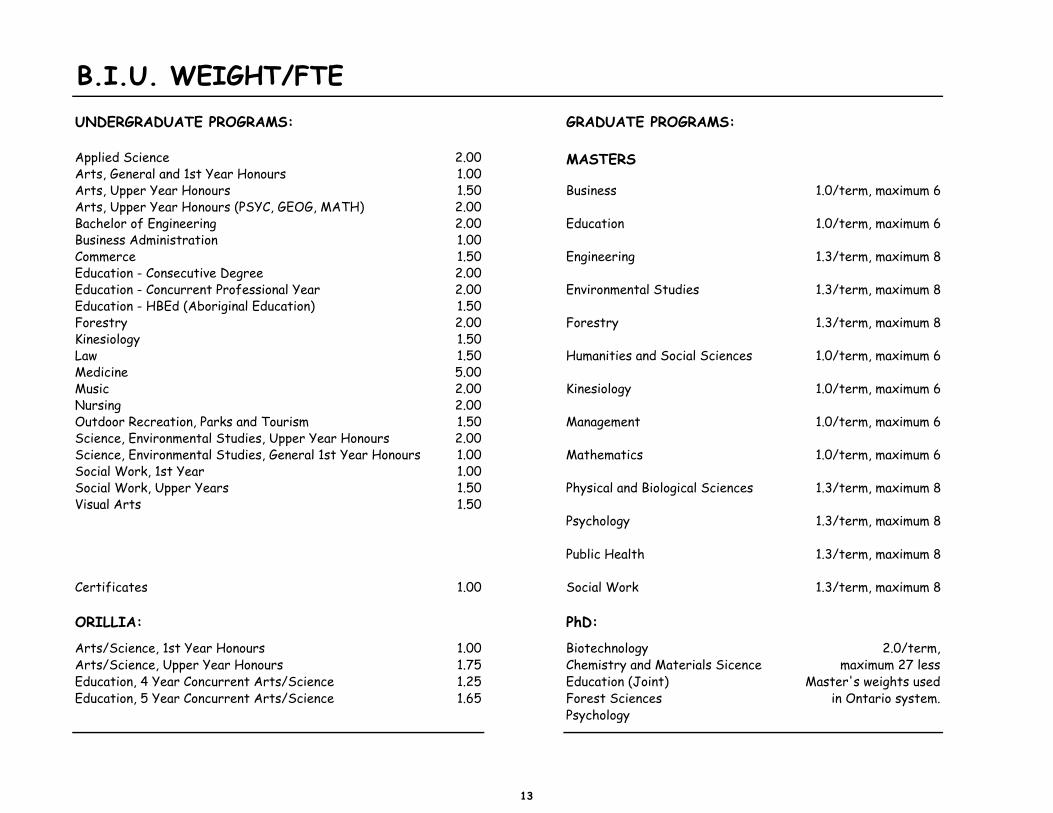
B.I.U. WEIGHT/FTEUNDERGRADUATE PROGRAMS: GRADUATE PROGRAMS:
Applied Science 2.00 MASTERSArts, General and 1st Year Honours 1.00Arts, Upper Year Honours 1.50 Business 1.0/term, maximum 6Arts, Upper Year Honours (PSYC, GEOG, MATH) 2.00Bachelor of Engineering 2.00 Education 1.0/term, maximum 6Business Administration 1.00Commerce 1.50 Engineering 1.3/term, maximum 8Education - Consecutive Degree 2.00Education - Concurrent Professional Year 2.00 Environmental Studies 1.3/term, maximum 8Education - HBEd (Aboriginal Education) 1.50Forestry 2.00 Forestry 1.3/term, maximum 8Kinesiology 1.50Law 1.50 Humanities and Social Sciences 1.0/term, maximum 6Medicine 5.00Music 2.00 Kinesiology 1.0/term, maximum 6Nursing 2.00Outdoor Recreation, Parks and Tourism 1.50 Management 1.0/term, maximum 6Science, Environmental Studies, Upper Year Honours 2.00Science, Environmental Studies, General 1st Year Honours 1.00 Mathematics 1.0/term, maximum 6Social Work, 1st Year 1.00Social Work, Upper Years 1.50 Physical and Biological Sciences 1.3/term, maximum 8Visual Arts 1.50
Psychology 1.3/term, maximum 8
Public Health 1.3/term, maximum 8
Certificates 1.00 Social Work 1.3/term, maximum 8
ORILLIA: PhD:
Arts/Science, 1st Year Honours 1.00 Biotechnology 2.0/term,Arts/Science, Upper Year Honours 1.75 Chemistry and Materials SicenceEducation, 4 Year Concurrent Arts/Science 1.25 Education (Joint)Education, 5 Year Concurrent Arts/Science 1.65 Forest Sciences
Psychology
maximum 27 less Master's weights used
in Ontario system.
13
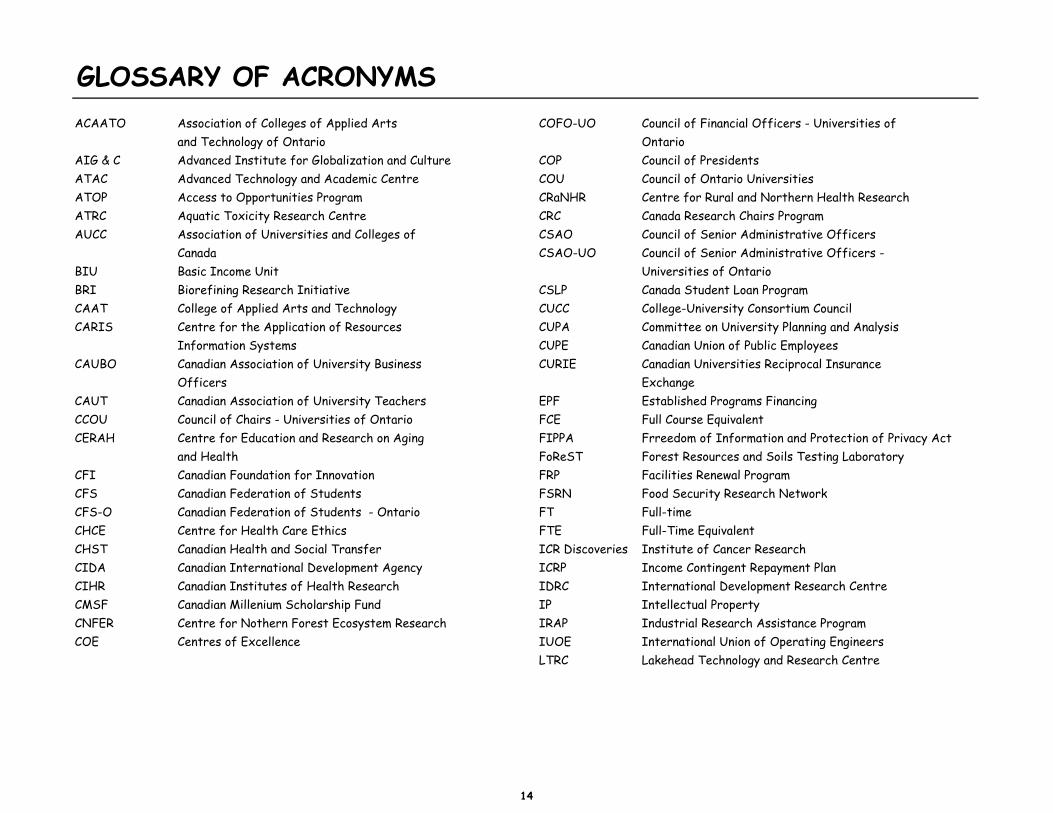
GLOSSARY OF ACRONYMSACAATO Association of Colleges of Applied Arts COFO-UO Council of Financial Officers - Universities of
and Technology of Ontario OntarioAIG & C Advanced Institute for Globalization and Culture COP Council of PresidentsATAC Advanced Technology and Academic Centre COU Council of Ontario UniversitiesATOP Access to Opportunities Program CRaNHR Centre for Rural and Northern Health Research ATRC Aquatic Toxicity Research Centre CRC Canada Research Chairs ProgramAUCC Association of Universities and Colleges of CSAO Council of Senior Administrative Officers
Canada CSAO-UO Council of Senior Administrative Officers - BIU Basic Income Unit Universities of OntarioBRI Biorefining Research Initiative CSLP Canada Student Loan ProgramCAAT College of Applied Arts and Technology CUCC College-University Consortium CouncilCARIS Centre for the Application of Resources CUPA Committee on University Planning and Analysis
Information Systems CUPE Canadian Union of Public EmployeesCAUBO Canadian Association of University Business CURIE Canadian Universities Reciprocal Insurance
Officers ExchangeCAUT Canadian Association of University Teachers EPF Established Programs FinancingCCOU Council of Chairs - Universities of Ontario FCE Full Course EquivalentCERAH Centre for Education and Research on Aging FIPPA Frreedom of Information and Protection of Privacy Act
and Health FoReST Forest Resources and Soils Testing LaboratoryCFI Canadian Foundation for Innovation FRP Facilities Renewal ProgramCFS Canadian Federation of Students FSRN Food Security Research NetworkCFS-O Canadian Federation of Students - Ontario FT Full-timeCHCE Centre for Health Care Ethics FTE Full-Time EquivalentCHST Canadian Health and Social Transfer ICR Discoveries Institute of Cancer ResearchCIDA Canadian International Development Agency ICRP Income Contingent Repayment PlanCIHR Canadian Institutes of Health Research IDRC International Development Research CentreCMSF Canadian Millenium Scholarship Fund IP Intellectual PropertyCNFER Centre for Nothern Forest Ecosystem Research IRAP Industrial Research Assistance ProgramCOE Centres of Excellence IUOE International Union of Operating Engineers
LTRC Lakehead Technology and Research Centre
14

GLOSSARY cont'dLUAMC Lakehead University Aboriginal Management OAC Ontario Academic Credit
Council OCAV Ontario Council of Academic Vice-PresidentsLUCAS Lakehead University Centre for Analytical Services OCGS Ontario Council on Graduate StudiesLUEL Lakehead University Environmental Laboratory OCSA Ontario Council on Student AffairsLUFA Lakehead University Faculty Association OCUFA Ontario Council of University Faculty LUGS Lakehead University Genetic Services AssociationsLUIL Lakehead University Instrumentation Laboratory OIT Ontario Innovation TrustLUMCS Lakehead University Material Characterization OPAS Office for Partnerships for Advanced Skills
Services OPEIU Office & Professional Employees InternationalLUMINX Lakehead University Mineralogical and Union
Experimental Laboratory ORDCF Ontario Research & Development ChallengeLUNE Lakehead University Nutrient Ecology Laboratory FundLUPRAC Lakehead University Program Review Audit OSAP Ontario Student Assistance Program
Committee OUAC Ontario Universities' Application CentreLUSU Lakehead University Student Union OUCA Ontario Universities' Council on AdmissionsLUWSTF Lakehead University Wood ScienceTesting Facility OURA Ontario Universities' Registrars' AssociationMEDTT Ministry of Economic Development, Trade and PDNA Paleo-DNA Laboratory
Tourism PREA Premier's Research Excellence AwardsMEST Ministry of Energy, Science and Technology PT Part-timeMRC Medical Research Council of Canada ROIE Research Overhead Infrastructure EnvelopeMTCU Ministry of Training, Colleges & Universities RPF Research Performance FundNCE Networks of Centres of Excellence SEIU Service Employees International UnionNECAH Northern Educational Centre for Aging & Health SSHRC Social Sciences & Humanities Research Council NOMP Northwestern Ontario Medical Program of CanadaNOSM Northern Ontario School of Medicine UCASS University and College Academic Staff SystemNOTC Northwestern Ontario Technology Centre (Stats Canada)NRC National Research Council USWA United Steelworkers of AmericaNSERC Natural Sciences & Engineering Research
Council of Canada
15

SECTION 2 – STUDENT DATA
FTE/BIU History
Degrees Awarded by Program
Full-time and Part-time Enrolment by Majors
Enrolment by Gender, Registration Status and Level
Enrolment by Gender
Enrolment by Level and Registration Status
Age Distribution of Registered Applicants
Geographic Distribution of Full-time Registrants
Applicant/Registrant Data
Analyses of Total and First Choice Applications & Registrations
11/09/2013
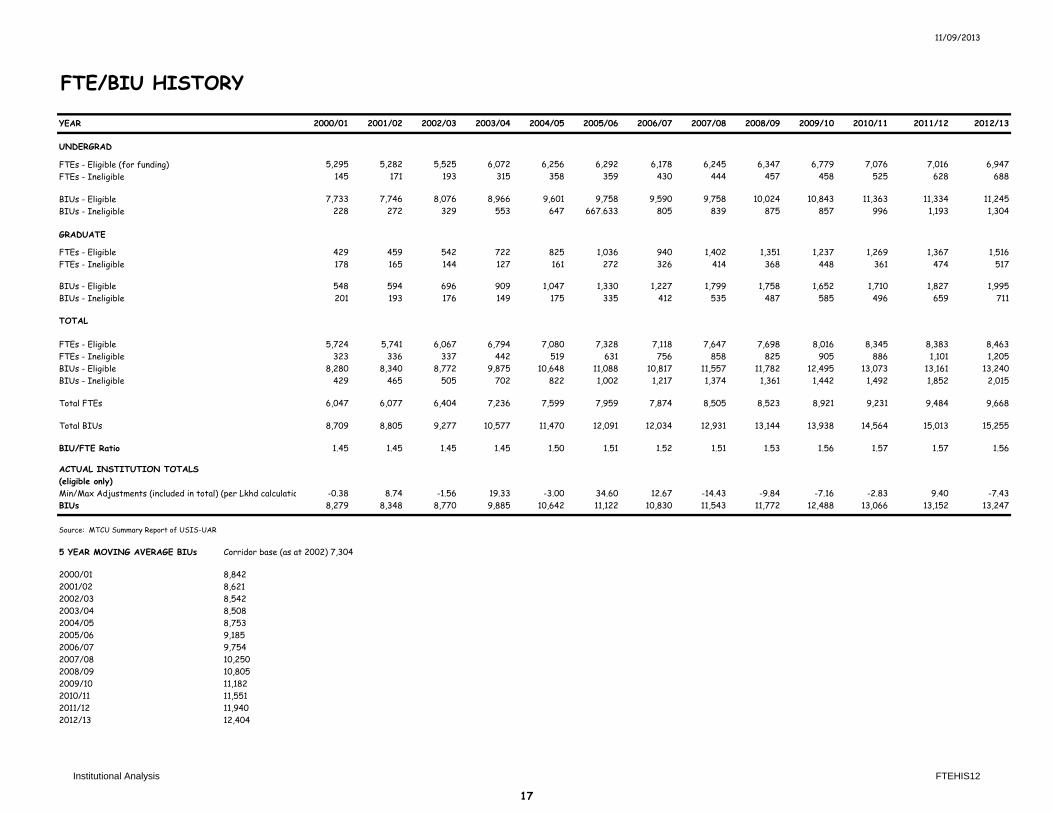
FTE/BIU HISTORY
YEAR 2000/01 2001/02 2002/03 2003/04 2004/05 2005/06 2006/07 2007/08 2008/09 2009/10 2010/11 2011/12 2012/13
UNDERGRAD
FTEs - Eligible (for funding) 5,295 5,282 5,525 6,072 6,256 6,292 6,178 6,245 6,347 6,779 7,076 7,016 6,947FTEs - Ineligible 145 171 193 315 358 359 430 444 457 458 525 628 688
BIUs - Eligible 7,733 7,746 8,076 8,966 9,601 9,758 9,590 9,758 10,024 10,843 11,363 11,334 11,245BIUs - Ineligible 228 272 329 553 647 667.633 805 839 875 857 996 1,193 1,304
GRADUATE
FTEs - Eligible 429 459 542 722 825 1,036 940 1,402 1,351 1,237 1,269 1,367 1,516FTEs - Ineligible 178 165 144 127 161 272 326 414 368 448 361 474 517
BIUs - Eligible 548 594 696 909 1,047 1,330 1,227 1,799 1,758 1,652 1,710 1,827 1,995BIUs - Ineligible 201 193 176 149 175 335 412 535 487 585 496 659 711
TOTAL
FTEs - Eligible 5,724 5,741 6,067 6,794 7,080 7,328 7,118 7,647 7,698 8,016 8,345 8,383 8,463FTEs - Ineligible 323 336 337 442 519 631 756 858 825 905 886 1,101 1,205BIUs - Eligible 8,280 8,340 8,772 9,875 10,648 11,088 10,817 11,557 11,782 12,495 13,073 13,161 13,240BIUs - Ineligible 429 465 505 702 822 1,002 1,217 1,374 1,361 1,442 1,492 1,852 2,015
Total FTEs 6,047 6,077 6,404 7,236 7,599 7,959 7,874 8,505 8,523 8,921 9,231 9,484 9,668
Total BIUs 8,709 8,805 9,277 10,577 11,470 12,091 12,034 12,931 13,144 13,938 14,564 15,013 15,255
BIU/FTE Ratio 1.45 1.45 1.45 1.45 1.50 1.51 1.52 1.51 1.53 1.56 1.57 1.57 1.56
ACTUAL INSTITUTION TOTALS(eligible only)Min/Max Adjustments (included in total) (per Lkhd calculatio -0.38 8.74 -1.56 19.33 -3.00 34.60 12.67 -14.43 -9.84 -7.16 -2.83 9.40 -7.43BIUs 8,279 8,348 8,770 9,885 10,642 11,122 10,830 11,543 11,772 12,488 13,066 13,152 13,247
Source: MTCU Summary Report of USIS-UAR
5 YEAR MOVING AVERAGE BIUs Corridor base (as at 2002) 7,304
2000/01 8,8422001/02 8,6212002/03 8,5422003/04 8,5082004/05 8,7532005/06 9,1852006/07 9,7542007/08 10,2502008/09 10,8052009/10 11,1822010/11 11,5512011/12 11,9402012/13 12,404
Institutional Analysis FTEHIS12
17
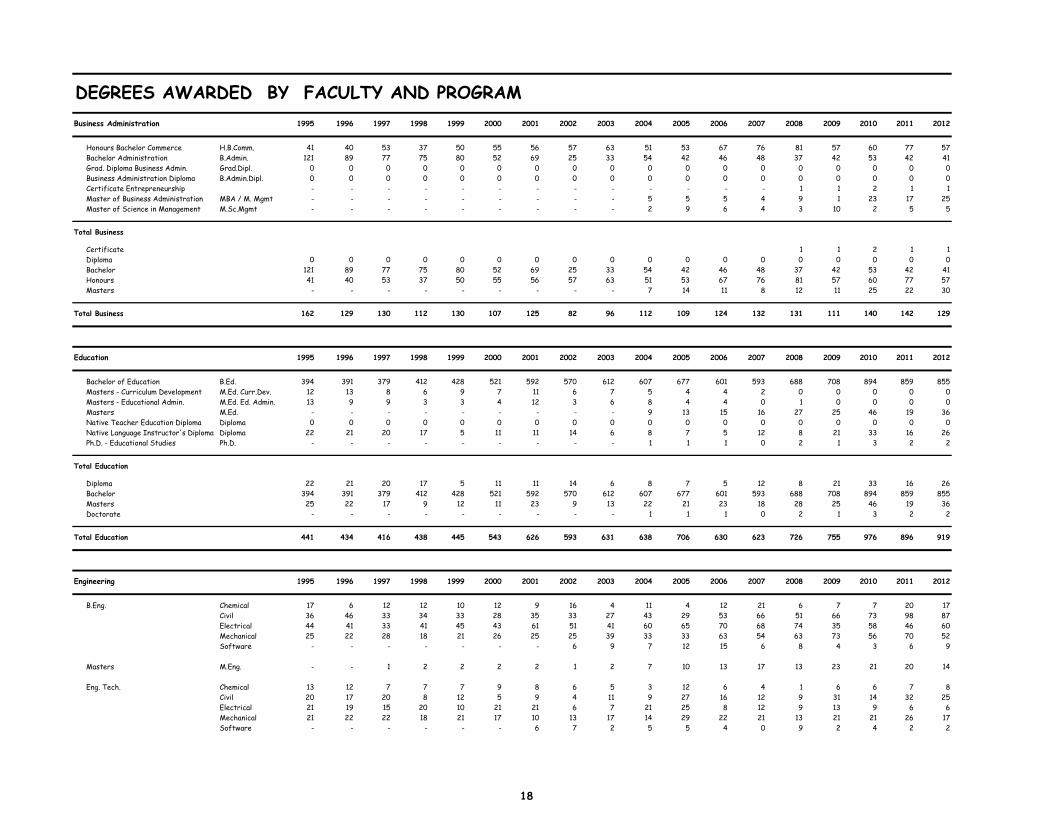
DEGREES AWARDED BY FACULTY AND PROGRAMBusiness Administration 1995 1996 1997 1998 1999 2000 2001 2002 2003 2004 2005 2006 2007 2008 2009 2010 2011 2012
Honours Bachelor Commerce H.B.Comm. 41 40 53 37 50 55 56 57 63 51 53 67 76 81 57 60 77 57 Bachelor Administration B.Admin. 121 89 77 75 80 52 69 25 33 54 42 46 48 37 42 53 42 41 Grad. Diploma Business Admin. Grad.Dipl. 0 0 0 0 0 0 0 0 0 0 0 0 0 0 0 0 0 0 Business Administration Diploma B.Admin.Dipl. 0 0 0 0 0 0 0 0 0 0 0 0 0 0 0 0 0 0 Certificate Entrepreneurship - - - - - - - - - - - - - 1 1 2 1 1 Master of Business Administration MBA / M. Mgmt - - - - - - - - - 5 5 5 4 9 1 23 17 25 Master of Science in Management M.Sc.Mgmt - - - - - - - - - 2 9 6 4 3 10 2 5 5
Total Business
Certificate 1 1 2 1 1 Diploma 0 0 0 0 0 0 0 0 0 0 0 0 0 0 0 0 0 0 Bachelor 121 89 77 75 80 52 69 25 33 54 42 46 48 37 42 53 42 41 Honours 41 40 53 37 50 55 56 57 63 51 53 67 76 81 57 60 77 57 Masters - - - - - - - - - 7 14 11 8 12 11 25 22 30
Total Business 162 129 130 112 130 107 125 82 96 112 109 124 132 131 111 140 142 129
Education 1995 1996 1997 1998 1999 2000 2001 2002 2003 2004 2005 2006 2007 2008 2009 2010 2011 2012
Bachelor of Education B.Ed. 394 391 379 412 428 521 592 570 612 607 677 601 593 688 708 894 859 855 Masters - Curriculum Development M.Ed. Curr.Dev. 12 13 8 6 9 7 11 6 7 5 4 4 2 0 0 0 0 0 Masters - Educational Admin. M.Ed. Ed. Admin. 13 9 9 3 3 4 12 3 6 8 4 4 0 1 0 0 0 0 Masters M.Ed. - - - - - - - - - 9 13 15 16 27 25 46 19 36 Native Teacher Education Diploma Diploma 0 0 0 0 0 0 0 0 0 0 0 0 0 0 0 0 0 0 Native Language Instructor's Diploma Diploma 22 21 20 17 5 11 11 14 6 8 7 5 12 8 21 33 16 26 Ph.D. - Educational Studies Ph.D. - - - - - - - - - 1 1 1 0 2 1 3 2 2
Total Education
Diploma 22 21 20 17 5 11 11 14 6 8 7 5 12 8 21 33 16 26 Bachelor 394 391 379 412 428 521 592 570 612 607 677 601 593 688 708 894 859 855 Masters 25 22 17 9 12 11 23 9 13 22 21 23 18 28 25 46 19 36 Doctorate - - - - - - - - - 1 1 1 0 2 1 3 2 2
Total Education 441 434 416 438 445 543 626 593 631 638 706 630 623 726 755 976 896 919
Engineering 1995 1996 1997 1998 1999 2000 2001 2002 2003 2004 2005 2006 2007 2008 2009 2010 2011 2012
B.Eng. Chemical 17 6 12 12 10 12 9 16 4 11 4 12 21 6 7 7 20 17Civil 36 46 33 34 33 28 35 33 27 43 29 53 66 51 66 73 98 87Electrical 44 41 33 41 45 43 61 51 41 60 65 70 68 74 35 58 46 60Mechanical 25 22 28 18 21 26 25 25 39 33 33 63 54 63 73 56 70 52Software - - - - - - - 6 9 7 12 15 6 8 4 3 6 9
Masters M.Eng. - - 1 2 2 2 2 1 2 7 10 13 17 13 23 21 20 14 Eng. Tech. Chemical 13 12 7 7 7 9 8 6 5 3 12 6 4 1 6 6 7 8
Civil 20 17 20 8 12 5 9 4 11 9 27 16 12 9 31 14 32 25Electrical 21 19 15 20 10 21 21 6 7 21 25 8 12 9 13 9 6 6Mechanical 21 22 22 18 21 17 10 13 17 14 29 22 21 13 21 21 26 17Software - - - - - - 6 7 2 5 5 4 0 9 2 4 2 2
18

DEGREES AWARDED BY FACULTY AND PROGRAMTotal Engineering
Diploma 75 70 64 53 50 52 54 36 42 52 98 56 49 41 73 54 73 58 Bachelor 122 115 106 105 109 109 130 131 120 154 143 213 215 202 185 197 240 225 Masters - - 1 2 2 2 2 1 2 7 10 13 17 13 23 21 20 14
Total Engineering 197 185 171 160 161 163 186 168 164 213 251 282 281 256 281 272 333 297
Health and Behavioural Sciences 1995 1996 1997 1998 1999 2000 2001 2002 2003 2004 2005 2006 2007 2008 2009 2010 2011 2012
Gerontology B.A. - - - - - - - - 4 3 1 3 3 5 6 8 5 5H.B.A. - - - - - - - 1 0 0 1 1 1 0 1 0 4 0Certificate - - - - - - - - - 2 11 14 10 9 5 9 5 7
Health Sciences M.P.H. - - - - - - - - - 3 7 19 26 27 26 29 21 16Grad Diploma - - - - - - - - - - 1 0 2 1 2 2 1 3
Kinesiology Honours Bachelor PE H.B.P.E. 4 0 0 0 0 0 0 0 0 0 0 0 0 0 0 0 0 0 Honours Bachelor Kinesiology H.B.K. 38 70 56 80 71 92 70 46 59 64 41 38 78 47 57 55 56 53 MA/MSc. Coaching MA./M.Sc. 3 7 7 5 4 6 9 6 4 3 3 6 4 4 7 4 4 8
Nursing Bachelor of Science B.Sc. 6 48 53 35 43 35 35 27 67 76 88 135 144 127 154 145 156 158 Honours Bachelor Science H.B.Sc. 65 3 0 0 0 0 0 0 0 0 0 0 0 0 0 0 0 0
Certificate - - - 10 20 23 23 18 14 7 11 24 22 18 26 13 16 22M.P.H. - - - - - - - - - - 12 2 5 14 6 10 6 10Grad Diploma - - - - - - - - - - - - - 1 0 0 0 0
Psychology Arts B.A. 86 111 120 84 91 84 75 53 67 81 81 82 61 60 60 57 52 44
B.A. 4 Year - - - - - - - - 1 3 1 8 10 5 6 4 2 4H.B.A. 34 46 28 45 37 39 15 23 15 25 36 43 44 33 33 47 40 40M.A. 24 18 17 7 9 12 13 11 7 11 10 7 3 9 7 8 5 7Ph.D. - - - 1 0 0 1 3 2 3 4 4 3 4 1 4 3 4
Science B.Sc. 4 3 3 2 9 8 1 6 4 0 2 3 6 2 6 4 1 0B.Sc. 4 Year - - - - - - - - 1 0 0 4 1 2 2 0 0 1H.B.Sc. 1 5 6 5 5 4 5 4 3 1 6 4 3 9 5 12 8 2M.Sc. - - - - - - - - - - - - 2 5 1 0 1 0
Social Work H.B.S.W. 44 41 47 48 47 37 48 47 44 59 48 50 62 72 49 102 96 108M.S.W. 6 15 13 11 13 14 9 14 10 17 14 11 17 22 21 14 14 14Grad Diploma - - - - - - - - - - - - - - 1 0 0 0
Total Health and Behavioural Sciences
Certificate - - - 10 20 23 23 18 14 9 22 38 32 27 31 22 21 29Bachelor 96 162 176 121 143 127 111 86 142 160 172 223 214 194 226 214 214 207B.A. 4 Year - - - - - - - - 1 3 1 8 10 5 6 4 2 4B.Sc. 4 Year - - - - - - - - 1 0 0 4 1 2 2 0 0 1Hon. Bachelor 186 165 137 178 160 172 138 121 121 149 132 136 188 161 145 216 204 203Masters 33 40 37 23 26 32 31 31 21 34 46 45 57 81 68 65 51 55Grad.Dipl. - - - - - - - - - - 1 0 2 2 3 2 1 3Ph.D. - - - 1 0 0 1 3 2 3 4 4 3 4 1 4 3 4
Total Health and Behavioural Sciences 315 367 350 333 349 354 304 259 302 358 378 458 507 476 482 527 496 506
19

DEGREES AWARDED BY FACULTY AND PROGRAM
Medicine 1995 1996 1997 1998 1999 2000 2001 2002 2003 2004 2005 2006 2007 2008 2009 2010 2011 2012
MD - - - - - - - - - - - - - - 24 21 27 23
Total Medicine - - - - - - - - - - - - - - 24 21 27 23
Natural Resources Management 1995 1996 1997 1998 1999 2000 2001 2002 2003 2004 2005 2006 2007 2008 2009 2010 2011 2012
Honours Bachelor Science 28 31 39 33 37 47 55 35 47 19 20 20 19 24 19 17 16 13 BES - - - - 2 11 16 6 5 7 3 2 10 3 4 3 5 2 HBEM - - - - - - - - - - - - - - - - - 1 HBES - - - - 2 3 5 14 10 5 3 3 8 4 5 4 6 3 Masters Science 8 9 11 6 5 19 10 9 5 5 7 8 5 9 11 13 7 10 Integrated Forest Resources Mgmt. Diploma 9 16 23 13 9 15 0 1 0 0 1 0 0 0 0 0 0 0 PhD - - - - - - - - - - - - - - 4 1 1 9
Total Natural Resources Management
Diploma 9 16 23 13 9 15 0 1 0 0 1 0 0 0 0 0 0 0 Bachelor - - - - 2 11 16 6 5 7 3 2 10 3 4 3 5 2 Hon. Bachelor 28 31 39 33 39 50 60 49 57 24 23 23 27 28 24 21 22 17 Masters 8 9 11 6 5 19 10 9 5 5 7 8 5 9 11 13 7 10 Doctorate - - - - - - - - - - - - - - 4 1 1 9
Total Natural Resources Management 45 56 73 52 55 95 86 65 67 36 34 33 42 40 43 38 35 38
Orillia BASc - - - - - - - - - - - - - - 2 37 58 61HBASc - - - - - - - - - - - - - - 3 14 45 44
(The following are for information only; these numbers are included with their departmental totals.)BA - - - - - - - - - - - - - - 2 6 1 2B Admin - - - - - - - - - - - - - 7 15 14 15 8
(BEd incl Consecutive and Concurrent) BEd - - - - - - - - - - - - - - - 232 266 272Certificate - - - - - - - - - - - - - - 1 0 0 0HBA - - - - - - - - - - - - - - - 1 1 1HBSW - - - - - - - - - - - - - 3 29 53 48 51
Total Orillia - - - - - - - - - - - - - 10 52 357 434 439
20
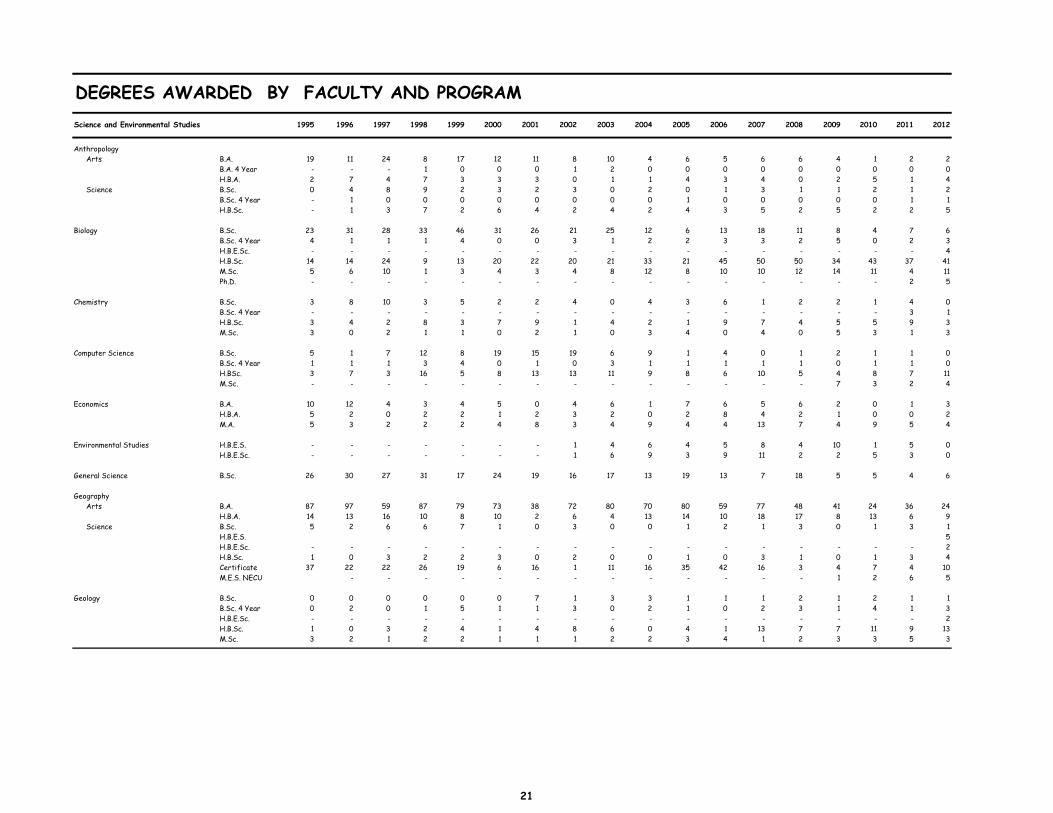
DEGREES AWARDED BY FACULTY AND PROGRAMScience and Environmental Studies 1995 1996 1997 1998 1999 2000 2001 2002 2003 2004 2005 2006 2007 2008 2009 2010 2011 2012
Anthropology Arts B.A. 19 11 24 8 17 12 11 8 10 4 6 5 6 6 4 1 2 2
B.A. 4 Year - - - 1 0 0 0 1 2 0 0 0 0 0 0 0 0 0H.B.A. 2 7 4 7 3 3 3 0 1 1 4 3 4 0 2 5 1 4
Science B.Sc. 0 4 8 9 2 3 2 3 0 2 0 1 3 1 1 2 1 2B.Sc. 4 Year - 1 0 0 0 0 0 0 0 0 1 0 0 0 0 0 1 1H.B.Sc. - 1 3 7 2 6 4 2 4 2 4 3 5 2 5 2 2 5
Biology B.Sc. 23 31 28 33 46 31 26 21 25 12 6 13 18 11 8 4 7 6B.Sc. 4 Year 4 1 1 1 4 0 0 3 1 2 2 3 3 2 5 0 2 3H.B.E.Sc. - - - - - - - - - - - - - - - - - 4H.B.Sc. 14 14 24 9 13 20 22 20 21 33 21 45 50 50 34 43 37 41M.Sc. 5 6 10 1 3 4 3 4 8 12 8 10 10 12 14 11 4 11Ph.D. - - - - - - - - - - - - - - - - 2 5
Chemistry B.Sc. 3 8 10 3 5 2 2 4 0 4 3 6 1 2 2 1 4 0B.Sc. 4 Year - - - - - - - - - - - - - - - - 3 1H.B.Sc. 3 4 2 8 3 7 9 1 4 2 1 9 7 4 5 5 9 3M.Sc. 3 0 2 1 1 0 2 1 0 3 4 0 4 0 5 3 1 3
Computer Science B.Sc. 5 1 7 12 8 19 15 19 6 9 1 4 0 1 2 1 1 0B.Sc. 4 Year 1 1 1 3 4 0 1 0 3 1 1 1 1 1 0 1 1 0H.BSc. 3 7 3 16 5 8 13 13 11 9 8 6 10 5 4 8 7 11M.Sc. - - - - - - - - - - - - - - 7 3 2 4
Economics B.A. 10 12 4 3 4 5 0 4 6 1 7 6 5 6 2 0 1 3H.B.A. 5 2 0 2 2 1 2 3 2 0 2 8 4 2 1 0 0 2M.A. 5 3 2 2 2 4 8 3 4 9 4 4 13 7 4 9 5 4
Environmental Studies H.B.E.S. - - - - - - - 1 4 6 4 5 8 4 10 1 5 0H.B.E.Sc. - - - - - - - 1 6 9 3 9 11 2 2 5 3 0
General Science B.Sc. 26 30 27 31 17 24 19 16 17 13 19 13 7 18 5 5 4 6
Geography Arts B.A. 87 97 59 87 79 73 38 72 80 70 80 59 77 48 41 24 36 24
H.B.A. 14 13 16 10 8 10 2 6 4 13 14 10 18 17 8 13 6 9 Science B.Sc. 5 2 6 6 7 1 0 3 0 0 1 2 1 3 0 1 3 1
H.B.E.S. 5H.B.E.Sc. - - - - - - - - - - - - - - - - - 2H.B.Sc. 1 0 3 2 2 3 0 2 0 0 1 0 3 1 0 1 3 4Certificate 37 22 22 26 19 6 16 1 11 16 35 42 16 3 4 7 4 10M.E.S. NECU - - - - - - - - - - - - - 1 2 6 5
Geology B.Sc. 0 0 0 0 0 0 7 1 3 3 1 1 1 2 1 2 1 1B.Sc. 4 Year 0 2 0 1 5 1 1 3 0 2 1 0 2 3 1 4 1 3H.B.E.Sc. - - - - - - - - - - - - - - - - - 2H.B.Sc. 1 0 3 2 4 1 4 8 6 0 4 1 13 7 7 11 9 13M.Sc. 3 2 1 2 2 1 1 1 2 2 3 4 1 2 3 3 5 3
21
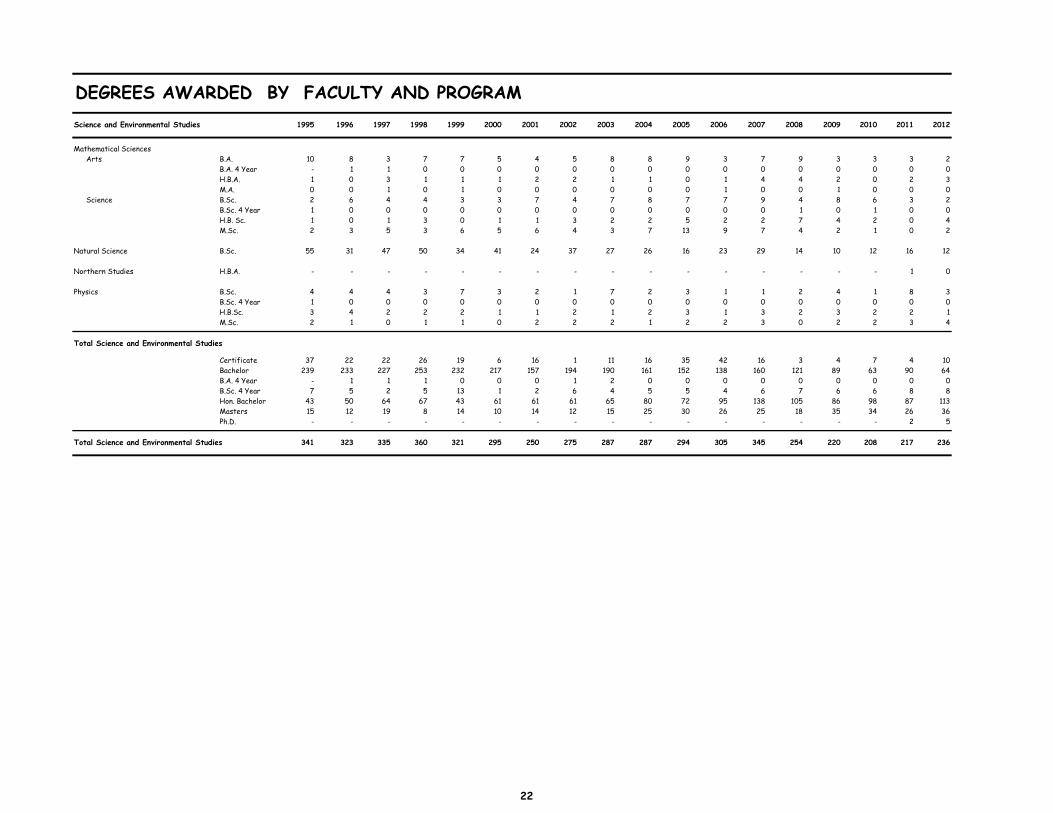
DEGREES AWARDED BY FACULTY AND PROGRAMScience and Environmental Studies 1995 1996 1997 1998 1999 2000 2001 2002 2003 2004 2005 2006 2007 2008 2009 2010 2011 2012
Mathematical Sciences Arts B.A. 10 8 3 7 7 5 4 5 8 8 9 3 7 9 3 3 3 2
B.A. 4 Year - 1 1 0 0 0 0 0 0 0 0 0 0 0 0 0 0 0H.B.A. 1 0 3 1 1 1 2 2 1 1 0 1 4 4 2 0 2 3M.A. 0 0 1 0 1 0 0 0 0 0 0 1 0 0 1 0 0 0
Science B.Sc. 2 6 4 4 3 3 7 4 7 8 7 7 9 4 8 6 3 2B.Sc. 4 Year 1 0 0 0 0 0 0 0 0 0 0 0 0 1 0 1 0 0H.B. Sc. 1 0 1 3 0 1 1 3 2 2 5 2 2 7 4 2 0 4M.Sc. 2 3 5 3 6 5 6 4 3 7 13 9 7 4 2 1 0 2
Natural Science B.Sc. 55 31 47 50 34 41 24 37 27 26 16 23 29 14 10 12 16 12
Northern Studies H.B.A. - - - - - - - - - - - - - - - - 1 0
Physics B.Sc. 4 4 4 3 7 3 2 1 7 2 3 1 1 2 4 1 8 3B.Sc. 4 Year 1 0 0 0 0 0 0 0 0 0 0 0 0 0 0 0 0 0H.B.Sc. 3 4 2 2 2 1 1 2 1 2 3 1 3 2 3 2 2 1M.Sc. 2 1 0 1 1 0 2 2 2 1 2 2 3 0 2 2 3 4
Total Science and Environmental Studies
Certificate 37 22 22 26 19 6 16 1 11 16 35 42 16 3 4 7 4 10Bachelor 239 233 227 253 232 217 157 194 190 161 152 138 160 121 89 63 90 64B.A. 4 Year - 1 1 1 0 0 0 1 2 0 0 0 0 0 0 0 0 0B.Sc. 4 Year 7 5 2 5 13 1 2 6 4 5 5 4 6 7 6 6 8 8Hon. Bachelor 43 50 64 67 43 61 61 61 65 80 72 95 138 105 86 98 87 113Masters 15 12 19 8 14 10 14 12 15 25 30 26 25 18 35 34 26 36Ph.D. - - - - - - - - - - - - - - - - 2 5
Total Science and Environmental Studies 341 323 335 360 321 295 250 275 287 287 294 305 345 254 220 208 217 236
22
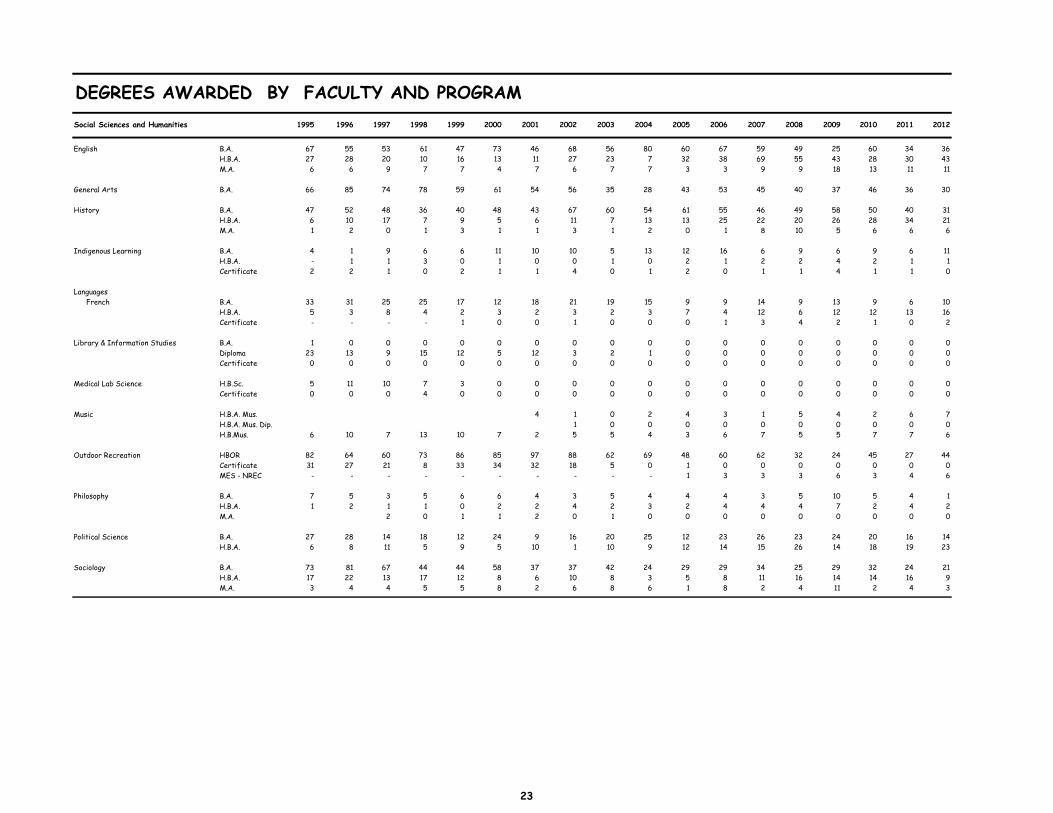
DEGREES AWARDED BY FACULTY AND PROGRAMSocial Sciences and Humanities 1995 1996 1997 1998 1999 2000 2001 2002 2003 2004 2005 2006 2007 2008 2009 2010 2011 2012
English B.A. 67 55 53 61 47 73 46 68 56 80 60 67 59 49 25 60 34 36H.B.A. 27 28 20 10 16 13 11 27 23 7 32 38 69 55 43 28 30 43M.A. 6 6 9 7 7 4 7 6 7 7 3 3 9 9 18 13 11 11
General Arts B.A. 66 85 74 78 59 61 54 56 35 28 43 53 45 40 37 46 36 30
History B.A. 47 52 48 36 40 48 43 67 60 54 61 55 46 49 58 50 40 31H.B.A. 6 10 17 7 9 5 6 11 7 13 13 25 22 20 26 28 34 21M.A. 1 2 0 1 3 1 1 3 1 2 0 1 8 10 5 6 6 6
Indigenous Learning B.A. 4 1 9 6 6 11 10 10 5 13 12 16 6 9 6 9 6 11H.B.A. - 1 1 3 0 1 0 0 1 0 2 1 2 2 4 2 1 1Certificate 2 2 1 0 2 1 1 4 0 1 2 0 1 1 4 1 1 0
Languages French B.A. 33 31 25 25 17 12 18 21 19 15 9 9 14 9 13 9 6 10
H.B.A. 5 3 8 4 2 3 2 3 2 3 7 4 12 6 12 12 13 16Certificate - - - - 1 0 0 1 0 0 0 1 3 4 2 1 0 2
Library & Information Studies B.A. 1 0 0 0 0 0 0 0 0 0 0 0 0 0 0 0 0 0Diploma 23 13 9 15 12 5 12 3 2 1 0 0 0 0 0 0 0 0Certificate 0 0 0 0 0 0 0 0 0 0 0 0 0 0 0 0 0 0
Medical Lab Science H.B.Sc. 5 11 10 7 3 0 0 0 0 0 0 0 0 0 0 0 0 0Certificate 0 0 0 4 0 0 0 0 0 0 0 0 0 0 0 0 0 0
Music H.B.A. Mus. 4 1 0 2 4 3 1 5 4 2 6 7H.B.A. Mus. Dip. 1 0 0 0 0 0 0 0 0 0 0H.B.Mus. 6 10 7 13 10 7 2 5 5 4 3 6 7 5 5 7 7 6
Outdoor Recreation HBOR 82 64 60 73 86 85 97 88 62 69 48 60 62 32 24 45 27 44Certificate 31 27 21 8 33 34 32 18 5 0 1 0 0 0 0 0 0 0MES - NREC - - - - - - - - - - 1 3 3 3 6 3 4 6
Philosophy B.A. 7 5 3 5 6 6 4 3 5 4 4 4 3 5 10 5 4 1H.B.A. 1 2 1 1 0 2 2 4 2 3 2 4 4 4 7 2 4 2M.A. 2 0 1 1 2 0 1 0 0 0 0 0 0 0 0 0
Political Science B.A. 27 28 14 18 12 24 9 16 20 25 12 23 26 23 24 20 16 14H.B.A. 6 8 11 5 9 5 10 1 10 9 12 14 15 26 14 18 19 23
Sociology B.A. 73 81 67 44 44 58 37 37 42 24 29 29 34 25 29 32 24 21H.B.A. 17 22 13 17 12 8 6 10 8 3 5 8 11 16 14 14 16 9M.A. 3 4 4 5 5 8 2 6 8 6 1 8 2 4 11 2 4 3
23
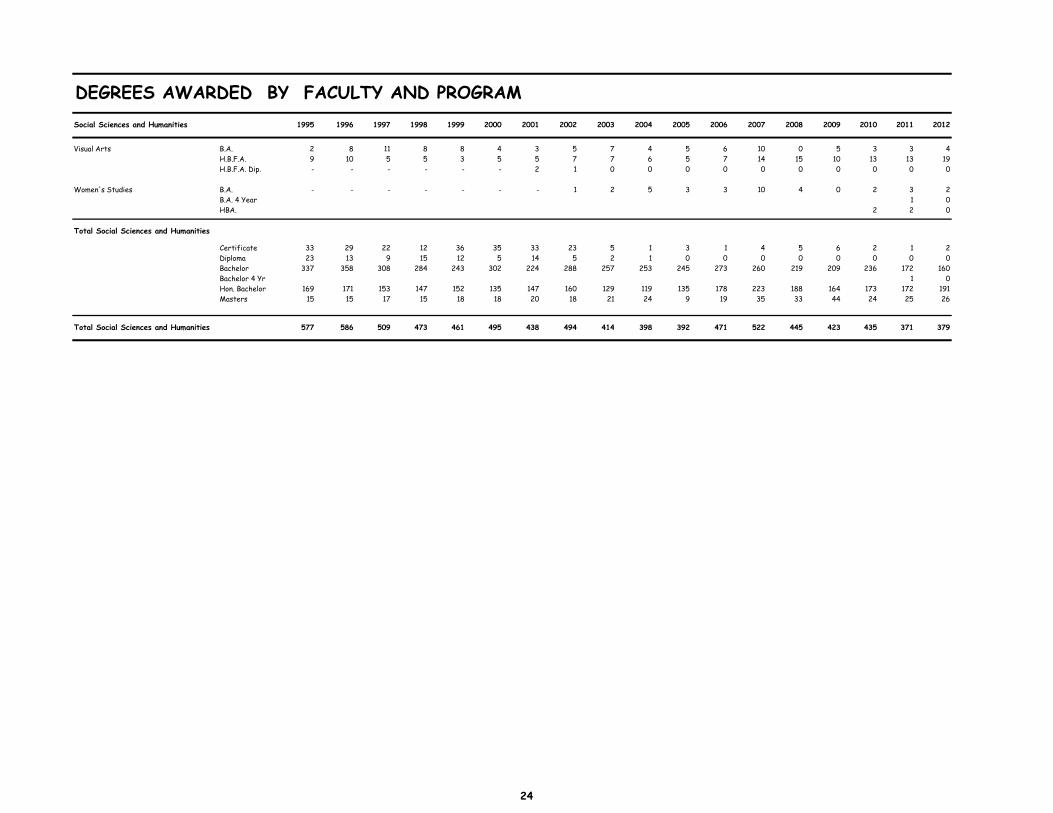
DEGREES AWARDED BY FACULTY AND PROGRAMSocial Sciences and Humanities 1995 1996 1997 1998 1999 2000 2001 2002 2003 2004 2005 2006 2007 2008 2009 2010 2011 2012
Visual Arts B.A. 2 8 11 8 8 4 3 5 7 4 5 6 10 0 5 3 3 4H.B.F.A. 9 10 5 5 3 5 5 7 7 6 5 7 14 15 10 13 13 19H.B.F.A. Dip. - - - - - - 2 1 0 0 0 0 0 0 0 0 0 0
Women's Studies B.A. - - - - - - - 1 2 5 3 3 10 4 0 2 3 2B.A. 4 Year 1 0HBA. 2 2 0
Total Social Sciences and Humanities
Certificate 33 29 22 12 36 35 33 23 5 1 3 1 4 5 6 2 1 2Diploma 23 13 9 15 12 5 14 5 2 1 0 0 0 0 0 0 0 0Bachelor 337 358 308 284 243 302 224 288 257 253 245 273 260 219 209 236 172 160Bachelor 4 Yr 1 0Hon. Bachelor 169 171 153 147 152 135 147 160 129 119 135 178 223 188 164 173 172 191Masters 15 15 17 15 18 18 20 18 21 24 9 19 35 33 44 24 25 26
Total Social Sciences and Humanities 577 586 509 473 461 495 438 494 414 398 392 471 522 445 423 435 371 379
24
DEGREES AWARDED BY FACULTY AND PROGRAM
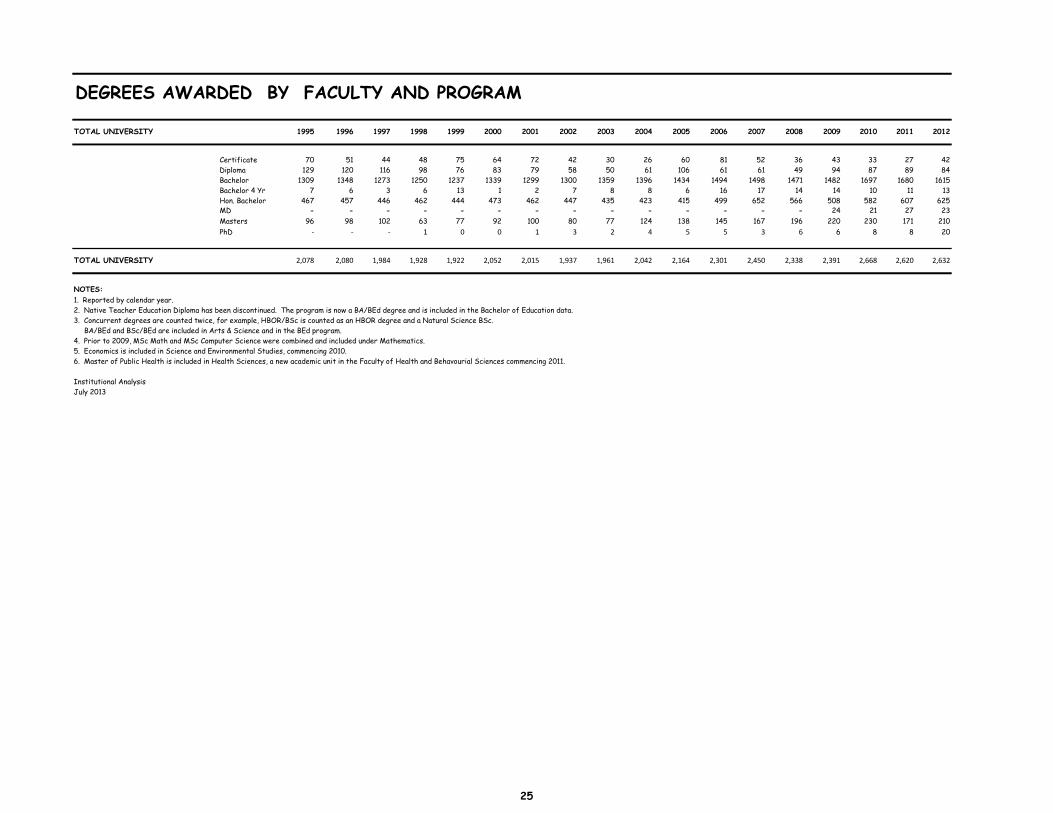
TOTAL UNIVERSITY 1995 1996 1997 1998 1999 2000 2001 2002 2003 2004 2005 2006 2007 2008 2009 2010 2011 2012
Certificate 70 51 44 48 75 64 72 42 30 26 60 81 52 36 43 33 27 42Diploma 129 120 116 98 76 83 79 58 50 61 106 61 61 49 94 87 89 84Bachelor 1309 1348 1273 1250 1237 1339 1299 1300 1359 1396 1434 1494 1498 1471 1482 1697 1680 1615Bachelor 4 Yr 7 6 3 6 13 1 2 7 8 8 6 16 17 14 14 10 11 13Hon. Bachelor 467 457 446 462 444 473 462 447 435 423 415 499 652 566 508 582 607 625MD - - - - - - - - - - - - - - 24 21 27 23Masters 96 98 102 63 77 92 100 80 77 124 138 145 167 196 220 230 171 210PhD ‐ ‐ ‐ 1 0 0 1 3 2 4 5 5 3 6 6 8 8 20
TOTAL UNIVERSITY 2,078 2,080 1,984 1,928 1,922 2,052 2,015 1,937 1,961 2,042 2,164 2,301 2,450 2,338 2,391 2,668 2,620 2,632
NOTES: 1. Reported by calendar year.2. Native Teacher Education Diploma has been discontinued. The program is now a BA/BEd degree and is included in the Bachelor of Education data.3. Concurrent degrees are counted twice, for example, HBOR/BSc is counted as an HBOR degree and a Natural Science BSc. BA/BEd and BSc/BEd are included in Arts & Science and in the BEd program. 4. Prior to 2009, MSc Math and MSc Computer Science were combined and included under Mathematics.5. Economics is included in Science and Environmental Studies, commencing 2010.6. Master of Public Health is included in Health Sciences, a new academic unit in the Faculty of Health and Behavourial Sciences commencing 2011.
Institutional AnalysisJuly 2013
25

19/09/2013
FULL-TIME ENROLMENT BY MAJORS - FALL/WINTER
DEPARTMENT 03/04 04/05 05/06 06/07 07/08 08/09 09/10 10/11 11/12 12/13 03/04 04/05 05/06 06/07 07/08 08/09 09/10 10/11 11/12 12/13 03/04 04/05 05/06 06/07 07/08 08/09 09/10 10/11 11/12 12/13
Anthropology 49 55 39 28 30 21 24 35 39 45 0 0 0 0 0 0 0 0 0 0 49 55 39 28 30 21 24 35 39 45Biology 193 158 191 217 195 212 207 212 200 212 29 32 29 29 39 37 33 40 45 46 222 190 220 246 234 249 240 252 245 258 Natural Science 27 76 45 20 12 12 11 8 7 13 0 0 0 0 0 0 0 0 0 0 27 76 45 20 12 12 11 8 7 13Business Administration 398 409 396 409 368 372 372 402 398 431 21 16 10 7 29 25 29 24 27 29 419 425 406 416 397 397 401 426 425 460Chemistry 31 25 28 31 46 40 42 40 33 33 8 8 5 4 7 8 6 7 14 20 39 33 33 35 53 48 48 47 47 53Economics 32 33 26 15 14 12 13 14 12 19 9 12 17 19 14 10 14 7 10 18 41 45 43 34 28 22 27 21 22 37Education 1,461 1,583 1,591 1,691 1,859 1,868 2,005 1,981 1,788 1,594 34 34 43 58 116 113 111 96 135 150 1,495 1,617 1,634 1,749 1,975 1,981 2,116 2,077 1,923 1,744Engineering 634 686 708 637 612 656 744 794 781 803 23 27 40 34 57 56 54 51 46 48 657 713 748 671 669 712 798 845 827 851English 146 156 153 117 95 70 67 51 50 43 20 13 16 19 27 29 27 21 20 18 166 169 169 136 122 99 94 72 70 61Environmental Studies 69 73 61 49 42 53 75 87 73 74 - 7 9 16 20 23 30 32 28 31 69 80 70 65 62 76 105 119 101 105General/Undecided/Special 324 321 283 291 269 208 198 190 179 158 1 0 0 0 0 0 1 0 0 0 325 321 283 291 269 208 199 190 179 158Geography 105 104 77 65 43 36 33 27 18 17 0 0 0 0 0 0 0 0 0 0 105 104 77 65 43 36 33 27 18 17Geology 17 19 40 44 42 58 73 86 99 102 7 9 10 9 12 12 13 17 13 17 24 28 50 53 54 70 86 103 112 119Gerontology 4 6 12 10 13 17 16 14 17 29 0 0 0 0 0 0 0 0 0 0 4 6 12 10 13 17 16 14 17 29Health Sciences (MHSc) - - - - - - - - - - - - - - - - - - - 1 - - - - - - - - - 1History 114 109 84 73 94 60 54 47 41 38 3 7 12 16 19 9 11 15 17 12 117 116 96 89 113 69 65 62 58 50Indigenous Learning 25 26 27 21 21 12 16 20 21 20 0 0 0 0 0 0 0 0 0 0 25 26 27 21 21 12 16 20 21 20Kinesiology 259 242 238 218 194 175 184 200 239 251 9 14 12 17 23 19 19 19 19 12 268 256 250 235 217 194 203 219 258 263Languages 17 14 17 14 17 13 9 7 10 7 0 0 0 0 0 0 0 0 0 0 17 14 17 14 17 13 9 7 10 7Lib & Info Studies 0 0 0 0 0 0 0 0 0 0 0 0 0 0 0 0 0 0 0 0 0 0 0 0 0 0 0 0 0 0 Library Tech 0 0 0 0 0 0 0 0 0 0 0 0 0 0 0 0 0 0 0 0 0 0 0 0 0 0 0 0 0 0Mathematics 37 27 27 24 18 20 17 15 16 14 24 29 28 19 18 14 7 2 4 8 61 56 55 43 36 34 24 17 20 22 Computer Science 54 49 45 34 38 37 40 49 54 42 0 0 0 0 0 0 2 8 15 30 54 49 45 34 38 37 42 57 69 72Medical Lab Science 0 0 0 0 0 0 0 0 0 0 0 0 0 0 0 0 0 0 0 0 0 0 0 0 0 0 0 0 0 0Medicine - - 24 48 72 97 96 103 104 109 - - 0 0 0 0 0 0 0 0 - - 24 48 72 97 96 103 104 109Music 34 40 37 33 27 32 42 40 30 39 0 0 0 0 0 0 0 0 0 0 34 40 37 33 27 32 42 40 30 39Natural Resources Management 114 118 116 107 112 111 100 90 103 117 26 26 27 43 57 48 53 52 54 39 140 144 143 150 169 159 153 142 157 156Northern Studies - - - 1 0 1 4 5 3 4 - - - - - - - - - - - - - 1 0 1 4 5 3 4Nursing 381 472 504 511 529 542 557 631 622 631 1 1 1 18 35 24 33 39 53 72 382 473 505 529 564 566 590 670 675 703Orillia - - - 103 230 349 452 550 591 657 - - - 0 0 0 0 0 0 0 - - - 103 230 349 452 550 591 657Outdoor Recreation 306 243 189 139 122 100 102 96 105 103 0 0 0 0 0 0 0 0 0 0 306 243 189 139 122 100 102 96 105 103Philosophy 22 29 27 25 25 36 26 21 23 23 0 0 0 0 0 0 0 0 0 0 22 29 27 25 25 36 26 21 23 23Physics 28 27 21 17 27 25 23 26 21 16 2 4 6 5 5 6 5 7 7 7 30 31 27 22 32 31 28 33 28 23Political Science 102 111 134 121 93 127 107 105 102 108 0 0 0 0 0 0 0 0 0 0 102 111 134 121 93 127 107 105 102 108Psychology 287 300 288 255 226 176 203 236 251 257 39 45 48 47 48 46 42 39 43 48 326 345 336 302 274 222 245 275 294 305Public Health (MPH) excl. Nursing - - - - - - - - - - 11 26 38 55 103 81 78 66 82 90 11 26 38 55 103 81 78 66 82 90Social Work 175 170 152 158 198 202 218 261 345 369 18 23 22 27 41 34 22 27 35 42 193 193 174 185 239 236 240 288 380 411Sociology 59 52 69 65 46 47 39 44 50 46 13 9 12 11 18 16 8 9 11 14 72 61 81 76 64 63 47 53 61 60Visual Arts 44 43 45 46 38 39 41 33 40 27 0 0 0 0 0 0 0 0 0 0 44 43 45 46 38 39 41 33 40 27Women's Studies 4 5 8 3 5 7 5 9 3 6 0 0 0 0 0 0 0 0 0 0 4 5 8 3 5 7 5 9 3 6
TOTAL UNIVERSITY 5,552 5,781 5,702 5,640 5,772 5,843 6,215 6,529 6,468 6,457 298 342 385 453 688 610 598 578 678 752 5,850 6,123 6,087 6,093 6,460 6,453 6,813 7,107 7,146 7,209
NOTES : 1. Enrolment counts are based on November headcounts. 2. Students pursuing more than one degree are counted only once 3. All dual degree students in HBOR and Education are counted in the Professional program 4. Nursing Transition students are enrolled as Special Students in General/Undecided/Special 5. Orillia includes BASc, BAScBEd, HBASc, HBAScBEd, HBASBEd
UNDERGRADUATE GRADUATE TOTAL
ENROLMENT_1213
26
05/09/2013
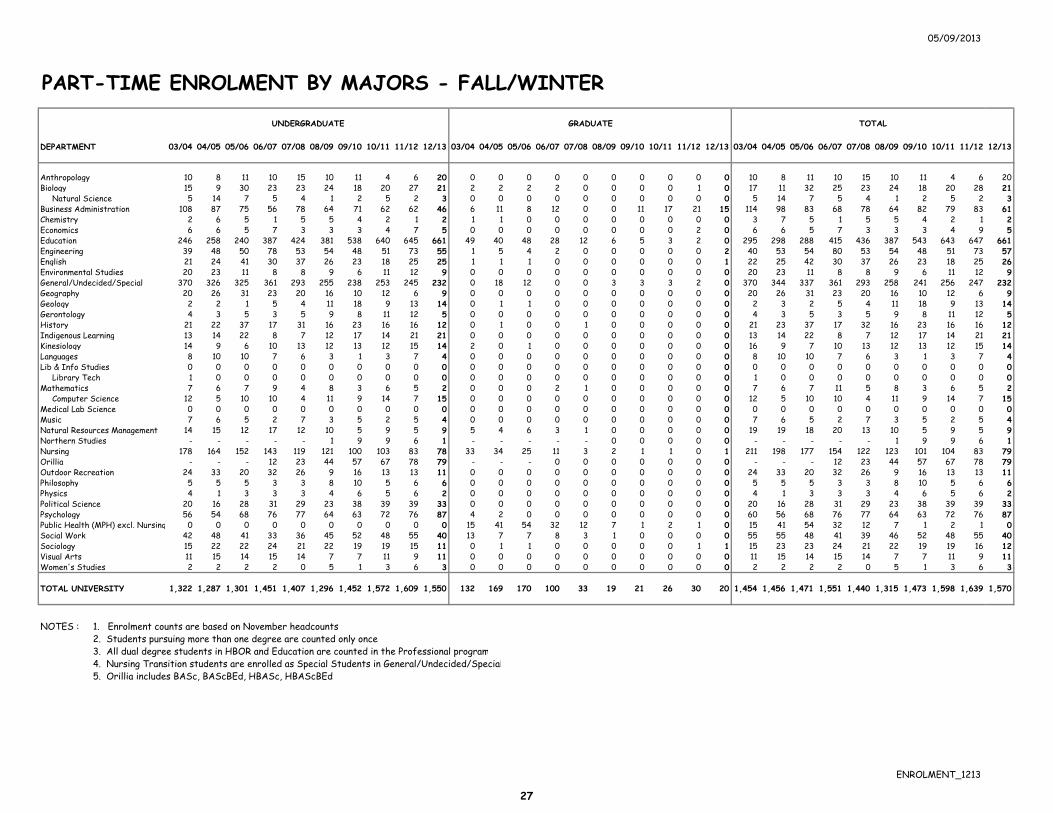
PART-TIME ENROLMENT BY MAJORS - FALL/WINTER
DEPARTMENT 03/04 04/05 05/06 06/07 07/08 08/09 09/10 10/11 11/12 12/13 03/04 04/05 05/06 06/07 07/08 08/09 09/10 10/11 11/12 12/13 03/04 04/05 05/06 06/07 07/08 08/09 09/10 10/11 11/12 12/13
Anthropology 10 8 11 10 15 10 11 4 6 20 0 0 0 0 0 0 0 0 0 0 10 8 11 10 15 10 11 4 6 20Biology 15 9 30 23 23 24 18 20 27 21 2 2 2 2 0 0 0 0 1 0 17 11 32 25 23 24 18 20 28 21 Natural Science 5 14 7 5 4 1 2 5 2 3 0 0 0 0 0 0 0 0 0 0 5 14 7 5 4 1 2 5 2 3Business Administration 108 87 75 56 78 64 71 62 62 46 6 11 8 12 0 0 11 17 21 15 114 98 83 68 78 64 82 79 83 61Chemistry 2 6 5 1 5 5 4 2 1 2 1 1 0 0 0 0 0 0 0 0 3 7 5 1 5 5 4 2 1 2Economics 6 6 5 7 3 3 3 4 7 5 0 0 0 0 0 0 0 0 2 0 6 6 5 7 3 3 3 4 9 5Education 246 258 240 387 424 381 538 640 645 661 49 40 48 28 12 6 5 3 2 0 295 298 288 415 436 387 543 643 647 661Engineering 39 48 50 78 53 54 48 51 73 55 1 5 4 2 0 0 0 0 0 2 40 53 54 80 53 54 48 51 73 57English 21 24 41 30 37 26 23 18 25 25 1 1 1 0 0 0 0 0 0 1 22 25 42 30 37 26 23 18 25 26Environmental Studies 20 23 11 8 8 9 6 11 12 9 0 0 0 0 0 0 0 0 0 0 20 23 11 8 8 9 6 11 12 9General/Undecided/Special 370 326 325 361 293 255 238 253 245 232 0 18 12 0 0 3 3 3 2 0 370 344 337 361 293 258 241 256 247 232Geography 20 26 31 23 20 16 10 12 6 9 0 0 0 0 0 0 0 0 0 0 20 26 31 23 20 16 10 12 6 9Geology 2 2 1 5 4 11 18 9 13 14 0 1 1 0 0 0 0 0 0 0 2 3 2 5 4 11 18 9 13 14Gerontology 4 3 5 3 5 9 8 11 12 5 0 0 0 0 0 0 0 0 0 0 4 3 5 3 5 9 8 11 12 5History 21 22 37 17 31 16 23 16 16 12 0 1 0 0 1 0 0 0 0 0 21 23 37 17 32 16 23 16 16 12Indigenous Learning 13 14 22 8 7 12 17 14 21 21 0 0 0 0 0 0 0 0 0 0 13 14 22 8 7 12 17 14 21 21Kinesiology 14 9 6 10 13 12 13 12 15 14 2 0 1 0 0 0 0 0 0 0 16 9 7 10 13 12 13 12 15 14Languages 8 10 10 7 6 3 1 3 7 4 0 0 0 0 0 0 0 0 0 0 8 10 10 7 6 3 1 3 7 4Lib & Info Studies 0 0 0 0 0 0 0 0 0 0 0 0 0 0 0 0 0 0 0 0 0 0 0 0 0 0 0 0 0 0 Library Tech 1 0 0 0 0 0 0 0 0 0 0 0 0 0 0 0 0 0 0 0 1 0 0 0 0 0 0 0 0 0Mathematics 7 6 7 9 4 8 3 6 5 2 0 0 0 2 1 0 0 0 0 0 7 6 7 11 5 8 3 6 5 2 Computer Science 12 5 10 10 4 11 9 14 7 15 0 0 0 0 0 0 0 0 0 0 12 5 10 10 4 11 9 14 7 15Medical Lab Science 0 0 0 0 0 0 0 0 0 0 0 0 0 0 0 0 0 0 0 0 0 0 0 0 0 0 0 0 0 0Music 7 6 5 2 7 3 5 2 5 4 0 0 0 0 0 0 0 0 0 0 7 6 5 2 7 3 5 2 5 4Natural Resources Management 14 15 12 17 12 10 5 9 5 9 5 4 6 3 1 0 0 0 0 0 19 19 18 20 13 10 5 9 5 9Northern Studies - - - - - 1 9 9 6 1 - - - - - 0 0 0 0 0 - - - - - 1 9 9 6 1Nursing 178 164 152 143 119 121 100 103 83 78 33 34 25 11 3 2 1 1 0 1 211 198 177 154 122 123 101 104 83 79Orillia - - - 12 23 44 57 67 78 79 - - - 0 0 0 0 0 0 0 - - - 12 23 44 57 67 78 79Outdoor Recreation 24 33 20 32 26 9 16 13 13 11 0 0 0 0 0 0 0 0 0 0 24 33 20 32 26 9 16 13 13 11Philosophy 5 5 5 3 3 8 10 5 6 6 0 0 0 0 0 0 0 0 0 0 5 5 5 3 3 8 10 5 6 6Physics 4 1 3 3 3 4 6 5 6 2 0 0 0 0 0 0 0 0 0 0 4 1 3 3 3 4 6 5 6 2Political Science 20 16 28 31 29 23 38 39 39 33 0 0 0 0 0 0 0 0 0 0 20 16 28 31 29 23 38 39 39 33Psychology 56 54 68 76 77 64 63 72 76 87 4 2 0 0 0 0 0 0 0 0 60 56 68 76 77 64 63 72 76 87Public Health (MPH) excl. Nursing 0 0 0 0 0 0 0 0 0 0 15 41 54 32 12 7 1 2 1 0 15 41 54 32 12 7 1 2 1 0Social Work 42 48 41 33 36 45 52 48 55 40 13 7 7 8 3 1 0 0 0 0 55 55 48 41 39 46 52 48 55 40Sociology 15 22 22 24 21 22 19 19 15 11 0 1 1 0 0 0 0 0 1 1 15 23 23 24 21 22 19 19 16 12Visual Arts 11 15 14 15 14 7 7 11 9 11 0 0 0 0 0 0 0 0 0 0 11 15 14 15 14 7 7 11 9 11Women's Studies 2 2 2 2 0 5 1 3 6 3 0 0 0 0 0 0 0 0 0 0 2 2 2 2 0 5 1 3 6 3
TOTAL UNIVERSITY 1,322 1,287 1,301 1,451 1,407 1,296 1,452 1,572 1,609 1,550 132 169 170 100 33 19 21 26 30 20 1,454 1,456 1,471 1,551 1,440 1,315 1,473 1,598 1,639 1,570
NOTES : 1. Enrolment counts are based on November headcounts. 2. Students pursuing more than one degree are counted only once 3. All dual degree students in HBOR and Education are counted in the Professional program 4. Nursing Transition students are enrolled as Special Students in General/Undecided/Special 5. Orillia includes BASc, BAScBEd, HBASc, HBAScBEd
GRADUATEUNDERGRADUATE TOTAL
ENROLMENT_1213
27

30/01/2013
ENROLMENT BY GENDER, REGISTRATION STATUS AND LEVELFALL 2012
TOTALMALE % OF TOTAL FEMALE % OF TOTAL ENROLMENT
FULL-TIME
Undergraduate 2638 41.6% 3706 58.4% 6344
Master's 255 39.2% 396 60.8% 651
Doctoral 49 46.7% 56 53.3% 105
PART-TIME
Undergraduate 541 34.9% 1008 65.1% 1549
Master's 12 57.1% 9 42.9% 21
Doctoral 0 0.0% 0 0.0% 0
TOTAL 3495 5175 8670
Excludes Faculty of Medicine.
Institutional Analysis Gender12
28

12/09/2013
ENROLMENT BY GENDER - 2002 to 2012
2002/03 2003/04 2004/05 2005/06 2006/07 2007/08 2008/09 2009/10 2010/11 2011/12 2012/13
MALE
F/T Undergraduate 2,155 2,440 2,568 2,530 2,457 2,463 2,491 2,638 2,739 2,687 2,641F/T Graduate 105 141 166 182 198 295 270 263 250 287 301Total F/T 2,260 2,581 2,734 2,712 2,655 2,758 2,761 2,901 2,989 2,974 2,942
P/T Undergraduate 446 460 495 489 539 544 479 524 551 582 543P/T Graduate 32 37 54 54 33 12 4 12 16 14 10Total P/T 478 497 549 543 572 556 483 536 567 596 553
TOTAL MALE 2,738 3,078 3,283 3,255 3,227 3,314 3,244 3,437 3,556 3,570 3,495
FEMALE
F/T Undergraduate 2,764 3,112 3,213 3,173 3,183 3,239 3,255 3,481 3,687 3,677 3,707F/T Graduate 133 157 176 202 255 393 340 335 328 391 451Total F/T 2,897 3,269 3,389 3,375 3,438 3,632 3,595 3,816 4,015 4,068 4,158
P/T Undergraduate 815 862 792 823 912 870 817 929 1021 1029 1007P/T Graduate 75 95 115 105 67 21 15 8 10 14 10Total P/T 890 957 907 928 979 891 832 937 1031 1043 1017
TOTAL FEMALE 3,787 4,226 4,296 4,303 4,417 4,523 4,427 4,753 5,046 5,111 5,175
TOTAL ENROLMENT 6,525 7,304 7,579 7,558 7,644 7,837 7,671 8,190 8,602 8,681 8,670
Excludes Faculty of Medicine.
Institutional Analysis ENR by Gender
29

12/09/2013
ENROLMENT BY LEVEL AND REGISTRATION STATUS - 1992 to 2012
TOTALTOTAL
YEAR Full-time Part-time Full-time Part-time Full-time Part-time ENROLMENT
1992 5,119 2,051 182 149 5,301 2,200 7,501
1993 5,602 1,741 219 139 5,821 1,880 7,701
1994 5,849 1,648 196 158 6,045 1,806 7,851
1995 5,497 1,587 230 144 5,727 1,731 7,458
1996 5,375 1,137 197 118 5,572 1,255 6,827
1997 5,268 1,195 219 105 5,487 1,300 6,787
1998 5,083 1,184 225 93 5,308 1,277 6,585
1999 4,847 1,185 205 99 5,052 1,284 6,336
2000 4,770 1,146 182 97 4,952 1,243 6,195
2001 4,662 1,192 200 86 4,862 1,278 6,140
2002 4,919 1,261 238 107 5,157 1,368 6,525
2003 5,552 1,322 298 132 5,850 1,454 7,304
2004 5,781 1,305 342 151 6,123 1,456 7,579
2005 5,702 1,301 385 170 6,087 1,471 7,558
2006 5,640 1,451 453 100 6,093 1,551 7,644
2007 5,774 1,414 688 33 6,462 1,447 7,909
2008 5,843 1,296 610 19 6,453 1,315 7,768
2009 6,216 1,453 598 20 6,814 1,473 8,287
2010 6,529 1,572 578 26 7,107 1,598 8,705
2011 6,468 1,611 678 28 7,146 1,639 8,785
2012 6,457 1,550 752 20 7,209 1,570 8,779
Note: Includes Faculty of Medicine students (except Medical Residents), commencing 2005.
UNDERGRADUATE GRADUATE
Institutional Analysis ENROL
30

AGE DISTRIBUTION OF REGISTERED STUDENTSas at November 1, 2012
Age 2000/01 2001/02 2002/03 2003/04 2004/05 2005/06 2006/07 2007/08 2008/09 2009/10 2010/11 2011/12 2012/13
19 & underF/T Undergrad 731 626 842 1342 1330 1270 1295 1483 1510 1540 1653 1646 1704F/T Grad 0 0 0 0 0 0 0 0 0 0 0 0 0P/T Undergrad 5 14 16 25 21 30 40 61 41 45 41 52 51P/T Grad 0 0 0 0 0 0 0 0 0 0 0 0 0
20 to 24F/T Undergrad 3032 3003 3019 3058 3230 3323 3300 3175 3142 3255 3383 3410 3420F/T Grad 48 55 77 94 98 101 104 158 161 135 140 166 153P/T Undergrad 293 299 306 362 351 410 480 492 416 467 491 521 528P/T Grad 2 1 0 3 9 2 1 0 0 0 0 2 3
25 to 29F/T Undergrad 581 580 601 662 700 655 587 638 681 792 820 790 740F/T Grad 75 93 104 120 147 158 177 237 222 220 202 217 297P/T Undergrad 211 235 238 274 284 273 342 285 269 333 371 403 393P/T Grad 20 20 28 31 33 36 22 7 0 3 5 6 5
30 - 39F/T Undergrad 293 315 316 344 372 299 284 293 297 354 394 375 341F/T Grad 36 36 43 60 70 87 97 166 130 149 151 176 186P/T Undergrad 327 281 321 335 319 311 310 298 272 301 348 338 313P/T Grad 40 33 36 48 61 67 51 13 10 9 12 11 6
40 & overF/T Undergrad 117 125 132 141 147 152 126 113 116 178 176 142 137F/T Grad 24 16 13 23 27 39 75 126 96 94 85 119 120P/T Undergrad 288 310 311 311 309 276 277 278 293 307 320 292 262P/T Grad 34 31 42 49 66 65 26 13 9 8 9 10 9
TotalF/T Undergrad 4754 4649 4910 5547 5779 5699 5592 5702 5746 6119 6426 6363 6342F/T Grad 183 200 237 297 342 385 453 687 609 598 578 678 756P/T Undergrad 1124 1139 1192 1307 1284 1300 1449 1414 1291 1453 1571 1606 1547P/T Grad 96 85 106 131 169 170 100 33 19 20 26 29 23
Not Recorded 38 67 80 22 5 4 2 1 6 0 1 4 2
Total 6195 6140 6525 7304 7579 7558 7596 7837 7671 8190 8602 8680 8670
Note: Excludes Faculty of Medicine
Institutional Analysis AGE_1213
31
31
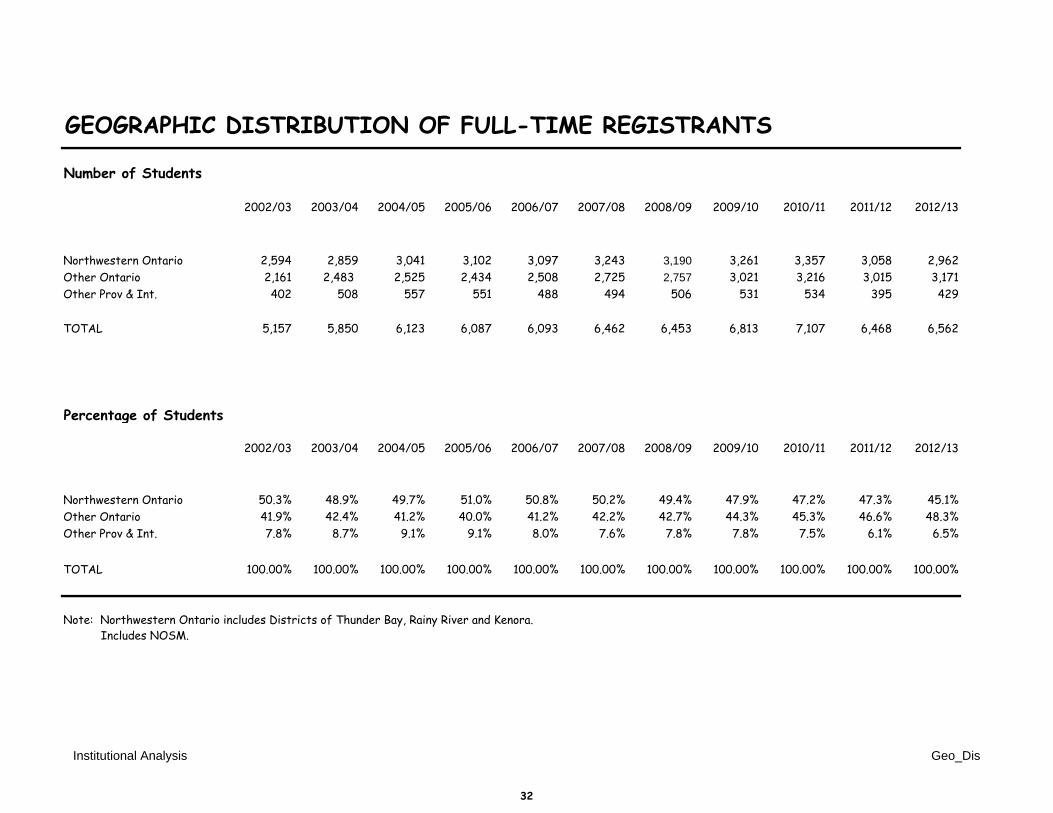
GEOGRAPHIC DISTRIBUTION OF FULL-TIME REGISTRANTS
Number of Students
2002/03 2003/04 2004/05 2005/06 2006/07 2007/08 2008/09 2009/10 2010/11 2011/12 2012/13
Northwestern Ontario 2,594 2,859 3,041 3,102 3,097 3,243 3,190 3,261 3,357 3,058 2,962Other Ontario 2,161 2,483 2,525 2,434 2,508 2,725 2,757 3,021 3,216 3,015 3,171Other Prov & Int. 402 508 557 551 488 494 506 531 534 395 429
TOTAL 5,157 5,850 6,123 6,087 6,093 6,462 6,453 6,813 7,107 6,468 6,562
Percentage of Students
2002/03 2003/04 2004/05 2005/06 2006/07 2007/08 2008/09 2009/10 2010/11 2011/12 2012/13
Northwestern Ontario 50.3% 48.9% 49.7% 51.0% 50.8% 50.2% 49.4% 47.9% 47.2% 47.3% 45.1%Other Ontario 41.9% 42.4% 41.2% 40.0% 41.2% 42.2% 42.7% 44.3% 45.3% 46.6% 48.3%Other Prov & Int. 7.8% 8.7% 9.1% 9.1% 8.0% 7.6% 7.8% 7.8% 7.5% 6.1% 6.5%
TOTAL 100.00% 100.00% 100.00% 100.00% 100.00% 100.00% 100.00% 100.00% 100.00% 100.00% 100.00%
Note: Northwestern Ontario includes Districts of Thunder Bay, Rainy River and Kenora. Includes NOSM.
Institutional Analysis Geo_Dis
32
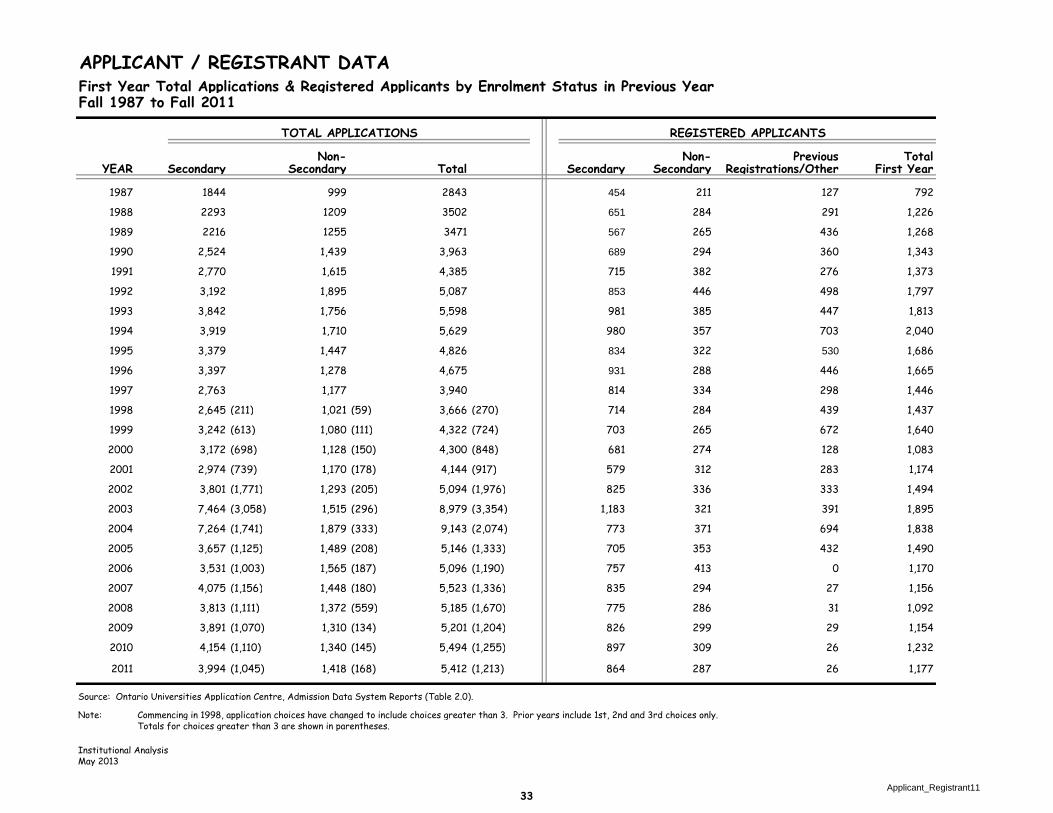
APPLICANT / REGISTRANT DATAFirst Year Total Applications & Registered Applicants by Enrolment Status in Previous YearFall 1987 to Fall 2011
TOTAL APPLICATIONS REGISTERED APPLICANTS
Non- Non- Previous TotalYEAR Secondary Secondary Total Secondary Secondary Registrations/Other First Year
1987 1844 999 2843 454 211 127 792
1988 2293 1209 3502 651 284 291 1,226
1989 2216 1255 3471 567 265 436 1,268
1990 2,524 1,439 3,963 689 294 360 1,343
1991 2,770 1,615 4,385 715 382 276 1,373
1992 3,192 1,895 5,087 853 446 498 1,797
1993 3,842 1,756 5,598 981 385 447 1,813
1994 3,919 1,710 5,629 980 357 703 2,040
1995 3,379 1,447 4,826 834 322 530 1,686
1996 3,397 1,278 4,675 931 288 446 1,665
1997 2,763 1,177 3,940 814 334 298 1,446
1998 2,645 (211) 1,021 (59) 3,666 (270) 714 284 439 1,437
1999 3,242 (613) 1,080 (111) 4,322 (724) 703 265 672 1,640
2000 3,172 (698) 1,128 (150) 4,300 (848) 681 274 128 1,083
2001 2,974 (739) 1,170 (178) 4,144 (917) 579 312 283 1,174
2002 3,801 (1,771) 1,293 (205) 5,094 (1,976) 825 336 333 1,494
2003 7,464 (3,058) 1,515 (296) 8,979 (3,354) 1,183 321 391 1,895
2004 7,264 (1,741) 1,879 (333) 9,143 (2,074) 773 371 694 1,838
2005 3,657 (1,125) 1,489 (208) 5,146 (1,333) 705 353 432 1,490
2006 3,531 (1,003) 1,565 (187) 5,096 (1,190) 757 413 0 1,170
2007 4,075 (1,156) 1,448 (180) 5,523 (1,336) 835 294 27 1,156
2008 3,813 (1,111) 1,372 (559) 5,185 (1,670) 775 286 31 1,092
2009 3,891 (1,070) 1,310 (134) 5,201 (1,204) 826 299 29 1,154
2010 4,154 (1,110) 1,340 (145) 5,494 (1,255) 897 309 26 1,232
2011 3,994 (1,045) 1,418 (168) 5,412 (1,213) 864 287 26 1,177
Source: Ontario Universities Application Centre, Admission Data System Reports (Table 2.0).
Note: Commencing in 1998, application choices have changed to include choices greater than 3. Prior years include 1st, 2nd and 3rd choices only.Totals for choices greater than 3 are shown in parentheses.
Institutional AnalysisMay 2013
Applicant_Registrant1133
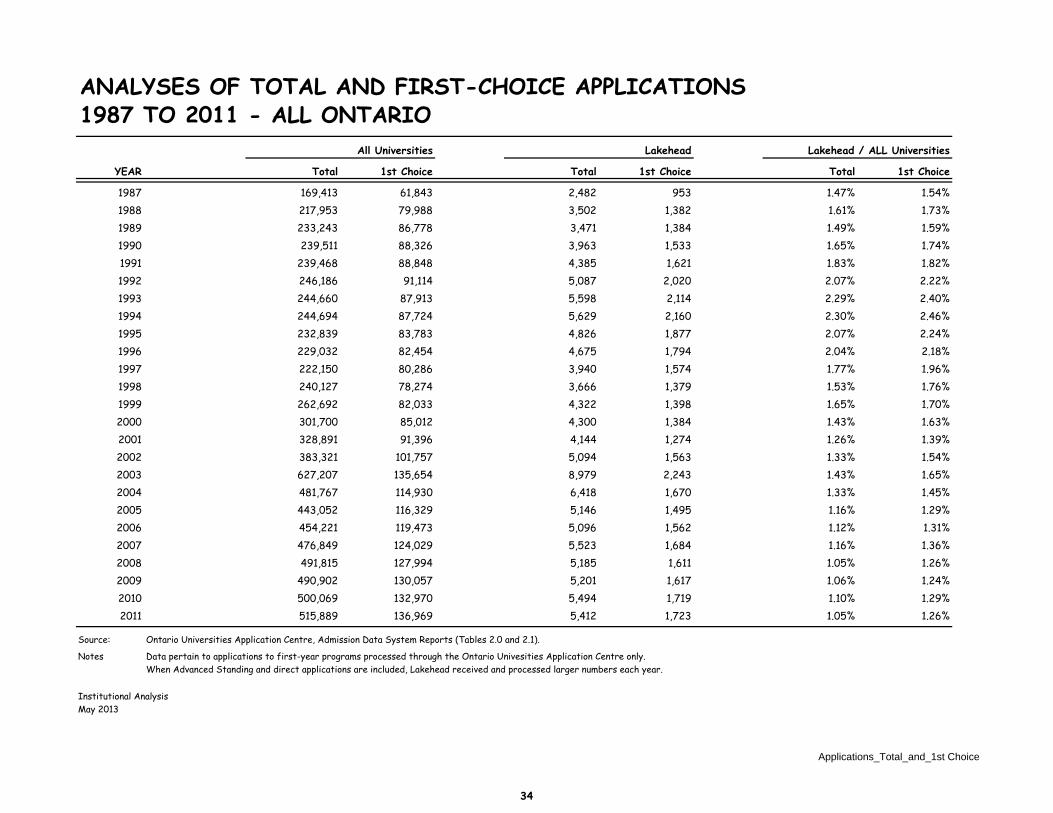
ANALYSES OF TOTAL AND FIRST-CHOICE APPLICATIONS1987 TO 2011 - ALL ONTARIO
YEAR Total 1st Choice Total 1st Choice Total 1st Choice
1987 169,413 61,843 2,482 953 1.47% 1.54%1988 217,953 79,988 3,502 1,382 1.61% 1.73%1989 233,243 86,778 3,471 1,384 1.49% 1.59%1990 239,511 88,326 3,963 1,533 1.65% 1.74%1991 239,468 88,848 4,385 1,621 1.83% 1.82%1992 246,186 91,114 5,087 2,020 2.07% 2.22%1993 244,660 87,913 5,598 2,114 2.29% 2.40%1994 244,694 87,724 5,629 2,160 2.30% 2.46%1995 232,839 83,783 4,826 1,877 2.07% 2.24%1996 229,032 82,454 4,675 1,794 2.04% 2.18%1997 222,150 80,286 3,940 1,574 1.77% 1.96%1998 240,127 78,274 3,666 1,379 1.53% 1.76%1999 262,692 82,033 4,322 1,398 1.65% 1.70%2000 301,700 85,012 4,300 1,384 1.43% 1.63%2001 328,891 91,396 4,144 1,274 1.26% 1.39%2002 383,321 101,757 5,094 1,563 1.33% 1.54%2003 627,207 135,654 8,979 2,243 1.43% 1.65%2004 481,767 114,930 6,418 1,670 1.33% 1.45%2005 443,052 116,329 5,146 1,495 1.16% 1.29%2006 454,221 119,473 5,096 1,562 1.12% 1.31%2007 476,849 124,029 5,523 1,684 1.16% 1.36%2008 491,815 127,994 5,185 1,611 1.05% 1.26%2009 490,902 130,057 5,201 1,617 1.06% 1.24%2010 500,069 132,970 5,494 1,719 1.10% 1.29%2011 515,889 136,969 5,412 1,723 1.05% 1.26%
Source: Ontario Universities Application Centre, Admission Data System Reports (Tables 2.0 and 2.1).
Notes Data pertain to applications to first-year programs processed through the Ontario Univesities Application Centre only.When Advanced Standing and direct applications are included, Lakehead received and processed larger numbers each year.
Institutional AnalysisMay 2013
All Universities Lakehead Lakehead / ALL Universities
Applications_Total_and_1st Choice
34

ANALYSES OF TOTAL AND FIRST-CHOICE REGISTRATIONS1987 TO 2011 - ALL ONTARIO
YEAR Total 1st Choice Total 1st Choice Total 1st Choice
1987 38,663 24,888 627 442 1.6% 1.8%1988 50,771 28,466 1,226 626 2.4% 2.2%1989 54,594 30,169 1,268 592 2.3% 2.0%1990 56,072 30,530 1,343 665 2.4% 2.2%1991 57,427 30,987 1,373 739 2.4% 2.4%1992 57,785 27,979 1,797 875 3.1% 3.1%1993 55,879 27,058 1,366 924 2.4% 3.4%1994 58,312 27,123 2,040 901 3.5% 3.3%1995 55,159 28,528 1,686 804 3.1% 2.8%1996 54,934 28,492 1,665 824 3.0% 2.9%1997 54,617 28,796 1,446 791 2.6% 2.7%1998 54,292 29,444 1,437 714 2.6% 2.4%1999 59,547 28,495 1,640 665 2.8% 2.3%2000 56,191 28,242 1,083 629 1.9% 2.2%2001 62,947 29,755 1,174 655 1.9% 2.2%2002 70,028 32,389 1,494 732 2.1% 2.3%2003 88,989 40,224 1,895 883 2.1% 2.2%2004 77,535 38,704 1,838 745 2.4% 1.9%2005 78,316 42,239 1,490 736 1.9% 1.7%2006 72,882 42,560 1,170 876 1.6% 2.1%2007 79,583 43,994 1,156 815 1.5% 1.9%2008 78,092 45,501 1,092 815 1.4% 1.8%2009 80,638 47,241 1,154 763 1.4% 1.6%2010 81,505 45,595 1,232 902 1.5% 2.0%2011 82,894 35,498 1,177 475 1.4% 1.3%
Source: Ontario Universities Application Centre, Admission Data System Reports (Tables 2.0 and 2.1).
Notes Data pertain to applications to first-year programs processed through the Ontario Univesities Application Centre only.When Advanced Standing and direct applications are included, Lakehead received and processed larger numbers each year.
Institutional AnalysisAugust 2013
All Universities Lakehead Lakehead / ALL Universities
Registrations_Total_and_1st Choice
35

ANALYSES OF TOTAL AND FIRST-CHOICE APPLICATIONSFOR STUDENTS FROM NWO ATTENDING ONTARIO UNIVERSITIES1987 TO 2011
YEAR Total 1st Choice Total 1st Choice Total 1st Choice
1987 2,895 1,174 968 556 33.4% 47.4%1988 3,413 1,397 1,239 700 36.3% 50.1%1989 3,289 1,341 1,178 683 35.8% 50.9%1990 3,305 1,338 1,359 762 41.1% 57.0%1991 3,013 1,251 1,260 723 41.8% 57.8%1992 3,329 1,374 1,509 845 45.3% 61.5%1993 3,412 1,374 1,618 894 47.4% 65.1%1994 3,560 1,414 1,615 829 45.4% 58.6%1995 3,206 1,253 1,403 709 43.8% 56.6%1996 3,184 1,226 1,441 724 45.3% 59.1%1997 3,031 1,211 1,286 673 42.4% 55.6%1998 3,065 1,166 1,244 649 40.6% 55.7%1999 3,415 1,183 1,293 610 37.9% 51.6%2000 3,408 1,158 1,313 628 38.5% 54.2%2001 3,466 1,146 1,378 602 39.8% 52.5%2002 3,850 1,294 1,647 753 42.8% 58.2%2003 5,747 1,795 2,571 1,105 44.7% 61.6%2004 3,991 1,372 2,095 915 52.5% 66.7%2005 3,747 1,358 1,884 852 50.3% 62.7%2006 3,815 1,337 1,979 851 51.9% 63.6%2007 4,178 1,450 2,145 922 51.3% 63.6%2008 3,656 1,295 1,886 854 51.6% 65.9%2009 3,650 1,289 1,855 842 50.8% 65.3%2010 3,637 1,303 1,998 877 54.9% 67.3%2011 3,598 1,236 1,863 782 51.8% 63.3%
Source: Ontario Universities Application Centre, Admission Data System Reports (Tables 5.0, 5.1, 5.2 and 5.3).
Notes Data prior to 1976 do not include numbers for Lakehead University's diploma programs.Data pertain to applications to first-year programs processed through the Ontario Universities Application Centre only.When Advanced Standing and direct applications are included, Lakehead received and processed larger numbers each year.
Institutional AnalysisMay 2013
All Universities Lakehead Lakehead / ALL Universities
Applications_NWO_Total_and_1st Choice
36

ANALYSES OF TOTAL AND FIRST-CHOICE REGISTRATIONSFOR STUDENTS FROM NWO ATTENDING ONTARIO UNIVERSITIES1987 TO 2011
YEAR Total 1st Choice Total 1st Choice Total 1st Choice
1987 664 481 405 320 61.0% 66.5%1988 800 603 517 408 64.6% 67.7%1989 742 563 471 384 63.5% 68.2%1990 753 583 529 429 70.3% 73.6%1991 717 557 494 415 68.9% 74.5%1992 816 637 596 499 73.0% 78.3%1993 823 656 625 539 75.9% 82.2%1994 816 606 577 469 70.7% 77.4%1995 725 540 483 400 66.6% 74.1%1996 721 550 509 427 70.6% 77.6%1997 735 542 501 413 68.2% 76.2%1998 739 550 484 408 65.5% 74.2%1999 813 550 479 363 58.9% 66.0%2000 783 531 497 372 63.5% 70.1%2001 736 549 439 384 59.6% 69.9%2002 897 662 608 451 67.8% 68.1%2003 1,123 772 784 576 69.8% 74.6%2004 881 623 648 487 73.6% 78.2%2005 893 665 625 496 70.0% 74.6%2006 875 724 643 546 73.5% 75.4%2007 910 698 654 536 71.9% 76.8%2008 817 661 584 508 71.5% 76.9%2009 853 638 619 473 72.6% 74.1%2010 840 689 615 543 73.2% 78.8%2011 788 608 550 463 69.8% 76.2%
Source: Ontario Universities Application Centre, Admission Data System Reports (Tables 6.0, 6.1, 6.2 and 6.3).
Notes Data pertain to applications to first-year programs processed through the Ontario Universities Application Centre only.When Advanced Standing and direct applications are included, Lakehead received and processed larger numbers each year.
Institutional AnalysisAugust 2013
All Universities Lakehead Lakehead/ALL Universities
Registrations_NWO_Total_and_1st Choice
37
SECTION 3 – FACULTY DATA
Full-time Faculty Appointments by Department
Full-time Faculty Appointments - Distribution by Rank
Full-time Faculty Appointments - Distribution by Type of Appointment
Full-time Faculty Appointments - Distribution by Gender & Rank
Full-time Faculty Appointments - Distribution by Gender & Type of Appointment
FTE Course Enrolments & FTE Course Enrolments per FTE Faculty
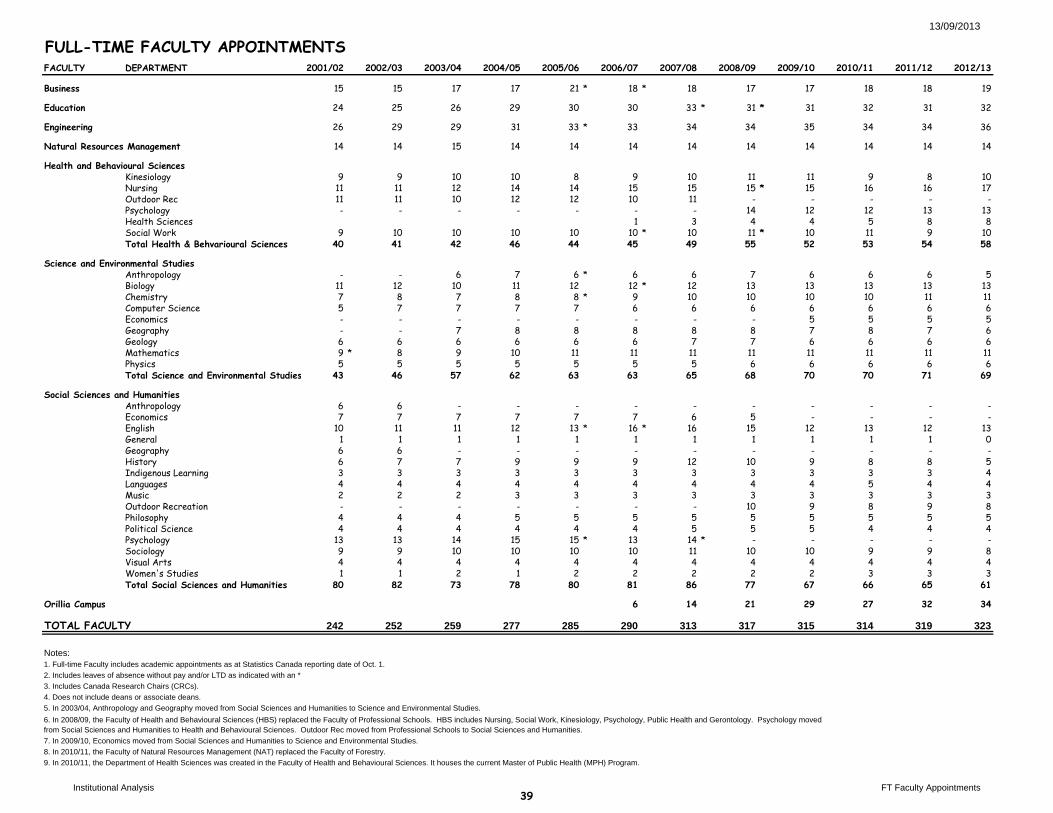
13/09/2013
FULL-TIME FACULTY APPOINTMENTSFACULTY DEPARTMENT 2001/02 2002/03 2003/04 2004/05 2005/06 2006/07 2007/08 2008/09 2009/10 2010/11 2011/12 2012/13
Business 15 15 17 17 21 * 18 * 18 17 17 18 18 19
Education 24 25 26 29 30 30 33 * 31 * 31 32 31 32
Engineering 26 29 29 31 33 * 33 34 34 35 34 34 36
Natural Resources Management 14 14 15 14 14 14 14 14 14 14 14 14
Health and Behavioural SciencesKinesiology 9 9 10 10 8 9 10 11 11 9 8 10Nursing 11 11 12 14 14 15 15 15 * 15 16 16 17Outdoor Rec 11 11 10 12 12 10 11 - - - - -Psychology - - - - - - - 14 12 12 13 13Health Sciences 1 3 4 4 5 8 8Social Work 9 10 10 10 10 10 * 10 11 * 10 11 9 10Total Health & Behvarioural Sciences 40 41 42 46 44 45 49 55 52 53 54 58
Science and Environmental StudiesAnthropology - - 6 7 6 * 6 6 7 6 6 6 5Biology 11 12 10 11 12 12 * 12 13 13 13 13 13Chemistry 7 8 7 8 8 * 9 10 10 10 10 11 11Computer Science 5 7 7 7 7 6 6 6 6 6 6 6Economics - - - - - - - - 5 5 5 5Geography - - 7 8 8 8 8 8 7 8 7 6Geology 6 6 6 6 6 6 7 7 6 6 6 6Mathematics 9 * 8 9 10 11 11 11 11 11 11 11 11Physics 5 5 5 5 5 5 5 6 6 6 6 6Total Science and Environmental Studies 43 46 57 62 63 63 65 68 70 70 71 69
Social Sciences and HumanitiesAnthropology 6 6 - - - - - - - - - -Economics 7 7 7 7 7 7 6 5 - - - -English 10 11 11 12 13 * 16 * 16 15 12 13 12 13General 1 1 1 1 1 1 1 1 1 1 1 0Geography 6 6 - - - - - - - - - -History 6 7 7 9 9 9 12 10 9 8 8 5Indigenous Learning 3 3 3 3 3 3 3 3 3 3 3 4Languages 4 4 4 4 4 4 4 4 4 5 4 4Music 2 2 2 3 3 3 3 3 3 3 3 3Outdoor Recreation - - - - - - - 10 9 8 9 8Philosophy 4 4 4 5 5 5 5 5 5 5 5 5Political Science 4 4 4 4 4 4 5 5 5 4 4 4Psychology 13 13 14 15 15 * 13 14 * - - - - -Sociology 9 9 10 10 10 10 11 10 10 9 9 8Visual Arts 4 4 4 4 4 4 4 4 4 4 4 4Women's Studies 1 1 2 1 2 2 2 2 2 3 3 3Total Social Sciences and Humanities 80 82 73 78 80 81 86 77 67 66 65 61
Orillia Campus 6 14 21 29 27 32 34
TOTAL FACULTY 242 252 259 277 285 290 313 317 315 314 319 323
Notes: 1. Full-time Faculty includes academic appointments as at Statistics Canada reporting date of Oct. 1.2. Includes leaves of absence without pay and/or LTD as indicated with an *.3. Includes Canada Research Chairs (CRCs). 4. Does not include deans or associate deans.5. In 2003/04, Anthropology and Geography moved from Social Sciences and Humanities to Science and Environmental Studies.
7. In 2009/10, Economics moved from Social Sciences and Humanities to Science and Environmental Studies. 8. In 2010/11, the Faculty of Natural Resources Management (NAT) replaced the Faculty of Forestry. 9. In 2010/11, the Department of Health Sciences was created in the Faculty of Health and Behavioural Sciences. It houses the current Master of Public Health (MPH) Program.
6. In 2008/09, the Faculty of Health and Behavioural Sciences (HBS) replaced the Faculty of Professional Schools. HBS includes Nursing, Social Work, Kinesiology, Psychology, Public Health and Gerontology. Psychology moved from Social Sciences and Humanities to Health and Behavioural Sciences. Outdoor Rec moved from Professional Schools to Social Sciences and Humanities.
Institutional Analysis FT Faculty Appointments39
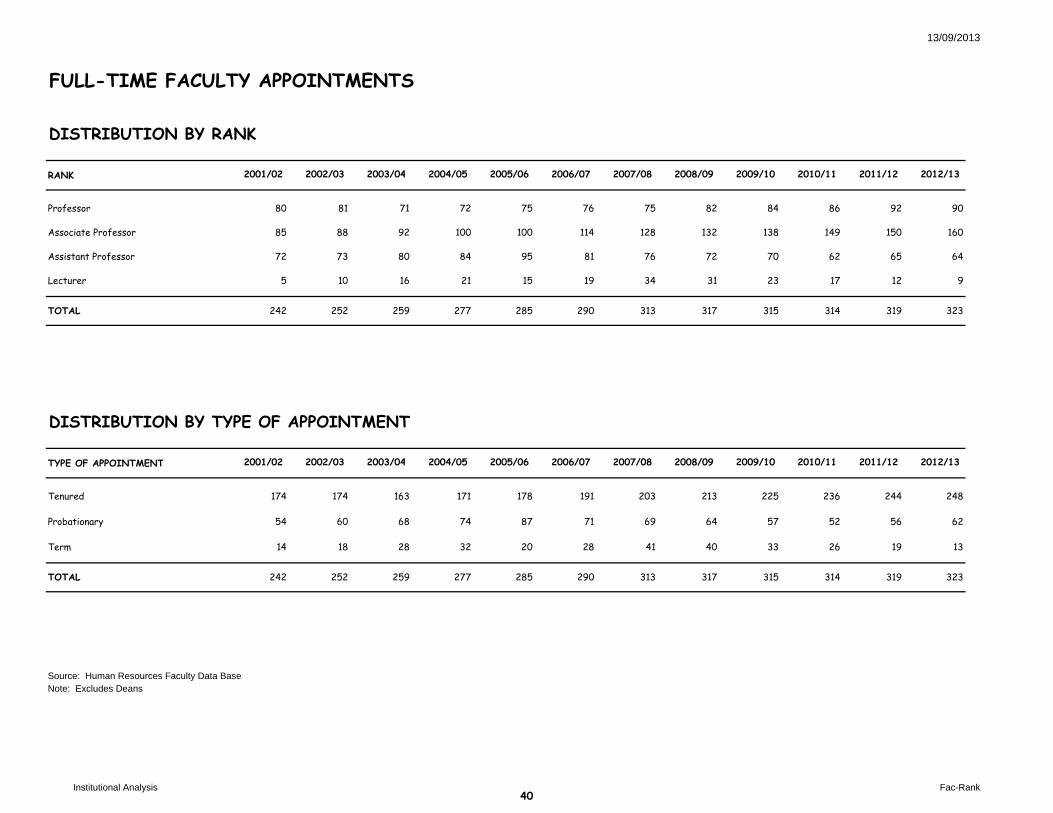
13/09/2013
FULL-TIME FACULTY APPOINTMENTS
DISTRIBUTION BY RANK
RANK 2001/02 2002/03 2003/04 2004/05 2005/06 2006/07 2007/08 2008/09 2009/10 2010/11 2011/12 2012/13
Professor 80 81 71 72 75 76 75 82 84 86 92 90
Associate Professor 85 88 92 100 100 114 128 132 138 149 150 160
Assistant Professor 72 73 80 84 95 81 76 72 70 62 65 64
Lecturer 5 10 16 21 15 19 34 31 23 17 12 9
TOTAL 242 252 259 277 285 290 313 317 315 314 319 323
DISTRIBUTION BY TYPE OF APPOINTMENT
TYPE OF APPOINTMENT 2001/02 2002/03 2003/04 2004/05 2005/06 2006/07 2007/08 2008/09 2009/10 2010/11 2011/12 2012/13
Tenured 174 174 163 171 178 191 203 213 225 236 244 248
Probationary 54 60 68 74 87 71 69 64 57 52 56 62
Term 14 18 28 32 20 28 41 40 33 26 19 13
TOTAL 242 252 259 277 285 290 313 317 315 314 319 323
Source: Human Resources Faculty Data BaseNote: Excludes Deans
Institutional Analysis Fac-Rank40
16/09/2013
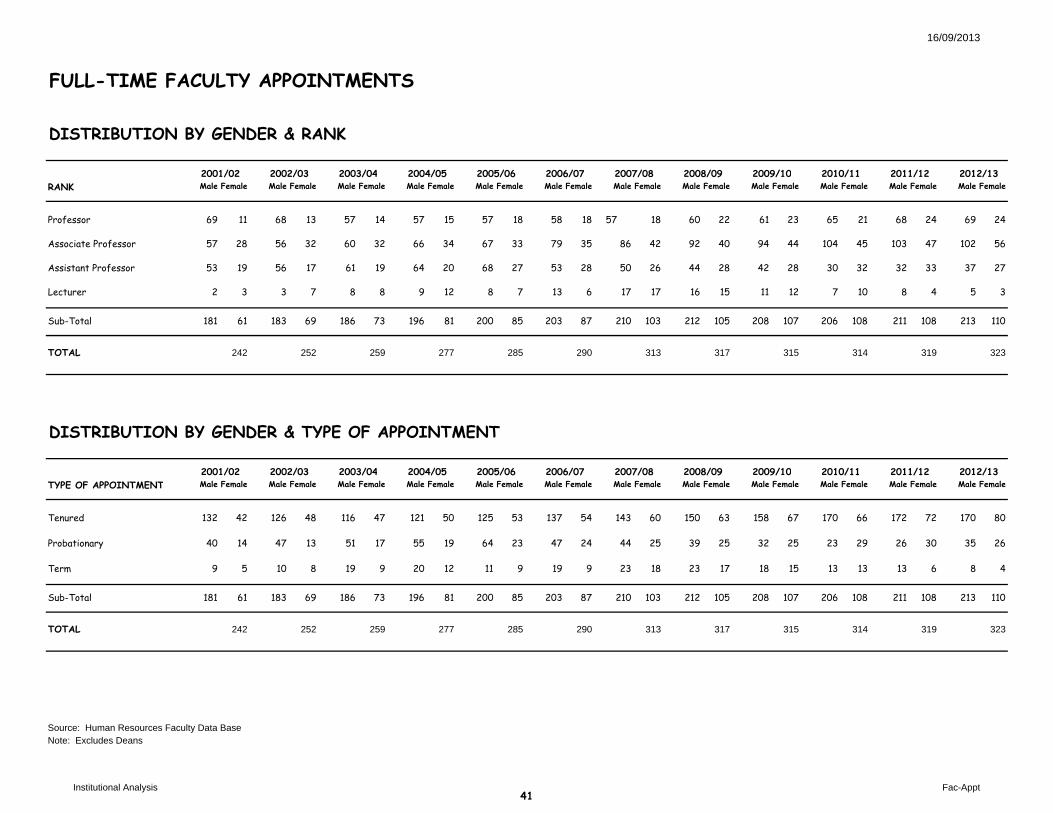
FULL-TIME FACULTY APPOINTMENTS
DISTRIBUTION BY GENDER & RANK
RANK Male Female Male Female Male Female Male Female Male Female Male Female Male Female Male Female Male Female Male Female Male Female Male Female
Professor 69 11 68 13 57 14 57 15 57 18 58 18 57 18 60 22 61 23 65 21 68 24 69 24
Associate Professor 57 28 56 32 60 32 66 34 67 33 79 35 86 42 92 40 94 44 104 45 103 47 102 56
Assistant Professor 53 19 56 17 61 19 64 20 68 27 53 28 50 26 44 28 42 28 30 32 32 33 37 27
Lecturer 2 3 3 7 8 8 9 12 8 7 13 6 17 17 16 15 11 12 7 10 8 4 5 3
Sub-Total 181 61 183 69 186 73 196 81 200 85 203 87 210 103 212 105 208 107 206 108 211 108 213 110
TOTAL 242 252 259 277 285 290 313 317 315 314 319 323
DISTRIBUTION BY GENDER & TYPE OF APPOINTMENT
TYPE OF APPOINTMENT Male Female Male Female Male Female Male Female Male Female Male Female Male Female Male Female Male Female Male Female Male Female Male Female
Tenured 132 42 126 48 116 47 121 50 125 53 137 54 143 60 150 63 158 67 170 66 172 72 170 80
Probationary 40 14 47 13 51 17 55 19 64 23 47 24 44 25 39 25 32 25 23 29 26 30 35 26
Term 9 5 10 8 19 9 20 12 11 9 19 9 23 18 23 17 18 15 13 13 13 6 8 4
Sub-Total 181 61 183 69 186 73 196 81 200 85 203 87 210 103 212 105 208 107 206 108 211 108 213 110
TOTAL 242 252 259 277 285 290 313 317 315 314 319 323
Source: Human Resources Faculty Data BaseNote: Excludes Deans
2011/12
2011/122010/112006/07 2007/08 2008/09 2009/10
2007/08 2008/09 2009/102001/02 2002/03
2001/02 2002/03
2012/13
2012/132005/06
2003/04 2004/05 2005/06 2006/07
2003/04 2004/05
2010/11
Institutional Analysis Fac-Appt41

NUMBER OF FULL-TIME EQUIVALENT COURSE ENROLMENTSand
FULL COURSE ENROLMENTS PER F.T.E. FACULTY
2003/04 2004/05 2005/06 2006/07 2007/08 2008/09 2009/10 2010/11 2011/12
# FCE FCE # FCE FCE # FCE FCE # FCE FCE # FCE FCE # FCE FCE # FCE FCE # FCE FCE # FCE FCEEnrol Enrol/ Enrol Enrol/ Enrol Enrol/ Enrol Enrol/ Enrol Enrol/ Enrol Enrol/ Enrol Enrol/ Enrol Enrol/ Enrol Enrol/
DEPARTMENT F.T.E. F.T.E. F.T.E. F.T.E. F.T.E. F.T.E. F.T.E. F.T.E. F.T.E.Faculty Faculty Faculty Faculty Faculty Faculty Faculty Faculty Faculty
BUSINESS 1,995.50 100.62 2,180.00 98.7 1,860.50 81.5 1,865.50 98.58 1,751.50 76.62 1708.00 85.00 2034.00 101.00 1987.00 90.10 2150.00 100.70
EDUCATION 6055.50 150.02 5320.75 121.25 5114.75 116.33 4853.25 107.23 5062.75 99.40 5096.30 101.20 4843.00 97.70 4718.00 92.70 5114.80 97.40
ENGINEERING 2665.50 82.48 3054.50 86.16 3167.00 85.59 3121.00 80.88 3176.00 76.66 3178.50 76.20 3630.50 89.30 3799.00 95.20 3678.00 92.40
FORESTRY 847.50 52.95 726.00 44.15 753.50 46.74 985.00 54.92 973.00 50.42 921.50 49.40 1031.00 54.70 829.50 42.20 958.50 53.90
ORILLIA 529.25 69.79 1,276.50 76.84 1765.75 70.00 3618.00 96.90 4244.00 98.60 4719.80 100.00
HEALTH & BEHAVIOURAL SCIENCES
Kinesiology 1,104.00 96.69 989 80.15 1,029.00 102.29 1,512.50 131.89 1,220.50 94.39 1212.00 87.50 1180.50 97.80 1025.00 85.10 1262.00 130.10MPH 779.00 170.28 538.00 120.90 599.50 120.10 478.50 85.50 652.50 70.50Nursing 1358.00 81.82 2099.00 93.68 2221.50 104.83 2037.50 88.24 2114.00 91.63 2112.00 91.80 2212.50 105.60 2511.00 108.50 2551.50 103.60Outdoor Rec 817.50 76.94 798.00 59.95 768.75 56.82 787.75 63.41 676.75 51.64 - - - - - - - -Psychology - - - - - - - - - - 2452.00 127.60 2115.50 131.00 2246.00 129.20 2233.50 142.40Social Work 1079.50 95.19 958.50 77.76 914.50 76.44 1112.50 95.11 1127.50 83.58 934.50 62.80 763.00 69.10 989.50 82.10 1116.50 96.50
4359.00 87.21 4732.50 80.23 4933.75 86.95 5450.25 92.88 5917.75 88.10 7248.50 96.10 6871.00 105.40 7250.00 97.60 7816.00 110.30
TOTAL UNIVERSITY 34157.00 107.77 33596.25 96.82 33290.50 97.07 33651.75 94.11 34298.50 86.04 34489.80 85.90 36533.50 92.90 37403.30 90.20 38320.00 94.60
FCE = Full Course EquivalentFTE = Full Time Equivalent
Excludes off-campus and distance education courses included in the Continuing Education & Distributed Learning budget which are not a part of loaVideo-conference courses in Orillia have been credited to the department with primary responsibilityGeneral Arts & Science courses have been credited to the department with primary responsibility
Corrections made to Nursing commencing 2002-03.
Total Health & Behavioural Sciences
Note: FCE Enrolment is calculated with a graduate enrolment weighting of 3
Institutional Analysis FTE_ENR_11
42
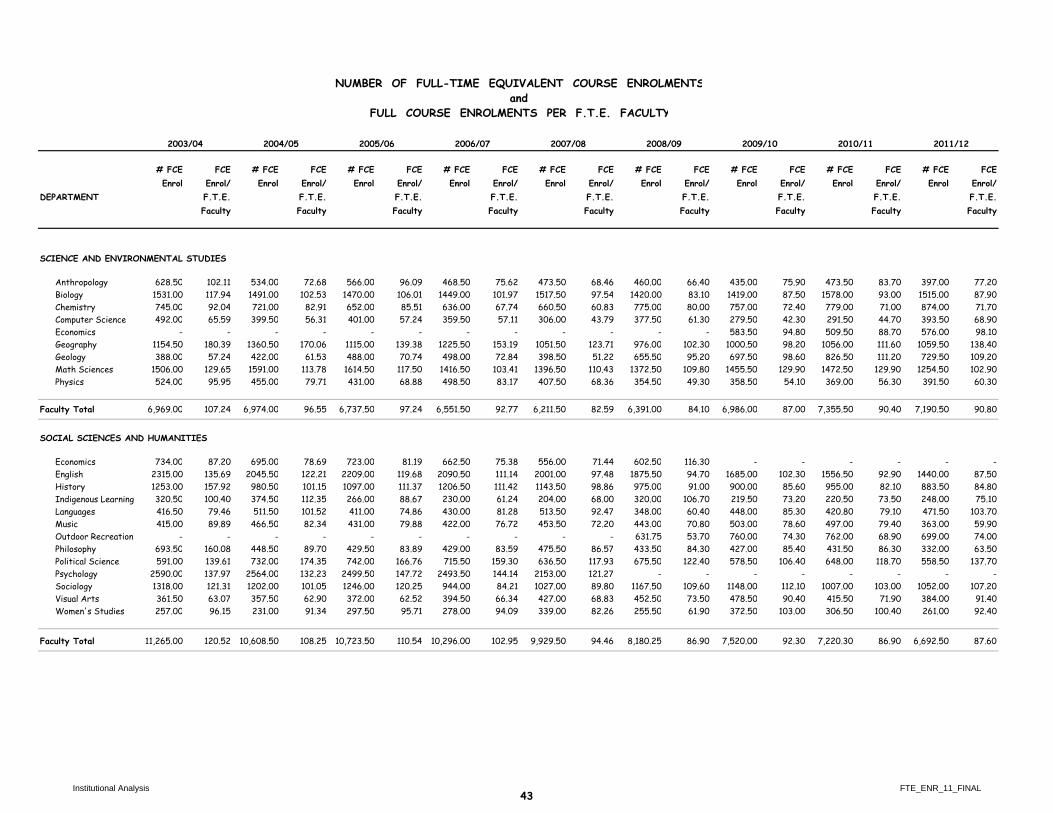
NUMBER OF FULL-TIME EQUIVALENT COURSE ENROLMENTSand
FULL COURSE ENROLMENTS PER F.T.E. FACULTY
# FCE FCE # FCE FCE # FCE FCE # FCE FCE # FCE FCE # FCE FCE # FCE FCE # FCE FCE # FCE FCEEnrol Enrol/ Enrol Enrol/ Enrol Enrol/ Enrol Enrol/ Enrol Enrol/ Enrol Enrol/ Enrol Enrol/ Enrol Enrol/ Enrol Enrol/
DEPARTMENT F.T.E. F.T.E. F.T.E. F.T.E. F.T.E. F.T.E. F.T.E. F.T.E. F.T.E.Faculty Faculty Faculty Faculty Faculty Faculty Faculty Faculty Faculty
SCIENCE AND ENVIRONMENTAL STUDIES
Anthropology 628.50 102.11 534.00 72.68 566.00 96.09 468.50 75.62 473.50 68.46 460.00 66.40 435.00 75.90 473.50 83.70 397.00 77.20Biology 1531.00 117.94 1491.00 102.53 1470.00 106.01 1449.00 101.97 1517.50 97.54 1420.00 83.10 1419.00 87.50 1578.00 93.00 1515.00 87.90Chemistry 745.00 92.04 721.00 82.91 652.00 85.51 636.00 67.74 660.50 60.83 775.00 80.00 757.00 72.40 779.00 71.00 874.00 71.70Computer Science 492.00 65.59 399.50 56.31 401.00 57.24 359.50 57.11 306.00 43.79 377.50 61.30 279.50 42.30 291.50 44.70 393.50 68.90Economics - - - - - - - - - - - - 583.50 94.80 509.50 88.70 576.00 98.10Geography 1154.50 180.39 1360.50 170.06 1115.00 139.38 1225.50 153.19 1051.50 123.71 976.00 102.30 1000.50 98.20 1056.00 111.60 1059.50 138.40Geology 388.00 57.24 422.00 61.53 488.00 70.74 498.00 72.84 398.50 51.22 655.50 95.20 697.50 98.60 826.50 111.20 729.50 109.20Math Sciences 1506.00 129.65 1591.00 113.78 1614.50 117.50 1416.50 103.41 1396.50 110.43 1372.50 109.80 1455.50 129.90 1472.50 129.90 1254.50 102.90Physics 524.00 95.95 455.00 79.71 431.00 68.88 498.50 83.17 407.50 68.36 354.50 49.30 358.50 54.10 369.00 56.30 391.50 60.30
Faculty Total 6,969.00 107.24 6,974.00 96.55 6,737.50 97.24 6,551.50 92.77 6,211.50 82.59 6,391.00 84.10 6,986.00 87.00 7,355.50 90.40 7,190.50 90.80
SOCIAL SCIENCES AND HUMANITIES
Economics 734.00 87.20 695.00 78.69 723.00 81.19 662.50 75.38 556.00 71.44 602.50 116.30 - - - - - -English 2315.00 135.69 2045.50 122.21 2209.00 119.68 2090.50 111.14 2001.00 97.48 1875.50 94.70 1685.00 102.30 1556.50 92.90 1440.00 87.50History 1253.00 157.92 980.50 101.15 1097.00 111.37 1206.50 111.42 1143.50 98.86 975.00 91.00 900.00 85.60 955.00 82.10 883.50 84.80Indigenous Learning 320.50 100.40 374.50 112.35 266.00 88.67 230.00 61.24 204.00 68.00 320.00 106.70 219.50 73.20 220.50 73.50 248.00 75.10Languages 416.50 79.46 511.50 101.52 411.00 74.86 430.00 81.28 513.50 92.47 348.00 60.40 448.00 85.30 420.80 79.10 471.50 103.70Music 415.00 89.89 466.50 82.34 431.00 79.88 422.00 76.72 453.50 72.20 443.00 70.80 503.00 78.60 497.00 79.40 363.00 59.90Outdoor Recreation - - - - - - - - - - 631.75 53.70 760.00 74.30 762.00 68.90 699.00 74.00Philosophy 693.50 160.08 448.50 89.70 429.50 83.89 429.00 83.59 475.50 86.57 433.50 84.30 427.00 85.40 431.50 86.30 332.00 63.50Political Science 591.00 139.61 732.00 174.35 742.00 166.76 715.50 159.30 636.50 117.93 675.50 122.40 578.50 106.40 648.00 118.70 558.50 137.70Psychology 2590.00 137.97 2564.00 132.23 2499.50 147.72 2493.50 144.14 2153.00 121.27 - - - - - - - -Sociology 1318.00 121.31 1202.00 101.05 1246.00 120.25 944.00 84.21 1027.00 89.80 1167.50 109.60 1148.00 112.10 1007.00 103.00 1052.00 107.20Visual Arts 361.50 63.07 357.50 62.90 372.00 62.52 394.50 66.34 427.00 68.83 452.50 73.50 478.50 90.40 415.50 71.90 384.00 91.40Women's Studies 257.00 96.15 231.00 91.34 297.50 95.71 278.00 94.09 339.00 82.26 255.50 61.90 372.50 103.00 306.50 100.40 261.00 92.40
Faculty Total 11,265.00 120.52 10,608.50 108.25 10,723.50 110.54 10,296.00 102.95 9,929.50 94.46 8,180.25 86.90 7,520.00 92.30 7,220.30 86.90 6,692.50 87.60
2009/102005/06 2006/07 2007/08 2008/09 2011/122003/04 2004/05 2010/11
Institutional Analysis FTE_ENR_11_FINAL43
SECTION 4 – FINANCIAL DATA
Revenue by Source and Type of Fund
Expenses by Object and Type of Fund
Operating Income and Expenditures
Revenue from Research Grants and Contracts

LAKEHEAD UNIVERSITY REVENUE BY SOURCE AND TYPE OF FUNDFOR THE FISCAL YEAR ENDING APRIL 30th(IN THOUSANDS OF DOLLARS)
SOURCE 1999/00 2000/01 2001/02 2002/03 2003/04 2004/05 2005/06 2006/07 2007/08 2008/09 2009/10 2010/11 2011/12
1. GOVERNMENT GRANTS AND CONTRACTS (A) ONTARIO MTCU (I) FORMULA 22,325 22,657 24,518 24,774 25,305 27,761 30,694 32,451 31,482 39,813 40,350 45,233 46,129 (II) EXTRA FORMULA 8,647 8,492 6,938 10,273 16,540 20,599 20,347 21,299 0 0 0 0 0 (III) OTHER MET GRANTS 15,167 1,613 1,002 5,585 597 591 4,480 639 25,159 19,352 23,998 25,468 16,826
(B) OTHER ONTARIO GRANTS 1,459 2,145 2,984 5,706 3,269 5,312 1,932 7,787 6,001 6,635 6,582 9,196 8,520
TOTAL ONTARIO GRANTS $47,598 $34,907 $35,442 $46,338 $45,711 $54,263 $57,453 $62,176 $62,642 $65,800 $70,930 $79,897 $71,475
(C) FEDERAL 3,356 3,655 6,822 10,145 5,953 9,508 8,536 8,035 9,129 9,809 18,068 13,515 12,451
(D) MUNICIPAL 0 2 28 25 0 0 5 3 0 20 227 236 250
(E) OTHER 334 40 34 43 12 0 68 90 273 175 151 163 428
2. FEES (A) TUITION CREDIT 22,349 22,617 22,966 25,168 29,632 31,172 31,153 32,689 34,402 36,937 40,126 42,933 46,201 (B) TUITION NON-CREDIT 204 191 454 307 187 273 391 452 433 390 366 399 419 (C) MISCELLANEOUS 5,265 1,479 1,526 1,559 1,934 2,290 2,504 2,713 2,754 2,707 2,917 3,432 3,695
3. BORROWINGS 0 0 0 0 13,600 14,595 100,000 235 0 0 2300 7400 16100
4. DONATIONS, NON-GOVT GRANTS & CONTRACTS 1,475 2,433 7,641 3,178 1,962 5,575 4,477 5,147 4,445 9,867 6,287 6,861 8,097
5. SALES OF SERVICE AND PRODUCTS 10,682 13,440 10,755 12,294 13,363 13,061 13,676 14,923 14,903 14,698 15,146 15,760 17,061
6. INVESTMENT INCOME 1,552 930 525 224 2,135 1,597 3,578 7,911 1,030 -10,246 10,791 4,620 1,749
7. MISCELLANEOUS 849 1,034 1,054 3,174 1,530 1,773 1,506 1,721 2,229 1,923 2,481 6,796 2,113
TOTAL $93,664 $80,728 $87,247 $102,455 $116,019 $134,107 $223,347 $136,095 $132,240 $132,080 $169,790 $182,012 $180,039
Source: Table 2, Council of Ontario Universities COFO-UO Reports
Institutional Analysis
August 2013
COFO-UO_Revenue
45
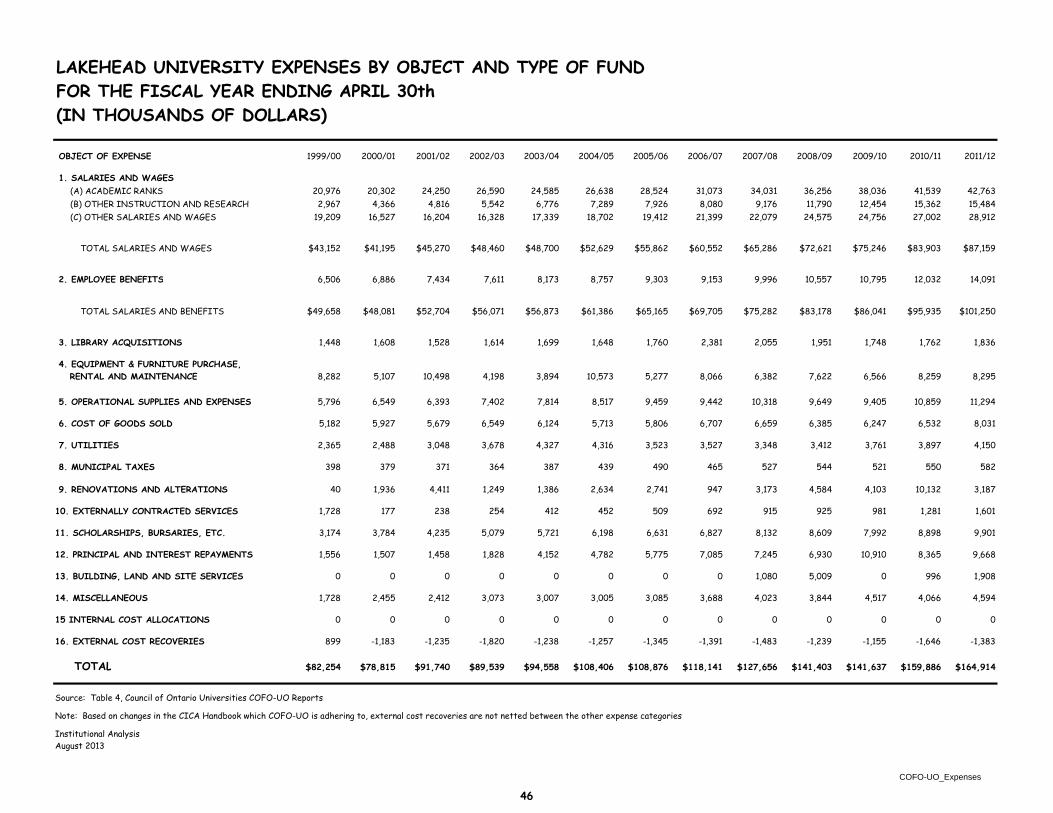
LAKEHEAD UNIVERSITY EXPENSES BY OBJECT AND TYPE OF FUNDFOR THE FISCAL YEAR ENDING APRIL 30th(IN THOUSANDS OF DOLLARS)
OBJECT OF EXPENSE 1999/00 2000/01 2001/02 2002/03 2003/04 2004/05 2005/06 2006/07 2007/08 2008/09 2009/10 2010/11 2011/12
1. SALARIES AND WAGES (A) ACADEMIC RANKS 20,976 20,302 24,250 26,590 24,585 26,638 28,524 31,073 34,031 36,256 38,036 41,539 42,763 (B) OTHER INSTRUCTION AND RESEARCH 2,967 4,366 4,816 5,542 6,776 7,289 7,926 8,080 9,176 11,790 12,454 15,362 15,484 (C) OTHER SALARIES AND WAGES 19,209 16,527 16,204 16,328 17,339 18,702 19,412 21,399 22,079 24,575 24,756 27,002 28,912
TOTAL SALARIES AND WAGES $43,152 $41,195 $45,270 $48,460 $48,700 $52,629 $55,862 $60,552 $65,286 $72,621 $75,246 $83,903 $87,159
2. EMPLOYEE BENEFITS 6,506 6,886 7,434 7,611 8,173 8,757 9,303 9,153 9,996 10,557 10,795 12,032 14,091
TOTAL SALARIES AND BENEFITS $49,658 $48,081 $52,704 $56,071 $56,873 $61,386 $65,165 $69,705 $75,282 $83,178 $86,041 $95,935 $101,250
3. LIBRARY ACQUISITIONS 1,448 1,608 1,528 1,614 1,699 1,648 1,760 2,381 2,055 1,951 1,748 1,762 1,836
4. EQUIPMENT & FURNITURE PURCHASE, RENTAL AND MAINTENANCE 8,282 5,107 10,498 4,198 3,894 10,573 5,277 8,066 6,382 7,622 6,566 8,259 8,295
5. OPERATIONAL SUPPLIES AND EXPENSES 5,796 6,549 6,393 7,402 7,814 8,517 9,459 9,442 10,318 9,649 9,405 10,859 11,294
6. COST OF GOODS SOLD 5,182 5,927 5,679 6,549 6,124 5,713 5,806 6,707 6,659 6,385 6,247 6,532 8,031
7. UTILITIES 2,365 2,488 3,048 3,678 4,327 4,316 3,523 3,527 3,348 3,412 3,761 3,897 4,150
8. MUNICIPAL TAXES 398 379 371 364 387 439 490 465 527 544 521 550 582
9. RENOVATIONS AND ALTERATIONS 40 1,936 4,411 1,249 1,386 2,634 2,741 947 3,173 4,584 4,103 10,132 3,187
10. EXTERNALLY CONTRACTED SERVICES 1,728 177 238 254 412 452 509 692 915 925 981 1,281 1,601
11. SCHOLARSHIPS, BURSARIES, ETC. 3,174 3,784 4,235 5,079 5,721 6,198 6,631 6,827 8,132 8,609 7,992 8,898 9,901
12. PRINCIPAL AND INTEREST REPAYMENTS 1,556 1,507 1,458 1,828 4,152 4,782 5,775 7,085 7,245 6,930 10,910 8,365 9,668
13. BUILDING, LAND AND SITE SERVICES 0 0 0 0 0 0 0 0 1,080 5,009 0 996 1,908
14. MISCELLANEOUS 1,728 2,455 2,412 3,073 3,007 3,005 3,085 3,688 4,023 3,844 4,517 4,066 4,594
15 INTERNAL COST ALLOCATIONS 0 0 0 0 0 0 0 0 0 0 0 0 0
16. EXTERNAL COST RECOVERIES 899 -1,183 -1,235 -1,820 -1,238 -1,257 -1,345 -1,391 -1,483 -1,239 -1,155 -1,646 -1,383
TOTAL $82,254 $78,815 $91,740 $89,539 $94,558 $108,406 $108,876 $118,141 $127,656 $141,403 $141,637 $159,886 $164,914
Source: Table 4, Council of Ontario Universities COFO-UO Reports
Note: Based on changes in the CICA Handbook which COFO-UO is adhering to, external cost recoveries are not netted between the other expense categories
Institutional AnalysisAugust 2013
COFO-UO_Expenses
46
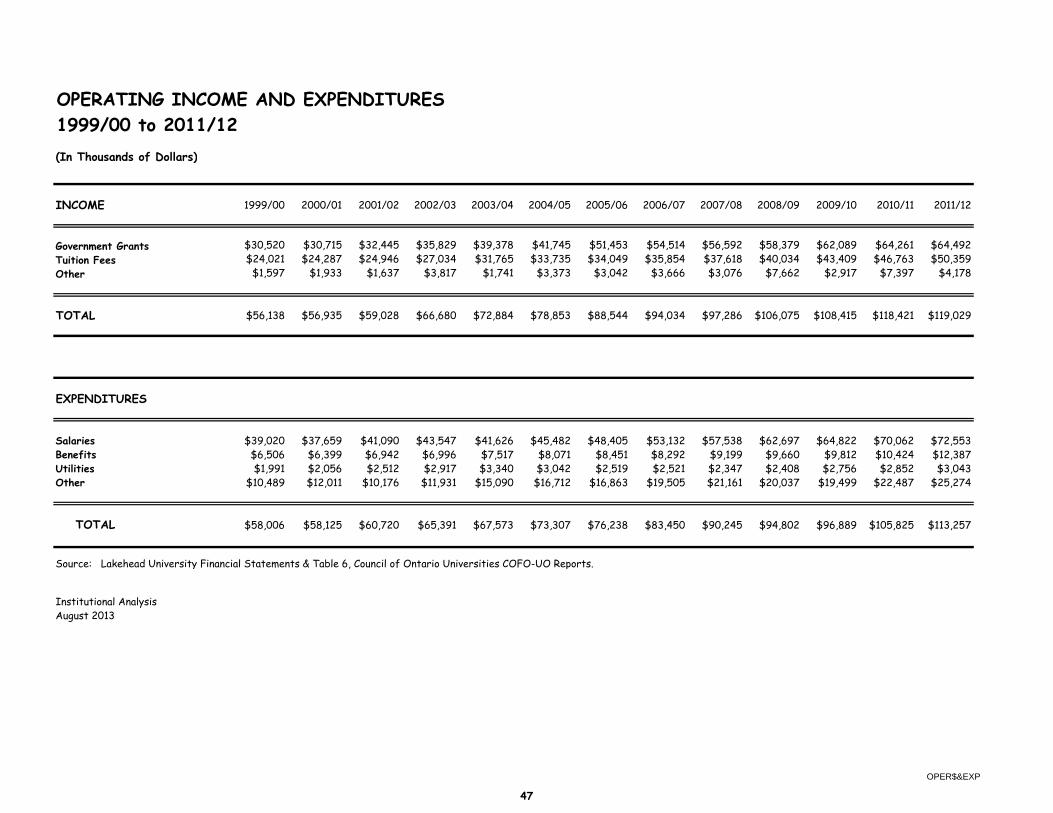
OPERATING INCOME AND EXPENDITURES1999/00 to 2011/12(In Thousands of Dollars)
INCOME 1999/00 2000/01 2001/02 2002/03 2003/04 2004/05 2005/06 2006/07 2007/08 2008/09 2009/10 2010/11 2011/12
Government Grants $30,520 $30,715 $32,445 $35,829 $39,378 $41,745 $51,453 $54,514 $56,592 $58,379 $62,089 $64,261 $64,492Tuition Fees $24,021 $24,287 $24,946 $27,034 $31,765 $33,735 $34,049 $35,854 $37,618 $40,034 $43,409 $46,763 $50,359Other $1,597 $1,933 $1,637 $3,817 $1,741 $3,373 $3,042 $3,666 $3,076 $7,662 $2,917 $7,397 $4,178
TOTAL $56,138 $56,935 $59,028 $66,680 $72,884 $78,853 $88,544 $94,034 $97,286 $106,075 $108,415 $118,421 $119,029
EXPENDITURES
Salaries $39,020 $37,659 $41,090 $43,547 $41,626 $45,482 $48,405 $53,132 $57,538 $62,697 $64,822 $70,062 $72,553Benefits $6,506 $6,399 $6,942 $6,996 $7,517 $8,071 $8,451 $8,292 $9,199 $9,660 $9,812 $10,424 $12,387Utilities $1,991 $2,056 $2,512 $2,917 $3,340 $3,042 $2,519 $2,521 $2,347 $2,408 $2,756 $2,852 $3,043Other $10,489 $12,011 $10,176 $11,931 $15,090 $16,712 $16,863 $19,505 $21,161 $20,037 $19,499 $22,487 $25,274
TOTAL $58,006 $58,125 $60,720 $65,391 $67,573 $73,307 $76,238 $83,450 $90,245 $94,802 $96,889 $105,825 $113,257
Source: Lakehead University Financial Statements & Table 6, Council of Ontario Universities COFO-UO Reports.
Institutional AnalysisAugust 2013
OPER$&EXP
47

REVENUE FROM RESEARCH GRANTS AND CONTRACTS - 2002/03 TO 2012/13(IN THOUSANDS OF DOLLARS)
2002/03 2003/04 2004/05 2005/06 2006/07 2007/08 2008/09 2009/10 2010/11 2011/12 2012/13
NSERC - - Individual 1,562 1,390 1,957 1,825 2,061 2,205 1,726 1,646 1,862 2,125 1,864 - - Equipment 43 10 260 96 79 185 0 97 53 0 75 - - Other 270 167 525 1,148 303 1,103 1,344 1,066 724 356 958
TOTAL $1,875 $1,567 $2,742 $3,069 $2,443 $3,493 $3,070 $2,809 $2,639 $2,481 $2,897
SSHRC - - Individual 361 457 340 395 740 627 1,411 538 1,194 1,311 1,073 - - Other 42 30 143 202 279 154 272 586 415 371 363
TOTAL $403 $487 $483 $597 $1,019 $781 $1,683 $1,124 $1,609 $1,682 $1,436
CIHR 133 135 506 212 370 715 537 493 657 569 1,140
CFI 141 517 2,374 1,316 253 317 145 272 455 433 406
FedNor 122 306 874 393 575 420 744 359 2,057 2,328 482
Other Federal 2,339 2,434 2,449 2,713 3,223 3,247 3,438 3,728 3,074 3,379 3,375
TOTAL $2,735 $3,392 $6,203 $4,634 $4,421 $4,699 $4,864 $4,852 $6,243 $6,709 $5,403
TOTAL FEDERAL $5,013 $5,446 $9,428 $8,300 $7,883 $8,973 $9,617 $8,785 $10,491 $10,872 $9,736
Ontario Living Legacy 1,394 908 1,742 0 0 0 0 0 0 0 0Ontario Innovation Trust 189 337 1,564 218 0 23 53 0 121 26 154Ministry of Research/Innovation - - - - 6,599 351 270 122 1,444 53 76Other Ontario 1,255 1,515 1,674 1,891 1,471 2,442 3,381 2,994 3,811 5,283 3,513Private Sector 1,238 1,398 3,694 2,871 2,891 3,349 3,612 3,463 5,207 5,199 6,486Misc. 163 254 329 375 877 1,254 980 926 960 1,964 2,072
TOTAL TO UNIVERSITY $9,252 $9,858 $18,431 $13,655 $19,721 $16,392 $17,913 $16,290 $22,034 $23,397 $22,037
Source: Table 2, Council of Ontario Universities COFO-UO ReportsNote: 2010/11 figures include the non-consolidated information of TBRRI
Institutional AnalysisOctober 2013
Research Revenue 2012-13_FINAL
48
SECTION 5 – SPACE
University Land
Distribution of Physical Space
Residence Accommodation
Campus Maps

14/3/2011
UNIVERSITY LAND (in Hectares)
UNIVERSITY LAND AMOUNT
Thunder Bay Campus 116.7Orillia Campus 34.4
Forest Areas
Forbes Township 21.8
Hogarth Plantations 44.0
Raith 6,452.0
Silver Mountain (leased land) 282.0
Trout Lake 1,060.0
Port Arthur Collegiate Institute (PACI) 0.8
Rural Resource Centre 3.6
Big Thunder (leased land) 10.0
TOTAL 8,025.4
Source: Physical Plant / Triennial COU Inventory of Physical Facilities of Ontario Universities 2010-11.
Land1011.xls
50

14/3/2011
DISTRIBUTION OF PHYSICAL SPACENovember 2010
SQUAREUSAGE METERS *
Classrooms 8,098Laboratories Undergraduate 12,386 Graduate and Faculty 6,288Offices Academic 9,309 Administrative 5,472Facilities Bookstore / Merchandising 546 Audio Visual / Television / Central Services 2,813 Health Services 180 Assembly / Exhibition 2,464Library / Study Activity 7,996Recreation / Athletic 10,197Common Use and Student Activity 2,686Food Services 3,583Plant Maintenance 993Residential 30,050Non-Assignable 48,082Other 5,776
TOTAL 156,919
* Net Assignable Square Meters. Measurements are approximate.
Source: Physical Plant / Triennial COU Inventory of Physical Facilities of OntarioUniversities 2010-11.
Space1011.xls
51

RESIDENCE ACCOMMODATION
TOTAL ACCOMMODATION
2002/03 2003/04 2004/05 2005/06 2006/07 2007/08 2008/09 2009/10 2010/11 2011/12 2012/13 2013/14Thunder Bay Campus: Apartments 288 288 288 288 288 288 288 288 288 288 288 Dormitories 640 639 625 564 505 478 478 479 479 447 440 612 Townhouses 430 430 430 430 430 430 430 430 430 414 430 414
Orillia Campus: Dormitories − − − − − − − − − 105 271 250
Total 1070 1357 1343 1282 1223 1196 1196 1197 1197 1254 1429 1564
FEES
2002/03 2003/04 2004/05 2005/06 2006/07 2007/08 2008/09 2009/10 2010/11 2011/12 2012/13 2013/14Thunder Bay Campus: Basic Single $3,420 $3,724 $3,911 $3,990 $4,184 $4,422 $4,512 $4,623 $4,750 $4,775 $4,880 $4,975 Single $3,884 $4,230 $4,442 $4,535 $4,744 $4,992 $5,092 $5,218 $5,355 $5,400 $5,525 $5,630 Double $3,074 $3,348 $3,516 $3,586 $3,764 $3,992 $4,072 $4,173 $4,290 $4,300 N/A $3,875 Townhouse (+Utilities) $4,284 $4,631 $4,863 $4,980 $5,250 $5,450 $5,515 $5,650 $5,785 $5,985 $6,165 $6,240 Full Meal Plan $2,606 $2,708 $2,747 $2,983 $2,976 $3,038 $3,098 $3,172 $3,225 $3,440 $3,580 $3,615 Apartment $4,631 $4,863 $4,980 $5,270 $5,470 $5,540 $5,675 $5,810 $5,985 $6,165 $6,240
Orillia Campus: Single − − − − − − − − − $5,800 $6,075 $6,150 Full Meal Plan − − − − − − − − − $3,550- $3,550 $3,500
$4,050
Lakehead University has dormitory, townhouse and apartment style residences.Dormitories offer double, basic single and single rooms.Townhouses have four single bedrooms each with the exception of two houses which have three bedrooms each. Handicap accommodation is available in the townhouses. Meal plans are required in dormitories and are available to townhouse and apartment residents. Two 144-bed apartment-style complexes opened in September 2003. The apartments have four single bedrooms (including barrier-free units)Utility fees are included in the townhouse rates as of September 2003.Dormitory double rooms converted to single rooms in 3 Bartley Houses during the summer of 2005. Dormitory double rooms converted to single rooms in Bartley and Prettie Residences during the summer of 2006. Dormitory double rooms converted to single rooms in 3 Bartley houses during the summer of 2006. Remainder of dormitory double rooms converted to single rooms in Bartley Residence during the summer of 2011. Townhouse availability reduced by 16 spaces, used by NOSM for visiting doctors / students. Orillia residence partially open, Fall 2011. Dormitory-style rooms, meal plan required. In Fall 2012, all of Orillia residence is opened. Dormitory double rooms reinstated at Thunder Bay Campus for Fall 2014.Orillia Residence first floor rooms repurposed; no longer used for students.
Accommodation1314
52
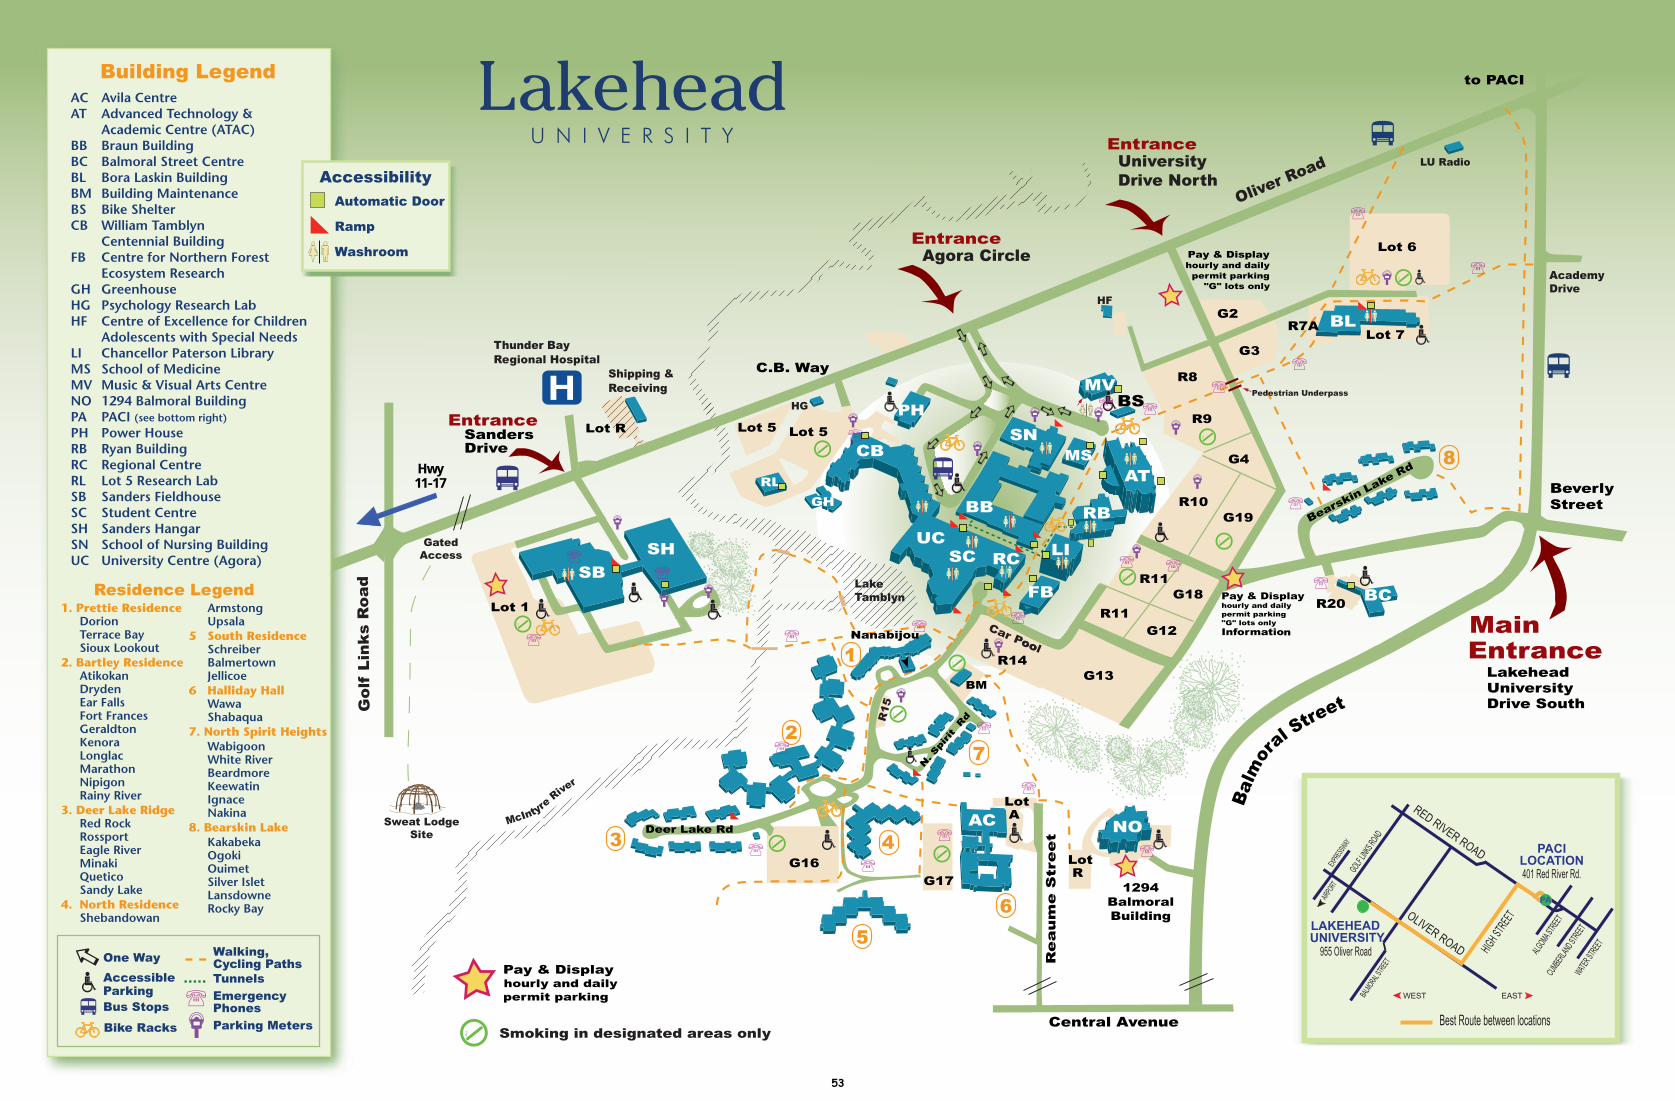
Walking,C cling PathsyTunnels
rgencyPhonesEme'Parking Meters
One Way
AccessiblekinPar g
Bus Stops
Bike Racks
C.B. Way
Agora CircleEntrance
Hwy11-17
SandersveDri
Go
lf L
ink
s R
oa
d
Entrance
GatedAccess
Deer Lake Rd
Central Avenue
LakeheadUniversityDrive South
Re
au
me
Str
ee
t
MainEntrance
BeverlyStreet
AcademyDrive
Balm
or
al Street
Entrance
Oliver RoadUniversity Drive North
Pedestrian Underpass
Bearskin Lake R
d
to PACIBuilding LegendAC Avila CentreAT Advanced Technology & Academic Centre (ATAC)BB Braun BuildingBC Balmoral Street CentreBL Bora Laskin BuildingBM Building MaintenanceBS Bike Shelter CB William Tamblyn Centennial BuildingFB Centre for Northern Forest Ecosystem ResearchGH GreenhouseHG Psychology Research LabHF Centre of Excellence for Children Adolescents with Special NeedsLI Chancellor Paterson LibraryMS School of MedicineMV Music & Visual Arts CentreNO 1294 Balmoral BuildingPA PACI (see bottom right)PH Power HouseRB Ryan BuildingRC Regional CentreRL Lot 5 Research LabSB Sanders FieldhouseSC Student CentreSH Sanders HangarSN School of Nursing BuildingUC University Centre (Agora)
UC
CB
GHRL
BB
SC RC
FB
PH
LI
SNMS
AT
RB
SB
Shipping &Receiving
SH
Nanabijou
BSMV
HF
1294 Balmoral Building
NO
BM
LU Radio
BC
BL
AC3
Residence Legend1. Prettie Residence
DorionTerrace BaySioux Lookout
2. Bartley ResidenceAtikokanDrydenEar FallsFort FrancesGeraldtonKenoraLonglacMarathonNipigonRainy River
3. Deer Lake RidgeRed RockRossportEagle RiverMinakiQueticoSandy Lake
4. North ResidenceShebandowan
ArmstongUpsala
5 South ResidenceSchreiberBalmertownJellicoe
6 Halliday HallWawaShabaqua
7. North Spirit HeightsWabigoonWhite RiverBeardmoreKeewatinIgnaceNakina
8. Bearskin LakeKakabekaOgokiOuimetSilver IsletLansdowneRocky Bay
7
6
5
1
2
4
8
Accessibility
Automatic Door
Ramp
Washroom
Pay & Displayhourly and dailypermit parking
Lot 5Lot 5Lot R
Lot 1
R14
Car Pooool
G13
Pay & Displayhourly and dailypermit parking
"G" lots only
R8
R9
R10
R11G18
G12
G19
G4
G3
G2
Pay & Displayhourly and dailypermit parking"G" lots only
Information
LotRG17
LotA
G16R
15
Lot 6
R20
R7ALot 7
R11
'
'
'
' '
'
'
' '
'
'
'
'
'
'
''
'
'
'
'
'
''
Smoking in designated areas only
Thunder BayRegional Hospital
LakeTamblyn
McIntyre
River
Sweat LodgeSite
WEST EAST
LAKEHEAD UNIVERSITY
PACILOCATION401 Red River Rd.
RED RIVER ROAD
BALMORAL
STREE
T
OLIVER ROAD ALGOMA S
TREET
CUMBER
LAND S
TREET
WATER S
TREET
EXPRES
SWAY
GOLF LIN
KS RO
AD
AIRPO
RT
HIGH STREET
Best Route between locations
955 Oliver Road
PA
Walking,C cling PathsyTunnels
rgencyPhonesEme'Parking Meters
One Way
AccessiblekinPar g
Bus Stops
Bike Racks
HG
53
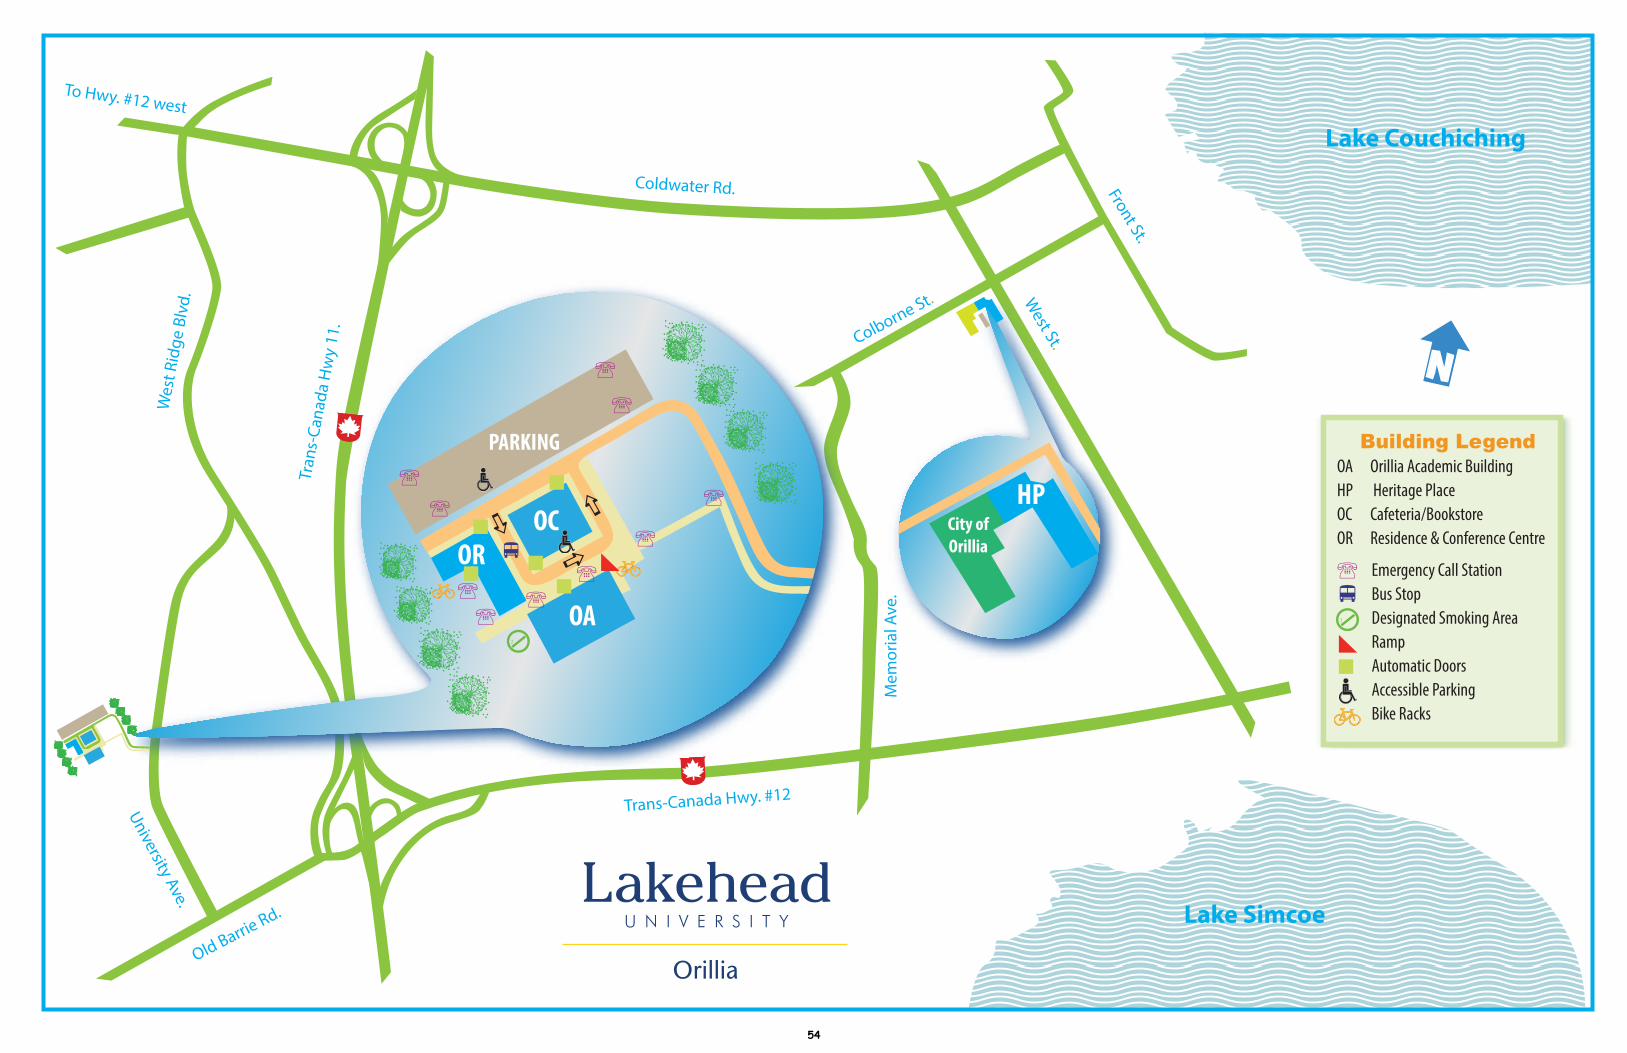
Y
E
Front St.
West St.Colborne St.
Building Legend OA Orillia Academic BuildingHP Heritage PlaceOC Cafeteria/BookstoreOR Residence & Conference Centre
Emergency Call StationBus Stop Designated Smoking Area RampAutomatic Doors Accessible ParkingBike Racks
Trans-Canada Hwy. #12
Mem
oria
l Ave
.
Coldwater Rd.
Tran
s-Ca
nada
Hw
y 11
.
Wes
t Rid
ge B
lvd.
Old Barrie Rd.
University Ave.
To Hwy. #12 west
Y
OA
OCOR
PARKING
Lake Couchiching
Lake Simcoe
HPCity of Orillia
EE
54
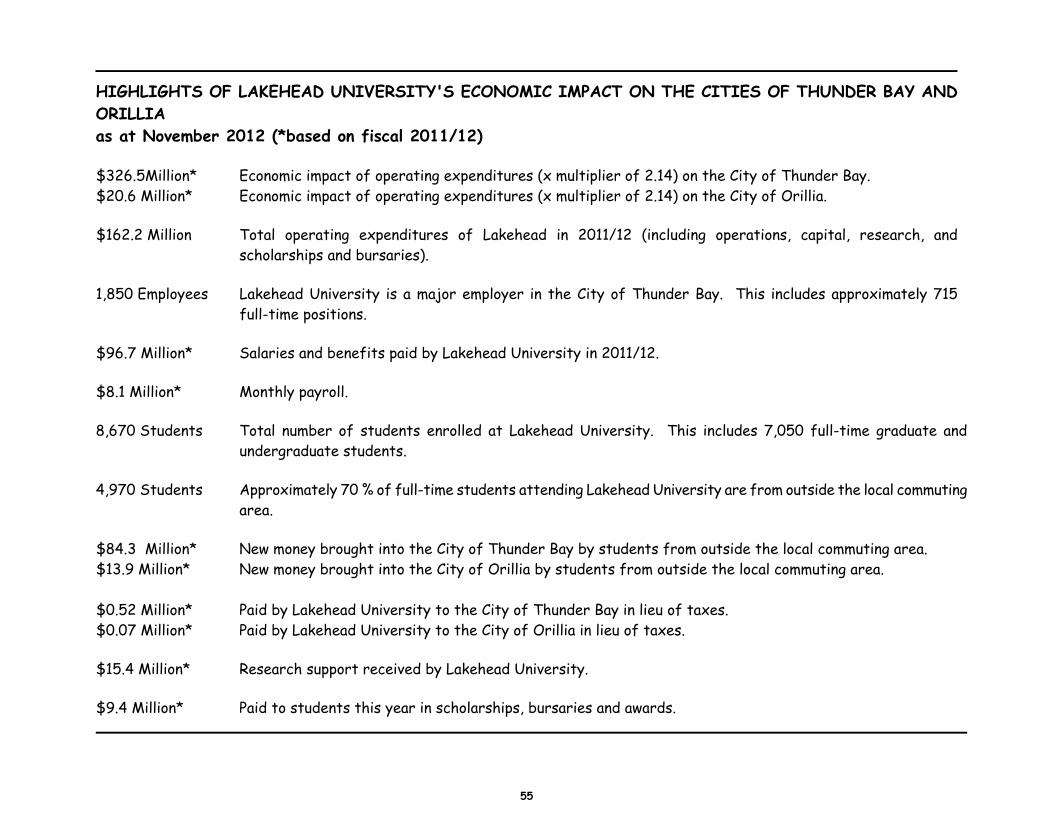
HIGHLIGHTS OF LAKEHEAD UNIVERSITY'S ECONOMIC IMPACT ON THE CITIES OF THUNDER BAY AND ORILLIA as at November 2012 (*based on fiscal 2011/12) $326.5Million* Economic impact of operating expenditures (x multiplier of 2.14) on the City of Thunder Bay. $20.6 Million* Economic impact of operating expenditures (x multiplier of 2.14) on the City of Orillia. $162.2 Million Total operating expenditures of Lakehead in 2011/12 (including operations, capital, research, and
scholarships and bursaries). 1,850 Employees Lakehead University is a major employer in the City of Thunder Bay. This includes approximately 715
full-time positions. $96.7 Million* Salaries and benefits paid by Lakehead University in 2011/12. $8.1 Million* Monthly payroll. 8,670 Students Total number of students enrolled at Lakehead University. This includes 7,050 full-time graduate and
undergraduate students.
4,970 Students Approximately 70 % of full-time students attending Lakehead University are from outside the local commuting area.
$84.3 Million* New money brought into the City of Thunder Bay by students from outside the local commuting area. $13.9 Million* New money brought into the City of Orillia by students from outside the local commuting area. $0.52 Million* Paid by Lakehead University to the City of Thunder Bay in lieu of taxes. $0.07 Million* Paid by Lakehead University to the City of Orillia in lieu of taxes. $15.4 Million* Research support received by Lakehead University. $9.4 Million* Paid to students this year in scholarships, bursaries and awards.
55


