
Integration of Software Cost Estimates Across COCOMO, SEER-SEM, and PRICE-S models
Integration of Software Cost Estimates Across COCOMO, SEER-SEM, and PRICE-S models
Tom Harwick, Engineering SpecialistNorthrop Grumman CorporationIntegrated SystemsOctober 26-29, 2004
19th International Forum on COCOMO and Software Cost Modeling

19th International Forum on COCOMO and Software Cost Modeling
2
10/07/2004
Outline
• Need for Inter-Model Estimate Integration
• Model Analysis– Model Comparisons & Sensitivity Analysis– Economic Properties
• Baseline Example– COCOMO– SEER-SEM– PRICE-S
• Summary
19th International Forum on COCOMO and Software Cost Modeling

19th International Forum on COCOMO and Software Cost Modeling
3
10/07/2004
Need for Inter-Model Estimate Integration
• Communication of overall Software Cost Estimate to the Customer
• Minimize Program Cost Risk
• Integration of Software Estimates Across Vendors– Various Software Cost Models
– Sizing Definitions– Selection of Cost Driver Settings
– Vendors have different Statement Of Work (SOW)
19th International Forum on COCOMO and Software Cost Modeling
19th International Forum on COCOMO and Software Cost Modeling
4
10/07/2004
Model Analysis
• Approach– Understand Properties of Each Cost Model
– Sizing and Sizing Normalization– Productivity Cost Drivers
–Team & Process–Market – Customer(s)–Complexity, Operating Environment–Model Scope Differences
19th International Forum on COCOMO and Software Cost Modeling

19th International Forum on COCOMO and Software Cost Modeling
5
10/07/2004
Model Analysis - Cost Drivers by Cost Model
Team & Process COCOMO II SEER-SEM PRICE-S Team ACAP, PCAP, APEX,
PLEX, LTEX Analyst Capabilities; Analyst Experience;
Programmer Capabilities;
Programmers Language Experience
INTEGI
Process TOOL, PCON, PVOL Development Method – KnowledgeBase; and
Practices and Methods Experience
CPLX1
Market/ Customer COCOMO II SEER-SEM PRICE-S Market RUSE, SITE, SECU * Requirements
Definition Normality ; Development Method –
Application and Acquisition Method-
KnowledgeBase; Multiple Site Development
CPLXM, CPLX1
Schedule SCED Required Schedule; Start Date
DSTART, PEND
Reliability RELY Certification Requirements
DOCU Development Standard - KnowledgeBase
Standard
Complexity COCOMO II SEER-SEM PRICE-S Complexity CPLX, DATA, STOR Application –
KnowledgeBase UTIL, APPL
Operating Environment & Technology
TIME Platform; and DevelopmentMethod -
KnowledgeBase
PLTFM
Sizing & Exponent COCOMO II SEER-SEM PRICE-S Size Raw KSLOC New Lines of Code;
Pre-existing SLOC. Raw SLOC
Normalized size Equiv. new KSLOC New Lines of Code NEWD, NEWD, SLOC
Exponent PREC, FLEX, RESL,
TEAM, PMAT- or SEI rating
Scope COCOMO II SEER-SEM PRICE-S Hardware dev. in parallel with software
Not in the default model CPLX2
System Integration
19th International Forum on COCOMO and Software Cost Modeling

19th International Forum on COCOMO and Software Cost Modeling
6
10/07/2004
Model Analysis - Concept of “Ceterus Parabus”
Methodology to Extract Cost Driver Information
Parameter(e.g. Analyst Experience)
Cost
Other parametersheld constant
Slope = delta Cost/delta (Analyst Experience)
Range = Cost/(Analyst Experience)
19th International Forum on COCOMO and Software Cost Modeling

19th International Forum on COCOMO and Software Cost Modeling
7
10/07/2004
Model Analysis - Major COCOMO Cost Drivers
COCOMO II - Local Impact (about Baseline, +/- 1 setting)
- 0.20 0.40 0.60 0.80 1.00 1.20 1.40 1.60
STOR=Nom
SECU = High
SCED= Nom
RELY= VHigh
PLEX= Nom
LTEX= Nom
TOOL=Nom
DOCU= Nom
SITE= Low
APEX = High
PCON= Nom
TIME= XHigh
DATA= High
CPLX= XHigh
RUSE= Nom
PCAP= Nom
PVOL= Nom
ACAP = High
Environmental Factors
19th International Forum on COCOMO and Software Cost Modeling

19th International Forum on COCOMO and Software Cost Modeling
8
10/07/2004
Model Analysis - Major SEER-SEM Cost Drivers
SEER-SEM 7.0
0% 10% 20% 30% 40% 50% 60% 70% 80%
Specif ication Level Reliability= “Hi”
LanguageType = “Nom”
Programmers Language Experience = “Nom”
Multiple Site Development= “VHi”
Process Volatility= “Nom+”
Automated Tool Use = “Nom+”
Modern Development Practices Use = “Hi-“
Requirements Volatility= “Hi”
Programmer Capabilities = “Nom”
Analyst Capabilities = “Nom+”
Analyst Applic. Experience = “Nom”
Security Requirements= “Nom+”
Local Impact, Percentage
19th International Forum on COCOMO and Software Cost Modeling

19th International Forum on COCOMO and Software Cost Modeling
9
10/07/2004
Model Analysis - Major PRICE-S Cost Drivers
PRICE-S - Local Range
- 0.50 1.00 1.50 2.00
CPLX1-Tools= -0.1, CPLX1-Req.+new Lang. = 0
CPLX1 -product familiarity
PLTFM = 1.8
CPLXM=1.2
PROFAC= 6.5
INTEGI-timing= 0.7,INTEGE-timing=0.7,UTIL=0.5,APPL=8.46
INTEGI-Team=0.70, INTEGE-Team= 0.70, CPLX1-person.= -
0.2
Productivity Factors
19th International Forum on COCOMO and Software Cost Modeling
19th International Forum on COCOMO and Software Cost Modeling
10
10/07/2004
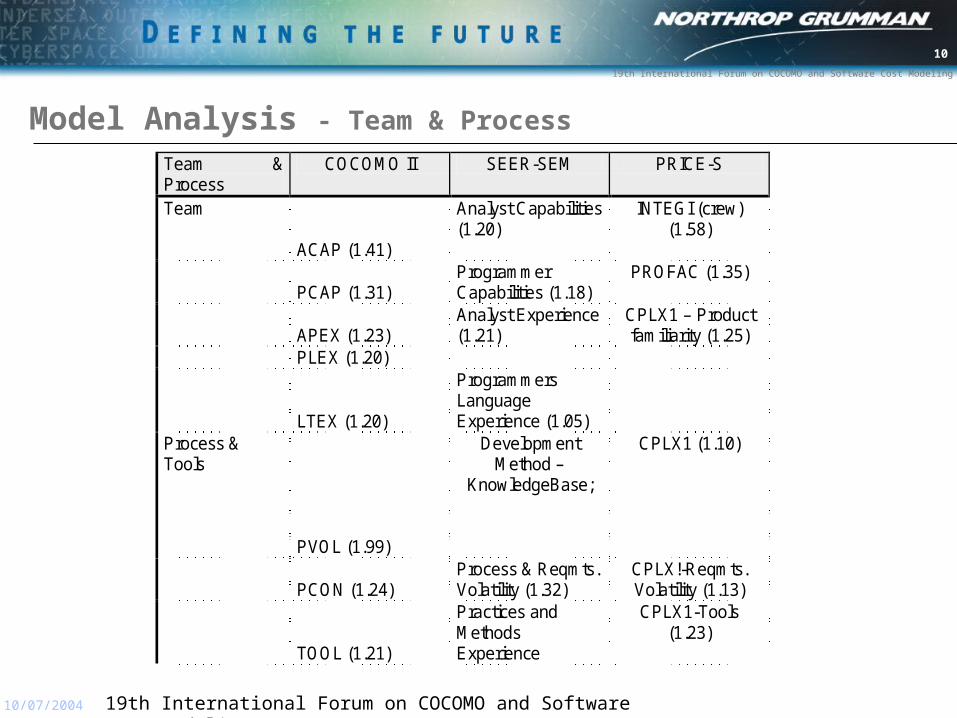
Model Analysis - Team & ProcessTeam & Process
COCOMO II SEER-SEM PRICE-S
Team
ACAP (1.41)
Analyst Capabilities (1.20)
INTEGI (crew) (1.58)
PCAP (1.31) Programmer Capabilities (1.18)
PROFAC (1.35)
APEX (1.23)
Analyst Experience (1.21)
CPLX1 – Product familiarity (1.25)
PLEX (1.20)
LTEX (1.20)
Programmers Language Experience (1.05)
Process & Tools
PVOL (1.99)
Development Method –
KnowledgeBase;
CPLX1 (1.10)
PCON (1.24)
Process & Reqmts. Volatility (1.32)
CPLX!-Reqmts. Volatility (1.13)
TOOL (1.21)
Practices and Methods Experience
CPLX1-Tools (1.23)
19th International Forum on COCOMO and Software Cost Modeling

19th International Forum on COCOMO and Software Cost Modeling
11
10/07/2004
Model Analysis - Market
Market COCOMO II SEER-SEM PRICE-S Market RUSE (1.31) SITE (1.22) CPLXM (1.2) SECU (1.10) Security
Requirements(1.75)
Schedule SCED (1.14) Required Schedule;
Start Date DSTART, PEND
Reliability RELY (1.15) Requirements
Definition Formality; (part of Platform,
Application -Kbase)
(part of PLTFM)
Certification requirements
DOCU (1.22) Development Standard -
Kbase
19th International Forum on COCOMO and Software Cost Modeling

19th International Forum on COCOMO and Software Cost Modeling
12
10/07/2004
Model Analysis - Complexity
Complexity COCOMO II SEER-SEM PRICE-S Complexity CPLX (1.30)
Application (Kbase) APPL
DATA (1.28) UTIL STOR (1.05) INTEGI (Timing.
Coupling) (1.55) Operating Environment & Technology
TIME (1.26) Platform; and DevelopmentMethod -
KnowledgeBase
PLTFM (1.25)
19th International Forum on COCOMO and Software Cost Modeling
19th International Forum on COCOMO and Software Cost Modeling
13
10/07/2004
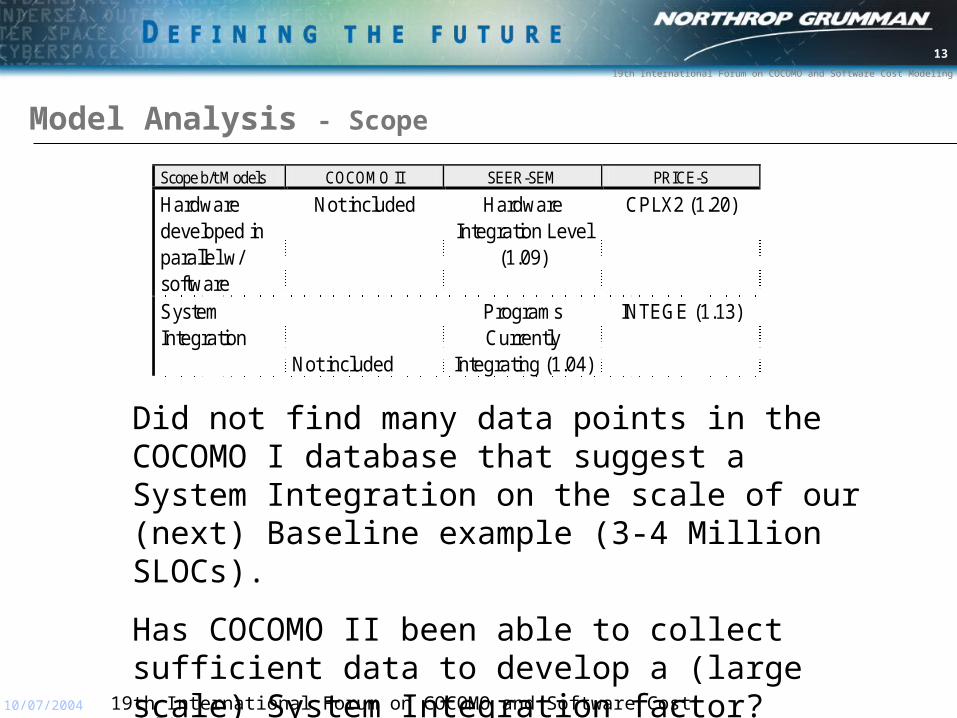
Model Analysis - Scope
Scope b/t Models COCOMO II SEER-SEM PRICE-S
Hardware developed in parallel w/ software
Not included Hardware Integration Level
(1.09)
CPLX2 (1.20)
System Integration
Not included
Programs Currently
Integrating (1.04)
INTEGE (1.13)
Did not find many data points in the COCOMO I database that suggest a System Integration on the scale of our (next) Baseline example (3-4 Million SLOCs).
Has COCOMO II been able to collect sufficient data to develop a (large scale) System Integration factor?
19th International Forum on COCOMO and Software Cost Modeling

19th International Forum on COCOMO and Software Cost Modeling
14
10/07/2004
Model Analysis - Economic Properties(Models Exponents Indicate Diseconomies of Scale for Large Projects)
COCOMO, SEER-SEM, PRICE-S
-
2,000
4,000
6,000
8,000
10,000
12,000
14,000
16,000
18,000
20,000
0 100 200 300 400 500 600 KSLOC
Eff
ort
- P
ers
on
-Mo
nth
s
COCOMO
SEER-SEM
PRICE-S
y = 19.4 x 1.09
y = 15.1 x 1.12
y = 9.7 x 1.11
The COCOMO II exponent ranges from 0.91 to approximately 1.26 depending upon the Scale Factors.
19th International Forum on COCOMO and Software Cost Modeling
19th International Forum on COCOMO and Software Cost Modeling
15
10/07/2004
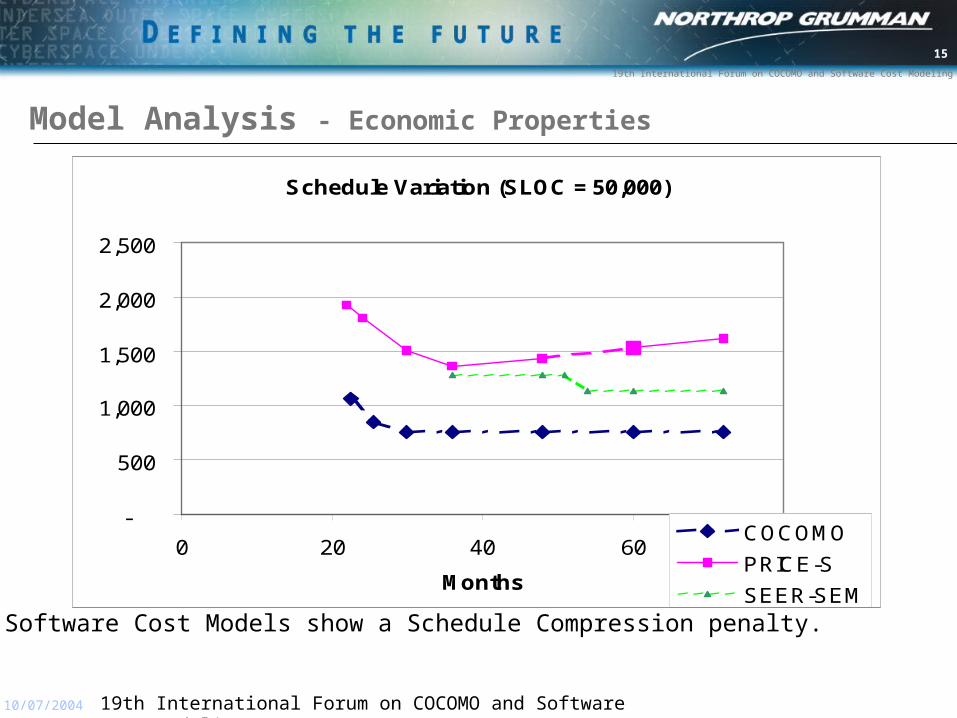
Model Analysis - Economic Properties
Schedule Variation (SLOC = 50,000)
-
500
1,000
1,500
2,000
2,500
0 20 40 60 80
Months
COCOMO
PRICE-S
SEER-SEM
All Software Cost Models show a Schedule Compression penalty.
19th International Forum on COCOMO and Software Cost Modeling
19th International Forum on COCOMO and Software Cost Modeling
16
10/07/2004
Baseline Example
• Illustrate Software Cost Estimation & Integration– Baseline
– SEER-SEM – Sensor Software– PRICE-S – Air Vehicle Software– COCOMO – Control Station
– Sizing Assumptions and Scenarios– Equivalent New SLOC
– Productivity Range– Hours/ SLOC
– Estimating Ranges using Monte Carlo– Hours = (SLOC) X (Hours/SLOC)
19th International Forum on COCOMO and Software Cost Modeling
19th International Forum on COCOMO and Software Cost Modeling
17
10/07/2004
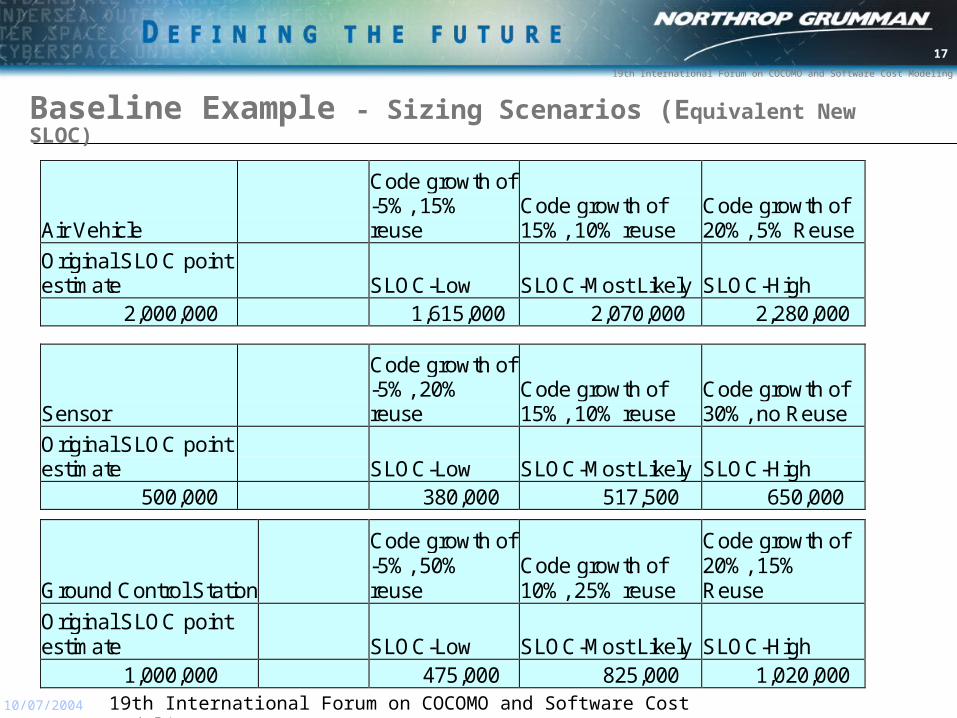
Baseline Example - Sizing Scenarios (Equivalent New SLOC)
Air Vehicle
Code growth of -5%, 15% reuse
Code growth of 15%, 10% reuse
Code growth of 20%, 5% Reuse
Original SLOC point estimate SLOC-Low SLOC-Most Likely SLOC-High 2,000,000 1,615,000 2,070,000 2,280,000
Sensor
Code growth of -5%, 20% reuse
Code growth of 15%, 10% reuse
Code growth of 30%, no Reuse
Original SLOC point estimate SLOC-Low SLOC-Most Likely SLOC-High 500,000 380,000 517,500 650,000
Ground Control Station
Code growth of -5%, 50% reuse
Code growth of 10%, 25% reuse
Code growth of 20%, 15% Reuse
Original SLOC point estimate SLOC-Low SLOC-Most Likely SLOC-High 1,000,000 475,000 825,000 1,020,000 19th International Forum on COCOMO and Software Cost Modeling

19th International Forum on COCOMO and Software Cost Modeling
18
10/07/2004
Baseline Example – Productivity Ranges- Productivity (Hours/SLOC)
PRODUCTIVITY (Hours/SLOC) Model
High Productivity
Medium Productivity Low Productivity
Air Vehicle PRICE-S 3.66
4.48 5.74 Sensor SEER-SEM 4.02 4.91 6.29 Ground Control Station COCOMO 3.32 4.06 5.20
COCOMO Assumptions:
COCOMO – Normalized to include Security, HW/SW integration, System Integration. This adds approximately 50% to the raw COCOMO II estimate. The EAF = 3.32 for the Gnd. Cntl. Stn. The Equivalent New SLOC = 825,000. The assumed module level was 50,000 SLOC. The internal integration = 1.05; the external integration = 1.11 for the “Medium Productivity” (COCOMO) setting.
19th International Forum on COCOMO and Software Cost Modeling
19th International Forum on COCOMO and Software Cost Modeling
19
10/07/2004
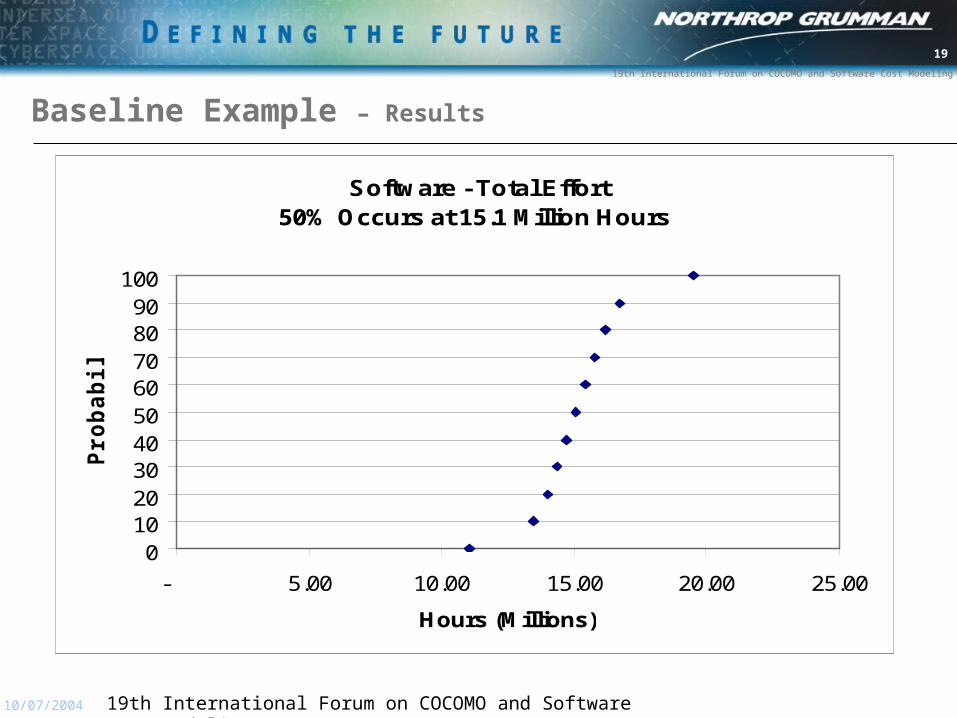
Baseline Example – Results
Software - Total Effort50% Occurs at 15.1 Million Hours
0102030405060708090
100
- 5.00 10.00 15.00 20.00 25.00
Hours (Millions)
Pro
bab
ilit
y
19th International Forum on COCOMO and Software Cost Modeling

19th International Forum on COCOMO and Software Cost Modeling
20
10/07/2004
Baseline Example – Air Vehicle, Hours = (Hours/SLOC) X SLOC
Probability SLOC, Thousands Hours/SLOC Hours, in Millions 0 1625 3.70 6.14
10 1794 4.07 7.83 20 1864 4.24 8.28 30 1914 4.37 8.59 40 1960 4.48 8.87 50 2002 4.61 9.16 60 2038 4.73 9.44 70 2071 4.87 9.76 80 2110 5.03 10.13 90 2164 5.22 10.64
100 2275 5.73 12.48
19th International Forum on COCOMO and Software Cost Modeling
19th International Forum on COCOMO and Software Cost Modeling
21
10/07/2004
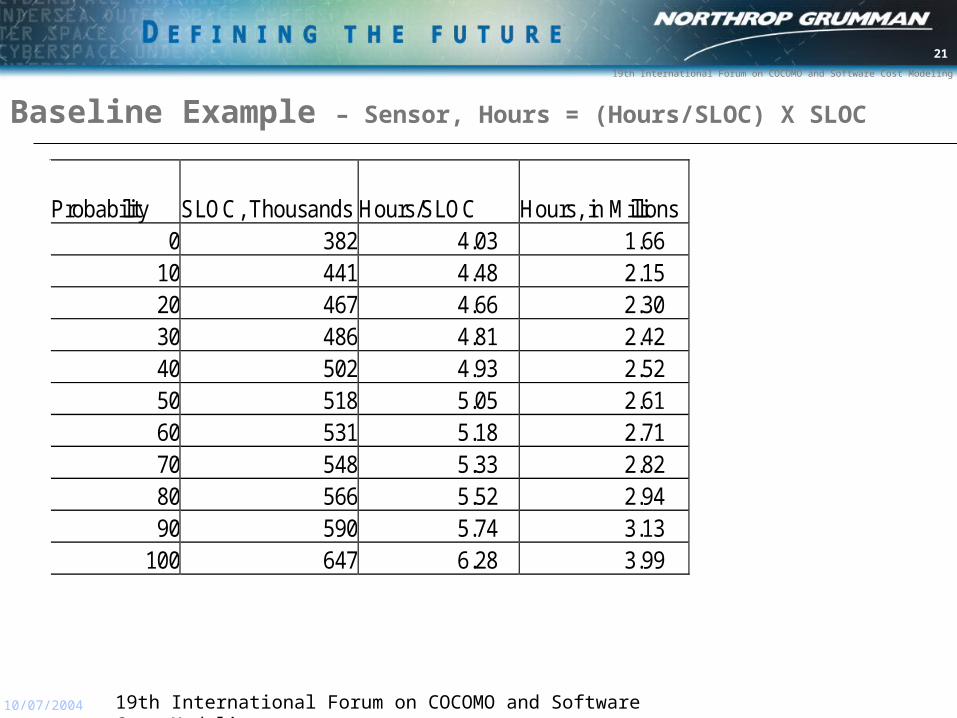
Baseline Example – Sensor, Hours = (Hours/SLOC) X SLOC
Probability SLOC, Thousands Hours/SLOC Hours, in Millions 0 382 4.03 1.66
10 441 4.48 2.15 20 467 4.66 2.30 30 486 4.81 2.42 40 502 4.93 2.52 50 518 5.05 2.61 60 531 5.18 2.71 70 548 5.33 2.82 80 566 5.52 2.94 90 590 5.74 3.13
100 647 6.28 3.99
19th International Forum on COCOMO and Software Cost Modeling
19th International Forum on COCOMO and Software Cost Modeling
22
10/07/2004
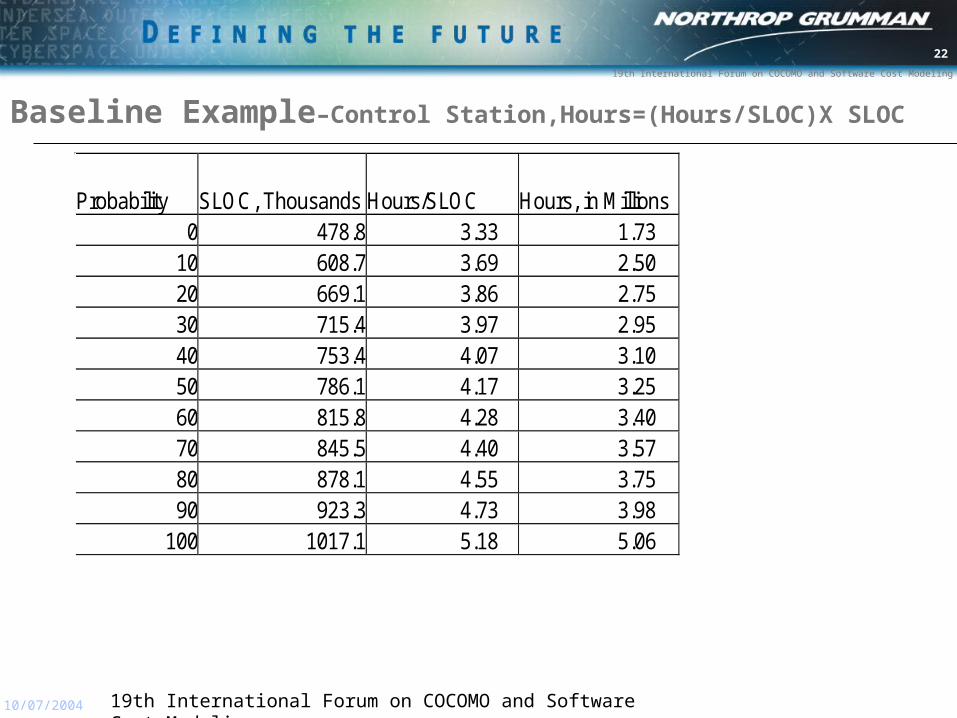
Baseline Example–Control Station,Hours=(Hours/SLOC)X SLOC
Probability SLOC, Thousands Hours/SLOC Hours, in Millions 0 478.8 3.33 1.73
10 608.7 3.69 2.50 20 669.1 3.86 2.75 30 715.4 3.97 2.95 40 753.4 4.07 3.10 50 786.1 4.17 3.25 60 815.8 4.28 3.40 70 845.5 4.40 3.57 80 878.1 4.55 3.75 90 923.3 4.73 3.98
100 1017.1 5.18 5.06
19th International Forum on COCOMO and Software Cost Modeling
19th International Forum on COCOMO and Software Cost Modeling
23
10/07/2004
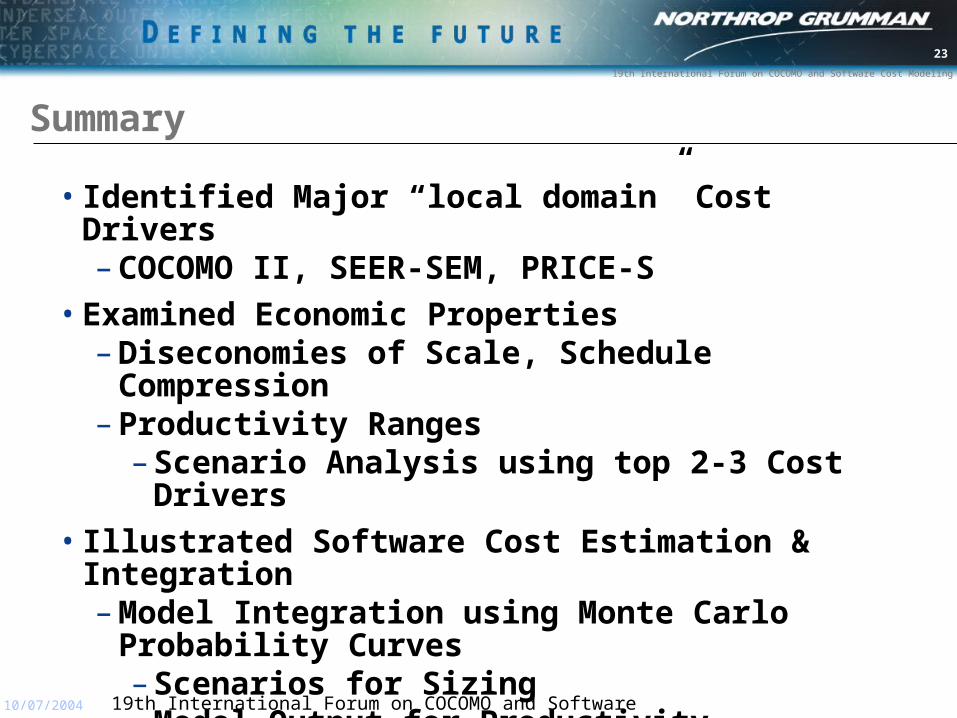
Summary
• Identified Major “local domain” Cost Drivers– COCOMO II, SEER-SEM, PRICE-S
• Examined Economic Properties– Diseconomies of Scale, Schedule Compression– Productivity Ranges
– Scenario Analysis using top 2-3 Cost Drivers
• Illustrated Software Cost Estimation & Integration– Model Integration using Monte Carlo Probability
Curves– Scenarios for Sizing– Model Output for Productivity
19th International Forum on COCOMO and Software Cost Modeling

19th International Forum on COCOMO and Software Cost Modeling
24
10/07/2004
Object Oriented Analysis (OOA)
• OOA– Unified Modeling Language (UML)
– Several Standard Diagrams– Starts with “Use Case” (users view of the world)– Develops charts including:
– Use Case (Actors use of information in the system)– Collaboration Diagrams (provide details of each Use Case)– Class Diagram
– Specify Blueprints (for objects) – Attributes and Methods– Relationship between Classes
– Objects are linked across a design– Object Interfaces
– Encapsulates Local Variables within a “Black Box”– Inheritance of Classes
19th International Forum on COCOMO and Software Cost Modeling
19th International Forum on COCOMO and Software Cost Modeling
25
10/07/2004
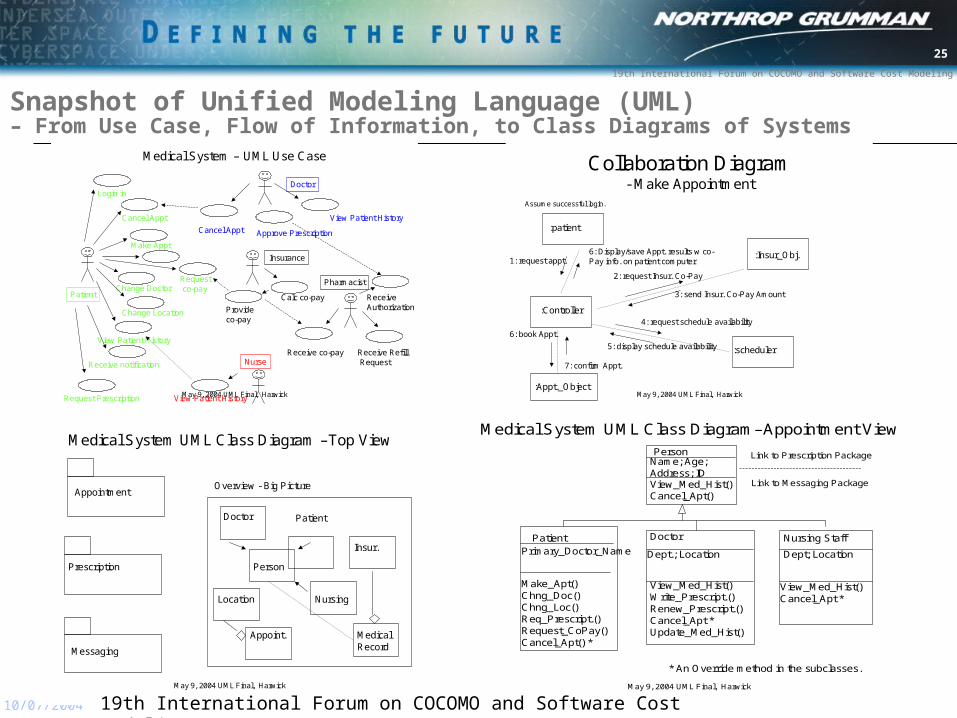
Snapshot of Unified Modeling Language (UML) – From Use Case, Flow of Information, to Class Diagrams of Systems
May 9, 2004 UML Final, Harwick
Medical System – UML Use Case
Login in
Make Appt
Approve PrescriptionCancel Appt
Cancel Appt
Change Doctor
Change Location
Request Prescription
View Patient History
View Patient History
View Patient History
Patient
Nurse
Doctor
Receive notification
Receive RefillRequest
Receive co-pay
Receive Authorization
Pharmacist
Provideco-pay
Insurance
Requestco-pay
Calc co-pay
May 9, 2004 UML Final, Harwick
Collaboration Diagram- Make Appointment
:patient
:scheduler
:Insur_Obj.
:Controller
1: request appt.
Assume successful login.
2: request Insur. Co-Pay
3: send Insur. Co-Pay Amount
4: request schedule availability
5: display schedule availability
:Appt._Object
6: book Appt.
7: confirm Appt.
6: Display/save Appt. results w co-Pay info. on patient computer
May 9, 2004 UML Final, Harwick
Medical System UML Class Diagram –Top View
Appointment
Messaging
Overview - Big Picture
Person
Doctor Patient
Location
Insur.
Nursing
Appoint. Medical Record
Prescription
May 9, 2004 UML Final, Harwick
Medical System UML Class Diagram–Appointment View
Doctor Nursing Staff
Dept.; Location
View_Med_Hist()Write_Prescript.()Renew_Prescript.()Cancel_Apt *Update_Med_Hist()
PersonName; Age;Address; IDView_Med_Hist()Cancel_Apt()
Dept; Location
View_Med_Hist()Cancel_Apt *
Link to Prescription Package
Link to Messaging Package
Patient
Make_Apt()Chng_Doc()Chng_Loc()Req_Prescript.()Request_CoPay()Cancel_Apt() *
Primary_Doctor_Name
* An Override method in the subclasses.
19th International Forum on COCOMO and Software Cost Modeling
19th International Forum on COCOMO and Software Cost Modeling
26
10/07/2004
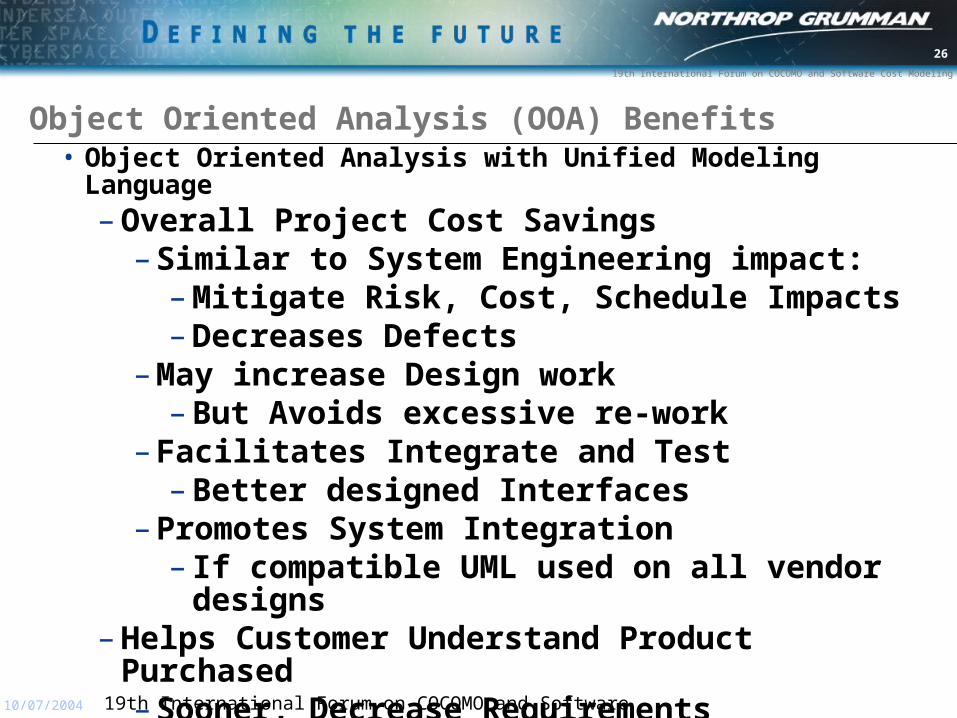
Object Oriented Analysis (OOA) Benefits• Object Oriented Analysis with Unified Modeling Language
– Overall Project Cost Savings– Similar to System Engineering impact:
– Mitigate Risk, Cost, Schedule Impacts– Decreases Defects
– May increase Design work– But Avoids excessive re-work
– Facilitates Integrate and Test – Better designed Interfaces
– Promotes System Integration – If compatible UML used on all vendor designs
– Helps Customer Understand Product Purchased– Sooner, Decrease Requirements Volatility
– Need Data to Measure impact of OOA (UML)19th International Forum on COCOMO and Software Cost Modeling

19th International Forum on COCOMO and Software Cost Modeling
27
10/07/2004
References• Models:• Price Systems, PRICE-S model, Los Angeles, California,
1996.• Galorath Associates, SEER-SEM, Los Angeles, California,
1996.• USC Associates, COCOMO II.1999, Los Angeles, California,
2004.
• Books:• 1. Boehm, Reifer, et al., Software Cost Estimation with
COCOMO II, Prentice-Hall, New Jersey, 2000. • 2. Boehm, Barry W., Software Engineering Economics,
Prentice-Hall, New Jersey, 1981.• 3. Deming, W. Edward, Out of the Crisis, Massachusetts
Institute of Technology, Cambridge, 1982.• 4. Cs3 Inc., Objected Oriented Analysis Using the Unified
Modeling Language, (UML), Los Angeles, CA, 2000-2003.
19th International Forum on COCOMO and Software Cost Modeling


![COCOMO-1 Only] [Compatibility Mode]](https://cdn.vdocument.in/doc/165x107/577d27aa1a28ab4e1ea47e2f/cocomo-1-only-compatibility-mode.jpg)


