
Integrative agroforestry science: reflections and perspectives
Meine van Noordwijk24-01-2017

I. Theory of Place, pantropical extrapolation domains and the places where we work
II. Who cares about ‘evidence’? Political ecology, behavioural economics, change as it happens
III. Social-Ecological Systems: are efforts to remove ‘endogeneity’ from ‘impacts’ futile?
IV. Supporting learning, self-selection, IDC’s, bottom-up actions
V. ‘Cool trees’ the start and end of all agroforestry research
10 Building blocks:• Tree cover transitions• TiF, ToF and ToToF• Three AF paradigms• ToC, ToP, ToIC• Three knowledge
systems: LEK, MEK, PEK• Boundary work, NSS• Options, Contexts, Issues
& Goals• 17 SDG’s 30 years after
Brundtland• Yield & efficiency gaps:
Land Equivalent Ratios• Diversity deficits

A. Theory of Place B. Theory of change
C. Theory of induced change
Core Logged-over Secondary & Grassland Annual Mosaic landscape of agro-forest forest agro-forest & shrubs crops forestry, plantations, crops orchards, woodlots, homes
Tree
bas
al a
rea,
carb
on st
ock
Degr
adati
onDefores-tation
Agro-/Re-forestation
Drivers, land use changeDemography (migration)
Logging, forest manage- ment (For)Agricultural (Ag) expan- sionPlantation developmentAgricultural de/re-treeingAgroforestation(Peri)urban (Ur) re-treeing
% T
ree
cove
r
Log (Human Pop)Ag
Ur
For
% F
ores
t cov
er
Time
Nat Planted
Changes of awareness, monitoring, analysis of options and scenariosChanges of land (use) rights, regulations of conversion, agricultural & urban planningChanges in economic incentives, market demand, profitability, taxation, certification Actors
Ecosystem (dis)services
PeopleMarkets
Operational forest definition
venti
ons
Inte
r-
Trees out-side forest}

Building blocks:• Tree cover transitions• TiF, ToF and ToToF• Three AF paradigms• ToC, ToP, ToIC• Three knowledge
systems: LEK, MEK, PEK• Boundary work, NSS• Options, Contexts, Issues
& Goals• 17 SDG’s 30 years after
Brundtland• Yield & efficiency gaps:
Land Equivalent Ratios• Diversity deficits
How much agroforestry is there? Where is it?
http://blog.worldagroforestry.org/index.php/2013/04/08/tif-tof-and-totof-trees-or-universal-tree-rights/
Outside forestInside forest Outside trees
outside forest

Zomer et al. 2016
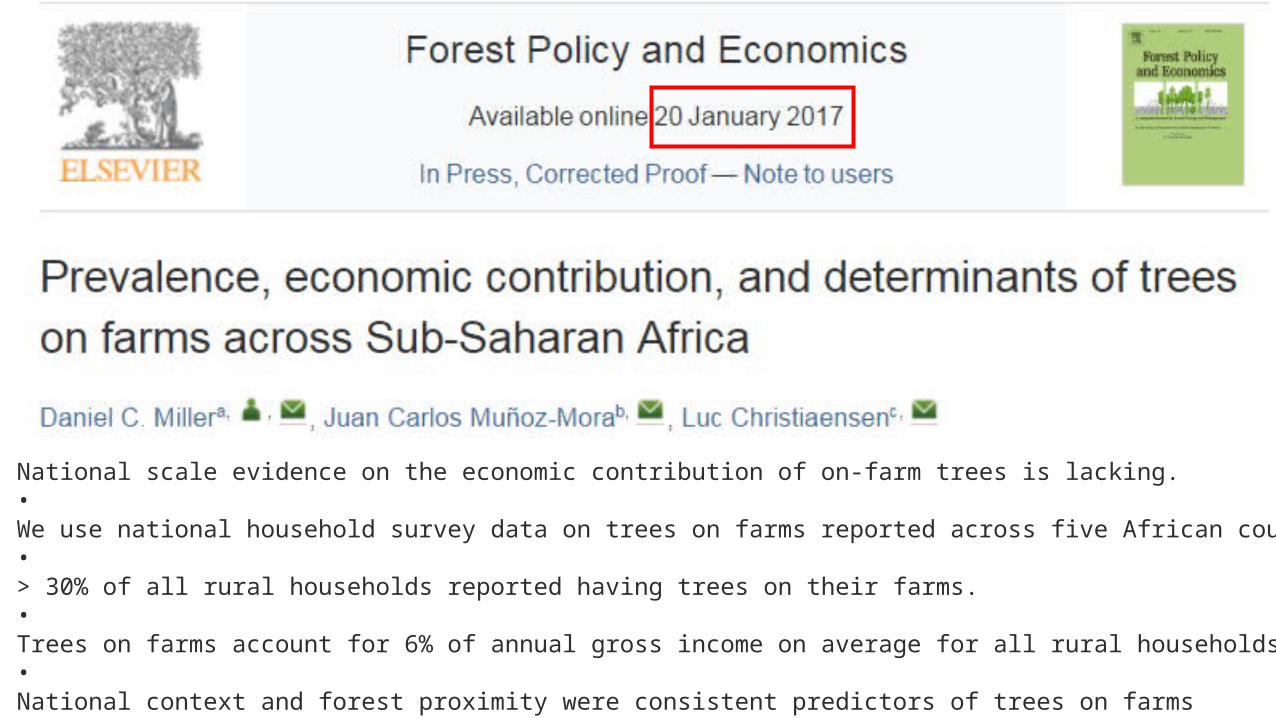
National scale evidence on the economic contribution of on-farm trees is lacking.•We use national household survey data on trees on farms reported across five African countries.•> 30% of all rural households reported having trees on their farms.•Trees on farms account for 6% of annual gross income on average for all rural households.•National context and forest proximity were consistent predictors of trees on farms

Investment, marketsIncentives
Capacitydevelop-ment
Motivation
Land use governance
RightsInputs & technology
Know-how
12
3
SDG
Agroforestry_1A set of specific practices that combine trees, crops and/or livestock and aims for positive interactions.
Primary task as ‘council’: documentation, inventory, capacity development, participatory D&D.
Shift towards ‘research centre’ with tree improve-ment, technology testing, agroforestry systems
taungya
AF systems
Building blocks:• Tree cover transitions• TiF, ToF and ToToF• Three AF paradigms• ToC, ToP, ToIC• Three knowledge
systems: LEK, MEK, PEK• Boundary work, NSS• Options, Contexts,
Issues & Goals• 17 SDG’s 30 years after
Brundtland• Yield & efficiency gaps:
Land Equivalent Ratios• Diversity deficits
Investment, marketsIncentives
Capacitydevelop-ment
Motivation
Land use governance
RightsInputs & technology
Know-how
12
3
SDG
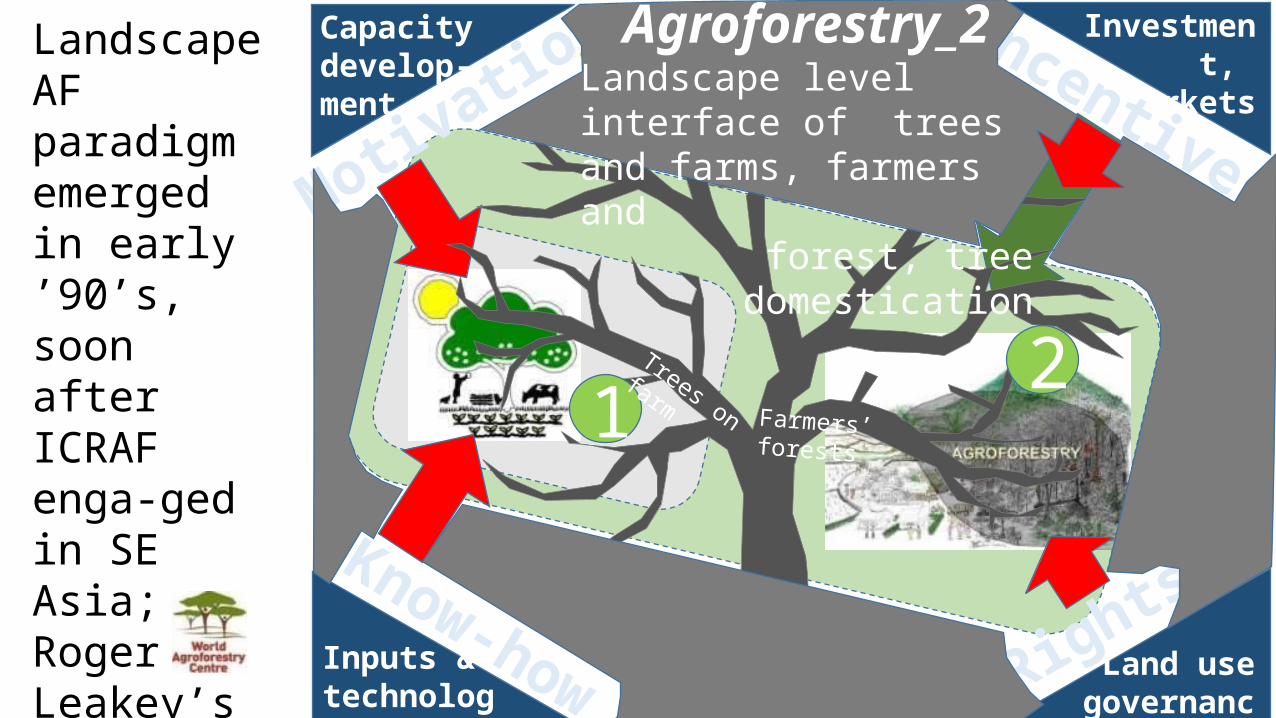
Agroforestry_2Landscape level interface of trees and farms, farmers and
forest, tree domestication
Forest use rights ecosystem services (ES), markets for tree products
Trees on farm Farmers’ forests
Landscape AF paradigm emerged in early ’90’s, soon after ICRAF enga-ged in SE Asia; Roger Leakey’s AF definition; ASB hypo-theses

Investment, marketsIncentives
Capacitydevelop-ment
3
Land use governance
Rights
12
Agro+Forestry policiesInputs & technology
Know-how
taungya
Trees on farm Farmers’ forests
Landscape approaches
Green growth
AF polic
y
SDG
MotivationA further step is the ‘agro-plus-forestry’ concept of all interactions and inter-faces, offer-ing integra-tion where policies got segregated

Building blocks:• Tree cover transitions• TiF, ToF and ToToF• Three AF paradigms• ToC, ToP, ToIC• Three knowledge
systems: LEK, MEK, PEK• Boundary work, NSS• Options, Contexts, Issues
& Goals• 17 SDG’s 30 years after
Brundtland• Yield & efficiency gaps:
Land Equivalent Ratios• Diversity deficits
Theory of change (ToC)Theory of change (ToC)Change of theory Theory of change of theory of change…
Theory of induced change (ToIC) Choices among options in context targeting explicit goalsTheory of place (ToP)
Place of theory Theory of place of theory of change… ’learning’
Theory of everything
Theory of anything

\\\\\
Tradeoff Innovationanalysis
Monitoring Platforms for change change
Conse- Scena-quences rios
Place\
GlobalNational
SubnationalLandscapeCommunityHouseholdIndividual
Actio
n
Changecontext options
A. D
iagn
osis
(con
text
)
B. In
nova
tion
(opti
ons)
C. A
ction

Local Ecological Knowledge
ModellersEcologicalKnowledge
http://www.millenniumassessment.org/ma/ASB-MA_statusreport_ver5.0.pdf
Building blocks:• Tree cover transitions• TiF, ToF and ToToF• Three AF paradigms• ToC, ToP, ToIC• Three knowledge
systems: LEK, MEK, PEK• Boundary work, NSS• Options, Contexts, Issues
& Goals• 17 SDG’s 30 years after
Brundtland• Yield & efficiency gaps:
Land Equivalent Ratios• Diversity deficits
Public/PolicyEcologicalKnowledge

Building blocks:• Tree cover transitions• TiF, ToF and ToToF• Three AF paradigms• ToC, ToP, ToIC• Three knowledge systems:
LEK, MEK, PEK• Boundary work, • NSS• Options, Contexts, Issues &
Goals• 17 SDG’s 30 years after
Brundtland• Yield & efficiency gaps:
Land Equivalent Ratios• Diversity deficits
Cross-generational
transfer & education
Cultural, religious, philosophicaltraditions
Praxis & tech-nology
Politics of identity, cultural, gen-der & age differentiation
Taxonomic & explanatory knowledge, wisdom
Local know-ledge
Geographi-cal sciences
Social sciences
Ecological sciences
Biologicalsciences
Techno-logical sciences
Agronomical and forestry sciences
System analysis & decision scienceSustainability & global change sciences
Economic sciences
Legal and poli-tical sciences
Scientific & modellers’knowledge
Health, education & social development
Infractructure & eco-nomic development
Land use planning and resource access
National legislation & implementation
guidelines
Public discourse & deba-te ~ emerging issues
International conventions & millennium/sustainable development goals
Public/policyknowledge
K2ARecognition Innovation
Value Investment
RespectCarrots, sticks & sermons

#4 #3
#1
#5
#6
#2
Nested scales decisions
#1 Evidence of urgency: issues and goals #2 Evidence for a portfolio of options in context #3 Willingness to act: sovereignty, ownership #4 Overcoming vested interest: transparency #5 Ability to act: means of implementation #6 Options for bottom-up, empowered, continued innovation: agility sustained
The national agroforestry policy of India: experiential learning in development and
delivery phasesVirendra Pal Singh, Rakesh Bhushan Sinha, Rita Sharma,
Devashree Nayak, Henry Neufeldt, Meine van Noordwijk and Javed Rizvi. World Agroforestry Centre (ICRAF)
Working paper 234 New Delhi (India)
Engaging with national policy reform: where and how can “evidence” help?

Goals
Contexts
Issue
s
Optio
ns
Polic
y
Science
Adaptive, learning
loops
2. A
naly
sis o
f iss
ues,
trad
eoffs
Income, food, energy, water, climate, biodiversity
Education, gender, inequity, conflict, cooperation
5. Communicate, platforms for change
1. Monitor, observe
3. Innovate4. Strategize, use scenarios
.
.
.
.
.
.
.
.
.
evidence
questions
At m
ultip
le, n
este
d sc
ales
6. Agency, decisions
Building blocks:• Tree cover transitions• TiF, ToF and ToToF• Three AF paradigms• ToC, ToP, ToIC• Three knowledge
systems: LEK, MEK, PEK• Boundary work, NSS• Options, Contexts, Issues
& Goals• 17 SDG’s 30 years after
Brundtland• Yield & efficiency gaps:
Land Equivalent Ratios• Diversity deficits

Enab
ling All
lan
d us
es
Nexus
Fairn
ess +
effi
cien
cy Income
Food
Water
EnergyClimate&
Biodiversity
1987
1992Safeguards
Cobenefits
Separate Rio conventions
UN a
gend
a 20
30: 1
7 Su
stai
nabl
e De
velo
pmen
t Goa
ls, a
dopt
ed in
201
5
Every step in UNFCCC has to deal with “cobenefits” and “safeguards”
30 years ago

Agroforestry buf-fering from cli-mate extremes, basis for adapta-tion + net emis-sion reduction
Agroforestry as ‘green growth’ option, shift to service-based economy
Agroforestry balancing productivity, local needs (diversity) & market-based food security
Agroforestry buffering water flows, riparian integrity, mangroves
(Peri)Urban trees, pro-tective (agro) forests, bio-energy
Agroforestry as source of ecosystem services and protecting biodiversityAg
rofo
rest
ry re
duci
ng a
g f
ores
t con
flict
s, e
nhan
cing
equ
ity
gg
g
g
g
g
g
1. End poverty in all its forms everywhere2. End hunger, achieve food security and improved nutrition and
promote sustainable agriculture3. Ensure healthy lives and promote well-being for all at all ages4. Ensure inclusive and equitable quality education and promote
lifelong learning opportunities for all5. Achieve gender equality and empower all women and girls6. Ensure availability and sustainable management of water and
sanitation for all7. Ensure access to affordable, reliable, sustainable and modern
energy for all8. Promote sustained, inclusive and sustainable economic growth,
full and productive employment and decent work for all9. Build resilient infrastructure, promote inclusive and sustainable
industrialization and foster innovation10. Reduce inequality within and among countries11. Make cities and human settlements inclusive, safe, resilient and
sustainable12. Ensure sustainable consumption and production patterns13. Take urgent action to combat climate change and its impacts14. Conserve and sustainably use the oceans, seas and marine
resources for sustainable development15. Protect, restore and promote sustainable use of terrestrial
ecosystems, sustainably manage forests, combat desertification, and halt and reverse land degradation and halt biodiversity loss
16. Promote peaceful and inclusive societies for sustainable development, provide access to justice for all and build effective, accountable and inclusive institutions at all levels
17. Strengthen the means of implementation and revitalize the global partnership for sustainable development
http://www.worldagroforestry.org/region/sea/publications/detail?pubID=3479
SDG synergy in local context
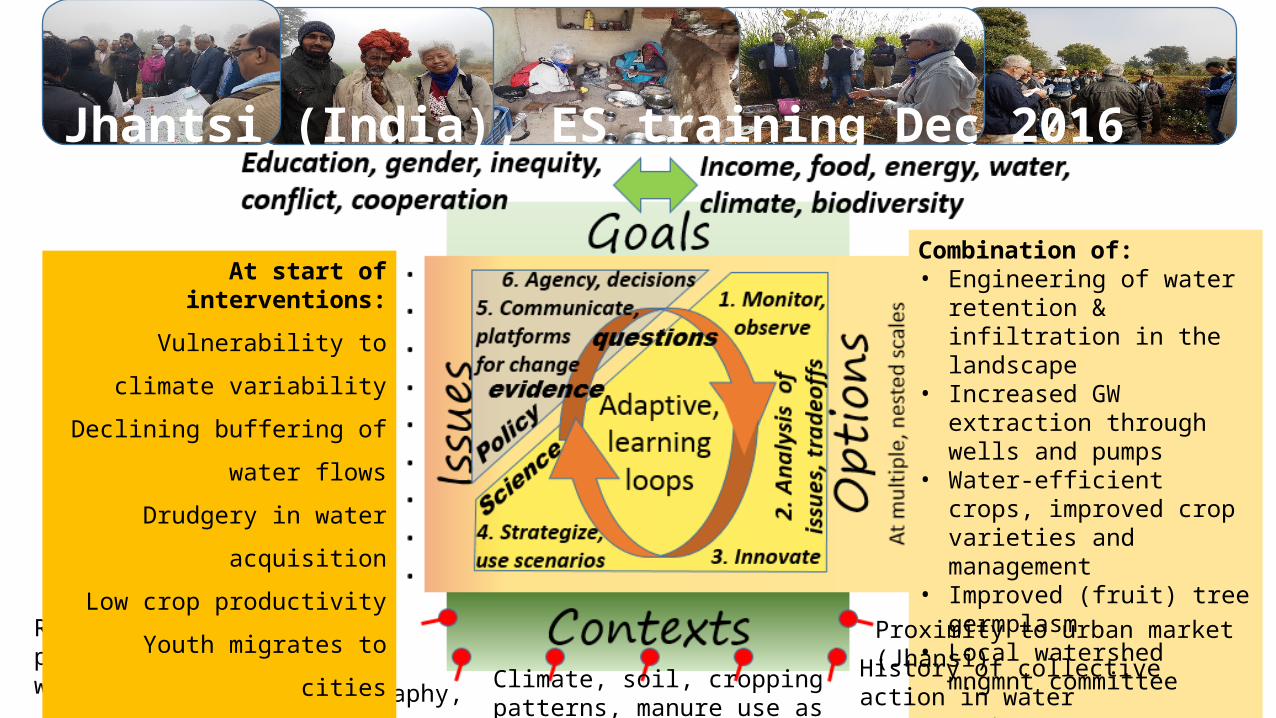
Combination of:• Engineering of water retention
& infiltration in the landscape• Increased GW extraction
through wells and pumps• Water-efficient crops,
improved crop varieties and management
• Improved (fruit) tree germplasm
• Local watershed mngmnt committee
Proximity to urban market (Jhansi)
History of collective action in water management
Rocky outcrops with low productivity, source of water harvesting
Social structure, demography, expectations Climate, soil, cropping patterns, manure use as fuel, livestock
At start of interventions:
Vulnerability to climate variability
Declining buffering of water flows
Drudgery in water acquisition
Low crop productivity
Youth migrates to cities
Social capital declining
Low diversity of local food supply
Jhantsi (India), ES training Dec 2016

Green growth SDG: jobs!
Peace,People, Poverty
Jobs(livelihoods)
Tax and consumer spending
Envi-ron-
ment
Investment .
Adjusted GDP-growth
Fiscal policy
International markets International conventions
FN
H, S,I
Basic model of a national economy with policy leverage domains
Righ
ts &
res-
pons
ibili
ties
Gree
n Ec
onom
y?

Global climate (net of fossil car-bon emissions, other GHG + ΔC stock, land and
ocean feedbacks) SDG16
Jobs in mining (resource extraction)
Jobs in forest extraction
Jobs in plantationsJobs in agriculture
Jobs in manufacture
Jobs in services (incl. trade, transport, health
education, tourism)
Green jobs (in natural resource management, renewable energy)
Natural capital & Biodiversity (incl. forests, oceans,
fresh water, energy stocks)
Human. capital.Fixed assets
Adjusted GDP-growth
Education & health expenditure
International markets & investment International conventions
Demography, Equity (access, endowments), Transparency, Identity, Peace Ri
ghts
& re
s-po
nsib
ilitie
s
N
SI
Empl
oym
ent ~
skill
s ~
heal
th &
food
, wat
er,
ener
gy se
curit
y
Subs
isten
ce,s
elfr
elia
nt li
velih
oods
HInfrastructure investment
Social safetynet expenditureSustainable Development Goals (SDGs): 1. End poverty; 2. End hunger; 3. Health and well-being; 4. Quality education; 5. Gender equality; 6. Water and sanitation for all; 7. Sustainable energy; 8. Decent work for all; 9. Technology to benefit all; 10. Reduce inequality; 11. Safe cities; 12. Responsible consumption; 13. Stop climate change; 14. Protect the ocean; 15. Take care of the earth; 16. Live in peace; 17. International partnership and means of implementation
Tax and consumer spending
SDG4 SDG
5
SDG6
SDG10
SDG11
SDG13
SDG15
SDG17
SDG10
SDG5
SDG7
SDG8
SDG12
SDG3
Fiscal policy: Investment in
renewables and human capital
Crowding in pri-vate investments
Taxing negative externalities
Quality of spen-ding
F
SDG1
SDG2
SDG9
SDG14
ΔClim
ΔES

Building blocks:• Tree cover transitions• TiF, ToF and ToToF• Three AF paradigms• ToC, ToP, ToIC• Three knowledge
systems: LEK, MEK, PEK• Boundary work, NSS• Options, Contexts, Issues
& Goals• 17 SDG’s 30 years after
Brundtland• Yield & efficiency gaps:
Land Equivalent Ratios• Diversity deficits

Can intensification reduce emission intensity of biofuel through optimized fertilizer use? Theory and the case of oil palm in Indonesia.
Footprints are minimized at around 80% of attainable yield

LERMs = ɣP ∑i Pi /Pi,ref + ɣR ∑j Rj /Rj,ref + ɣC ∑k Ck /Ck,ref
Societal weighting of provisioning
services
With• Pi , Rj and Ck be the attainment (in any metric) of a range of provisioning (P),
regulating (R) and Cultural (C) services provided by a landscape• Pi,ref ,Rj,ref and Ck,ref be the attainment (in the same metric) of such services in a
landscape optimized for that specific service (often a ‘monoculture’)• ɣP,i , ɣR,j and ɣC,k be a weighting function for the importance of the three
groups of ecosystem services
LERM as the “Land Equivalent Ratio for Multifunctionality” indicates the efficiency of the tested configuration. If LERM > 1 the mixed system spares land relative to a segregated mosaic of monofunctional land uses.
Societal weighting of
regulating services
Societal weighting of
cultural services
Plot-to-landscape scale metric for multifunc-tional land use
Current vs reference
services per unit land
Current vs reference
services per unit land
Current vs reference
services per unit land

LERMs = ɣP ∑i Pi /Pi,ref + ɣR ∑j Rj /Rj,ref + ɣC ∑k Ck /Ck,ref
Societal weighting of provisioning
services
Societal weighting of
regulating services
Societal weighting of
cultural services
Plot-to-landscape scale
Current vs reference
services per unit land
Current vs reference
services per unit land
Current vs reference
services per unit land
• “Yield gap” complements a special reduced form of LERM: only considering a single P, using as Pref the potential and/or attainable yield, and ignoring other services provided by a unit of land: Yield gap = 1 - LERM
Includes water infiltration, GHG emissions

Building blocks:• Tree cover transitions• TiF, ToF and ToToF• Three AF paradigms• ToC, ToP, ToIC• Three knowledge
systems: LEK, MEK, PEK• Boundary work, NSS• Options, Contexts, Issues
& Goals• 17 SDG’s 30 years after
Brundtland• Yield & efficiency gaps:
Land Equivalent Ratios• Diversity deficits
Institution and human
decisions
Biophysical structure or
process
• Natural forest• Complex
multistrata agroforest
• Simple agroforest• Simple-shade
practices• Conservation
agriculture • Alley cropping• Monocropping
Function- Produce food
and commodity
- Manage water flows
- Provide habitat and corridors for flora and fauna
- Etc.
Service-Provisioning-Regulating-Habitat -Cultural and amenity (agro-tourism)
Human wellbeing(socio-cultural context)
Benefit(food, raw material, clean(er) water, better water regulation, wildlife habitat and corridor
Value (economic)
(commodity price, premium price for organic products, incentives for agri-ecosystem services)
Ecosystems and Biodiversity
Feedback between value perception and use of ecosystem services
Management/ Restoration
The use of services usually affect the underlying biophysical sources and processes Modified from Braat and De Groot (2012)

Diversity deficits:
Villamor, G.B., Van Noordwijk, M., Le, Q.B., Lusiana, B., Matthews, R., Vlek, P.L., 2011. Diversity deficits in modelled landscape mosaics. Ecological Informatics 6: 73-82.
Four interpretations: 1) What we don’t know might as well not exist,2) In the real world where actual diversity is less
than a potential state that is deemed desirable (hence we worry about loss of biodiversity and cultural diversity);
3) In oversimplified modelling of the real world and describing its rules and policies
4) In our recognition of the driving forces that are used to construct models and design policy responses.
Diversity of ecological contexts
Diversity of social contexts Diversity of actors
Diversity of land use decisions
Diversity of ecological responses
Diversity of social-ecological consequences & feedbacks
Diversity of diversity indices

Approximately 100,000 species of trees (1/4 of total plants), spread over ~ 250 plant families (woody perennials in 6 of 11 divisions of Chloroplastida: Angiospermae, (incl. monocots, eudicots), Magnoliophyta, Gnetophyta, Pinophyta (=Coniferae), Cycadophyta, Pteridophyta)
Trees are not a taxonomic entity, but a life form choice in many families
You & me
Animal diversity is dominated by beetles
Genetic diver-sity concepts have shifted substantially in recent decade(s)

Biodiversity paradox:Urban consumers have more and more choice of foods, derived from farms that get less and less diverse
Shop-keeping unit (SKU) diversity far exceeds landscape biodiversity

I. Theory of Place, pantropical extrapolation domains and the places where we work
http://www.millenniumassessment.org/ma/ASB-MA_statusreport_ver5.0.pdf
FTA Sentinel Landscapes

Theory of Place depends on scale, e.g. Indonesia as a country is a point in the centre of the curve, but zooming in to district scale it displays the full spectrum
van Noordwijk, M. and G.B. Villamor. 2014. Tree cover transitions in tropical landscapes: hypotheses and cross-continental synthesis. GLPnews, 10: 33-37. (Open Acess)

Archeological sites & forest monitoring plots are both determined by ‘accessibility’
Forest plot evidence for continued C sequestration may be response to past disturbance


0 1 2 3 4 5 6 7 8 9100.001
0.010
0.100
1.000Tropical timber (trade)Coffee (prod.)Rubber (prod.)Cacao (prod.)Palm oil (prod.)
Country rank
Frac
tion
of g
loba
l val
ue
Roundwood exports
Based on FAO-Stat data for 2014

20% tree cover in areas with highest human population density
Dewi et al. in review
Deforestation ~ demography
‘Pure agriculture’ vs
mosaic landscapes
Stages of tropical tree cover transi-tions at sub-watershed level

Water tower configuration (~ Arabica coffee) has high
human population and major ‘issues’ with
downstream effects of forest loss
(Per)Humid has relatively low human population density
Extrapolation domains for studies relating people, forests and tree crops: validity of a tropical landscapes portfolio Sonya Dewi1,*, Meine van Noordwijk1,2, Muhammad Thoha Zulkarnain1, Adrian Dwiputra1, Glenn Hyman3, Terry Sunderland4, Ravi Prabhu1, Vincent Gitz4 and Robert Nasi4


Stage 6 (urban) under-. Stage 5 overrepresented

The portfolio of sentinel landscapes of the Forests, Trees and Agroforestry (FTA) research program provides a 5% sample of area, 8% of people, 9% of tree cover and 10-12% of potential tree crop presence across the tropics, with quantified biases
across zones, transition stages and HDI.

II. Who cares about ‘evidence’? Political ecology, behavioural economics, change as it happens
Active dis-information
Bdaryounwork

On which picture do you see more people?
20 Jan 2017
21 Jan 2017
Fact-free politics//Disinformation
Kellyanne Conway denies Trump press secretary lied: ‘He offered alternative facts’

“evidence is provided that it is possible to pre-emptively protect (“inoculate”) public attitudes
about climate change against real-world misinformation.”

PicoBehavioural economicsreally internalizing externalities at emotional core of decision making
Soci
alEc
olog
ical
Mon
etar
y fu
ngib
ility
$$ do NOT get us a
new planet
$$ do NOT buy real
happiness
Individual & household decisions on scarce resourcesMicro
Environmental economics: internalizing externalities of individual decisions for common goods
Meso
National scale decisions on scarce resourcesMacro
Ecological economics: planetary boundaries put hard constraintsGiga
Van Noordwijk, M., Leimona, B., Jindal, R., Villamor, G.B., Vardhan, M., Namirembe, S., Catacutan, D., Kerr, J., Minang, P.A., Tomich, T.P., 2012. Payments for Environmental Services: Evolution Toward Efficient and Fair Incentives for Multifunctional Landscapes. Annual Review of Environment and Resources 37, 389-420.

Problem 3: Asymmetry; People are often risk averse, sensitive
to the way (+ or -) a comparison is presented
Expected utility hypothesisE(x) = ∑ xi piExpected utility is sum of all possible values xi multi-plied with their probability pi.
Problem 1: People are notoriously poor in estimating probabilities, especially when
they are exposed to strongly filtered information
Problem 2: People are not good at comparing values that differ in time
course: strong preference for immediate gratificationDaniel Bernouilli (1700,
Groningen). 1738. Specimen theoriae novae de mensura sortis. [Exposition of a New Theory on the Measurement of Risk]PhD in Anatomy & Botany, Mathematician, Physicist, Hydrodynamics (blood pressure), Probability & Statistics (censored data), Impact quantification of smallpox vaccination

https://www.youtube.com/watch?v=F5O3JSn2fEU

Internalizing externalities• Individual expected utility of alternate
decisions is aligned with societal utility, through a combination of ‘polluter pay’ + ‘stewards are rewarded’ rules: carrots and sticks.
• Individual and local community ‘norms of behaviour’ change, in response to respect, responsibility, scrutiny, social controls and new (green and clean) business opportunities: carrots, sticks & sermons
But, legal opportunity costs of less ES friendly choices may need to be off-set at infinitum.
1
2Co-investment paradigms involve respect, sharing risk, voluntary agreements
PES, REDD+

Millions of years of selection pressure shaped our basic brain: we feel good in a group where there is perceived fairness, sharing and social policing of norms of behavior.
The start of agriculture, sedentary life-styles and cities created the concept of property rights, accu-mulation of wealth, con-flicts, efficiency, poverty
Fairness + Efficiency
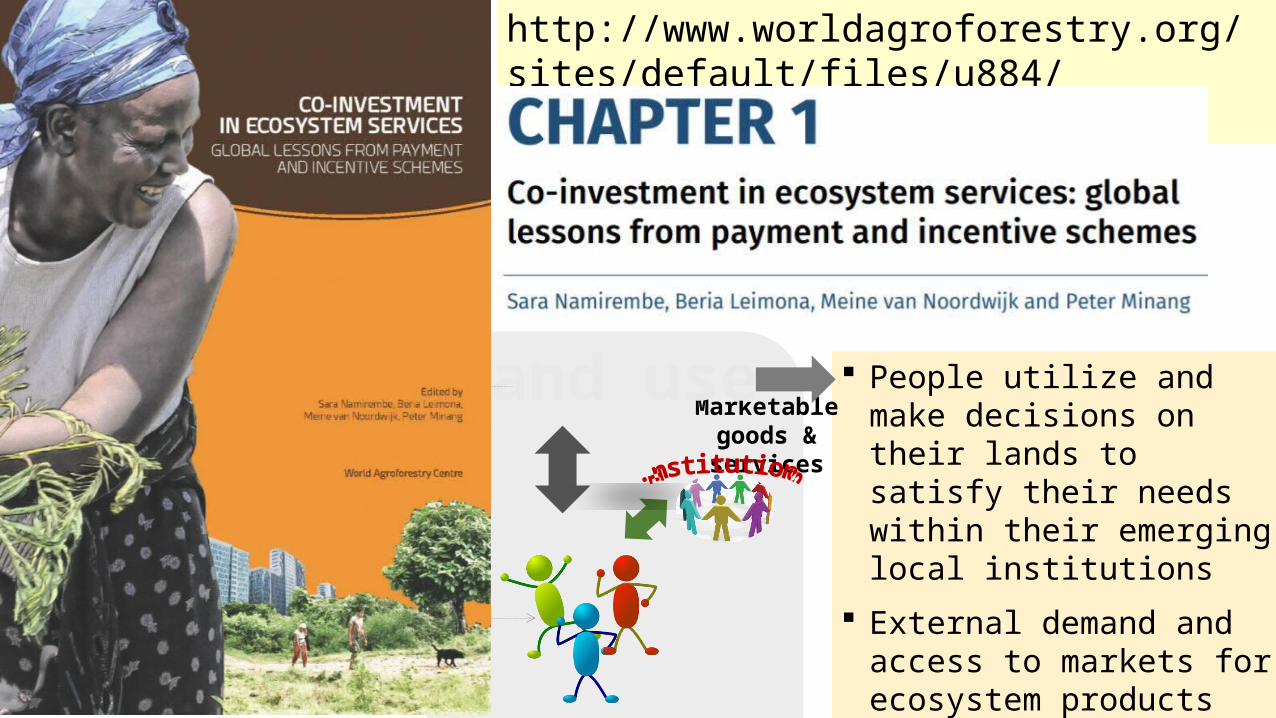
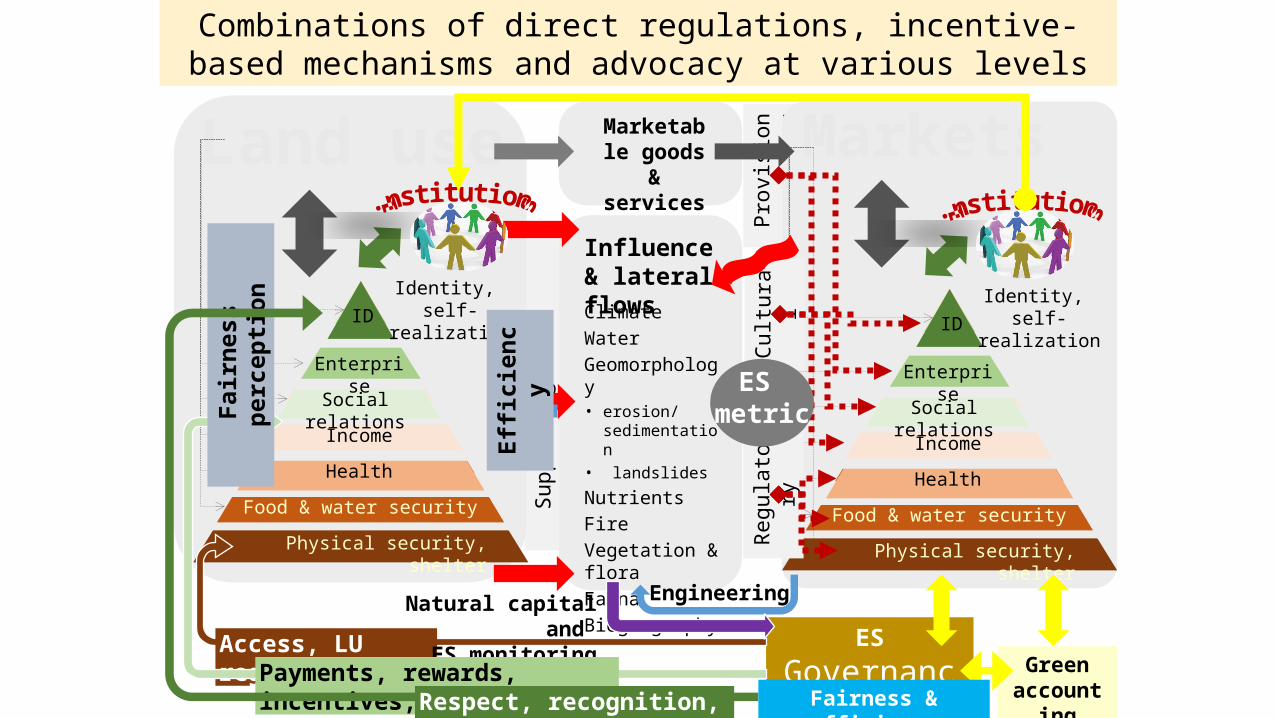
People utilize and make decisions on their lands to satisfy their needs within their emerging local institutions
External demand and access to markets for ecosystem products and services modify feeds backs to their land use decisions
http://www.worldagroforestry.org/sites/default/files/u884/Ch1_IntroCoinvest_ebook.pdf
Marketable goods & services
Land use
ES Governanc
e
Supp
ortin
g
Evol
utio
nary
Prov
isio
nin gMarketable
goods & services
Physical security, shelter
Food & water security
Health
Income
Enterprise
Social relations
IDIdentity,
self-realization
Land use
ClimateWaterGeomorphology• erosion/
sedimentation• landslides
NutrientsFireVegetation & floraFaunaBiogeography
Influence & lateral flows
Markets
Physical security, shelter
Food & water security
Health
Income
Enterprise
Social relations
IDIdentity,
self-realization
Cul
tura
lR
egul
ator
y
Combinations of direct regulations, incentive-based mechanisms and advocacy at various levels
ES metric
Engineering
Green accounting
Access, LU regulation
Natural capital and ES monitoring
Fairness & efficiency
Effici
ency
Payments, rewards, incentives, tax
Fairn
ess
perc
eptio
n
Respect, recognition, suasion

Who cares about the real value of ecosystem services of agroforestry?
# Governments (supported by public opinion leaders) who take SDG’s seriously and want the asset base to be secured
# Private sector entities with long-term vision but close watch on current bottom-lines
# Project proponents who want investment in projects that transform lives & landscapes; PES?
What type of understanding, evidence and data would it take to shift opinions and behaviour
Workplans for CAFRI + other institutions
Opportunities to collect information, use case studies, apply new methods, involve stakeholders in ‘action research’
I
II
IIIIV

III. Social-Ecological Systems: are efforts to remove ‘endogeneity’ from ‘impacts’ futile?
Central to current ‘impact evaluations’ is that it seeks to
separate ‘treatment’ effects from
‘self-selection’
Why?

Medical research: beyond ‘self-selected’ medication
Natural resource management and governance
Units of analysis Clearly defined: individuals (or mother-child combinations)
Nested/overlapping scales, fuzzy system boundaries
Stratification, domains of similarity
Well-defined medical diagnos-tics, age, sex, body-weight index, as co-variants
No generally accepted ‘theory of place’ descriptors and diagnostics of issues to be resolved
Treatments Initial ‘dose-effect’ relations, followed by tests of ‘fine-tuning’ criteria
Strongly interconnected subsystems, dependency on national regulations, international agreements
Double-blind experiments
Feasible as ‘gold standard’, strong ‘placebo’ effects
Not feasible, reliance on ‘counterfactuals’
Options to scale-up ‘success’
Public finance and insurance companies (if cost<benefit)
Recipe-based scaling up bound to fail as differences in context matter
Risks mitigated Unrecognized negative side-effects; inefficient expenditure
Diversity support may lead to lack of ‘fairness’, bureaucratic efficiency
There has been a long-standing perception that research on integrated natural resource management issues has a lower return on investment than research on ‘technologies’ that may be more closely mirror the standards for separating ‘self-selection’ from ‘replicable, objective’ observables that helped the medical field deal with many major illnesses (and create some new ones…)
Medical research: beyond ‘self-selected’ medication
Natural resource management and governance
Units of analysis Clearly defined: individuals (or mother-child combinations)
Nested/overlapping scales, fuzzy system boundaries
Stratification, domains of similarity
Well-defined medical diagnos-tics, age, sex, body-weight index, as co-variants
No generally accepted ‘theory of place’ descriptors and diagnostics of issues to be resolved
Treatments Initial ‘dose-effect’ relations, followed by tests of ‘fine-tuning’ criteria
Strongly interconnected subsystems, dependency on national regulations, international agreements
Double-blind experiments
Feasible as ‘gold standard’, strong ‘placebo’ effects
Not feasible, reliance on ‘counterfactuals’
Options to scale-up ‘success’
Public finance and insurance companies (if cost<benefit)
Recipe-based scaling up bound to fail as differences in context matter
Risks mitigated Unrecognized negative side-effects; inefficient expenditure
Diversity support may lead to lack of ‘fairness’, bureaucratic efficiency
Maybe we need to accept that we can ‘quantify change’, analyze contextual factors, stimulate cross-learning, allow spread & adaptation, rather than bullet-proof ‘adoption’ of proven recipes by voiceless objects of policy change.ToIC’s need to become more empirical and more soundly rooted in ToC’s as ‘counterfactuals’, with ToP’s that allow better contextualization…

IV. Supporting learning, self-selection, IDC’s, bottom-up actions

AtmosphereAnthropocene GHG increase
Humans
Fossil fuel use
Atmospheremacroclimate
Land
NatFor Ag
Ur Food, fibre
Energy
Service sectors
Hum
an
wel
lbei
ng
microclimate rene
wab
les
CO2
CH4
N2O
rainCO2 CO
2
CH4
N2OCO2
Oce
ans
CO2H2O
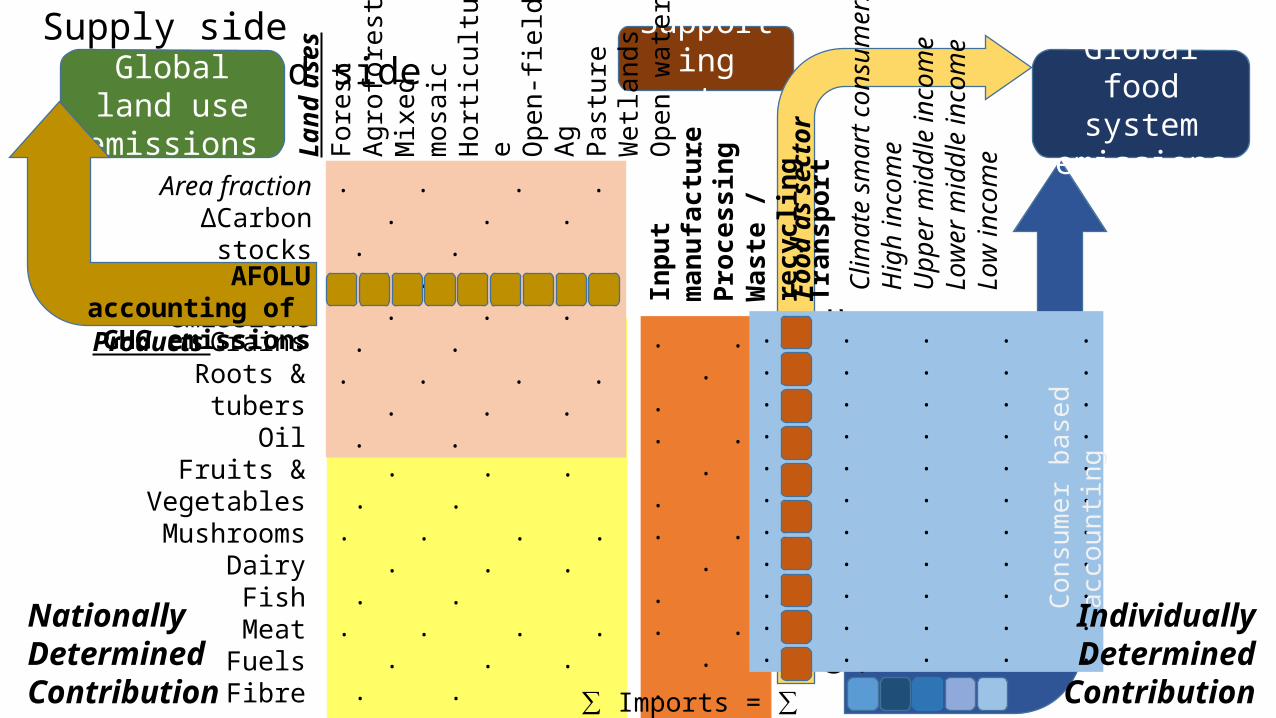
Nation-based AFOLU accounting
as part of NDC’s
Nation-based fossil fuel use accounting
as part of NDC’s
Unresolved blue carbon global accountability
Unresolved accountability for emissions embodied in industrial,
forest-product and agricultural trade
“Individually determined
contributions” based on foot-
prints & lifestyles
Self-regulation by private sector

Supporting sectors
Products GrainsRoots & tubers
OilFruits & Vegetables
MushroomsDairy
FishMeatFuelsFibre
…
Land
use
sFo
rest
Agro
fore
stM
ixed
mos
aic
Horti
cultu
reO
pen-
field
Ag
Past
ure
Wet
land
sO
pen
wat
er…
. . . . . . . . .
. . . . . . . . .
. . . . . . . . .
. . . . . . . . .
. . . . . . . . .
. . . . . . . . .
. . . . . . . . .
. . . . . . . . .
. . . . . . . . .
. . . . . . . . .
. . . . . . . . .
Supply side Demand side
Area fractionΔCarbon stocks
N2O, CH4 emissions
. . . . . . . . .
. . . . . . . . .
. . . . . . . . .
GHG
foot
prin
ts p
er u
nit f
ood
prod
uct
Inpu
t man
ufac
ture
Proc
essi
ngW
aste
/ re
cycl
ing
Tran
spor
t
. . . .
. . . .
. . . .
. . . .
. . . .
. . . .
. . . .
. . . .
. . . .
. . . .
. . . .
Clim
ate
smar
t con
sum
ers
High
inco
me
Upp
er m
iddl
e in
com
eLo
wer
mid
dle
inco
me
Low
inco
me
. . . . .
. . . . .
. . . . .
. . . . .
. . . . .
. . . . .
. . . . .
. . . . .
. . . . .
. . . . .
. . . . .
Global food system
emissions
Global land use emissions
AFOLU accounting of GHG emissions
Cons
umer
bas
ed a
ccou
nting
Food
as s
ecto
r
IndividuallyDetermined
Contributions
NationallyDetermined Contributions ∑ Imports = ∑ Exports

Certification
Sustainability initiatives,
standards, and certification of
adherence
Issue-attention cycle: dynamics of discourse &
‘solutions’
Status and trends in
ecosystem services, human
wellbeing
Sw
ing
pote
ntia
l: fo
otpr
int o
f pro
duct
s
Best
Median
Worst
Sta
ndar
ds v
aryi
ng in
am
bitio
n
Global value chains
Power
Market structure
Qualitystandards
(mandatory, voluntary)
Governance
Supply & demand
3. Pressures from the public evoke private sector and governmentalsustainability initiatives to converge and shift existing standards.
1. Public discourse on sustainability concerns and associated actions is part of one or more issue-attention cycles.
2. The way sustainability standards, initiatives and certification emerge, depends on global value chain and its intermediaries.
4. Sustainability initiatives, standard settings and certification only provide partial solutions for ecosystem service and social problems.

Further papers (Coffee, Cacao, Oil palm) forthcoming

V. ‘Cool trees’ the start and end of all agroforestry research

Global Environmental Change 2017:
Trees, forests and water: cool insights for a hot worldDavid Ellison1,2, Cindy E. Morris3,4, Bruno Locatelli5,6, Douglas Sheil7, Jane Cohen8, Daniel Murdiyarso9,10, Victoria Gutierrez11, Meine van Noordwijk12, Irena F. Creed13, Jan Pokorny14, David Gaveau9, Dominick V. Spracklen15, Aida Bargués Tobella1, Ulrik Ilstedt1, Adriaan J. Teuling16, Solomon Gebreyohannis Gebrehiwot17,18, David C. Sands4, Bart Muys19, Bruno Verbist19, Elaine Springgay20, Yulia Sugandi21, Caroline A. Sullivan22
“…the effects of forests on climate at local, regional and continental scales must be moved to the center of land and water management so that the appropriate management of forests can bridge the conventional distinction between these paradigms. The enhanced understanding of the dynamics of water, energy and carbon synergies would greatly improve climate adaptation and mitigation efforts. “

Tree
s, fo
rest
s and
wat
er: c
ool i
nsig
hts f
or a
hot
wor
ld. E
lliso
n et
al.
(201
7)
Surface tempe-rature distribu-tion in a mixed landscape with forest.Source: (Hesslerová et al., 2013).

Infiltration and groundwater recharge relative to canopy coverSource: Ilstedt et al. 2016

Natural forest
activ
e re
stor
ation
Salience: 21
3
Exposure Hazard: Flood human frequency presence & duration
Vulnerability: Victims, dama-ge and its economic value
Q = P - E - ∆S
Credibility:Directly obser-vable hydrograph
Topography & engineered river channel, reservoirs, flood plain (and its subsi-dence), dykes, drainage, storage, extractions
4
Climate variability and change
Rainfall & Epot as space/time pattern
Avoided flood damage asperceived Ecosystem Service
5
6
Hillslope/landscapeDrainage vs retentionBuffer and filter effects‘Effective rainfall’
Land cover:oNatural forestoForest-derivedoPlantationsoTree-based AgoOpen-field AgoDegraded landsoSettlements
Spati
al co
nfigu
ratio
n
Watershed functions: pathways, water use and flow buffering
Riparian vegetationBuffer and filter effects
78
Ecosystem structure Ecosystem function // watershed management
Spati
al co
nfigu
ratio
nPatch-levelRainfall interceptionInfiltrationSurface filter effectsSoil macroporosity (decline & buildup)Water storage and use for transpiration
7D
7C
7A
7B
Avoi
ded
degr
adati
on &
?
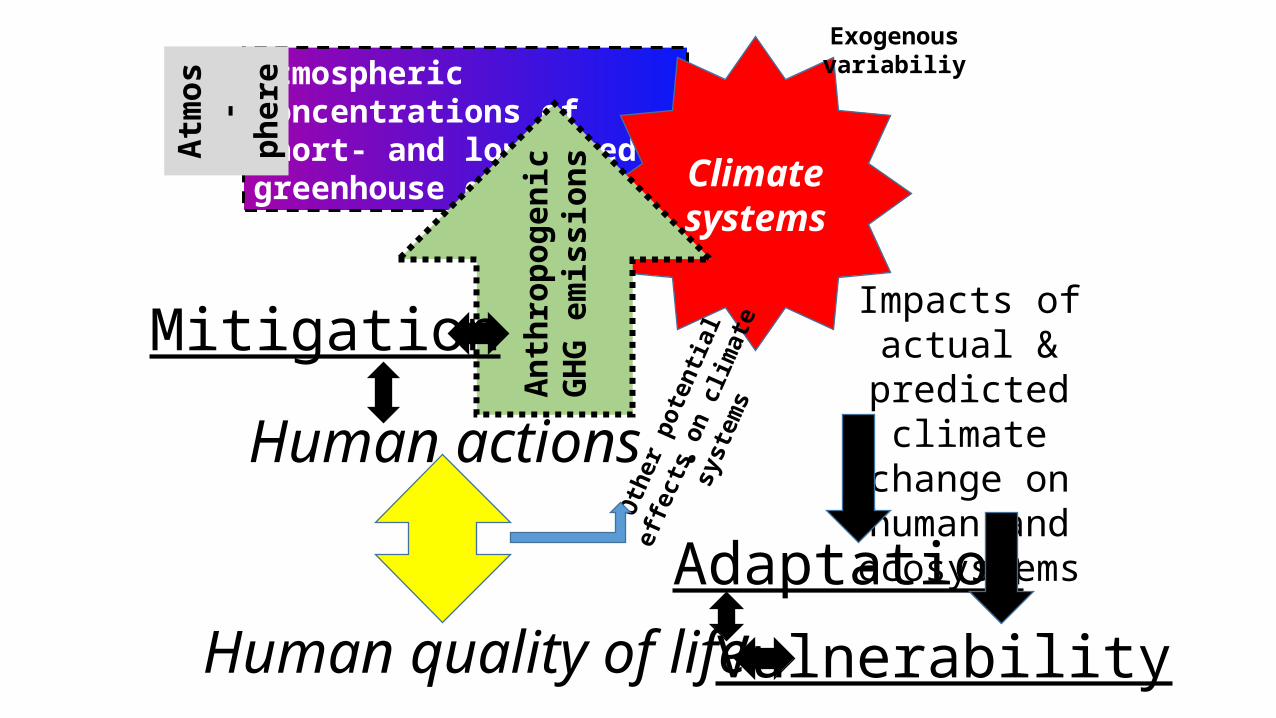
Atmospheric concentrations of short- and longlived greenhouse gassesAt
mos
-ph
ere
Climate
systems
Anth
ropo
geni
c GH
G
emis
sion
s
Impacts of actual & predicted
climate change on human and ecosystems
Adaptation
Mitigation
Vulnerability
Human actions .
Human quality of lifeOt
her p
oten
tial
effec
ts o
n cl
imat
e sy
stem
s
Exogenous variabiliy
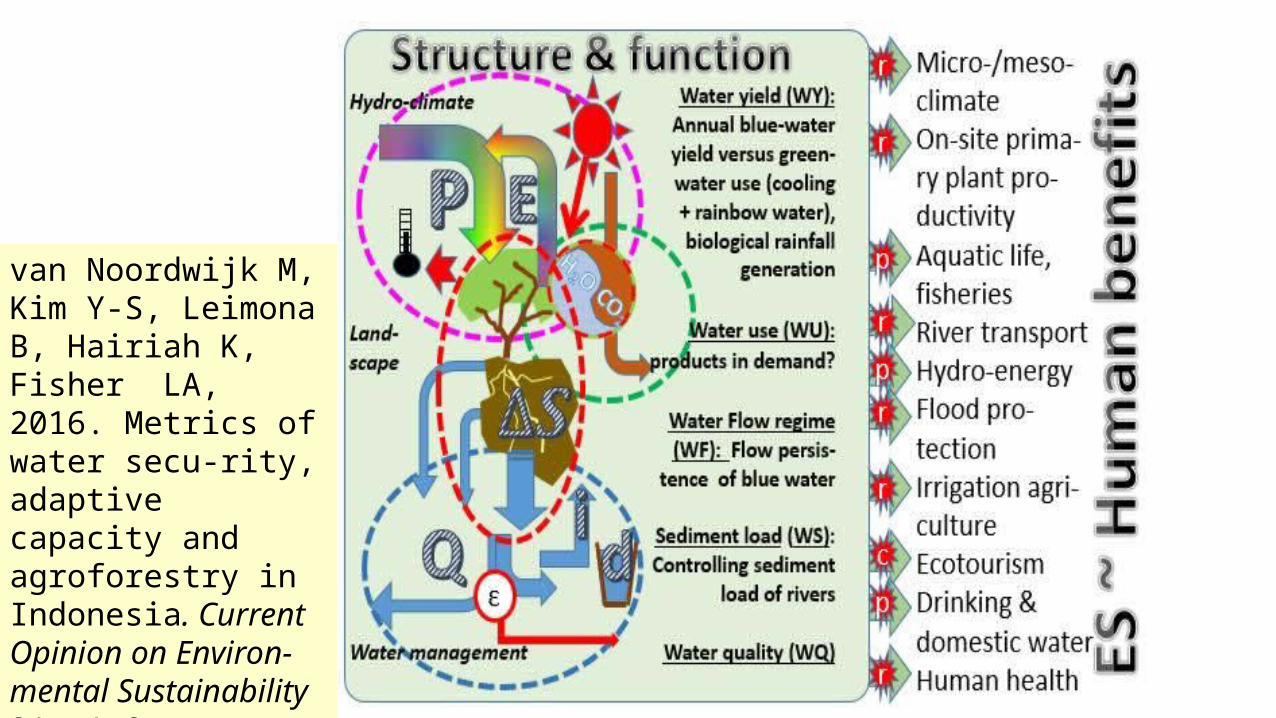
van Noordwijk M, Kim Y-S, Leimona B, Hairiah K, Fisher LA, 2016. Metrics of water secu-rity, adaptive capacity and agroforestry in Indonesia. Current Opinion on Environ-mental Sustainability 21: 1-8

for further ideas see
WaNuLCAS

Ackn
owle
dgin
g
you
all…

Meine van Noordwijk ICRAF
1993-2017
Integrative agroforestry science: reflections and
perspectives
1984
1987
Thank you!


% o
f zon
e-sp
ecifi
c C-
stoc
k
Log (HumanPopDens)
Exported C-rich
products
Imported C-rich
products
Footprintcorrected
Purely Ag
Urban
Above-par
Average
Below-par
Net immigration emigration
Proposed performance metric for jurisdictional entities: foot-print adjusted relative C-stock
Including the consumption and production side of landscape performance, we propose a metric that relates current landscape C stock to the reference of natural vegetation in the ecological zone, that gives credit for all produce that leaves the landscape (whether food, wood, fodder or fibre) and balances that with the external footprint of the landscape:

Accounting rules:Landbased C-stock changeActivity-based recurrent GHG emissions: + Paddy rice + Enteric fermentation + Peatland use + N-fertilizationWaste landfillsIndustrial processesCement productionFossil fuel use inc. transport
CO2 CH4 N2O++/-- . .
. ++ .
. ++ .++ . .. . ++. ++ ++ + +++ . .++++ . .++ . ++
Nati
on st
ates
: nati
onal
co
mm
unic
ation
s + N
DC’s
International
Citiz
ens,
cons
umer
s, pr
ivat
e se
ctor
val
ue c
hain
s
Accountability
“Emissions embodied in trade” remain major challenge
Forests & Agri-culture/Forest interface: Stock change attribu-tion issues:
“Individually Determined
Contributions”
Food systems: Footprint ac-counting rules:
“Indirect land use change”


