
East Capital Explorer AB Corporate ID no. 556693-7404 Box 7214, 103 88 Stockholm, Sweden
Tel: +46 8 505 97 700 [email protected] www.eastcapitalexplorer.com
30 June 2015 30 June 2014
NAV per share
30 Jun EUR 9.32 (+6.8% Jan-Jun) EUR 9.95
30 Jun SEK 86 (+4.2% Jan-Jun)
SEK 91
Closing price per share
30 Jun EUR 5.7 (+26.5% Jan-Jun) EUR 6.3
30 Jun SEK 52.50 (+23.5% Jan-Jun) SEK 57.75
Total NAV 30 Jun MEUR 264 MEUR 298
Market cap 30 Jun MEUR 161 MEUR 189
Net result
Apr-Jun MEUR 0.9 MEUR 23.7
Jan-Jun MEUR 16.8 MEUR 2.6
Earnings per share
Apr-Jun EUR 0.03 EUR 0.72
Jan-Jun EUR 0.55 EUR 0.08
1 EUR = 9.25 SEK on 30 June 2015. Source: Reuters
Key events during and after the quarter
» Net Asset Value (NAV) per share decreased by 0.3% to EUR 9.32 (9.95) during Q2 2015
» Redemption program completed in June, with EUR 13.2m distributed to shareholders in July. The three-year program is hence concluded with an aggregate shareholder distribution of EUR 41.0m, corresponding to a yield of 7-8%
» Good development in Real Estate (+3.0% in Q2) while Private Equity (-1.1%) and Public Equity (-0.7%) contracted slightly
» Private Equity and Real Estate increased to 61% (48 %) of the portfolio, while Public Equity decreased to 25 % (47 %), in line with the communicated strategy
» 0.3% of the outstanding shares were repurchased in April. A new share buyback program starting 21 August was announced today
» Fund holdings amounting to EUR 11.4m were sold during the quarter. In July and August, additional fund holdings were divested for a total consideration of EUR 5.0m
» In April, a new dividend policy was announced, whereby at least 50% of received dividends will be distributed to shareholders
» In line with the aim of increasing the portion of Real Estate investments, EUR 20m will be invested in the new fund East Capital Baltic Property Fund III
Comparative numbers in parentheses refer to the corresponding period 2014.
Key figures
Interim ReportJanuary – June 2015

East Capital Explorer AB Interim Report January - June 2015
2
Change in NAV Q2 2015, EURm
263.9
-1.4 -1.2
-0.3 -0.1 -0.1 -0.6 -1.1 -13.2
1.0 0.9 0.6 0.2
279.3
Mia Jurke, CEO
6.8% increase in NAV/share during Jan-Jun (EUR)
7-8% yield through the three redemption programs 2013-2015
61% of our portfolio is Private Equity and Real Estate, compared to 48% a year ago
East Capital Explorer’s portfolio had a mixed second quarter. The largest positive contribution came from the Baltic Real Estate segment, which continued to benefit from low interest rates and generated stable returns. Private Equity, however, had a slight negative performance due to an impairment of Trev-2. In the Public Equity segment, the Russian stock market continued its recovery despite escalated turmoil in Eastern Ukraine and falling oil prices towards the end of the quarter, whereas the Greece crisis affected several of our Eastern European markets. NAV per share on 30 June 2015 was EUR 9.32 (SEK 86), a decrease of 0.3 percent during the quarter and an increase of 6.8 percent since the beginning of the year. The share price ended at SEK 52.50, down 7.1 percent during the quarter but up 23.5 percent since year-end. Over the past three years, since the strategic shift towards Private Equity and Real Estate, our NAV per share has increased by 16.2 percent while the index MSCI Emerging Markets Europe is down by 21.0 percent.
Portfolio development and activity
Baltic real estate continued to show good operating results. The sector, which combines high yields with stable rents and attractive financing, has in recent years constituted a focus area for us, currently comprising about a fifth of our portfolio. In July, we announced that we will increase our exposure to the sector further through investing EUR 20m in East Capital Baltic Property Fund III, which is expected to be launched in August. Among private equity investments, Starman continued to perform well, both in the Estonian and the Lithuanian business. Aivo Adamson, with considerable experience of complex cross-border
integration, was appointed new Group CEO. Management has thus been further strengthened for the continued consolidation of the Baltic cable TV and broadband market. The company completed a smaller, but strategically important, acquisition in July, by which nationwide coverage in Lithuania was obtained. Melon Fashion Group (MFG) generated a positive EBITDA margin of 3 percent and an impressive sales growth of 11 percent in the second quarter, in a market that is still struggling with weak consumer demand. Much of the margin improvement is a result of the vast cost reduction program launched at the end of last year. Although encouraged by this indication of recovery, we continue to closely monitor the Russian consumer market that is still challenging. Trev-2 had a weaker quarter than expected. Continued weak market conditions and low volumes prompted an impairment of the holding by 16.9 percent. Trev-2’s AGM decided to distribute previous year’s total earnings to its shareholders. East Capital Explorer’s share of the dividend is approximately EUR 0.8m and is to be paid out in December. The development in the Public Equity segment was mixed as holdings were, to various extents, affected by the continued recovery in the Russian market and concerns over Greece. During the second quarter there were additional divestments in all funds comprising listed assets, corresponding to EUR 11.4m in total. The divestments were primarily carried out to fund the redemption program, which was finalized in mid-July. Hence, the Public Equity segment was further decreased, and now represents a quarter of the Net Asset Value.
Stable quarter with good Real Estate performance Continued positive development in the Baltic real estate sector, in which another EUR 20m will be invested, while share buybacks are resumed.
East Capital Explorer AB Interim Report January - June 2015
3
“EUR 13.2m was paid out in mid-July to shareholders who participated in the share redemption program”
Buybacks, a new dividend policy and AGM resolutions
On 13 April the buyback program initiated in late March was completed. Shares representing more than a half percent were repurchased during the period. In April, the Board adopted a new dividend policy in which at least 50 percent of the received dividends will be distributed to shareholders. The policy reflects our changed strategy with focus on cash flow and growth investments in private equity and real estate. It further states that share buybacks or redemptions can be used when funds are available and deemed to be more attractive than the available investment opportunities. The Annual General Meeting, held on 21 April, adopted the Nomination Committee’s Board proposal with Lars O Grönstedt as new Chairman, and Jenny Rosberg and Mikael Nachemson (Vice Chairman) as new Members. Paul Bergqvist, former Chairman, and Louise Hedberg had declined re-election. The Meeting also approved the third and final redemption program. One in twenty shares could this year be redeemed at SEK 83 per share. The program was completed in late June with a participation rate of 98.5 percent, whereby EUR 13.2m (SEK 121.7m) was paid out to shareholders in mid-July. Under the three programs during 2013-2015, we have distributed a total of EUR 41.0m to our shareholders, corresponding to annual yields of 7-8 percent. Total shareholder distribution since the IPO amounts to EUR 67m.
Outlook and events after the quarter
The market sentiment in our region has so far in the third quarter been affected by the Greece crisis as well as by lower oil prices, influenced by, among other things, worries about the Chinese economy and the Iran nuclear deal.
This, together with weak Russian macro statistics, has once again dampened a Russian market recovery. The rouble, which is closely linked with the oil price, depreciated during the first month of the third quarter. If this trend is sustained, it could impact the valuation of our Russian holdings, including MFG. However, oil importing countries, which constitute the majority of our market exposure, will in the long-term benefit from lower oil prices. The Baltic economies remain strong, despite the economic slowdown in large trade partners such as Russia and Finland. Growth in the next five years, based on a broad domestic and foreign demand, is expected to average at 3.5 percent with a moderate inflation rate of about 2 percent. This provides good opportunities for both our real estate and private equity investments in the Baltic States; a region that now represents 46 percent of our Net Asset Value. It is also primarily in this region that we continue to seek new investments. East Capital Explorer is looking forward to taking additional steps along the strategic route of growing our Private Equity and Real Estate portfolio. During this fall, we will make our initial investment in the new fund East Capital Baltic Property Fund III with an interesting pipeline of real estate investments in the Baltic capitals. In parallel to identifying and executing attractive investments, the share buybacks will be resumed. Today we decided to launch a new buyback program, as we believe that the current share price levels do not fully reflect the values and potential we see in our portfolio. The program will run from 21 August to 6 October.
Mia Jurke CEO, East Capital Explorer
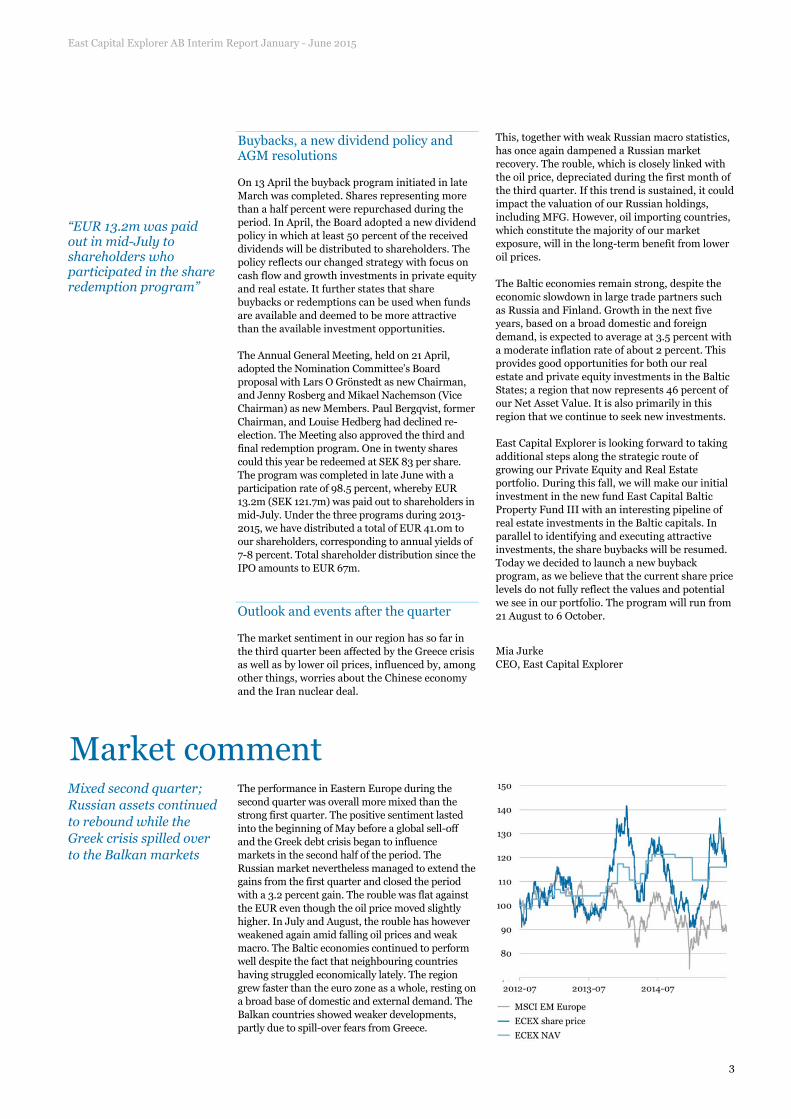
Mixed second quarter; Russian assets continued to rebound while the Greek crisis spilled over to the Balkan markets
The performance in Eastern Europe during the second quarter was overall more mixed than the strong first quarter. The positive sentiment lasted into the beginning of May before a global sell-off and the Greek debt crisis began to influence markets in the second half of the period. The Russian market nevertheless managed to extend the gains from the first quarter and closed the period with a 3.2 percent gain. The rouble was flat against the EUR even though the oil price moved slightly higher. In July and August, the rouble has however weakened again amid falling oil prices and weak macro. The Baltic economies continued to perform well despite the fact that neighbouring countries having struggled economically lately. The region grew faster than the euro zone as a whole, resting on a broad base of domestic and external demand. The Balkan countries showed weaker developments, partly due to spill-over fears from Greece.
Market comment

East Capital Explorer AB Interim Report January - June 2015
4
East Capital Explorer’s strategy builds on four cornerstones: growth in Eastern Europe, domestic consumption, companies with strong outlook and a long-term active ownership. The preferred way of investing is through direct investments. East Capital Explorer’s focus for new investments is within the Private Equity and Real Estate segments, where the company can, in a more direct way, contribute its expertise and create value. As of 2015, East Capital Explorer has changed its segment reporting to reflect the ongoing strategic shift. The new segments are Private Equity, Real Estate and Public Equity. Short-term investments include assets that are expected to be divested. These are reported separately, and not included in the core segments. Comparable numbers for 2014 are reclassified according to the new segment reporting.
1 The value change calculation is adjusted for investments, divestments and distributions during the relevant period. i.e. it is the percentage change between: the ending value plus any
proceeds from dividends or divestments during the period, divided by the starting value plus any added investment during the period 2 NAV per share development 3 Includes East Capital Bering Ukraine Fund Class R
Please refer to Note 3 Financial Instruments for more information regarding the valuations of the holdings 1 EUR = 9.25 SEK on 3o June 2015. Source: Reuters
Note that certain numerical information may not add up due to rounding
Portfolio on 30 June 2015 Value
30 Jun 2015
EURm
NAV/share
EUR % of NAV
Value 31 Mar 2015
EURm
Value31 Dec 2014
EURm
Value change Jan–Jun
2015, %1
Value changeApr–Jun
2015, %1
Private Equity
Starman 62.0 2.19 23.5 62.0 39.5 0.0 0.0
Melon Fashion Group 41.0 1.45 15.5 40.8 35.1 17.0 0.6
Trev-2 Group 7.0 0.25 2.7 8.5 8.5 -16.9 -16.9Total Private Equity 110.1 3.89 41.7 111.3 83.0 4.3 -1.1
Real Estate
East Capital Baltic Property Fund II 25.5 0.90 9.7 25.0 24.4 4.7 2.3
3 Burės 24.8 0.87 9.4 23.9 24.2 2.2 3.7
Total Real Estate 50.3 1.78 19.1 48.8 48.6 3.4 3.0
Public Equity
East Capital Deep Value Fund 46.1 1.63 17.5 52.8 47.0 9.6 -2.3
East Capital Russia Domestic Growth Fund 13.5 0.48 5.1 17.5 16.1 39.7 5.6
Komercijalna Banka Skopje 6.6 0.23 2.5 6.8 7.3 -10.6 -4.2
Total Public Equity 66.2 2.34 25.1 77.1 70.4 14.4 -0.7
Short-term Investments
East Capital Frontier Markets Fund 35.8 1.27 13.6 37.0 40.9 7.3 -0.4
Other short-term Investments3 1.4 0.05 0.5 1.4 13.3 -2.6 -4.4
Short-term Investments 37.2 1.31 14.1 38.4 54.2 4.9 -0.5
Cash and cash equivalents 13.7 0.48 5.2 4.3 5.6
Total Short-term Investments 50.9 1.80 19.3 42.7 59.8
Total Portfolio 277.5 9.80 105.1 279.9 261.9
Other assets and liabilities net -13.6 -0.48 -5.1 -0.6 -0.6
Net Asset Value (NAV) 263.9 9.32 100.0 279.3 261.3 6.82 -0.32
Our portfolio

East Capital Explorer AB Interim Report January - June 2015
5
I IH HG G
FF
E
E
D
D
C
C
B
B
A
A
0%
20%
40%
60%
80%
100%
Q2 2014 Q2 2015
10 largest holdings in East Capital Explorer’s portfolio on a see-through basis (sum of direct and indirect holdings)1
On 30 June 2015 Company
Value in portfolio,
EURm % of NAV Perf. Q2, %
Country
Sector
East Capital Explorer’s investment vehicle
Starman 62.0 23.5 0.0 Estonia Telecom Direct Investment
Melon Fashion Group 41.0 15.5 0.6 Russia Consumer Discretionary Direct Investment
3 Burės 24.8 9.4 3.7 Lithuania Real Estate Direct Investment
Komercijalna Banka Skopje 8.1 3.1 -4.2 Macedonia Financials Direct Investment East Capital Deep Value Fund
Trev-2 Group 7.0 2.7 -16.9 Estonia Industrials Direct Investment
GO9 6.7 2.6 0.8 Lithuania Real Estate East Capital Baltic Property Fund II
Tänassilma Logistics 6.4 2.4 3.1 Estonia Real Estate East Capital Baltic Property Fund II
Metro Plaza 5.3 2.0 2.8 Estonia Real Estate East Capital Baltic Property Fund II
Integra 4.3 1.6 -3.6 Russia Energy East Capital Deep Value Fund
B92 4.1 1.5 1.5 Serbia Consumer Discretionary East Capital Deep Value Fund
Total 169.7 64.3
1 As if East Capital Explorer had owned its pro-rata share of all the underlying securities in the different funds it has invested in
Sector breakdown, %
A Telecom 27 (6) B Consumer Discr. 22 (36) C Real Estate 22 (19) D Financials 13 (14) E Industrials 4 (8) F Consumer Staples 3 (5) G Energy 3 (4) H Utilities 2 (3) I Materials 2 (2)
Geographic breakdown, %
A Baltics 46 (27)B Russia 25 (44)C Balkans 11 (14)D Other countries 18 (15)
Segment breakdown*, %
A Private Equity 42 (33)B Real Estate 19 (15)C Public Equity 25 (47)D Short-term investments, cash,
other assets and liabilities 14 (5)
Comparative numbers in parentheses refer to the corresponding period 2014
DD
C C
B
B
AA
0%
20%
40%
60%
80%
100%
Q2 2014 Q2 2015
D D
C C
B
B
A
A
0%
20%
40%
60%
80%
100%
Q2 2014 Q2 2015

East Capital Explorer AB Interim Report January - June 2015
6
Starman
Starman, the first truly pan-Baltic cable TV and broadband provider operating in Estonia and Lithuania, benefits from its loyal customer base through strong non-cyclical cash flows. With its leading market position and superior product offering, Starman is well positioned to lead the market consolidation and benefit from the increasing broadband penetration in the Baltics. East Capital Explorer’s holding in the company 63%
% of NAV 24%
EURm
2015 Jan-Jun
2014 Jan-Jun
2015 Apr-Jun
2014 Apr-Jun
Sales 24.8 16.6 13.1 8.3- of which Cgates 6.7 - 4.0 -
EBITDA 11.9 8.2 6.3 4.0
- of which Cgates 2.9 - 1.8 -
Net profit 2.4 1.9 1.2 0.8
Sales growth (%) 49.5 10.9 57.5 10.9
EBITDA margin (%) 47.9 49.3 48.2 49.2
Number of RGU’s (’000) 533 285 533 285
- of which Cgates 202 - 202 -
Average ARPU (€/month) 14.4 14.4 13.0 14.5 * Cgates consolidated as of 1 Feb 2015 RGU: Revenue generating units, ARPU: Average revenue per user
• In Q2 2015, Starman continued to perform strongly. Group revenues reached EUR 13.1m (8.3m) and EBITDA, after one-off items of EUR 0.2m related to the Cgates deal, amounted to EUR 6.3m (4.0m)
• Revenues in Estonia for the second quarter reached EUR 9.1m (8.3m), which corresponds to an increase of 9.6 percent compared to same period last year. EBITDA after one-off items amounted to EUR 4.5m (4.0m), corresponding to a margin of 49.5 percent
• Revenues in Lithuania for the second quarter reached EUR 4.0m. EBITDA after one-off items amounted to EUR 1.8m, which corresponds to an EBITDA margin of 45.0 percent
• In June, Aivo Adamson was appointed Group CEO, a new position as a result of the company’s Baltic consolidation strategy. Aivo has broad experience from leading positions within banking, infrastructure and IT, most recently as Managing Director of the Estonian Road Administration. His experience of executing complex cross-border business integration, together with the experienced Management team in place, makes a strong combination for taking the company forward
• In July, Starman’s Lithuanian subsidiary Cgates announced the acquisition of Kava. This acquisition will expand Cgates’ coverage to Panevėžys, Šiauliai and Klaipėda, making it a nationwide operator. The closing of the transaction, subject to regulatory approvals, is expected in the third quarter
• The fair value of Starman remained unchanged at EUR 62.0m Learn more about Starman on: www.starman.ee
Melon Fashion Group
Melon Fashion Group (MFG) is the fastest growing fashion retailer in Russia. The company is well positioned for growth with a broad target group under three strong brands: Zarina, befree and Love Republic. MFG benefits from the consolidation in the fragmented Russian fashion industry and long-term consumption growth. East Capital Explorer’s holding in the company 36%
% of NAV 16%
RUBm
2015 Jan-Jun
2014 Jan-Jun
2015 Apr-Jun
2014 Apr-Jun
Sales 5,922 4,826 3,052 2,762Gross profit 2,494 2,732 1,426 1,697EBITDA 67 -384 76 1Net profit -148 -463 -21 -74Sales growth (%) 22.7 26.8 10.5 32.2Gross margin (%) 42.1 56.6 46.7 61.4EBITDA margin (%) 1.1 -8.0 2.5 0.0Number of stores (end-quarter) 644 635 644 635Like-for-like sales growth (%) 7.8 1.2 2.3 5.0
• The challenging market environment continued to put pressure on MFG’s operations during Q2. Consumer sentiment hardly showed any improvement from the beginning of the year. Traffic to shopping malls remained weak while government monthly statistics pointed at a contraction of non-food retail sales in line with the Q1 trend
• Despite the headwinds, MFG’s results showed year-on-year improvement, mainly thanks to efficiency measures resulting in significant cost savings and improved operating results. Net sales grew by 10.5 percent to RUB 3.1bn compared to the same period last year, primarily due to the addition of new space, while like-for-like sales growth remained positive at 2.3 percent
• Gross profit was pressured by increased purchasing costs in a market that is unable to transfer significant price increases to the end consumer. We expect margins to increase gradually as the market stabilizes, but the exact timing of such a turnaround is yet unclear
• Despite lower gross margins, cost savings from reduced rental and payroll costs brought noticeable improvements in operating results compared to last year. Q2 2015 EBITDA increased to RUB 76.4m, equal to a margin of 2.5 percent, from almost zero in Q2 2014. The net loss was also reduced to RUB -20.6m (RUB -73.5m) in Q2
• With continued streamlining of operations and shedding of unprofitable units, the total number of stores decreased from 669 at the end of 2014 to 644 as of end of Q2. While closing unprofitable stores, equal efforts were put into search for opportunities to acquire attractive locations with clear payback schedules that have become available amidst general market weakness. This resulted in 12 new openings since the beginning of the year
• The underlying RUB based valuation of MFG was unchanged, while the translation to EUR resulted in a 0.6 percent appreciation to EUR 41.0m. The RUB depreciation during the first part of Q3 would, if sustained, impact the EUR valuation of the company
Learn more about Melon Fashion Group on: www.melonfashion.ru
Private Equity The Private Equity segment represents 42 (33) percent of total Net Asset Value. The portfolio primarily consists of non-cyclical, consumer-oriented companies with high growth and/or cash flow potential. More detailed financial information regarding the Private Equity holdings is available on www.eastcapitalexplorer.com under Investors/Reports and Presentations.

East Capital Explorer AB Interim Report January - June 2015
7
Trev-2 Group
Trev-2 Group, one of the largest infrastructure construction and maintenance companies in Estonia, was acquired as a restructuring case, which has under our guidance concentrated its operational focus on its core areas: environmental and road construction and maintenance.
• Q2 2015 was more tough than expected. The volume of tenders is lower than expected, which impacted Q2 revenues negatively. The margins from new projects are also lower. Revenues in the second quarter amounted to EUR 13.4m (16.6m), which corresponds to a decrease of 19.3 percent compared to the same period in 2014
• EBITDA amounted to EUR 0.9m (1.7m) and the company showed a net profit of EUR 0.0m (0.8m)
• Rein Rätsep, formerly Group CFO, was appointed CEO in May. In the last two years, Rein has played an important role in restructuring and shaping Trev-2 into a modern company
• The AGM in June decided on a dividend payout, totaling approximately EUR 2.1m. This corresponds to EUR 0.8m for East Capital Explorer’s holding, and is expected to be paid out in December
• The fair value of Trev-2 Group was impaired by 16.9 percent to EUR 7.0m in the second quarter, as a consequence of the weaker market conditions in the Estonian infrastructure sector and lower volumes
Learn more about Trev-2 Group on: www.trev2.ee
East Capital Explorer’s holding in the company 38%
% of NAV 3%
EURm
2015 Jan-Jun
2014 Jan-Jun
2015 Apr-Jun
2014 Apr-Jun
Sales 17.2 22.7 13.4 16.6EBITDA -0.5 1.1 0.9 1.7Operating profit -1.9 -0.4 0.2 0.9Net profit -2.1 -0.6 0.0 0.8Sales growth (%) -24.5 -35.5 -19.3 -28.5EBITDA margin (%) -2.8 4.9 6.7 10.1Operating margin (%) -10.9 -1.9 1.4 5.4

East Capital Explorer AB Interim Report January - June 2015
8
3 Burės
3 Burės is one of Vilnius’ most modern and well located A Class office properties. The two buildings, with low vacancy rates and high interest from potential tenants, currently generate a stable cash flow with potential ahead for increasing rents. At the same time, the country’s stable and growing economy supports continued low financing costs and the potential for long term value appreciation.
East Capital Explorer’s holding in the company 100%
% of NAV 9%
EURm
2015 Jan-Jun
2015 Apr-Jun
2014* May-Dec
Net rental revenue** 2.2 1.1 3.1Net operating income 2.0 1.0 2.4Vacancy rate (%) 2.1 0.6 4.2Avg. rent (€/sqm, end-quarter) 12.7 12.7 12.6* 3 Burės was acquired in May 2014 ** Rental income only, excluding income from communal services
• During the second quarter 2015, the fair value of 3 Burės increased by 3.7 percent to EUR 24.8m, owing to a positive operating result
• Vacancy in the office complex decreased from 3.5 percent in the first quarter 2015 to 0.6 percent in the second quarter on account of several new signed leases
• The conference center in the building was resized for a more efficient use of space. The residue was rented out as offices
• Detailed planning regarding the development project of the land plot, which was part of the acquisition, is ongoing in parallel with a technical project, expected to be ready by the fourth quarter 2015 Learn more about 3 Burės on: www.3bures.lt
East Capital Baltic Property Fund II
The Fund acquires and manages properties with well-established tenants on sustainable rental terms in the Baltic capitals; primarily shopping centers and retail properties, but also logistics and office properties. The goal is to acquire properties at good locations with a stable income and potential for improvement
East Capital Explorer’s share of the Fund 53%
% of NAV 10%
Q2 2015 Since May 12
Performance, EUR 2.3% 27.6%
Properties in the portfolio
Weight of mkt value, %
Contr,%*
Location Type
Tänassilma Logistics 24.0 31.0 Tallinn Logistics
GO9 Shopping Centre 27.0 10.0 Vilnius Retail
Deglava Prisma 15.0 16.0 Riga Retail
Rimi Logistics 13.0 20.0 Tallinn Logistics
Metro Plaza 21.0 23.0 Tallinn Office* Contribution; Share of quarterly change in NAV from property operating result
• The net asset value of East Capital Baltic Property Fund II increased by 2.3 percent during the second quarter 2015, which represents a 4.7 percent increase for the financial year to date
• All properties increased in value during the quarter on account of positive operating results, with Tänassilma Logistics and Metro Plaza contributing the most
• In GO9 shopping center, the number of visitors (footfall) increased by 23 percent in the second quarter 2015 compared to the same period 2014
Real Estate The Real Estate segment represents 19 (15) percent of total Net Asset Value. The Real Estate investments in the Baltic capitals have strong cash flows, sustainable rents and low vacancies. Yields are 7-9 percent, 2-3 percentage points higher than in the Nordic capitals, while financing terms are attractive. The Baltic economies have among the highest GDP growths in the euro zone. More detailed financial information regarding 3 Burės is available on www.eastcapitalexplorer.com under Investors/Reports and Presentations.
East Capital Explorer AB Interim Report January - June 2015
9
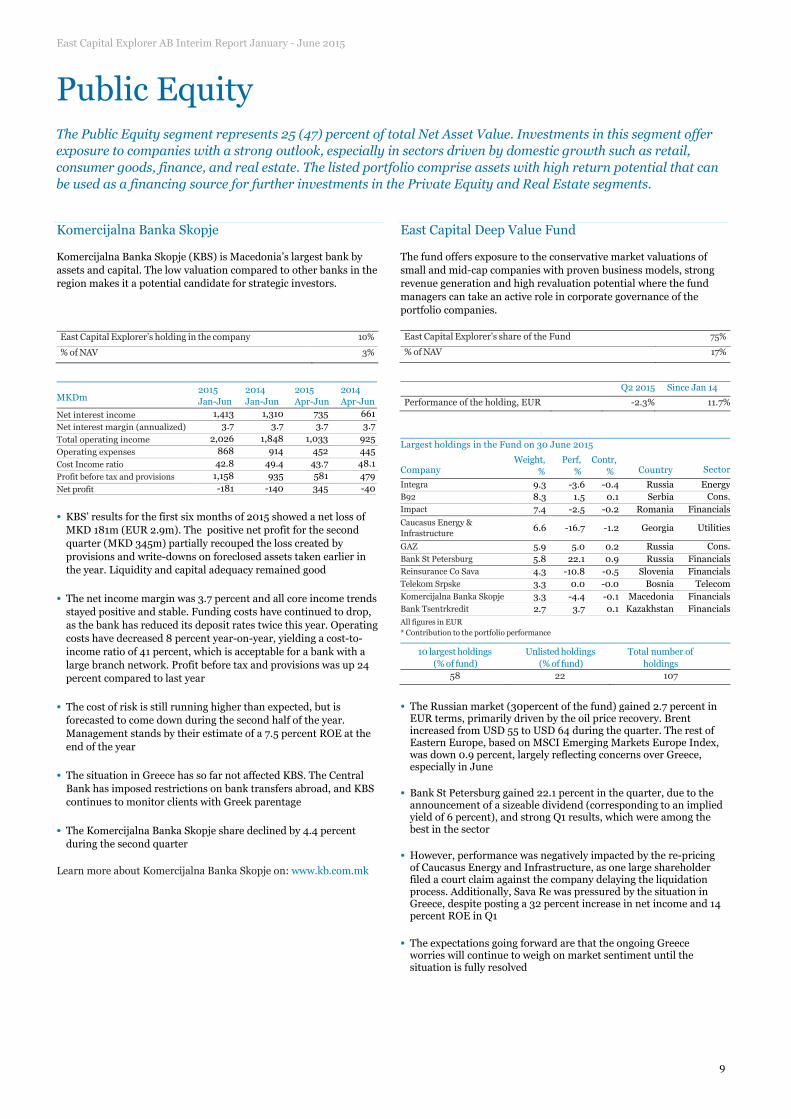
Komercijalna Banka Skopje
Komercijalna Banka Skopje (KBS) is Macedonia’s largest bank by assets and capital. The low valuation compared to other banks in the region makes it a potential candidate for strategic investors. East Capital Explorer’s holding in the company 10%
% of NAV 3%
MKDm
2015 Jan-Jun
2014 Jan-Jun
2015 Apr-Jun
2014 Apr-Jun
Net interest income 1,413 1,310 735 661Net interest margin (annualized) 3.7 3.7 3.7 3.7
Total operating income 2,026 1,848 1,033 925Operating expenses 868 914 452 445Cost Income ratio 42.8 49.4 43.7 48.1Profit before tax and provisions 1,158 935 581 479Net profit -181 -140 345 -40
• KBS’ results for the first six months of 2015 showed a net loss of MKD 181m (EUR 2.9m). The positive net profit for the second quarter (MKD 345m) partially recouped the loss created by provisions and write-downs on foreclosed assets taken earlier in the year. Liquidity and capital adequacy remained good
• The net income margin was 3.7 percent and all core income trends stayed positive and stable. Funding costs have continued to drop, as the bank has reduced its deposit rates twice this year. Operating costs have decreased 8 percent year-on-year, yielding a cost-to-income ratio of 41 percent, which is acceptable for a bank with a large branch network. Profit before tax and provisions was up 24 percent compared to last year
• The cost of risk is still running higher than expected, but is forecasted to come down during the second half of the year. Management stands by their estimate of a 7.5 percent ROE at the end of the year
• The situation in Greece has so far not affected KBS. The Central Bank has imposed restrictions on bank transfers abroad, and KBS continues to monitor clients with Greek parentage
• The Komercijalna Banka Skopje share declined by 4.4 percent during the second quarter
Learn more about Komercijalna Banka Skopje on: www.kb.com.mk
East Capital Deep Value Fund
The fund offers exposure to the conservative market valuations of small and mid-cap companies with proven business models, strong revenue generation and high revaluation potential where the fund managers can take an active role in corporate governance of the portfolio companies.
East Capital Explorer’s share of the Fund 75%
% of NAV 17%
Q2 2015 Since Jan 14
Performance of the holding, EUR -2.3% 11.7%
Largest holdings in the Fund on 30 June 2015
Company
Weight, %
Perf, %
Contr, % Country Sector
Integra 9.3 -3.6 -0.4 Russia EnergyB92 8.3 1.5 0.1 Serbia Cons. Impact 7.4 -2.5 -0.2 Romania FinancialsCaucasus Energy & Infrastructure
6.6 -16.7 -1.2 Georgia Utilities
GAZ 5.9 5.0 0.2 Russia Cons. Bank St Petersburg 5.8 22.1 0.9 Russia FinancialsReinsurance Co Sava 4.3 -10.8 -0.5 Slovenia FinancialsTelekom Srpske 3.3 0.0 -0.0 Bosnia TelecomKomercijalna Banka Skopje 3.3 -4.4 -0.1 Macedonia FinancialsBank Tsentrkredit 2.7 3.7 0.1 Kazakhstan FinancialsAll figures in EUR * Contribution to the portfolio performance
10 largest holdings (% of fund)
Unlisted holdings (% of fund)
Total number of holdings
58 22 107
• The Russian market (30percent of the fund) gained 2.7 percent in EUR terms, primarily driven by the oil price recovery. Brent increased from USD 55 to USD 64 during the quarter. The rest of Eastern Europe, based on MSCI Emerging Markets Europe Index, was down 0.9 percent, largely reflecting concerns over Greece, especially in June
• Bank St Petersburg gained 22.1 percent in the quarter, due to the announcement of a sizeable dividend (corresponding to an implied yield of 6 percent), and strong Q1 results, which were among the best in the sector
• However, performance was negatively impacted by the re-pricing of Caucasus Energy and Infrastructure, as one large shareholder filed a court claim against the company delaying the liquidation process. Additionally, Sava Re was pressured by the situation in Greece, despite posting a 32 percent increase in net income and 14 percent ROE in Q1
• The expectations going forward are that the ongoing Greece worries will continue to weigh on market sentiment until the situation is fully resolved
Public Equity The Public Equity segment represents 25 (47) percent of total Net Asset Value. Investments in this segment offer exposure to companies with a strong outlook, especially in sectors driven by domestic growth such as retail, consumer goods, finance, and real estate. The listed portfolio comprise assets with high return potential that can be used as a financing source for further investments in the Private Equity and Real Estate segments.
East Capital Explorer AB Interim Report January - June 2015
10
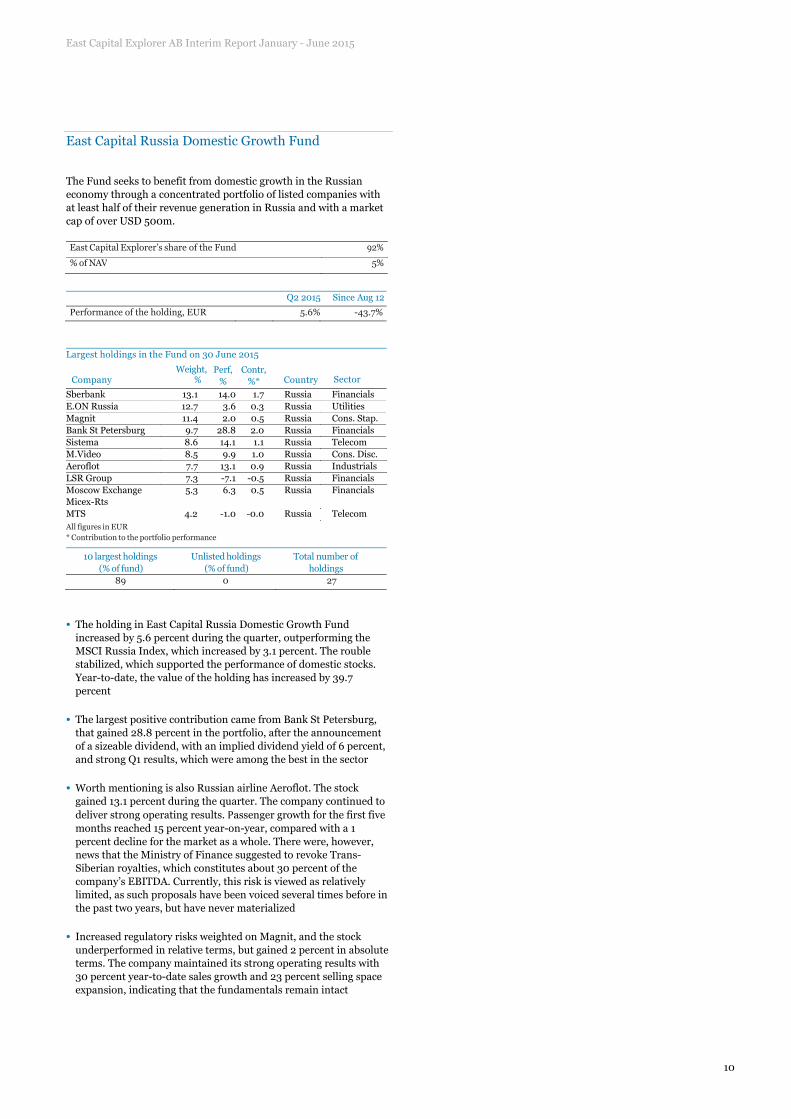
East Capital Russia Domestic Growth Fund
The Fund seeks to benefit from domestic growth in the Russian economy through a concentrated portfolio of listed companies with at least half of their revenue generation in Russia and with a market cap of over USD 500m.
East Capital Explorer’s share of the Fund 92%
% of NAV 5%
Q2 2015 Since Aug 12
Performance of the holding, EUR 5.6% -43.7%
Largest holdings in the Fund on 30 June 2015
Weight, Company %
Perf,%
Contr, %*
Country Sector
Sberbank 13.1 14.0 1.7 Russia FinancialsE.ON Russia 12.7 3.6 0.3 Russia UtilitiesMagnit 11.4 2.0 0.5 Russia Cons. Stap.Bank St Petersburg 9.7 28.8 2.0 Russia FinancialsSistema 8.6 14.1 1.1 Russia TelecomM.Video 8.5 9.9 1.0 Russia Cons. Disc.Aeroflot 7.7 13.1 0.9 Russia IndustrialsLSR Group 7.3 -7.1 -0.5 Russia FinancialsMoscow Exchange Micex-Rts
5.3 6.3 0.5 Russia Financials
MTS 4.2 -1.0 -0.0 Russia TelecomAll figures in EUR * Contribution to the portfolio performance
10 largest holdings (% of fund)
Unlisted holdings (% of fund)
Total number of holdings
89 0 27
• The holding in East Capital Russia Domestic Growth Fund increased by 5.6 percent during the quarter, outperforming the MSCI Russia Index, which increased by 3.1 percent. The rouble stabilized, which supported the performance of domestic stocks. Year-to-date, the value of the holding has increased by 39.7 percent
• The largest positive contribution came from Bank St Petersburg, that gained 28.8 percent in the portfolio, after the announcement of a sizeable dividend, with an implied dividend yield of 6 percent, and strong Q1 results, which were among the best in the sector
• Worth mentioning is also Russian airline Aeroflot. The stock gained 13.1 percent during the quarter. The company continued to deliver strong operating results. Passenger growth for the first five months reached 15 percent year-on-year, compared with a 1 percent decline for the market as a whole. There were, however, news that the Ministry of Finance suggested to revoke Trans-Siberian royalties, which constitutes about 30 percent of the company’s EBITDA. Currently, this risk is viewed as relatively limited, as such proposals have been voiced several times before in the past two years, but have never materialized
• Increased regulatory risks weighted on Magnit, and the stock underperformed in relative terms, but gained 2 percent in absolute terms. The company maintained its strong operating results with 30 percent year-to-date sales growth and 23 percent selling space expansion, indicating that the fundamentals remain intact

East Capital Explorer AB Interim Report January - March 2015
11
East Capital Frontier Markets Fund
East Capital Frontier Markets Fund is a daily traded UCITS fund with a global focus on young and growing markets. To combine high growth, attractive valuations and risk-adjusted returns, the fund seeks to invest in a wide spectrum of countries, sectors and companies. A significant share is invested in off-index countries, the”next frontiers”.
East Capital Explorer’s share of the Fund 56%
% of NAV 14%
Q2 2015 Since Dec 14
Performance of the holding, EUR -0.4% 11.2%
Largest holdings in the Fund on 30 June 2015
Weight, Company %
Perf,%
Contr, %*
Country Sector
National Bank Of Kuwait 4.6 2.0 0.0 Kuwait FinancialsZavarovalnica Triglav 3.8 -5.0 -0.2 Slovenia FinancialsUnited Bank/Pakistan 3.8 8.3 0.3 Pakistan FinancialsPak Suzuki Motor 2.8 21.4 0.5 Pakistan Cons.Disc.Zenith Bank 2.8 -12.1 -0.3 Nigeria FinancialsMobile Telecommunications
2.6 -16.9 -0.5 Kuwait Telecom
Guaranty Trust Bank 2.6 -1.4 -0.1 Nigeria FinancialsMontenegro Telekom 2.6 -2.0 0.0 Montenegro TelecomLucky Cement 2.5 11.6 0.2 Pakistan MaterialsYpf Sociedad Anonima 2.2 -5.7 -0.0 Argentina Energy
All figures in EUR * Contribution to the portfolio performance
10 largest holdings (% of fund)
Unlisted holdings (% of fund)
Total number of holdings
30 0 66
• Domestic politics, oil price volatility and Eurozone stimulus continued to be the prominent factors affecting different markets
• Pakistan, Nigeria and Saudi Arabia were among the top in terms of outperforming the index
• The stock market in Argentina rallied on expectations of a positive political change. However, the fund remains underweight in the country as beliefs stay firm that the underlying economy is not strong enough to sustain this rally
• During the second half of 2015 it will be important to monitor the new policy direction in Nigeria, the impact of opening the Saudi Arabian market to foreign direct investments, the positive steps towards reclassification to Emerging Markets for Pakistan and Vietnam, the political developments in Argentina and Sri Lanka, the removal of Iranian sanctions, and EU’s economic recovery
Short-term investments Short-term investments include assets that are expected to be divested. The largest short-term investment is East Capital Frontier Markets Fund, corresponding to 13.6 percent of NAV. East Capital Bering Ukraine Fund Class R, which decreased by 4.4 percent in the second quarter, corresponds to 0.5 percent of East Capital Explorer’s NAV.

East Capital Explorer AB Interim Report 1 January – 30 June 2015
12
The investment activities of East Capital Explorer AB (publ) (the Company) are managed in the operating subsidiary East Capital Explorer Investments SA which manages the investment portfolio, in accordance with the Investment Policy. Transactions in the operating subsidiaries East Capital Explorer Investments SA, East Capital Explorer Investments AB and Humarito Ltd are referred to as the investment activities in this report.
Presentation currency is euro (EUR).
Results for the second quarter 2015
The net result for the second quarter was EUR 0.9m (EUR 23.7m), including value changes of shares in subsidiaries of EUR 1.1m (EUR 23.8m), corresponding to earnings per share of EUR 0.03 (EUR 0.72).
In Q2 2015, the value of the holding in Trev-2 Group was impaired by EUR 1.4m. Further, an accounting adjustment of EUR +2.5m, related to Q1, was made in the Income Statement. The adjustment had, however, no impact on Net Asset Value. Net impact on Profit/Loss for the period January-June 2015, was neutral.
In the investment activities, the Company sold shares in East Capital Frontier Markets Fund for a total amount equivalent to EUR 1.0m, East Capital Russia Domestic Growth Fund for an amount equivalent to EUR 5.0m and in East Capital Deep Value Fund for an amount equivalent to EUR 5.4m.
The result for the period includes expenses of EUR -0.4m (EUR -0.5m), all of which refer to the Parent company.
Financial income for the period amounted to EUR 0.1m (EUR 0.4m) and financial expenses to EUR -0.0m (EUR -0.0m).
Comparative numbers in parenthesis refer to the second quarter of 2014.
Results for the period January-June 2015
The net result for the first six months was EUR 16.8m (EUR 2.6m), including value changes of shares in subsidiaries of EUR 17.5m (EUR 2.8m), corresponding to earnings per share of EUR 0.55 (EUR 0.08).
The value of the holding in Melon Fashion Group (MFG) was appreciated by EUR 5.9m due to translation from rouble to euro, and the value of the holding in Trev-2 Group was impaired by EUR 1.4m. Together with the fair value adjustments in East Capital Deep Value Fund of EUR 4.5m, East Capital Russia Domestic Growth Fund of EUR 6.4m and East Capital Frontier Markets Fund of EUR 3.0m, these were the main contributors to the change in value of shares in subsidiaries in the Income statement for the period.
In the investment activities, Starman's acquisition of Cgates was finalized on 12 February 2015. In conjunction with the transaction, East Capital Explorer made an additional investment of EUR 22.5m through a share issue in Starman, thereby increasing the ownership from 51 to 63 percent. Furthermore, the Company sold shares in East Capital Frontier Markets Fund for a total amount equivalent to EUR 8.1m, in East Capital Russia Domestic Growth Fund for an amount equivalent to EUR 9.0m and in East Capital Deep Value Fund for an amount equivalent to EUR 5.4m.
To calculate all fees related to East Capital Explorer, fees originated in funds are added to the fees in the investment activities. Total fees to East Capital, generated by the investments held by East Capital Explorer AB, amounted to EUR -2.5m (EUR +8.1m). Of this, EUR -2.5m (EUR -3.1m) was management fees and EUR 0.0m (EUR +11.2m) was performance fees. The fees for 2014 were positive due to reversed performance fees relating to previous years.
The result for the period includes expenses of EUR -0.8m (EUR -1.0m), all of which refer to the Parent company.
Financial income for the period amounted to EUR 0.1m (EUR 0.8m) and financial expenses to EUR -0.0m (EUR -0.0m). Comparative numbers in parenthesis refer to January-June 2014.
Financial Position and Cash Flow January-June 2015
The Company’s equity ratio was 95.1 percent (99.8 percent). The cash flow presented below only relates to transactions in the
Parent Company. During the period January-June 2015, the Company received repayment of shareholder’s contributions of EUR 12.0m (EUR 15.6m) from East Capital Explorer Investments SA (East Capital Explorer Investments AB in 2014). During the period 25 March-13 April 2015, East Capital Explorer repurchased a total of 166,100 shares, for an amount equivalent to EUR 1.0m.
Cash and cash equivalent at the end of the period amounted to EUR 11.3m (EUR 1.1m), all of which refer to the Parent Company.
At the end of the period, cash, cash equivalents and other short-term investments in the investment activities amounted to EUR 50.9m (EUR 57.8m). Please refer to the breakdown of values in subsidiaries on pages 18-19 for more details regarding the investment activities.
Comparative numbers in parenthesis refer to 31 December 2014.
Commitments
On 10 July 2015, East Capital Explorer announced a commitment to invest EUR 20m in total in the new fund East Capital Baltic Property Fund III. No amount has so far been drawn down.
Business Environment and Market
Most markets in Eastern Europe enjoyed a good start of the year, supported by increased optimism regarding European macro in general, and ECB stimulus in particular. The second quarter was overall more mixed than the strong first quarter. The positive sentiment lasted into the beginning of May before a global sell-off and the Greek debt crisis began to influence markets. The Russian market nevertheless managed to extend the gains from the first quarter and closed the second quarter with a 3.2 percent gain. The rouble has strengthened against the EUR during the first six months, with the oil price moving slightly higher. In July and August, however, the rouble has weakened again amid falling oil prices and weak macro. The Baltic economies have continued to perform well throughout the first half of 2015 and grew faster than the euro zone as a whole, resting on a broad base of domestic and external demand. This despite neighbouring countries having struggled economically lately. The Balkan countries have shown weaker developments, partly due to spill-over fears from Greece.
For 2015, the Baltics and the Balkans are expected to grow 2-3 percent while inflation will remain subdued. The Russian economy is predicted to contract 3-4 percent, with a rebound toward the second half of the year, while the Russian rouble is expected to remain volatile and trade on geopolitics and the oil price. The economic development in East Capital Explorer’s investment region is uneven and significant uncertainties remains. East Capital Explorer’s holdings may therefore be associated with increased risk, which may also impact the possibilities for divestments, while, on the other hand, creating opportunities for new investments.
Other information
Accounting principles
This interim report has been prepared in accordance with International Financial Reporting Standards (IFRS) and International Accounting Standards (IAS) 34 Interim Financial Reporting and applicable provisions in the Swedish Annual Accounts Act (Årsredovisningslagen). The interim report for the Company has
Results

East Capital Explorer AB Interim Report 1 January – 30 June 2015
13
been prepared in accordance with Swedish Financial Reporting
Board (RFR 2) and The Swedish Annual Accounts Act Chapter 9,
Interim report. The parts of IFRSs and RFR 2 that are currently
relevant for East Capital Explorer AB lead to the same accounting.
The two sets of separate financial statements are therefore presented
together as a common single set of accounts.
Any future performance fees to the Investment Manager East
Capital pertaining to direct investments will not be accounted for as
a provision on the balance sheet nor as a contingent liability until a
direct investment has been realized. As all decisions to realise direct
investments needs to be approved by East Capital Explorer’s Board
of Directors, and the payment of any accrued performance fees
therefore are within the Company’s control, it is the Company’s
interpretation of IAS 32 and IAS 37 that no obligation arises until
such a decision is made.
As of Q1 2015, East Capital Explorer has changed its segment
reporting to reflect the ongoing strategic shift. The new segments are
Private Equity, Real Estate and Public Equity. Comparable numbers
for 2014 are restated according to the new segment reporting, see
Note 1 Segment reporting. The classes of investments used in the fair
value disclosures in note 3 have been affected in a corresponding
way. All other accounting principles applied are the same as in the
Annual Report for 2014.
A number of other new standards, amendments to standards and
interpretations are effective for periods beginning after this report
has been published. These are assessed not to have any material
impact on the reports of East Capital Explorer.
For further information about the accounting principles of the
Company, please see Note 1 Accounting principles in the Annual
Report 2014.
Risks and uncertainties
The dominant risk in East Capital Explorer’s operations is
commercial risk in the form of exposure to specific sectors,
geographic regions or individual holdings and financial risk in the
form of market risk, equity price risk, foreign exchange risk and
interest rate risk. A more detailed description of East Capital
Explorer’s material risks and uncertainties is provided in the
Company’s Annual Report 2014 on pages 40-42. An assessment for
the coming months is provided in the Business Environment and
Market section above.
In addition, through the business activities of their holdings, i.e.
their offerings of products and services, within the respective sectors,
the investments are also exposed to legal/regulatory risk and
political risk, for example political decisions on public sector
expenditures and industry regulations.
Fees
For direct investments, an annual management fee of 2% is charged
by the Investment Manager, besides for Real Estate investments,
where the management fee corresponds to 1.75%. Further,
performance fee of 20% of profits is paid provided that a threshold
value of 8% annually has been achieved. Performance fees are only
charged on realized investments.
For fund investments, the fee terms of the relevant fund applies,
which normally corresponds to an annual management fee of 1.95%
(plus additional administrative expenses and charges, among others
an AIFMD related charge of 0.1% and custody fees) and 20%
performance fee (for real estate funds, the management fee is 1.75%).
For East Capital Frontier Markets Fund, which is a UCITS fund, East
Capital Explorer is charged a rebated management fee of 1% (plus an
additional "all-in" fee for fund administration, depository and other
expenses of 0.45% NAV). The fund does not charge any performance
fee.
No performance fees are to be paid out until the net asset value per
ordinary share exceeds SEK 100. For direct investments, an
additional condition for payment is that all direct investments, in
total, show a positive result. Additionally, all management fees on
portfolio values exceeding EUR 400m is reduced to 1.0%. Catch-up
clauses in the range of 0/100 – 50/50, related to profit distribution
after the hurdle is reached, are applicable for direct investments as
well as real estate investments. For more details about fees, please
see the latest Annual Report available on the Company’s website.
Related party transactions January-June 2015
There have been no related party transactions during the year, other
than fee payments according to agreements in place. East Capital
Explorer Investments SA has a related party relationship with its
subsidiaries, with companies in the East Capital Group, as well as
with management and employees.
East Capital Explorer AB, East Capital Explorer Investments SA
and East Capital Explorer Investments AB have a licensing
agreement with East Capital Explorer Licensing AB, pursuant to
which East Capital Explorer Licensing AB has granted a non-
exclusive, royalty-free license to use the trade name and trademark
“East Capital Explorer”.
During the first six months of 2015, the fees paid by East Capital
Explorer Investments SA to East Capital Asset Management SA were
EUR -2.5m (EUR +8.1m). The fees in 2014 were positive due to
reversed performance fees relating to earlier years.
The Company has a service agreement with East Capital
International AB, a service company within East Capital, pursuant to
which the Company buys certain administrative and other services.
The Company has a sub rent premises agreement with East Capital
International AB. During the first six months of 2015, the Company
purchased services for EUR 0.0m (EUR 0.1m), all through the
Parent Company.
East Capital Explorer AB's management, Board members and their
close relatives and related companies control 23 percent of voting
rights in the Company.
The CEO of East Capital Explorer AB is a Board member of East
Capital Explorer Investments SA and a member of the Investment
Committee of East Capital Explorer Investments SA (the AIFM).
Comparative numbers in parenthesis refer to January-June 2014.
Organisational and investment structure
East Capital Explorer AB (publ) is a Swedish investment company
listed on Nasdaq Stockholm. East Capital Explorer’s business
concept is to maximise risk-adjusted shareholder return by offering
shareholders a liquid exposure to a unique investment portfolio of
primarily unlisted companies in Eastern Europe. Value is added
through active ownership made possible by the investment manager
East Capital’s local presence, extensive network and long experience
in the Eastern European markets.
East Capital Explorer’s strategy is to invest in sectors and
companies that have the most to gain from the long-term trends in
its investment universe. Strong domestic demand is a key driver for
growth in Eastern Europe and this is the main investment theme.
East Capital Explorer targets fast growing sectors such as retail,
consumer goods, financials and real estate. The investment portfolio
is actively managed to optimize the long-term value. All investments
are considered carefully from a risk-reward perspective. Risks are
managed on the basis of a number of methods and tools, among
others, through emphasis on corporate governance, including
material and relevant environmental and social factors. Active
ownership also involves board representation and close relations
with the companies in which East Capital Explorer invests.
For further information about the organizational and investment
structure of the Company, please see the Corporate Governance
Report for 2014, included in the Annual Report and on the
Company’s web site www.eastcapitalexplorer.com under the section,
‘Corporate Governance’.

East Capital Explorer AB Interim Report 1 January – 30 June 2015
14
Redemption program and repurchase of shares
On 24 March 2015, The Board of East Capital Explorer AB resolved
to initiate a share repurchase program in order to increase
shareholder value. The decision to repurchase shares fell within the
scope of the authorization given to the Board by the Annual General
Meeting 2014. The Company repurchased a total of 166,100 shares
during the period 25 March through 13 April 2015, corresponding to
0.55% of the Company's outstanding shares, at an average price of
SEK 57.07 per share. The Board intends to propose to the 2016
Annual General Meeting (AGM), or sooner, that the share capital in
the company be reduced by cancelling the repurchased shares. At the
AGM on 21 April 2015, it was resolved to renew the mandate to
repurchase a maximum of 10 percent of the Company's outstanding
shares.
At the AGM, it was further resolved that East Capital Explorer
would offer its shareholders to redeem 5 percent of the Company’s
outstanding shares at a price of SEK 83 (corresponding to EUR 8.99)
for each redeemed share. The redemption price was equivalent to the
Company’s Net Asset Value per share on 31 December 2014. A total
of 1,466,468 ordinary shares were tendered for redemption during
the period 26 May to 22 June 2015, corresponding to an acceptance
level of approximately 98.5 percent. Consequently, a total of SEK
121,716,844, EUR 13.2m, was paid out on 15 July 2015 to the
shareholders participating in the redemption program.
The total number of shares outstanding in East Capital Explorer as
of 30 June 2015 amounted to 28,310,692, adjusted for the shares
redeemed under the above mentioned redemption program and the
repurchased shares. The weighted average number of shares
outstanding for the reporting period was 30,469,298, adjusted for
the redemption program and the repurchased shares.
Dividend
A new dividend policy was adopted as of 21 April 2015. The new
policy implies that at least 50 percent of the dividends received from
portfolio holdings will be distributed to shareholders. With an
ordinary dividend as a base, share redemptions and repurchases can
also be used from time to time to enhance shareholder value. The
first dividend, in accordance with the policy, will be proposed to the
Annual General Meeting 2016.
Events occurring after the end of the quarter
In July and August, shares in East Capital Deep Value Fund were
sold for an amount equivalent to EUR 2.0m, in East Capital Russia
Domestic Growth Fund for an amount equivalent to EUR 2.0m and
in East Capital Frontier Markets Fund for an amount equivalent to
EUR 1.0m.
On 10 July 2015, East Capital Explorer announced a commitment
to invest EUR 20m in total in the new fund East Capital Baltic
Property Fund III. No amount has so far been drawn down.
The Board has decided to launch a new share buyback program
starting on 21 of August.
The Board of Directors and CEO give their assurance that the interim
report presents a true and fair view of the Company's and the
Group’s operations, financial position and profits and describes the
significant risks and uncertainties facing the Company and the
Group.
Stockholm, 20 August 2015
Lars O Grönstedt Mia Jurke
Chairman of the Board Chief Executive Officer
Peter Elam Håkansson Liselotte Hjorth
Board Member Board Member
Alexander Ikonnikov Mikael Nachemson
Board Member Vice Chairman
Jenny Rosberg
Board Member
Contact information
Mia Jurke, CEO, +46 8 505 885 32
Lena Krauss, CFO and Head of Investor Relations, +46 8 505 885 94
East Capital Explorer AB
Kungsgatan 33, Box 7214
SE-103 88 Stockholm, Sweden
Tel: +46 8 505 977 00
www.eastcapitalexplorer.com
Financial calendar
• Interim Report, Q3 2015 – 5 November 2015
• Year-end Report 2015 – 11 February 2016
Subscribe to financial reports and press releases directly to your
e-mail on: www.eastcapitalexplorer.com or by sending an email to
The information in this interim report is the information which East
Capital Explorer AB is required to disclose under Sweden’s
Securities Market Act. It was released for publication at 08:00 a.m.
CET on 20 August 2015

East Capital Explorer AB Interim Report 1 January – 30 June 2015
15
To the Board of East Capital Explorer AB (publ) Corporate identity number 556693-7404
Introduction
We have reviewed the summary interim financial information (interim report) of East Capital Explorer AB (publ) as of 30 June 2015 and the six-month period then ended except for the portfolio reporting on pages 5-11. The Board of Directors and the Managing Director are responsible for the preparation and presentation of this interim report in accordance with IAS 34 and the Annual Accounts Act. Our responsibility is to express a conclusion on this interim report based on our review.
Scope of the Review
We conducted our review in accordance with the Standard on review engagements (ISRE) 2410 Review of Interim Financial Information Performed by the Independent Auditor of the Entity. A review of interim financial information consists of making inquiries, primarily of persons responsible for financial and accounting matters, and applying analytical and other review procedures. A review is substantially less in scope than an audit conducted in accordance with International Standards on Auditing and other generally accepted auditing practices. The procedures performed in a review do not enable us to obtain a level of assurance that would make us aware of all significant matters that might be identified in an audit. Accordingly, we do not express an audit opinion.
Conclusion
Based on our review, nothing has come to our attention that causes us to believe that the interim report is not prepared, in all material respects, for the Group in accordance with IAS 34 and the Annual Accounts Act, and for the Parent Company in accordance with the Annual Accounts Act.
Stockholm, 20 August 2015 KPMG AB
Mårten Asplund Anders Malmeby Authorised Public Accountant Authorised Public Accountant
This review report is a translation of the original review report in Swedish.
Review Report

East Capital Explorer AB Interim Report 1 January - 30 June 2015
2015 2014 2015 2014Note Jan-Jun Jan-Jun Apr-Jun Apr-Jun
1 17,477 2,830 1,147 23,806
-415 -404 -200 -201
-418 -578 -211 -298
16,644 1,847 736 23,306
126 751 126 367
-6 -5 -5 -3
16,764 2,593 857 23,670
- - - -
16,764 2,593 857 23,670
Earnings per share, EUR
0.55 0.08 0.03 0.72
No dilutive effects during the periods
2015 2014 2014Note 30 Jun 31 Dec 30 Jun
Assets
Shares in subsidiaries 2, 3 266,121 260,644 266,908
Total non-current assets 266,121 260,644 266,908
Loans group companies - - 29,315
Other short-term receivables - 1 -
Accrued income and prepaid expenses 7 16 16
Cash and cash equivalent 11,258 1,057 1,811
Total current assets 11,265 1,074 31,143
Total assets 277,386 261,718 298,051
Equity
Share capital13,650 3,650 3,650
Other contributed capital/Share premium reserve2320,377 334,564 334,564
Retained earnings including other reserves2-76,901 -43,055 -42,972
Net profit/loss for the period216,764 -33,846 2,593
Total equity 263,892 261,314 297,836
Current liabilities
Other liabilities 13,279 129 97
Accrued expenses and prepaid income 215 275 119
Total current liabilities 13,495 404 216
Total equity and liabilities 277,386 261,718 298,051
1 Restricted capital2 Unrestricted capital
Income Statement
EUR Thousands
Changes in fair value of subsidiaries
Staff expenses
Other operating expenses
Operating profit/loss
Financial income
Financial expenses
Profit/loss before tax
EUR Thousands
Tax
NET PROFIT/LOSS FOR THE PERIOD1
1 Net Profit/Loss for the period corresponds to Total Comprehensive income
Balance sheet
- Attributable to shareholders of the Parent Company
16

East Capital Explorer AB Interim Report 1 January - 30 June 2015
Statement of Changes in Equity
EUR Thousands
Share capital
Othercontributed
capital/Sharepremium
reserve Other reserves
Retainedearnings incl.profit/loss for
the year
Total equityshareholders
in Parentcompany
Opening equity 1 January 2015 3,650 334,564 -619 -76,282 261,314
Net profit/loss for the period - - - 16,764 16,764
Total comprehensive income - - - 16,764 16,764
Redemption program - -13,170 - - -13,170
Share buy-back - -1,017 - - -1,017
Closing equity 30 June 2015 3,650 320,377 -619 -59,518 263,891
EUR Thousands
Share capital
Othercontributed
capital/Sharepremium
reserve Other reserves
Retainedearnings incl.profit/loss for
the year
Total equityshareholders
in Parentcompany
Opening equity 1 January 2014 3,640 348,183 - -42,435 309,387
Net profit/loss for the period - - - 2,593 2,593
Total comprehensive income - - - 2,593 2,593
Bonus issue 10 -10 - - -
Redemption program - -13,609 -62 - -13,671
Other reserves - - -474 - -474
Closing equity 30 June 2014 3,650 334,564 -537 -39,843 297,836
Statement of Cash Flow
2015 2014 2015 2014Jan-Jun Jan-Jun Apr-Jun Apr-Jun
Operating activities
Operating profit/loss 16,644 1,847 736 23,306
Changes in fair value of subsidiaries -17,477 -2,830 -1,147 -23,806
Interest received - 751 - 367-833 -231 -411 -132
Cash flow from changes in working capital
Increase (-)/decrease(+) in other current receivables 10 5 4 357
Increase (+)/decrease(-) in other current payables -79 -725 -268 -966-902 -951 -675 -741
Investing activities
Repayment of shareholder contributions 12,000 15,600 9,500 15,60012,000 15,600 9,500 15,600
Financing activities
Redemption program - -13,609 - -13,609
Share buy-back -1,017 - -622 -
-1,017 -13,609 -622 -13,609
Cash flow for the period 10,081 1,040 8,203 1,250
1,057 776 2,934 564
Exchange rate differences in cash and cash equivalents 120 -5 121 -3
11,258 1,811 11,258 1,811Cash and cash equivalent/cash and bank at the end of the period
Cash flow from financing activities
Cash flow from current operations before changes in working capital
Cash flow from investing activities
Cash flow from operating activities
EUR Thousands
Cash and cash equivalent at the beginning of the period
17

East Capital Explorer AB Interim Report 1 January - 30 June 2015
Note 1 Segment Reporting
EUR thousands
1 Jan – 30 Jun 2015 Unallocated
Changes in value of portfolio 4,516 1,674 10,140 2,651 - 18,982
Other operating expenses (including management fees) -994 -210 -73 - -228 -1,505
Changes in value of subsidiaries 3,523 1,463 10,068 2,651 -228 17,477
Staff expenses - - - - -415 -415
Other operating expenses - - - - -418 -418
Operating profit/loss 3,523 1,463 10,068 2,651 -1,061 16,644
Financial income - - - - 126 126
Financial expense - - - - -6 -6
Profit/loss before tax 3,523 1,463 10,068 2,651 -940 16,764
Assets 110,061 50,294 66,152 50,946 -67 277,386
EUR thousands
1 Jan – 30 Jun 2014 Unallocated
Changes in value of portfolio -7,462 181 -468 2,159 - -5,590
Other operating expenses (including management fees) 9,768 -380 -82 -1 -885 8,420
Changes in value of subsidiaries 2,306 -199 -550 2,158 -885 2,830
Staff expenses - - - - -404 -404
Other operating expenses - - - - -578 -578
Operating profit/loss 2,306 -199 -550 2,158 -1,867 1,847
Financial income - - - - 751 751
Financial expense - - - - -5 -5
Profit/loss before tax 2,306 -199 -550 2,158 -1,121 2,593
Assets 98,971 43,165 139,930 16,428 -443 298,051
Note 2 Entities with ownership interests over 50 percent
East Capital Explorer Investments SA 4,000 266,121 100%
11,000 6,877 100%
Humarito Limited 2,000 237,278 100%
Baltic Cable Holding OÜ 2,501 - 100%
Starman AS 10,758 62,029 63%
UAB Portarera1 300 24,771 100%
UAB Solverta1 100 - 100%
UAB Verslina1 100 - 100%
East Capital Deep Value Fund 56,740 46,093 75%
East Capital Frontier Markets Fund 395,916 35,839 56%
East Capital Baltic Property Fund II 189,758 25,522 53%
21,955 13,501 92%East Capital Russia Domestic Growth Fund Bertrange, Luxembourg
1) The operations in UAB Portarera, UAB Solverta and UAB Verslina have been aggregated as they are consolidated as 3 Burės
Vilnius, Lithuania
Vilnius, Lithuania
Bertrange, Luxembourg
Bertrange, Luxembourg
Bertrange, Luxembourg
Stockholm, Sweden
Nicosia, Cyprus
Tallinn, Estonia
Tallinn, Estonia
Vilnius, Lithuania
The following entities, in which the ownership interest is over 50%, are not consolidated due to the consolidation exception for investment entities.
CountryNumber of
shares
Book value,EUR
thousandsOwnership
capital
Real Estate Public EquityShort-term
investments Total
East Capital Explorer AB classifies the Company’s various segments based on the nature of the investments. Segment results and assets include items directlyattributable to the segment, which can be allocated in a reasonable and dependable manner. Management monitors the holdings on the basis of fair value, and allholdings are reported at fair value through profit or loss in accordance with IAS 39. As the value of the holding in East Capital Explorer Investments SA, where theinvestment activities are managed, is directly dependable of the investment portfolio, the value change of holdings held by the subsidiary has been allocated to valuechanges, dividends received and other operating expenses that are directly attributable to the underlying investments in private equity, real estate, public equity orshort-term investments. All other revenues and expenses are classified as unallocated in the table below. As of Q1 2015, East Capital Explorer has changed itssegment reporting to reflect the ongoing strategic shift (previously, the segment reporting was classified as Direct Investments, Fund Investments and Short-terminvestments). Comparable numbers for 2014 are restated according to the new segment reporting.
East Capital Explorer Investments AB
Real Estate Public Equity
Non consolidated entities 30 June 2015
Private Equity
Private Equity
Short-terminvestments Total
Bertrange, Luxembourg
18

East Capital Explorer AB Interim Report 1 January - 30 June 2015
Note 3 Financial instruments
Calculation of fair value
Shares in subsidiaries/financial instruments
Shares in subsidiaries Country 30 Jun 2015 31 Dec 2014 30 Jun 2015 31 Dec 2014
East Capital Explorer Investments SA Bertrange, Luxembourg 266,121 260,644 100 100
EUR Thousands
30 June 2015
Breakdown of values in subsidiaries,including loans to subsidiaries Total
Opening balance 1 January 2015 85,028 48,620 70,442 52,188 4,557 -191 260,644
Reclassifications -1,997 - - 1,997 - - -
Purchase/additions 22,514 - - - -22,514 - -
Divestments/Reductions - - -14,430 -19,618 34,048 - -
Other - - - - -1,621 117 -1,504
Repaid shareholders contributions - - - - -12,000 - -12,000
4,516 1,674 10,140 2,651 - - 18,982
Closing balance 30 June 2015 110,061 50,294 66,152 37,218 2,470 -74 266,121
EUR Thousands
31 December 2014
Breakdown of values in subsidiaries,including loans to subsidiaries Total
Opening balance 1 January 2014 106,435 20,670 172,321 112 19,471 -10,016 308,993
Reclassifications - - -17,820 17,820 - - -
Purchase/additions - 24,643 - 50,236 -74,880 - -
Divestments/Reductions -691 - -58,190 -19,452 78,332 - -
Other - - - - -2,980 9,825 6,845
Repaid shareholders contributions - - - - -15,600 - -15,600
Dividend received - - - - 214 - 214
-20,715 3,306 -25,870 3,471 - - -39,80885,028 48,620 70,442 52,188 4,557 -191 260,644
• Level 2: Inputs other than quoted prices included within level 1 that are observable for the asset or liability, either directly (that is, as prices) or indirectly (that is,derived from prices).
• Level 3: Inputs for the asset or liability that are not based on observable market data (that is, unobservable inputs).
The level in the fair value hierarchy within which the fair value measurement is categorised in its entirety is determined on the basis of the lowest level of input that issignificant to the fair value measurement in its entirety. For this purpose, the significance of an input is assessed against the fair value measurement in its entirety. Ifa fair value measurement uses observable inputs requiring significant adjustment based on unobservable inputs, such measurement is a level 3 measurement.Assessing the significance of a particular input to the fair value measurement in its entirety requires judgment, considering factors specific to the financial asset orliability.
The determination of what constitutes ‘observable’ requires significant judgment by the Company. The Company considers observable data to be market data that isreadily available, regularly distributed or updated, reliable and verifiable, not proprietary, and provided by independent sources that are actively involved in therelevant market. The remaining equity funds are classified in the level where underlying equities to a predominant proportion have been classified.
In the Parent company, financial instruments consist of shares in subsidiaries of EUR 266.1m and cash and cash equivalent of EUR 11.3m. The carrying amount ofthese assets constitutes the fair value on the balance sheet date.
Real Estate Public Equity
Financial instruments not measured at fair value through profit and lossFor accounts receivable and accounts payable, the carrying amount is assessed to reflect fair value since the remaining maturity is generally short. This is also thecase for cash and bank. East Capital Explorer AB measures its loan to group companies at amortised cost according to the effective interest method. The value hasbeen assessed to correspond to fair value on the balance sheet date.
The following summarises the main methods and assumptions applied in determining the fair values of the financial instruments in the balance sheet. Please refer tothe Annual Report 2014 for more details on valuation policies used by East Capital Explorer AB.
Fair value hierarchyThe fair value hierarchy has the following levels:
• Level 1: Quoted prices (unadjusted) in active markets for identical assets or liabilities.
For a better understanding of the business, the information regarding financial instruments below is presented on a see-through basis as the fair value of the holdingin the subsidiary East Capital Explorer Investments SA is a result of the fair values of the holdings in the investment activities within East Capital ExplorerInvestments AB and Humarito Ltd. Shares and participations in the investment activities as well as the Company’s holdings in subsidiaries are all valued at fair value.
East Capital Explorer AB owns 100% of the Class A shares, and 4.0% (4.0%) of the votes, in East Capital Explorer Investments SA and is entitled to all profits, assetsand liabilities attributable to that company. East Capital Explorer Investments SA is in turn classified as an investment entity whose total holdings, including itssubsidiaries, are measured at fair value through profit and loss.
As the holdings in East Capital Explorer Investments SA and its investing subsidiary Humarito Ltd are presented on a see through basis, the tables below reflect thefair value hierarchy in the investment activities.
The value of the shares in subsidiaries is directly and indirectly made up by the following assets:
Book value, EURt Share of capital, %
PrivateEquity
Short-terminvestments Cash and bank
Other assetsand liabilities,
net
Real Estate Public EquityShort-term
investments Cash and bank
Other assetsand liabilities,
netPrivateEquity
Changes in fair value recognised net in profit/loss
Changes in fair value recognised net in profit/loss
Closing balance 31 December 2014
19

East Capital Explorer AB Interim Report 1 January - 30 June 2015
Holding Valuation method Valuation assumptions
Starman DCF Long-term growth 2%, Long term operating margin 25%, WACC 6-8%
Melon Fashion Group DCF Long-term growth 4%, Long term operating margin 11%, WACC 17%
Trev-2 Group DCF Long-term growth 2%, Long term operating margin 4%, WACC 9-11%
3 Burės DCF Long-term growth 2.5%, WACC 8-11%
Baltic Property Fund II Yield 7-9%
Effect in EUR thousands30 June 2015
Sensitivity analysis Increase Decrease
Long term growth rate (0.5% movement) 5,472 -4,791
Weighted average cost of capital (WACC) (0.5% movement) -7,059 8,007
Long term operating margin (0.5% movement) 2,577 -2,577
EUR thousands
30 June 2015
- Private Equity - 110,061 110,061
- Real Estate - 50,294 50,294
- Public Equity 66,152 - 66,152
- Short-term investments 35,839 1,379 37,218
Total 101,991 161,734 263,725
EUR thousands
31 December 2014
- Private Equity - 85,028 85,028
- Real Estate - 48,620 48,620
- Public Equity 70,442 - 70,442
- Short-term investments 52,187 1 52,188
Total 122,628 133,650 256,278
EUR thousands30 June 2015
Opening balance 2015 85,028 48,620 - 1 133,649
Reclassifications -1,997 - - 1,997 -
Purchase/additions 22,514 - - - 22,514
Changes in fair value recognised net in profit/loss 4,516 1,674 - -619 5,571
Closing balance 30 June 2015 110,061 50,294 - 1,379 161,734
Private Equity consists of the holdings in Melon Fashion Group (MFG), Starman and Trev-2 Group. Real Estate consists of holdings in 3 Burės and East Capital Baltic Property Fund II. All of these holdings are valued by external appraisers at least once a year, normally at year-end. The fair value of the holdings is assessed on aquarterly basis.
Public Equity consists of funds with a majority of public holdings managed by East Capital, a specialist in emerging and frontier markets, basing its investmentstrategy on thorough knowledge of the markets, fundamental analyses and frequent company visits by its investment teams. The holding in Komercijalna BankaSkopje, which is publicly traded, is also included in Public Equity. Holdings in Public Equity are valued at fair value according to the valuation principles described inprevious page.
* Discounted Cash Flow model (DCF), weighted average cost of capital (WACC)
Short-term investments consist of holdings which are expected to be divested within a year. The holding in East Capital Frontier Markets Fund and East CapitalBering Ukraine Fund R are classified as short-term investments.
For the fair values of Private Equity investments and 3 Burės - reasonably possible changes at the reporting date to one of the significant unobservable inputs, holding other inputs constant, would have the following effects:
Profit or loss
The East Capital Explorer portfolio is presented on page 4 in this report, including information on fair value changes during the period. More information on theportfolio holdings can be found on pages 5 to 11 in this report.
The following table analyses, within the fair value hierarchy, the investments in the investment activities measured at fair value:
Level 1 Level 3 Total balanceShares and participations in investment activities at fair value through profit or loss1
Shares and participations in investment activities at fair value through profit or loss1
Changes in financial assets and liabilities in Level 3PrivateEquity Real Estate Public Equity
Level 1 Level 3 Total balance
Investments with values based on quoted market prices in active markets are classified within Level 1. Investments classified within Level 3 have significantunobservable inputs, as they trade infrequently. Level 3 instruments include mainly unquoted investments. As observable prices are not available for these holdings,valuation techniques are used to derive fair value. Level 3 instruments also include investments in East Capital funds, to the extent they primarily hold unlistedinvestments.
Short-termInvestments Total
1 The following investments are classified in Level 1: East Capital Russia Domestic Growth Fund, East Capital Deep Value Fund, East Capital Frontier Markets Fund and Komercijalna BankaSkopje.The following investments are classified in Level 3: East Capital Baltic Property Fund II, East Capital Bering Ukraine Fund Class R, Melon Fashion Group, Starman, Trev-2 Group and 3 Burės.
20

East Capital Explorer AB Interim Report 1 January - 30 June 2015
EUR thousands31 December 2014
Opening balance 2014 106,434 20,670 - 112 127,217
Purchase/additions - 24,643 - - 24,643
Divestments/Reductions -454 - - -58 -511
Changes in fair value recognised net in profit/loss -20,952 3,306 - -53 -17,69985,028 48,620 - 1 133,649
Risks and uncertainties
Risk factors Change
Fx EUR/RUB +/- 10%
Fx EUR/USD +/- 5%
Equity price +/- 10%
Note 4 Key Figures
Key figures 6m 3m 12m 9m 6m 3m 12m1 9m1
2015 2015 2014 2014 2014 2014 2013 2013
Net asset value (NAV), EUR m 264 279 261 297 298 288 309 284
Equity ratio, % 95.1 99.8 99.8 99.9 99.9 99.8 99.9 99.9
Market capitalisation, SEK m 1,486 1,688 1,273 1,395 1,729 1,587 1,956 1,468
Market capitalisation, EUR m 161 182 134 153 189 178 225 169
Number of outstanding shares, m328.3 29.9 29.9 29.9 29.9 31.4 31.4 31.4
Weighted average number of shares, m 30.5 30.6 31.8 32.3 33.1 33.1 33.1 33.1
Number of employees 4 4 4 4 3 3 4 5
Key figures per share 6m 3m 12m 9m 6m 3m 12m1 9m1
2015 2015 2014 2014 2014 2014 2013 2013
Earnings per share, EUR 0.55 0.52 -1.06 0.07 0.08 -0.64 0.70 -0.06
Dividend per share, EUR - - - - - - - -
NAV, SEK 86 87 83 90 91 82 87 79
NAV, EUR 9.32 9.35 8.73 9.94 9.95 9.17 9.85 9.04
Share price, SEK252.50 56.50 42.50 46.60 57.75 50.50 62.25 46.70
Share price, EUR25.68 6.10 4.49 5.12 6.31 5.67 7.00 5.38
SEK/EUR 9.25 9.26 9.47 9.11 9.15 8.91 8.89 8.69
1 Recalculated due to amendments to IFRS 10 and IAS 27 regarding accounting by investment entities2 Not adjusted for redemption programs3 Number of outstanding shares per 30 June 2015 is adjusted for redemption program
EUR 5,571 thousands (EUR -17,646 thousands) of changes in fair value recognised net in profit/loss relate to investments still held at the end of the period.
Closing balance 31 December 2014
Effect on netprofit/loss for the period
4,101
4,165
26,373
PrivateEquity
Sensitivity analysis for market risks (EUR Thousands)
For information about risks, uncertainties and information about the business environments and markets in which East Capital Explorer invests, please see page 12.For a summary of the methods and assumptions used to determine fair value of the portfolio holdings please see Note 3 and in more detail on page 71 in the AnnualReport of 2014. The effect of fluctuations in the major parameters on the value of the portfolio holdings is presented in the table below:
30 June 2015
Changes in financial assets and liabilities in Level 3 Real Estate Public EquityShort-term
Investments Total
21

Kungsgatan 33, Box 7214SE-103 88 Stockholm, Sweden
Tel: +46 8 505 97 700Coroporate identity no: 556693-7404
www.eastcapitalexplorer.com


