
kiw
i p
rop
ert
y
inte
rim
re
su
lt p
res
en
tati
on
2018
interim result
FOR THE SIX MONTHS ENDED30 SEPTEMBER 2017
kiwi 2-19
how we’re delivering 3
interim result 9
the bricks and mortar story / sales 13
outlook and dividend guidance 18
property 20-51
appendix 1.00 property portfolio review 22
appendix 2.00 development update 38
appendix 3.00 markets update 49
group 52-73
appendix 4.00 strategy 54
appendix 5.00 financial review 58
appendix 6.00 other information 70
This interim result presentation, for the six months ended 30 September 2017, should be read in conjunction with the NZX announcement and online interim report also released on 20 November 2017. Refer to our website kp.co.nz or nzx.com.
Property statistics within this presentation represent owned assets only; property interests managed on behalf of third parties are excluded.
Unless otherwise indicated, all of the numerical data provided in this Presentation is stated as at or for the six months ended 30 September 2017. All amounts are in New Zealand dollars. Due to rounding, numbers within this Presentation may not add up precisely to the totals provided and percentages may not precisely reflect the absolute figures.
Refer to Appendix 6.01 of this presentation for a glossary of terms.Photography Logan West
creating a world-class town centre at Sylvia Park
3
2.02-2.10 Sylvia Park development
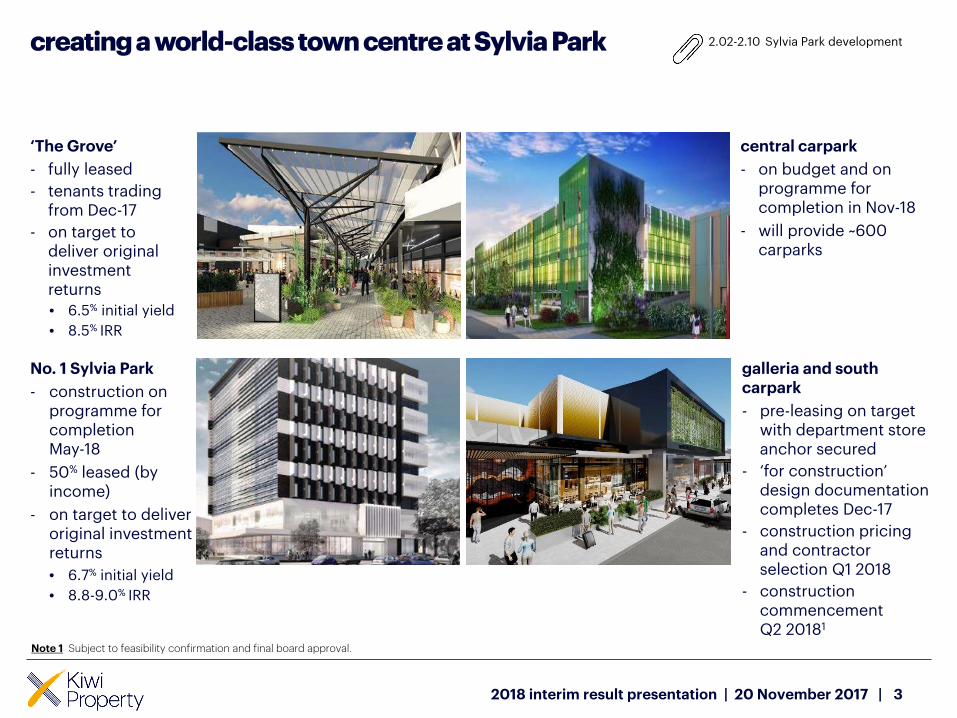
‘The Grove’
- fully leased
- tenants trading from Dec-17
- on target to deliver original investment returns
• 6.5% initial yield
• 8.5% IRR
central carpark
- on budget and on programme for completion in Nov-18
- will provide ~600 carparks
No. 1 Sylvia Park
- construction on programme for completion May-18
- 50% leased (by income)
- on target to deliver original investment returns
• 6.7% initial yield
• 8.8-9.0% IRR
2018 interim result presentation | 20 November 2017 |
galleria and south carpark
- pre-leasing on target with department store anchor secured
- ‘for construction’ design documentation completes Dec-17
- construction pricing and contractor selection Q1 2018
- construction commencement Q2 20181
Note 1 Subject to feasibility confirmation and final board approval.
42018 interim result presentation | 20 November 2017 |
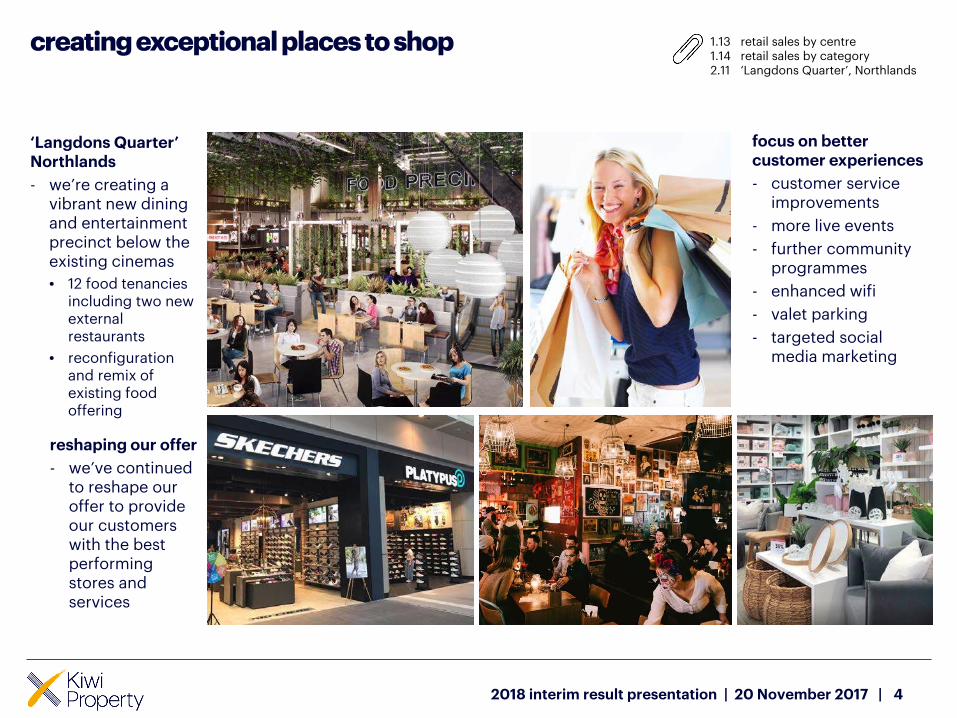
‘Langdons Quarter’ Northlands
- we’re creating a vibrant new dining and entertainment precinct below the existing cinemas
• 12 food tenancies including two new external restaurants
• reconfiguration and remix of existing food offering
Artists impression. Concept only. Subject to change.
focus on better customer experiences
- customer service improvements
- more live events
- further community programmes
- enhanced wifi
- valet parking
- targeted social media marketing
creating exceptional places to shop
reshaping our offer
- we’ve continued to reshape our offer to provide our customers with the best performing stores and services
1.131.142.11
retail sales by centreretail sales by category‘Langdons Quarter’, Northlands
creating exceptional places to work
52018 interim result presentation | 20 November 2017 |
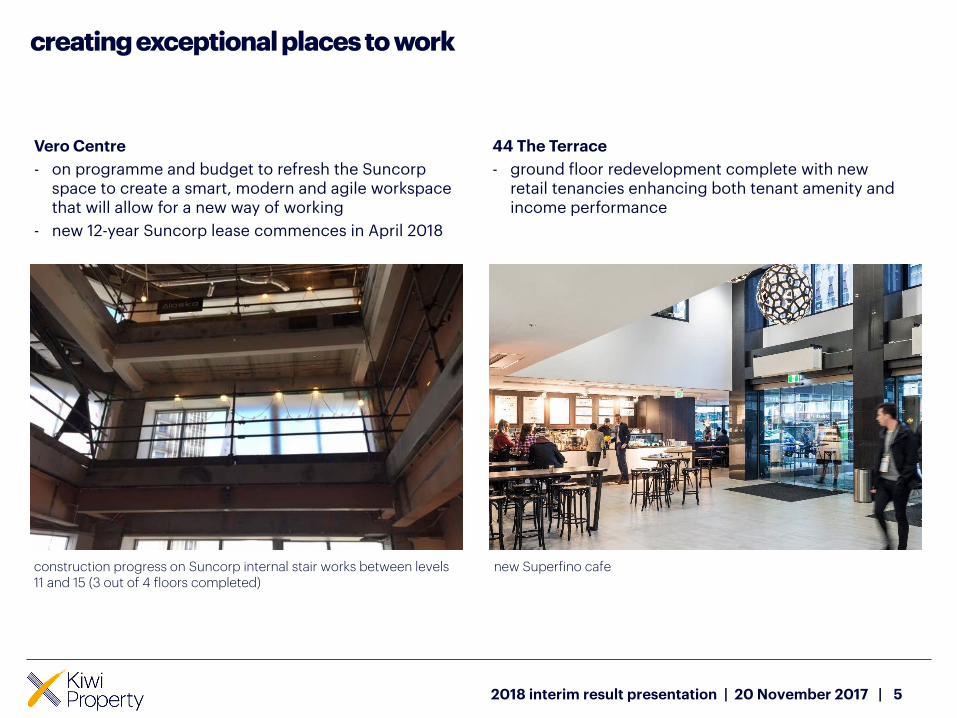
Vero Centre
- on programme and budget to refresh the Suncorp space to create a smart, modern and agile workspace that will allow for a new way of working
- new 12-year Suncorp lease commences in April 2018
44 The Terrace
- ground floor redevelopment complete with new retail tenancies enhancing both tenant amenity and income performance
construction progress on Suncorp internal stair works between levels 11 and 15 (3 out of 4 floors completed)
new Superfino cafe
recycling capital to fund future growth
62018 interim result presentation | 20 November 2017 |
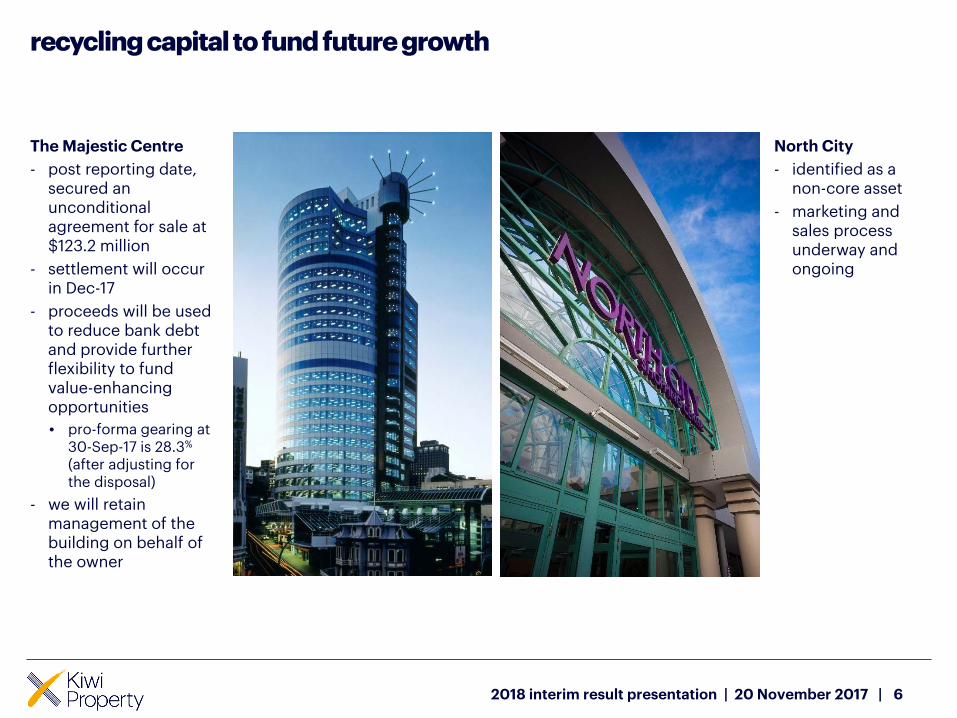
The Majestic Centre
- post reporting date, secured an unconditional agreement for sale at$123.2 million
- settlement will occur in Dec-17
- proceeds will be used to reduce bank debt and provide further flexibility to fund value-enhancing opportunities
• pro-forma gearing at 30-Sep-17 is 28.3%
(after adjusting for the disposal)
- we will retain management of the building on behalf of the owner
North City
- identified as a non-core asset
- marketing and sales process underway and ongoing
building long-term investment opportunities
72018 interim result presentation | 20 November 2017 |
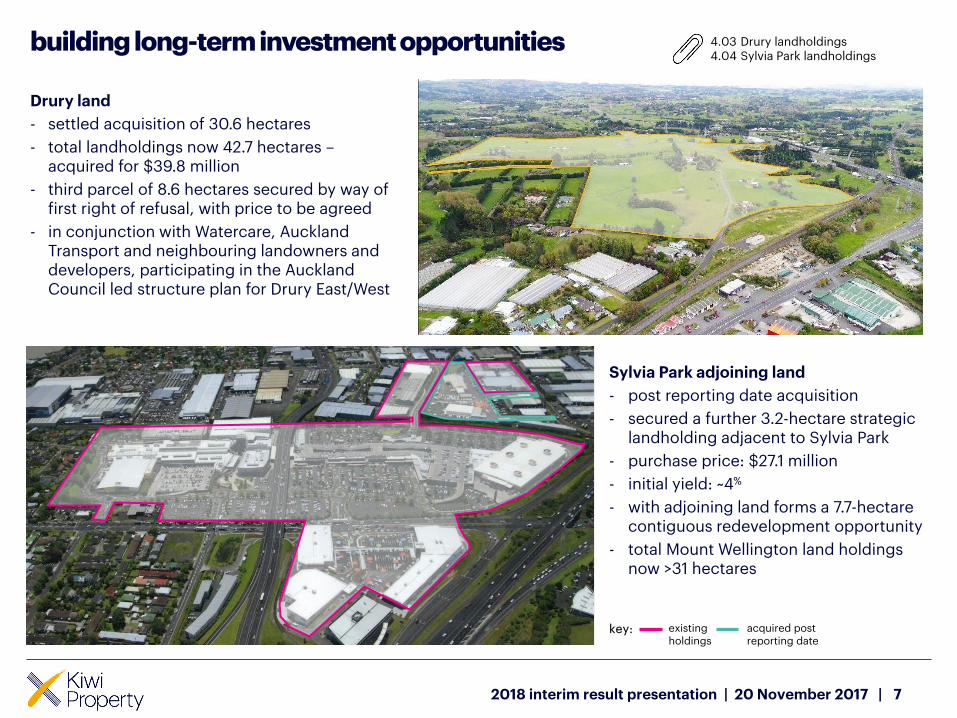
Drury land
- settled acquisition of 30.6 hectares
- total landholdings now 42.7 hectares –acquired for $39.8 million
- third parcel of 8.6 hectares secured by way of first right of refusal, with price to be agreed
- in conjunction with Watercare, Auckland Transport and neighbouring landowners and developers, participating in the Auckland Council led structure plan for Drury East/West
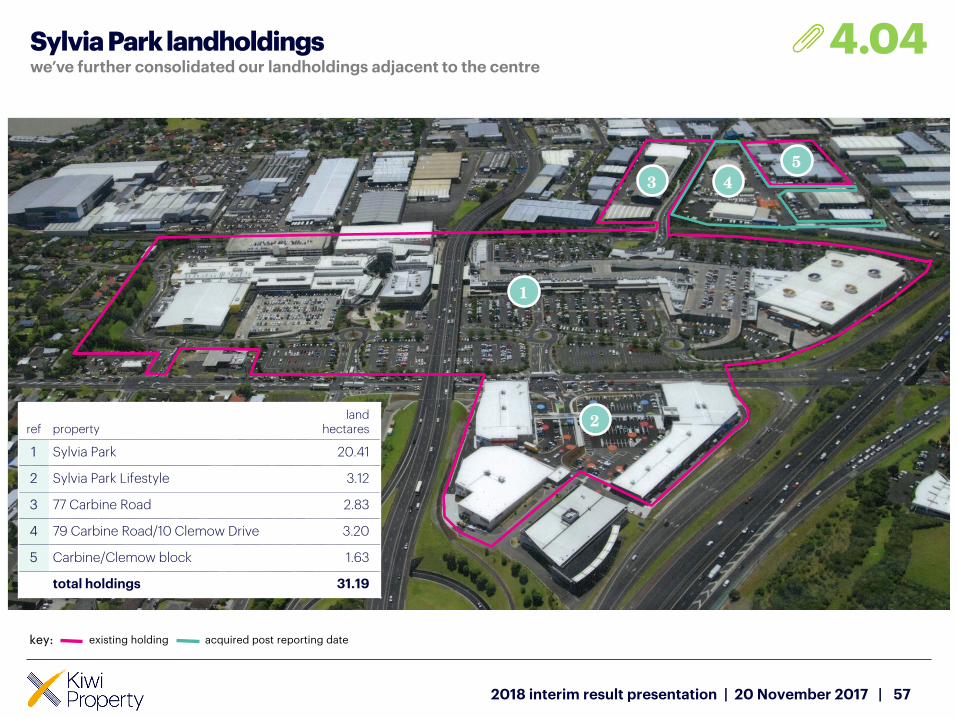
Sylvia Park adjoining land
- post reporting date acquisition
- secured a further 3.2-hectare strategic landholding adjacent to Sylvia Park
- purchase price: $27.1 million
- initial yield: ~4%
- with adjoining land forms a 7.7-hectare contiguous redevelopment opportunity
- total Mount Wellington land holdings now >31 hectares
key: existing holdings
acquired post reporting date
4.034.04
Drury landholdingsSylvia Park landholdings
continuing to lead in sustainability achievements
8
1.16 sustainability achievements
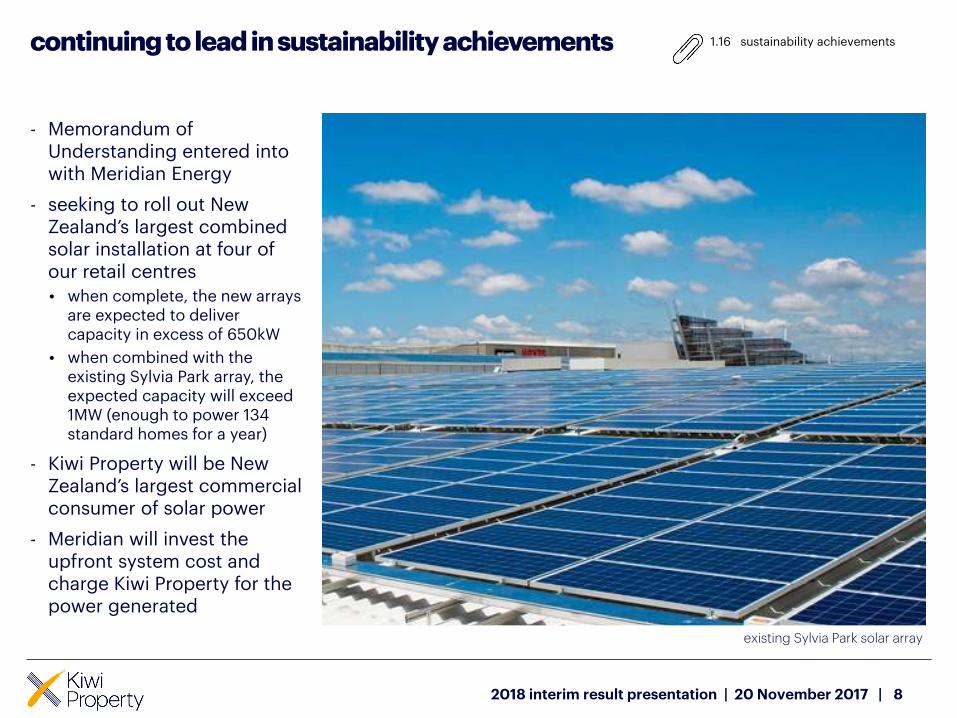
- Memorandum of Understanding entered into with Meridian Energy
- seeking to roll out New Zealand’s largest combined solar installation at four of our retail centres
• when complete, the new arrays are expected to deliver capacity in excess of 650kW
• when combined with the existing Sylvia Park array, the expected capacity will exceed 1MW (enough to power 134 standard homes for a year)
- Kiwi Property will be New Zealand’s largest commercial consumer of solar power
- Meridian will invest the upfront system cost and charge Kiwi Property for the power generated
2018 interim result presentation | 20 November 2017 |
existing Sylvia Park solar array
our strategy is delivering robust financial results
9
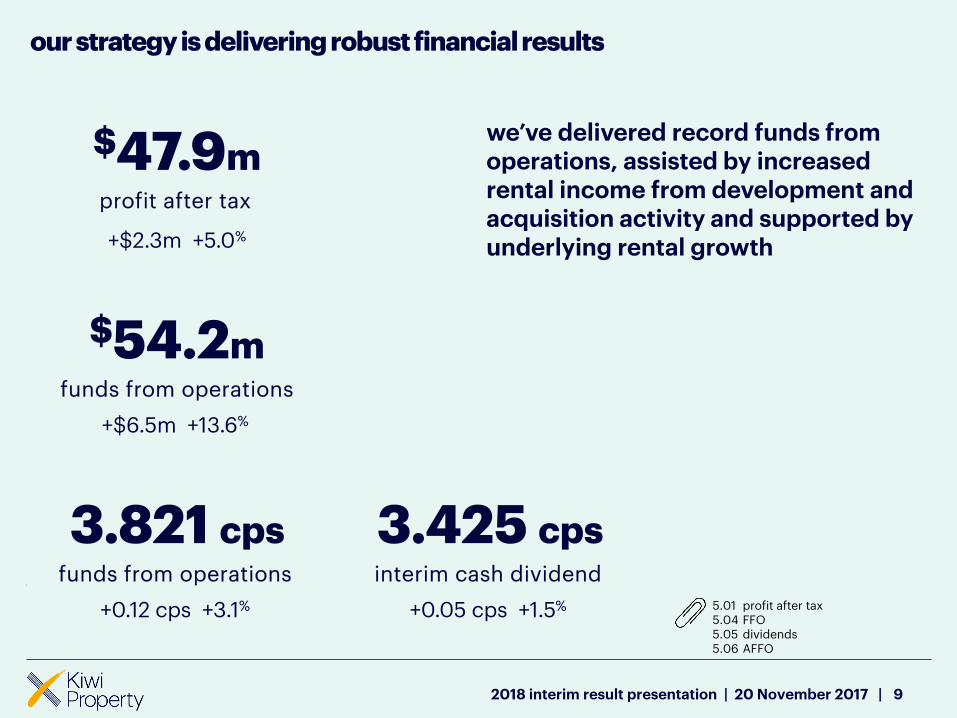
$47.9mprofit after tax
+$2.3m +5.0%
$54.2mfunds from operations
+$6.5m +13.6%
3.821 cpsfunds from operations
+0.12 cps +3.1%
we’ve delivered record funds from operations, assisted by increased rental income from development and acquisition activity and supported by underlying rental growth
5.015.045.055.06
profit after taxFFOdividendsAFFO
2018 interim result presentation | 20 November 2017 |
3.425 cpsinterim cash dividend
+0.05 cps +1.5%
we’ve maintained a strong balance sheet
10
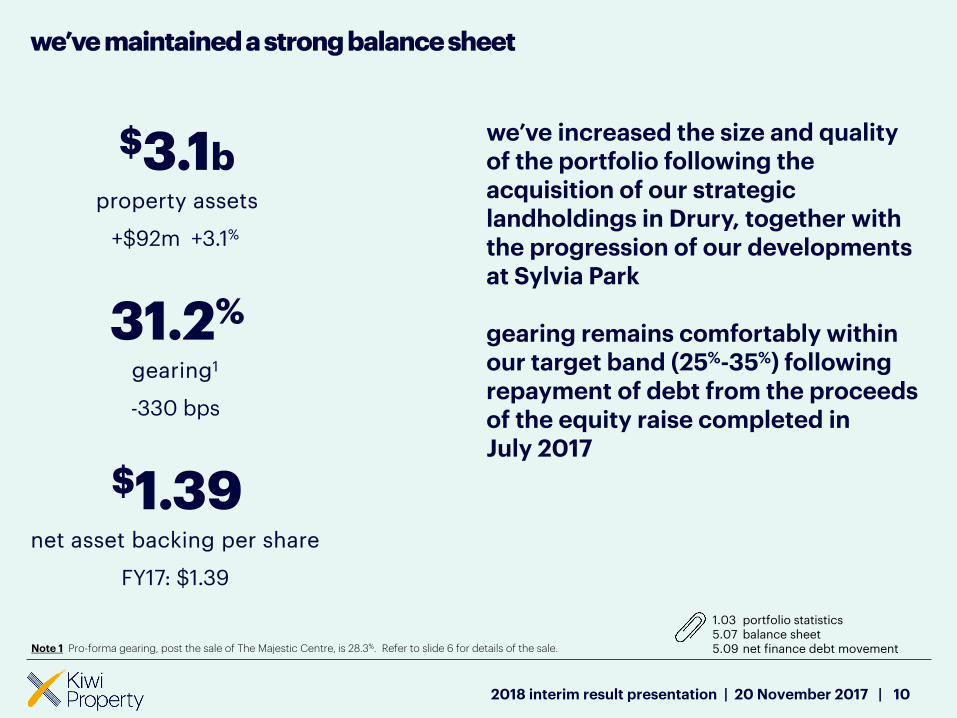
we’ve increased the size and quality of the portfolio following the acquisition of our strategic landholdings in Drury, together with the progression of our developments at Sylvia Park
gearing remains comfortably within our target band (25%-35%) following repayment of debt from the proceeds of the equity raise completed in July 2017
$3.1bproperty assets
+$92m +3.1%
31.2%
gearing1
-330 bps
$1.39net asset backing per share
FY17: $1.39
1.035.075.09
portfolio statisticsbalance sheetnet finance debt movement
2018 interim result presentation | 20 November 2017 |
Note 1 Pro-forma gearing, post the sale of The Majestic Centre, is 28.3%. Refer to slide 6 for details of the sale.
we’re delivering on our capital management strategy
11
5.075.095.105.115.12
balance sheetnet finance debt movementfinance debt facilitiescapital management metricsfixed-rate debt profile
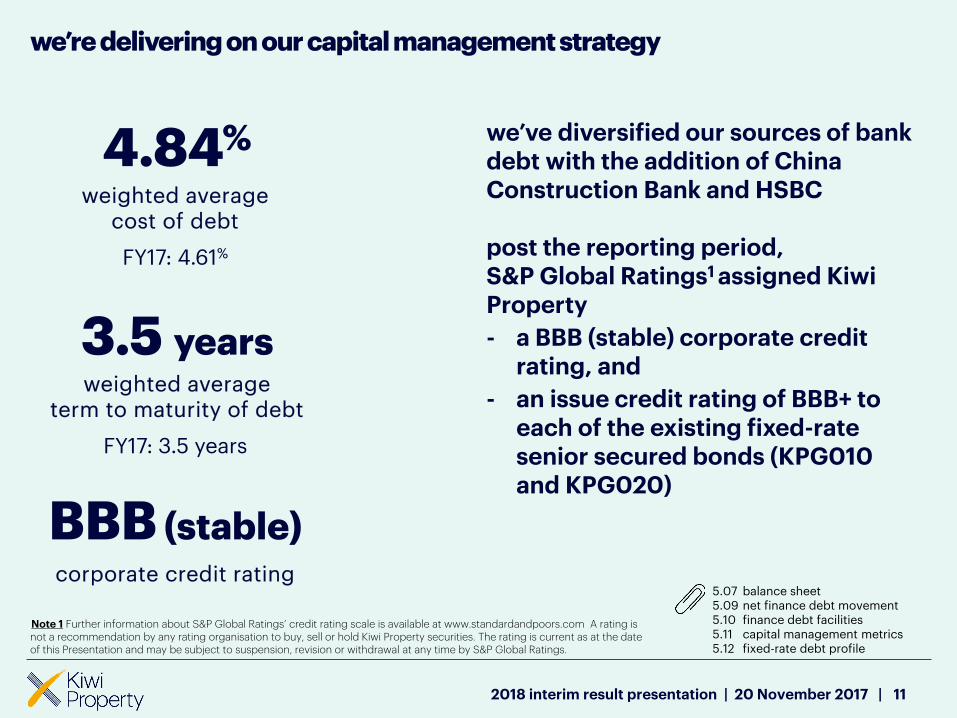
we’ve diversified our sources of bank debt with the addition of China Construction Bank and HSBC
post the reporting period, S&P Global Ratings1 assigned Kiwi Property
- a BBB (stable) corporate credit rating, and
- an issue credit rating of BBB+ to each of the existing fixed-rate senior secured bonds (KPG010 and KPG020)
4.84%
weighted averagecost of debt
FY17: 4.61%
3.5 yearsweighted average
term to maturity of debt
FY17: 3.5 years
BBB (stable)corporate credit rating
2018 interim result presentation | 20 November 2017 |
Note 1 Further information about S&P Global Ratings’ credit rating scale is available at www.standardandpoors.com A rating is not a recommendation by any rating organisation to buy, sell or hold Kiwi Property securities. The rating is current as at the date of this Presentation and may be subject to suspension, revision or withdrawal at any time by S&P Global Ratings.
we’ve created a stronger portfolio
12
1.031.041.101.11
portfolio statisticsrental incomenew leasing and rent reviewslease expiry profile
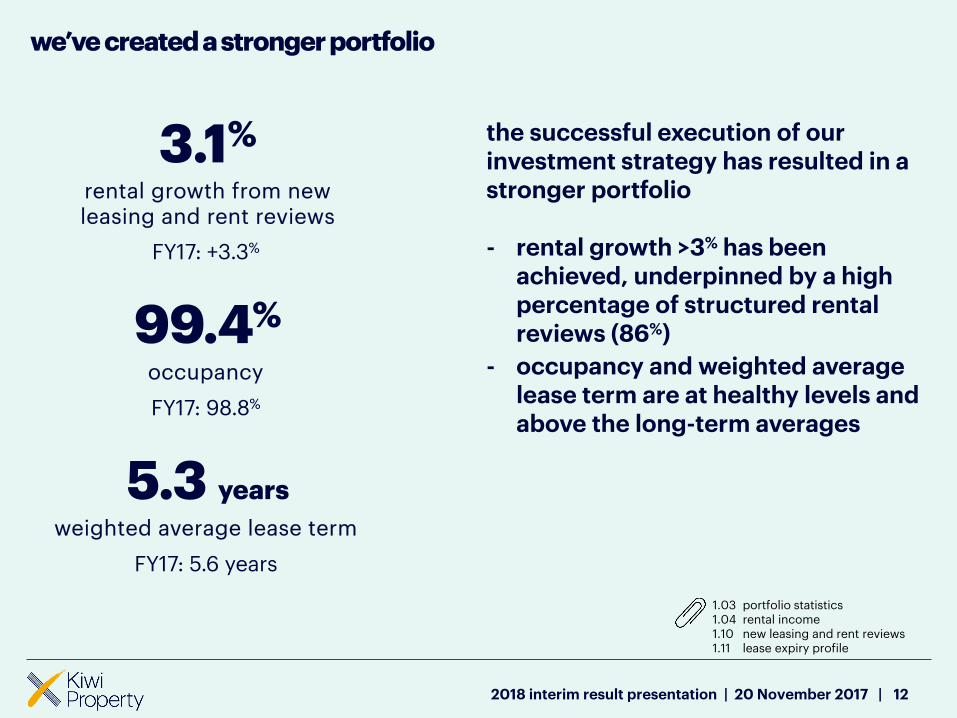
the successful execution of our investment strategy has resulted in a stronger portfolio
- rental growth >3% has been achieved, underpinned by a high percentage of structured rental reviews (86%)
- occupancy and weighted average lease term are at healthy levels and above the long-term averages
3.1%
rental growth from newleasing and rent reviews
FY17: +3.3%
99.4%
occupancy
FY17: 98.8%
5.3 years
weighted average lease term
FY17: 5.6 years
2018 interim result presentation | 20 November 2017 |
the bricks and mortar storywhy New Zealand is not the United States
132018 interim result presentation | 20 November 2017 |
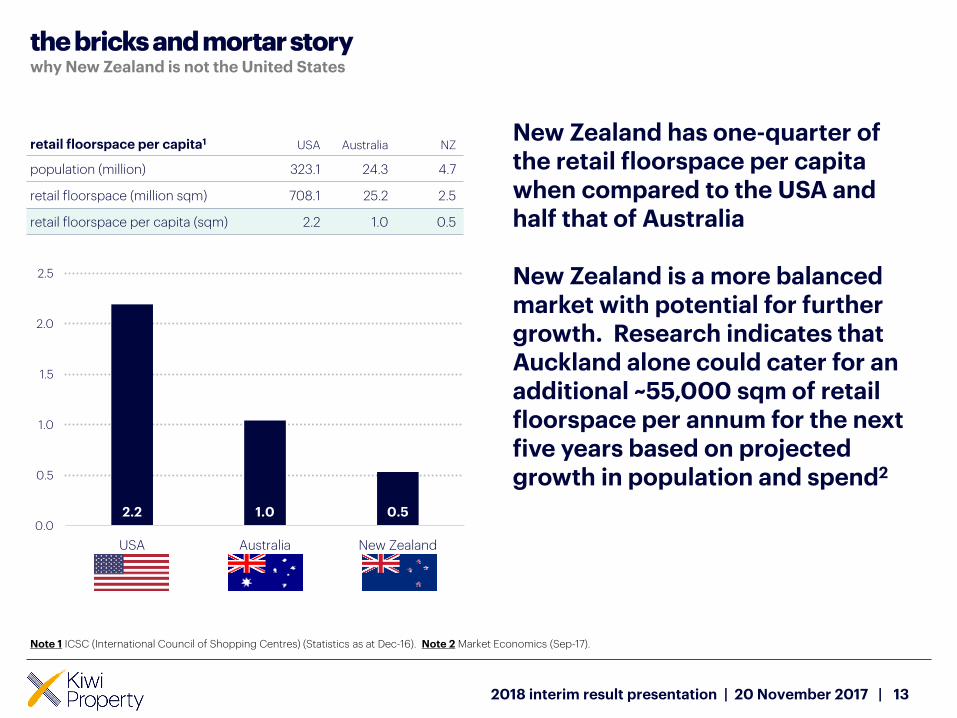
retail floorspace per capita1 USA Australia NZ
population (million) 323.1 24.3 4.7
retail floorspace (million sqm) 708.1 25.2 2.5
retail floorspace per capita (sqm) 2.2 1.0 0.5
2.2 1.0 0.50.0
0.5
1.0
1.5
2.0
2.5
USA Australia New Zealand
New Zealand has one-quarter of the retail floorspace per capita when compared to the USA and half that of Australia
New Zealand is a more balanced market with potential for further growth. Research indicates that Auckland alone could cater for an additional ~55,000 sqm of retail floorspace per annum for the next five years based on projected growth in population and spend2
Note 1 ICSC (International Council of Shopping Centres) (Statistics as at Dec-16). Note 2 Market Economics (Sep-17).
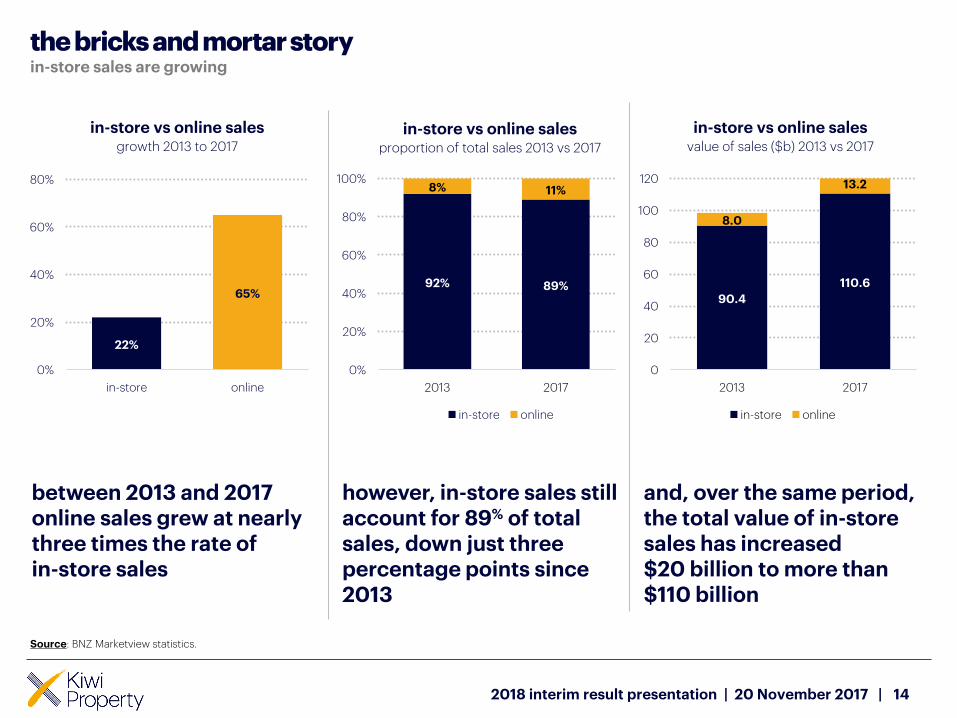
the bricks and mortar storyin-store sales are growing
142018 interim result presentation | 20 November 2017 |
22%
65%
0%
20%
40%
60%
80%
in-store online
in-store vs online sales growth 2013 to 2017
92% 89%
8% 11%
0%
20%
40%
60%
80%
100%
2013 2017
in-store vs online salesproportion of total sales 2013 vs 2017
in-store online
90.4
110.6
8.0
13.2
0
20
40
60
80
100
120
2013 2017
in-store vs online salesvalue of sales ($b) 2013 vs 2017
in-store online
between 2013 and 2017online sales grew at nearly three times the rate of in-store sales
however, in-store sales still account for 89% of total sales, down just three percentage points since 2013
and, over the same period, the total value of in-store sales has increased $20 billion to more than $110 billion
Source: BNZ Marketview statistics.

the bricks and mortar storyhow we’re keeping our centres relevant
152018 interim result presentation | 20 November 2017 |
we’re focused on attracting best-in-class, destinational retailers which create higher visitation and help us to improve overall sales productivity
we’re enhancing the social experience aspect of shopping by increasing the range and quality of food outlets, with a focus on placemaking and a curated mix of operators
we’re improving the overall customer experience through initiatives such as live events, activation, parking management, valet parking, better wifi and social media connectivity
better stores better food better experiences
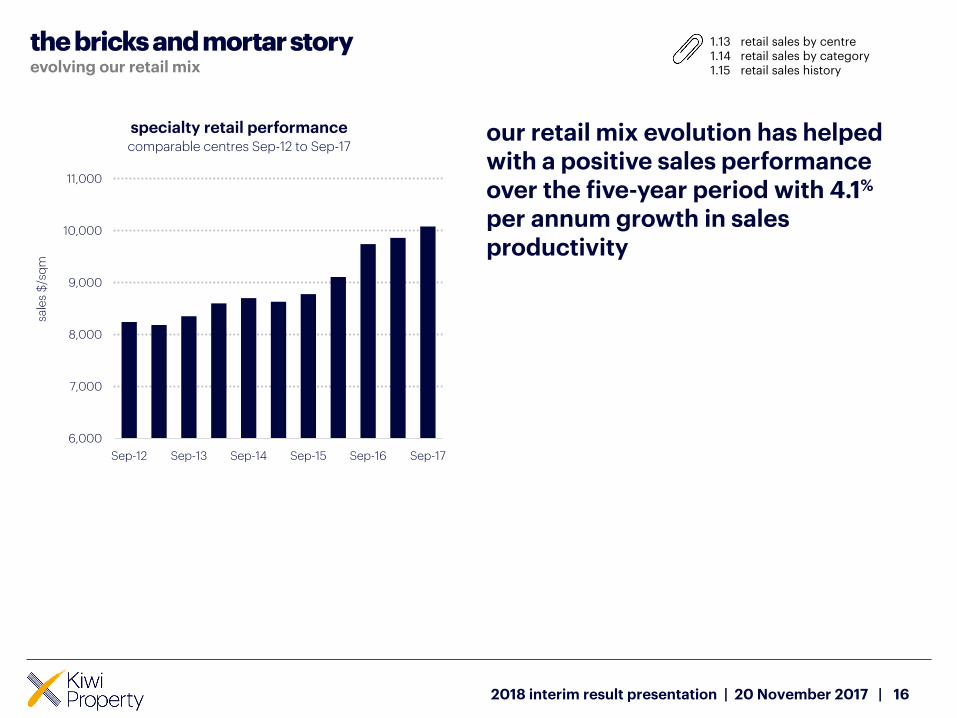
the bricks and mortar storyevolving our retail mix
162018 interim result presentation | 20 November 2017 |
6,000
7,000
8,000
9,000
10,000
11,000
Sep-12 Sep-13 Sep-14 Sep-15 Sep-16 Sep-17
sale
s $
/sq
m
specialty retail performancecomparable centres Sep-12 to Sep-17
our retail mix evolution has helped with a positive sales performance over the five-year period with 4.1%
per annum growth in sales productivity
1.131.141.15
retail sales by centreretail sales by categoryretail sales history
pharmacy and wellbeing (incl. personal
services)
commercial services
(incl. mobile phones and travel)
general retail
food
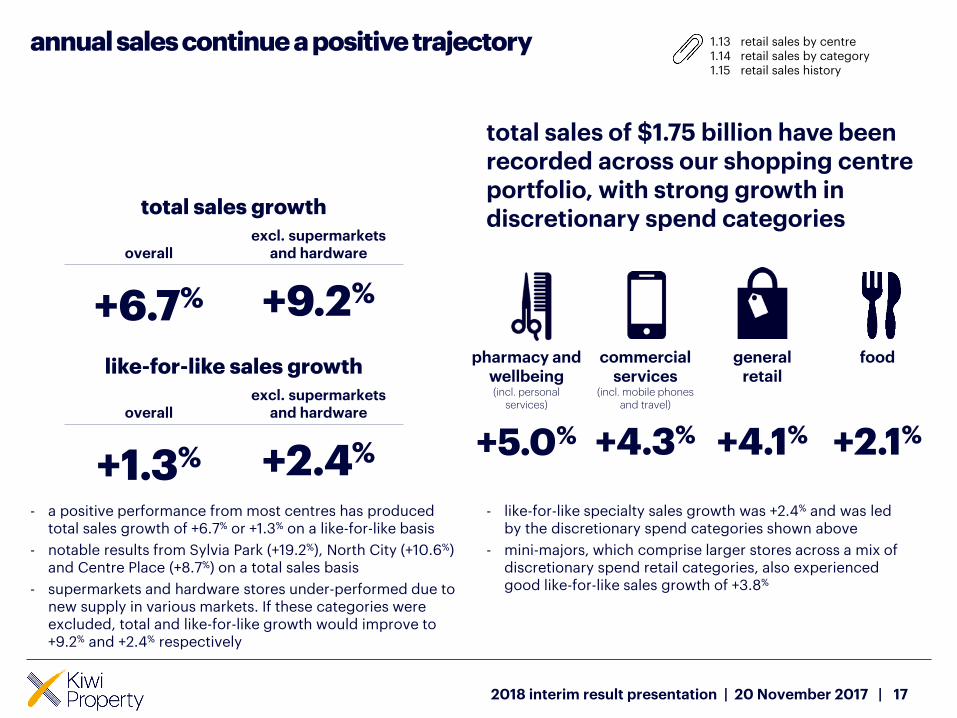
+5.0% +4.3% +4.1% +2.1%
annual sales continue a positive trajectory
17
total sales of $1.75 billion have been recorded across our shopping centre portfolio, with strong growth in discretionary spend categories
- a positive performance from most centres has produced total sales growth of +6.7% or +1.3% on a like-for-like basis
- notable results from Sylvia Park (+19.2%), North City (+10.6%) and Centre Place (+8.7%) on a total sales basis
- supermarkets and hardware stores under-performed due to new supply in various markets. If these categories were excluded, total and like-for-like growth would improve to +9.2% and +2.4% respectively
- like-for-like specialty sales growth was +2.4% and was led by the discretionary spend categories shown above
- mini-majors, which comprise larger stores across a mix of discretionary spend retail categories, also experienced good like-for-like sales growth of +3.8%
total sales growth
overallexcl. supermarkets
and hardware
+6.7% +9.2%
like-for-like sales growth
overallexcl. supermarkets
and hardware
+1.3% +2.4%
1.131.141.15
retail sales by centreretail sales by categoryretail sales history
2018 interim result presentation | 20 November 2017 |
we will continue to deliver on our strategy
182018 interim result presentation | 20 November 2017 |
- advance our town centre vision at Sylvia Park
• successfully open ‘The Grove’ dining precinct
• advance construction and leasing of the No. 1 Sylvia Park office building
• advance construction of the central carpark
• satisfy pre-development requirements for the galleria expansion and south carpark
- commence our ‘Langdons Quarter’ food and entertainment precinct redevelopment at Northlands
- progress masterplanning for our Drury land
• settle purchase of the remaining land parcel
• advance structure planning towards securing town centre zoning
- progress value-adding initiatives at The Base
- complete the sale of The Majestic Centre
we have a clear focus for the balance of 2018
outlook and dividend guidance
19
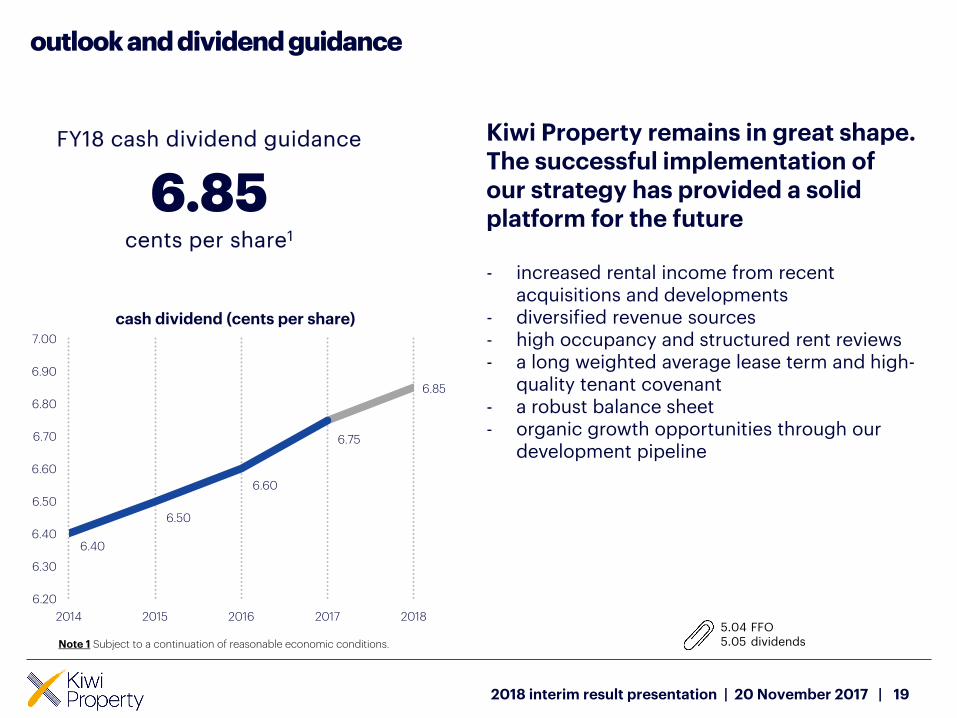
Kiwi Property remains in great shape. The successful implementation of our strategy has provided a solid platform for the future
- increased rental income from recent acquisitions and developments
- diversified revenue sources- high occupancy and structured rent reviews- a long weighted average lease term and high-
quality tenant covenant- a robust balance sheet- organic growth opportunities through our
development pipeline
FY18 cash dividend guidance
6.85cents per share1
6.40
6.50
6.60
6.75
6.85
6.20
6.30
6.40
6.50
6.60
6.70
6.80
6.90
7.00
2014 2015 2016 2017 2018
cash dividend (cents per share)
5.045.05
FFOdividendsNote 1 Subject to a continuation of reasonable economic conditions.
2018 interim result presentation | 20 November 2017 |

property
20
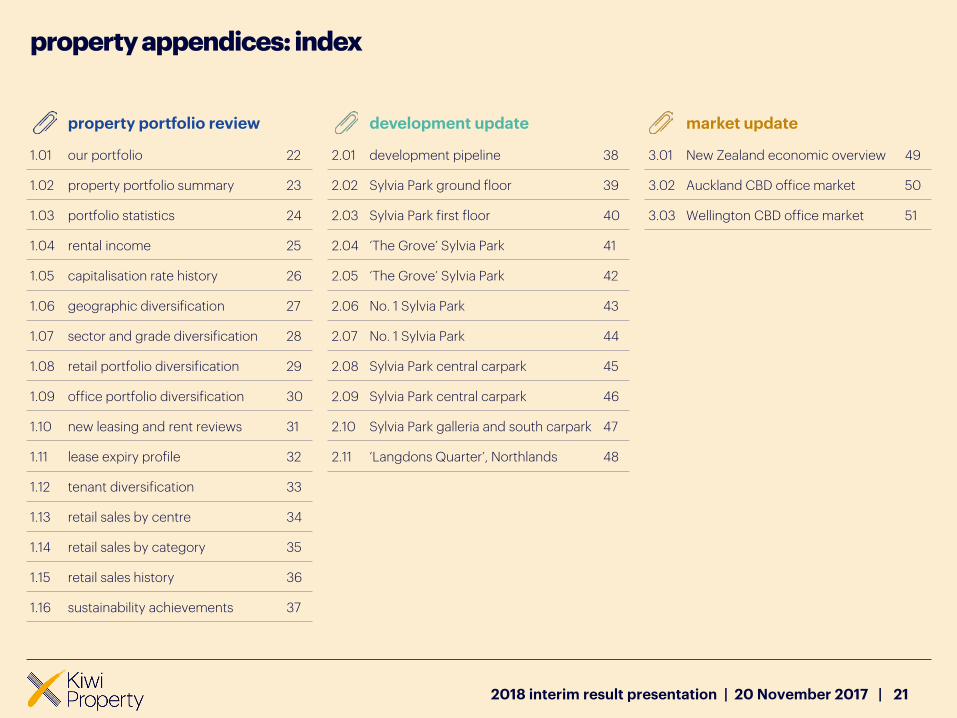
property appendices: index
21
property portfolio review development update market update
1.01 our portfolio 22 2.01 development pipeline 38 3.01 New Zealand economic overview 49
1.02 property portfolio summary 23 2.02 Sylvia Park ground floor 39 3.02 Auckland CBD office market 50
1.03 portfolio statistics 24 2.03 Sylvia Park first floor 40 3.03 Wellington CBD office market 51
1.04 rental income 25 2.04 ‘The Grove’ Sylvia Park 41
1.05 capitalisation rate history 26 2.05 ‘The Grove’ Sylvia Park 42
1.06 geographic diversification 27 2.06 No. 1 Sylvia Park 43
1.07 sector and grade diversification 28 2.07 No. 1 Sylvia Park 44
1.08 retail portfolio diversification 29 2.08 Sylvia Park central carpark 45
1.09 office portfolio diversification 30 2.09 Sylvia Park central carpark 46
1.10 new leasing and rent reviews 31 2.10 Sylvia Park galleria and south carpark 47
1.11 lease expiry profile 32 2.11 ‘Langdons Quarter’, Northlands 48
1.12 tenant diversification 33
1.13 retail sales by centre 34
1.14 retail sales by category 35
1.15 retail sales history 36
1.16 sustainability achievements 37
2018 interim result presentation | 20 November 2017 |
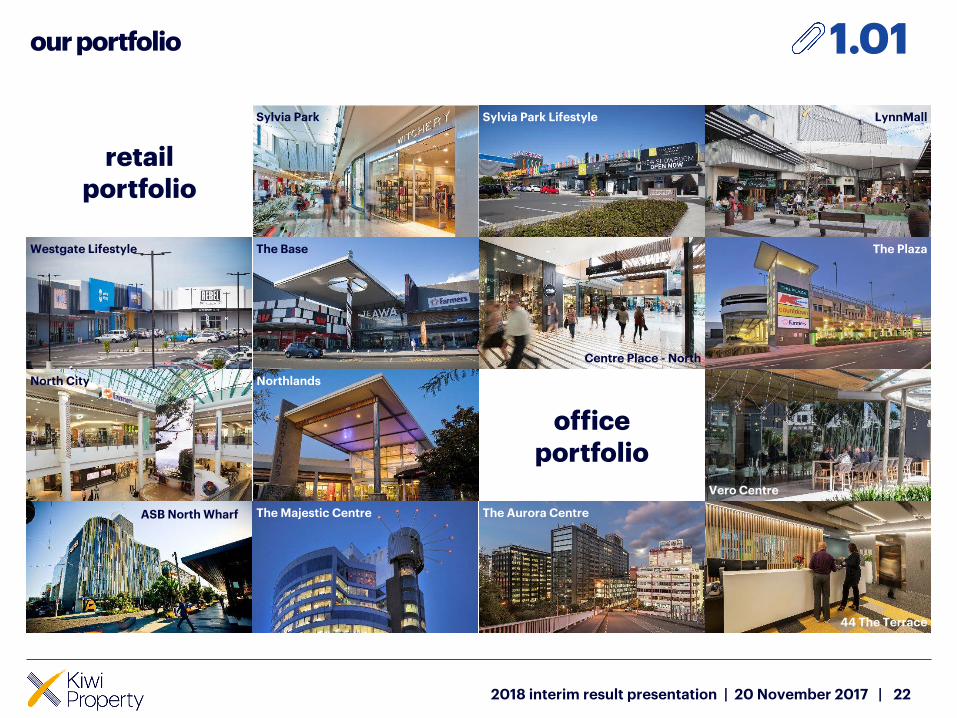
our portfolio
22
retail portfolio
office portfolio
Sylvia Park Sylvia Park Lifestyle LynnMall
Westgate Lifestyle The Base
Centre Place - North
The Plaza
North City Northlands
Vero Centre
ASB North Wharf The Majestic Centre The Aurora Centre
44 The Terrace
1.01
2018 interim result presentation | 20 November 2017 |
1.03
1.03
1.03
1.12
1.03
1.03
1.12
1.03
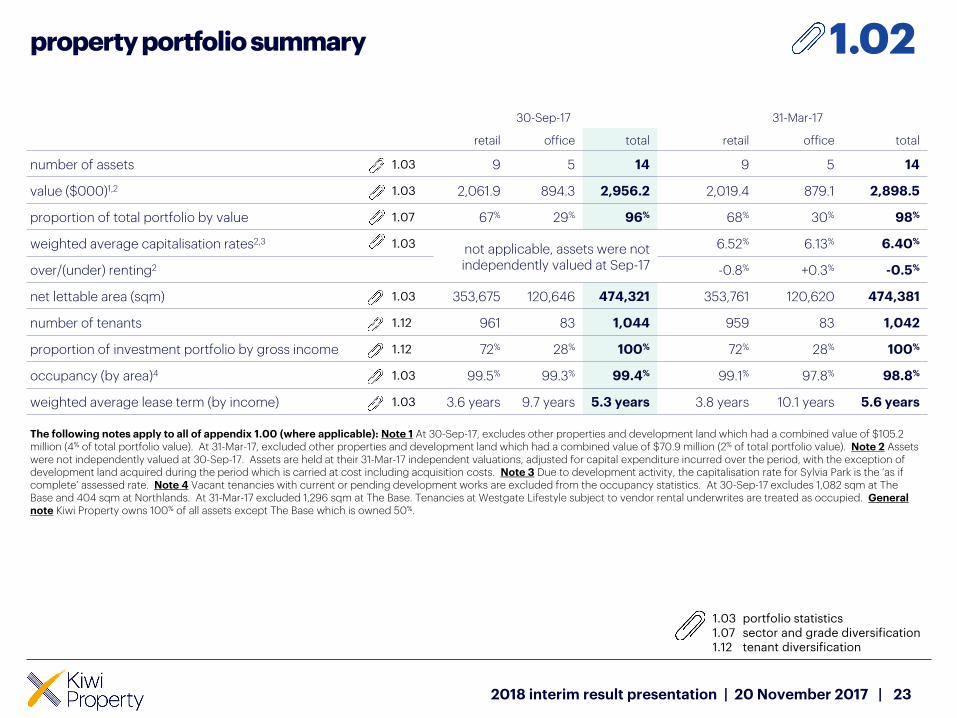
1.02property portfolio summary
23
1.031.071.12
portfolio statisticssector and grade diversificationtenant diversification
2018 interim result presentation | 20 November 2017 |
1.07
30-Sep-17 31-Mar-17
retail office total retail office total
number of assets 9 5 14 9 5 14
value ($000)1,2 2,061.9 894.3 2,956.2 2,019.4 879.1 2,898.5
proportion of total portfolio by value 67% 29% 96% 68% 30% 98%
weighted average capitalisation rates2,3not applicable, assets were not independently valued at Sep-17
6.52% 6.13% 6.40%
over/(under) renting2 -0.8% +0.3% -0.5%
net lettable area (sqm) 353,675 120,646 474,321 353,761 120,620 474,381
number of tenants 961 83 1,044 959 83 1,042
proportion of investment portfolio by gross income 72% 28% 100% 72% 28% 100%
occupancy (by area)4 99.5% 99.3% 99.4% 99.1% 97.8% 98.8%
weighted average lease term (by income) 3.6 years 9.7 years 5.3 years 3.8 years 10.1 years 5.6 years
The following notes apply to all of appendix 1.00 (where applicable): Note 1 At 30-Sep-17, excludes other properties and development land which had a combined value of $105.2 million (4% of total portfolio value). At 31-Mar-17, excluded other properties and development land which had a combined value of $70.9 million (2% of total portfolio value). Note 2 Assets were not independently valued at 30-Sep-17. Assets are held at their 31-Mar-17 independent valuations, adjusted for capital expenditure incurred over the period, with the exception of development land acquired during the period which is carried at cost including acquisition costs. Note 3 Due to development activity, the capitalisation rate for Sylvia Park is the ‘as if complete’ assessed rate. Note 4 Vacant tenancies with current or pending development works are excluded from the occupancy statistics. At 30-Sep-17 excludes 1,082 sqm at The Base and 404 sqm at Northlands. At 31-Mar-17 excluded 1,296 sqm at The Base. Tenancies at Westgate Lifestyle subject to vendor rental underwrites are treated as occupied. General note Kiwi Property owns 100% of all assets except The Base which is owned 50%.
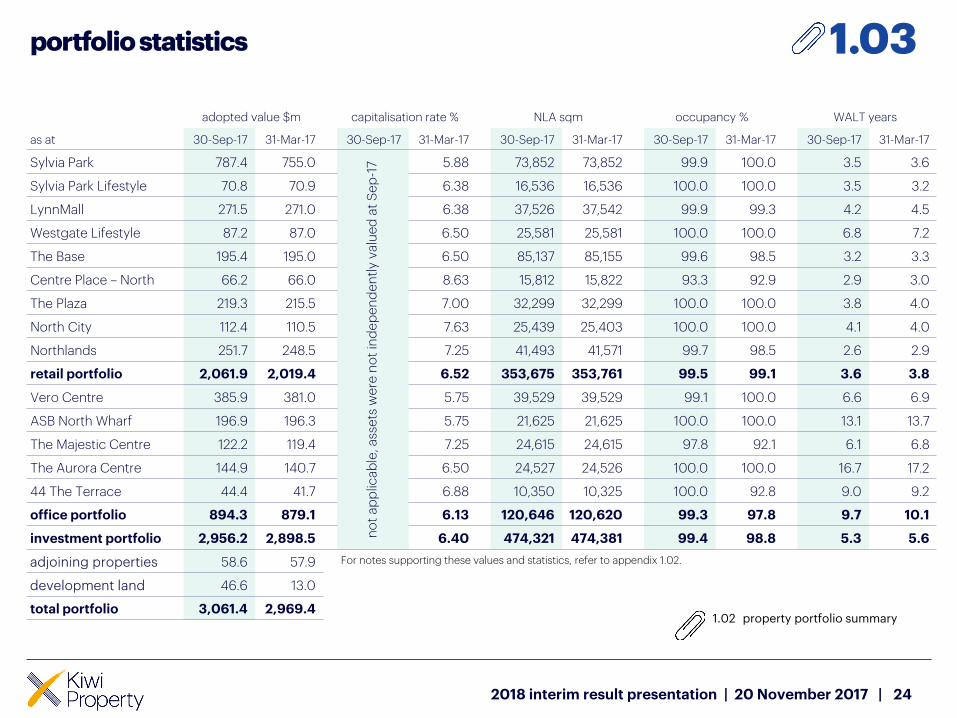
portfolio statistics
24
as at
adopted value $m capitalisation rate % NLA sqm occupancy % WALT years
30-Sep-17 31-Mar-17 30-Sep-17 31-Mar-17 30-Sep-17 31-Mar-17 30-Sep-17 31-Mar-17 30-Sep-17 31-Mar-17
Sylvia Park 787.4 755.0
no
t a
pp
lica
ble
, ass
ets
we
re n
ot
ind
ep
en
de
ntl
y v
alu
ed
at
Se
p-1
7 5.88 73,852 73,852 99.9 100.0 3.5 3.6
Sylvia Park Lifestyle 70.8 70.9 6.38 16,536 16,536 100.0 100.0 3.5 3.2
LynnMall 271.5 271.0 6.38 37,526 37,542 99.9 99.3 4.2 4.5
Westgate Lifestyle 87.2 87.0 6.50 25,581 25,581 100.0 100.0 6.8 7.2
The Base 195.4 195.0 6.50 85,137 85,155 99.6 98.5 3.2 3.3
Centre Place – North 66.2 66.0 8.63 15,812 15,822 93.3 92.9 2.9 3.0
The Plaza 219.3 215.5 7.00 32,299 32,299 100.0 100.0 3.8 4.0
North City 112.4 110.5 7.63 25,439 25,403 100.0 100.0 4.1 4.0
Northlands 251.7 248.5 7.25 41,493 41,571 99.7 98.5 2.6 2.9
retail portfolio 2,061.9 2,019.4 6.52 353,675 353,761 99.5 99.1 3.6 3.8
Vero Centre 385.9 381.0 5.75 39,529 39,529 99.1 100.0 6.6 6.9
ASB North Wharf 196.9 196.3 5.75 21,625 21,625 100.0 100.0 13.1 13.7
The Majestic Centre 122.2 119.4 7.25 24,615 24,615 97.8 92.1 6.1 6.8
The Aurora Centre 144.9 140.7 6.50 24,527 24,526 100.0 100.0 16.7 17.2
44 The Terrace 44.4 41.7 6.88 10,350 10,325 100.0 92.8 9.0 9.2
office portfolio 894.3 879.1 6.13 120,646 120,620 99.3 97.8 9.7 10.1
investment portfolio 2,956.2 2,898.5 6.40 474,321 474,381 99.4 98.8 5.3 5.6
adjoining properties 58.6 57.9 For notes supporting these values and statistics, refer to appendix 1.02.
development land 46.6 13.0
total portfolio 3,061.4 2,969.4
1.03
1.02 property portfolio summary
2018 interim result presentation | 20 November 2017 |
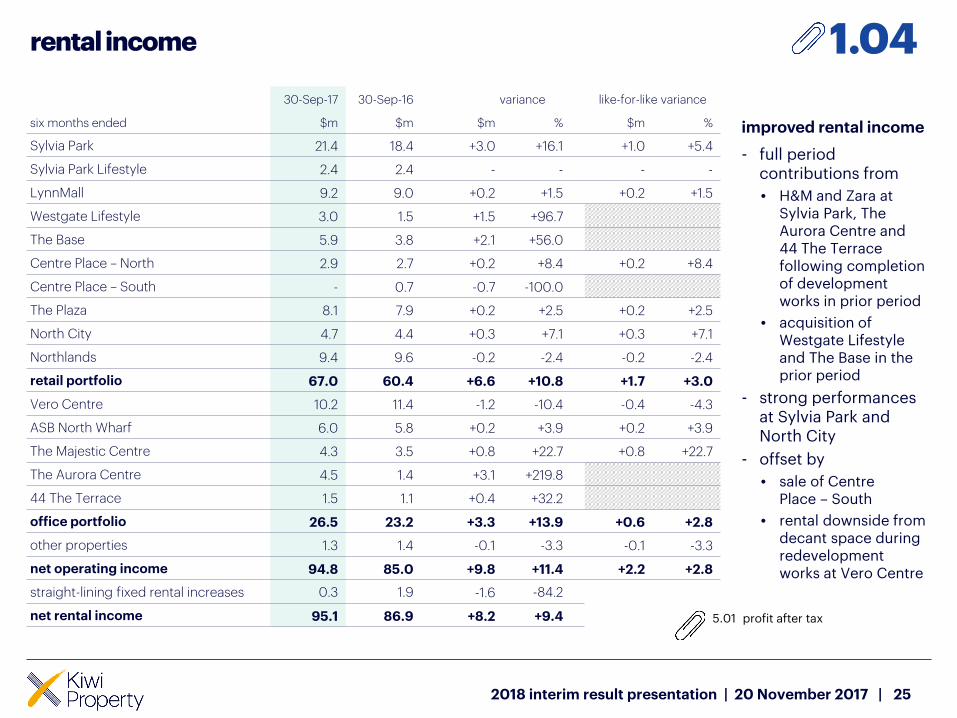
rental income
25
six months ended
30-Sep-17 30-Sep-16 variance like-for-like variance
$m $m $m % $m %
Sylvia Park 21.4 18.4 +3.0 +16.1 +1.0 +5.4
Sylvia Park Lifestyle 2.4 2.4 - - - -
LynnMall 9.2 9.0 +0.2 +1.5 +0.2 +1.5
Westgate Lifestyle 3.0 1.5 +1.5 +96.7
The Base 5.9 3.8 +2.1 +56.0
Centre Place – North 2.9 2.7 +0.2 +8.4 +0.2 +8.4
Centre Place – South - 0.7 -0.7 -100.0
The Plaza 8.1 7.9 +0.2 +2.5 +0.2 +2.5
North City 4.7 4.4 +0.3 +7.1 +0.3 +7.1
Northlands 9.4 9.6 -0.2 -2.4 -0.2 -2.4
retail portfolio 67.0 60.4 +6.6 +10.8 +1.7 +3.0
Vero Centre 10.2 11.4 -1.2 -10.4 -0.4 -4.3
ASB North Wharf 6.0 5.8 +0.2 +3.9 +0.2 +3.9
The Majestic Centre 4.3 3.5 +0.8 +22.7 +0.8 +22.7
The Aurora Centre 4.5 1.4 +3.1 +219.8
44 The Terrace 1.5 1.1 +0.4 +32.2
office portfolio 26.5 23.2 +3.3 +13.9 +0.6 +2.8
other properties 1.3 1.4 -0.1 -3.3 -0.1 -3.3
net operating income 94.8 85.0 +9.8 +11.4 +2.2 +2.8
straight-lining fixed rental increases 0.3 1.9 -1.6 -84.2
net rental income 95.1 86.9 +8.2 +9.4
improved rental income
- full period contributions from
• H&M and Zara at Sylvia Park, The Aurora Centre and 44 The Terrace following completion of development works in prior period
• acquisition of Westgate Lifestyle and The Base in the prior period
- strong performances at Sylvia Park and North City
- offset by
• sale of Centre Place – South
• rental downside from decant space during redevelopment works at Vero Centre
1.04
2018 interim result presentation | 20 November 2017 |
5.01 profit after tax
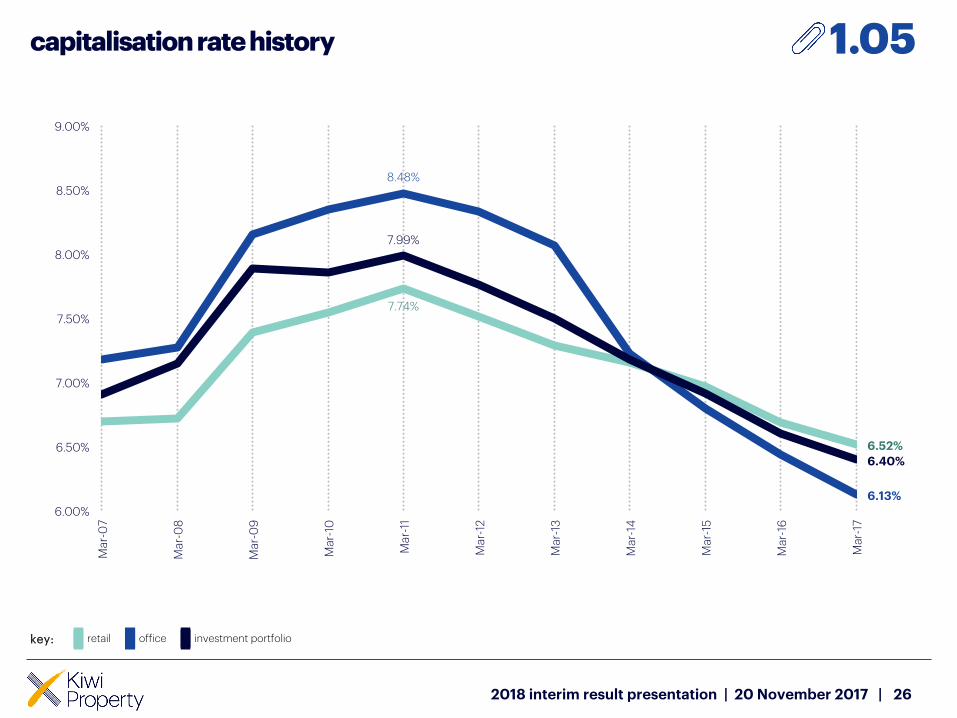
capitalisation rate history
26
7.74%
6.52%
8.48%
6.13%
7.99%
6.40%
6.00%
6.50%
7.00%
7.50%
8.00%
8.50%
9.00%
Ma
r-0
7
Ma
r-0
8
Ma
r-0
9
Ma
r-10
Ma
r-11
Ma
r-12
Ma
r-13
Ma
r-14
Ma
r-15
Ma
r-16
Ma
r-17
key: retail office investment portfolio
1.05
2018 interim result presentation | 20 November 2017 |
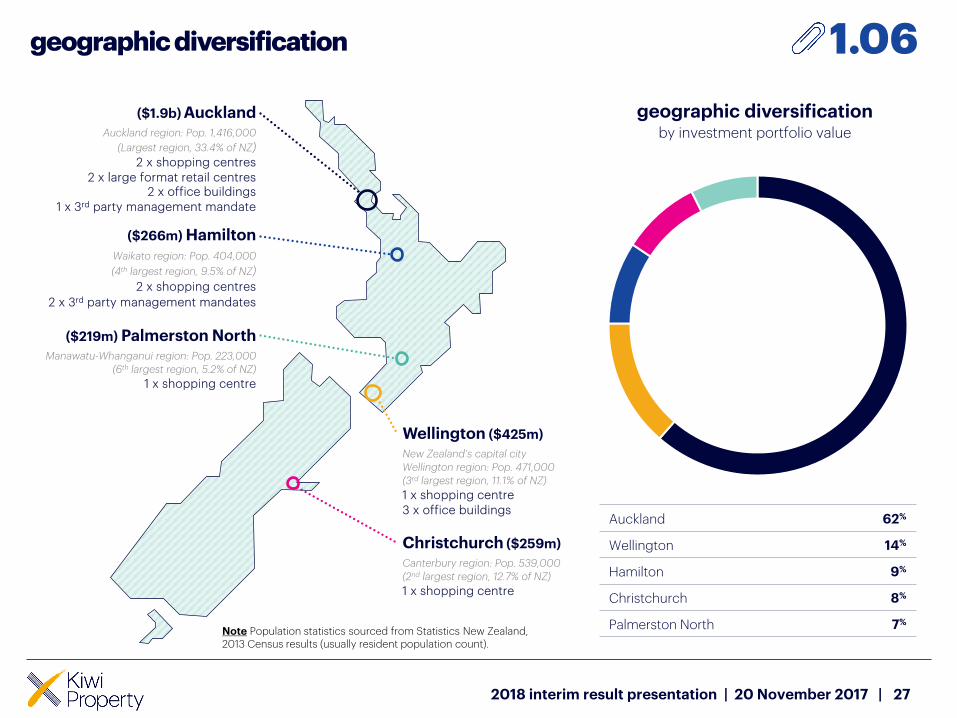
geographic diversification
27
($1.9b) AucklandAuckland region: Pop. 1,416,000
(Largest region, 33.4% of NZ)
2 x shopping centres
2 x large format retail centres2 x office buildings
1 x 3rd party management mandate
($266m) HamiltonWaikato region: Pop. 404,000
(4th largest region, 9.5% of NZ)
2 x shopping centres
2 x 3rd party management mandates
Wellington ($425m)
New Zealand’s capital city
Wellington region: Pop. 471,000
(3rd largest region, 11.1% of NZ)
1 x shopping centre
3 x office buildings
Christchurch ($259m)
Canterbury region: Pop. 539,000
(2nd largest region, 12.7% of NZ)
1 x shopping centre
Note Population statistics sourced from Statistics New Zealand, 2013 Census results (usually resident population count).
($219m) Palmerston NorthManawatu-Whanganui region: Pop. 223,000
(6th largest region, 5.2% of NZ)
1 x shopping centre
Auckland 62%
Wellington 14%
Hamilton 9%
Christchurch 8%
Palmerston North 7%
geographic diversificationby investment portfolio value
1.06
2018 interim result presentation | 20 November 2017 |
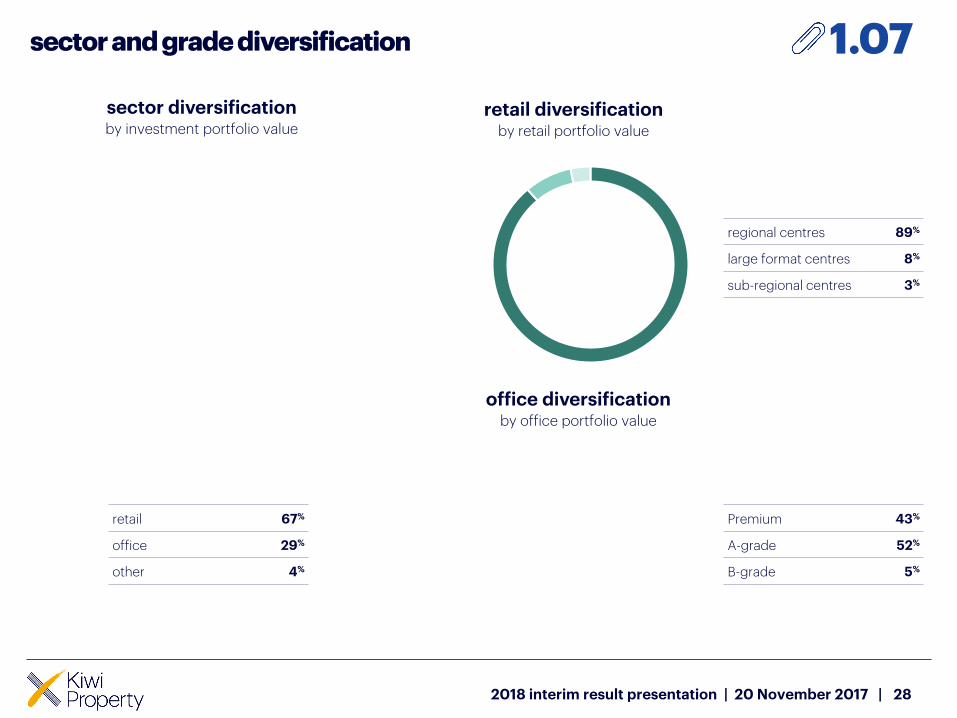
sector and grade diversification
28
1.07
retail 67%
office 29%
other 4%
sector diversificationby investment portfolio value
retail diversificationby retail portfolio value
regional centres 89%
large format centres 8%
sub-regional centres 3%
office diversificationby office portfolio value
Premium 43%
A-grade 52%
B-grade 5%
2018 interim result presentation | 20 November 2017 |
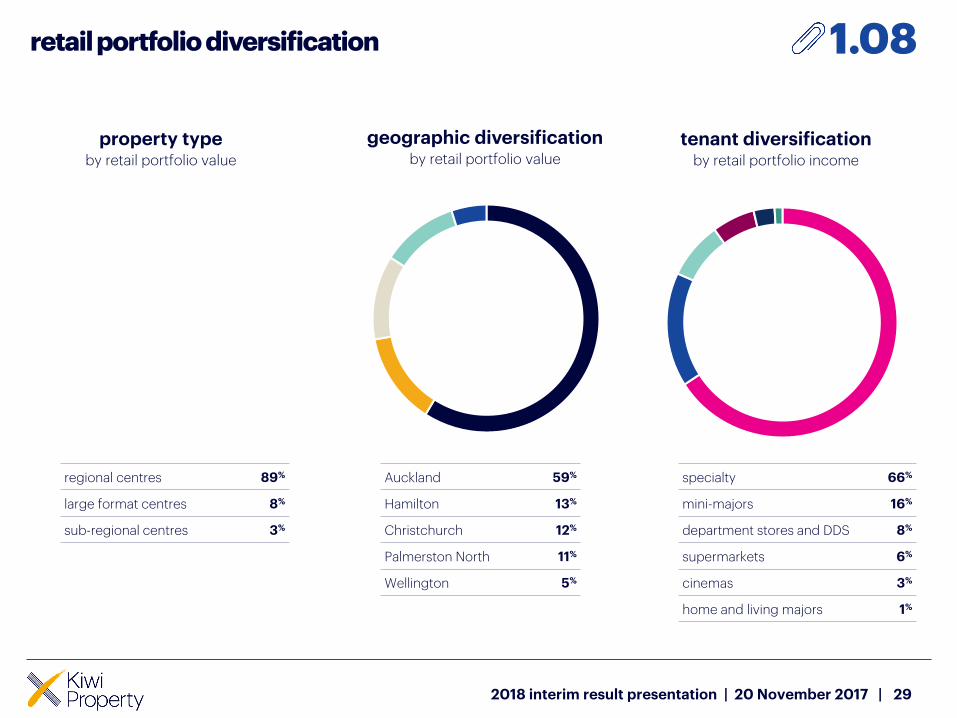
retail portfolio diversification
29
1.08
regional centres 89%
large format centres 8%
sub-regional centres 3%
property typeby retail portfolio value
tenant diversificationby retail portfolio income
specialty 66%
mini-majors 16%
department stores and DDS 8%
supermarkets 6%
cinemas 3%
home and living majors 1%
2018 interim result presentation | 20 November 2017 |
geographic diversificationby retail portfolio value
Auckland 59%
Hamilton 13%
Christchurch 12%
Palmerston North 11%
Wellington 5%
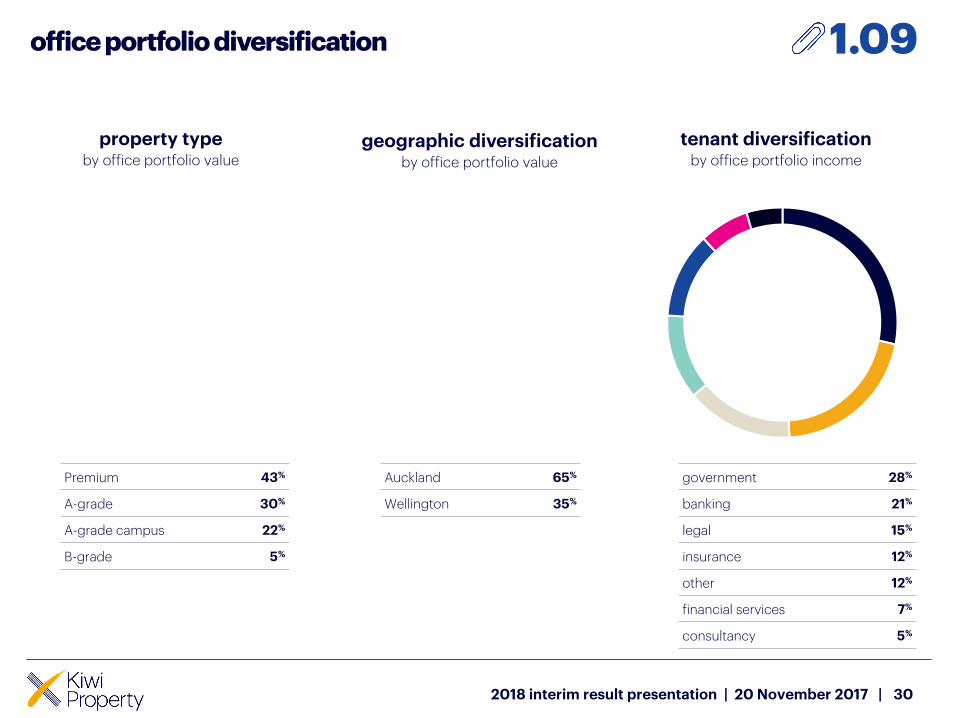
office portfolio diversification
30
1.09
Premium 43%
A-grade 30%
A-grade campus 22%
B-grade 5%
property typeby office portfolio value
tenant diversificationby office portfolio income
government 28%
banking 21%
legal 15%
insurance 12%
other 12%
financial services 7%
consultancy 5%
2018 interim result presentation | 20 November 2017 |
geographic diversificationby office portfolio value
Auckland 65%
Wellington 35%
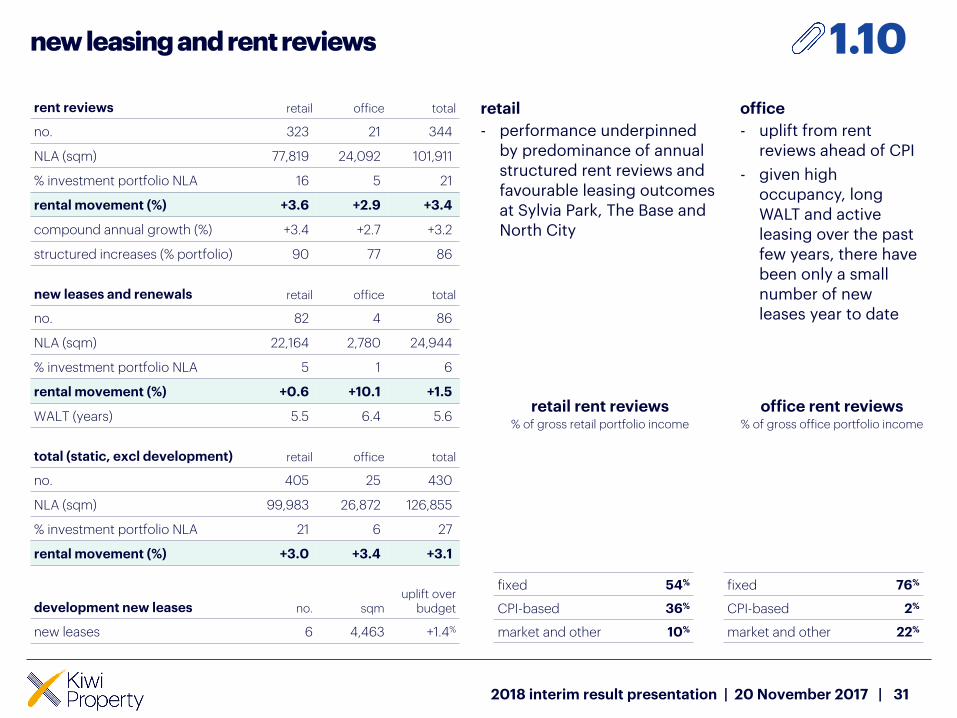
new leasing and rent reviews
31
rent reviews retail office total
no. 323 21 344
NLA (sqm) 77,819 24,092 101,911
% investment portfolio NLA 16 5 21
rental movement (%) +3.6 +2.9 +3.4
compound annual growth (%) +3.4 +2.7 +3.2
structured increases (% portfolio) 90 77 86
new leases and renewals retail office total
no. 82 4 86
NLA (sqm) 22,164 2,780 24,944
% investment portfolio NLA 5 1 6
rental movement (%) +0.6 +10.1 +1.5
WALT (years) 5.5 6.4 5.6
total (static, excl development) retail office total
no. 405 25 430
NLA (sqm) 99,983 26,872 126,855
% investment portfolio NLA 21 6 27
rental movement (%) +3.0 +3.4 +3.1
development new leases no. sqmuplift over
budget
new leases 6 4,463 +1.4%
office
- uplift from rent reviews ahead of CPI
- given high occupancy, long WALT and active leasing over the past few years, there have been only a small number of new leases year to date
retail
- performance underpinned by predominance of annual structured rent reviews and favourable leasing outcomes at Sylvia Park, The Base and North City
1.10
retail rent reviews% of gross retail portfolio income
fixed 54%
CPI-based 36%
market and other 10%
office rent reviews% of gross office portfolio income
fixed 76%
CPI-based 2%
market and other 22%
2018 interim result presentation | 20 November 2017 |
lease expiry profile
32
1.6%
7.8%
15.3%
10.4%7.4%
57.5%
0%
10%
20%
30%
40%
50%
60%
70%
vacant or
holdover
FY18 FY19 FY20 FY21 FY22+
lease expiry profile % of investment portfolio gross income
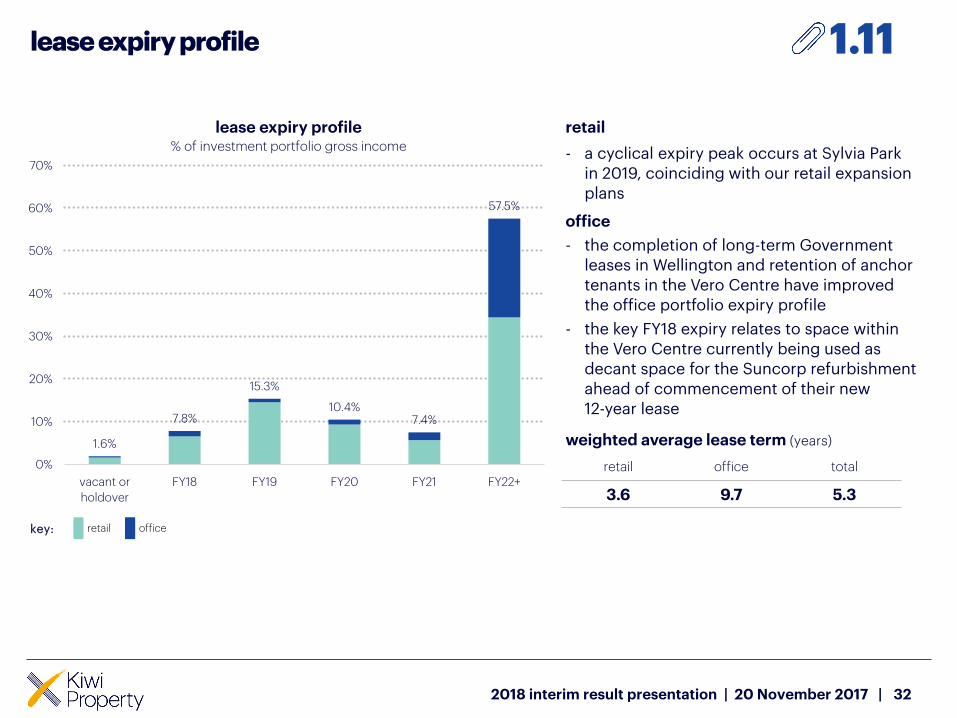
retail
- a cyclical expiry peak occurs at Sylvia Park in 2019, coinciding with our retail expansion plans
office
- the completion of long-term Government leases in Wellington and retention of anchor tenants in the Vero Centre have improved the office portfolio expiry profile
- the key FY18 expiry relates to space within the Vero Centre currently being used as decant space for the Suncorp refurbishment ahead of commencement of their new 12-year lease
1.11
key: retail office
weighted average lease term (years)
retail office total
3.6 9.7 5.3
2018 interim result presentation | 20 November 2017 |
our top 20 tenants
tenant diversification
33
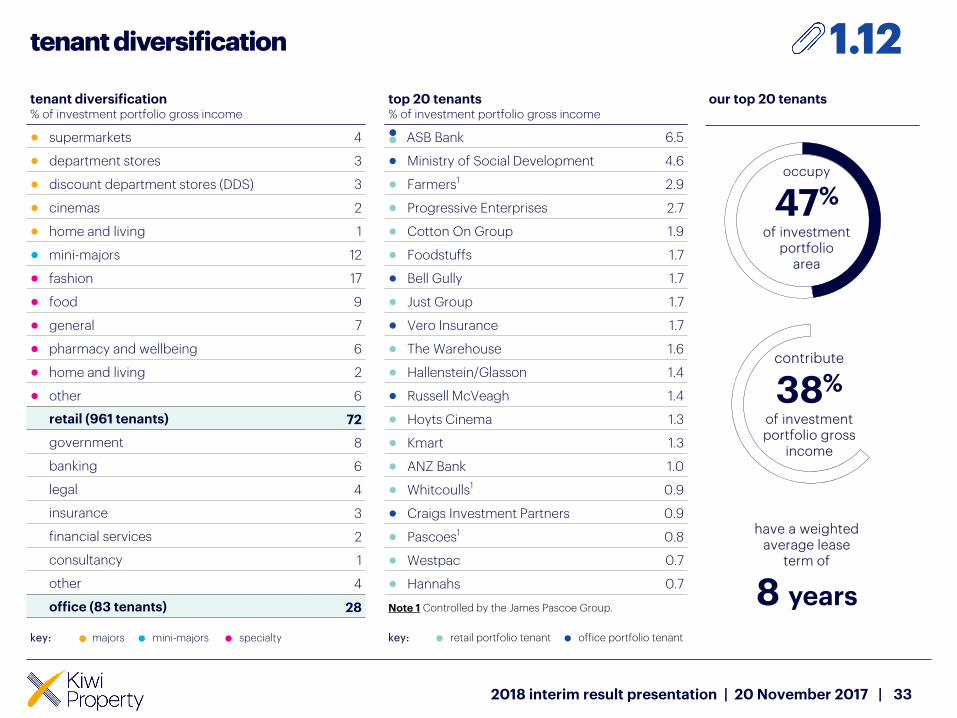
tenant diversification % of investment portfolio gross income
● supermarkets 4
● department stores 3
● discount department stores (DDS) 3
● cinemas 2
● home and living 1
● mini-majors 12
● fashion 17
● food 9
● general 7
● pharmacy and wellbeing 6
● home and living 2
● other 6
retail (961 tenants) 72
government 8
banking 6
legal 4
insurance 3
financial services 2
consultancy 1
other 4
office (83 tenants) 28
top 20 tenants % of investment portfolio gross income
ASB Bank 6.5
● Ministry of Social Development 4.6
● Farmers1 2.9
● Progressive Enterprises 2.7
● Cotton On Group 1.9
● Foodstuffs 1.7
● Bell Gully 1.7
● Just Group 1.7
● Vero Insurance 1.7
● The Warehouse 1.6
● Hallenstein/Glasson 1.4
● Russell McVeagh 1.4
● Hoyts Cinema 1.3
● Kmart 1.3
● ANZ Bank 1.0
● Whitcoulls1 0.9
● Craigs Investment Partners 0.9
● Pascoes1 0.8
● Westpac 0.7
● Hannahs 0.7
Note 1 Controlled by the James Pascoe Group.
occupy
47%
of investment portfolio
area
contribute
38%
of investment portfolio gross
income
have a weighted average lease
term of
8 years
1.12
key: ● majors ● mini-majors ● specialty key: ● retail portfolio tenant ● office portfolio tenant
2018 interim result presentation | 20 November 2017 |
retail sales by centre
34
twelve months ended
MAT $m % var. from Sep-16shopping centre specialty sales2
pedestrian count3
millions per annum
30-Sep-17 total like-for-like $/sqm GOC% 30-Sep-17
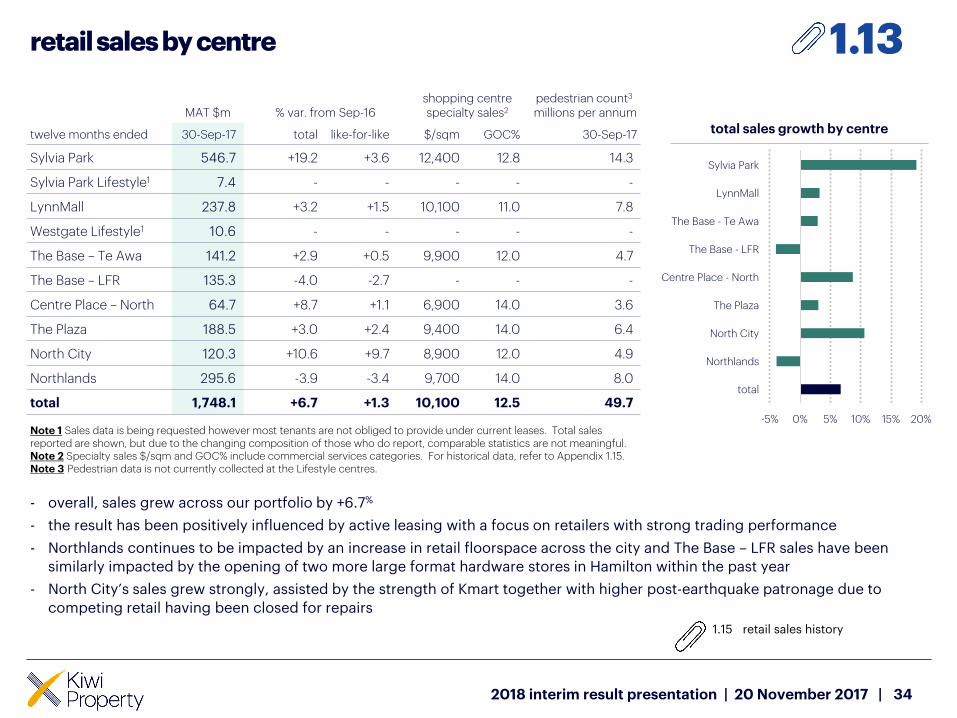
Sylvia Park 546.7 +19.2 +3.6 12,400 12.8 14.3
Sylvia Park Lifestyle1 7.4 - - - - -
LynnMall 237.8 +3.2 +1.5 10,100 11.0 7.8
Westgate Lifestyle1 10.6 - - - - -
The Base – Te Awa 141.2 +2.9 +0.5 9,900 12.0 4.7
The Base – LFR 135.3 -4.0 -2.7 - - -
Centre Place – North 64.7 +8.7 +1.1 6,900 14.0 3.6
The Plaza 188.5 +3.0 +2.4 9,400 14.0 6.4
North City 120.3 +10.6 +9.7 8,900 12.0 4.9
Northlands 295.6 -3.9 -3.4 9,700 14.0 8.0
total 1,748.1 +6.7 +1.3 10,100 12.5 49.7
Note 1 Sales data is being requested however most tenants are not obliged to provide under current leases. Total sales reported are shown, but due to the changing composition of those who do report, comparable statistics are not meaningful.Note 2 Specialty sales $/sqm and GOC% include commercial services categories. For historical data, refer to Appendix 1.15. Note 3 Pedestrian data is not currently collected at the Lifestyle centres.
1.13
total sales growth by centre
2018 interim result presentation | 20 November 2017 |
-5% 0% 5% 10% 15% 20%
Sylvia Park
LynnMall
The Base - Te Awa
The Base - LFR
Centre Place - North
The Plaza
North City
Northlands
total
- overall, sales grew across our portfolio by +6.7%
- the result has been positively influenced by active leasing with a focus on retailers with strong trading performance
- Northlands continues to be impacted by an increase in retail floorspace across the city and The Base – LFR sales have been
similarly impacted by the opening of two more large format hardware stores in Hamilton within the past year
- North City’s sales grew strongly, assisted by the strength of Kmart together with higher post-earthquake patronage due to
competing retail having been closed for repairs
1.15 retail sales history
retail sales by category
35
twelve months ended
MAT $m % var. from Sep-16
30-Sep-17 total like-for-like
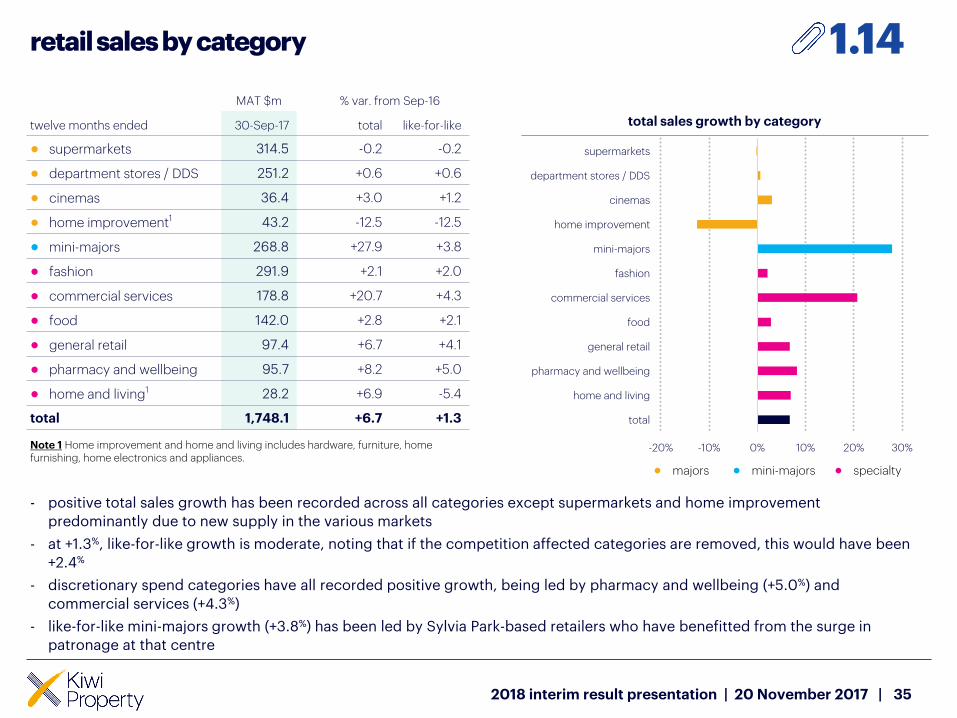
● supermarkets 314.5 -0.2 -0.2
● department stores / DDS 251.2 +0.6 +0.6
● cinemas 36.4 +3.0 +1.2
● home improvement1 43.2 -12.5 -12.5
● mini-majors 268.8 +27.9 +3.8
● fashion 291.9 +2.1 +2.0
● commercial services 178.8 +20.7 +4.3
● food 142.0 +2.8 +2.1
● general retail 97.4 +6.7 +4.1
● pharmacy and wellbeing 95.7 +8.2 +5.0
● home and living1 28.2 +6.9 -5.4
total 1,748.1 +6.7 +1.3
Note 1 Home improvement and home and living includes hardware, furniture, home furnishing, home electronics and appliances.
1.14
total sales growth by category
● majors ● mini-majors ● specialty
2018 interim result presentation | 20 November 2017 |
-20% -10% 0% 10% 20% 30%
supermarkets
department stores / DDS
cinemas
home improvement
mini-majors
fashion
commercial services
food
general retail
pharmacy and wellbeing
home and living
total
- positive total sales growth has been recorded across all categories except supermarkets and home improvement
predominantly due to new supply in the various markets
- at +1.3%, like-for-like growth is moderate, noting that if the competition affected categories are removed, this would have been
+2.4%
- discretionary spend categories have all recorded positive growth, being led by pharmacy and wellbeing (+5.0%) and
commercial services (+4.3%)
- like-for-like mini-majors growth (+3.8%) has been led by Sylvia Park-based retailers who have benefitted from the surge in
patronage at that centre
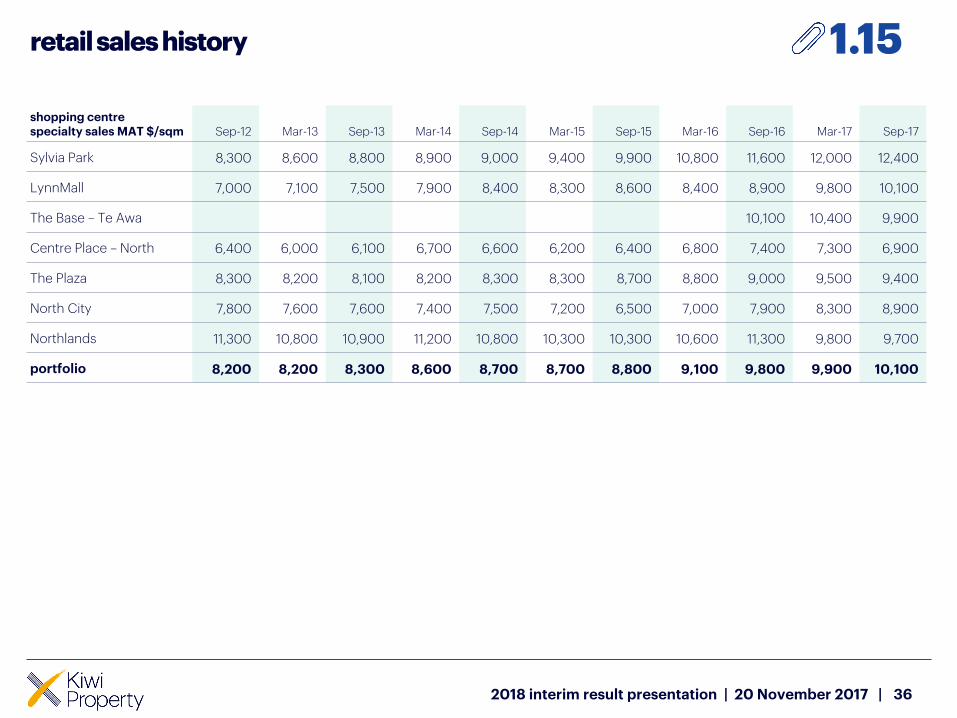
retail sales history
36
1.15
2018 interim result presentation | 20 November 2017 |
shopping centre specialty sales MAT $/sqm Sep-12 Mar-13 Sep-13 Mar-14 Sep-14 Mar-15 Sep-15 Mar-16 Sep-16 Mar-17 Sep-17
Sylvia Park 8,300 8,600 8,800 8,900 9,000 9,400 9,900 10,800 11,600 12,000 12,400
LynnMall 7,000 7,100 7,500 7,900 8,400 8,300 8,600 8,400 8,900 9,800 10,100
The Base – Te Awa 10,100 10,400 9,900
Centre Place – North 6,400 6,000 6,100 6,700 6,600 6,200 6,400 6,800 7,400 7,300 6,900
The Plaza 8,300 8,200 8,100 8,200 8,300 8,300 8,700 8,800 9,000 9,500 9,400
North City 7,800 7,600 7,600 7,400 7,500 7,200 6,500 7,000 7,900 8,300 8,900
Northlands 11,300 10,800 10,900 11,200 10,800 10,300 10,300 10,600 11,300 9,800 9,700
portfolio 8,200 8,200 8,300 8,600 8,700 8,700 8,800 9,100 9,800 9,900 10,100
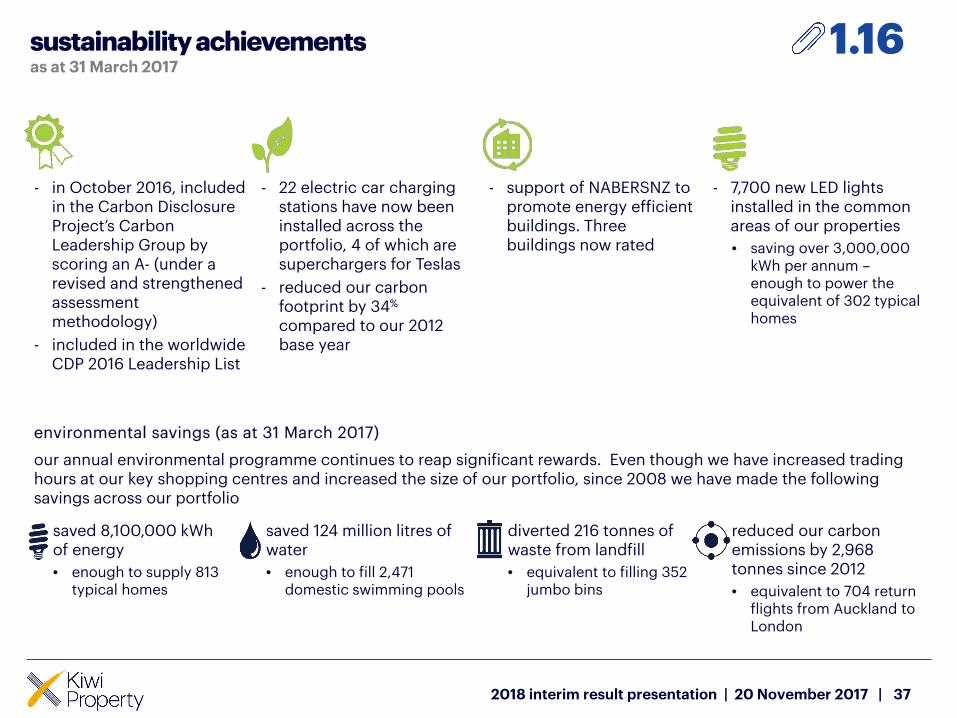
- in October 2016, included in the Carbon Disclosure Project’s Carbon Leadership Group by scoring an A- (under a revised and strengthened assessment methodology)
- included in the worldwide CDP 2016 Leadership List
- 22 electric car charging stations have now been installed across the portfolio, 4 of which are superchargers for Teslas
- reduced our carbon footprint by 34%
compared to our 2012 base year
- support of NABERSNZ to promote energy efficient buildings. Three buildings now rated
- 7,700 new LED lights installed in the common areas of our properties
• saving over 3,000,000 kWh per annum –enough to power the equivalent of 302 typical homes
environmental savings (as at 31 March 2017)
our annual environmental programme continues to reap significant rewards. Even though we have increased trading hours at our key shopping centres and increased the size of our portfolio, since 2008 we have made the following savings across our portfolio
> saved 8,100,000 kWh of energy
• enough to supply 813 typical homes
> saved 124 million litres of water
• enough to fill 2,471 domestic swimming pools
> diverted 216 tonnes of waste from landfill
• equivalent to filling 352 jumbo bins
> reduced our carbon emissions by 2,968 tonnes since 2012
• equivalent to 704 return flights from Auckland to London
sustainability achievementsas at 31 March 2017
37
1.16
2018 interim result presentation | 20 November 2017 |
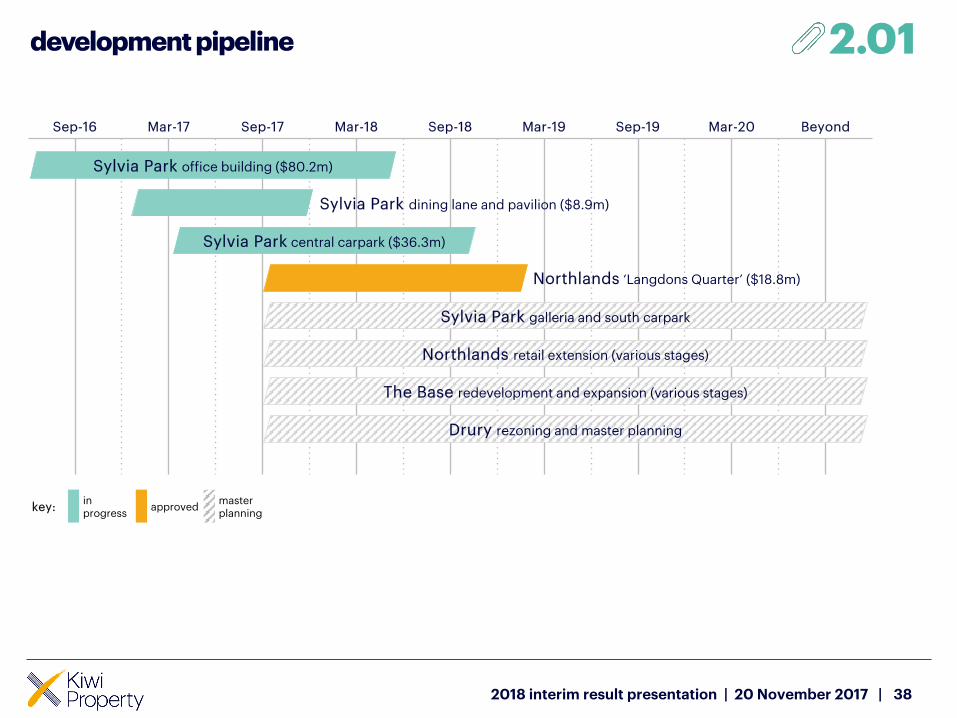
development pipeline
38
Sep-16 Mar-17 Sep-17 Mar-18 Sep-18 Mar-19 Sep-19 Mar-20 Beyond
Sylvia Park office building ($80.2m)
Sylvia Park dining lane and pavilion ($8.9m)
Sylvia Park central carpark ($36.3m)
Northlands retail extension (various stages)
The Base redevelopment and expansion (various stages)
Drury rezoning and master planning
2.01
key:in progress
approvedmaster planning
2018 interim result presentation | 20 November 2017 |
Sylvia Park galleria and south carpark
Northlands ‘Langdons Quarter’ ($18.8m)
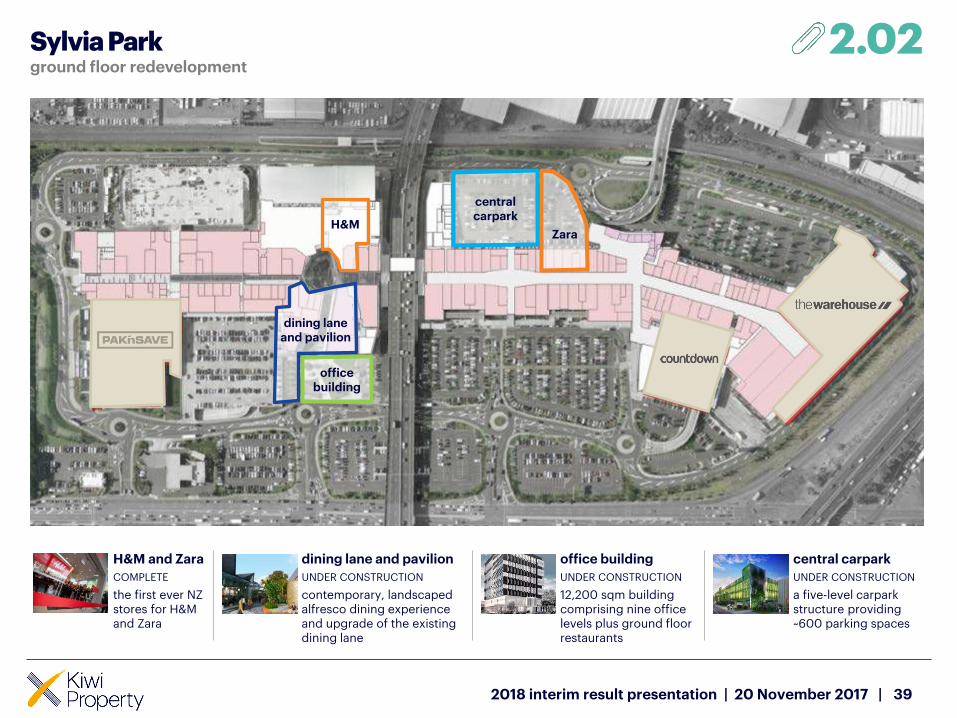
Sylvia Park
39
H&M
dining laneand pavilion
office building
dining lane and pavilion
UNDER CONSTRUCTION
contemporary, landscaped alfresco dining experience and upgrade of the existing dining lane
H&M and Zara
COMPLETE
the first ever NZ stores for H&M and Zara
office building
UNDER CONSTRUCTION
12,200 sqm building comprising nine office levels plus ground floor restaurants
central carpark
UNDER CONSTRUCTION
a five-level carpark structure providing~600 parking spaces
central carpark
Zara
2.02ground floor redevelopment
2018 interim result presentation | 20 November 2017 |
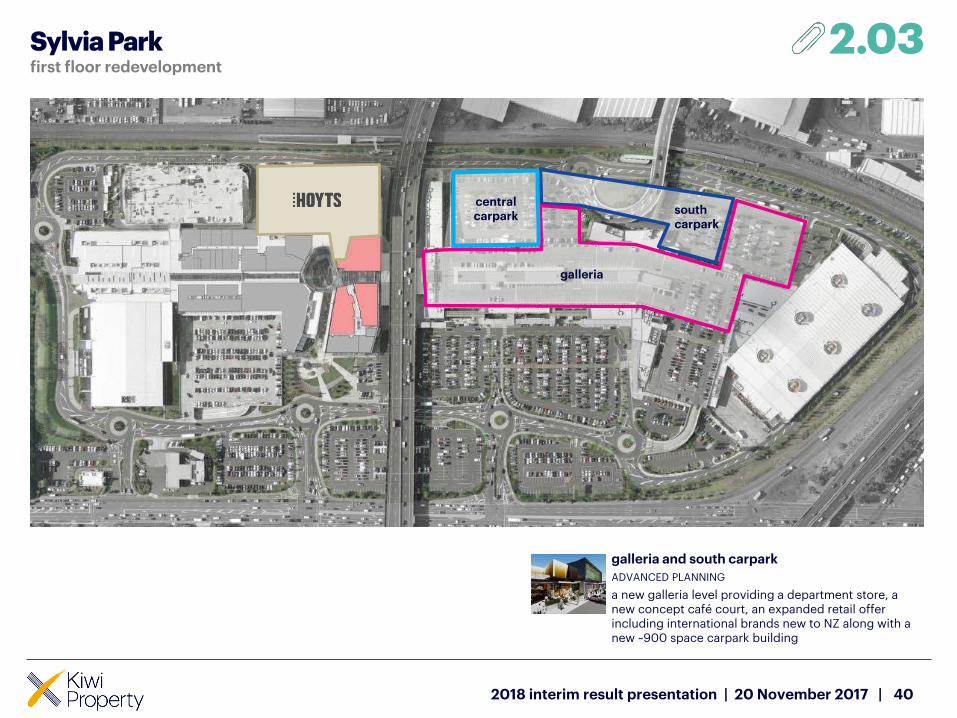
Sylvia Park
40
2.03
galleria and south carpark
ADVANCED PLANNING
a new galleria level providing a department store, a new concept café court, an expanded retail offer including international brands new to NZ along with a new ~900 space carpark building
first floor redevelopment
2018 interim result presentation | 20 November 2017 |
south carpark
galleria
central carpark
41
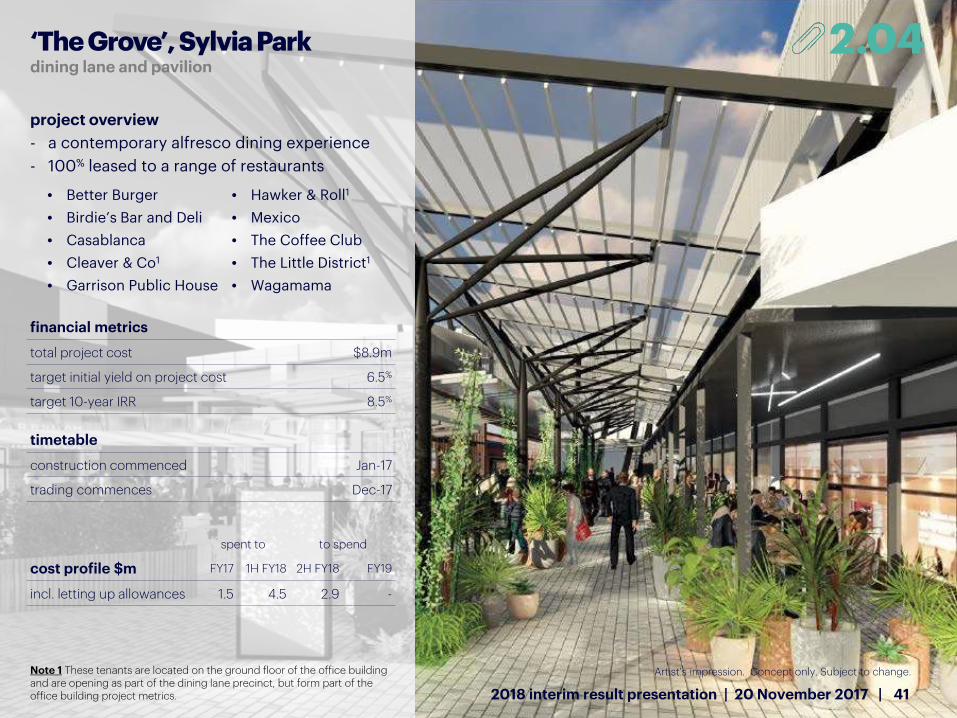
2.04
project overview
- a contemporary alfresco dining experience
- 100% leased to a range of restaurants
financial metrics
total project cost $8.9m
target initial yield on project cost 6.5%
target 10-year IRR 8.5%
timetable
construction commenced Jan-17
trading commences Dec-17
spent to to spend
cost profile $m FY17 1H FY18 2H FY18 FY19
incl. letting up allowances 1.5 4.5 2.9 -
‘The Grove’, Sylvia Parkdining lane and pavilion
2018 interim result presentation | 20 November 2017 |
• Better Burger • Hawker & Roll1
• Birdie’s Bar and Deli • Mexico
• Casablanca • The Coffee Club
• Cleaver & Co1 • The Little District1
• Garrison Public House • Wagamama
Note 1 These tenants are located on the ground floor of the office building and are opening as part of the dining lane precinct, but form part of the office building project metrics.
Artist’s impression. Concept only. Subject to change.
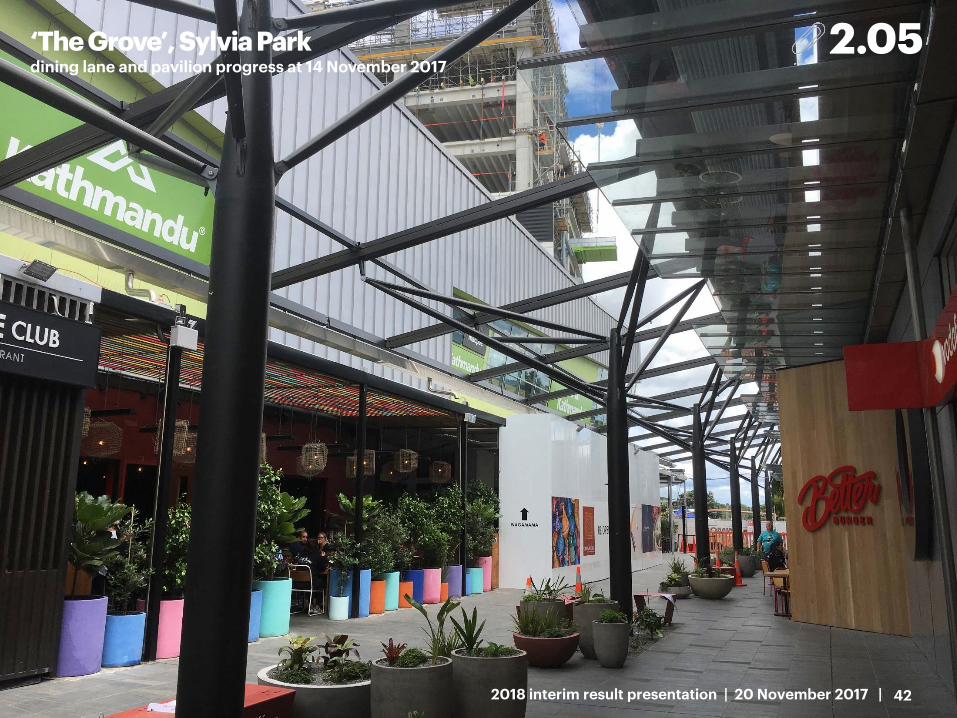
‘The Grove’, Sylvia Parkdining lane and pavilion progress at 14 November 2017
2.05
422018 interim result presentation | 20 November 2017 |
43
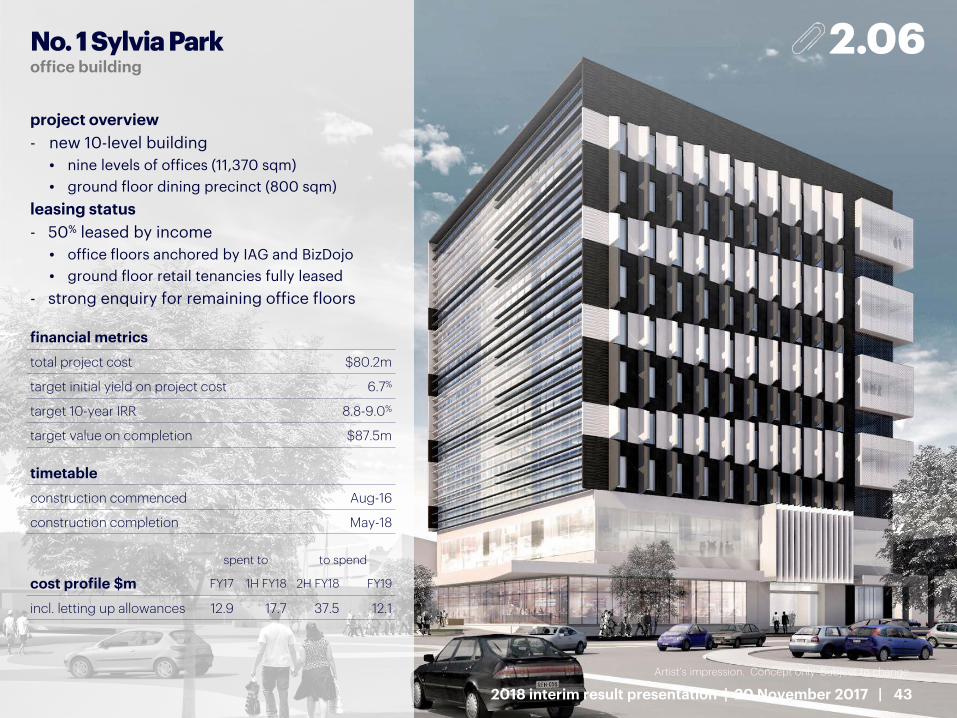
2.06
project overview
- new 10-level building
• nine levels of offices (11,370 sqm)
• ground floor dining precinct (800 sqm)
leasing status
- 50% leased by income
• office floors anchored by IAG and BizDojo
• ground floor retail tenancies fully leased
- strong enquiry for remaining office floors
financial metrics
total project cost $80.2m
target initial yield on project cost 6.7%
target 10-year IRR 8.8-9.0%
target value on completion $87.5m
timetable
construction commenced Aug-16
construction completion May-18
spent to to spend
cost profile $m FY17 1H FY18 2H FY18 FY19
incl. letting up allowances 12.9 17.7 37.5 12.1
No. 1 Sylvia Parkoffice building
2018 interim result presentation | 20 November 2017 |
Artist’s impression. Concept only. Subject to change.
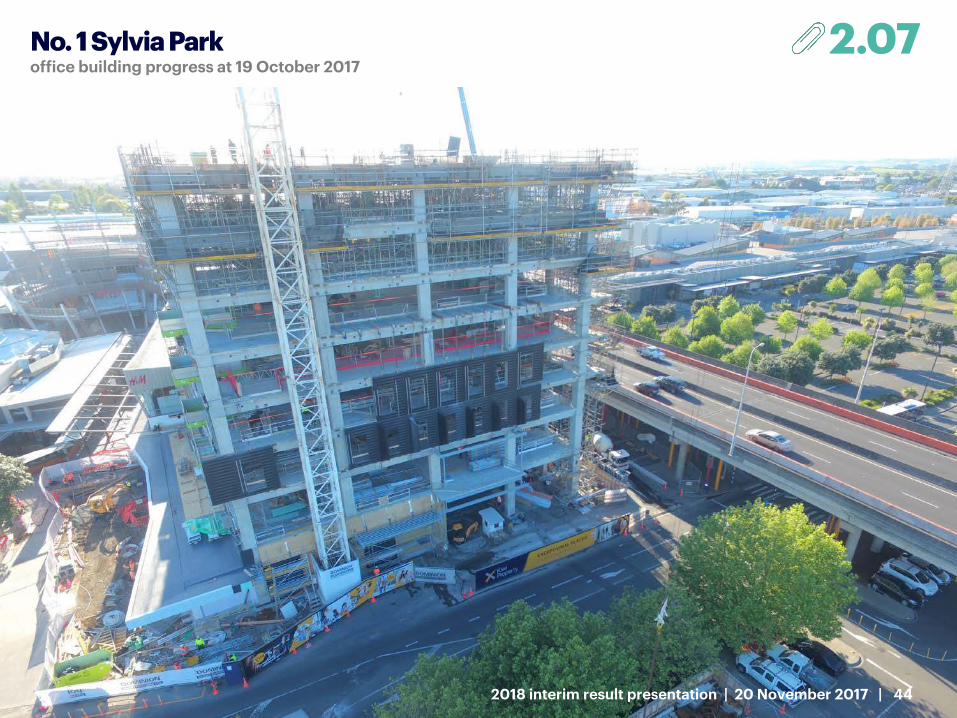
No. 1 Sylvia Parkoffice building progress at 19 October 2017
2.07
442018 interim result presentation | 20 November 2017 |
45
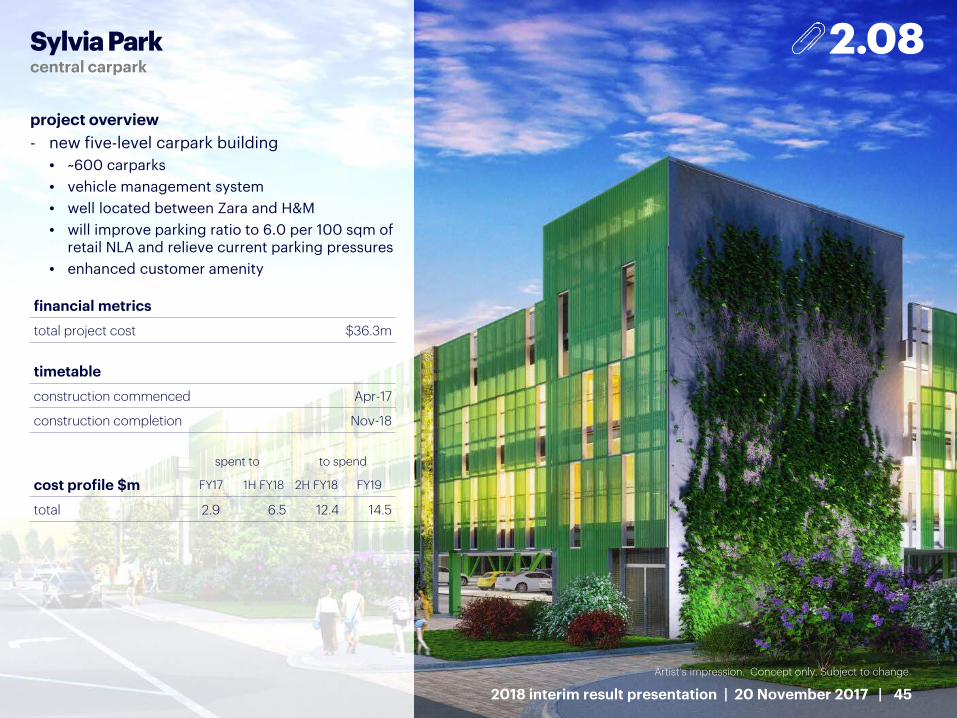
2.08
project overview
- new five-level carpark building
• ~600 carparks
• vehicle management system
• well located between Zara and H&M
• will improve parking ratio to 6.0 per 100 sqm of retail NLA and relieve current parking pressures
• enhanced customer amenity
financial metrics
total project cost $36.3m
timetable
construction commenced Apr-17
construction completion Nov-18
spent to to spend
cost profile $m FY17 1H FY18 2H FY18 FY19
total 2.9 6.5 12.4 14.5
Sylvia Parkcentral carpark
2018 interim result presentation | 20 November 2017 |
Artist’s impression. Concept only. Subject to change.
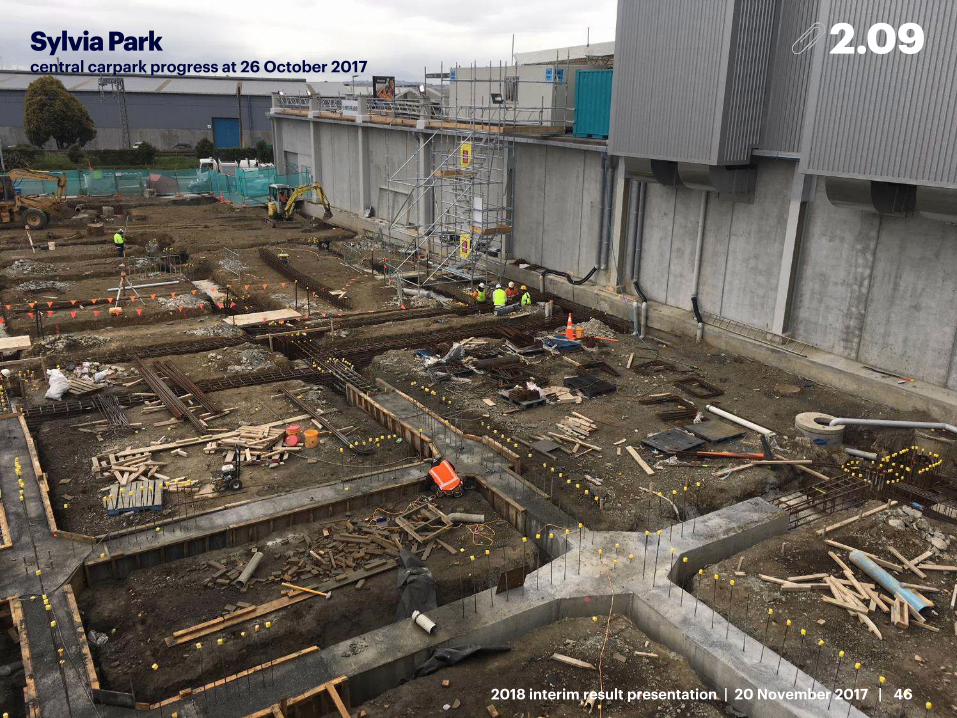
Sylvia Parkcentral carpark progress at 26 October 2017
2.09
2018 interim result presentation | 20 November 2017 | 46
47
2.10
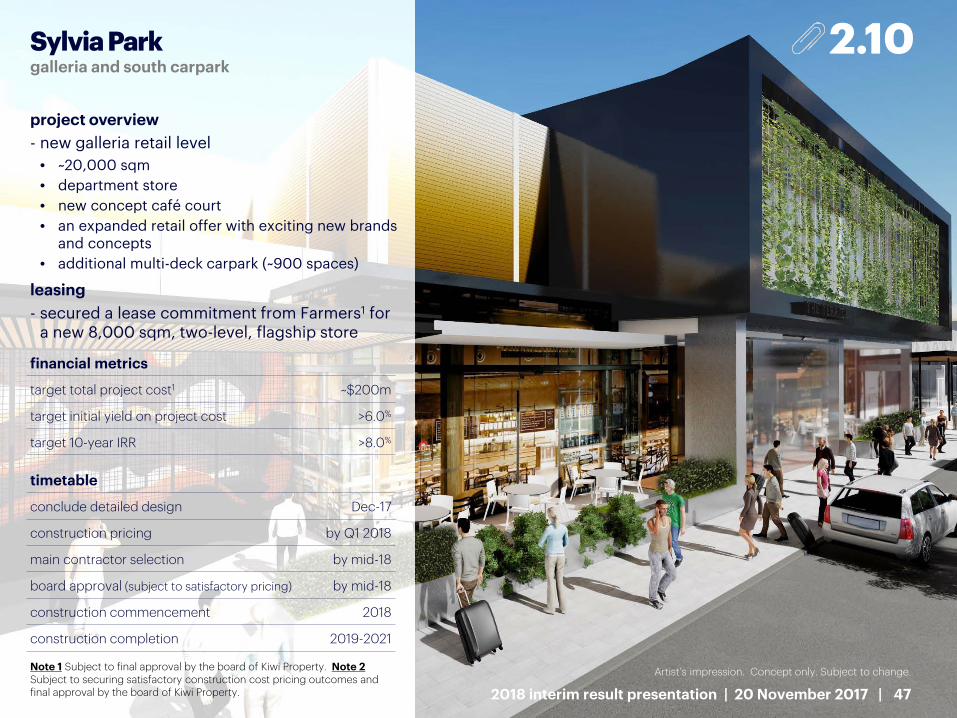
project overview
- new galleria retail level
• ~20,000 sqm
• department store
• new concept café court
• an expanded retail offer with exciting new brands and concepts
• additional multi-deck carpark (~900 spaces)
leasing
- secured a lease commitment from Farmers1 for a new 8,000 sqm, two-level, flagship store
financial metrics
target total project cost1 ~$200m
target initial yield on project cost >6.0%
target 10-year IRR >8.0%
timetable
conclude detailed design Dec-17
construction pricing by Q1 2018
main contractor selection by mid-18
board approval (subject to satisfactory pricing) by mid-18
construction commencement 2018
construction completion 2019-2021
Sylvia Parkgalleria and south carpark
2018 interim result presentation | 20 November 2017 |
Artist’s impression. Concept only. Subject to change.Note 1 Subject to final approval by the board of Kiwi Property. Note 2Subject to securing satisfactory construction cost pricing outcomes and final approval by the board of Kiwi Property.
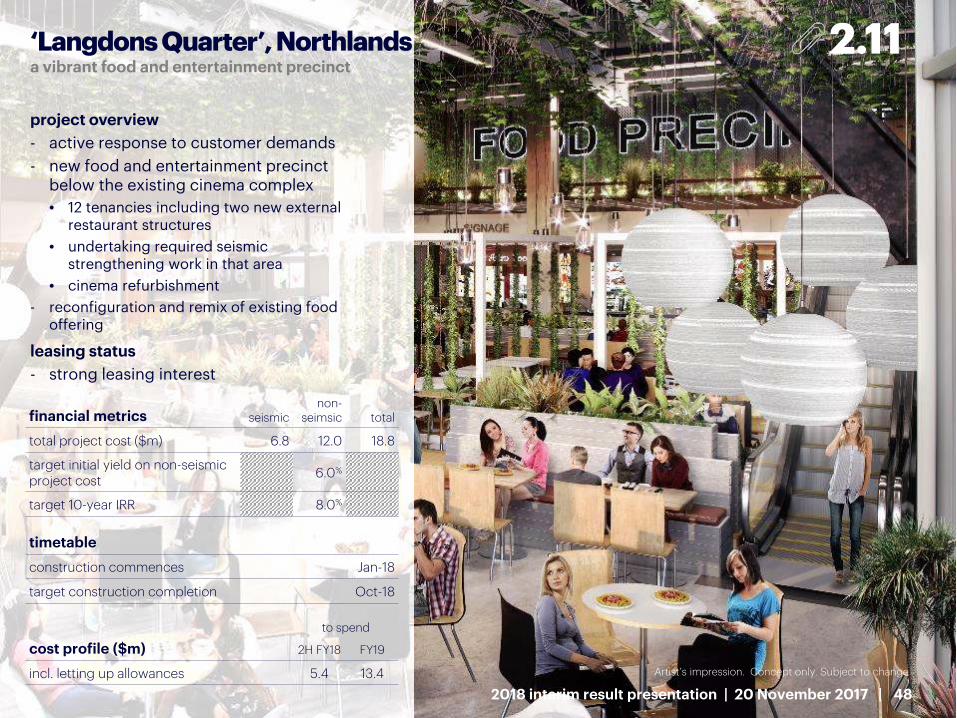
‘Langdons Quarter’, Northlands
482018 interim result presentation | 20 November 2017 |
a vibrant food and entertainment precinct
project overview
- active response to customer demands
- new food and entertainment precinct below the existing cinema complex
• 12 tenancies including two new external restaurant structures
• undertaking required seismic strengthening work in that area
• cinema refurbishment
- reconfiguration and remix of existing food offering
leasing status
- strong leasing interest
financial metrics seismicnon-
seimsic total
total project cost ($m) 6.8 12.0 18.8
target initial yield on non-seismic project cost
6.0%
target 10-year IRR 8.0%
timetable
construction commences Jan-18
target construction completion Oct-18
cost profile ($m)
to spend
2H FY18 FY19
incl. letting up allowances 5.4 13.4
2.11
Artist’s impression. Concept only. Subject to change.
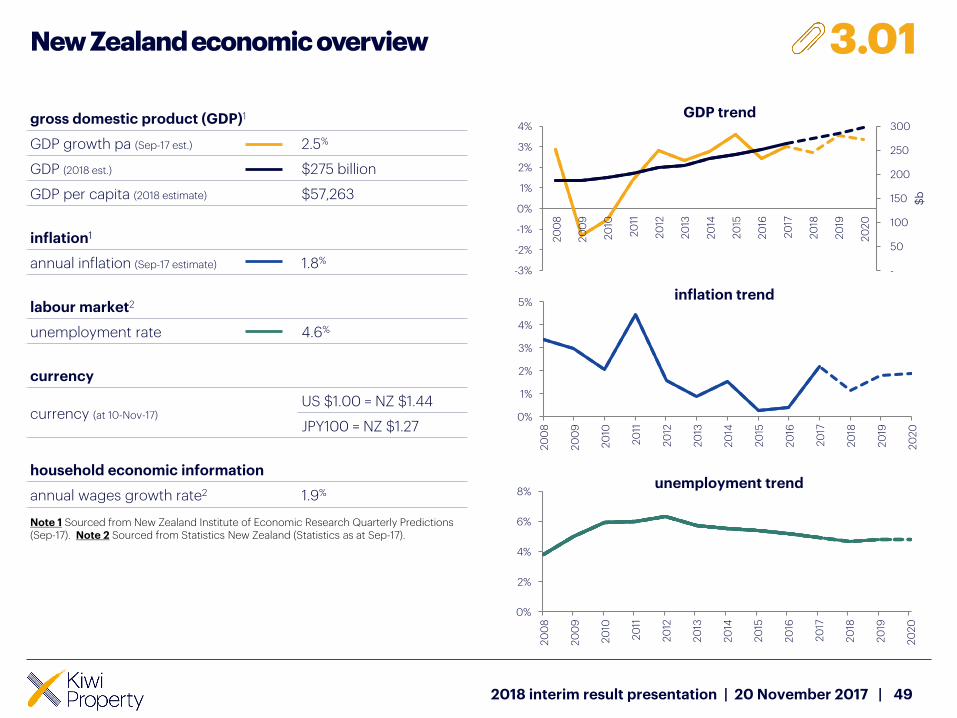
New Zealand economic overview
49
3.01
gross domestic product (GDP)1
GDP growth pa (Sep-17 est.) 2.5%
GDP (2018 est.) $275 billion
GDP per capita (2018 estimate) $57,263
inflation1
annual inflation (Sep-17 estimate) 1.8%
labour market2
unemployment rate 4.6%
currency
currency (at 10-Nov-17)US $1.00 = NZ $1.44
JPY100 = NZ $1.27
household economic information
annual wages growth rate2 1.9%
Note 1 Sourced from New Zealand Institute of Economic Research Quarterly Predictions (Sep-17). Note 2 Sourced from Statistics New Zealand (Statistics as at Sep-17).
2018 interim result presentation | 20 November 2017 |
-
50
100
150
200
250
300
-3%
-2%
-1%
0%
1%
2%
3%
4%
20
08
20
09
20
10
20
11
20
12
20
13
20
14
20
15
20
16
20
17
20
18
20
19
20
20
$b
GDP trend
0%
1%
2%
3%
4%
5%
20
08
20
09
20
10
20
11
20
12
20
13
20
14
20
15
20
16
20
17
20
18
20
19
20
20
inflation trend
0%
2%
4%
6%
8%
20
08
20
09
20
10
20
11
20
12
20
13
20
14
20
15
20
16
20
17
20
18
20
19
20
20
unemployment trend
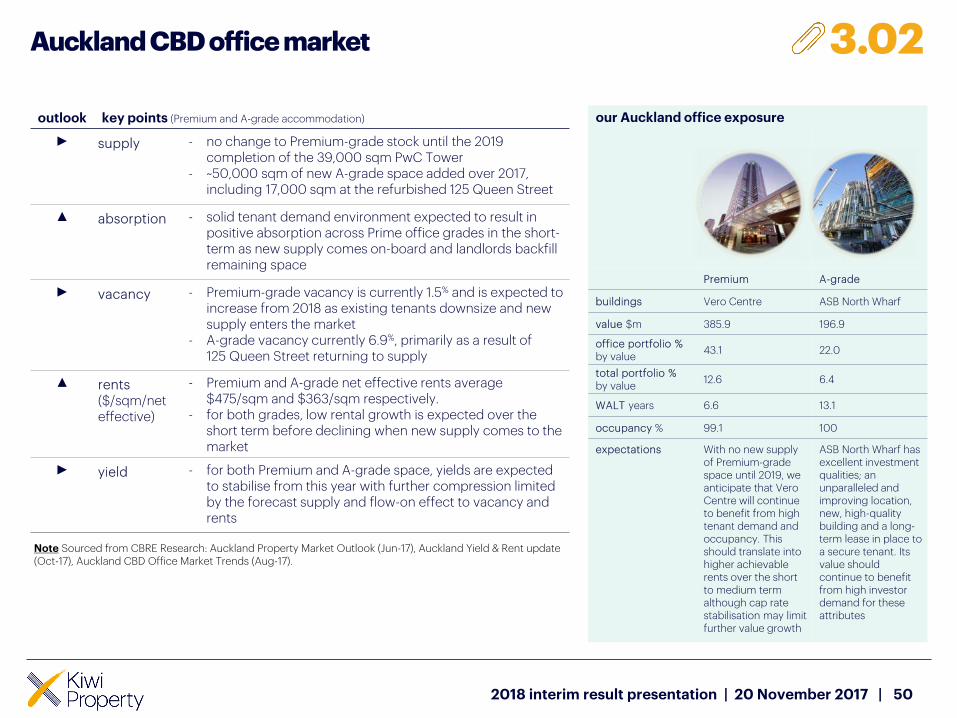
Auckland CBD office market
50
our Auckland office exposure
Premium A-grade
buildings Vero Centre ASB North Wharf
value $m 385.9 196.9
office portfolio %by value
43.1 22.0
total portfolio %by value
12.6 6.4
WALT years 6.6 13.1
occupancy % 99.1 100
expectations With no new supply of Premium-grade space until 2019, we anticipate that Vero Centre will continue to benefit from high tenant demand and occupancy. This should translate into higher achievable rents over the short to medium term although cap rate stabilisation may limit further value growth
ASB North Wharf has excellent investment qualities; an unparalleled and improving location, new, high-quality building and a long-term lease in place to a secure tenant. Its value should continue to benefit from high investor demand for these attributes
outlook key points (Premium and A-grade accommodation)
► supply - no change to Premium-grade stock until the 2019 completion of the 39,000 sqm PwC Tower
- ~50,000 sqm of new A-grade space added over 2017, including 17,000 sqm at the refurbished 125 Queen Street
▲ absorption - solid tenant demand environment expected to result in positive absorption across Prime office grades in the short-term as new supply comes on-board and landlords backfill remaining space
► vacancy - Premium-grade vacancy is currently 1.5% and is expected to increase from 2018 as existing tenants downsize and new supply enters the market
- A-grade vacancy currently 6.9%, primarily as a result of 125 Queen Street returning to supply
▲ rents($/sqm/net effective)
- Premium and A-grade net effective rents average $475/sqm and $363/sqm respectively.
- for both grades, low rental growth is expected over the short term before declining when new supply comes to the market
► yield - for both Premium and A-grade space, yields are expected to stabilise from this year with further compression limited by the forecast supply and flow-on effect to vacancy and rents
Note Sourced from CBRE Research: Auckland Property Market Outlook (Jun-17), Auckland Yield & Rent update (Oct-17), Auckland CBD Office Market Trends (Aug-17).
3.02
2018 interim result presentation | 20 November 2017 |
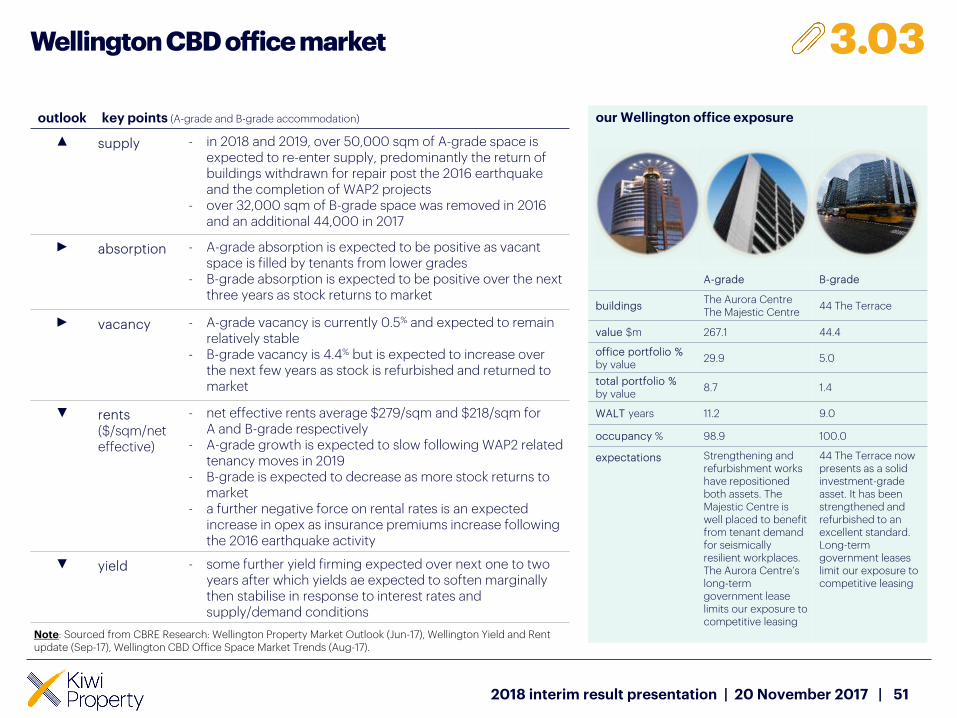
outlook key points (A-grade and B-grade accommodation)
▲ supply - in 2018 and 2019, over 50,000 sqm of A-grade space is expected to re-enter supply, predominantly the return of buildings withdrawn for repair post the 2016 earthquake and the completion of WAP2 projects
- over 32,000 sqm of B-grade space was removed in 2016 and an additional 44,000 in 2017
► absorption - A-grade absorption is expected to be positive as vacant space is filled by tenants from lower grades
- B-grade absorption is expected to be positive over the next three years as stock returns to market
► vacancy - A-grade vacancy is currently 0.5% and expected to remain relatively stable
- B-grade vacancy is 4.4% but is expected to increase over the next few years as stock is refurbished and returned to market
▼ rents($/sqm/net effective)
- net effective rents average $279/sqm and $218/sqm for A and B-grade respectively
- A-grade growth is expected to slow following WAP2 related tenancy moves in 2019
- B-grade is expected to decrease as more stock returns to market
- a further negative force on rental rates is an expected increase in opex as insurance premiums increase following the 2016 earthquake activity
▼ yield - some further yield firming expected over next one to two years after which yields ae expected to soften marginally then stabilise in response to interest rates and supply/demand conditions
Note: Sourced from CBRE Research: Wellington Property Market Outlook (Jun-17), Wellington Yield and Rent update (Sep-17), Wellington CBD Office Space Market Trends (Aug-17).
Wellington CBD office market
51
our Wellington office exposure
A-grade B-grade
buildingsThe Aurora CentreThe Majestic Centre
44 The Terrace
value $m 267.1 44.4
office portfolio %by value
29.9 5.0
total portfolio %by value
8.7 1.4
WALT years 11.2 9.0
occupancy % 98.9 100.0
expectations Strengthening and refurbishment works have repositioned both assets. The Majestic Centre is well placed to benefit from tenant demand for seismically resilient workplaces. The Aurora Centre’s long-term government lease limits our exposure to competitive leasing
44 The Terrace now presents as a solid investment-grade asset. It has been strengthened and refurbished to an excellent standard. Long-term government leases limit our exposure to competitive leasing
3.03
2018 interim result presentation | 20 November 2017 |

group
52
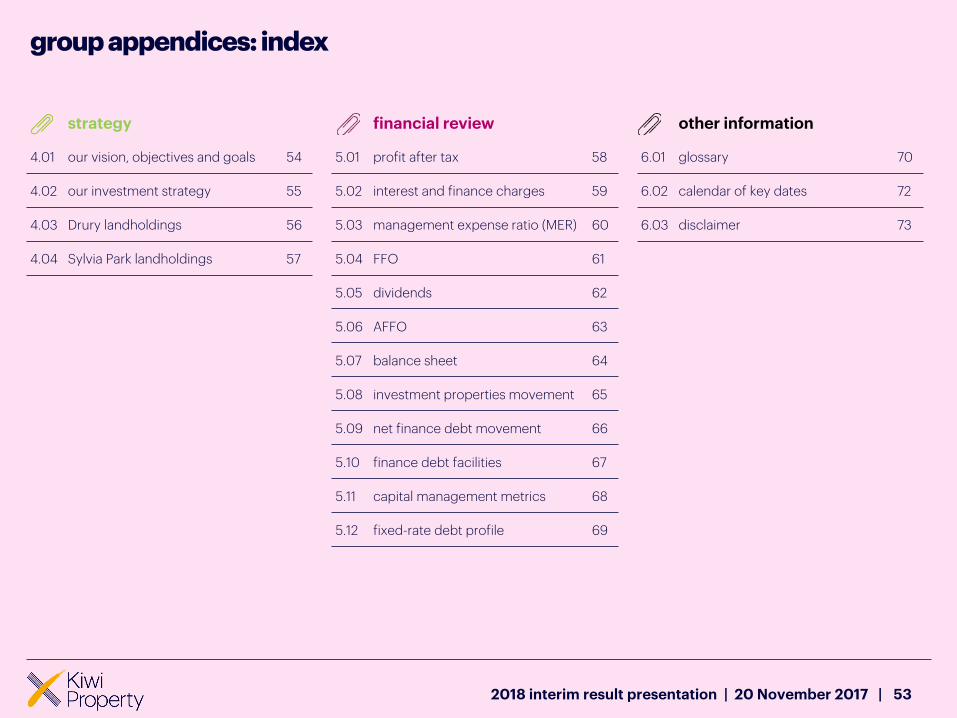
strategy financial review other information
4.01 our vision, objectives and goals 54 5.01 profit after tax 58 6.01 glossary 70
4.02 our investment strategy 55 5.02 interest and finance charges 59 6.02 calendar of key dates 72
4.03 Drury landholdings 56 5.03 management expense ratio (MER) 60 6.03 disclaimer 73
4.04 Sylvia Park landholdings 57 5.04 FFO 61
5.05 dividends 62
5.06 AFFO 63
5.07 balance sheet 64
5.08 investment properties movement 65
5.09 net finance debt movement 66
5.10 finance debt facilities 67
5.11 capital management metrics 68
5.12 fixed-rate debt profile 69
group appendices: index
532018 interim result presentation | 20 November 2017 |
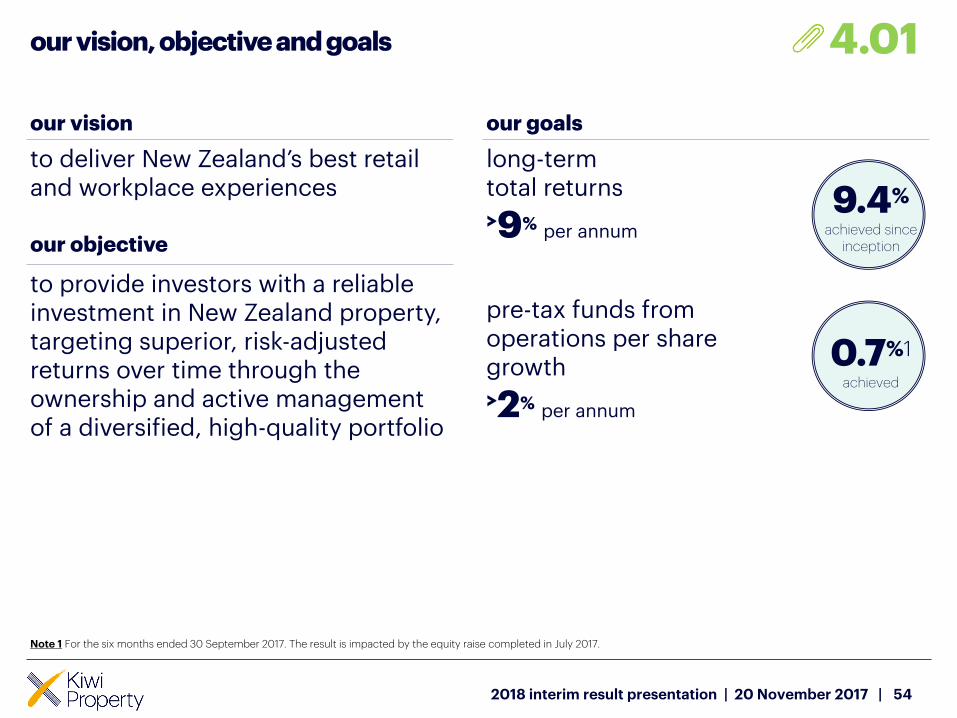
our goals
long-term total returns
>9% per annum
9.4%
achieved since inception
pre-tax funds from operations per share growth
>2% per annum
0.7%1
achieved
our vision, objective and goals
2018 interim result presentation | 20 November 2017 | 54
our vision
to deliver New Zealand’s best retail and workplace experiences
our objective
to provide investors with a reliable investment in New Zealand property, targeting superior, risk-adjusted returns over time through the ownership and active management of a diversified, high-quality portfolio
4.01
Note 1 For the six months ended 30 September 2017. The result is impacted by the equity raise completed in July 2017.
our investment strategy
55
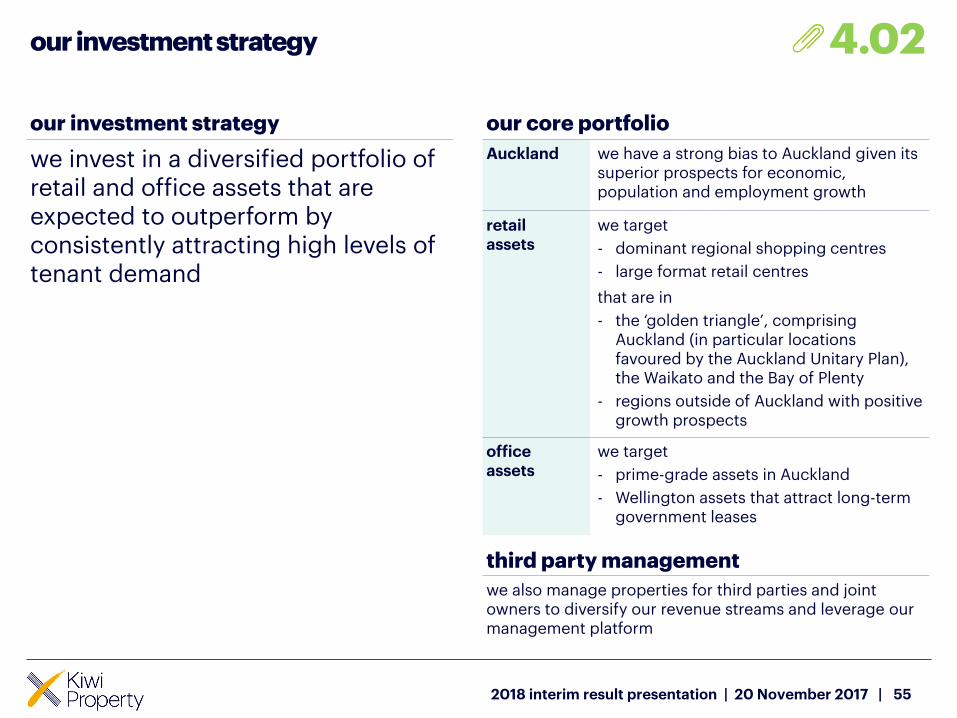
our investment strategy
we invest in a diversified portfolio of retail and office assets that are expected to outperform by consistently attracting high levels of tenant demand
our core portfolio
Auckland we have a strong bias to Auckland given its superior prospects for economic, population and employment growth
retail assets
we target
- dominant regional shopping centres
- large format retail centres
that are in
- the ‘golden triangle’, comprising Auckland (in particular locations favoured by the Auckland Unitary Plan), the Waikato and the Bay of Plenty
- regions outside of Auckland with positive growth prospects
officeassets
we target
- prime-grade assets in Auckland
- Wellington assets that attract long-term government leases
third party management
we also manage properties for third parties and joint owners to diversify our revenue streams and leverage our management platform
2018 interim result presentation | 20 November 2017 |
4.02
Drury landholdings
56
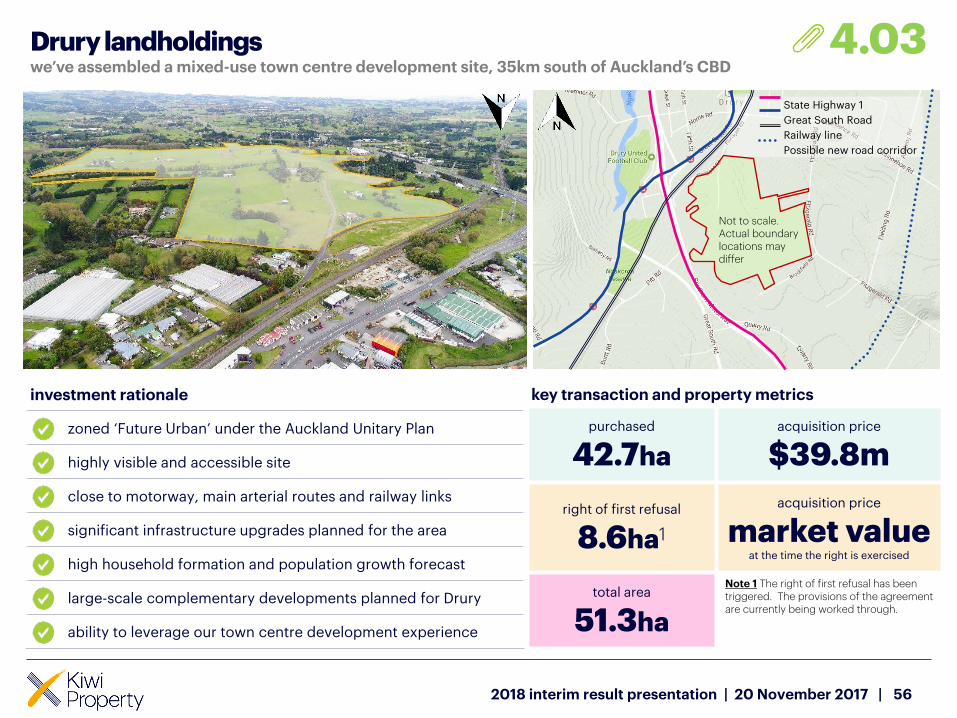
investment rationale
zoned ‘Future Urban’ under the Auckland Unitary Plan
highly visible and accessible site
close to motorway, main arterial routes and railway links
significant infrastructure upgrades planned for the area
high household formation and population growth forecast
large-scale complementary developments planned for Drury
ability to leverage our town centre development experience
key transaction and property metrics
purchased
42.7ha
acquisition price
$39.8m
right of first refusal
8.6ha1
acquisition price
market valueat the time the right is exercised
total area
51.3ha
Note 1 The right of first refusal has been triggered. The provisions of the agreement are currently being worked through.
State Highway 1
Great South Road
Railway line
Possible new road corridor
Not to scale. Actual boundary locations may differ
2018 interim result presentation | 20 November 2017 |
4.03we’ve assembled a mixed-use town centre development site, 35km south of Auckland’s CBD
57
1
3
2
5
Sylvia Park landholdingswe’ve further consolidated our landholdings adjacent to the centre
4
572018 interim result presentation | 20 November 2017 |
key: existing holding acquired post reporting date
ref propertyland
hectares
1 Sylvia Park 20.41
2 Sylvia Park Lifestyle 3.12
3 77 Carbine Road 2.83
4 79 Carbine Road/10 Clemow Drive 3.20
5 Carbine/Clemow block 1.63
total holdings 31.19
4.04
six months ended
30-Sep-17 30-Sep-16 variance
$m $m $m %
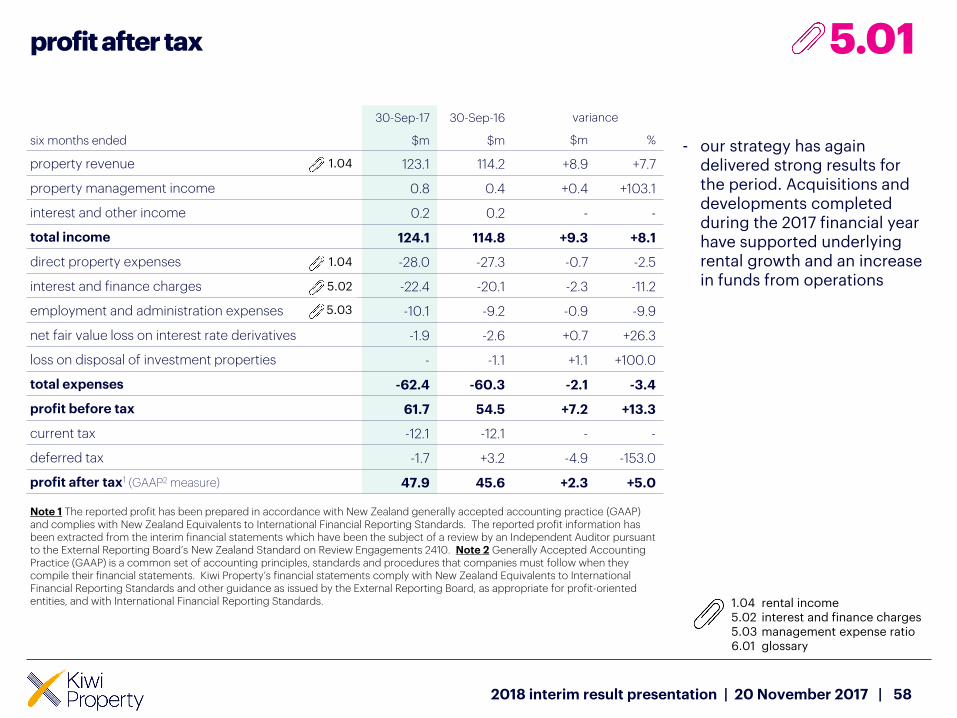
property revenue 123.1 114.2 +8.9 +7.7
property management income 0.8 0.4 +0.4 +103.1
interest and other income 0.2 0.2 - -
total income 124.1 114.8 +9.3 +8.1
direct property expenses -28.0 -27.3 -0.7 -2.5
interest and finance charges -22.4 -20.1 -2.3 -11.2
employment and administration expenses -10.1 -9.2 -0.9 -9.9
net fair value loss on interest rate derivatives -1.9 -2.6 +0.7 +26.3
loss on disposal of investment properties - -1.1 +1.1 +100.0
total expenses -62.4 -60.3 -2.1 -3.4
profit before tax 61.7 54.5 +7.2 +13.3
current tax -12.1 -12.1 - -
deferred tax -1.7 +3.2 -4.9 -153.0
profit after tax1 (GAAP2 measure) 47.9 45.6 +2.3 +5.0
Note 1 The reported profit has been prepared in accordance with New Zealand generally accepted accounting practice (GAAP) and complies with New Zealand Equivalents to International Financial Reporting Standards. The reported profit information has been extracted from the interim financial statements which have been the subject of a review by an Independent Auditor pursuant to the External Reporting Board’s New Zealand Standard on Review Engagements 2410. Note 2 Generally Accepted Accounting Practice (GAAP) is a common set of accounting principles, standards and procedures that companies must follow when they compile their financial statements. Kiwi Property’s financial statements comply with New Zealand Equivalents to International Financial Reporting Standards and other guidance as issued by the External Reporting Board, as appropriate for profit-oriented entities, and with International Financial Reporting Standards.
5.03
profit after tax
58
5.01
1.04
1.04
5.02
- our strategy has again delivered strong results for the period. Acquisitions and developments completed during the 2017 financial year have supported underlying rental growth and an increase in funds from operations
1.045.025.036.01
rental incomeinterest and finance chargesmanagement expense ratioglossary
2018 interim result presentation | 20 November 2017 |
interest and finance charges
59
six months ended
30-Sep-17 30-Sep-16 variance
$m $m $m %
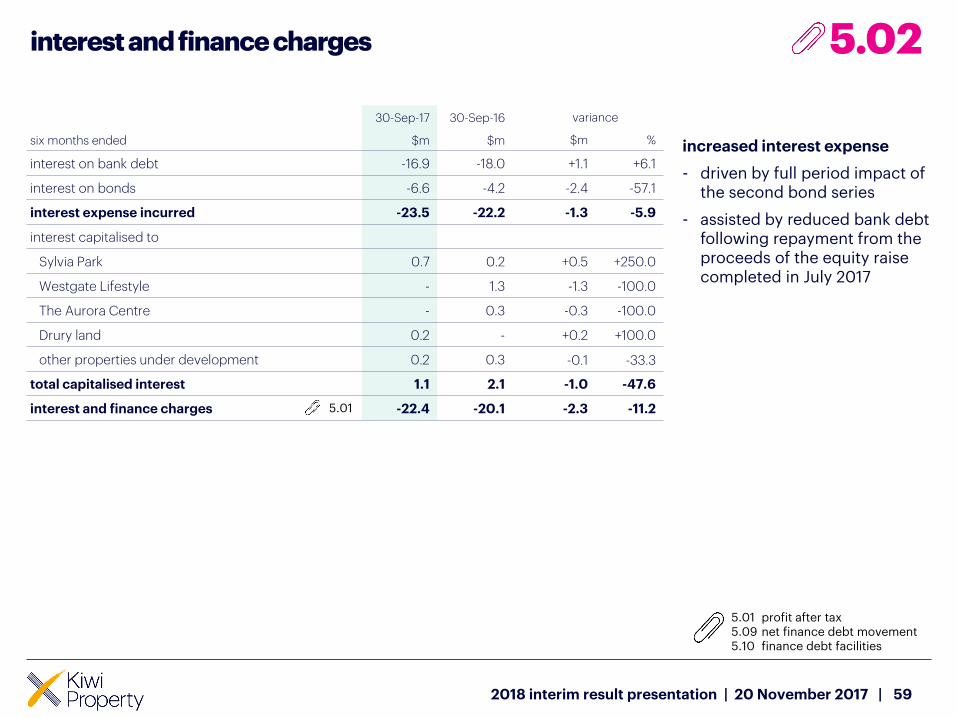
interest on bank debt -16.9 -18.0 +1.1 +6.1
interest on bonds -6.6 -4.2 -2.4 -57.1
interest expense incurred -23.5 -22.2 -1.3 -5.9
interest capitalised to
Sylvia Park 0.7 0.2 +0.5 +250.0
Westgate Lifestyle - 1.3 -1.3 -100.0
The Aurora Centre - 0.3 -0.3 -100.0
Drury land 0.2 - +0.2 +100.0
other properties under development 0.2 0.3 -0.1 -33.3
total capitalised interest 1.1 2.1 -1.0 -47.6
interest and finance charges -22.4 -20.1 -2.3 -11.2
increased interest expense
- driven by full period impact of the second bond series
- assisted by reduced bank debt following repayment from the proceeds of the equity raise completed in July 2017
5.02
5.015.095.10
profit after taxnet finance debt movementfinance debt facilities
5.01
2018 interim result presentation | 20 November 2017 |
twelve months ended
30-Sep-17 31-Mar-17 30-Sep-16
$m $m $m
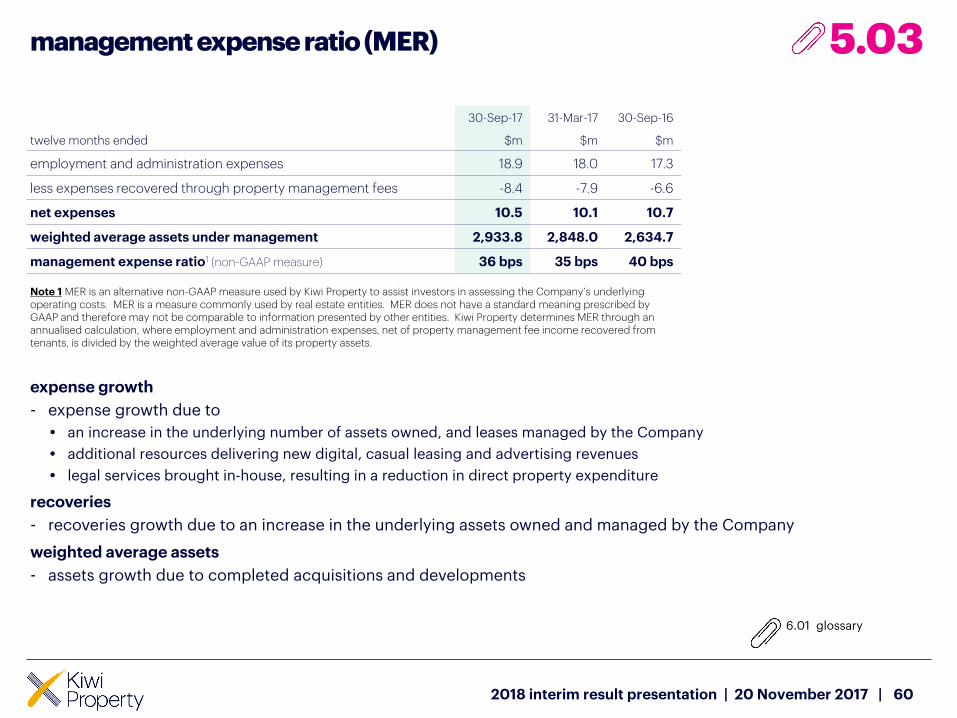
employment and administration expenses 18.9 18.0 17.3
less expenses recovered through property management fees -8.4 -7.9 -6.6
net expenses 10.5 10.1 10.7
weighted average assets under management 2,933.8 2,848.0 2,634.7
management expense ratio1 (non-GAAP measure) 36 bps 35 bps 40 bps
Note 1 MER is an alternative non-GAAP measure used by Kiwi Property to assist investors in assessing the Company’s underlying operating costs. MER is a measure commonly used by real estate entities. MER does not have a standard meaning prescribed by GAAP and therefore may not be comparable to information presented by other entities. Kiwi Property determines MER through anannualised calculation, where employment and administration expenses, net of property management fee income recovered from tenants, is divided by the weighted average value of its property assets.
management expense ratio (MER)
60
expense growth
- expense growth due to
• an increase in the underlying number of assets owned, and leases managed by the Company
• additional resources delivering new digital, casual leasing and advertising revenues
• legal services brought in-house, resulting in a reduction in direct property expenditure
recoveries
- recoveries growth due to an increase in the underlying assets owned and managed by the Company
weighted average assets
- assets growth due to completed acquisitions and developments
5.03
2018 interim result presentation | 20 November 2017 |
6.01 glossary
six months ended
30-Sep-17 30-Sep-16 variance
$m $m $m %
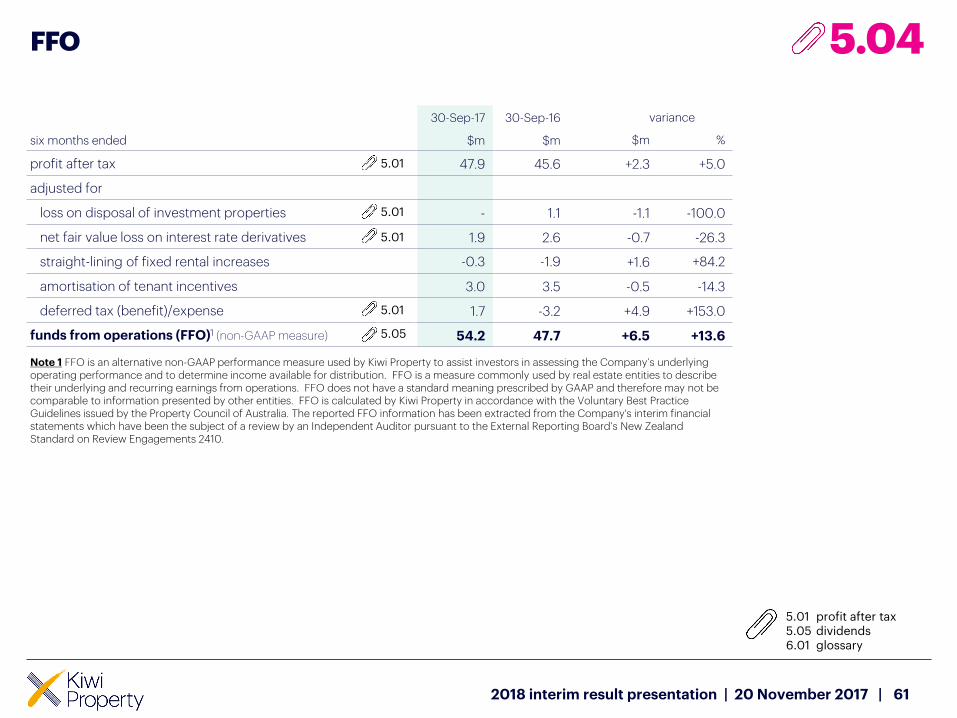
profit after tax 47.9 45.6 +2.3 +5.0
adjusted for
loss on disposal of investment properties - 1.1 -1.1 -100.0
net fair value loss on interest rate derivatives 1.9 2.6 -0.7 -26.3
straight-lining of fixed rental increases -0.3 -1.9 +1.6 +84.2
amortisation of tenant incentives 3.0 3.5 -0.5 -14.3
deferred tax (benefit)/expense 1.7 -3.2 +4.9 +153.0
funds from operations (FFO)1 (non-GAAP measure) 54.2 47.7 +6.5 +13.6
Note 1 FFO is an alternative non-GAAP performance measure used by Kiwi Property to assist investors in assessing the Company’s underlying operating performance and to determine income available for distribution. FFO is a measure commonly used by real estate entities to describe their underlying and recurring earnings from operations. FFO does not have a standard meaning prescribed by GAAP and therefore may not be comparable to information presented by other entities. FFO is calculated by Kiwi Property in accordance with the Voluntary Best Practice Guidelines issued by the Property Council of Australia. The reported FFO information has been extracted from the Company's interim financial statements which have been the subject of a review by an Independent Auditor pursuant to the External Reporting Board’s New Zealand Standard on Review Engagements 2410.
5.01
5.01
5.01
FFO
61
5.04
5.015.056.01
profit after taxdividendsglossary
2018 interim result presentation | 20 November 2017 |
5.01
5.05
5.04
six months ended
30-Sep-17 30-Sep-16 30-Sep-17 30-Sep-16
$m $m cps2 cps2
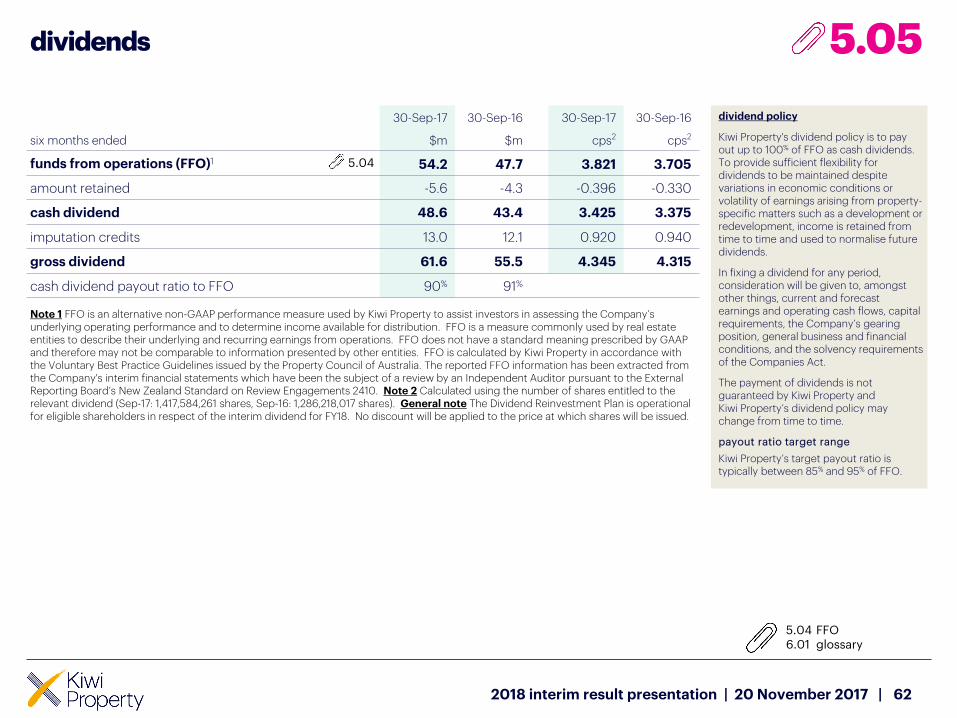
funds from operations (FFO)1 54.2 47.7 3.821 3.705
amount retained -5.6 -4.3 -0.396 -0.330
cash dividend 48.6 43.4 3.425 3.375
imputation credits 13.0 12.1 0.920 0.940
gross dividend 61.6 55.5 4.345 4.315
cash dividend payout ratio to FFO 90% 91%
Note 1 FFO is an alternative non-GAAP performance measure used by Kiwi Property to assist investors in assessing the Company’s underlying operating performance and to determine income available for distribution. FFO is a measure commonly used by real estate entities to describe their underlying and recurring earnings from operations. FFO does not have a standard meaning prescribed by GAAP and therefore may not be comparable to information presented by other entities. FFO is calculated by Kiwi Property in accordance withthe Voluntary Best Practice Guidelines issued by the Property Council of Australia. The reported FFO information has been extracted from the Company's interim financial statements which have been the subject of a review by an Independent Auditor pursuant to the External Reporting Board’s New Zealand Standard on Review Engagements 2410. Note 2 Calculated using the number of shares entitled to the relevant dividend (Sep-17: 1,417,584,261 shares, Sep-16: 1,286,218,017 shares). General note The Dividend Reinvestment Plan is operational for eligible shareholders in respect of the interim dividend for FY18. No discount will be applied to the price at which shares will be issued.
dividends
62
5.05
2018 interim result presentation | 20 November 2017 |
dividend policy
Kiwi Property's dividend policy is to pay out up to 100% of FFO as cash dividends. To provide sufficient flexibility for dividends to be maintained despite variations in economic conditions or volatility of earnings arising from property-specific matters such as a development or redevelopment, income is retained from time to time and used to normalise future dividends.
In fixing a dividend for any period, consideration will be given to, amongst other things, current and forecast earnings and operating cash flows, capital requirements, the Company’s gearing position, general business and financial conditions, and the solvency requirements of the Companies Act.
The payment of dividends is not guaranteed by Kiwi Property and Kiwi Property’s dividend policy may change from time to time.
payout ratio target range
Kiwi Property’s target payout ratio is typically between 85% and 95% of FFO.
5.046.01
FFOglossary
six months ended
30-Sep-17 30-Sep-16 variance
$m $m $m %
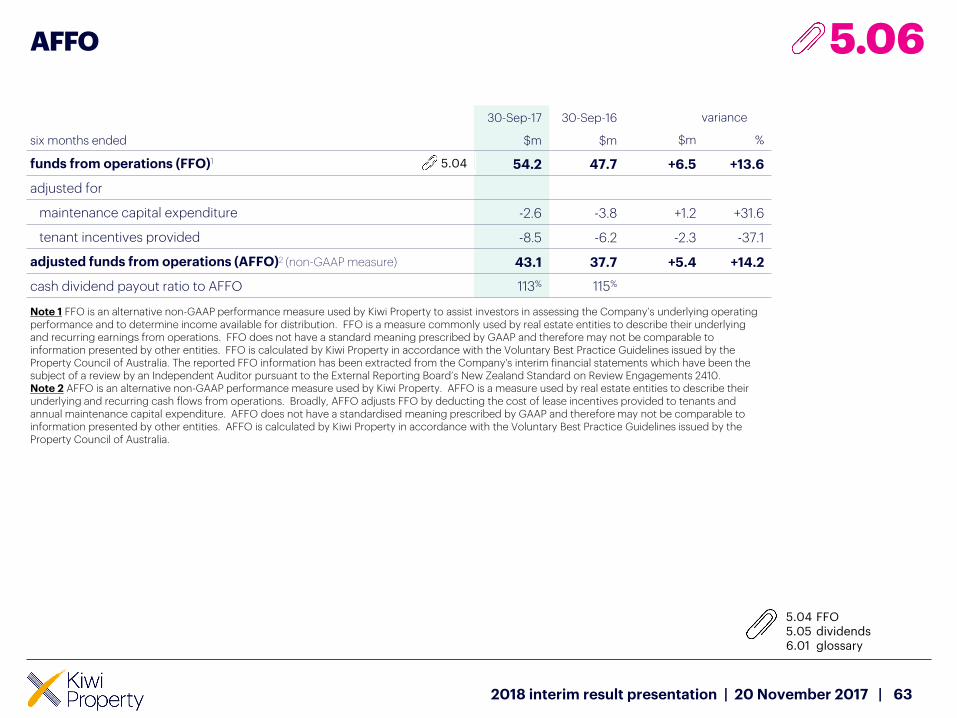
funds from operations (FFO)1 54.2 47.7 +6.5 +13.6
adjusted for
maintenance capital expenditure -2.6 -3.8 +1.2 +31.6
tenant incentives provided -8.5 -6.2 -2.3 -37.1
adjusted funds from operations (AFFO)2 (non-GAAP measure) 43.1 37.7 +5.4 +14.2
cash dividend payout ratio to AFFO 113% 115%
Note 1 FFO is an alternative non-GAAP performance measure used by Kiwi Property to assist investors in assessing the Company’s underlying operating performance and to determine income available for distribution. FFO is a measure commonly used by real estate entities to describe their underlying and recurring earnings from operations. FFO does not have a standard meaning prescribed by GAAP and therefore may not be comparable to information presented by other entities. FFO is calculated by Kiwi Property in accordance with the Voluntary Best Practice Guidelines issued by the Property Council of Australia. The reported FFO information has been extracted from the Company's interim financial statements which have been the subject of a review by an Independent Auditor pursuant to the External Reporting Board’s New Zealand Standard on Review Engagements 2410. Note 2 AFFO is an alternative non-GAAP performance measure used by Kiwi Property. AFFO is a measure used by real estate entities to describe their underlying and recurring cash flows from operations. Broadly, AFFO adjusts FFO by deducting the cost of lease incentives provided to tenants and annual maintenance capital expenditure. AFFO does not have a standardised meaning prescribed by GAAP and therefore may not be comparable to information presented by other entities. AFFO is calculated by Kiwi Property in accordance with the Voluntary Best Practice Guidelines issued by the Property Council of Australia.
AFFO
63
5.06
5.04
5.045.056.01
FFOdividendsglossary
2018 interim result presentation | 20 November 2017 |
as at
30-Sep-17 31-Mar-17 movement
$m $m $m %
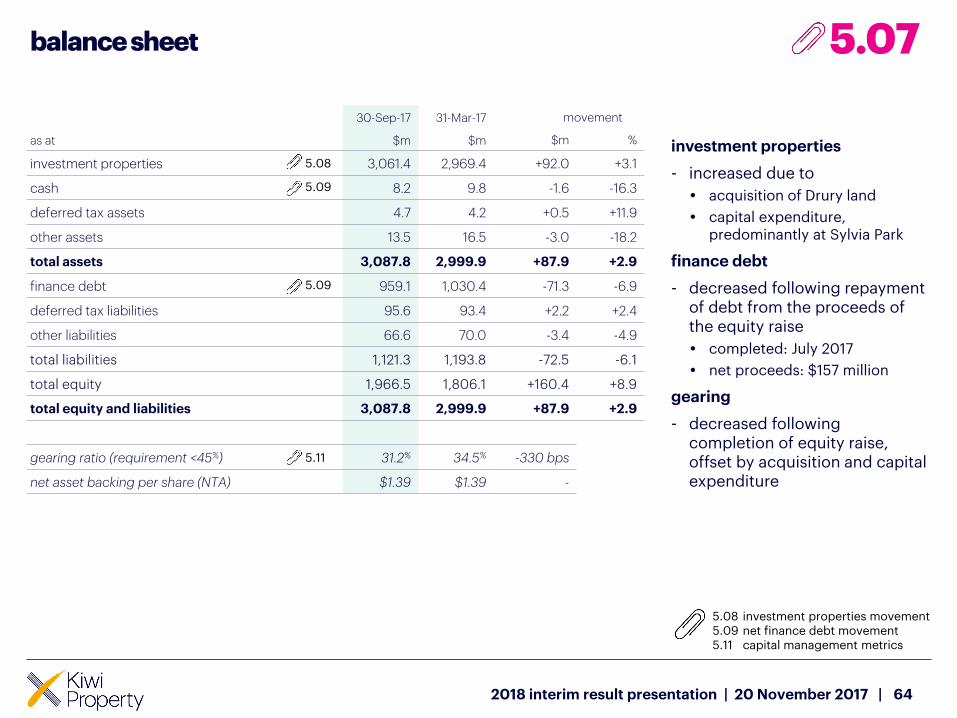
investment properties 3,061.4 2,969.4 +92.0 +3.1
cash 8.2 9.8 -1.6 -16.3
deferred tax assets 4.7 4.2 +0.5 +11.9
other assets 13.5 16.5 -3.0 -18.2
total assets 3,087.8 2,999.9 +87.9 +2.9
finance debt 959.1 1,030.4 -71.3 -6.9
deferred tax liabilities 95.6 93.4 +2.2 +2.4
other liabilities 66.6 70.0 -3.4 -4.9
total liabilities 1,121.3 1,193.8 -72.5 -6.1
total equity 1,966.5 1,806.1 +160.4 +8.9
total equity and liabilities 3,087.8 2,999.9 +87.9 +2.9
gearing ratio (requirement <45%) 31.2% 34.5% -330 bps
net asset backing per share (NTA) $1.39 $1.39 -
balance sheet
64
5.08
5.09
5.09
investment properties
- increased due to
• acquisition of Drury land
• capital expenditure, predominantly at Sylvia Park
finance debt
- decreased following repayment of debt from the proceeds of the equity raise
• completed: July 2017
• net proceeds: $157 million
gearing
- decreased following completion of equity raise, offset by acquisition and capital expenditure
5.07
5.085.095.11
investment properties movementnet finance debt movementcapital management metrics
2018 interim result presentation | 20 November 2017 |
5.11
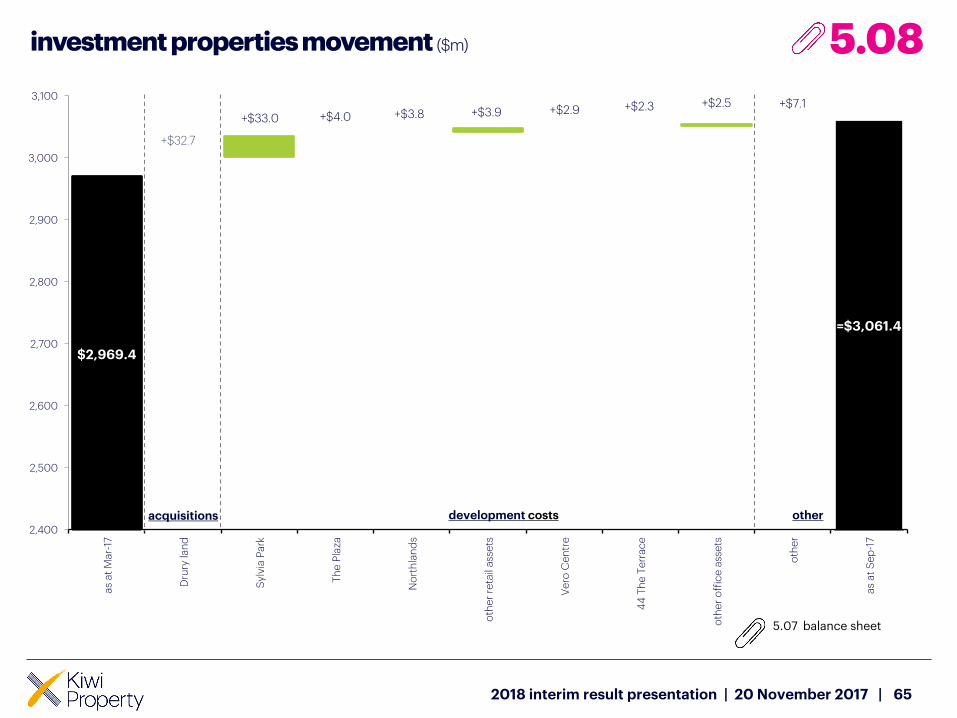
=$3,061.4
$2,969.4
+$32.7
+$33.0 +$4.0 +$3.8 +$3.9 +$2.9 +$2.3 +$2.5 +$7.1
2,400
2,500
2,600
2,700
2,800
2,900
3,000
3,100a
s a
t M
ar-
17
Dru
ry la
nd
Sy
lvia
Pa
rk
Th
e P
laza
No
rth
lan
ds
oth
er
reta
il a
sse
ts
Ve
ro C
en
tre
44
Th
e T
err
ac
e
oth
er
off
ice
ass
ets
oth
er
as
at
Se
p-1
7
investment properties movement ($m)
65
acquisitions development costs other
5.08
2018 interim result presentation | 20 November 2017 |
5.07 balance sheet
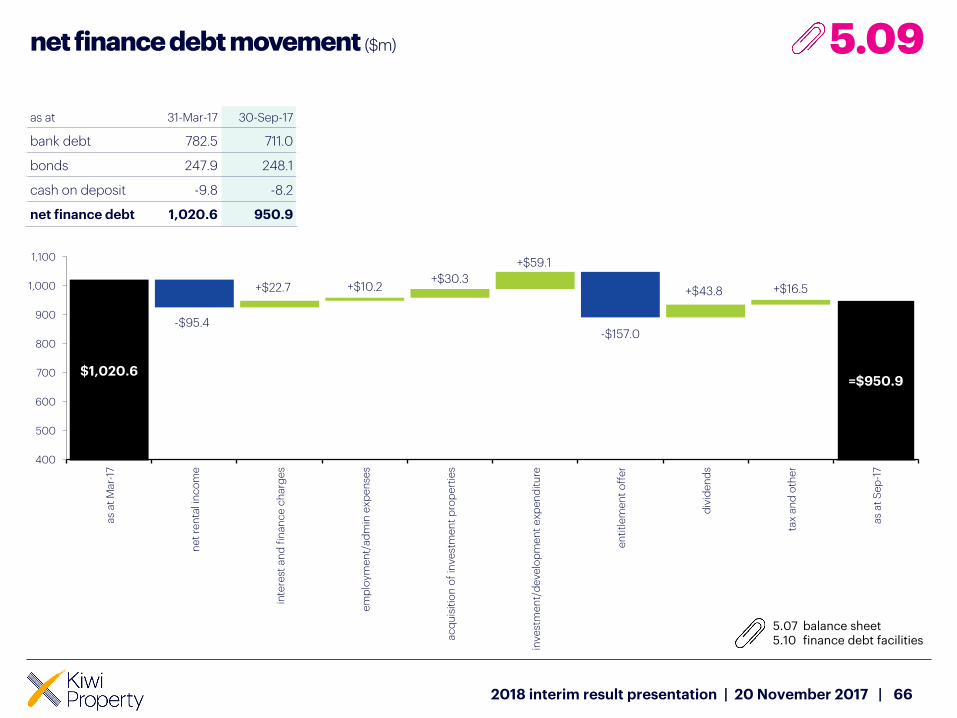
=$950.9$1,020.6
+$10.2+$30.3
+$59.1
+$43.8 +$16.5
-$95.4-$157.0
400
500
600
700
800
900
1,000
1,100
as
at
Ma
r-17
ne
t re
nta
l in
co
me
inte
rest
an
d f
ina
nc
e c
ha
rge
s
em
plo
ym
en
t/a
dm
in e
xp
en
ses
ac
qu
isit
ion
of
inv
est
me
nt
pro
pe
rtie
s
inv
est
me
nt/
de
ve
lop
me
nt
ex
pe
nd
itu
re
en
titl
em
en
t o
ffe
r
div
ide
nd
s
tax
an
d o
the
r
as
at
Se
p-1
7
+$22.7
net finance debt movement ($m)
66
5.09
as at 31-Mar-17 30-Sep-17
bank debt 782.5 711.0
bonds 247.9 248.1
cash on deposit -9.8 -8.2
net finance debt 1,020.6 950.9
2018 interim result presentation | 20 November 2017 |
5.075.10
balance sheetfinance debt facilities
key: ANZ BNZ ` CBA CCB HSBC Westpac Bonds
$30
$52.5
$52.5
$60.0
$28
$73.0
$74.0
$55.0
$45.0
$80.0
$80.0
$25
$0.0
$30
$52.5
$52.5
$60.0 $125.0
$125.0 $100.0
$0.0
$33.0
$34.0
$33.0
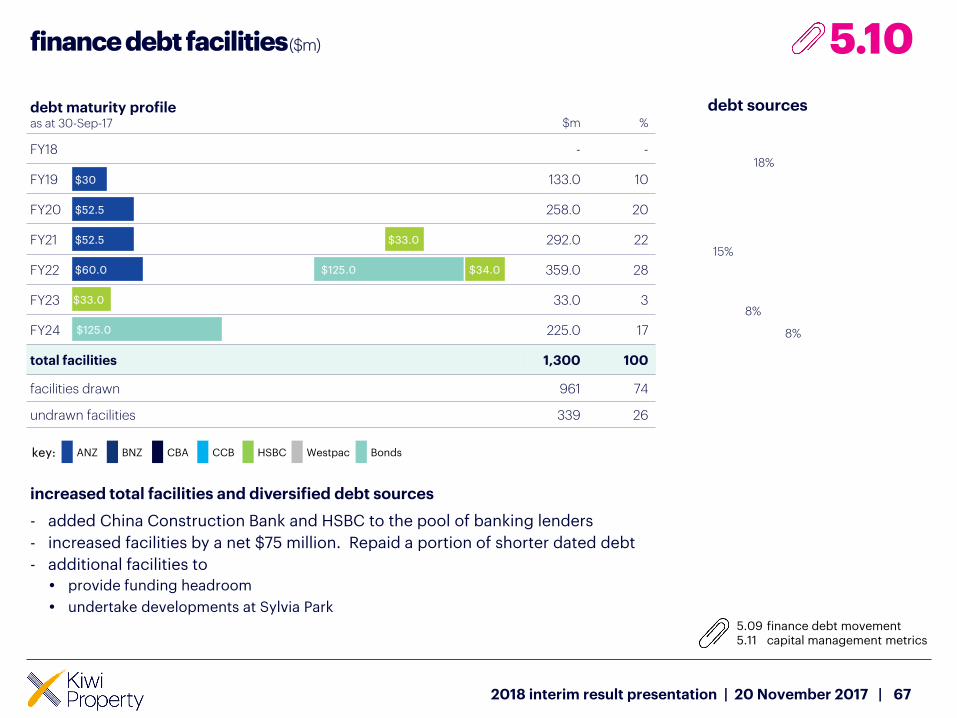
debt maturity profileas at 30-Sep-17 $m %
FY18 - -
FY19 133.0 10
FY20 258.0 20
FY21 292.0 22
FY22 359.0 28
FY23 33.0 3
FY24 225.0 17
total facilities 1,300 100
facilities drawn 961 74
undrawn facilities 339 26
finance debt facilities($m)
67
increased total facilities and diversified debt sources
- added China Construction Bank and HSBC to the pool of banking lenders
- increased facilities by a net $75 million. Repaid a portion of shorter dated debt
- additional facilities to
• provide funding headroom
• undertake developments at Sylvia Park
5.10
2018 interim result presentation | 20 November 2017 |
5.095.11
finance debt movementcapital management metrics
15%
18%
18%8%
8%
15%
18%
debt sources
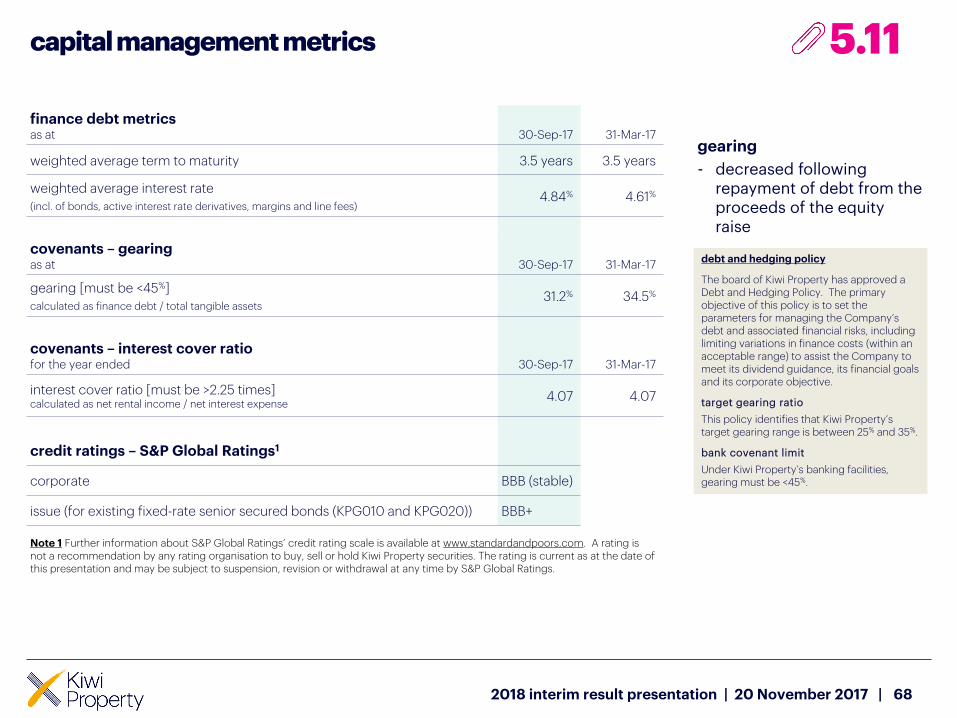
finance debt metricsas at 30-Sep-17 31-Mar-17
weighted average term to maturity 3.5 years 3.5 years
weighted average interest rate
(incl. of bonds, active interest rate derivatives, margins and line fees)4.84% 4.61%
covenants – gearingas at 30-Sep-17 31-Mar-17
gearing [must be <45%]
calculated as finance debt / total tangible assets31.2% 34.5%
covenants – interest cover ratiofor the year ended 30-Sep-17 31-Mar-17
interest cover ratio [must be >2.25 times] calculated as net rental income / net interest expense
4.07 4.07
credit ratings – S&P Global Ratings1
corporate BBB (stable)
issue (for existing fixed-rate senior secured bonds (KPG010 and KPG020)) BBB+
Note 1 Further information about S&P Global Ratings’ credit rating scale is available at www.standardandpoors.com. A rating is not a recommendation by any rating organisation to buy, sell or hold Kiwi Property securities. The rating is current as at the date of this presentation and may be subject to suspension, revision or withdrawal at any time by S&P Global Ratings.
capital management metrics
68
gearing
- decreased following repayment of debt from the proceeds of the equity raise
5.11
2018 interim result presentation | 20 November 2017 |
debt and hedging policy
The board of Kiwi Property has approved a Debt and Hedging Policy. The primary objective of this policy is to set the parameters for managing the Company’s debt and associated financial risks, including limiting variations in finance costs (within an acceptable range) to assist the Company to meet its dividend guidance, its financial goals and its corporate objective.
target gearing ratio
This policy identifies that Kiwi Property’s target gearing range is between 25% and 35%.
bank covenant limit
Under Kiwi Property’s banking facilities, gearing must be <45%.
2%
3%
4%
5%
6%
7%
8%
200
300
400
500
600
700
800
Mar-18 Mar-19 Mar-20 Mar-21 Mar-22 Mar-23
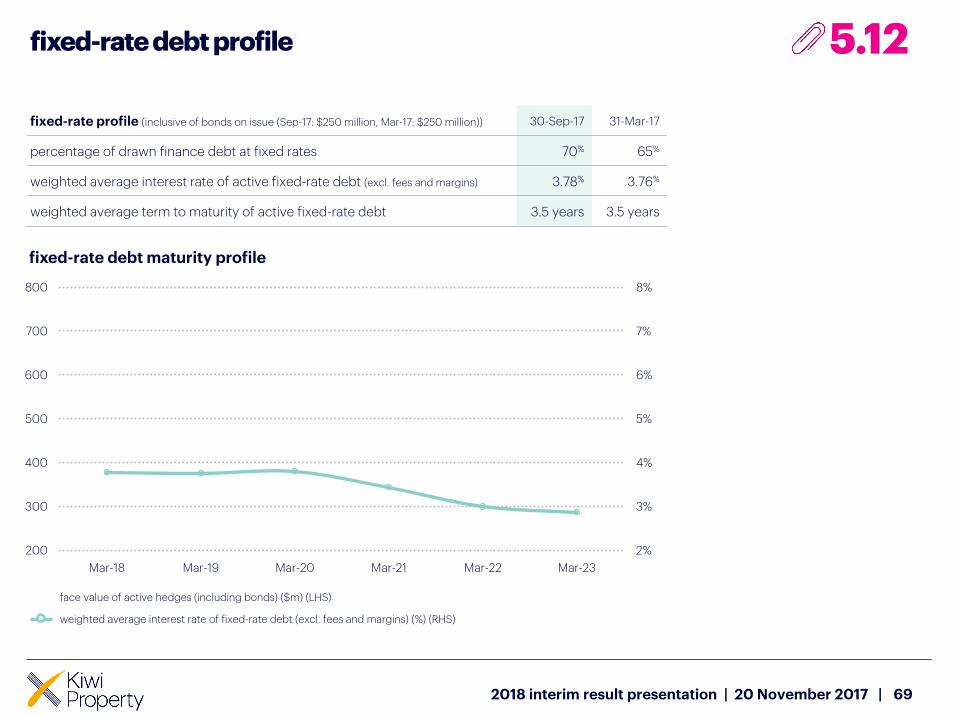
fixed-rate debt profile
69
fixed-rate profile (inclusive of bonds on issue (Sep-17: $250 million, Mar-17: $250 million)) 30-Sep-17 31-Mar-17
percentage of drawn finance debt at fixed rates 70% 65%
weighted average interest rate of active fixed-rate debt (excl. fees and margins) 3.78% 3.76%
weighted average term to maturity of active fixed-rate debt 3.5 years 3.5 years
5.12
face value of active hedges (including bonds) ($m) (LHS)
weighted average interest rate of fixed-rate debt (excl. fees and margins) (%) (RHS)
2018 interim result presentation | 20 November 2017 |
fixed-rate debt maturity profile
glossary
70
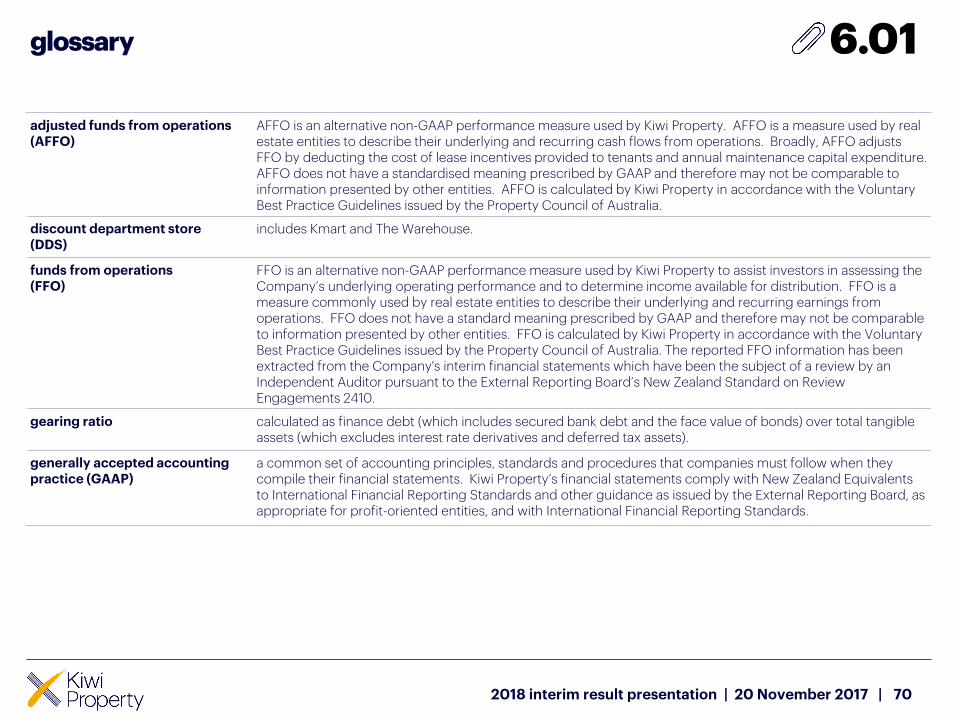
adjusted funds from operations(AFFO)
AFFO is an alternative non-GAAP performance measure used by Kiwi Property. AFFO is a measure used by real estate entities to describe their underlying and recurring cash flows from operations. Broadly, AFFO adjusts FFO by deducting the cost of lease incentives provided to tenants and annual maintenance capital expenditure. AFFO does not have a standardised meaning prescribed by GAAP and therefore may not be comparable to information presented by other entities. AFFO is calculated by Kiwi Property in accordance with the Voluntary Best Practice Guidelines issued by the Property Council of Australia.
discount department store(DDS)
includes Kmart and The Warehouse.
funds from operations (FFO)
FFO is an alternative non-GAAP performance measure used by Kiwi Property to assist investors in assessing the Company’s underlying operating performance and to determine income available for distribution. FFO is a measure commonly used by real estate entities to describe their underlying and recurring earnings from operations. FFO does not have a standard meaning prescribed by GAAP and therefore may not be comparable to information presented by other entities. FFO is calculated by Kiwi Property in accordance with the Voluntary Best Practice Guidelines issued by the Property Council of Australia. The reported FFO information has been extracted from the Company's interim financial statements which have been the subject of a review by an Independent Auditor pursuant to the External Reporting Board’s New Zealand Standard on Review Engagements 2410.
gearing ratio calculated as finance debt (which includes secured bank debt and the face value of bonds) over total tangible assets (which excludes interest rate derivatives and deferred tax assets).
generally accepted accounting practice (GAAP)
a common set of accounting principles, standards and procedures that companies must follow when they compile their financial statements. Kiwi Property’s financial statements comply with New Zealand Equivalents to International Financial Reporting Standards and other guidance as issued by the External Reporting Board, as appropriate for profit-oriented entities, and with International Financial Reporting Standards.
6.01
2018 interim result presentation | 20 November 2017 |
glossary
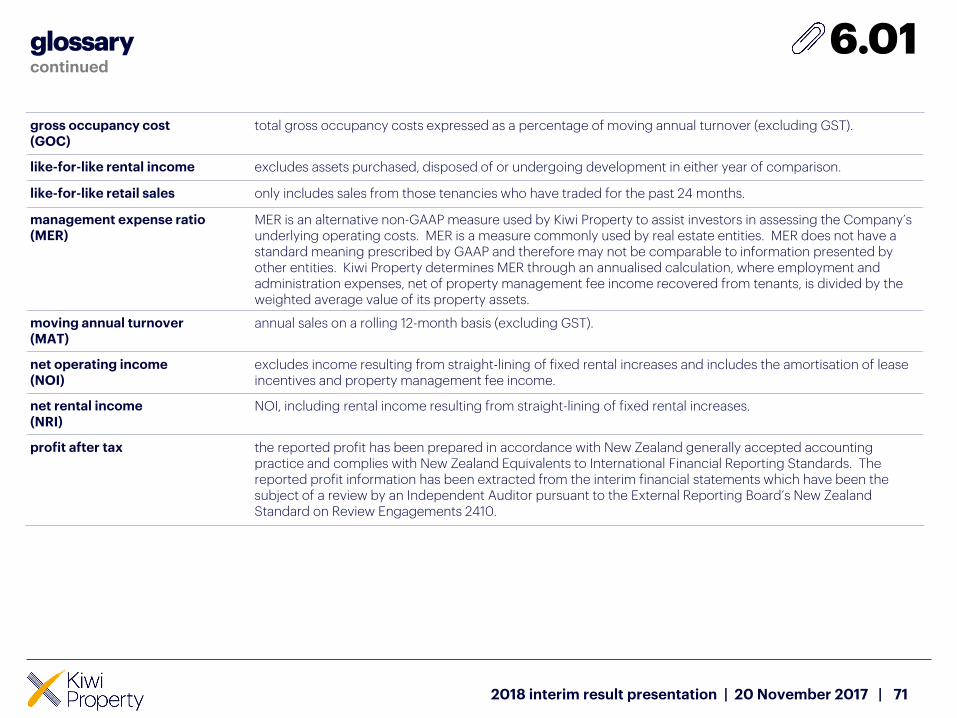
gross occupancy cost (GOC)
total gross occupancy costs expressed as a percentage of moving annual turnover (excluding GST).
like-for-like rental income excludes assets purchased, disposed of or undergoing development in either year of comparison.
like-for-like retail sales only includes sales from those tenancies who have traded for the past 24 months.
management expense ratio(MER)
MER is an alternative non-GAAP measure used by Kiwi Property to assist investors in assessing the Company’s underlying operating costs. MER is a measure commonly used by real estate entities. MER does not have a standard meaning prescribed by GAAP and therefore may not be comparable to information presented by other entities. Kiwi Property determines MER through an annualised calculation, where employment and administration expenses, net of property management fee income recovered from tenants, is divided by the weighted average value of its property assets.
moving annual turnover (MAT)
annual sales on a rolling 12-month basis (excluding GST).
net operating income (NOI)
excludes income resulting from straight-lining of fixed rental increases and includes the amortisation of lease incentives and property management fee income.
net rental income (NRI)
NOI, including rental income resulting from straight-lining of fixed rental increases.
profit after tax the reported profit has been prepared in accordance with New Zealand generally accepted accounting practice and complies with New Zealand Equivalents to International Financial Reporting Standards. The reported profit information has been extracted from the interim financial statements which have been the subject of a review by an Independent Auditor pursuant to the External Reporting Board’s New Zealand Standard on Review Engagements 2410.
continued
71
6.01
2018 interim result presentation | 20 November 2017 |
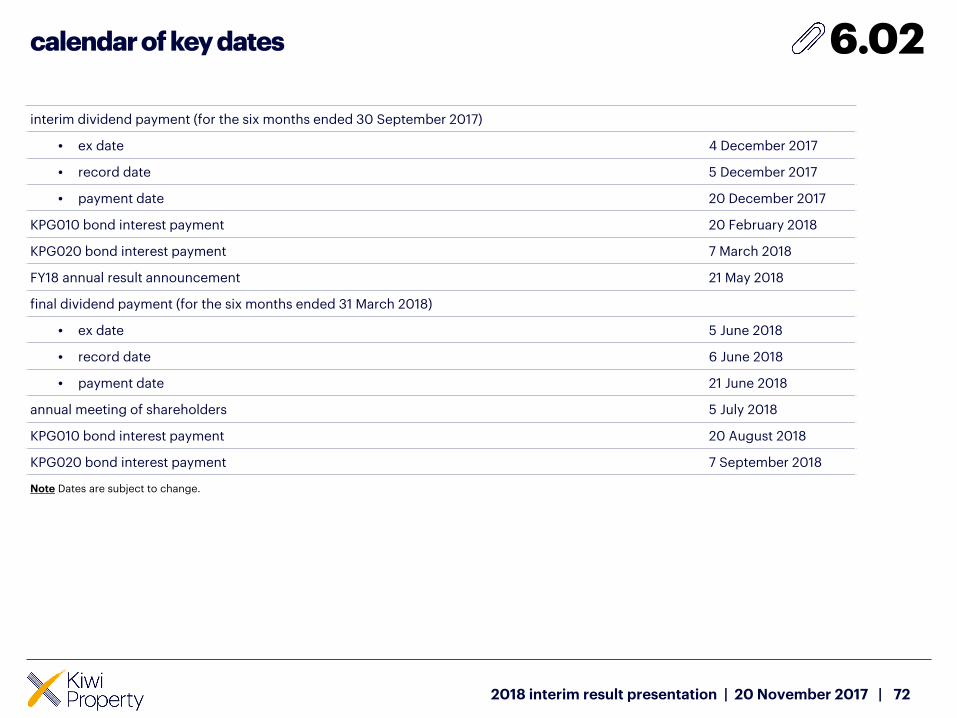
calendar of key dates
72
interim dividend payment (for the six months ended 30 September 2017)
• ex date 4 December 2017
• record date 5 December 2017
• payment date 20 December 2017
KPG010 bond interest payment 20 February 2018
KPG020 bond interest payment 7 March 2018
FY18 annual result announcement 21 May 2018
final dividend payment (for the six months ended 31 March 2018)
• ex date 5 June 2018
• record date 6 June 2018
• payment date 21 June 2018
annual meeting of shareholders 5 July 2018
KPG010 bond interest payment 20 August 2018
KPG020 bond interest payment 7 September 2018
Note Dates are subject to change.
6.02
2018 interim result presentation | 20 November 2017 |
disclaimer
73
Kiwi Property Group Limited (‘Kiwi Property’) has prepared this presentation (the ‘Presentation’) and the information contained in it is intended
to provide general information only and does not take into account your individual objectives, financial situation or needs. It is not intended as
investment or financial advice and must not be relied upon as such. Some of the information in this Presentation is based on unaudited financial
data which may be subject to change. You should assess whether the Presentation is appropriate for you and consider talking to a financial
adviser or consultant before making any investment decision. This Presentation is not an offer or invitation for subscription or purchase of
securities or other financial products.
All reasonable care has been taken in relation to the preparation and collation of the Presentation. Neither Kiwi Property, its directors, officers,
employees, agents, associates, nor any other person accepts responsibility for any loss or damage howsoever occurring resulting from the use
of or reliance on the Presentation by any person. Past performance is not indicative of future performance and no guarantee of future returns is
implied or given.
caution regarding forward-looking statements
This Presentation includes forward-looking statements regarding future events and the future financial performance of Kiwi Property. Any
forward-looking statements included in this Presentation involve subjective judgement and analysis and are subject to significant uncertainties,
risks and contingencies, many of which are outside the control of, and are unknown to Kiwi Property, its directors, officers, employees, agents
and associates.
Actual results, performance or achievements may vary materially from any forward-looking statements and the assumptions on which those
statements are based including, without limitation, in particular because of risks associated with the New Zealand economy which could affect
the future performance of Kiwi Property’s property portfolio, its ability to obtain funding on acceptable terms, the risks inherent in property
ownership and leasing, and Kiwi Property’s business generally. Given these uncertainties, you are cautioned that this Presentation should not
be relied upon as a recommendation or forecast by Kiwi Property, any of its directors, officers, employees, agents or associates. None of Kiwi
Property, any of its directors, officers, employees, agents or associates undertakes any obligation to revise the forward-looking statements
included in this Presentation to reflect any future events or circumstances.
copyright and confidentiality
The copyright of this document and the information contained in it is vested in Kiwi Property. This document should not be copied, reproduced
or redistributed without prior written consent of Kiwi Property.
20 November 2017
6.03
2018 interim result presentation | 20 November 2017 |

kp.co.nz


