
CMYK
CMYK
CMYK
CMYK
CMYK
CMYK

INTERNATIONAL TOURISM
IN D-8 COUNTRIES:
PROSPECTS AND CHALLENGES 2016
ORGANI SATION O F ISL AMIC COOPERATIO N
STATISTICAL, ECONOMIC AND SOCIAL RESEARCH AND
TRAINING CENTRE FOR ISLAMIC COUNTRIES (SESRIC)
© 2016 Statistical, Economic and Social Research and Training Centre for Islamic Countries (SESRIC)
Kudüs Cad. No: 9, Diplomatik Site, 06450 Oran, Ankara –Turkey
Telephone : +90–312–468 6172
Internet : www.sesric.org
E-mail : [email protected]
All rights reserved
The material presented in this publication is copyrighted. The authors give the permission to view, copy,
download, and print the material presented provided that these materials are not going to be reused, on
whatsoever condition, for commercial purposes. For permission to reproduce or reprint any part of this
publication, please send a request with complete information to the Publication Department of SESRIC.
All queries on rights and licenses should be addressed to the Publication Department, SESRIC, at the
aforementioned address. Cover design by Savas Pehlivan, Publication Department, SESRIC.
ISBN: 978-975-6427-51-4
For additional information, contact Research Department, SESRIC through: [email protected]
CONTENTS
1. INTRODUCTION
2. INTERNATIONAL TOURISM WORLDWIDE: OVERVIEW
3. INTERNATIONAL TOURISM IN D-8 COUNTRIES
4. NEW DIRECTIONS IN THE TOURISM SECTOR: ISLAMIC TOURISM IN D-8
COUNTRIES
5. CONCLUDING REMARKS AND POLICY RECOMMENDATIONS ................................. 37
REFERENCES ............................................................................................................................................................ 41
STATISTICAL APPENDIX ................................................................................................................................ 45


D-8 TOURISM REPORT 2016
i
Foreword
Over the past few decades, international tourism activity has shown substantial and sustained growth in
terms of both the number of tourists and tourism receipts. While the world tourist arrivals and tourism
receipts have been growing substantially over the years, world tourism markets witnessed some
important changes in the direction of tourism. This has been clear in the increase observed in the relative
share of the developing countries, including D-8 member countries, in the world tourist arrivals and
tourism receipts. In 2013, the share of developing countries in the world tourist arrivals and tourist
receipts exceeded 49.2 per cent and 38.1 per cent, respectively.
Like many other groups of developing countries, D-8 countries also benefited from such a positive change.
As a group, D-8 countries attracted 88.1 million tourists in 2013, compared with 76.7 million in 2009.
International tourism receipts in D-8 countries also increased by about $11.4 billion during the period
2009-2013 and reached $76.9 billion in 2013. Yet, it is observed that tourism activity, in terms of both
tourist arrivals and tourism receipts, is still concentrated in few D-8 countries. For example, in 2013, only
Turkey and Malaysia together hosted 72 per cent of the total tourist arrivals to all D-8 countries and 73.5
per cent of total D-8 tourism receipts.
Similar trends have been observed in intra-D-8 tourism, where intra-D-8 tourist arrivals increased from 6.2
million in 2009 to 6.6 million in 2013. Intra-D-8 tourism receipts also went up from $5.3 billion in 2009 to
$5.8 billion in 2013. Yet, at the individual country level, it is observed that the intra-D-8 tourist arrivals and
receipts are concentrated in few D-8 member countries. In particular, Malaysia, Turkey and Indonesia
represented 86.8 per cent of all intra-D-8 tourist arrivals and 92.3 per cent of all intra-D-8 tourism receipts
in 2013. One of the main driving factors behind this positive development in intra-D-8 tourism is the
emergence of the Islamic (Halal) tourism in which all tourism activities, services, facilities and products
are being provided in line with the principles of Islam.
Against this backdrop, this report examines the performance and economic role of international tourism
sector in D-8 countries in the latest five-year period for which the data are available. The report dedicates a
special section to highlight the “Islamic Tourism”, as a new direction in the tourism sector in D-8 countries
with a great potential for sustainable growth and significant contribution to the development of the overall
tourism sector in these countries. The Report elaborates on the challenges ahead of the tourism industry in
D-8 countries and proposes some recommendations to serve as broad policy guidelines to overcome these
challenges.
Amb. Musa Kulaklıkaya
Director General
S E S R I C


D-8 TOURISM REPORT 2016
1
1 INTRODUCTION
Defined by the United Nations World Tourism Organisation (UNWTO), international tourism
comprises the activities of individuals travelling to and staying at places outside their usual
permanent places of residence for a period not exceeding 12 months for leisure, business and
other purposes. Based on this broad definition, the tourism industry includes all socio-economic
activities that are directly and/or indirectly related to the provision of goods and services to
tourists. In this regard, the UNWTO identifies 185 supply-side activities that have significant
connections to the tourism sector.1 These activities include the services of various sectors, such
as transportation and communication, hotels and lodging, food and beverages, cultural and
entertainment services, banking and finance, and promotion and publicity services. Defined by
this impressive network of socio-economic activities and the infrastructure needed to support it,
tourism is one of the largest sectors in the world as well as an important category of
international trade.
Over the past few decades, international tourism activity has shown substantial and sustained
growth in terms of both tourism revenues and number of tourists, and has left broad economic,
social, cultural and environmental footprints reaching almost every part of the globe.
International tourism activity generates significant economic benefits to tourists’ host and home
countries alike. According to the UNWTO, the number of international tourist arrivals
increased from 880 million in 2009 to 1,133 million in 2014, corresponding to an average annual
growth rate of 5.2 per cent. The revenues generated by those tourists, i.e. international tourism
receipts, in terms of current US dollar prices, increased from $852 billion to $1,245 billion in the
same period, corresponding to an average annual growth rate of 7.9 per cent; a rate which was
significantly higher than that of the world economy during the same period. The world tourism
revenues amounted to $3.4 billion per day or $1,099 per tourist arrival.
International tourism activity is also characterized by a continued increase in geographical
spread and diversification of tourist destinations and products. Although the bulk of
international tourism activity is still concentrated in the developed regions of Europe and the
Americas, a substantial proliferation of new tourist-receiving markets is also observed in the
developing regions. According to the UNWTO data, the two traditionally high tourist-receiving
regions, Europe and the Americas attracted, together, 68.2 per cent of the world’s total tourist
arrivals in 2009. Yet, by 2014, this share declined to 67.4 per cent in favour of the developing
regions of Asia & Pacific, the Middle East and Africa. Between 2009 and 2014, the recorded
decrease in the share of Europe and Americas in the world tourism receipts was more
1 UNWTO, “Standard International Classification of Tourism Activities (SICTA)”,
http://www.unwto.org/statistics/basic_references/index-en.htm
D-8 TOURISM REPORT 2016
2
substantial that went down from 67.8 per cent to 62.9 per cent in favour of the developing
regions in the world. International tourism has turned into one of the main economic activities
and an important source of foreign exchange earnings and employment in many developing
countries. Therefore, in recent years, tourism development has been given much attention in the
national development strategies of many developing countries and placed on the agenda of
many recent international conferences on sustainable development.
With their rich and diverse set of natural, geographic, historical and cultural attractions, D-8
countries, as a group, possess a significant potential for the development of a sustainable
international tourism sector. Yet, the share of D-8 region in the world tourism market is still
modest where in 2013, D-8 countries, as a group, accounted for only 8.2 per cent of the global
international tourist arrivals and 5.7 per cent of their tourism receipts,. International tourism
activity is also still concentrated in only a few D-8 countries, where only Turkey and Malaysia
accounted for 72 per cent of total D-8 tourist arrivals and 73.5 per cent of D-8 tourism receipts.
This state of affairs, apparently, indicates that a significant part of the tourism potential in these
countries remains unutilised. The problems facing tourism and the development of a
sustainable international tourism sector in D-8 countries are diverse as each country has its own
tourism-related characteristics, level of development and national development priorities and
policies. Nonetheless, it is a fact that tourism can play a significant role in the socio-economic
development of many D-8 countries, if it could be properly planned and managed. This is true
not only due to their existing and potential rich tourism resources, but also because their
citizens travel in large numbers around the world for business, leisure and other purposes.
Another promising factor for D-8 countries in the domain of tourism is the emergence of Islamic
(Halal) tourism. An increasing number of people living in D-8 countries prefer using tourism
facilities and services designed in line with the Islamic principles. According to the latest
estimates, the demand for Islamic (Halal) tourism will continue to grow and is expected to
reach $200 billion by 2020. The positive trend seen in Islamic tourism not only boosts the overall
tourism sector in D-8 countries but also helps to increase intra-D-8 tourism activities.
Given this state of affairs, this report attempts to assess the performance and economic role of
the international tourism sector in D-8 countries in the latest five-year period for which the data
are available. It analyses the two traditionally used indicators in measuring international
tourism, i.e. international tourist arrivals and international tourism receipts. The analysis is
made at both the individual country and D-8 regional levels. The Report dedicates a section to
the Islamic tourism topic, which constitutes a great potential for the development of the tourism
sector in D-8 countries. In the final chapter, the Report sheds light on the challenges of tourism
development in D-8 countries and the issue of tourism cooperation among them and proposes
some recommendations to serve as broad policy guidelines to which the attention of these
countries needs to be drawn.

D-8 TOURISM REPORT 2016
3
2 INTERNATIONAL TOURISM WORLDWIDE: OVERVIEW
The number of international tourist arrivals worldwide increased from 880 million in 2009 to
1,133 million in 2014, corresponding to an average annual growth rate of 5.2 per cent (Figure
2.1.). In the same period, international tourism receipts, in current US dollar prices, increased
from $852 billion to $1,245 billion, corresponding to an average annual growth rate of 7.9 per
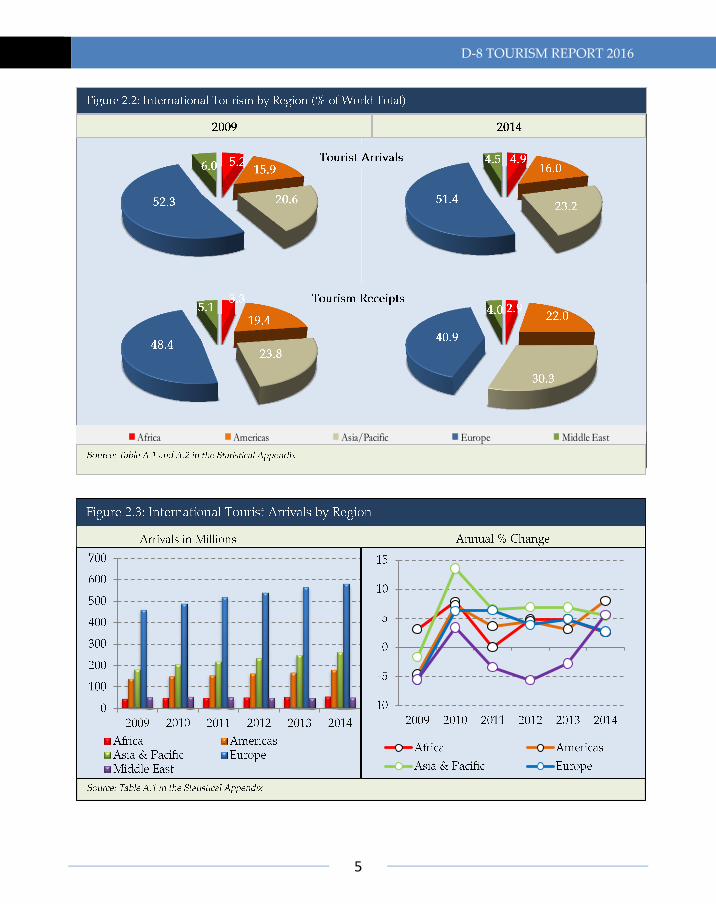
cent (Table A.1. and Table A.2 in the Statistical Appendix). In terms of worldwide regional
distribution, Europe, the Asia & Pacific and the Americas were the top three main tourist-
receiving regions in 2009. They attracted, respectively, 460, 180.9 and 140 million tourists,
corresponding to 52.3, 20.6 and 15.9 per cent of the world tourism market in 2009 (Figure 2.2). A
detailed look at the annual changes in the world international tourist arrivals and tourism
receipts indicates that tourism sector worldwide experienced significant growth rates both in
terms of tourist arrivals and tourism receipts between 2009 and 2010, which was mainly due to
the recovery after the global financial crisis.
Since international tourism is characterised by a growing tendency for tourists to visit new
destinations, coupled with the diversification of tourism products as well as increasing
competition in international tourism markets, new destinations are steadily growing at a faster
pace in many developing countries, particularly located in the Asia & Pacific region. Therefore,
these regions experience a remarkable increase in their share in the world tourism market. For

D-8 TOURISM REPORT 2016
4
example, the Asia & Pacific region, mostly consisting of developing countries, experienced the
highest annual growth rate of tourist arrivals measured at 7.8 per cent between 2009 and 2014. It
was followed by Americas with an annual average growth rate of 5.3 per cent. Africa, as a
developing region, achieved a remarkable increase in international tourist arrivals with an
average annual growth rate of 4 per cent during the period under consideration. In contrast,
Middle East could not improve its overall performance due to the on-going conflicts and
political instability in the region. The number of international tourist arrivals in the Middle East
region was 52.9 million in 2009 and decreased to 51.1 million in 2014, corresponding to a 0.7 per
cent average annual contraction rate. As a traditionally high tourist-receiving region, Europe
recorded a 4.8 per cent annual growth rate between 2009 and 2014 that stayed below the world
average of 5.2 per cent (Table A.1. and Table A.2 in the Statistical Appendix).
During 2009-2014, the Asia & Pacific and the Americas were the only two regions that achieved
to increase their share in the world tourism market in terms of the number of tourist arrivals.
The share of the Asia & Pacific region went up from 20.6 per cent in 2009 to 23.4 per cent in 2014
(see Figure 2.2). The share of the Asia & Pacific region in world tourism receipts also jumped
from 23.8 per cent in 2009 to 30.3 per cent in 2014. Despite seeing positive growth in terms of
world tourist arrivals, a substantial decrease was observed in the share of Europe in world
tourism receipts that went down from 48.4 per cent to 40.9 during 2009-2014. A major reason
behind this picture is the on-going economic uncertainty in several European countries that
affected expenditures of European tourists negatively. Africa region received a smaller share in
world tourism receipts in 2014 when compared to 2009 where its share decreased from 3.3 per
cent to 2.9 per cent (see Table A.1 in the Statistical Appendix, Figure 2.3 and 2.4). Therefore,
African countries not only need to focus on increasing international tourist arrivals but also try
to find ways to boost receipts from tourism through diversifying tourism activities (e.g. beach
vs. mountain) and developing alternative tourism types (e.g. balloon safari tours) as well as
implementing market-targeting strategies (trying to attract more tourists from countries with a
higher consumption tendency).
Figure 2.2 also shows that Europe and Americas were continuing as strong performer regions in
the world tourism market both in 2009 and 2014. In 2014, these two regions accounted for 62.9
per cent of all international tourism receipts and 67.4 per cent of all international tourist
arrivals.
D-8 TOURISM REPORT 2016
5
3.5
21.2
12.860.4
2.2
Africa Americas Asia/Pacific Europe Middle East
D-8 TOURISM REPORT 2016
6
It should be noted that the global financial crisis, which started in July 2007 in the United States,
deepened during 2008-2009 with a global reach and affected a wide range of financial and
economic activities and institutions in many developed and developing countries around the
world. As a result, like many other economic activities, in 2009, international tourism activity
witnessed one of the worst downturns in the last five decades. In fact, until the first half of 2008,
international tourism was performing well. Yet, in the second half of 2008 and the whole year of
2009, tourism sector was hit very hard due to the impact of the global financial crisis and the
sharp rise in world oil prices together with the outbreak of swine flu. In this context, it is worth
mentioning that developed economies of the Americas and Europe, which are the origin of the
global financial crisis, have also played an important role in further intensifying its negative
impacts on tourism industry as these countries are the major tourist-generating regions in the
world.
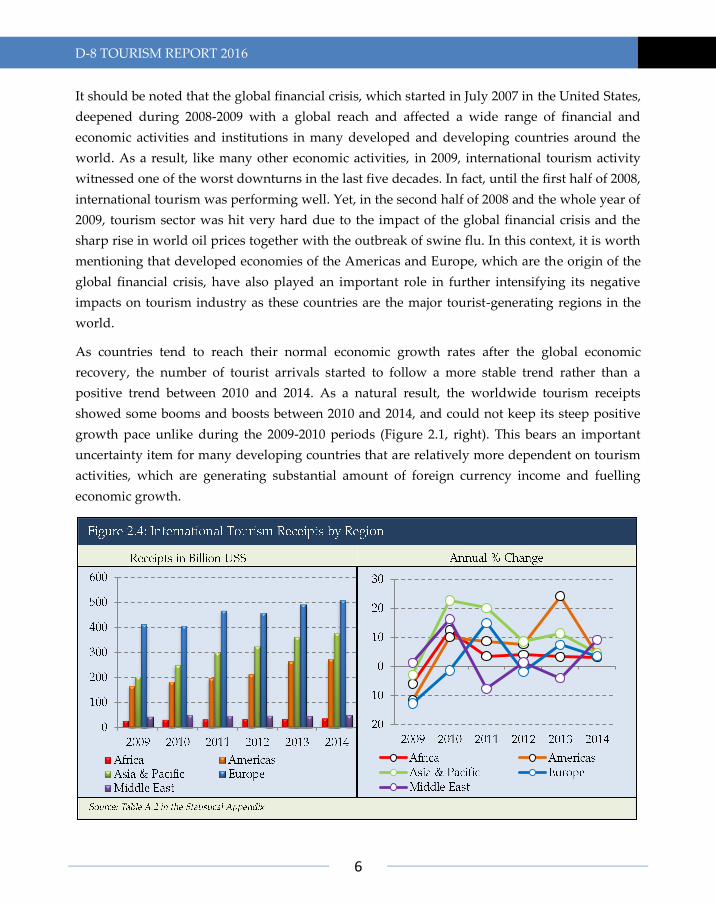
As countries tend to reach their normal economic growth rates after the global economic
recovery, the number of tourist arrivals started to follow a more stable trend rather than a
positive trend between 2010 and 2014. As a natural result, the worldwide tourism receipts
showed some booms and boosts between 2010 and 2014, and could not keep its steep positive
growth pace unlike during the 2009-2010 periods (Figure 2.1, right). This bears an important
uncertainty item for many developing countries that are relatively more dependent on tourism
activities, which are generating substantial amount of foreign currency income and fuelling
economic growth.

D-8 TOURISM REPORT 2016
7
In 2010, international tourism activity rebounded significantly throughout the world recording
949 million international tourist arrivals and $930 billion international tourism receipts. It is
observed that as a reflection of the economic conditions, recovery was particularly strong in
emerging economies. Between 2009 and 2010, the Asia & Pacific region enjoyed the highest
annual change both in terms of international tourist arrivals (13.5 per cent) and tourism receipts
(22.6 per cent). The Middle East region recovered its tourism figures very quickly in the same
period in which tourism receipts went up by 16.2 per cent while the arrivals increased by 3.4
per cent. The existing differences seen between the change in the international tourist arrivals
and the change in the international tourism receipts can be attributed to the exchange rate
differences and tourism strategies implemented (e.g. higher value added generating tourism). It
is also evident that in economic hard times, international tourists typically do not react so much
by refraining from travel, but by trading down; i.e. choosing, for instance, shorter stays in less
expensive destinations closer to home, with travel and accommodation in lower categories As
economic recovery takes place they tend to spend more during their holidays and stay longer at
their destinations. In this context, tourism receipts may grow more or less than the number of
tourist arrivals depending on the above-mentioned factors.
In 2011, worldwide tourist arrivals reached 997 million and tourism receipts went up to
US$1,042 billion. Asia & Pacific and Europe recorded the highest growth rates in terms of
international tourist arrivals, 6.5 per cent and 6.4 per cent, respectively. In the same year,
Americas recorded a positive growth rate in international tourist arrivals (3.6 per cent). The
Middle East and Africa experienced difficult times due to social movements and lack of security
which resulted in the diversion of travelling demand away from the Middle East and Africa,
explaining why a significant portion of the international tourism activity was concentrated
within the European region. In 2012, both international tourist arrivals and tourism receipts
continued to recover from the low figures recorded in 2009 where international tourist arrivals
reached to 1,038 million and tourism receipts hit $1,075 billion, growing by 4.1 per cent and 3.2
per cent, respectively. However, it is also observed that the repercussions of social movements
across Arab region were present and the Middle East remained to be the only region around the
world where international tourism arrivals continues to display a negative trend. In 2012,
unlike its weak performance in 2011, Africa region enjoyed a 4.8 per cent growth in tourist
arrivals and 4 per cent in tourism receipts.
In 2013, international tourist arrivals increased by 4.7 per cent to reach 1,087 million and
international tourism receipts reached US$1,197 billion, corresponding to 11.3 per cent increase
compared to the previous year. Asia & Pacific was the best performer region both in terms of
growth recorded in arrivals (6.8 per cent) and receipts (11.3 per cent). In terms of annual change
recorded in tourist arrivals in the same year, Asia & Pacific was followed by Europe (4.85 per

D-8 TOURISM REPORT 2016
8
cent) and Africa (4.82 per cent). The Middle East region was the only region that experienced a
negative growth rate both in arrivals (-2.8 per cent) and receipts (-4 per cent) in 2013.
As of 2014, international tourist arrivals hit 1,133 million and tourism receipts reached $1,245
billion, corresponding to 4.2 and 4 per cent increase over the previous year, respectively. In
particular, a strong growth was recorded in Americas and the Middle East regions in terms of
international tourist arrivals, that increased by 8 per cent and 5.6 per cent, respectively. After
four years of negative growth trend in arrivals, 2014 was the year in which the Middle East
region recorded a positive growth rate in terms of tourist arrivals. As a reflection of the positive
performance seen in tourist arrivals, tourism receipts also increased by 3.6 per cent in Americas
and 9.1 per cent in the Middle East region (Figure 2.3 and Figure 2.4). In terms of international
tourist arrivals, Africa and Europe recorded the lowest growth rate figures that stayed around
2.6 per cent. In terms of international tourism receipts, Africa region had the lowest growth rate
(3.1 per cent) while the highest growth was observed in the Middle East region (9.1 per cent)
followed by Asia & Pacific (4.5 per cent) and Americas (3.6 per cent) (Figure 2.4).
Overall, while the trends in tourism receipts followed, in general, similar patterns to those in
tourist arrivals, the average growth rates of tourism receipts and the regional shares in world
total were somewhat different. For example, Americas recorded an annual average growth rate
of 5.3 per cent between 2009 and 2014 in tourist arrivals. In the same period, tourism receipts in
Americas grew, on average, annually by 10.6 per cent, a rate which was two times higher than
the growth rate observed in tourist arrivals. On the other hand, over the period 2009-2014 in
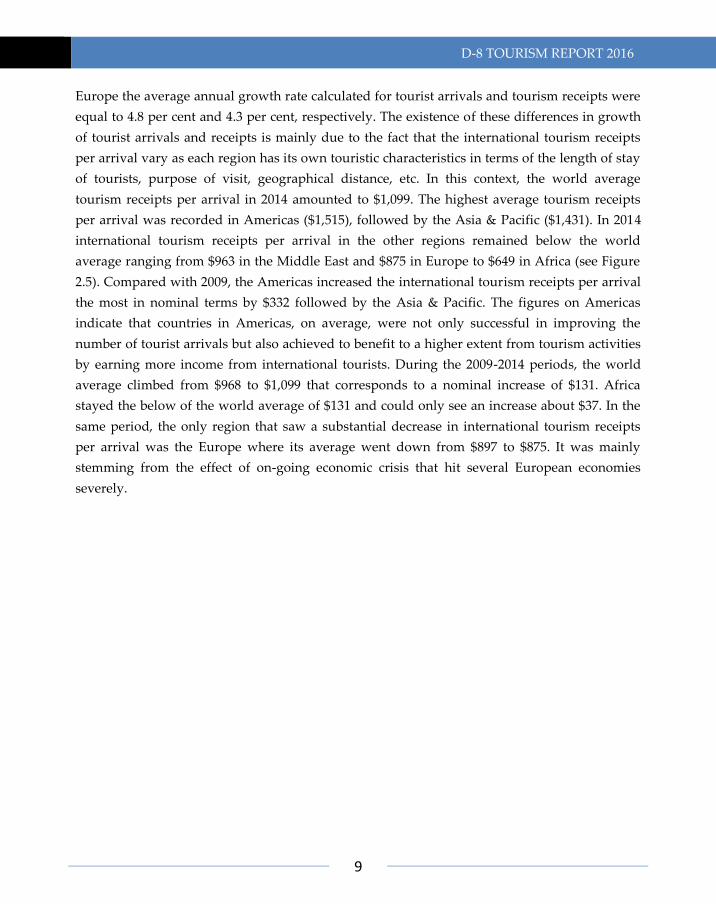
Figure 2.5: International Tourism Receipts per Arrival 2009 vs. 2014 (US$)
D-8 TOURISM REPORT 2016
9
Europe the average annual growth rate calculated for tourist arrivals and tourism receipts were
equal to 4.8 per cent and 4.3 per cent, respectively. The existence of these differences in growth
of tourist arrivals and receipts is mainly due to the fact that the international tourism receipts
per arrival vary as each region has its own touristic characteristics in terms of the length of stay
of tourists, purpose of visit, geographical distance, etc. In this context, the world average
tourism receipts per arrival in 2014 amounted to $1,099. The highest average tourism receipts
per arrival was recorded in Americas ($1,515), followed by the Asia & Pacific ($1,431). In 2014
international tourism receipts per arrival in the other regions remained below the world
average ranging from $963 in the Middle East and $875 in Europe to $649 in Africa (see Figure
2.5). Compared with 2009, the Americas increased the international tourism receipts per arrival
the most in nominal terms by $332 followed by the Asia & Pacific. The figures on Americas
indicate that countries in Americas, on average, were not only successful in improving the
number of tourist arrivals but also achieved to benefit to a higher extent from tourism activities
by earning more income from international tourists. During the 2009-2014 periods, the world
average climbed from $968 to $1,099 that corresponds to a nominal increase of $131. Africa
stayed the below of the world average of $131 and could only see an increase about $37. In the
same period, the only region that saw a substantial decrease in international tourism receipts
per arrival was the Europe where its average went down from $897 to $875. It was mainly
stemming from the effect of on-going economic crisis that hit several European economies
severely.


D-8 TOURISM REPORT 2016
11
3 INTERNATIONAL TOURISM IN D-8 COUNTRIES
This section attempts to assess the performance and economic role of the international tourism
sector in D-8 countries. The first sub-section examines the trends in the two traditionally used
indicators in measuring international tourism, i.e. international tourist arrivals and international
tourism receipts. The analysis is conducted at both the individual country and D-8 regional
levels. The second sub-section assesses the economic role of the international tourism sector in
D-8 countries. The third sub-section attempts, as much as the available relevant data allows,
shedding light on the state of intra-D-8 tourism. Finally, the fourth sub-section provides some
concluding remarks and policy recommendations.
3.1 Tourist Arrivals and Tourism Receipts
As shown in Figure 3.1, the number of international tourist arrivals in D-8 countries, for which
the data are available, recorded at 76.7 million in 2009, corresponding to an 8.63 per cent share
in the total international tourist arrivals worldwide. These tourists generated $65.4 billion as
international tourism receipts in D-8 countries, corresponding to a 6.58 per cent share in the
world’s total tourism receipts. When compared to 2008, international tourism receipts declined
by 5.44 per cent in D-8 countries in 2009 due to the impact of the global financial crisis.
International tourist arrivals in D-8 region reached 82.7 million in 2010, corresponding to an
increase by an annual growth rate of 7.7 per cent. The share of D-8 group in the world tourist
arrivals also increased in 2010 and recorded at 8.7 per cent. International tourism receipts
amounted to $70.2 billion in the same year, corresponding to an increase by 7.2 per cent when
D-8 TOURISM REPORT 2016
12
compared to 2009. With this, D-8 group represented a 6.5 per cent share in the world’s total
tourism receipts in 2010.
In 2011, although the number of international tourist arrivals in D-8 region witnessed a slight
decrease (1 per cent), international tourism receipts increased by 3.6 per cent. However, it
should be noted that the share of D-8 countries in the total international tourist arrivals
decreased from 8.7 per cent in 2010 to 8.3 per cent in 2011.
In 2011, the number of tourist arrivals, tourism receipts as well as the share of D-8 countries in
both worldwide total international tourist arrivals declined in 2011. Different countries were
affected in different patterns and intensities. Some were hit by sudden and dramatic falls like
Egypt, in which social movements adversely affected the tourism industry.
The recovery of the world economy, in particular the economies of the major tourist-generating
regions of the Americas and Europe, contributed to the better results of tourism in D-8 region in
2012. Growth was common in almost all the countries in the region, but was particularly strong
in countries such as Turkey, Indonesia and Malaysia. International tourist arrivals in D-8 region
increased to 85.4 million, corresponding to an increase by 4.3 per cent in 2012 when compared
to 2011. Similarly, international tourism receipts grew by 3.4 per cent in 2012 and amounted to
$75.2 billion that represented a share of 6.0 per cent in the world’s tourism receipts in 2012.

D-8 TOURISM REPORT 2016
13
The number of international tourist arrivals in D-8 countries, for which the data are available,
grew by 3.1 per cent and increased to 88.1 million in 2013, corresponding to a 8.2 per cent share
in the total international tourist arrivals worldwide. Similarly, international tourism receipts in
D-8 region increased nearly 2.2 per cent in the same year and amounted to $76.9 billion,
corresponding to a 5.7 per cent share in world’s total tourism receipts.
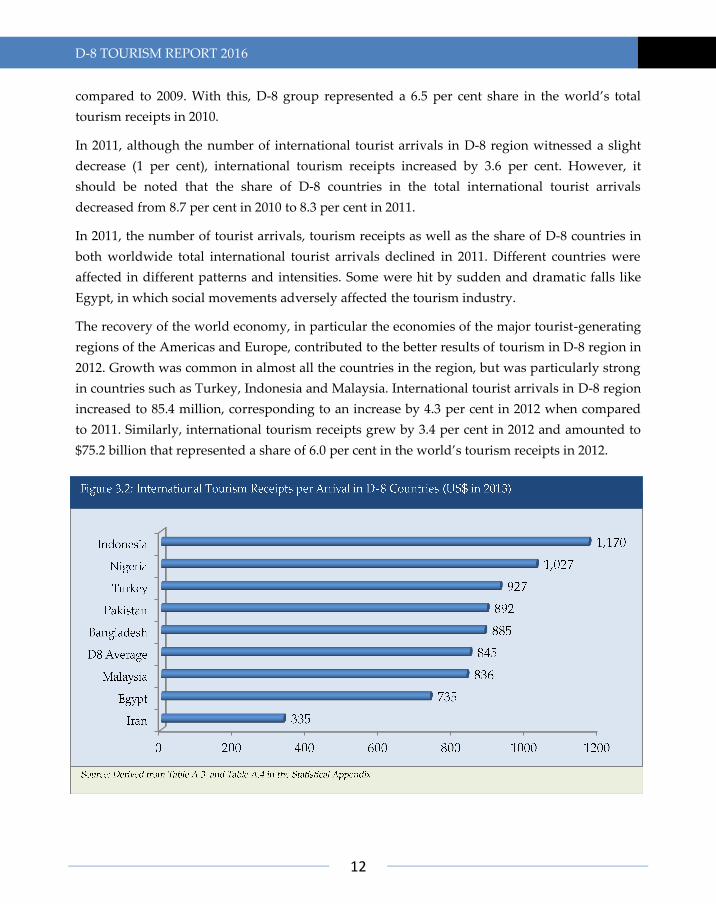
While, in absolute terms, the trends in international tourism receipts were generally similar to
those in international tourist arrivals, the shares of the individual countries in the total D-8
international tourism receipts as well as the average growth rates of those receipts were
somewhat different. This is due to the fact that receipts per arrival vary as each country has its
own tourism characteristics in terms of length of stay of tourists, purpose of their visit,
geographical distance, types of shopping, etc. For example, as shown in Figure 3.2, D-8 average
tourism receipts per arrival in 2013 amounted to $845. In the same year, the highest receipts per
tourist arrival were recorded in Indonesia ($1,170) followed by Nigeria ($1,027), Turkey ($927),
Pakistan ($892), Bangladesh ($885), Malaysia ($836), Egypt ($735) and Iran ($335).
At the individual country level, it is observed that international tourism activity, in terms of
both tourist arrivals and tourism receipts, is still concentrated in a few countries in the D-8
grouping. For example, in 2013, Turkey and Malaysia hosted 63.5 million international tourist
arrivals, corresponding to a share of 72.1 per cent of the total D-8 tourism market in 2013
(calculated based on the data in Table A.3 in the Appendix).
Source: Table A.3 and Table A.4 in the Statistical Appendix

D-8 TOURISM REPORT 2016
14
Moreover, international tourism receipts in D-8 countries were mostly collected by Turkey and
Malaysia (see Figure 3.3). These two D-8 countries earned $56.5 billion as international tourism
receipts in 2013, corresponding to a share of 73.5 per cent of the total D-8 tourism receipts in
that year.
3.2 Balance of International Tourism:
The Economic Role of International Tourism
In this sub-section, an attempt is made to assess the economic role of the international tourism
sector in the economies of D-8 countries. This is made by calculating the balance of international
tourism, i.e., by deducting the international tourism expenditure from the international tourism
receipts, for each individual country for which the relevant data are available in the five-year
period of 2009-2013. The net contribution of the international tourism sector to the economies of
D-8 countries is then examined by relating the balance of international tourism as a percentage
of the GDP of each country. The sector is also evaluated as a source of foreign exchange
earnings by relating the international tourism receipts in each country, as a percentage, to its
total merchandise exports in the same period.
Figure 3.4 displays D-8 countries in terms of their balance of international tourism in billions of
US dollars in 2013. It is observed that the balance of international tourism of some D-8 countries
accounts for a high percentage of their international tourism receipts. This is true for some
countries like Turkey (85 per cent) and Egypt (51.6 per cent), while some D-8 countries such as
29.8
9.1
3.5 1.6
0.02 -0.7 -1.2 -8

D-8 TOURISM REPORT 2016
15
Indonesia, Pakistan, Bangladesh and Nigeria had a deficit in their balance of foreign travel in
2013. The total D-8 international tourism balance amounted to $33.8 billion in 2013,
corresponding to almost 43.9 per cent of total D-8 international tourism receipts (calculated
based on the data in Table A.4 and Table A.6 in the Statistical).
When the economic role of the international tourism sector in the economies of D-8 countries is
examined in terms of its net contribution to the GDP of each country, the picture, as shown in
Figure 3.5 (left), reflects that the economic role of the international tourism sector in the
economies of D-8 countries is neither a function of the size nor the level of affluence of the
economy. In that regard, international tourism activity is found to have a negligible role in the
economies of Malaysia (3.59 per cent), Egypt (3.41 per cent), Turkey (3.30 per cent), while it has
negative role in the economies of Indonesia (-0.04 per cent), Pakistan (-0.27 per cent),
Bangladesh (-0.63 per cent), Iran (-1.08 per cent) and Nigeria (-2.02 per cent) over the period
2009 to 2013.
-2.02%
-1.08%
-0.63%
-0.27%
-0.04%
-0.81%
3.30%
3.41%
3.59% 37.8%
23%
10.4%
9.4%
5%
4.4%
2.2%
0.9%
0.5%

D-8 TOURISM REPORT 2016
16
However, when the international tourism sector is evaluated as a source of foreign exchange
earnings by relating the international tourism receipts in each country, as a percentage, to its
total merchandise exports, Figure 3.5 (right) indicates that international tourism activity plays a
more significant role in the economies of D-8 countries as a source of foreign exchange earnings.
During the period 2009-2013, international tourism receipts accounted, on average, for more
than 37.7 per cent of the total merchandise exports of Egypt, more than 23 per cent in Turkey
(Figure 3.5). Yet, in six D-8 countries (Malaysia, Indonesia, Pakistan, Iran, Nigeria and
Bangladesh), international tourism receipts were still accounted for less than the average of D-8
of 10.4 per cent of their total merchandise exports (Table A.8 in the Appendix).
3.3 Intra-D-8 Tourism
As in other dimensions of the economic integration (e.g. trade and investment), intra-D-8
tourism trends can be a good indicator to assess the level of economic integration among D-8
countries. Higher levels of intra-D-8 tourism in terms of both intra-D-8 tourist arrivals and
intra-D-8 tourism receipts indicate an improvement in intra-D-8 economic cooperation.
Figure 3.6 presents the trends on the intra-D-8 tourist arrivals and tourism receipts between
2009 and 2013. According to Figure 3.6, in 2009 intra-D-8 tourism, in terms of the number of
tourist arrivals, measured as 6.2 million arrivals, corresponding to 8.0 per cent of the total
international tourist arrivals in D-8 countries for which the relevant data are available. In 2010,
with the modest recovery in the global markets after the crisis, intra-D-8 tourist arrivals
increased to 7 million arrivals, the share of intra-D-8 tourist arrivals in total D-8 international

D-8 TOURISM REPORT 2016
17
tourist arrivals reached 8.4 per cent that was the highest figure measured during the 2009-2013
period. In 2011, intra-D-8 arrivals saw a decline and measured as 6.6 million arrivals that
represented 8.1 per cent share in total D-8 international tourist arrivals. In 2012, intra-D-8 tourist
arrivals continued to decrease and recorded 6.4 million arrivals, corresponding to a 7.5 per cent
share in total D-8 international tourist arrivals. Finally, in 2013 intra-D-8 tourist arrivals
bounced back and climbed to 6.6 million arrivals. In 2013, intra-D-8 tourist arrivals represented
a share of 7.5 per cent in total D-8 international tourist arrivals.
A similar trend was also observed in the case of the intra-D-8 tourism receipts as a share of total
D-8 international tourism receipts during the period under consideration (Figure 3.6). A growth
took place between 2009 and 2010 in intra-D-8 tourism receipts that climbed from $5.3 billion in
2009 to $5.9 billion in 2010. The share of intra-D-8 recipients also increased from 8.0 per cent to
8.4 per cent. As seen in intra-D-8 tourist arrivals, in 2011 the intra-D-8 tourism receipts started
to decrease, and measured 5.86 billion in 2011 and 5.6 billion in 2012, with a share of 8.1 per cent
and 7.5 per cent respectively. A recovery took place in intra-D-8 tourism receipts in 2013 and
reached 5.8 billion, the share of intra-D-8 tourism receipts in total D-8 international tourism
receipts remained the same.
At the individual country level, it is observed that the intra-D-8 tourist arrivals are concentrated
in a few countries. Figure 3.7 presents D-8 countries in terms of intra-D-8 tourist arrivals and
tourism receipts in 2013. In descending order, Malaysia, Turkey and Indonesia were the top 3
intra-D-8 tourism destinations in 2013 (Figure 3.7). Together, they hosted 57.4 million tourists
from D-8 countries, corresponding to 86.8 per cent of the total intra-D-8 tourist arrivals in that
year. Malaysia, Indonesia and Turkey were also the top 3 intra-D-8 tourism earners in 2013.
Altogether these three D-8 countries earned $54 billion, corresponding to 92.3 per cent of the
total intra-D-8 tourism receipts.
D-8 TOURISM REPORT 2016
18
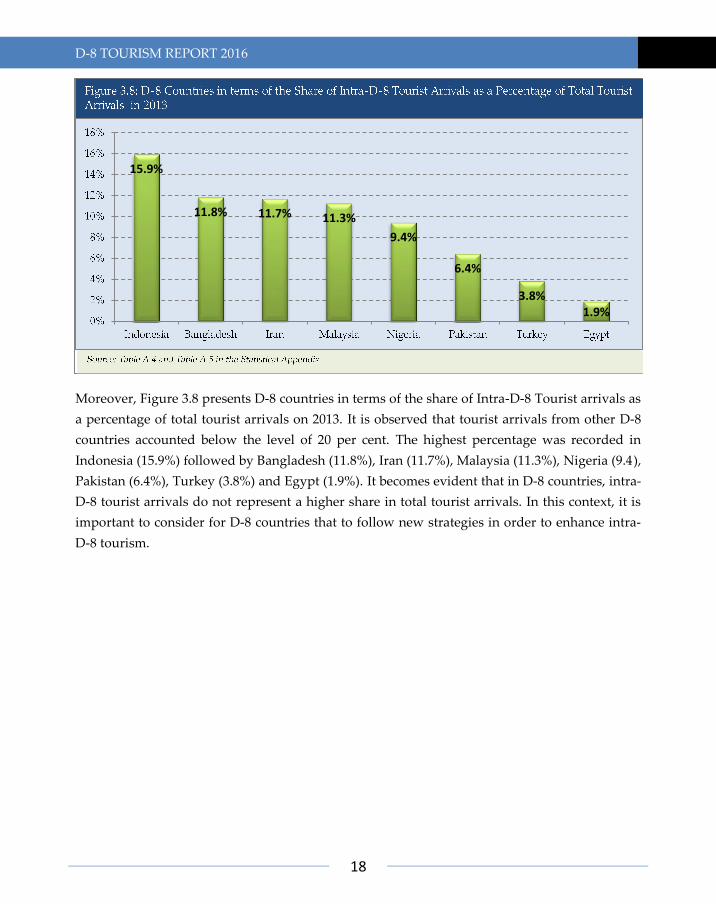
Moreover, Figure 3.8 presents D-8 countries in terms of the share of Intra-D-8 Tourist arrivals as
a percentage of total tourist arrivals on 2013. It is observed that tourist arrivals from other D-8
countries accounted below the level of 20 per cent. The highest percentage was recorded in
Indonesia (15.9%) followed by Bangladesh (11.8%), Iran (11.7%), Malaysia (11.3%), Nigeria (9.4),
Pakistan (6.4%), Turkey (3.8%) and Egypt (1.9%). It becomes evident that in D-8 countries, intra-
D-8 tourist arrivals do not represent a higher share in total tourist arrivals. In this context, it is
important to consider for D-8 countries that to follow new strategies in order to enhance intra-
D-8 tourism.
15.9%
11.8% 11.7% 11.3%
9.4%
6.4%
3.8% 1.9%

D-8 TOURISM REPORT 2016
19
4 NEW DIRECTIONS IN THE TOURISM SECTOR:
ISLAMIC TOURISM IN D-8 COUNTRIES
Over the last two decades, Islamic life style market has been growing as sharia’h complaint
products and services (e.g. halal food, Islamic tourism and Islamic finance) have become an
important component of the global economy. With an increasing awareness and expanding
numbers of Muslim tourists, many tourism industry players have started to offer special
products and services, developed and designed in accordance with the Islamic principles, to
cater the needs and demands of these tourists. Nevertheless, despite attracting significant
interest across the globe, Islamic tourism is relatively a new concept in both tourism theory and
practice. Not surprisingly, Islamic tourism activity remained highly concentrated in Muslim
majority countries of D-8, which are currently both the major source markets for the Islamic
tourism expenditures and popular destinations. Islamic tourism is a natural-fit for these
countries as the majority of them already have basic infrastructure and environment in place to
cater for the specific needs of Muslim tourists, and thus, have a comparative advantage over the
others. Therefore, it is true to believe that, if planned and managed properly, Islamic tourism
could play a vital role in revitalising the economic development and growth and hence, spread
the prosperity across D-8 countries.
Against this backdrop, this section aims to provide a candid theoretical discussion on the
definitions and dimensions of Islamic tourism by sifting through the tourism literature and
reviews the emergence and status of Islamic tourism industry in the world in general and in D-8
countries in particular by analysing the latest available information and statistics. A sub-section
also provides a brief discussion on major challenges and opportunities for the development of
Islamic tourism in D-8 countries. At the end, some specific policy recommendations have been
listed for the consideration of D-8 countries both at national and D-8 cooperation level and the
major stakeholders of tourism industry.
4.1 Islamic Tourism and its Components
Islam and Tourism
It is a well-established fact that religion has influence on the day-to-day activities of Muslims,
whether at home or travelling. Islam recognizes people’s right to move from one place to other
and encourages travelling for beneficial purposes including Hajj and Umrah (literally the higher
and lesser pilgrimages, respectively), health and medication, education, business, trade,
entertainment, and fun. However, words like “fun” and “entertainment” should be interpreted
with caution as Muslims are allowed to seek fun and entertainment only in a way that does not
go beyond the rules and obligations of Islamic Sharia’h (Saad et al, 2010). Therefore, in this

D-8 TOURISM REPORT 2016
20
Box 1: Major Components of Islamic Tourism
Halal Hotels: Some of the main indicators of an Islamic hotel include: No alcohol, gambling
etc.; Halal food only; Quran, prayer mats and arrows indicating the direction of Mecca in
every room; Beds and toilets positioned so as not to face the direction of Mecca; Prayer
rooms; Conservative staff dress; Islamic funding; Separate recreational facilities for men and
women.
Halal Transport (Airlines): Major indicators for halal transport include: cleanliness; non-
alcoholic drinks; and publications which are coherent with Islam.
Halal Food Premises: Foods that served in a restaurant have to be halal. All animals must be
slaughtered according to Islamic principles. No alcoholic drinks should be served in the
premise.
Halal Tour Packages: The content of the tour packages must be based on an Islamic themed.
The Islamic tour packages include visits to the mosques, Islamic monuments and promote
and event during the Ramadan.
Halal Finance: The financial resources of the hotel, restaurant, travel agency and the airlines
have to be fit with Islamic principles. In general, Islamic finance requires participation in
sharing the profit and loss among of all parties who involved in this finance enterprise.
Islamic finance also prohibits interest.
Source: Adapted from Akyol and Kilinc, 2014.
context, tourism policy, development objectives and the management and operation of the
industry will be greatly influenced by the Islamic principles (Scott and Jafari, 2010).
Islamic Tourism: Definitions and Dimensions
As it is evident from the name, Islamic tourism is mainly targeting people with Islamic beliefs in
particular, though it could also have a universal appeal even for the non-Muslims due to a
multitude of reasons like fair pricing, peace and security, family-friendly environment and
hygiene etc. Islamic tourism as a concept has been used with different names and connotations
in the tourism theory and practice. Halal tourism, Sharia’h Tourism and Muslim-friendly
tourism are the most common terms, which are used alternatively. However, none of these
terminologies has a universally understood definition (Crescent Rating, 2015). Moreover, there
are some related terms such as ‘Halal hospitality’, ‘Sharia’h compliant hotels’, and ‘Halal
friendly travel’ concerning the services in this sector.
The major components of Islamic tourism are similar to those of conventional tourism like
hotels, restaurants, logistics, finance, and travel packages. Evaluation of the value of tourism
products in case of Islamic tourism, however, entails a completely different process due to the
requirements of the Islam. These requirements are called Sharia’h-principles and at the simplest

D-8 TOURISM REPORT 2016
21
level, these principles “prohibit adultery, gambling, consumption of pork and other Haram
(forbidden) foods, selling or drinking liquor and dressing inappropriately.” In addition, a
typical Muslim is expected to do regular prayers in clean environments and fast in Ramadan. In
Islamic teachings, Muslims are also expected to abstain from unnecessary consumption and
indulgence. n principles, Islamic tourism is about satisfying tourists looking for a destination
that can fulfil their needs without being offensive in any way. It covers all tourism related
goods and services that are designed, produced and presented to the market according to the
Islamic rules (Hamza et al., 2012). Muslim tourists usually travel with family members and
therefore, this concept is tailored around the travel needs of Muslim tourists who
predominately seek a family friendly environment (Dinar Standard, 2015). All destinations that
provide services and facilities that cater to at least some of the faith-based needs of Muslim
visitors are categorised as 'Muslim Friendly Destinations' (Crescent Rating, 2015). At these
destinations, tourists can count on feeling safe and secure, and can enjoy family-centred halal
activities and have good time without worry. It may sound too good to be true, but there are
many such places at both Muslim and non-Muslim locations.
The motivation for the Muslims to participate in tourism activity can be general (e.g.,
conducting business, visiting friends or relatives), pursuing other personal goals and activities
(e.g., education, shopping) and pleasure, and/or specific Islamic motivations (e.g., spreading the
message of Islam, Islamic values and culture, worshiping Allah (through Hajj and Umrah),
strengthening the bond of silat al-rahim (fraternity) etc. Most of the general motivations are
common for Muslims and non-Muslims. However, certain motivations for tourism which
provoke pure hedonism and lavishness are not acceptable according to Islamic doctrine and
these motivations can be considered non-Islamic or haram (Duman, 2011).
There is also a wide diversity in awareness and adoption of various Islamic practices by Muslim
travellers. A significant number of Muslim tourists travel to global non-Muslim destinations
such as Europe and adjust to any limitations by seeking alternatives to Halal Food, as well as
other religious considerations such as prayer spaces, etc. Meanwhile, a big segment travelling
globally is also seeking options that address their religious considerations (Thomson Reuters
and Dinar Standard, 2015). In a global survey jointly conducted by Dinar Standard and Crescent
Rating, halal food, overall price and Muslim-friendly experience were ranked among the top-3
Muslim tourist market needs (Figure 4.1). While a large segment of Muslim tourists looking for
these services, very few hotels, airlines and tourism destinations in fact tried to meet their
demands.

D-8 TOURISM REPORT 2016
22
Of course, while developing a strategy to address the Islamic tourism market, all major
stakeholders like destinations, hotels and resorts, airlines and travel agencies need to consider
the size of the flow of Muslim visitors to their destination. They also need to consider which
faith related needs they will cater to. Basic needs such as Halal food, absence of alcohol, prayer
spaces and Ramadan accommodation are a must for Muslim majority countries. Additional
options include providing “women only” facilities, and incorporating Islamic heritage tours,
among other options (Dinar Standard, 2015).
4.2 State of Islamic Tourism in D-8 Countries
Traditionally Islamic tourism was often associated with Hajj and Umrah only. However,
recently there has been an influx of products and services designed specifically to cater the
business and leisure related segments of Muslim tourists across the globe. The Muslim tourism
market has witnessed rapid growth over the years and emerged as one of the fastest growing
segments of the global tourism market. According to the latest estimates, Muslim tourism
market (excluding the Hajj and Umrah expenditures of $20 to $25 billion) has increased from
around $80 billion in 2006 to $145 billion in 2014, corresponding to an impressive increase of 81
per cent (Crescent Rating, 2015). Despite recording impressive growth over the years, Islamic
tourism remained as an emerging niche market with 108 million Muslim travellers, accounting
for 10 to 12 per cent of the global tourism sector. Currently, with an annual growth rate of 4.8
per cent, Muslim tourism market is growing faster than the global tourism market, which
recorded a growth rate of 3.8 per cent in 2013. Provided the estimated exponential growth in
Muslim population and positive economic prospects for many Muslim majority countries,
Islamic tourism market is forecasted to grow to $200 billion with 150 million tourists by the end
of 2020 (Crescent Rating , 2015).

D-8 TOURISM REPORT 2016
23
Box 2: Broad Concepts of Islamic Tourism
Economic concept: The economic concept for the Islamic tourism focuses on inclusion of
new tourist markets and tourist destinations. This concept is the most widely discussed and
understood in both Islamic and non-Islamic countries. Major tourism players, consider
Muslim countries as one of the emerging tourist markets with huge economic, demographic
and destination potentials. There are many regional and international forums like Islamic
Conference for Ministers of Tourism (ICMT) and the Arab Counsel of Ministers of Tourism
(ACMT) to discuss and elaborate on economic dimensions of the Islamic tourism market.
Cultural concept: The cultural concept for Islamic tourism includes visions and ideas that
outline the inclusion of Islamic religious cultural sites in tourism programs with
“pedagogical” and self-confidence building elements. It tries to encourage a reorientation
inside the tourist destinations towards less consumption and “western culture” loaded sites
towards more Islamic historical, religious and cultural sites.
Religious conservative concept: The religious conservative concept for Islamic tourism is
based on the conservative interpretation and understanding of Islam. Merging elements of
the extremely conservative Islamic lifestyle with the modern tourism industry could indeed
present new tourism options, spaces, and spheres. For a growing intra Muslim tourism
market, the implementation of a religious conservative concept in tourism planning as an
extra option and as an insertion into the existing mainstream tourism could indeed have a
positive economic and social effect.
Source: Adapted from Al-Hamarneh and Steiner, 2004.
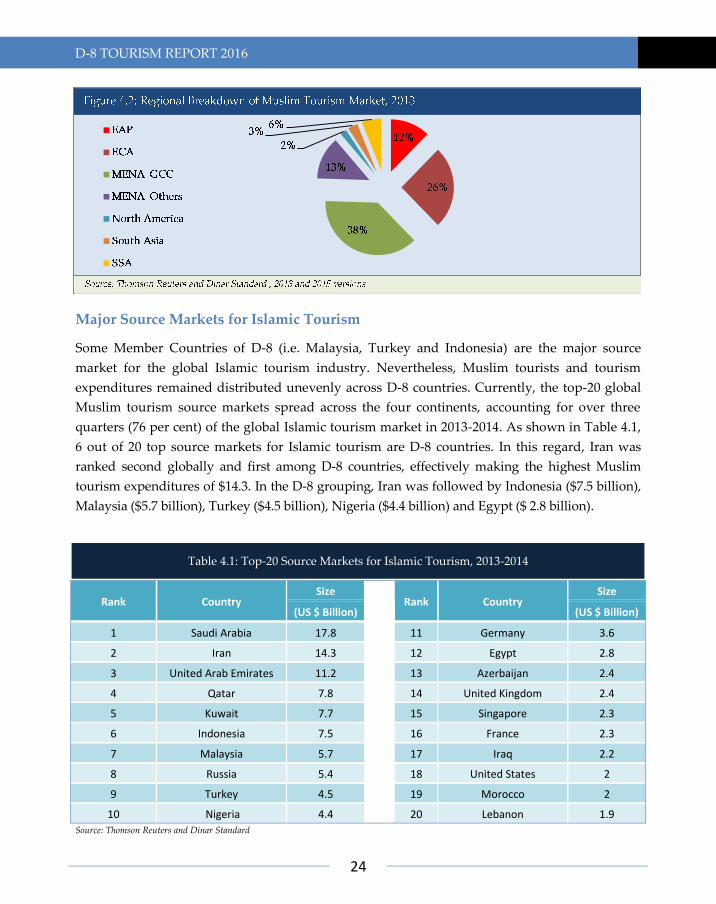
The regional breakdown of the global Islamic tourism market reveals that it is highly
concentrated in the Middle East and North Africa (MENA) region (Figure 4.2). In 2013, MENA
region accounted for half of the total out bound tourism expenditures made by the Muslim
tourists. Among other regions, Europe and Central Asia (ECA) accounted for the second largest
share of 25 per cent followed by East Asia and Pacific (EAP, 12 per cent) and Sub-Saharan
Africa (SSA, 6 per cent).
D-8 TOURISM REPORT 2016
24
Major Source Markets for Islamic Tourism
Some Member Countries of D-8 (i.e. Malaysia, Turkey and Indonesia) are the major source
market for the global Islamic tourism industry. Nevertheless, Muslim tourists and tourism
expenditures remained distributed unevenly across D-8 countries. Currently, the top-20 global
Muslim tourism source markets spread across the four continents, accounting for over three
quarters (76 per cent) of the global Islamic tourism market in 2013-2014. As shown in Table 4.1,
6 out of 20 top source markets for Islamic tourism are D-8 countries. In this regard, Iran was
ranked second globally and first among D-8 countries, effectively making the highest Muslim
tourism expenditures of $14.3. In the D-8 grouping, Iran was followed by Indonesia ($7.5 billion),
Malaysia ($5.7 billion), Turkey ($4.5 billion), Nigeria ($4.4 billion) and Egypt ($ 2.8 billion).
Rank Country Size
Rank Country Size
(US $ Billion) (US $ Billion)
1 Saudi Arabia 17.8 11 Germany 3.6
2 Iran 14.3 12 Egypt 2.8
3 United Arab Emirates 11.2 13 Azerbaijan 2.4
4 Qatar 7.8 14 United Kingdom 2.4
5 Kuwait 7.7 15 Singapore 2.3
6 Indonesia 7.5 16 France 2.3
7 Malaysia 5.7 17 Iraq 2.2
8 Russia 5.4 18 United States 2
9 Turkey 4.5 19 Morocco 2
10 Nigeria 4.4 20 Lebanon 1.9 Source: Thomson Reuters and Dinar Standard
Table 4.1: Top-20 Source Markets for Islamic Tourism, 2013-2014
D-8 TOURISM REPORT 2016
25
Major Islamic Tourism Destinations
Over the years, several institutions have embarked on initiatives to develop special criteria to
evaluate the performance of tourism destinations with respect to the compliance with the
requirements of the Islamic tourism and rank them accordingly. One of the most famous and
premier initiatives is the Master Card-Crescent Rating Global Muslim Travel Index (GMTI).
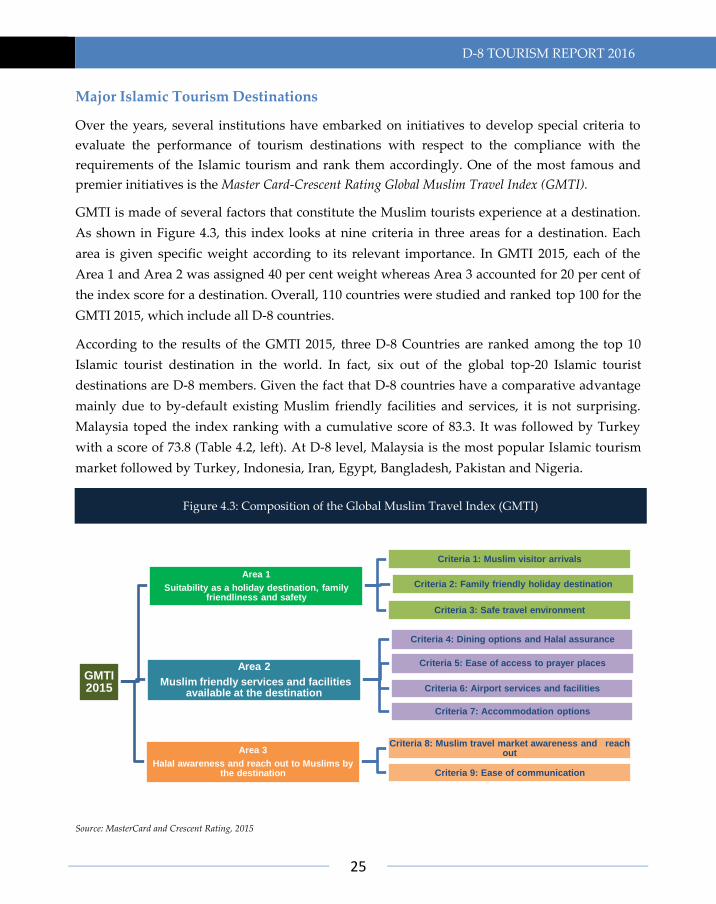
GMTI is made of several factors that constitute the Muslim tourists experience at a destination.
As shown in Figure 4.3, this index looks at nine criteria in three areas for a destination. Each
area is given specific weight according to its relevant importance. In GMTI 2015, each of the
Area 1 and Area 2 was assigned 40 per cent weight whereas Area 3 accounted for 20 per cent of
the index score for a destination. Overall, 110 countries were studied and ranked top 100 for the
GMTI 2015, which include all D-8 countries.
According to the results of the GMTI 2015, three D-8 Countries are ranked among the top 10
Islamic tourist destination in the world. In fact, six out of the global top-20 Islamic tourist
destinations are D-8 members. Given the fact that D-8 countries have a comparative advantage
mainly due to by-default existing Muslim friendly facilities and services, it is not surprising.
Malaysia toped the index ranking with a cumulative score of 83.3. It was followed by Turkey
with a score of 73.8 (Table 4.2, left). At D-8 level, Malaysia is the most popular Islamic tourism
market followed by Turkey, Indonesia, Iran, Egypt, Bangladesh, Pakistan and Nigeria.
Source: MasterCard and Crescent Rating, 2015
GMTI 2015
Area 1
Suitability as a holiday destination, family friendliness and safety
Criteria 1: Muslim visitor arrivals
Criteria 2: Family friendly holiday destination
Criteria 3: Safe travel environment
Area 2
Muslim friendly services and facilities available at the destination
Criteria 4: Dining options and Halal assurance
Criteria 5: Ease of access to prayer places
Criteria 6: Airport services and facilities
Criteria 7: Accommodation options
Area 3
Halal awareness and reach out to Muslims by the destination
Criteria 8: Muslim travel market awareness and reach out
Criteria 9: Ease of communication
Figure 4.3: Composition of the Global Muslim Travel Index (GMTI)

D-8 TOURISM REPORT 2016
26
GMTI 2015
Rank
Score GMTI
2015
Rank
Score
Destination Destination
1 Malaysia 83.8 9 Singapore 65.1
2 Turkey 73.8 10 Morocco 64.4
3 United Arab Emirates 72.1 14 Iran 63.9
4 Saudi Arabia 71.3 16 Egypt 62.3
5 Qatar 68.2 20 Thailand 59.2
6 Indonesia 67.5 19 Bangladesh 60.2
7 Oman 66.7 23 Pakistan 57.9
8 Jordan 66.4 54 Nigeria 39.2
Source: MasterCard and Crescent Rating, 2015
In contrast, some Muslim minority countries have made significant progress in catering for the
needs and demands of Muslim tourists. Among these countries Singapore and Thailand are
top-20 Islamic tourism destinations (Table 4.2, right). With a cumulative score of 65.1, Singapore
is ranked even higher than five D-8 destinations like Iran, Egypt, Bangladesh, Pakistan and
Nigeria. In fact, these non-D-8 top Islamic tourism destinations are characterised by excellent
tourism infrastructure and products and hence, sometimes they need very minimal changes in
their strategies to cater for the needs of the Muslim tourists (Master Card and Crescent Rating,
2015).
4.3 Challenges and Opportunities for Islamic Tourism
Islamic tourism is a very recent phenomenon. Despite all the positive developments, the Islamic
tourism market is still fragmented by the diversity of the meaning of halal, income level,
awareness level, location and religion and ethnicity. These are some of the main stumbling
blocks to enhancing Islamic tourism activity in D-8 countries. Some of the specific challenges
that limit the development of Islamic tourism in D-8 countries and available opportunities
ahead of D-8 countries for the development of Islamic tourism market are listed below.
Challenges
Lack of unified and global standards and certification: There are no unified international halal
standards and certification arrangement for the tourism industry. In fact, in the majority of D-8
countries, there is no official body available at the national level to certify hotels and
destinations according to the Islamic requirements. Meanwhile, a Singapore based private
Table 4.2: Top 10 D-8 and Non-D-8 Islamic Tourism Destinations
D-8 TOURISM REPORT 2016
27
company named Crescentrating pioneered the halal friendly travel certification by rating
hotels/resorts against a five-level Crescentrating Standards.
Financial Constraints: As a new emerging segment of global tourism industry, Islamic tourism
has not received enough financial resources, perhaps, with growing number of success stories
investors will give due attention to this niche segment by considering its potential and growing
market size.
Gender: In many Muslim majority countries, female employment in the tourism sector is a
problem due to various social and cultural reasons. Furthermore, women are also not allowed
to travel alone in certain Muslim countries. Thus, a significant proportion of the global Muslim
population is by-default eliminated from the Islamic tourism market.
Differences in the influence of Islamic values and beliefs: There is significant variation across
D-8 countries regarding the understanding and influence of the Islamic values and beliefs.
These existing differences are also reflected in their tourism development policies. While some
D-8 countries are more relaxed and welcoming towards the tourists, some others are more
conservative and less interested.
Opportunities
Islamic tourism potential for economic growth: Provided the fact that many D-8 countries
already have basic infrastructure and environment for catering to the requirements of the
Muslim tourists, they can benefit more from the Islamic tourism market. Therefore,
development of Islamic tourism could play a vital role in the economic growth and prosperity
in these countries.
Innovative tourism products: There are opportunities for D-8 countries to bundle traditional
pilgrimage and religious travel experiences with the activities related to culture and heritage to
make unique and innovative tourism packages. For the destinations with Islamic and heritage
sites, there is a growing opportunity to develop and market their potential by designing
Muslim-friendly cultural tour packages.
Social Media: Internet and social media provide a significant communication platform for
introducing, positioning and marketing of the Islamic tourism brands, products and services to
a wider audience.
D-8 TOURISM REPORT 2016
28
4.4 Highlights from D-8 Islamic Tourism Markets
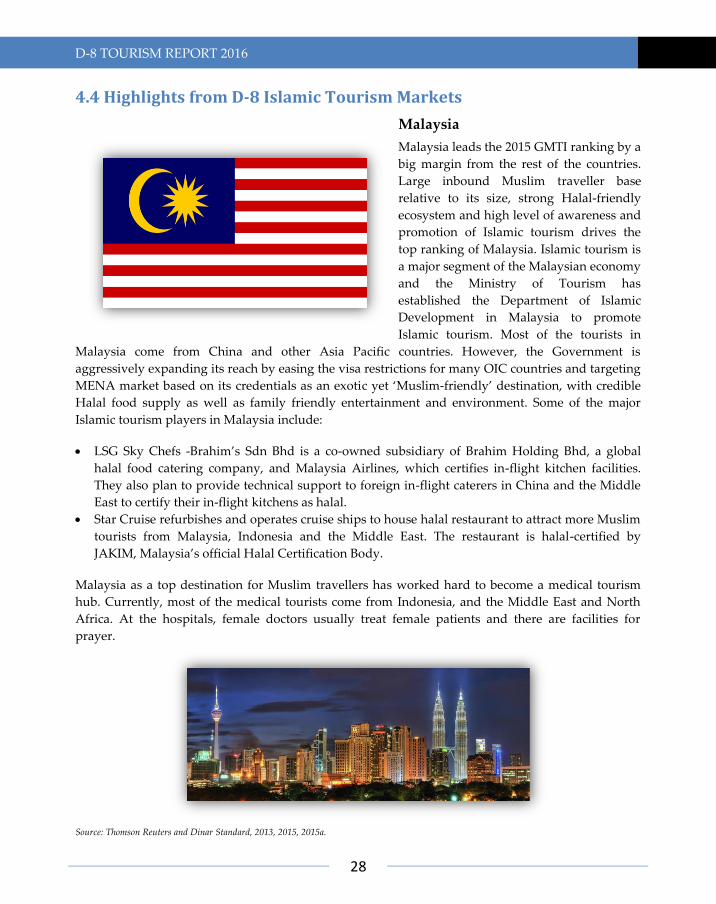
Malaysia
Malaysia leads the 2015 GMTI ranking by a
big margin from the rest of the countries.
Large inbound Muslim traveller base
relative to its size, strong Halal-friendly
ecosystem and high level of awareness and
promotion of Islamic tourism drives the
top ranking of Malaysia. Islamic tourism is
a major segment of the Malaysian economy
and the Ministry of Tourism has
established the Department of Islamic
Development in Malaysia to promote
Islamic tourism. Most of the tourists in
Malaysia come from China and other Asia Pacific countries. However, the Government is
aggressively expanding its reach by easing the visa restrictions for many OIC countries and targeting
MENA market based on its credentials as an exotic yet ‘Muslim-friendly’ destination, with credible
Halal food supply as well as family friendly entertainment and environment. Some of the major
Islamic tourism players in Malaysia include:
LSG Sky Chefs -Brahim’s Sdn Bhd is a co-owned subsidiary of Brahim Holding Bhd, a global
halal food catering company, and Malaysia Airlines, which certifies in-flight kitchen facilities.
They also plan to provide technical support to foreign in-flight caterers in China and the Middle
East to certify their in-flight kitchens as halal.
Star Cruise refurbishes and operates cruise ships to house halal restaurant to attract more Muslim
tourists from Malaysia, Indonesia and the Middle East. The restaurant is halal-certified by
JAKIM, Malaysia’s official Halal Certification Body.
Malaysia as a top destination for Muslim travellers has worked hard to become a medical tourism
hub. Currently, most of the medical tourists come from Indonesia, and the Middle East and North
Africa. At the hospitals, female doctors usually treat female patients and there are facilities for
prayer.
Source: Thomson Reuters and Dinar Standard, 2013, 2015, 2015a.
D-8 TOURISM REPORT 2016
29
Turkey
Turkey is quite rich in tourism potential.
Its geographic location, climate, the
multicultural nature of its demographics
and diverse history make it one of the
most attractive destinations in the world.
Currently, it is ranked as the second most
popular destinations for the Muslim
tourists. Family-friendly Islamic tourism
market is growing fast in Turkey with
strong domestic and inbound travel
demand.
Turkish Airlines is growing rapidly in a bid to become a transport hub serving Europe, Africa,
the Middle East and Asia. In terms of halal food, the airline states on its website that all meals
served on their flights are in accordance with Islamic religious beliefs. The hub airport for
Turkish Airlines, Ataturk International Airport in Istanbul is one of the fastest growing airports
in the world. In general, basic Muslim needs are largely catered at the airport.
Many hotels in Turkey offer conservative holidays, targeting the affluent and pious Muslim
population. Among these hotels and Bera Hotel are the most famous one. Sultan Beach Hotel
offers quite a number of Muslim-friendly services like halal food, separate pool for women,
prayer facilities and ban on alcohol. Bera Hotel in Alanya has an open-air, ladies-only pool on
the top floor to which access is strictly guarded; the elevators leading up to the pool is female
only and no camera phones. On the beach, women are required to dress modestly. All rooms
include a Quran, a prayer rug and prayer beads and a Qibla pointer. Digital displays in the lifts
and lobby indicate accurate prayer times and there is a mosque in the hotel.
Source: Duman, 2011; SG, 2016, Halal Travel, n.d.

D-8 TOURISM REPORT 2016
30
Indonesia
Indonesia is the sixth most popular
tourist destination for Muslims in the
world and the third one in D-8 grouping
according to the GMTI index in 2015.
Indonesia has the world’s largest Muslim
population. Comprising of 17,000 islands
that span from the Pacific Ocean to the
Indian Ocean, Indonesia is a tropical
archipelago. Located between Asia and
Australia, its population and culture are
incredibly diverse, with over two
hundred tribes and languages. Indonesia`s capital city is Jakarta.
Indonesia is now intensively promoting the development of halal tourism in an effort to attract
tourists from Muslim nations, particularly countries in the Middle East. The Tourism Ministry
has designated at least 10 provinces as halal tourist destination regions, which comprise six
provinces or special regions in Java (Banten, Jakarta, West Java, and Central Java, in addition to
Yogyakarta and East Java), two in Sumatra (West Sumatra and Aceh), one in Kalimantan (South
Kalimantan) and one in Nusa Tenggara (West Nusa Tenggara/NTB). The tourism authorities
have also produced tourist guides promoting Indonesia as a “Muslim friendly destination”. It
highlights the country’s best “sharia” tourism destinations and notes there are more than
600,000 mosques in the archipelago.
Source: The Guardian, 2015; Saudi Gazette, 2016.

D-8 TOURISM REPORT 2016
31
Iran
In GMTI index 2015, Iran is ranked as the
14th (in the world) and 4th (in D-8
grouping) the most popular Islamic
tourism destination. As cited from Iranian
tourism authorities, Iran plans to turn into
the world’s hub for Halal tourism, which
could draw as many as 15 million Muslims
a year from around the world.
There is a high potential for expansion of
Islamic tourism in Iran. Existence of Imam
Reza shrine in Mashhad, shrine of
Masoome in Qom, shrine of Imam Khomeini in Tehran and others indicates the high capacities
of Iran for developing Islamic tourism. Currently, Iran is seeing a steady rise in the numbers of
tourists visiting the country thanks to government’s priorities for development, including Qom
where there is insufficient tourism infrastructure. Many visitors from neighbouring countries
and around the world travel to the city to visit a holy shrine.
As cited from tourism authorities of Iran, many principles of Halal tourism, including serving
halal meat in airplanes, hotels and restaurants, and prohibition of serving alcoholic beverages in
such places, are already observed in Iran. If Iran provides more facilities for Muslims, then Iran
would be an ideal touristic destination for Muslims from all over the world.
Source: IRNA, 2016; Halal Travel,n.d.; Halal Expo Europe, 2015, Zolfaghari.

D-8 TOURISM REPORT 2016
32
Egypt
Egypt is the sixteenth most popular
Islamic tourism destination globally and
fifth one at D-8 level, according to The
GMTI index in 2015. Most of Egypt's
tourists describe their trip to Egypt as an
overwhelming experience: the culture,
the nature, the sights, the history, the
people, the lifestyle, the cuisine…
The new initiative comes in accord with
an expected influx of Muslim
holidaymakers over the next decade. In
that regard, Egypt promotes family tourism that is accommodated through the practice of
‘halal’ tourism, which includes a large number of hotels that provide Halal meat … and do not
present alcoholic beverages on board, or pork, and alternatives for female Muslim
holidaymakers, who wear full Islamic clothing, such as “covered swimming pools or other
places reserved only for women.
For the Muslim Tourist, Egypt offers not only Muslim-friendly facilities but also the colourful
history of Islam in Egypt shaped the culture, art and architecture of modern Egypt. Islamic
Egypt has a tremendous wealth of Islamic art and architecture. Visit Al-Mu'izz al-Din Street, El
Azhar Street, Darb al-Ahmar Street, El Saliba Street and Salah ad-Din Square in Cairo to see
Egypt as it once was during the golden age of Islamic architecture. These restored areas are
considered open museums and wonderful to visit at night. There are also dozens of historical
mosques, citadels and souks to visit.
Source: Egypt Tourism Authority; DIAS, M. C. ,2015.;El-Sergany, 2012.

D-8 TOURISM REPORT 2016
33
Bangladesh
Tourism is one of the promising sectors
of Bangladesh. Tourism industry effects
positively to the economic indicators in
Bangladesh. Bangladesh has a host of
natural treasures such as beaches, lakes,
rivers, hills, forests, wildlife, tribal life,
archaeological remains, historical
monuments, religious and cultural
heritages, handicrafts that offer great
value for tourist attractions. Tourism at
Sundarbans, hill forests (Sylhet,
Chittagong, CHTs and Cox's Bazar), wildlife sanctuaries, national parks, game reserves, safari
parks, eco-parks, water bodies are the potential tourism destinations in Bangladesh.
For Muslims, Bangladesh also possesses a strong potential for Islamic tourism. Currently,
Bangladesh has found a place among the world's top destinations for Muslim travelers, largely
thanks to its availability of Muslim-friendly services and facilities, According to GMTI index,
Bangladesh is the nineteenth most popular tourist destination for Muslims in the world and the
sixth one in D-8 grouping.
As second largest Muslim country of the world Bangladesh also possess a strong Islamic
heritage. The main Islamic heritage sites are- Star Mosque; Baitul Mukarram Mosque;
ShaitGumbad Mosque, Bagerhat; Chhota Sona Mosque; Mosque of Baba Adam; The Shrine of
Hazrat Shah Jalal; Shrine of Sultan Bayazid Bostami; Shrine of Shah Amanat; Huseni Dalan
Mosque. These places can be attractive destinations for Islamic tourism.
Source: Fahim, T., & Evana Nusrat Dooty, S., 2014; Saha, 2015.

D-8 TOURISM REPORT 2016
34
Pakistan
Pakistan is the 7th most popular Islamic
tourism destination among D-8
countries, also ranked as 23th most
popular in the world for Muslims (see
2015 GMTI index). Pakistan is divided
into four provinces viz., Khyber
Pukhtoonkhwa, Punjab, Sindh and
Balochistan. In those, Pakistan has many
Islamic tourism sites that are historical,
cultural and spiritual in nature and can
be visited by Muslim tourists from the
region and around the world. As the one of the largest Muslim population in Islamic countries
and being near Islamic economy hubs, such as Iran and GCC, Pakistan benefits from those
engines.
Currently, an agency of the Ministry of Tourism, the Pakistan Tourist Development
Corporation offers, for Muslims, a wide selection of hotels, motels and rest house (called
Musaifue Khanas) and tours operated by its subsidiary Pakistan Tours Ltd.
Islam-oriented destinations in Pakistan are also marketed as products of heritage, cultural,
historical, or archaeological tourism. More specifically, Pakistan presents several sites reflecting
upon the historical and architectural prime of the Mughal Indian Empire stretching around a
millennium, which are on the must-see list of many Islamic tourists.
In terms of halal food, the National Assembly of Pakistan has currently passed a bill to establish
Pakistan Halal authority. They would ensure to supply of halal food to the market and keep an
eye on important food items.
Source: Haq, F., & Medhekar, A. ,2014; NewsHalal, n.d.

D-8 TOURISM REPORT 2016
35
Nigeria
Tourism has recently become a priority
industry for the Nigeria government as it
seeks to diversify its economy. Nigeria
has a potential for a wide variety of
tourist attractions such as extended and
roomy river and ocean beaches ideal for
swimming and other water sports,
unique wildlife, vast tracts of unspoiled
nature ranging from tropical forest,
magnificent waterfalls, some new
rapidly growing cities and climatic
conditions in some parts particularly conducive to holidaying. Other attractions include
traditional ways of life preserved in local customs; rich and varied handicrafts and other
colourful products depicting or illustrative of native arts and lifestyle, and the authentic
unsophisticated but friendly attitude of many in the Nigerian population.
Yet, in spite of its vast potential, Nigeria suffers from very low visibility in the international
tourism arena and efforts to capture the mass tourism market. In terms of Islamic tourism,
Nigeria is ranked with the lowest rate at D-8 level, and as the 54th most popular Islamic tourism
destination globally according to GMTI index 2015.
However, it is fact that with the proper planning, Nigeria could offer a wide variety of
opportunities for tourists. More specifically, with its great potential for niche ecotourism,
Nigeria can be one of the important tourism centres in the world for visitors both from Muslim
countries and around the world.
Source: Halal Expo Europe, 2015; The Report: Nigeria 2010; Travel& Tourism 2012.


D-8 TOURISM REPORT 2016
37
5 CONCLUDING REMARKS AND
POLICY RECOMMENDATIONS
As a group, D-8 member countries have a high potential for the development of a sustainable
international tourism sector. This is true given their rich and diverse natural, geographical,
historical, and cultural heritage assets. Therefore, international tourism is a very important
sector that could, if properly planned and managed, play a significant role in the economic
development of D-8 countries. This is due not only to their existing and potential tourism
resources, but also to the fact that their citizens travel in large numbers around the world for
business, leisure, and other purposes. However, considering their modest share in the world
tourism market and the concentration of tourism activity in a few of them, it seems that the
desirable levels of tourism development and cooperation in many D-8 countries have not yet
been achieved.
In fact, the challenges facing tourism and the development of a sustainable international
tourism sector in D-8 countries are diverse as each country has its own tourism features, level of
development, and national development priorities and policies. In the case of many D-8
countries, these challenges still include the lack of technical know-how and the weak
promotional activity. Some D-8 countries also lack the relevant infrastructure necessary for the
development of a sustainable tourism industry. Primary amongst these are hotels and lodging
services, transportation and communication, and tourism information services. This makes it
difficult to provide tourists with the international standards of tourism facilities and services.
While investment in services is a well-established economic activity in the developed countries,
it is still lagging behind in many developing countries. Investment in service-oriented projects,
particularly in tourism, is often regarded in most developing countries as a risky decision.
Accordingly, though they may have a high tourism potential, it is still very difficult for some D-
8 countries to gain access to reasonable financing for their tourism projects even when they
manage to tackle the problems of project identification and planning. The lack of tourism
diversification its poor implementation also hinders the development of the tourism sector in D-
8 countries. Modern international tourism activity has shown a growing tendency towards
diversification and change. This makes it difficult for many D-8 countries, including those with
a relatively developed tourism sector, to keep pace with the rapidly changing and complex
requirements of international tourists. In a highly competitive international tourism market,
and considering the emergence of new tourism destinations, improving the conditions that
foster modern tourism development is not an easy process.
However, despite all these challenges and the modest share of D-8 countries in the world
tourism market, there still is a wide scope for the development of a sustainable international
D-8 TOURISM REPORT 2016
38
tourism industry in those countries. Overall, this necessitates the adoption of long-term
strategies as well as medium to short-term coherent plans and programmes at the national level
that would be accompanied by a process of creating a supportive D-8 cooperation environment.
In this context, the following set of recommendations can be proposed at both the national and
D-8 cooperation level to serve as policy guidelines to which the attention of the member
countries needs to be drawn.
At the national level, the promotion of sustainable tourism development should be an integral
part of the national development plans and strategies. The objectives and programmes of action
for tourism development should be focused on the promotion of the economic, social, cultural,
and environmental incentives of tourism. Sustainable tourism development strategies should be
outlined specifically and formulated in consultation with the private sector and other relevant
stakeholders in the tourism sector. Tourism development projects and strategies should
consider and include issues of environmental sustainability and poverty alleviation.
Governments and the private sector need to pay a special attention.
The quality and efficiency of the basic tourism-related infrastructures and services such as
hotels, roads, public amenities, transportation and communication, tourism information, and
visa regulations should be improved based on international standards to provide world-class
services to tourists. In this context, efforts should be made to create an environment conducive
to the safe travel of tourists by improving the border security measures, particularly at airports.
Special programmes should, therefore, be developed for the national capacity building in the
tourism sector, particularly in the domain of tourism administrations and regulations. On the
other hand, as an activity that symbolises free movement, international tourism has everything
to gain from the greatest possible liberalisation of trade in the services related to it. In this
context, efforts should be made to promote synergies between transport and tourism policies to
secure greater facilitation of border movements for visitors and to increase national capacities to
use the relevant elements of the multilateral trade framework.
Tourism is a business and primarily an area for private sector activity. Thus, efforts should be
made to encourage and promote extensive private sector involvement in tourism development
through strengthening public-private sector cooperation with a view to establishing policies,
strategies, and regulations relative to sustainable tourism development. In this context,
planning, management, and marketing of new and diverse tourism products should be
improved by the inclusion of socio-cultural programmes and traditional activities involving
local communities. In particular, efforts should be made to improve the potential of ecotourism,
not only as a sector with great potential for economic development, especially in remote areas
where few other possibilities exist, but also as a significant tool for the conservation of the
natural environment.

D-8 TOURISM REPORT 2016
39
In order to help change people’s perceptions regarding tourism and raise their awareness of the
opportunities and challenges involved therein, tourism-oriented education should be promoted
and developed. This should be accompanied by making efficient use of the mass media and
other promotional facilities to publicise and promote existing attractions and available tourism
resources. In this context, training programmes on different aspects of tourism should be
provided by national tourism authorities, particularly to people and personnel directly engaged
in tourism activities. These programmes should cover a broad range of subjects such as foreign
languages, business and e-tourism techniques, the environmental and socio-cultural impacts of
tourism, history, national flora and fauna, etc. To facilitate those programmes, actions must be
taken to provide local communities with financial and technical support and develop
entrepreneurial capacities and managerial skills, especially in small and medium-sized tourism
enterprises (SMEs), in order to improve the competitiveness of tourism products and services.
Moreover, at D-8 cooperation level, joint programmes and promotional materials on tourism in
D-8 member countries, such as TV programmes, brochures, posters, and guidebooks should be
developed and made available to the member countries as well as to other countries around the
world in order to promote the cultural heritage, diversity, and landmarks of D-8 countries at the
regional and international levels. In this context, scientific methods of joint tourism marketing
and advertisement should be developed and supported by tools that have a major impact on
potential visitors such as the Internet. A proposed example on these tools could be a D-8
Internet Guide for Tourism with a view to providing all actors in the tourism sector with
comprehensive and updated information on tourism opportunities in D-8 member countries to
help increase intra-D-8 tourism activities. In so doing, the experience of the EU Internet Guide
“EU Support for Tourism Enterprises and Tourist Destinations” could be a useful example.
The establishment of alliances between tourism stakeholders in D-8 countries, particularly
between the official tourism promotion bodies, should be encouraged with a view to
strengthening tourism marketing and promoting cooperation. Linkages in air, land, rail, and sea
transportation should be facilitated and established in order to ease access from one destination
to another within D-8 region. In this context, efforts should be made to establish a D-8 alliance
among the airline companies of D-8 countries with the aim of having direct flights between
their capitals and major cities. Meanwhile, tourism visa and other legal and administrative
travel procedures should be simplified with a view to easing entry and movement of tourists
among D-8 countries and thus enhancing intra-D-8 tourism.
Joint training/vocational programmes on various aspects of the tourism industry should also be
developed and organised by the relevant training institutions in D-8 countries. Linkages or
networks among tourism training institutions in the member countries may be established to
facilitate the exchange of experts and research on tourism development.

D-8 TOURISM REPORT 2016
40
Furthermore, in terms of Islamic Tourism, there is a convergence of common interest-religious,
political, economic, social, and cultural-that is now clustering around the concept of
Islamic/Halal tourism, and all that it implies. There is an increasing level of awareness about the
social, economic and cultural potentials of the Islamic tourism at the top policy makers’ level.
Nonetheless some policy recommendations could be made for the consideration of D-8
countries at both national and D-8 cooperation level, and the major stakeholders of Islamic
tourism industry.
Harmonization of policies and guidelines: There is a need for working out modalities and
findings ways and means to harmonize the Islamic Tourism policies and guidelines in order to
promote development of Islamic tourism and better cooperation among D-8 countries.
Sharing of expertise and experiences for the development of Islamic tourism: Among D-8
countries, there are some examples of successful Islamic destinations like Malaysia, Turkey and
Indonesia. Efforts should be made to facilitate the transfer of knowledge and exchange of
expertise among the emerging Islamic tourism markets and the top performing countries.
Cooperation for making a positive image: the phenomenon of Islamophobia is on the rise across
the globe. There is a need for joint action and cooperation at the D-8 level to counter the
negative media publicity and address the growing Islamophobia by highlighting the cultural
and religious values and contributions of the Muslims to the history, culture, architecture and
art. This will help not only in positive image building and but also pave way for the
development of Islamic tourism.
Organizing Islamic tourism events: There is a need for special conferences, workshops and
forums at both D-8 and national levels to introduce and advertise the Islamic tourism related
products and services. Furthermore, events should also be organized to gather the major
stakeholders in Islamic tourism market to share their experiences and best practices and
brainstorm the joint future policies and strategies.
Utilizing the media: Media can play an important role to foster and propagate Islamic tourism
activities. To this end, D-8 countries can consider establishing a dedicated satellite TV channel
(s); publish special editions of popular magazines on Islamic tourism and launch large-scale
social media campaigns.
Designing long-term strategies and master plans for the development of Islamic tourism
market: Being the major source markets and beneficiaries of Islamic tourism, D-8 countries
should develop a comprehensive; evidence based and long-term strategies for the development
of a sustainable Islamic tourism sector at both national and D-8 level.
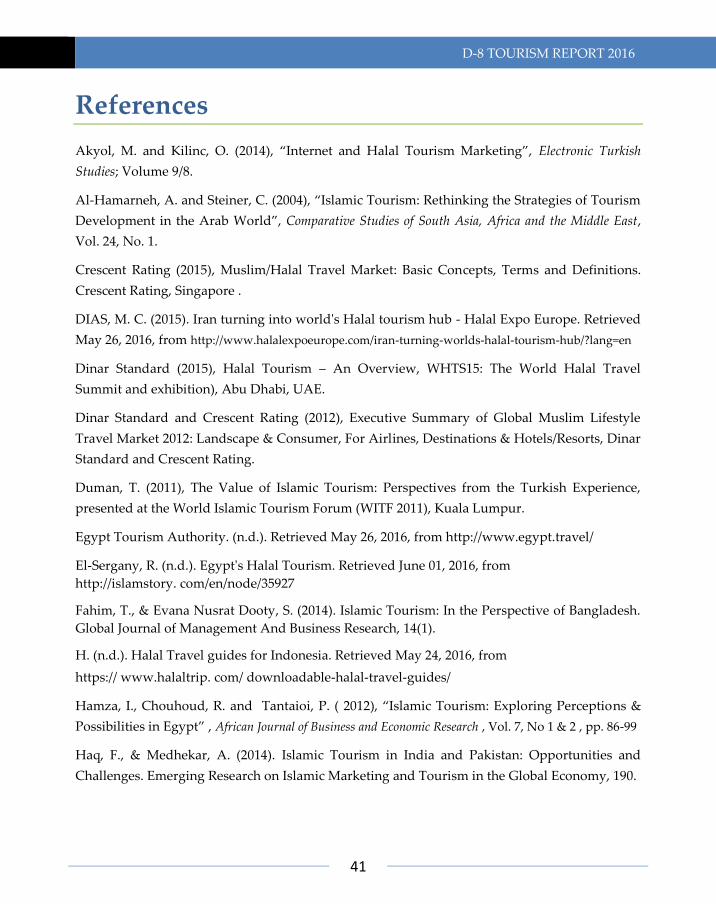
D-8 TOURISM REPORT 2016
41
References
Akyol, M. and Kilinc, O. (2014), “Internet and Halal Tourism Marketing”, Electronic Turkish
Studies; Volume 9/8.
Al-Hamarneh, A. and Steiner, C. (2004), “Islamic Tourism: Rethinking the Strategies of Tourism
Development in the Arab World”, Comparative Studies of South Asia, Africa and the Middle East,
Vol. 24, No. 1.
Crescent Rating (2015), Muslim/Halal Travel Market: Basic Concepts, Terms and Definitions.
Crescent Rating, Singapore .
DIAS, M. C. (2015). Iran turning into world's Halal tourism hub - Halal Expo Europe. Retrieved
May 26, 2016, from http://www.halalexpoeurope.com/iran-turning-worlds-halal-tourism-hub/?lang=en
Dinar Standard (2015), Halal Tourism – An Overview, WHTS15: The World Halal Travel
Summit and exhibition), Abu Dhabi, UAE.
Dinar Standard and Crescent Rating (2012), Executive Summary of Global Muslim Lifestyle
Travel Market 2012: Landscape & Consumer, For Airlines, Destinations & Hotels/Resorts, Dinar
Standard and Crescent Rating.
Duman, T. (2011), The Value of Islamic Tourism: Perspectives from the Turkish Experience,
presented at the World Islamic Tourism Forum (WITF 2011), Kuala Lumpur.
Egypt Tourism Authority. (n.d.). Retrieved May 26, 2016, from http://www.egypt.travel/
El-Sergany, R. (n.d.). Egypt's Halal Tourism. Retrieved June 01, 2016, from
http://islamstory. com/en/node/35927
Fahim, T., & Evana Nusrat Dooty, S. (2014). Islamic Tourism: In the Perspective of Bangladesh.
Global Journal of Management And Business Research, 14(1).
H. (n.d.). Halal Travel guides for Indonesia. Retrieved May 24, 2016, from
https:// www.halaltrip. com/ downloadable-halal-travel-guides/
Hamza, I., Chouhoud, R. and Tantaioi, P. ( 2012), “Islamic Tourism: Exploring Perceptions &
Possibilities in Egypt” , African Journal of Business and Economic Research , Vol. 7, No 1 & 2 , pp. 86-99
Haq, F., & Medhekar, A. (2014). Islamic Tourism in India and Pakistan: Opportunities and
Challenges. Emerging Research on Islamic Marketing and Tourism in the Global Economy, 190.

D-8 TOURISM REPORT 2016
42
Indonesia promotes halal industry to attract tourists from Middle East - Saudi Gazette. (2016).
Retrieved May 24, 2016, from http://saudigazette.com.sa/business/indonesia-promotes-halal-industry-attract-tourists-middle-east/
Indonesia's Lombok promotes itself as 'Muslim-friendly' tourism destination. (2015). Retrieved
June 01, 2016, from http://www.theguardian.com/world/2015/feb/25/indonesias-lombok-promotes-itself-as-muslim-friendly-tourism-destination
Iran turning into world's Halal tourism hub - Halal Expo Europe. (2015). Retrieved May 26,
2016, from http://www.halalexpoeurope.com/iran-turning-worlds-halal-tourism-hub/?lang=en
Islamic Iran enjoys potential to become Halal tourist hub. (2015). Retrieved June 01, 2016, from
http://theiranproject.com/blog/2015/03/14/islamic-iran-enjoys-potential-to-become-halal-tourist-hub/
Jafari, J. and Scott, N. (2014), “Muslim World and its Tourisms” Annals of Tourism Research, Vol.
44, 1-19.
Master Card and Crescent Rating (2015), Global Muslim Travel Index 2015 (GMTI 2015), Master
Card-Crescent Rating, Singapore.
Pakistan Halal Authority to start functioning within two months: Federal Minister said -
NewsHalal. (n.d.). Retrieved June 01, 2016, from http://newshalal.com/article/271/trends/Pakistan-Halal-Authority-to-start-functioning-within-two-months:-Federal-Minister-said
Saad Sanad, H. A., Kassem, M. and N. Scott (2010), Tourism and Islamic Law, in Noel
Scott, Jafar Jafari (ed.) Tourism in the Muslim World (Bridging Tourism Theory and Practice,
Volume 2, Emerald Group Publishing Limited, pp.17 – 30.
Saha, S. (2015). Bangladesh becoming a top spot for Muslim travellers. Retrieved June 01, 2016,
from http://www.thedailystar.net/business/bangladesh-becoming-top-spot-muslim-travellers-5137
Scott, N. and Jafari, J. (2010), Introduction: Chapter 1, in Noel Scott, Jafar Jafari (ed.) Tourism in
the Muslim World (Bridging Tourism Theory and Practice, Volume 2, Emerald Group
Publishing Limited, pp.1-13.
The Report: Nigeria 2010. (2010). Oxford Business Group.
Thomson Reuters and Dinar Standard (2013), State of the Global Islamic Economy, 2013 Report,
Thomson Reuters and Dinar Standard, New York City.
Thomson Reuters and Dinar Standard (2015), State of the Global Islamic Economy, 2014-2015
Report, Thomson Reuters and Dinar Standard, New York City.
D-8 TOURISM REPORT 2016
43
Thomson Reuters and Dinar Standard (2015a), Islamic Growth Markets Investment Outlook,
Official Report of Global Islamic Investment Gateway, Thomson Reuters and Dinar Standard,
New York City.
Travel&Tourism. (2012). Nigerian hotels set to corner Muslim tourist boom. Retrieved June 01,
2016, from
https://bivnze.wordpress.com/2012/08/10/nigerian-hotels-set-to-corner-muslim-tourist-boom/
UNDP (2011), Public-Private Partnership in Rural Tourism, United Nations Development
Programme, Belgrade.
UNWTO (2000), Public-Private Sector Cooperation: Enhancing Tourism Competitiveness, UN
World Tourism Organization, Madrid.
UNWTO (2003), Co-operation and Partnerships in Tourism - A Global Perspective, UN World
Tourism Organization, Madrid.
UNWTO (2015), World Tourism Barometer, Volume 13, April.
UNWTO (2015), World Tourism Barometer, Volume 13, January.
UNWTO (2015), World Tourism Barometer, Volume 13, June.
UNWTO (2015), World Tourism Highlights.
UNWTO, The Standard International Classification of Tourism Activities (SICTA), Available at:
http://www.unwto.org/statistics/basic_references/index-en.htm.
WEF (2009), Travel and Tourism Competitiveness Report 2009, World Economic Forum.
Zolfaghari, H. (N.D.). Potentials and Limitations in Iran for Developing Tourism Sector.
Retrieved June 1, 2016, from http://web.deu.edu.tr/geomed2010/2007/Zolfaghari.pdf

D-8 TOURISM REPORT 2016
44
Data Sources
IMF, Direction of Trade Statistics (DOTS), Online Database.
The SESRIC BASEIND (BAsic Social and Economic INDicators) Database.
United Nations Statistics Division (UNSD), Tourism Statistics Online Database (UNDATA).
United Nations World Tourism Organisation (UNWTO), Compendium of Tourism Statistics
CD-ROM: 2015.
World Bank, World Development Indicators Online Database.

D-8 TOURISM REPORT 2016
45
Statistical Appendix
Table A.1: International Tourist Arrivals by Region (Millions)
Year World Africa Americas Asia & Pacific Europe Middle East
1970 165.8 2.4 42.3 6.2 113 1.9
1975 222.3 4.7 50 10.2 153.9 3.5
1980 277.6 7.2 62.3 23 178 7.1
1981 278.2 8.1 62.5 24.9 175.1 7.6
1982 276.4 7.6 59.7 26 174.9 8.3
1983 281.2 8.2 59.9 26.6 179 7.5
1984 306.2 8.8 67.4 29.5 192.8 7.7
1985 319.5 9.6 65.1 32.9 203.8 8.1
1986 329.5 9.3 70.9 36.8 205.5 6.9
1987 359 9.8 76.6 42.1 223.3 7.2
1988 384.1 12.6 83 48.7 230.7 9.1
1989 409 13.8 86.9 49.4 249.6 9.2
1990 438.4 15.2 92.8 56.2 264.7 9.6
1991 441.3 16.3 95.3 58 262.8 8.9
1992 478.4 18.2 102.2 65.8 280.9 11.3
1993 494.2 18.8 102.2 72.3 289.5 11.4
1994 518 19.1 105.1 80.1 301.5 12.1
1995 538.5 20.1 109 82.5 313.2 13.7
1996 572.4 21.8 114.5 90.4 329.9 15.8
1997 596 22.8 116.2 89.7 350.6 16.7
1998 614.3 25.2 119.2 89.4 362.5 18
1999 637.4 26.7 122 98.8 368.4 21.5
2000 674 26.2 128.2 110.3 386.4 22.4
2001 680 28.9 122.1 120.7 383.8 25
2002 700 29.5 116.6 131.1 394 29.2
2003 694 31 113.1 113.3 407.1 29.5
2004 764 33.8 125.7 144.2 424.4 36.3
2005 809 34.8 133.3 154 453 33.7
2006 846 39.1 135.8 166 463.9 40.9
2007 900 42.6 142.9 182 485.4 46.9
2008 919 44.5 146.9 184 487.3 56
2009 880 45.9 140 180.9 460 52.9
2010 949 49.5 150.1 205.4 488.9 54.7
2011 997 49.5 155.5 218.7 520.1 52.8
2012 1038 51.9 162.5 233.8 540.2 49.8
2013 1087 54.4 167.5 249.8 566.4 48.4
2014 1133 55.8 180.9 263.3 581.7 51.1
Source: United Nations World Tourism Organization, Tourism Market Trends.
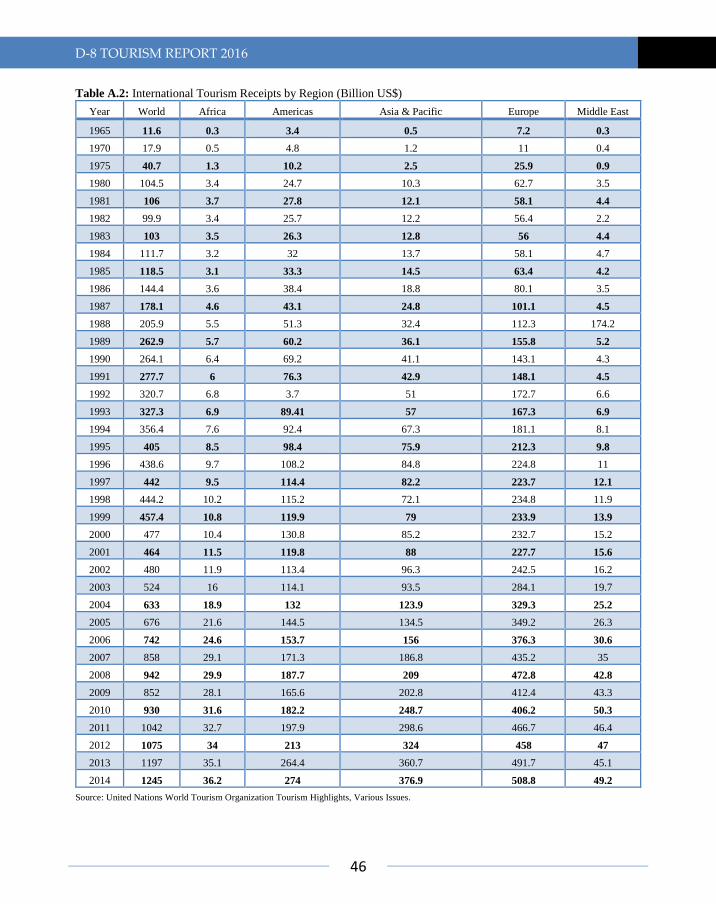
D-8 TOURISM REPORT 2016
46
Table A.2: International Tourism Receipts by Region (Billion US$)
Year World Africa Americas Asia & Pacific Europe Middle East
1965 11.6 0.3 3.4 0.5 7.2 0.3
1970 17.9 0.5 4.8 1.2 11 0.4
1975 40.7 1.3 10.2 2.5 25.9 0.9
1980 104.5 3.4 24.7 10.3 62.7 3.5
1981 106 3.7 27.8 12.1 58.1 4.4
1982 99.9 3.4 25.7 12.2 56.4 2.2
1983 103 3.5 26.3 12.8 56 4.4
1984 111.7 3.2 32 13.7 58.1 4.7
1985 118.5 3.1 33.3 14.5 63.4 4.2
1986 144.4 3.6 38.4 18.8 80.1 3.5
1987 178.1 4.6 43.1 24.8 101.1 4.5
1988 205.9 5.5 51.3 32.4 112.3 174.2
1989 262.9 5.7 60.2 36.1 155.8 5.2
1990 264.1 6.4 69.2 41.1 143.1 4.3
1991 277.7 6 76.3 42.9 148.1 4.5
1992 320.7 6.8 3.7 51 172.7 6.6
1993 327.3 6.9 89.41 57 167.3 6.9
1994 356.4 7.6 92.4 67.3 181.1 8.1
1995 405 8.5 98.4 75.9 212.3 9.8
1996 438.6 9.7 108.2 84.8 224.8 11
1997 442 9.5 114.4 82.2 223.7 12.1
1998 444.2 10.2 115.2 72.1 234.8 11.9
1999 457.4 10.8 119.9 79 233.9 13.9
2000 477 10.4 130.8 85.2 232.7 15.2
2001 464 11.5 119.8 88 227.7 15.6
2002 480 11.9 113.4 96.3 242.5 16.2
2003 524 16 114.1 93.5 284.1 19.7
2004 633 18.9 132 123.9 329.3 25.2
2005 676 21.6 144.5 134.5 349.2 26.3
2006 742 24.6 153.7 156 376.3 30.6
2007 858 29.1 171.3 186.8 435.2 35
2008 942 29.9 187.7 209 472.8 42.8
2009 852 28.1 165.6 202.8 412.4 43.3
2010 930 31.6 182.2 248.7 406.2 50.3
2011 1042 32.7 197.9 298.6 466.7 46.4
2012 1075 34 213 324 458 47
2013 1197 35.1 264.4 360.7 491.7 45.1
2014 1245 36.2 274 376.9 508.8 49.2
Source: United Nations World Tourism Organization Tourism Highlights, Various Issues.

D-8 TOURISM REPORT 2016
47
Table A.3: International Tourism Arrivals in D-8 Countries
2009 2010 2011 2012 2013
Bangladesh 267000 303000 155000 125000 148000
Egypt 11914000 14051000 9497000 11196000 9174000
Indonesia 6324000 7003000 7650000 8044000 8802000
Iran 2116000 2938000 3354000 3834000 4769000
Malaysia 23646000 24577000 24714000 25033000 25715000
Nigeria 1414000 1555000 715000 486000 600000
Pakistan 855000 907000 1161000 966000 1051928
Turkey 30187000 31364000 34654000 35698000 37795000
D-8 Total 76723000 82698000 81900000 85382000 88054928
Source: World Tourism Organization, Yearbook of Tourism Statistics, Compendium of Tourism Statistics and data files.
Table A.4: International Tourism Receipts in D-8 Countries (US$)
2009 2010 2011 2012 2013
Bangladesh 95000000 104000000 97000000 105000000 131000000
Egypt 11757000000 13633000000 9333000000 10823000000 6747000000
Indonesia 6053000000 7618000000 9038000000 9463000000 10302000000
Iran 2259000000 2631000000 2489000000 1346000000 1598000000
Malaysia 17231000000 18152000000 19649000000 20251000000 21500000000
Nigeria 791000000 736000000 688000000 639000000 616000000
Pakistan 950000000 998000000 1127000000 1014000000 938000000
Turkey 26331000000 26318000000 30302000000 31566000000 35037000000
D-8 Total 65467000000 70190000000 72723000000 75207000000 76869000000
Source: World Tourism Organization, Yearbook of Tourism Statistics, Compendium of Tourism Statistics and data files.
Table A.5: International Tourism Expenditure in D-8 Countries (US$)
2009 2010 2011 2012 2013
Bangladesh 661000000 852000000 819000000 889000000 1308000000
Egypt 2941000000 2696000000 2575000000 3037000000 3261000000
Indonesia 6908000000 8432000000 8653000000 9055000000 10280000000
Iran 8503000000 10570000000 10558000000 7517000000 8297000000
Malaysia 7196000000 8324000000 10180000000 12217000000 12236000000
Nigeria 6236000000 8348000000 9533000000 9240000000 9150000000
Pakistan 1098000000 1370000000 1857000000 1851000000 1638000000
Turkey 5061000000 5817000000 5372000000 4585000000 5253000000
D-8 Total 38604000000 46409000000 49547000000 48391000000 51423000000
Source: World Tourism Organization, Yearbook of Tourism Statistics, Compendium of Tourism Statistics and data files.

D-8 TOURISM REPORT 2016
48
Table A.6: Balance of International Tourism (Million US$)
2009 2010 2011 2012 2013
Bangladesh -566 -748 -722 -784 -1177
Egypt 8816 10937 6758 7786 3486
Indonesia -855 -814 385 408 22
Iran -6244 -7939 -8392 -6171 1598
Malaysia 10035 9828 9469 8706 9076
Nigeria -5445 -7641 -8846 -8639
Pakistan -148 -372 -728 -836 -699
Turkey 21270 20501 24930 26981 29784
D-8 Total 26863 23752 22854 27451 42090
Source: SESRIC BASEIND (BAsic Social and Economic INDicators) Database.
Table A.7: Balance of International Tourism (as % of GDP)
2009 2010 2011 2012 2013
Bangladesh -0.55 -0.65 -0.58 -0.61 -0.77
Egypt 4.69 5.1 2.92 2.99 1.37
Indonesia -0.15 -0.11 0.04 0.04 0
Iran -1.56 -1.7 -1.42 -1.05 0.31
Malaysia 4.96 3.97 3.27 2.85 2.9
Nigeria -2 -2.07 -2.15 -1.87
Pakistan -0.09 -0.21 -0.34 -0.39 -0.32
Turkey 3.46 2.8 3.22 3.42 3.62
D-8 Total 8.76 7.13 4.96 5.38 7.11
Source: SESRIC BASEIND (BAsic Social and Economic INDicators) Database.
Table A.8: International Tourism Receipts (as % of Merchandise Export)
2009 2010 2011 2012 2013
Bangladesh 0.66 0.63 0.42 0.47 0.51
Egypt 48.81 50.02 29.6 37.01 23.35
Indonesia 5.2 4.83 4.44 4.98 5.64
Iran 3.03 2.67 1.91 1.32 1.89
Malaysia 10.95 9.13 8.61 8.89 9.21
Nigeria 1.51 0.96 0.65 0.61
Pakistan 5.42 4.71 4.43 4.04 3.58
Turkey 25.78 23.11 22.46 20.7 23.08
D-8 Total 12.7 12.0 9.1 9.8 9.6
Source: SESRIC BASEIND (BAsic Social and Economic INDicators) Database.

D-8 TOURISM REPORT 2016
49
Table A.9: Intra-D-8 Tourist Arrivals
2009 2010 2011 2012 2013
Bangladesh 16892 17045 17199 17352 17506
Egypt 192372 219813 162071 186367 171645
Indonesia 1056596 1186716 1190812 1286532 1403190
Malaysia 2695740 2772606 2455499 2721969 2894584
Nigeria 208575 208994 45682 112320 56592
Pakistan 49275 61088 67211 62381 67834
Turkey 1523815 2023674 2055252 1416370 1447247
Iran 418861 466774 615927 577274 558108
D-8 Total 6162126 6956711 6609653 6380566 6616706
Source: Calculated based on the data in Table A.3, Table A.4.
Table A.10: Intra-D-8 Tourism Receipts (US$)
2009 2010 2011 2012 2013
Bangladesh 6010269 5850628 10763334 14576270 15495409
Egypt 189836965 213273833 159272259 180158096 126235973
Indonesia 1011318088 1290932813 1406870439 1513482386 1642315767
Iran 447167769 417999453 457078802 202663225 187011236
Malaysia 1964403956 2047782240 1952257824 2201997133 2420126619
Nigeria 116678094 98919346 43956945 147680000 58101120
Pakistan 54750000 67217005 65242719 65480677 60487428
Turkey 1329167283 1698095024 1797144517 1252426898 1341637601
D-8 Total 5258083030 5904514206 5869033034 5620191666 5776162855
Source: Calculated based on the data in Table A.3, Table A.4 and Table A.9.


