Exploration Undercover: A Practical Example using the QUEST Study Area
Geoscience BC, October 12-14, 2011
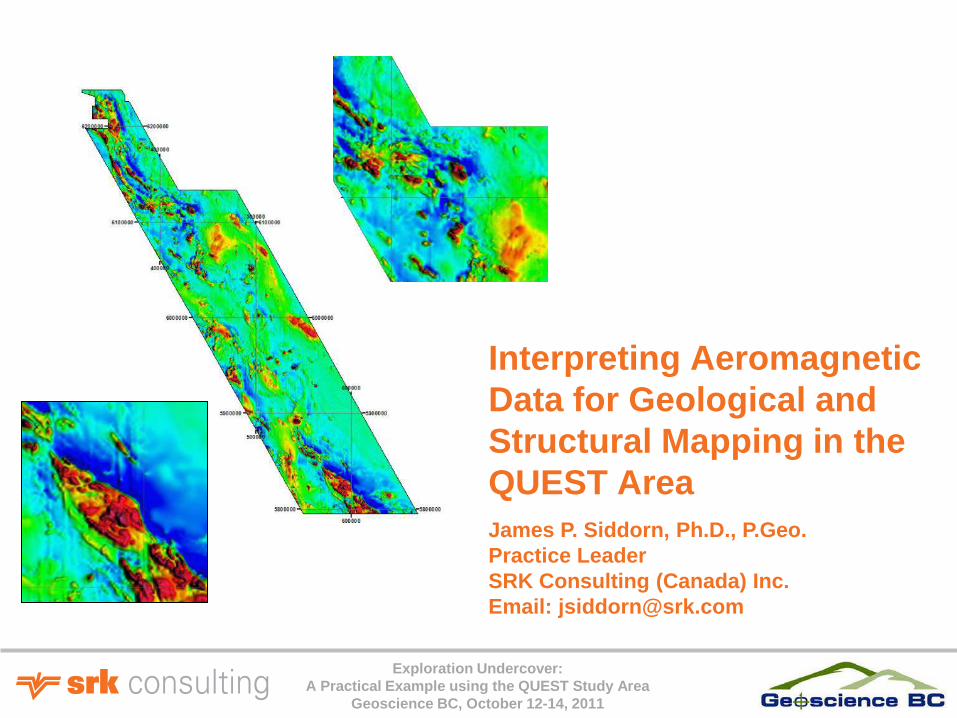
Interpreting Aeromagnetic Data for Geological and Structural Mapping in the QUEST Area James P. Siddorn, Ph.D., P.Geo. Practice Leader SRK Consulting (Canada) Inc. Email: [email protected]

Exploration Undercover: A Practical Example using the QUEST Study Area
Geoscience BC, October 12-14, 2011
Uses of Aeromagnetics • Mapping geology…..what attributes?
• Lithology; • Structure; • Alteration; • Metamorphism; • Mineralization.
• Mapping geology…..why/how is it possible?
• Magnetic minerals are present in (almost) all ‘rock types’; • Magnetometers can measure tiny magnetic signals; and • Airborne surveys allow rapid and inexpensive coverage.
• When do we need aeromagnetics? • Poorly exposed areas…..help interpolate between outcrops; • Covered areas……provide some geological control; and • Well exposed areas……there’s always surprises.
1VD
Exploration Undercover: A Practical Example using the QUEST Study Area
Geoscience BC, October 12-14, 2011
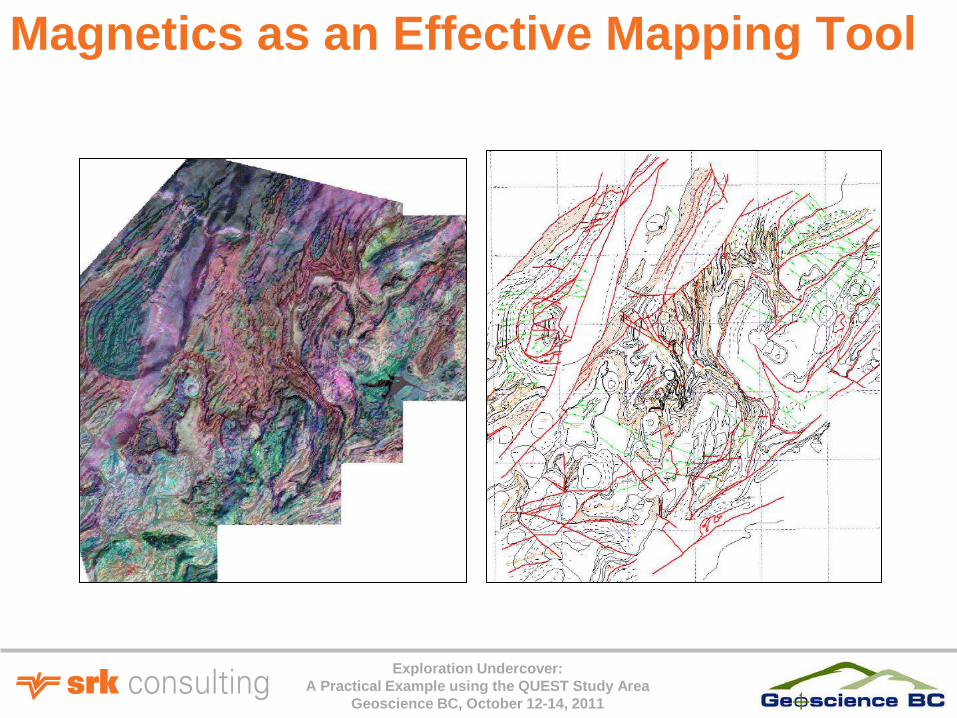
Magnetics as an Effective Mapping Tool

Exploration Undercover: A Practical Example using the QUEST Study Area
Geoscience BC, October 12-14, 2011
Aeromagnetic Expressions of Geological Features
1
3
2

Exploration Undercover: A Practical Example using the QUEST Study Area
Geoscience BC, October 12-14, 2011
Indirect versus Direct Targeting Indirect targeting (most common):
• Interpretation & structural analysis of magnetic data assists by • Highlighting suitable fluid conduits and traps; • Recognition / interpretation of favorable host (& source) lithologies.
Direct targeting (magnetic signature associated with deposit):
• Kimberlites; • BIF’s; • Some porphyries & skarns; • Some IOCG’s.
Ernest Henry
IOCG Cu-Au
122Mt 1%Cu 0.5g/t Au
Exploration Undercover: A Practical Example using the QUEST Study Area
Geoscience BC, October 12-14, 2011
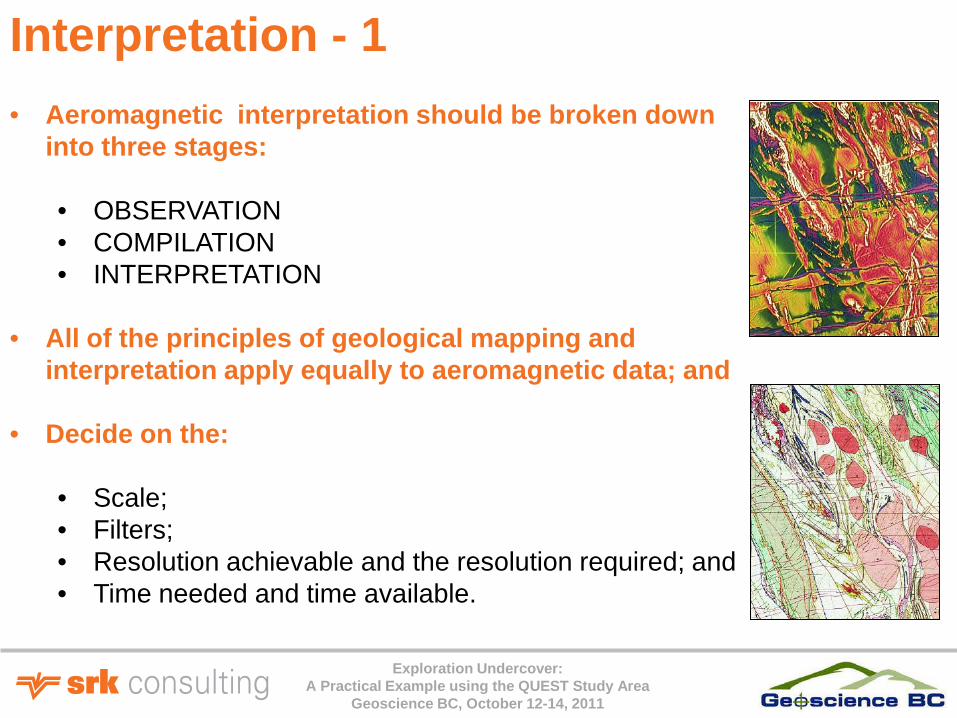
• Aeromagnetic interpretation should be broken down into three stages: • OBSERVATION • COMPILATION • INTERPRETATION
• All of the principles of geological mapping and
interpretation apply equally to aeromagnetic data; and
• Decide on the: • Scale; • Filters; • Resolution achievable and the resolution required; and • Time needed and time available.
Interpretation - 1

Exploration Undercover: A Practical Example using the QUEST Study Area
Geoscience BC, October 12-14, 2011
Interpretation - 2 • When relating lithology or stratigraphy to
magnetics, think:
• Which rocks contain the magnetic minerals (field evidence, susceptibility measurements, petrology)?
• Do these rocks always contain magnetic minerals in this area? • How and when did the magnetic minerals form?
• Be wary of making the following generalizations:
• “The XYZ Formation is highly magnetic” - Is it?? Always?? Everywhere?? Uniformly??
• “The igneous and metamorphic rocks will be more magnetic than the sedimentary rocks” - They are frequently not!!
• “The mafic rocks will be more magnetic than the felsic rocks” - They are frequently not!!
Think in terms of the magnetic rock body in the ground….not the magnetic field it causes. Formulation of structural history consistent with observations.
Exploration Undercover: A Practical Example using the QUEST Study Area
Geoscience BC, October 12-14, 2011
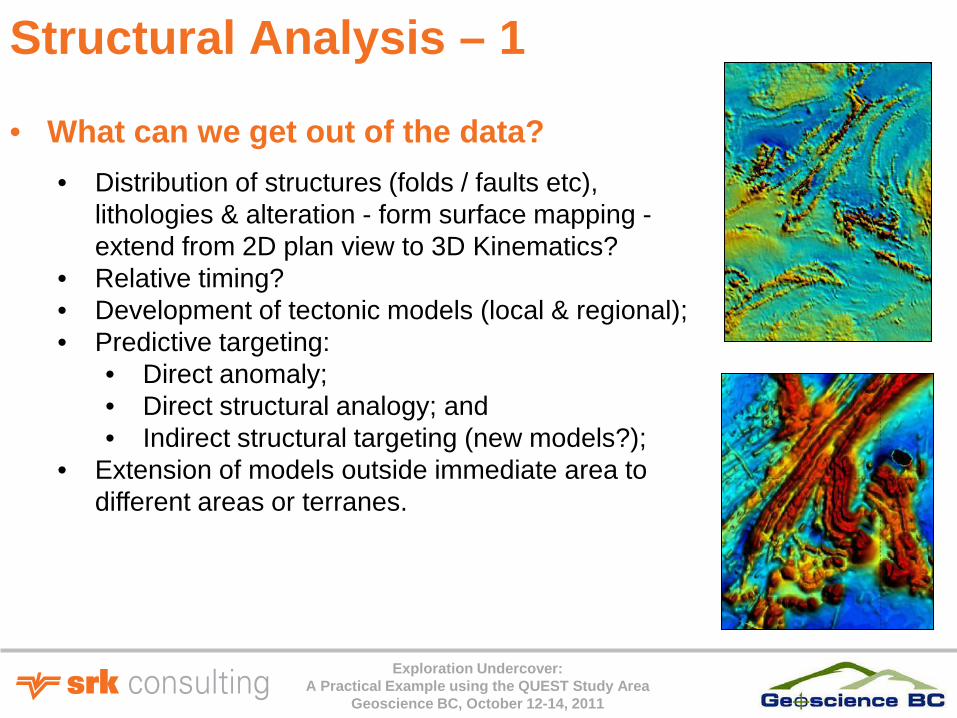
Structural Analysis – 1
• What can we get out of the data?
• Distribution of structures (folds / faults etc), lithologies & alteration - form surface mapping - extend from 2D plan view to 3D Kinematics?
• Relative timing? • Development of tectonic models (local & regional); • Predictive targeting:
• Direct anomaly; • Direct structural analogy; and • Indirect structural targeting (new models?);
• Extension of models outside immediate area to different areas or terranes.
Exploration Undercover: A Practical Example using the QUEST Study Area
Geoscience BC, October 12-14, 2011
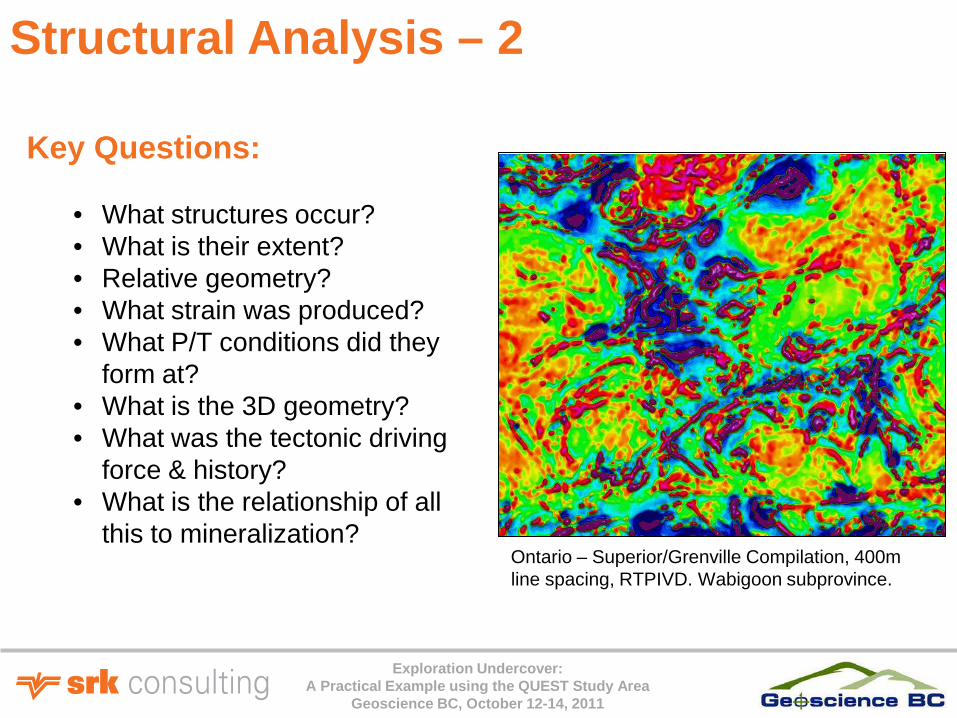
Key Questions:
• What structures occur? • What is their extent? • Relative geometry? • What strain was produced? • What P/T conditions did they
form at? • What is the 3D geometry? • What was the tectonic driving
force & history? • What is the relationship of all
this to mineralization?
Structural Analysis – 2
Ontario – Superior/Grenville Compilation, 400m line spacing, RTPIVD. Wabigoon subprovince.
Exploration Undercover: A Practical Example using the QUEST Study Area
Geoscience BC, October 12-14, 2011
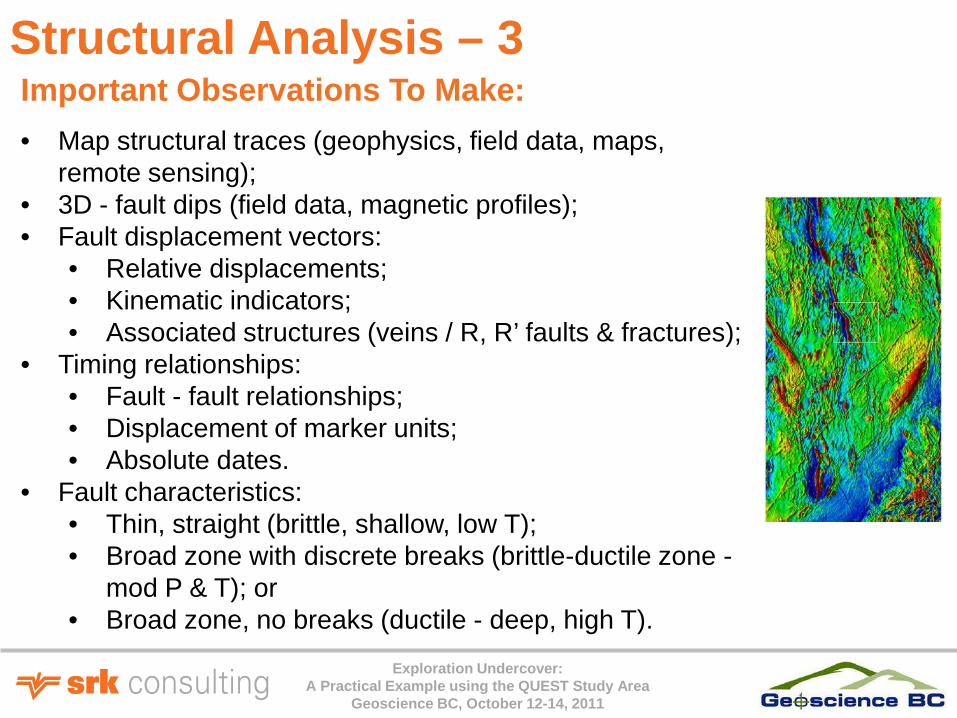
Important Observations To Make:
• Map structural traces (geophysics, field data, maps, remote sensing);
• 3D - fault dips (field data, magnetic profiles); • Fault displacement vectors:
• Relative displacements; • Kinematic indicators; • Associated structures (veins / R, R’ faults & fractures);
• Timing relationships: • Fault - fault relationships; • Displacement of marker units; • Absolute dates.
• Fault characteristics: • Thin, straight (brittle, shallow, low T); • Broad zone with discrete breaks (brittle-ductile zone -
mod P & T); or • Broad zone, no breaks (ductile - deep, high T).
Structural Analysis – 3

Exploration Undercover: A Practical Example using the QUEST Study Area
Geoscience BC, October 12-14, 2011
Structural Analysis – 4 Important Observations To Make (cont….):
• Associated features: • Folds (parallel / oblique); • 2nd order sediments / basins; • Associate intrusives / extrusives; • Veining / alteration; and • Recognition of fault hierarchy (1st order, 2nd order
etc). • Strain variations inferred from block geometries:
• Structures at block margins; and • Strain within blocks (possible modified stress fields).
• Regional context: • Relationship of area to regional structures; • Setting (e.g. basin, mobile belt, arc etc.); • Orogenic events elsewhere at inferred time of faulting? • Pre-existing structures possibly reactivated?
Exploration Undercover: A Practical Example using the QUEST Study Area
Geoscience BC, October 12-14, 2011
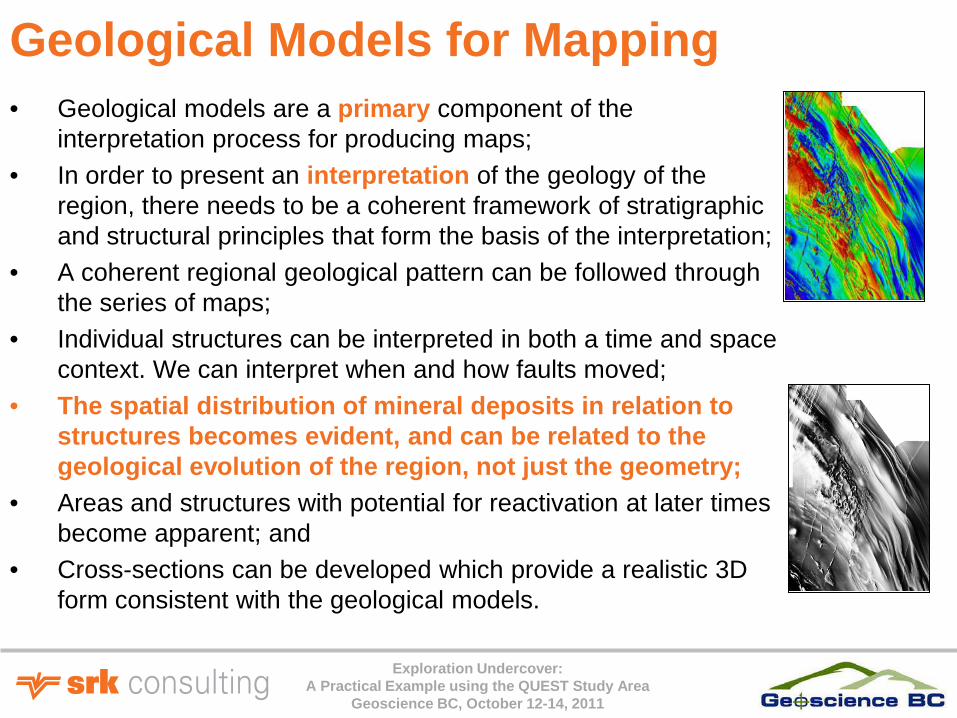
Geological Models for Mapping • Geological models are a primary component of the
interpretation process for producing maps; • In order to present an interpretation of the geology of the
region, there needs to be a coherent framework of stratigraphic and structural principles that form the basis of the interpretation;
• A coherent regional geological pattern can be followed through the series of maps;
• Individual structures can be interpreted in both a time and space context. We can interpret when and how faults moved;
• The spatial distribution of mineral deposits in relation to structures becomes evident, and can be related to the geological evolution of the region, not just the geometry;
• Areas and structures with potential for reactivation at later times become apparent; and
• Cross-sections can be developed which provide a realistic 3D form consistent with the geological models.

Exploration Undercover: A Practical Example using the QUEST Study Area
Geoscience BC, October 12-14, 2011
Add data from other sources (radiometrics and gravity) –
annotate on a separate layer
Finalize map presentation, prepare cross-sections and block model, check geology for internal consistency
Interpretation Flowchart Extract line data from 1VD image
Determine movement direction and dips on faults
and dip direction of stratigraphy.
Add geological data from surface geology maps, drilling results – identify formations
and marker units
Improve on unit boundaries, annotate and connect marker
units from magnetics
Interpret faults – breaks, truncations etc. Annotate
accordingly.
Add exploration model parameters
Add geological model parameters
Extract Lithology data from TMI image. Divide area into major lithological packages.
Exploration Undercover: A Practical Example using the QUEST Study Area
Geoscience BC, October 12-14, 2011
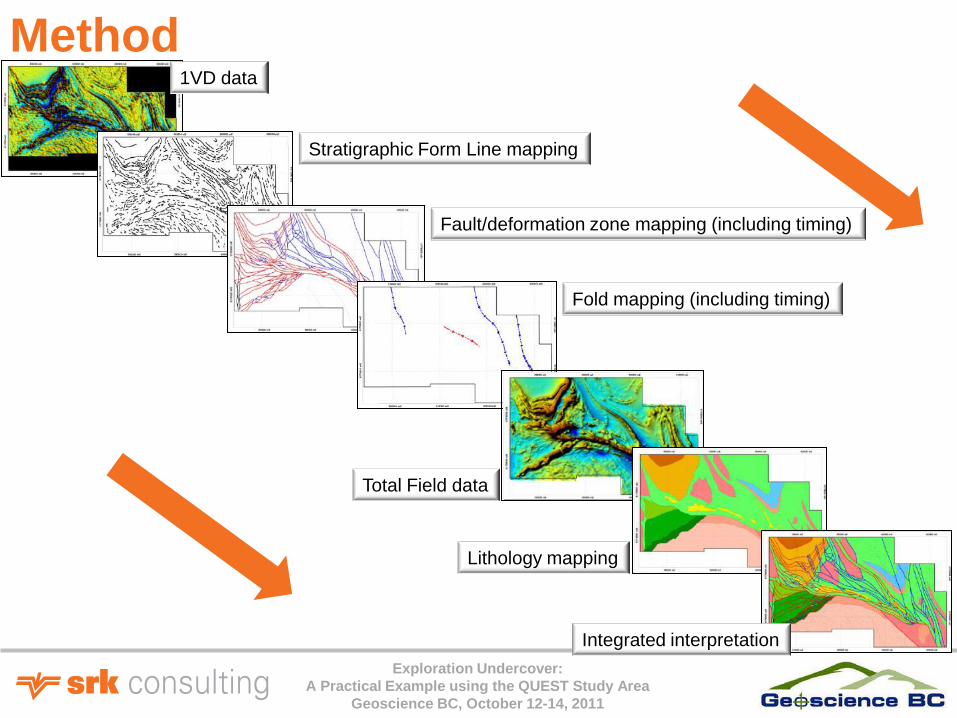
1VD data
Stratigraphic Form Line mapping
Fault/deformation zone mapping (including timing)
Fold mapping (including timing)
Total Field data
Lithology mapping
Integrated interpretation
Method

Exploration Undercover: A Practical Example using the QUEST Study Area
Geoscience BC, October 12-14, 2011
Example of final geological maps

Exploration Undercover: A Practical Example using the QUEST Study Area
Geoscience BC, October 12-14, 2011
Example of final geological maps - Yilgarn • The Yilgarn Craton in Western Australia - a Late Archean Granite-
Greenstone craton. Kambalda Ni
deposits
St. Ives Au deposit
Junction Au deposit
Exploration Undercover: A Practical Example using the QUEST Study Area
Geoscience BC, October 12-14, 2011
Quest
Exploration Undercover: A Practical Example using the QUEST Study Area
Geoscience BC, October 12-14, 2011
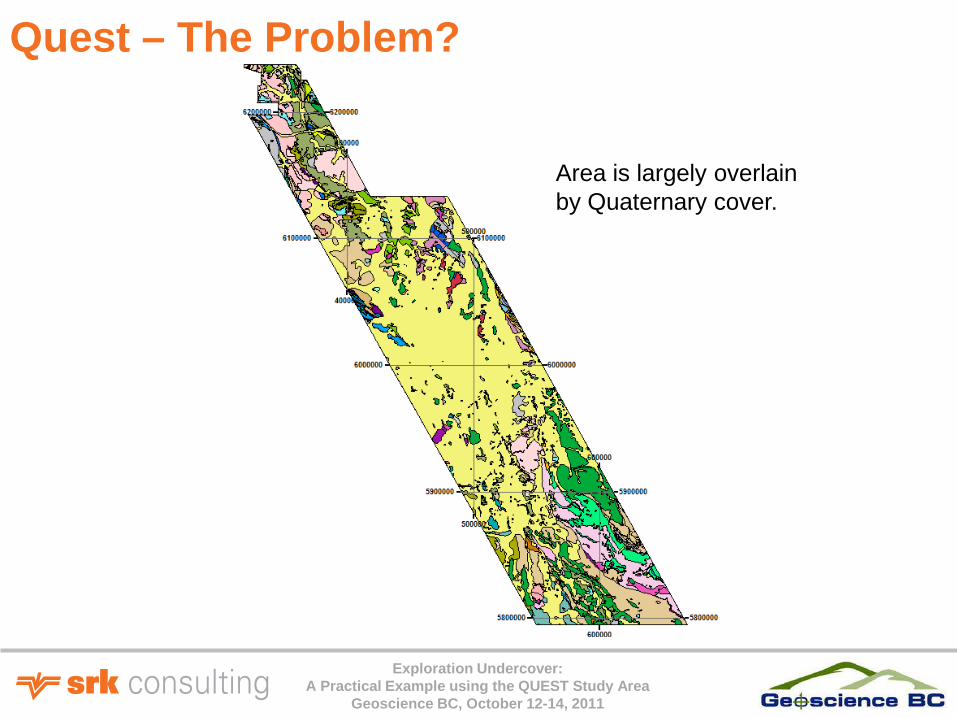
Quest – The Problem?
Area is largely overlain by Quaternary cover.

Exploration Undercover: A Practical Example using the QUEST Study Area
Geoscience BC, October 12-14, 2011
BCGS Geoscience map 2010-1 QUEST bedrock Logan et al.
Reviewing the Geological History....e.g. Quest • Stratigraphy:
• Nicola Group (Southern Quesnel; Middle to Upper Triassic): Pyroxene, feldspar-pyroxene and feldspar phyric basalt breccias, volcaniclastic units and sandstone;
• Takla Group (Northern Quesnel; Middle to Upper Triassic): Augite-phyric and aphyric basalt breccia, agglomerate, tuff and flows; red fragmental basalt; tuffaceous argillite and siltite; conglomerate, sandstone, greywacke, siltstone and chert; local andesitic basalt; minor limestone and diorite;
• Cache Creek Complex (Lower Mississippian to Lower Jurassic): Mafic volcanic rocks, limestone, argillite, chert, serpentinite;
• Slide Mountain Group (Lower Mississippian to Middle Permian): Basalts and Mississippian chert-quartz sandstones and conglomerates
• Snowshoe Group: Quartzite, schist, phyllite, gneiss, marble, conglomerate;
• Chilcotin Group (Oligocene to Pliocene): Columnar jointed olivine basalt.
Exploration Undercover: A Practical Example using the QUEST Study Area
Geoscience BC, October 12-14, 2011
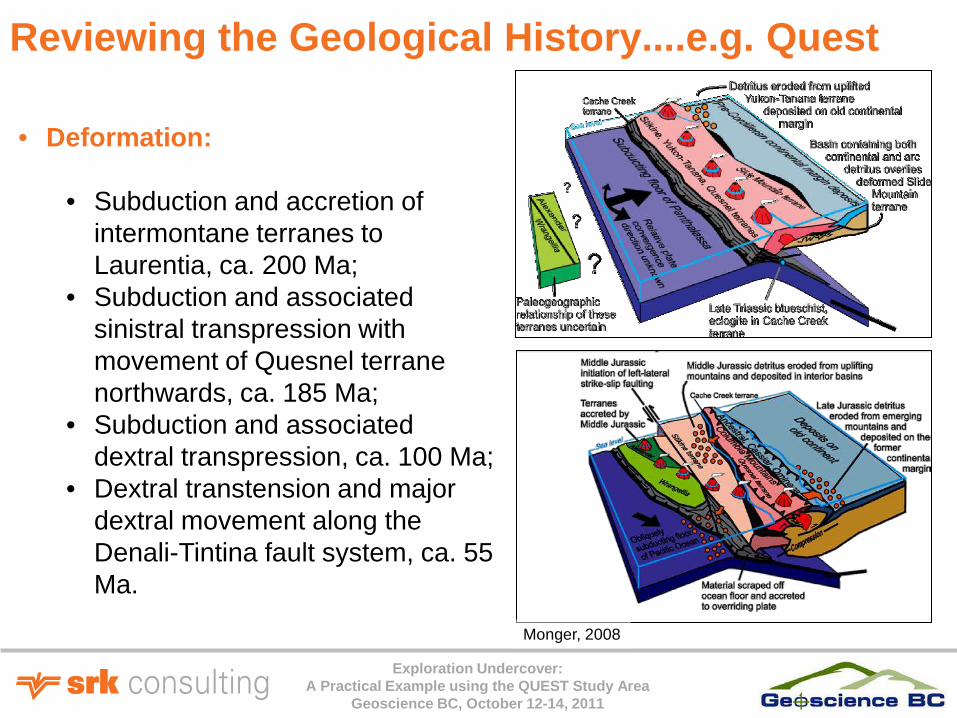
• Deformation:
• Subduction and accretion of intermontane terranes to Laurentia, ca. 200 Ma;
• Subduction and associated sinistral transpression with movement of Quesnel terrane northwards, ca. 185 Ma;
• Subduction and associated dextral transpression, ca. 100 Ma;
• Dextral transtension and major dextral movement along the Denali-Tintina fault system, ca. 55 Ma.
Reviewing the Geological History....e.g. Quest
Monger, 2008

Exploration Undercover: A Practical Example using the QUEST Study Area
Geoscience BC, October 12-14, 2011
Upper Triassic-Upper Jurassic Porphyries • Pre- to syn- accretion;
• Early Calc-alkalic Cu-Mo (Au) porphyries;
• ~206-203 Ma Alkalic Cu-Au porphyries;
• ~ 200 Ma Calc-alkalic Cu-Mo and Cu –Au porphyries;
• 190-180 Ma Alkalic Cu-Au porphyries; and
• < 170 Calc-alkalic Cu-Mo-Au porphyries (Island Cu).
S
Q Modified after Nelson and Colpron, 2007

Exploration Undercover: A Practical Example using the QUEST Study Area
Geoscience BC, October 12-14, 2011
Quest - Datasets
Geotech VTEM Data, TMI, 4000 m line spacing Geotech VTEM Data,1VD, 4000 m line spacing

Exploration Undercover: A Practical Example using the QUEST Study Area
Geoscience BC, October 12-14, 2011
Quest - Datasets
GSC Aeromagnetic Data, RTF, 800 m line spacing GSC Aeromagnetic Data, 1VD, 800 m line spacing

Exploration Undercover: A Practical Example using the QUEST Study Area
Geoscience BC, October 12-14, 2011
Quest – Form Line Mapping
Quest Area Form Lines Quest Form Lines Vs. Mapped Geology

Exploration Undercover: A Practical Example using the QUEST Study Area
Geoscience BC, October 12-14, 2011
Quest – Fault Mapping
Quest Area Faults Quest Faults with GSC 1VD magnetic grid
Exploration Undercover: A Practical Example using the QUEST Study Area
Geoscience BC, October 12-14, 2011
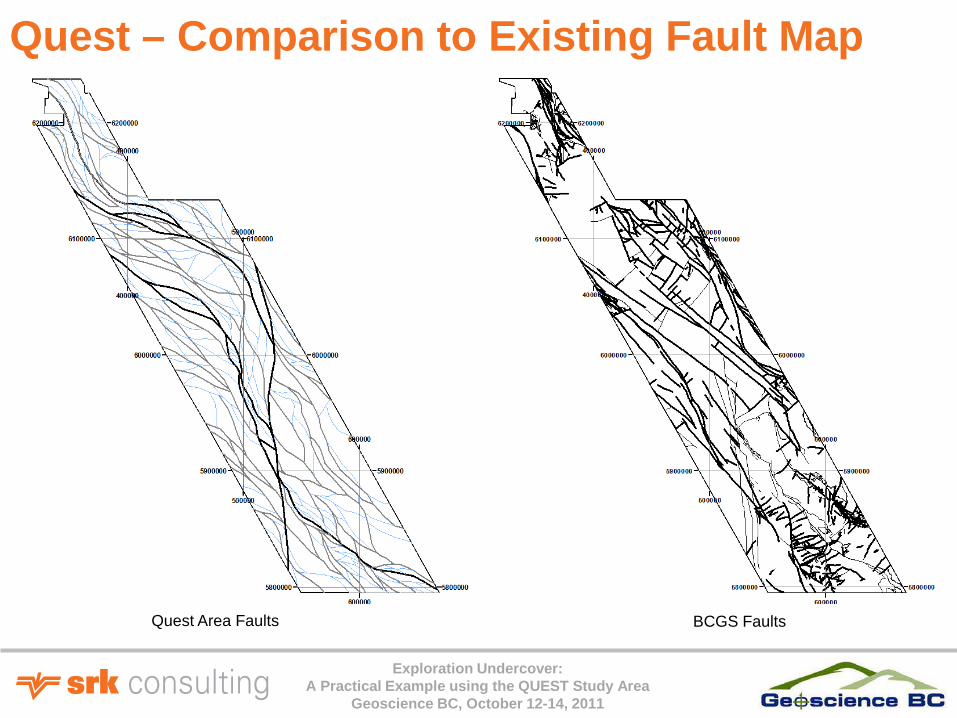
Quest – Comparison to Existing Fault Map
Quest Area Faults BCGS Faults

Exploration Undercover: A Practical Example using the QUEST Study Area
Geoscience BC, October 12-14, 2011
Quest – Association with Gravity Lineaments
Quest Area Faults with GBC Bouguer (2.67 g/cc) Gravity GBC Bouguer (2.67 g/cc) Gravity

Exploration Undercover: A Practical Example using the QUEST Study Area
Geoscience BC, October 12-14, 2011
Quest – Mt. Milligan Setting Mt. Milligan occurs at significant deflection in Quest fault network, from NW-SE to E-W.
Deflection corresponds to alignment of Mt. Milligan, Chuchi Lake, Col, Kwanika, Takla-Rainbow, and Lorraine porphyries
Mt.M
Mt.M
590 Mt at 0.193 % Cu and 0.35 g/t Au
Age: 185 Ma

Exploration Undercover: A Practical Example using the QUEST Study Area
Geoscience BC, October 12-14, 2011
Quest – Mt. Polley Setting Mt. Polley occurs within a fault duplex, trending WNW relative to main NW trending faults
Mt.P
Mt.P
46.2 mt @ 0.34% Cu, 0.29 g/t Au, 0.95 g/t Ag
Age: 203-200 Ma

Exploration Undercover: A Practical Example using the QUEST Study Area
Geoscience BC, October 12-14, 2011
Quest – Mt. Polley Setting
Mt.P
Mt.P
Mt.P
Split in Mt. Polley syenite-monzonite intrusion related to fault network
Exploration Undercover: A Practical Example using the QUEST Study Area
Geoscience BC, October 12-14, 2011
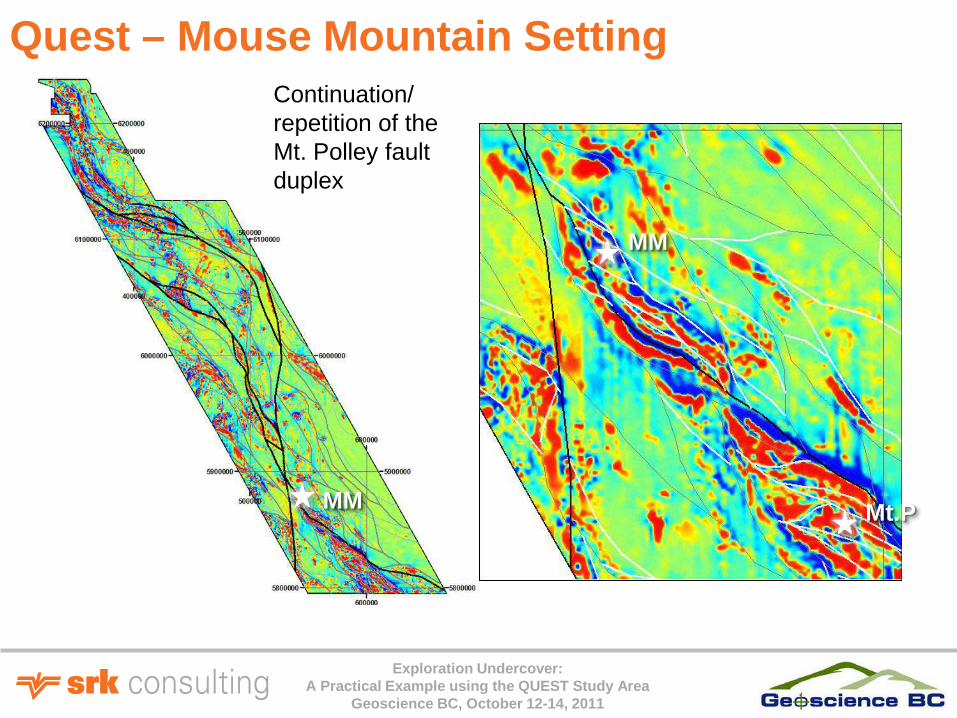
Quest – Mouse Mountain Setting
MM
MM
Mt.P
Continuation/ repetition of the Mt. Polley fault duplex

Exploration Undercover: A Practical Example using the QUEST Study Area
Geoscience BC, October 12-14, 2011
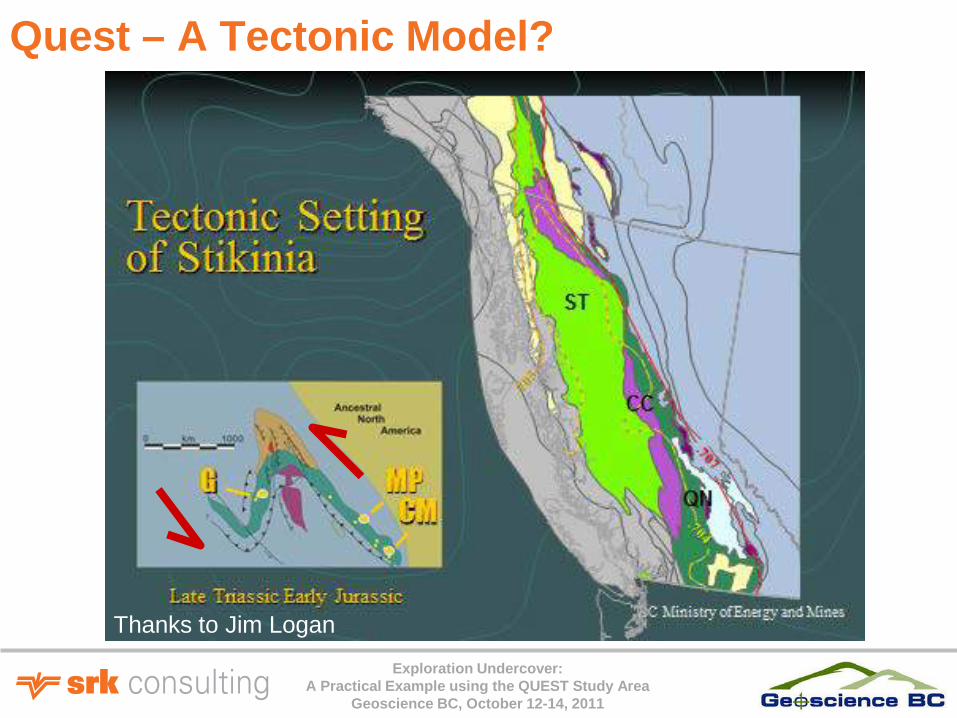
Quest – A Tectonic Model?
Reverse-sinistral transpression creating WNW or E-W pull-apart structures
Monger, 2008
MM
Mt.P
Exploration Undercover: A Practical Example using the QUEST Study Area
Geoscience BC, October 12-14, 2011
Quest – A Tectonic Model?
Thanks to Jim Logan

Exploration Undercover: A Practical Example using the QUEST Study Area
Geoscience BC, October 12-14, 2011
Quest – A Tectonic Model?
Thanks to Jim Logan Thanks to Fionnuala Devine

Exploration Undercover: A Practical Example using the QUEST Study Area
Geoscience BC, October 12-14, 2011
Quest – A Tectonic Model?
Thanks to Fionnuala Devine

Exploration Undercover: A Practical Example using the QUEST Study Area
Geoscience BC, October 12-14, 2011
PNG highlands – Compressional flower structure at bend along sinistral strike-slip plate boundary
Grasberg
Porgera
Porgera
Flower structures and Porphyry/Epithermal Deposits

Exploration Undercover: A Practical Example using the QUEST Study Area
Geoscience BC, October 12-14, 2011
Conclusions • To produce an accurate, applied geological interpretation:
• Think geologically – process/controls when defining
geological elements from aeromagnetic data; • Focus your interpretation with an understanding of
potential controls on the distribution of mineralization first;
• Incorporate reality – structural settings/geometries, known geological relationships in the area (e.g. stratigraphic relationships);
• Define your geological and structural history; and • Incorporate multiple datasets, e.g. existing geological
mapping, drillhole data.


