
International Review of Business Research Papers
Vol. 7. No. 1. January 2011. Pp. 176 – 190
Intra Industry Trade in Textile and Clothing Industry: The Case of Turkey
Bige Kucukefe
In recent decades, IIT has become a striking characteristic of the international trade regime, especially in the manufacturing industry. As in many other developing countries, the TAC industries have played an important role in the industrialization process of Turkey. The aim of this paper is to investigate the level of Intra Industry Trade at the TAC industry in Turkey. For this purpose static and dynamic IIT indices have been calculated. The analysis is based on the annual time series data on TAC exports and imports, extracted from the TUIK data bank. TAC data is at the three digit level of the Standard International Trade Classification (SITC) in U.S. dollars. Grubel-Lloyd (GL) and adjusted Grubel-Lloyd (C) indices have been calculated at SITC, 3 digit levels over the 1989-2008. And also MIIT has been calculated for three periods, 1989-1996, 1996-2001, 2001-2008.
JEL Codes: F12,F14
Keywords: Trade, Turkey, Intra Industry Trade, Marginal Intra Industry Trade
1. Introduction
In the classical trade theories each country is specialized in goods which they have comparative advantages. But normally, these goods were in a different industry, for example wheat and cloth. With an increase exceeding the goods production, today’s
trade is so complex that it can’t be explained by using traditional trade theories. Today countries also exchange their products which belong to the same industry and total world trade increases enormously. Intra-industry trade (IIT) draws attention
among the new trade theories to explain today’s trade. IIT deals with the causes of both export and import of the goods in the same industry by countries.
In recent decades, IIT has become a striking characteristic of the international trade regime, especially in the manufacturing industry. TAC has a significant portion in manufacturing industry. Industrialization began with TAC industry in 19th century.
Since then, TAC has transformed into a large industry. With the assistance of technological changes, products are differentiated within the same industry. Depending on this situation countries simultaneously export and import processed
products increasingly. Similar with other developing countries TAC industry has crucial importance in
Turkey. The industry contributes to around 10 percent of GDP. In spite of decreases, over two and a half million people are employed in TAC industry. However,
Namik Kemal University, Tekirdag,Turkey. [email protected]
Kucukefe
177
unregistered employment rate is very high and especially in clothing industry, firms
are mostly small and medium size enterprises.
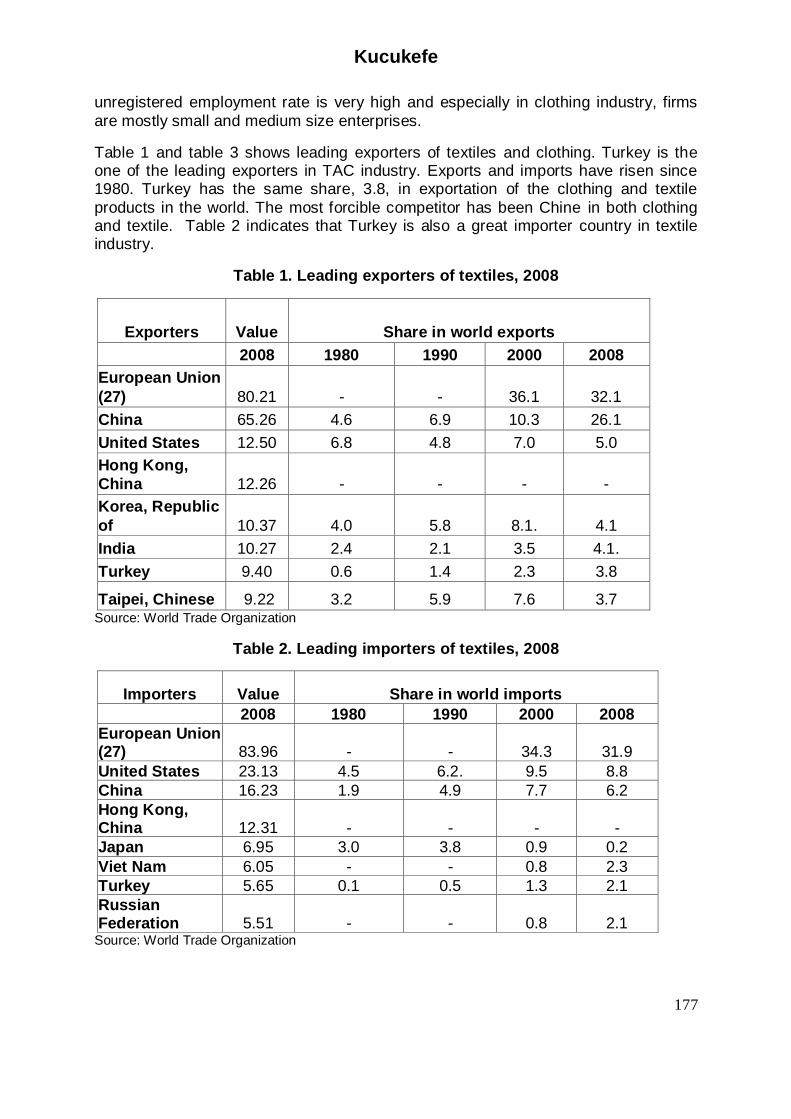
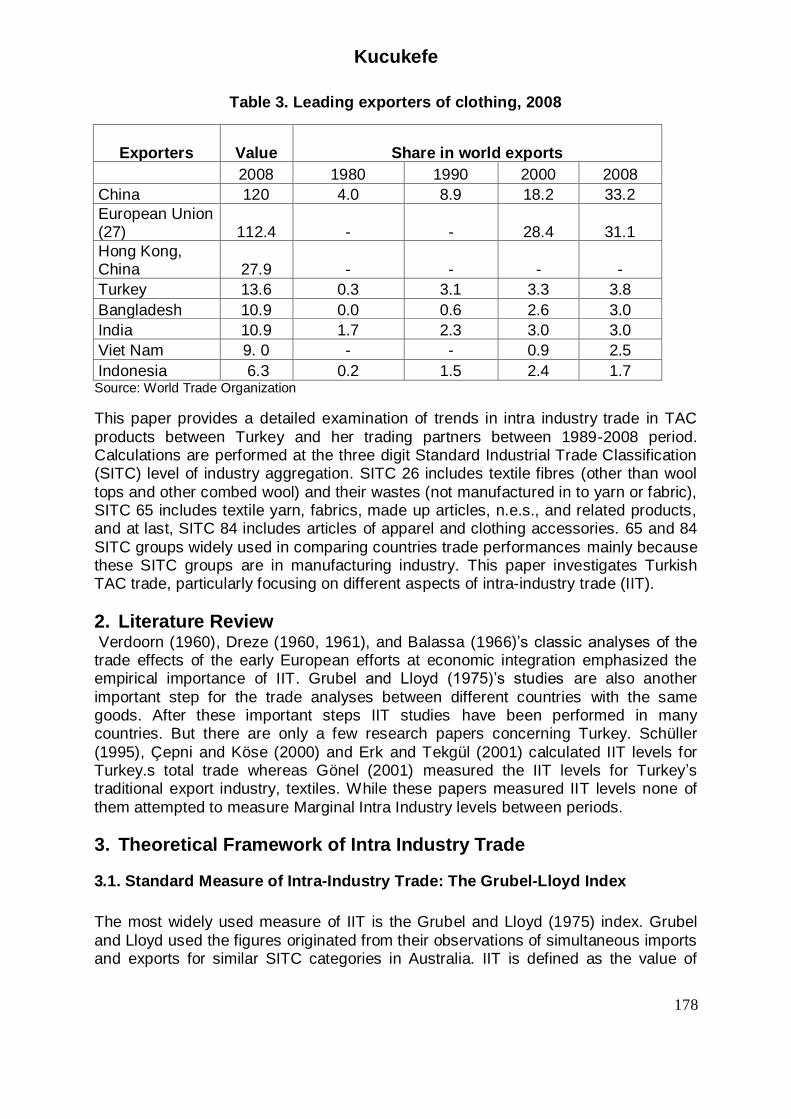
Table 1 and table 3 shows leading exporters of textiles and clothing. Turkey is the one of the leading exporters in TAC industry. Exports and imports have risen since 1980. Turkey has the same share, 3.8, in exportation of the clothing and textile
products in the world. The most forcible competitor has been Chine in both clothing and textile. Table 2 indicates that Turkey is also a great importer country in textile industry.
Table 1. Leading exporters of textiles, 2008
Exporters Value
Share in world exports
2008 1980 1990 2000 2008
European Union
(27) 80.21 - - 36.1 32.1
China 65.26 4.6 6.9 10.3 26.1
United States 12.50 6.8 4.8 7.0 5.0
Hong Kong,
China 12.26 - - - -
Korea, Republic
of 10.37 4.0 5.8 8.1. 4.1
India 10.27 2.4 2.1 3.5 4.1.
Turkey 9.40 0.6 1.4 2.3 3.8
Taipei, Chinese 9.22 3.2 5.9 7.6 3.7 Source: World Trade Organization
Table 2. Leading importers of textiles, 2008
Importers Value Share in world imports
2008 1980 1990 2000 2008
European Union (27) 83.96 - - 34.3 31.9
United States 23.13 4.5 6.2. 9.5 8.8
China 16.23 1.9 4.9 7.7 6.2
Hong Kong, China 12.31 - - - -
Japan 6.95 3.0 3.8 0.9 0.2
Viet Nam 6.05 - - 0.8 2.3
Turkey 5.65 0.1 0.5 1.3 2.1
Russian Federation 5.51 - - 0.8 2.1
Source: World Trade Organization
Kucukefe
178
Table 3. Leading exporters of clothing, 2008
Exporters Value
Share in world exports
2008 1980 1990 2000 2008
China 120 4.0 8.9 18.2 33.2
European Union (27) 112.4 - - 28.4 31.1
Hong Kong, China 27.9 - - - -
Turkey 13.6 0.3 3.1 3.3 3.8
Bangladesh 10.9 0.0 0.6 2.6 3.0
India 10.9 1.7 2.3 3.0 3.0
Viet Nam 9. 0 - - 0.9 2.5
Indonesia 6.3 0.2 1.5 2.4 1.7 Source: World Trade Organization
This paper provides a detailed examination of trends in intra industry trade in TAC
products between Turkey and her trading partners between 1989-2008 period. Calculations are performed at the three digit Standard Industrial Trade Classification (SITC) level of industry aggregation. SITC 26 includes textile fibres (other than wool
tops and other combed wool) and their wastes (not manufactured in to yarn or fabric), SITC 65 includes textile yarn, fabrics, made up articles, n.e.s., and related products, and at last, SITC 84 includes articles of apparel and clothing accessories. 65 and 84
SITC groups widely used in comparing countries trade performances mainly because these SITC groups are in manufacturing industry. This paper investigates Turkish TAC trade, particularly focusing on different aspects of intra-industry trade (IIT).
2. Literature Review Verdoorn (1960), Dreze (1960, 1961), and Balassa (1966)’s classic analyses of the trade effects of the early European efforts at economic integration emphasized the empirical importance of IIT. Grubel and Lloyd (1975)’s studies are also another
important step for the trade analyses between different countries with the same goods. After these important steps IIT studies have been performed in many countries. But there are only a few research papers concerning Turkey. Schüller
(1995), Çepni and Köse (2000) and Erk and Tekgül (2001) calculated IIT levels for Turkey.s total trade whereas Gönel (2001) measured the IIT levels for Turkey’s traditional export industry, textiles. While these papers measured IIT levels none of
them attempted to measure Marginal Intra Industry levels between periods.
3. Theoretical Framework of Intra Industry Trade
3.1. Standard Measure of Intra-Industry Trade: The Grubel-Lloyd Index
The most widely used measure of IIT is the Grubel and Lloyd (1975) index. Grubel
and Lloyd used the figures originated from their observations of simultaneous imports and exports for similar SITC categories in Australia. IIT is defined as the value of
Kucukefe
179
exports of an industry which is exactly matched by the imports of the same industry
according to the Grubel-Lloyd, that is,
MiXiMiXiRi )( (1)
where and are the value of the exports and imports of industry valued in the
home countries currency and = 1,...n, where n is the number of studies at a chosen
level of aggregation (Grubel-Lloyd, 1975)
Grubel-Lloyd, to facilitate comparisons of these measures for different industries, express them as a percentage of each industry’s combined exports and imports,
100.1MiXi
MiXiGL (2)
Grubel-Lloyd used relative size of exports plus imports of each industry as weights and at the same level of aggregation the industry indices:
100.n
i
n
i
MiXi
MiXiBi
GL 100.n
i
n
i
n
i
MiXi
MiXiMiXi
(3)
Both measures vary between 0 and 100. When the exports are exactly equal to the
imports of an industry all trade is IIT and the indices is 100. İf there is no IIT, GL takes the value of 100.
Equation 2 measures average IIT as a percentage of the total trade. Grubel- Lloyd indicates that this equation also equals to the sum of the IIT for the industries as a percentage of the total export plus import trade of the n industries:
100.n
i
n
i
MiXi
MiXiMiXi
GL (4)
Adjusted Grubel-Lloyd indices are used for if there is a total trade imbalance in a country:
100.n
i
n
i
n
i
n
i
n
i
MiXiMiXi
MiXiMiXi
Ci (5)

Kucukefe
180
It is also argued that Grubel- Lloyd index is a static measure only captures the trade
patterns at one time and doesn’t change over time. For a dynamic measurement Marginal Intra Industry Trade is used.
3.2. Marginal Intra Industry Trade
Marginal Intra Industry Trade (MIIT) is important for measuring dynamic phenomena and recent theoretical developments use (MIIT) in the context of trade liberalization
and adjustment costs (Hamilton and Kniest, 1991; Greenaway et al., 1994; Brulhart, 1994, 1999 and 2000; Thom–McDowell, 1999). In traditional IIT index can remain constant even as the volume of IIT expands. MIIT index shows us how much of the
change in the volume of trade between two periods is IIT. There are several indices for MIIT. But Brulhart (1994) index is most commonly used in recent empirical studies.
MX
MXB *100 (6)
This coefficient can take values ranging between –100 and 100. It is two-
dimensional, containing information about both the proportion of MIIT and country-specific sectoral performance. First, the closer B is to zero, the higher is MIIT,
whereas at both –100 and 100 it represents marginal trade as being entirely of the
inter-industry type. Second, sectoral performance is defined as the change in exports and imports in relation to each other. When B > 0, ΔX was > ΔM, the opposite holds for B < 0. Unlike the A index, B cannot be meaningfully aggregated across industries.
Therefore, B cannot be used for summary statistics resulting from calculations on a
disaggregated level. Its applicability is thus confined to the industry-by-industry assessment of MIIT and performance.
Trade performance is particularly relevant where MIIT is low, that is, where inter-industry change dominates. We say that the marginal intra-industry trade measured using B index can reflect a country’s specialization " into" or "out of" a particular
industry. If, in a certain industry, exports expand faster (or contract more slowly) than imports, this means that the country specializes in this particular activity. Accordingly,
a country specializes in other industries when the opposite composition of trade exists (Brülhart, 1999).
4. Turkish Intra Industry Trade In Tac Products: Empirical Results
As analyzing our IIT figures we take into account the following cases: • In 1989, liberalization is mainly finalized in many areas in Turkey • In 1996 , Turkey joined European Customs Union,
• In November 2000 and February 2001, Turkey experienced two severe economic crisis.

Kucukefe
181
4.1. The Grubel Lloyd IIT Results:
The analysis of Turkish IIT in TAC products is based on Grubel-Lloyd (GL) and adjusted Grubel-Lloyd (C) indices, calculated at SITC, 3 digit levels. These
subgroups are SITC-26 which is made up of textile fibers (other than wool tops) and their wastes, SITC-65 made up of textile yarn, fabrics, made up articles, n.e.s related products and SITC-84 made up of apparel and clothing accessories. GL indices of IIT
for Turkish TAC trade were calculated by: a) IIT between Turkey and the world in total TAC industry, b) GL index per SITC category between 1989-2008 years.
Figure 1: Grubel-Lloyd index SITC 26 level in Textile industry
Source: Own calculations based on TurkStat database

Kucukefe
182
Figure 2: Adjusted Grubel-Lloyd index SITC 26 level in Textile Industry
Source: Own calculations based on TurkStat database
SITC 26 product groups include these three digit groups.
261 - Silk 263 - Cotton
264 - Jute and other textile bast fibres, n.e.s., raw or processed but not spun; tow and waste of these fibres (including yarn waste and garnetted stock)
265 - Vegetable textile fibres (other than cotton and jute), raw or processed
but not spun; waste of these fibres 266 - Synthetic fibres suitable for spinning 267 - Other man-made fibres suitable for spinning; waste of man-made fibres
268 - Wool and other animal hair (including wool tops) 269 - Worn clothing and other worn textile articles; rags
The difference between GL and Adjusted GL indexes can be seen at Figure 1 and
Figure 2 clearly. Adjusted GL reduced fluctuations comparing with GL in Figure 2 and Adjusted GL values are higher than GL values. Adjusted GL oscillated around 90. There has been trade gap in this level since 1989. As depicted in Table 1 highest
GL index is 98.8 in the SITC 266 group.
Kucukefe
183
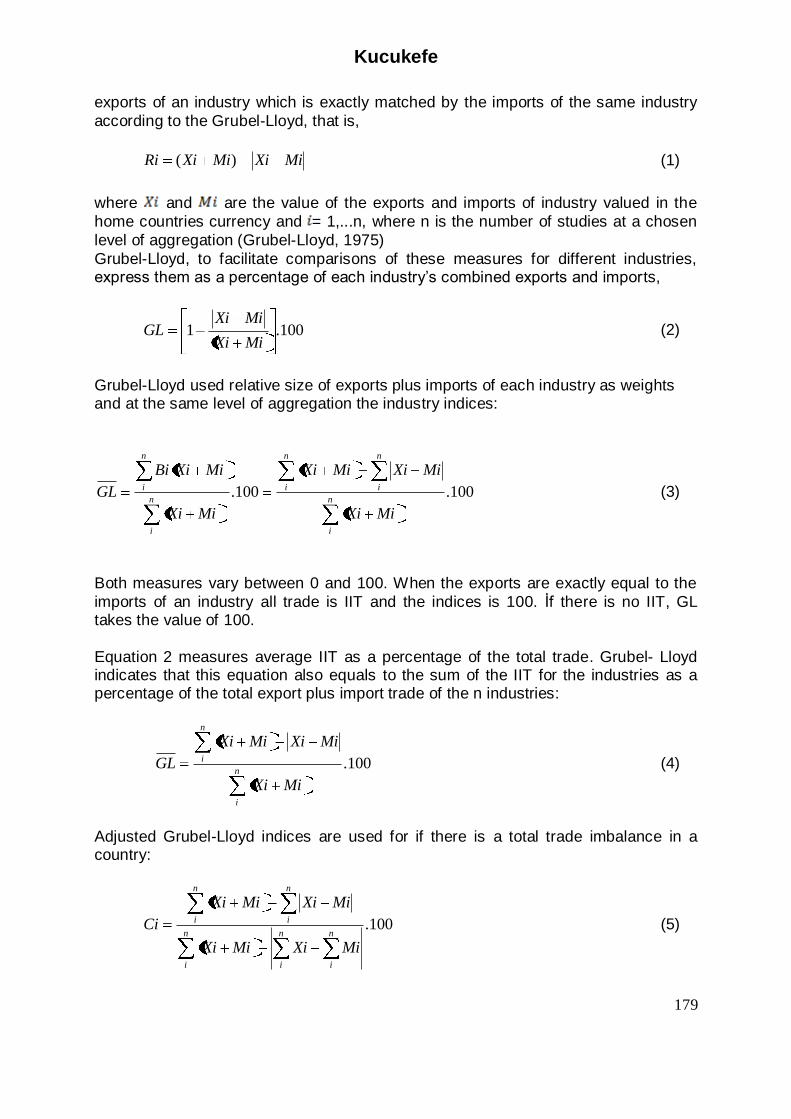
Figure 3: Grubel-Lloyd index SITC 65 level in Textile industry
Source: Own calculations based on TurkStat database
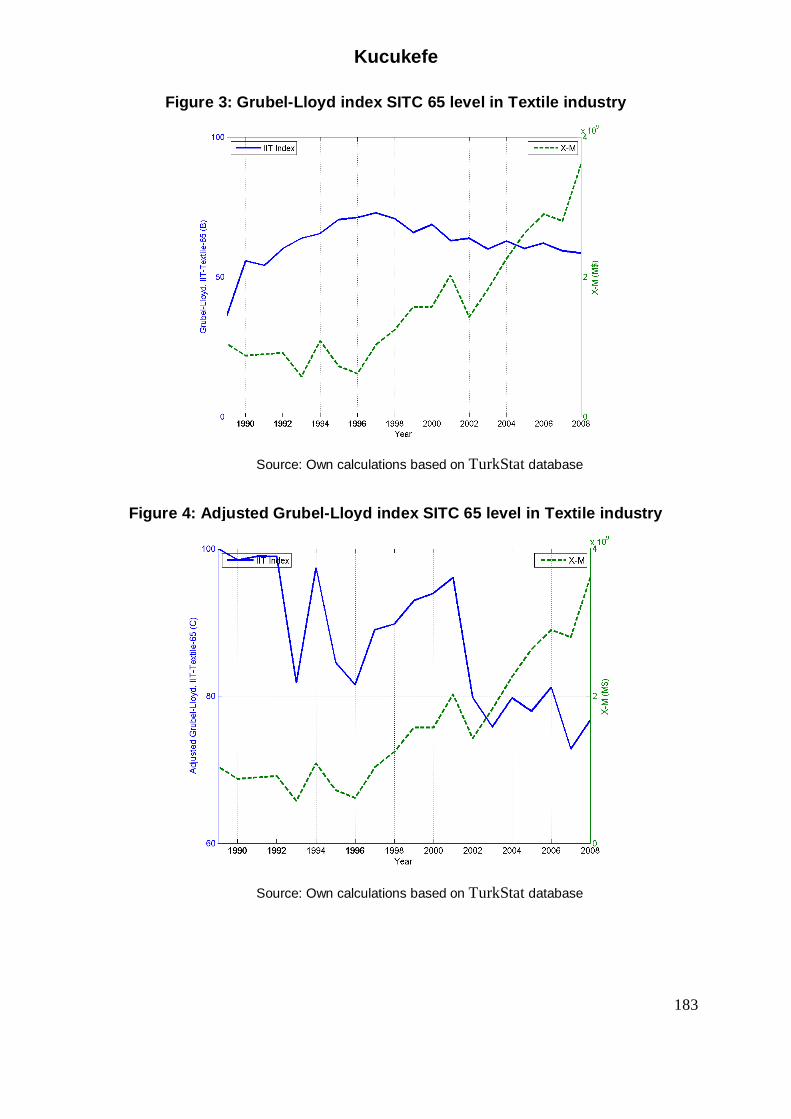
Figure 4: Adjusted Grubel-Lloyd index SITC 65 level in Textile industry
Source: Own calculations based on TurkStat database
Kucukefe
184
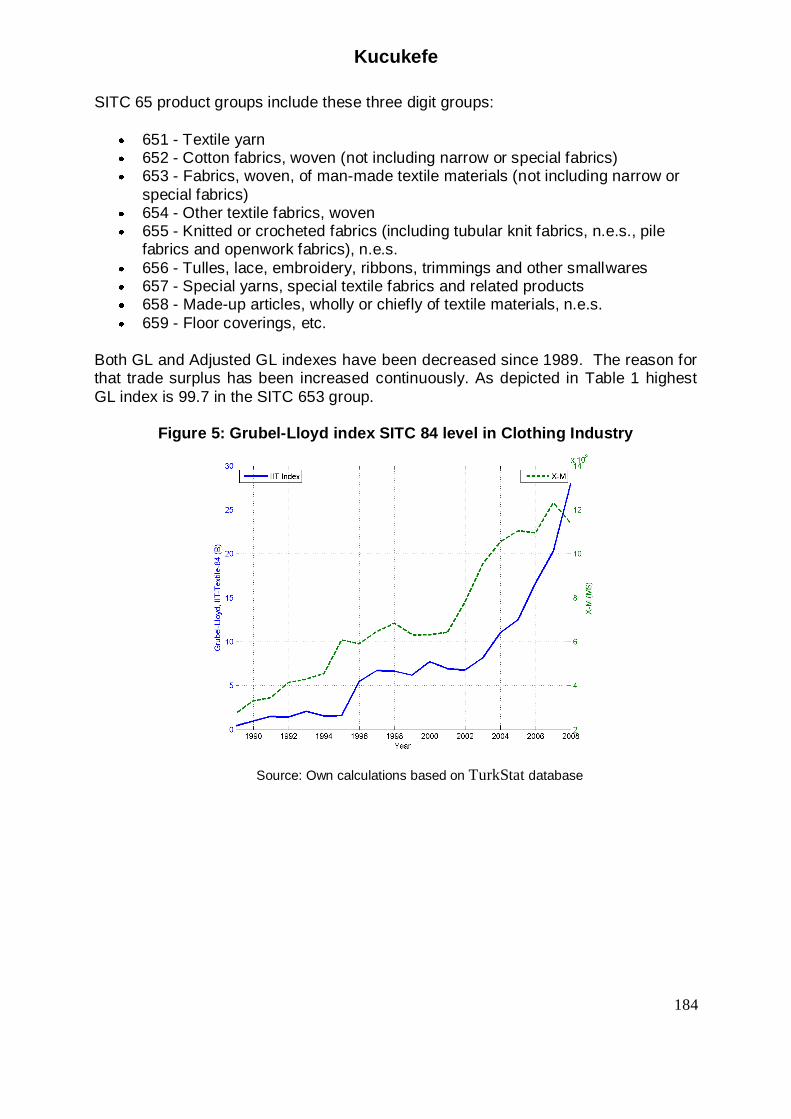
SITC 65 product groups include these three digit groups:
651 - Textile yarn 652 - Cotton fabrics, woven (not including narrow or special fabrics) 653 - Fabrics, woven, of man-made textile materials (not including narrow or
special fabrics) 654 - Other textile fabrics, woven 655 - Knitted or crocheted fabrics (including tubular knit fabrics, n.e.s., pile
fabrics and openwork fabrics), n.e.s.
656 - Tulles, lace, embroidery, ribbons, trimmings and other smallwares 657 - Special yarns, special textile fabrics and related products 658 - Made-up articles, wholly or chiefly of textile materials, n.e.s.
659 - Floor coverings, etc.
Both GL and Adjusted GL indexes have been decreased since 1989. The reason for that trade surplus has been increased continuously. As depicted in Table 1 highest
GL index is 99.7 in the SITC 653 group.
Figure 5: Grubel-Lloyd index SITC 84 level in Clothing Industry
Source: Own calculations based on TurkStat database
Kucukefe
185
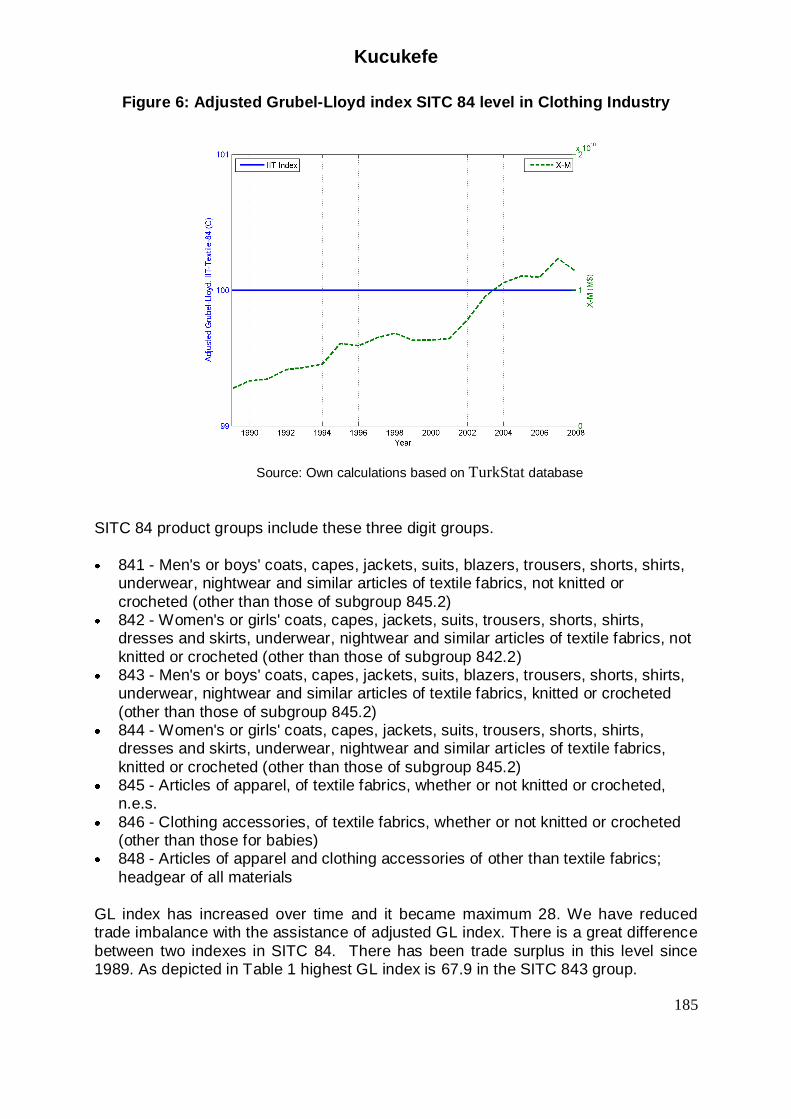
Figure 6: Adjusted Grubel-Lloyd index SITC 84 level in Clothing Industry
Source: Own calculations based on TurkStat database
SITC 84 product groups include these three digit groups.
841 - Men's or boys' coats, capes, jackets, suits, blazers, trousers, shorts, shirts, underwear, nightwear and similar articles of textile fabrics, not knitted or
crocheted (other than those of subgroup 845.2) 842 - Women's or girls' coats, capes, jackets, suits, trousers, shorts, shirts,
dresses and skirts, underwear, nightwear and similar articles of textile fabrics, not
knitted or crocheted (other than those of subgroup 842.2) 843 - Men's or boys' coats, capes, jackets, suits, blazers, trousers, shorts, shirts,
underwear, nightwear and similar articles of textile fabrics, knitted or crocheted
(other than those of subgroup 845.2) 844 - Women's or girls' coats, capes, jackets, suits, trousers, shorts, shirts,
dresses and skirts, underwear, nightwear and similar articles of textile fabrics,
knitted or crocheted (other than those of subgroup 845.2) 845 - Articles of apparel, of textile fabrics, whether or not knitted or crocheted,
n.e.s.
846 - Clothing accessories, of textile fabrics, whether or not knitted or crocheted (other than those for babies)
848 - Articles of apparel and clothing accessories of other than textile fabrics;
headgear of all materials
GL index has increased over time and it became maximum 28. We have reduced trade imbalance with the assistance of adjusted GL index. There is a great difference
between two indexes in SITC 84. There has been trade surplus in this level since 1989. As depicted in Table 1 highest GL index is 67.9 in the SITC 843 group.
Kucukefe
186
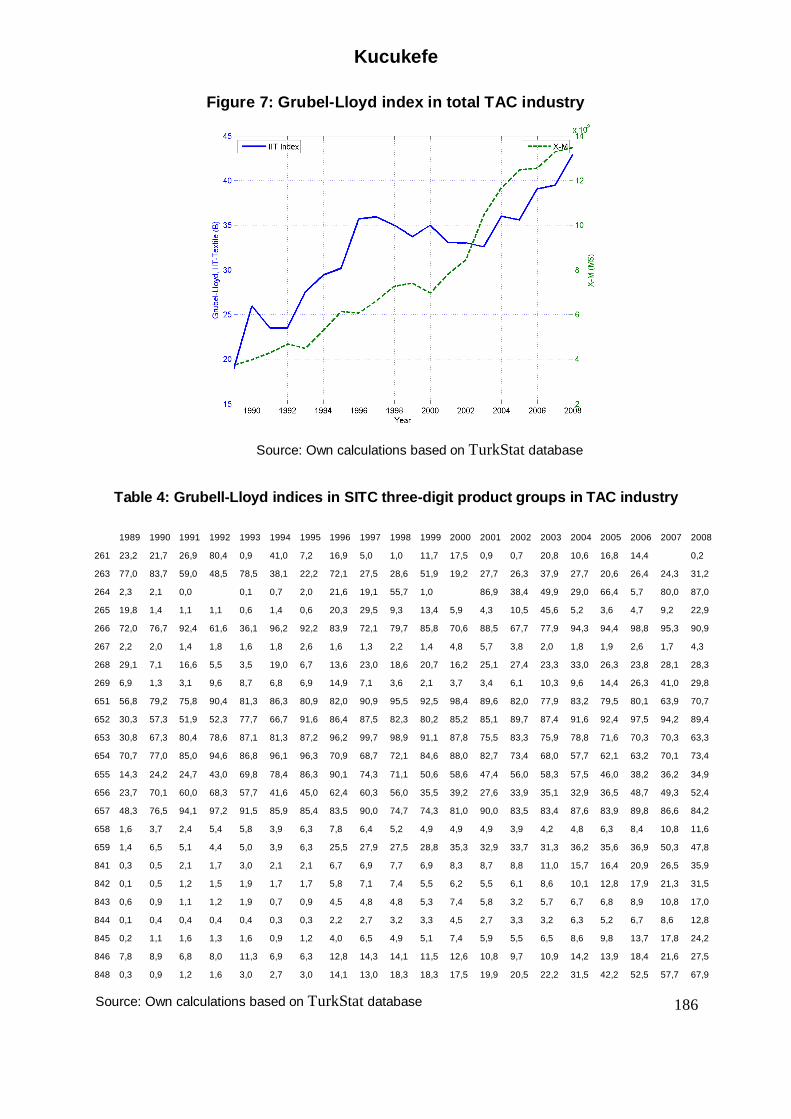
Figure 7: Grubel-Lloyd index in total TAC industry
Source: Own calculations based on TurkStat database
Table 4: Grubell-Lloyd indices in SITC three-digit product groups in TAC industry
1989 1990 1991 1992 1993 1994 1995 1996 1997 1998 1999 2000 2001 2002 2003 2004 2005 2006 2007 2008
261 23,2 21,7 26,9 80,4 0,9 41,0 7,2 16,9 5,0 1,0 11,7 17,5 0,9 0,7 20,8 10,6 16,8 14,4
0,2
263 77,0 83,7 59,0 48,5 78,5 38,1 22,2 72,1 27,5 28,6 51,9 19,2 27,7 26,3 37,9 27,7 20,6 26,4 24,3 31,2
264 2,3 2,1 0,0
0,1 0,7 2,0 21,6 19,1 55,7 1,0
86,9 38,4 49,9 29,0 66,4 5,7 80,0 87,0
265 19,8 1,4 1,1 1,1 0,6 1,4 0,6 20,3 29,5 9,3 13,4 5,9 4,3 10,5 45,6 5,2 3,6 4,7 9,2 22,9
266 72,0 76,7 92,4 61,6 36,1 96,2 92,2 83,9 72,1 79,7 85,8 70,6 88,5 67,7 77,9 94,3 94,4 98,8 95,3 90,9
267 2,2 2,0 1,4 1,8 1,6 1,8 2,6 1,6 1,3 2,2 1,4 4,8 5,7 3,8 2,0 1,8 1,9 2,6 1,7 4,3
268 29,1 7,1 16,6 5,5 3,5 19,0 6,7 13,6 23,0 18,6 20,7 16,2 25,1 27,4 23,3 33,0 26,3 23,8 28,1 28,3
269 6,9 1,3 3,1 9,6 8,7 6,8 6,9 14,9 7,1 3,6 2,1 3,7 3,4 6,1 10,3 9,6 14,4 26,3 41,0 29,8
651 56,8 79,2 75,8 90,4 81,3 86,3 80,9 82,0 90,9 95,5 92,5 98,4 89,6 82,0 77,9 83,2 79,5 80,1 63,9 70,7
652 30,3 57,3 51,9 52,3 77,7 66,7 91,6 86,4 87,5 82,3 80,2 85,2 85,1 89,7 87,4 91,6 92,4 97,5 94,2 89,4
653 30,8 67,3 80,4 78,6 87,1 81,3 87,2 96,2 99,7 98,9 91,1 87,8 75,5 83,3 75,9 78,8 71,6 70,3 70,3 63,3
654 70,7 77,0 85,0 94,6 86,8 96,1 96,3 70,9 68,7 72,1 84,6 88,0 82,7 73,4 68,0 57,7 62,1 63,2 70,1 73,4
655 14,3 24,2 24,7 43,0 69,8 78,4 86,3 90,1 74,3 71,1 50,6 58,6 47,4 56,0 58,3 57,5 46,0 38,2 36,2 34,9
656 23,7 70,1 60,0 68,3 57,7 41,6 45,0 62,4 60,3 56,0 35,5 39,2 27,6 33,9 35,1 32,9 36,5 48,7 49,3 52,4
657 48,3 76,5 94,1 97,2 91,5 85,9 85,4 83,5 90,0 74,7 74,3 81,0 90,0 83,5 83,4 87,6 83,9 89,8 86,6 84,2
658 1,6 3,7 2,4 5,4 5,8 3,9 6,3 7,8 6,4 5,2 4,9 4,9 4,9 3,9 4,2 4,8 6,3 8,4 10,8 11,6
659 1,4 6,5 5,1 4,4 5,0 3,9 6,3 25,5 27,9 27,5 28,8 35,3 32,9 33,7 31,3 36,2 35,6 36,9 50,3 47,8
841 0,3 0,5 2,1 1,7 3,0 2,1 2,1 6,7 6,9 7,7 6,9 8,3 8,7 8,8 11,0 15,7 16,4 20,9 26,5 35,9
842 0,1 0,5 1,2 1,5 1,9 1,7 1,7 5,8 7,1 7,4 5,5 6,2 5,5 6,1 8,6 10,1 12,8 17,9 21,3 31,5
843 0,6 0,9 1,1 1,2 1,9 0,7 0,9 4,5 4,8 4,8 5,3 7,4 5,8 3,2 5,7 6,7 6,8 8,9 10,8 17,0
844 0,1 0,4 0,4 0,4 0,4 0,3 0,3 2,2 2,7 3,2 3,3 4,5 2,7 3,3 3,2 6,3 5,2 6,7 8,6 12,8
845 0,2 1,1 1,6 1,3 1,6 0,9 1,2 4,0 6,5 4,9 5,1 7,4 5,9 5,5 6,5 8,6 9,8 13,7 17,8 24,2
846 7,8 8,9 6,8 8,0 11,3 6,9 6,3 12,8 14,3 14,1 11,5 12,6 10,8 9,7 10,9 14,2 13,9 18,4 21,6 27,5
848 0,3 0,9 1,2 1,6 3,0 2,7 3,0 14,1 13,0 18,3 18,3 17,5 19,9 20,5 22,2 31,5 42,2 52,5 57,7 67,9
Source: Own calculations based on TurkStat database

Kucukefe
187
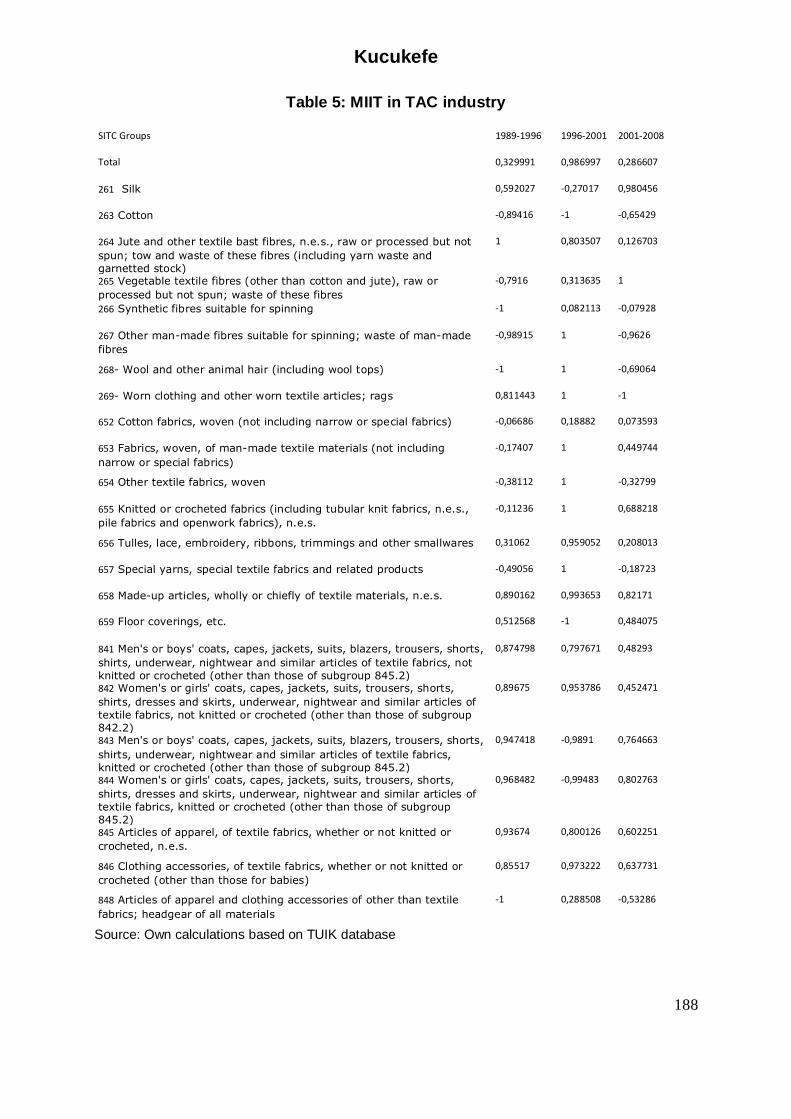
4.2 Marginal Intra Industry Trade Results
The data are supplied by the TUIK at the two digit level of the Standard International Trade Classification (SITC) in U.S. dollars. We calculate MIIT for three periods, 1989-
1996, 1996-2001, 2001-2008. By this way we can see the influence of liberalization, European Customs Union and economic crisis on IIT. In 1989-1996 period 652, 653, 654, 655, 656, 657, 659 SITC product groups IIT index rates are between -50 and
50. In 1996-2001, 261, 265, 652, 848 SITC groups shows IIT nature. In 2001-2008, 264, 266, 652, 653, 654, 656, 657, 659, 841, 842 MIIT absolute values are low and in these sectors trade structure is in Intra Industry Trade type.
Kucukefe
188
Table 5: MIIT in TAC industry
SITC Groups 1989-1996 1996-2001 2001-2008
Total 0,329991 0,986997 0,286607
261 Silk 0,592027 -0,27017 0,980456
263 Cotton -0,89416 -1 -0,65429
264 Jute and other textile bast fibres, n.e.s., raw or processed but not
spun; tow and waste of these fibres (including yarn waste and
garnetted stock)
1 0,803507 0,126703
265 Vegetable textile fibres (other than cotton and jute), raw or
processed but not spun; waste of these fibres
-0,7916 0,313635 1
266 Synthetic fibres suitable for spinning -1 0,082113 -0,07928
267 Other man-made fibres suitable for spinning; waste of man-made
fibres
-0,98915 1 -0,9626
268- Wool and other animal hair (including wool tops) -1 1 -0,69064
269- Worn clothing and other worn textile articles; rags 0,811443 1 -1
652 Cotton fabrics, woven (not including narrow or special fabrics) -0,06686 0,18882 0,073593
653 Fabrics, woven, of man-made textile materials (not including
narrow or special fabrics)
-0,17407 1 0,449744
654 Other textile fabrics, woven -0,38112 1 -0,32799
655 Knitted or crocheted fabrics (including tubular knit fabrics, n.e.s.,
pile fabrics and openwork fabrics), n.e.s.
-0,11236 1 0,688218
656 Tulles, lace, embroidery, ribbons, trimmings and other smallwares 0,31062 0,959052 0,208013
657 Special yarns, special textile fabrics and related products -0,49056 1 -0,18723
658 Made-up articles, wholly or chiefly of textile materials, n.e.s. 0,890162 0,993653 0,82171
659 Floor coverings, etc. 0,512568 -1 0,484075
841 Men's or boys' coats, capes, jackets, suits, blazers, trousers, shorts,
shirts, underwear, nightwear and similar articles of textile fabrics, not
knitted or crocheted (other than those of subgroup 845.2)
0,874798 0,797671 0,48293
842 Women's or girls' coats, capes, jackets, suits, trousers, shorts,
shirts, dresses and skirts, underwear, nightwear and similar articles of
textile fabrics, not knitted or crocheted (other than those of subgroup
842.2)
0,89675 0,953786 0,452471
843 Men's or boys' coats, capes, jackets, suits, blazers, trousers, shorts,
shirts, underwear, nightwear and similar articles of textile fabrics,
knitted or crocheted (other than those of subgroup 845.2)
0,947418 -0,9891 0,764663
844 Women's or girls' coats, capes, jackets, suits, trousers, shorts,
shirts, dresses and skirts, underwear, nightwear and similar articles of
textile fabrics, knitted or crocheted (other than those of subgroup
845.2)
0,968482 -0,99483 0,802763
845 Articles of apparel, of textile fabrics, whether or not knitted or
crocheted, n.e.s.
0,93674 0,800126 0,602251
846 Clothing accessories, of textile fabrics, whether or not knitted or
crocheted (other than those for babies)
0,85517 0,973222 0,637731
848 Articles of apparel and clothing accessories of other than textile
fabrics; headgear of all materials
-1 0,288508 -0,53286
Source: Own calculations based on TUIK database
Kucukefe
189
5. Conclusions
TAC industry is very important for Turkey because industrialization began with this industry in Turkey. Between 1980 and 1990, TAC industry opened to the foreign
markets. In 1990’s TAC industry has made high export performance. The sector after 1995 European Customs Union agreement allowed free access to EU market. After the cancellation of the all restrictions with the Agreement on Textiles and Clothing in
TAC products on January 1, 2005, China strengthened its position in the market. We can see the affects of China especially in raw materials, SITC 26. In conclusion of our analysis in TAC industry has a trade structure in accordance with intra-industry
trade.
MIIT is calculated for three periods, 1989-1996, 1996-2001, and 2001-2008. In 1989-
1996 period 7 product groups; in 1996-2001 period, 2 product groups; 2001-2008 period 7 product groups shows IIT nature. In 1989-1996 period 14, 1996-2001 period 19, 2001-2008 period 16 product groups shows good export performance. 1996,
joining European Customs Union and 2001, economic crisis increased intra industry trade.
References
Balassa, B 1966, ‘Tariff Reductions and Trade in Manufactures Among the Industrial Countries’, American Economic Review, vol. 56, no. 3, pp. 466-473.
Brulhart, M 1994, ‘Marginal intra-industry trade: Measurement and the relevance for the pattern of industrial adjustment’, Weltwirtschaftliches Archiv, vol. 130, no. 3, pp. 600-613.
Brulhart, M 1999, ‘Marginal intra-industry trade and trade-induced adjustment: A survey’, in M Brulhart & MRC Hine (eds.), Intra-Industry Trade and Adjustment. The European Experience, Macmillan, Basingstoke, Hampshire, pp. 36-69.
Çepni, E & Kose, N 2000, ‘Intra-industry Trade Patterns of Turkey: A Panel Study’, METU International Conference in Economics IV, Ankara, 13-16 September.
Dogruel, S & Dogruel, F 2008, Türkiye Sanayi’ne Sektörel Bakış, Report no:
TÜSİAD-T/2008-05/466, Tüsiad.
Dreze, J 1960, ‘Quelques Réflexions Sereines sur l’Adaptation de l’Industrie Belge au Marché Commun’, Comptes-rendus des Travaux de la Société d’Economie Politique de Belgique, p.275.
Dreze, J 1961, ‘Les Exportations intra-CEE en 1958 et la Position Belge’, Recherches Economiques de Louvain, vol. 27, pp. 717-738.
Erk, N & Tekgul, Y 2001, ‘Ekonomik Entegrasyon ve Endüstri-içi Ticaret: Türkiye-AB Ülkeleri Arasindaki Endüstri-içi Ticaretin Ölçülmesi ve Ticaret Tipinin Belirlenmesi’, METU International Conference in Economics V, Ankara, 10-13
September. Greenaway, D, Hine, R & Milner, C 1995, ‘Vertical and horizontal intra-industry trade:
A cross industry analysis for the United Kingdom’, Economic Journal, vol. 105,
pp. 1505-1518.
Kucukefe
190
Greenaway, D, Hine, R, Milner, C & Elliott, R 1994, ‘Adjustment and the measurement of marginal intra-industry trade’, Weltwirtschaftliches Archiv, vol. 130, no. 2, pp. 418-427.
Greenaway, D & Milner, C 1981, ‘Trade imbalance effects and the measurement of intra-industry trade’, Weltwirtschaftliches Archiv, vol. 117, no. 4, pp. 756-762.
Greenaway, D & Milner, C 1983, ‘On the measurement of intra-industry trade’, Economic Journal, vol. 93, pp. 900-908.
Greenaway, D & Milner, C 2003, ‘What have we learned from a generation’s research on intra industry trade’, in Leverhulme Centre for Research on Globalization and Economic Policy (ed.), GEP Research Paper, 2002/44.
Greenaway, D, Milner, C & Elliott, RJR 1999, ‘UK intra-industry trade with EU North and South’, Oxford Bulletin of Economics and Statistics, vol. 61, no. 3, pp. 365-
384. Greenaway, D & Milner, C 1986, The economics of intra-industry trade, Basil
Blackwell, Oxford. Gonel, FD 2001, ‘Tekstil Sektöründe Endüstri-içi Ticaret’, Diş Ticaret Dergisi, vol. 6,
no. 21, pp. 15-31. Grubel, HG & Lloyd, PJ 1975, Intra-industry trade: The theory and measurement of
international trade in differentiated products, Wiley, London and New York.
Schuller, MK 1995, ‘The Path of Intra-industry Trade Expansion: The Cases of Spain and Turkey’, METU Studies in Development, vol. 22, pp. 79-99.
Verdoorn, PJ 1960, ‘The Intra-Bloc Trade of BENELUX’, in EAG Robinson (ed.), Economic Consequences of the Size of Nations, Macmillan, London, pp. 291-
329.


