Download - Introduction - amar.org.ir

IRAN STATISTICAL YEARBOOK 1397 7. OIL & GAS
305
Introduction
ince oil, gas, and petrochemical industries
play a vital role in Iran's economy, the data on them are presented in an exclusive chapter.The Iranian oil industry came to existence by the exploitation of gas and oil from the first oil well in Masjed Soleyman (south-western Iran) in the year 1287 (1908) on which data are available. After the nationalization of the oil industry in the Month of Esfand of the year 1329, the National Iranian Oil Company (NIOC) managed to release some more data. The data furnished by the NIOC for the year 1334 were reflected in the first statistical yearbook of Iran. Also, the National Iranian Gas Company (NIGC), established in the year 1344, and the National Iranian Liquefied Gas Company (NILGC), established in the year 1366, have been regularly releasing data on liquefied natural gas (LNG) and liquefied petroleum gas (LPG), respectively. The start of the first fertilizer plant in the year 1342 was an introduction to the establishment of the National Petrochemical Company in the year 1343. Because of the abundant resources of oil and gas available in the country, the high value-added of the industry‚ and some other factors, the production of chemicals and petrochemicals has received great attention.
The statistics appearing in this chapter are currently provided by the Deputy for Planning of the ministry of oil. It is worth mentioning, in addition to the statistics in this chapter, some statistics about oil and gas appeared in Chapter 24 (International Statistics) which is provided by the Organization of the Petroleum Exporting Countries (OPEC)1. Definitions and concepts
Crude oil: is a complicated mixture of hydrocarbons that are extracted from natural underground reservoirs in some regions in the world. Crude petroleum mainly consists of saturated and unsaturated aliphatic hydrocarbons and some aromatic materials. In addition to hydrogen and carbon that are the main constituents of oil, it also contains nitrogen, oxygen, sulphur, and metals such as nickel, sodium, vanadium and iron as well. As a result of
the changes in the amount of these elements, the physical and chemical properties of crude oil is very variant. Kerosene: is part of crude oil consisting of paraffin, petroleum and aromatic hydrocarbons, this product is used as heating and thermal power generation fuel and is one of the main constituents of jet fuel. Fuel oil: is a residual substance obtained from the distillation of crude oil in refineries. Because of its heavy hydrocarbon content, this product does not burn easily. It is one of the main fuels for ships and large manufacturing establishments including power generation plants. Gas oil: is a product obtained from the separation of kerosene from crude petroleum, this product is used as fuel for agricultural and industrial machinery and public transport vehicles and for thermal installations.
Motor spirit: is a mixture of isomerized and circular hydrocarbons with different concentrations, to which certain organic compounds are added for easy burning. Jet fuel: is used as engine fuel for fighter and passenger aircraft. It is produced in different types in terms of a mixture of high quality burning oil and other light oil products (Naphtha) with some additives to prevent rusting, reduce the risk of icing, etc. In international standards, it is known as JP42 and ATK3. Enriched gas (Natural gas): refers to the gas obtained from oil and gas reservoirs, available as associated gas or cap gas (such as gas extracted from Aghajari gas field), non-associated gas (such as Sarakhs and Sarkhun gas). Sweet gas: enriched (natural) gas is turned into sweet gas after separation and refinement The separation means the separation of liquids and gaseous impurities from enriched gas. Liquefied gas: is a mixture of normal butane and propane, the proportion of which changes under environmental conditions and utilization and becomes liquid under a pressure of about 100-110 pounds per square inch. Gas injection: is gas and/or water injected into oil reservoir for optimum utilization and preservation of resources.
S
1) Organization of petroleum exporting countries.
2. Jet propellant. 3. Aviation turbine kerosene.

IRAN STATISTICAL YEARBOOK 1397 7. OIL & GAS
306
Gas customer: is the natural or legal person whose characteristics have been registered and who has been given a customer number after his/her submission of required documents and payment of related costs based on a formal procedure for admission of the natural gas applicant. Gas consumer: is the customers whose gas connection is made after passing the stages of the subscription. Gas extension: refers to the lines which have been extended from transmission, feeding and network lines into the customer's private station.
Polymer: refers to heavy molecules with high carbon made out of molecules with low carbon in compositions of unsaturated paraffin hydrocarbons. Types of the polymer include: (a) Major: polyethylenes, PVC, polypropylene, polystyrene, melamine crystal, polyesters, PET, and ABS. (b) Engineering: polycarbonate and epoxy. (c) Rubbers: styrene-butadiene and polybutadiene, rubber. Chemicals (a) Basics include ethylene, propylene,
methanol, butadiene, C4 cut, butene-1. (b) Intermediates include ethylene oxide,
ethylene glycols, acetic acid, vinyl acetate, EDC, VCM, ethanol amine, 2-ethyl-hexanol and butanols.
Fertilizers, pesticides and related materials (a) Fertilizers include urea, ammonium
nitrate, diammonium phosphate, ammonium sulphate.
(b) Pesticides include alachlor, butachlor. (c) Related materials include ammonia, nitric
acid, phosphoric acid, sulphuric acid, sulphur, chloroacetyl chloride.
(d) Minerals include light and dense sodium carbonate, sodium bicarbonate, argon, perchlorin, hydrochloric acid, chlorine (liquid), caustic soda, sodium hypochlorite, ammonium nitrate (explosive).
Aromatics: are unsaturated cyclic hydrocarbons consisting of one or more benzene rings (a six–carbon ring with three double bonds). Aromatics include benzene, toluene, mixed xylenes, p-xylene, o-xylene, ethyl benzene, monomer styrene and PTA. Fuel: includes propane, butane, pentane plus, pentane, pyrolysis gasoline, C4 raffinate, C6 raffinate, C.F.O, and MTBE.
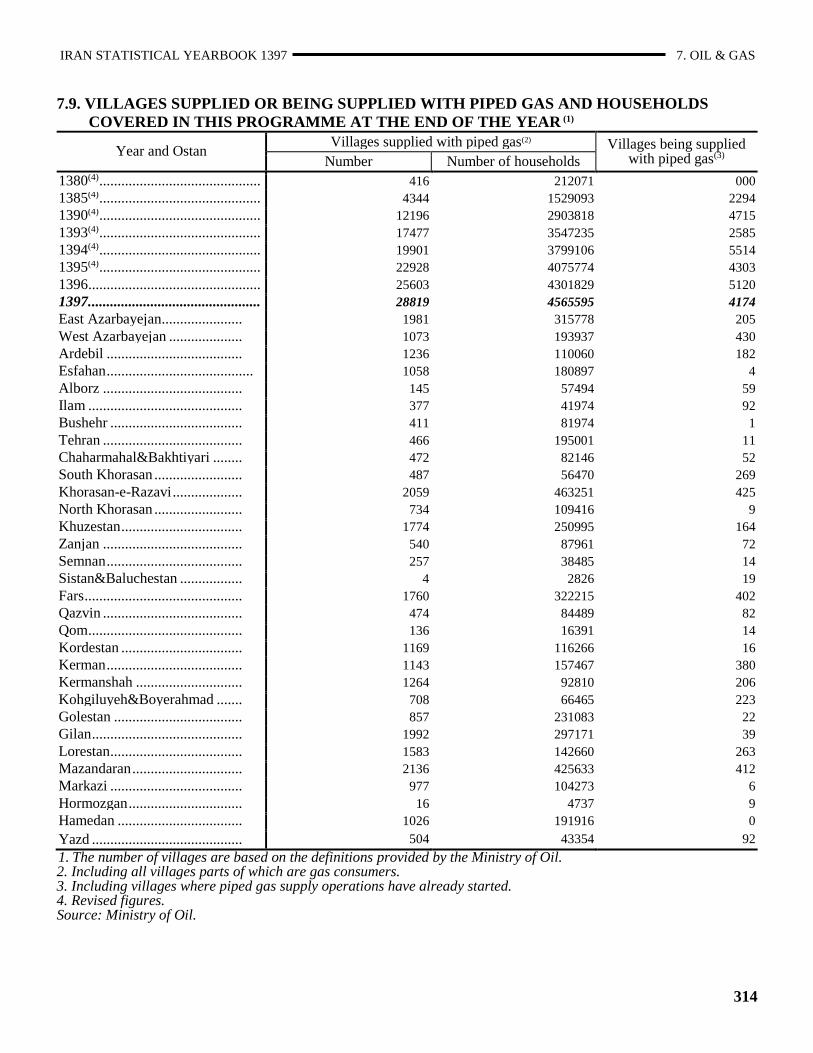
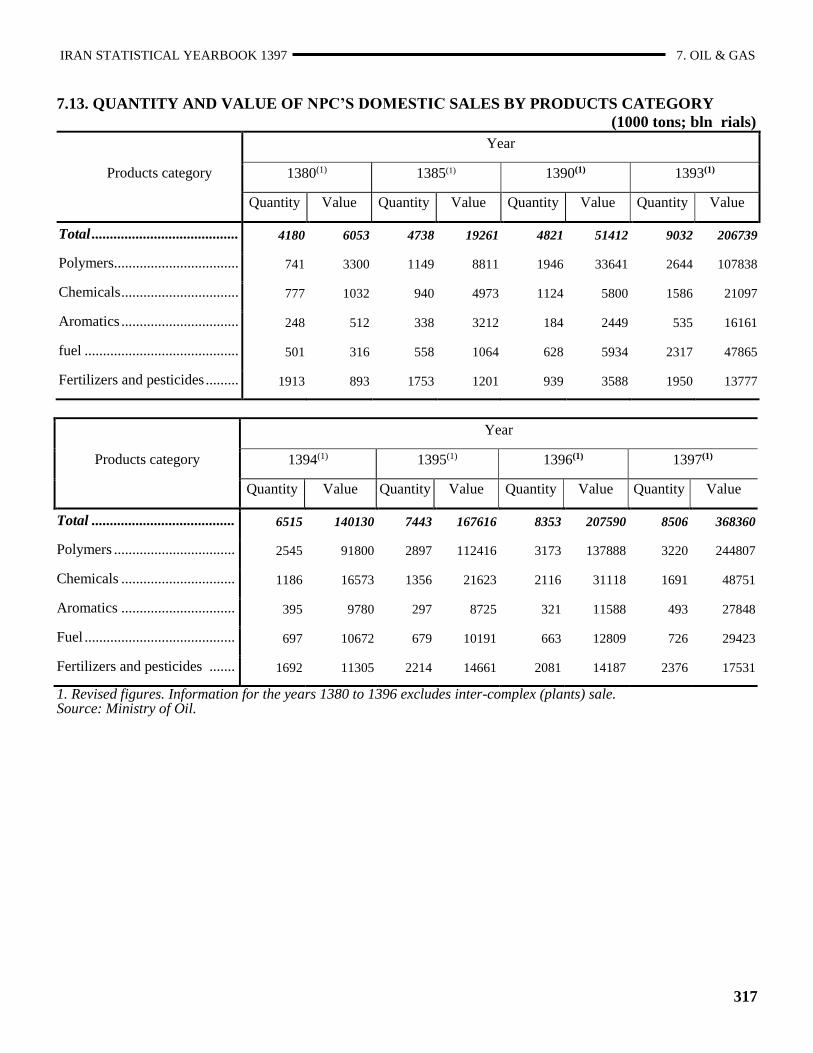
Selected information In the year 1397, a total of 763580 thousand barrels of crude oil were exported, which shows a 13% increase compared to the preceding year. In the year 1397, a number of 1171 cities and 28819 villages were supplied with piped gas, and 50 cities and 4174 villages were being supplied with piped gas. The total production of the National Company of the Petrochemical Industries with a 0.5% decrease stood at 53350 thousand tons in the year 1397 compared to the preceding year (the year1396). Out of this amount, 8506 thousand tons valued at 368360 billion rials are related to the domestic sale which increased by 1.8 and 77.4 percent, respectively compared to the previous year. Also, 20307 thousand tons valued at 11431 million dollars has been exported, which decreased by 9.4 and 4.3 percent, respectively compared to the previous year.

IRAN STATISTICAL YEARBOOK 1397 7. OIL & GAS
307
7.1. REFINMENT CAPACITY FOR CRUDE OIL IN DOMESTIC REFINERIES (1000 barrels)
Refinery Year
(1)1380 (1)1385 (1)1390 (1)3139 (1)4139 (1,2)5139 (1)6139 1397
Total ....................................... 556260 556260 623055 623055 623055 677832 675980 763580
Abadan ..................................... 142350 142350 142350 142350 142350 142740 142350 142350
Arak .......................................... 63875 63875 91250 91250 91250 91500 91250 91250
Esfahan ..................................... 103660 103660 103660 103660 103660 103944 103660 103660
Bandar Abbas ........................... 84680 84680 116800 116800 116800 117120 116800 116800
Tabriz ....................................... 40150 40150 40150 40150 40150 40260 40150 40150
Tehran ...................................... 82125 82125 82125 82125 82125 91500 91250 91250
Shiraz ....................................... 20440 20440 20440 20440 20440 20496 20440 20440
Kermanshah ............................. 8030 8030 8030 8030 8030 8052 8030 8030
Lavan (distillation complex) .... 10950 10950 18250 18250 18250 18300 18250 18250
Gas condensate of Persian Gulf Star × × × × × 43920 43800 131400
1. Revised figures. 2. The year 1395 was a leap year. Source: Ministry of Oil.
7.2. DIRECT EXPORT OF CRUDE OIL AND OIL PRODUCTS
Description Year
1380 1385 1390 1393 1394 1395 1396 1397
Crude oil (1000 barrels) ........... 730000 887881 741939 490086 523392 777714 782880 000
Oil products (mln lit/day) ........ 42 42 14 19 28 23 41 000
Source: Ministry of Oil.

IRAN STATISTICAL YEARBOOK 1397 7. OIL & GAS
308
0
100
200
300
400
500
600
700
800
900
1393 1394 1395 1396
7.1. DIRECT EXPORTS OF CRUDE OIL
For data see Table 7.2.
Mln barrels

IRAN STATISTICAL YEARBOOK 1397 7. OIL & GAS
309
7.3. AVERAGE PRODUCTION OF DIFFERENT TYPES OF OIL PRODUCTS IN REFINERIES
(cu m/day)
Product Year
1380 1385 1390 1393 1394 1395 1396 1397
Total .............................................. 245891(1) 257313(1) 000 000 000 000 000 000
Liquefied gas ................................. 8298 8016 9476 10135 9068 10774 000 9476
Motor spirit ................................... 37128(1) 44664(1) 64888 67872 62177 81911 000 64888
Kerosene........................................ 27160 21048 21640 20061 20710 17035 000 21640
Gas oil ........................................... 70879 80473 83857 87606 80339 84795 000 83857
Fuel oil .......................................... 80152 76205 73045 72302 69942 56853 000 73045
Jet fuels ......................................... 3098 3600 000 000 000 000 000 000
Lubricants...................................... 1221 0 000 000 000 000 000 000
Bitumen ......................................... 8284 859 000 000 000 000 000 000
Other products(2) ................................... 10382 24107 000 000 000 000 000 000
1. Motor spirit includes basic gasoline, MTBE, super gasoline consumption etc; however, MTBE and super gasoline
consumption are not included in the total.
2. Other oil products exclude semi-finished products, gas, hydrogen and sulfur.
Sources: Ministry of Oil.
0
10
20
30
40
50
60
70
80
90
100
1393 1394 1395 1396
7.2. SELECTED OIL PRODUCTS OF REFINERIES
Liquefied gas Motor spirit Burning oil Gas oil Fuel oil
1000 cu m/day
For data see Table 7.3.

IRAN STATISTICAL YEARBOOK 1397 7. OIL & GAS
310
7.4. CONSUMPTION OF OIL PRODUCTS (1000 cu m)
Product
Year
1380 1385 1390 1393 1394 1395 1396 1397
Motor spirit (1) ............................................ 16723 26887 20884 25135 26856 25762 34317 000
Jet fuel G.P.4 .............................................. 157 99 000 000 000 000 000 000
Jet fuel A. T. K ........................................... 943 1155 000 000 000 000 000 000
Kerosene..................................................... 8954 7199 7257 7899 7322 7559 6218 000
Gas oil ........................................................ 25215 31471 29427 30683 31794 28131 29102 000
Fuel oil ...................................................... 15245 15644 19909 21920 18939 19747 9593 000
Lubricants .................................................. 390 000 000 000 000 000 000 000
Bitumen ..................................................... 2100 4202(2) 000 000 000 000 000 000
Liquefied gas ............................................. 4163 3922 2739 1880 1447 1839 2079 000
Crude lubricants ......................................... 351 1668 000 000 000 000 000 000
Benzinc solvents ....................................... 12 42 000 000 000 000 000 000
Naphtha ..................................................... 2 42 000 000 000 000 000 000
1. Including regular, super, and unleaded gasoline. 2. Unit of measurement is regarded as thousand tons and includes VB (primary material of bitumen) as well. Sources: Ministry of Oil.
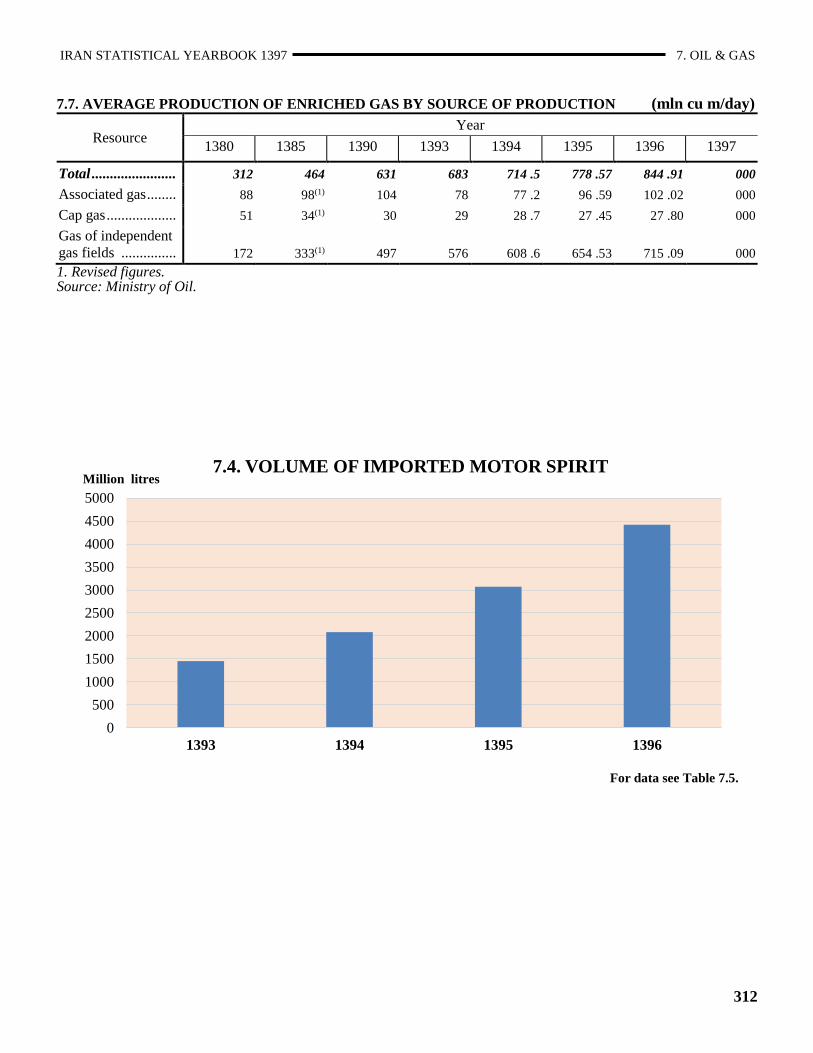
7.5. IMPORTS OF OIL PRODUCTS BY TYPE (mln/litre)
Product Year
1380 1385 1390 1393 1394 1395 1396 1397
Total ...................... 2840 11897 000 000 000 000 000 000
Motor spirit ............ 2840 10038 000 1451 2082 3067 4419 000
Kerosene................. 0 0 0 0 0 0 0 000
Gas oil ................... 0 1858 000 122 0 0 0 000
Aviation spirit ....... 0 2 000 000 000 000 000 000
Sources: Ministry of Oil.

IRAN STATISTICAL YEARBOOK 1397 7. OIL & GAS
311
7.6. TRANSPORTED OIL PRODUCTS BY MEANS OF TRANSPORT (mln ton kms)
Means of
transport
Year
1380 1385 1390 1393 1394 1395 1396 1397
Total ...................... 32397 39185 37249 37192 36429 38024 42749 44012
Pipelines ................ 21024 25194 21854 22485 21359 22145 26432 25002
Railway ................. 1977 2547 1661 2082 2069 2505 2168 2890
Road vehicles ........ 7893 8995 7844 9565 10754 11947 13196 14566
Tankers .................. 1503 2449 5890 3060 2247 1427 953 1554
Sources: Ministry of Oil.
0
5
10
15
20
25
30
35
40
1393 1394 1395 1396
7. 3. CONSUMPTION OF SOME OIL PRODUCTS
Motor spirit Kerosene Gas oil Fuel oil Liquefied gas
Mln cu/m
For data see Table 7.4.
Year
0
5
10
15
20
25
30
35
40
1393 1394 1395 1396
7. 3. CONSUMPTION OF SOME OIL PRODUCTS
Motor spirit Kerosene Gas oil Fuel oil Liquefied gas
Mln cu/m
For data see Table 7.4.
IRAN STATISTICAL YEARBOOK 1397 7. OIL & GAS
312
7.7. AVERAGE PRODUCTION OF ENRICHED GAS BY SOURCE OF PRODUCTION (mln cu m/day)
Resource Year
1380 1385 1390 1393 1394 1395 1396 1397
Total ....................... 312 464 631 683 714 .5 778 .57 844 .91 000
Associated gas ........ 88 98(1) 104 78 77 .2 96 .59 102 .02 000
Cap gas ................... 51 34(1) 30 29 28 .7 27 .45 27 .80 000
Gas of independent
gas fields ............... 172 333(1) 497 576 608 .6 654 .53 715 .09 000
1. Revised figures. Source: Ministry of Oil.
0
500
1000
1500
2000
2500
3000
3500
4000
4500
5000
1393 1394 1395 1396
7.4. VOLUME OF IMPORTED MOTOR SPIRITMillion litres
For data see Table 7.5.

IRAN STATISTICAL YEARBOOK 1397 7. OIL & GAS
313
7.8. CITIES SUPPLIED OR BEING SUPPLIED WITH PIPED GAS AND HOUSEHOLDS
COVERED IN THIS PROGRAMME AT THE END OF THE YEAR (1)
Year and Ostan Cities supplied with piped gas(2) Cities being supplied
with piped gas(3) Number Number of households
1380(4) ............................................ 393 13930668 79
1385(4) ............................................ 690 16678575 82
1390(4) ............................................ 995 17513996 000
1393(4) ............................................ 1066 17658160 46
1394(4) ............................................ 1097 17723726 50
1395(4) ............................................ 1118 17932052 25
1396(4) ............................................ 1148 17968984 47
1397. .............................................. 1171 18066054 50
East Azarbayejan ........................... 67 890557 0
West Azarbayejan ......................... 42 633403 1
Ardebil .......................................... 29 257887 0
Esfahan ........................................ 107 1410677 4
Alborz ........................................... 16 792535 0
Ilam ............................................... 24 108407 2
Bushehr ......................................... 36 234643 0
Tehran ........................................... 48 4406914 0
Chaharmahal&Bakhtiyari ............. 39 175505 1
South Khorasan ............................. 30 130400 0
Khorasan-e-Razavi ........................ 76 1429814 1
North Khorasan ............................. 22 143175 0
Khuzestan ...................................... 80 985443 2
Zanjan ........................................... 21 217688 0
Semnan .......................................... 20 169707 0
Sistan&Baluchestan ...................... 3 209335 3
Fars ................................................ 96 1013422 9
Qazvin ........................................... 25 295019 0
Qom ............................................... 6 365334 0
Kordestan ...................................... 31 337871 0
Kerman .......................................... 53 511734 16
Kermanshah .................................. 28 437429 3
Kohgiluyeh&Boyerahmad ............ 17 103270 0
Golestan ........................................ 33 305964 0
Gilan .............................................. 51 537270 0
Lorestan ......................................... 24 333502 1
Mazandaran ................................... 56 622281 2
Markazi ......................................... 35 350287 0
Hormozgan .................................... 4 19910 5
Hamedan ....................................... 31 346041 0
Yazd .............................................. 21 290630 0
1. The number of cities are based on the definitions provided by the Ministry of Oil. 2. Including all cities, parts of which are gas consumers. 3. Including cities where piped gas supply operations have already started. 4. Revised figures. Source: Ministry of Oil.
IRAN STATISTICAL YEARBOOK 1397 7. OIL & GAS
314
7.9. VILLAGES SUPPLIED OR BEING SUPPLIED WITH PIPED GAS AND HOUSEHOLDS
COVERED IN THIS PROGRAMME AT THE END OF THE YEAR (1)
Year and Ostan Villages supplied with piped gas(2) Villages being supplied
with piped gas(3) Number Number of households
1380(4) ............................................ 416 212071 000
1385(4) ............................................ 4344 1529093 2294
1390(4) ............................................ 12196 2903818 4715
1393(4) ............................................ 17477 3547235 2585
1394(4) ............................................ 19901 3799106 5514
1395(4) ............................................ 22928 4075774 4303
1396 ............................................... 25603 4301829 5120
1397. .............................................. 28819 4565595 4174
East Azarbayejan ...................... 1981 315778 205
West Azarbayejan .................... 1073 193937 430
Ardebil ..................................... 1236 110060 182
Esfahan ........................................ 1058 180897 4
Alborz ...................................... 145 57494 59
Ilam .......................................... 377 41974 92
Bushehr .................................... 411 81974 1
Tehran ...................................... 466 195001 11
Chaharmahal&Bakhtiyari ........ 472 82146 52
South Khorasan ........................ 487 56470 269
Khorasan-e-Razavi ................... 2059 463251 425
North Khorasan ........................ 734 109416 9
Khuzestan ................................. 1774 250995 164
Zanjan ...................................... 540 87961 72
Semnan ..................................... 257 38485 14
Sistan&Baluchestan ................. 4 2826 19
Fars ........................................... 1760 322215 402
Qazvin ...................................... 474 84489 82
Qom .......................................... 136 16391 14
Kordestan ................................. 1169 116266 16
Kerman ..................................... 1143 157467 380
Kermanshah ............................. 1264 92810 206
Kohgiluyeh&Boyerahmad ....... 708 66465 223
Golestan ................................... 857 231083 22
Gilan ......................................... 1992 297171 39
Lorestan .................................... 1583 142660 263
Mazandaran .............................. 2136 425633 412
Markazi .................................... 977 104273 6
Hormozgan ............................... 16 4737 9
Hamedan .................................. 1026 191916 0
Yazd ......................................... 504 43354 92
1. The number of villages are based on the definitions provided by the Ministry of Oil. 2. Including all villages parts of which are gas consumers. 3. Including villages where piped gas supply operations have already started. 4. Revised figures. Source: Ministry of Oil.
IRAN STATISTICAL YEARBOOK 1397 7. OIL & GAS
315
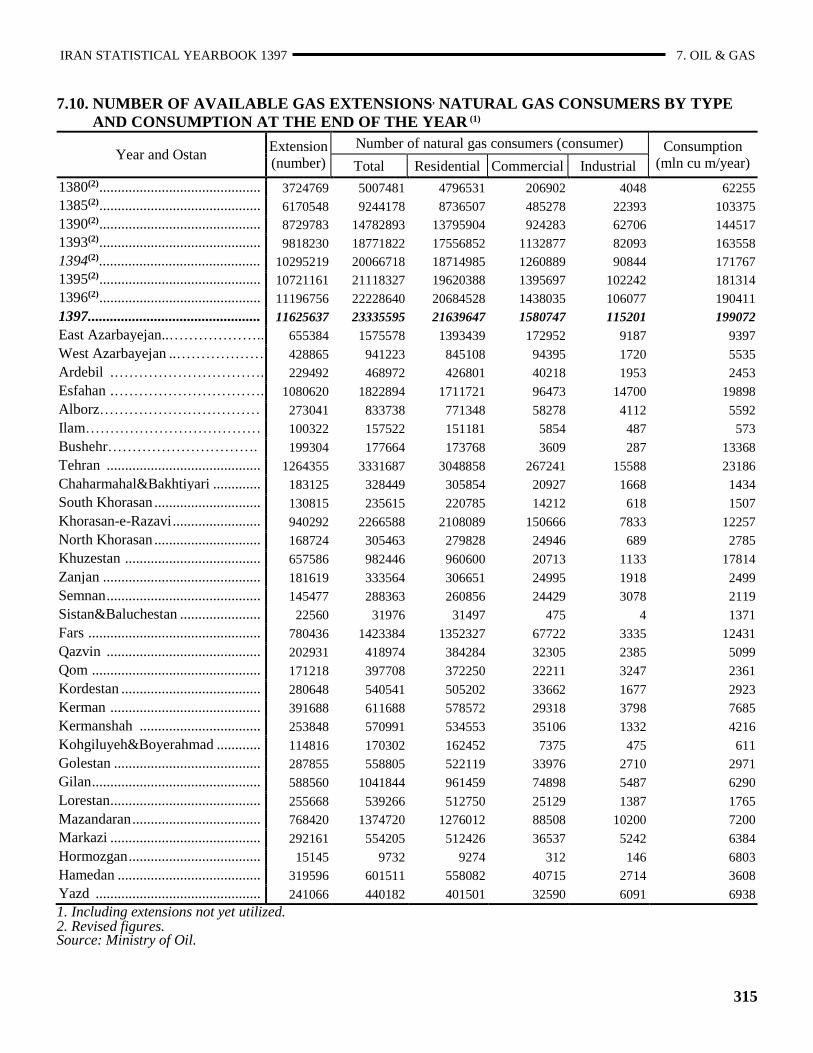
7.10. NUMBER OF AVAILABLE GAS EXTENSIONS, NATURAL GAS CONSUMERS BY TYPE
AND CONSUMPTION AT THE END OF THE YEAR (1)
Year and Ostan Extension
(number)
Number of natural gas consumers (consumer) Consumption
(mln cu m/year) Total Residential Commercial Industrial
1380(2) ............................................ 3724769 5007481 4796531 206902 4048 62255
1385(2) ............................................ 6170548 9244178 8736507 485278 22393 103375
1390(2) ............................................ 8729783 14782893 13795904 924283 62706 144517
1393(2) ............................................ 9818230 18771822 17556852 1132877 82093 163558
1394(2) ............................................ 10295219 20066718 18714985 1260889 90844 171767
1395(2) ............................................ 10721161 21118327 19620388 1395697 102242 181314
1396(2) ............................................ 11196756 22228640 20684528 1438035 106077 190411
1397. .............................................. 11625637 23335595 21639647 1580747 115201 199072
East Azarbayejan ..……………….. 655384 1575578 1393439 172952 9187 9397
West Azarbayejan ..……………… 428865 941223 845108 94395 1720 5535
Ardebil . …………………………. 229492 468972 426801 40218 1953 2453
Esfahan . …………………………. 1080620 1822894 1711721 96473 14700 19898
Alborz…………………………… 273041 833738 771348 58278 4112 5592
Ilam……………………………… 100322 157522 151181 5854 487 573
Bushehr…………………………. 199304 177664 173768 3609 287 13368
Tehran .......................................... 1264355 3331687 3048858 267241 15588 23186
Chaharmahal&Bakhtiyari ............. 183125 328449 305854 20927 1668 1434
South Khorasan ............................. 130815 235615 220785 14212 618 1507
Khorasan-e-Razavi ........................ 940292 2266588 2108089 150666 7833 12257
North Khorasan ............................. 168724 305463 279828 24946 689 2785
Khuzestan ..................................... 657586 982446 960600 20713 1133 17814
Zanjan ........................................... 181619 333564 306651 24995 1918 2499
Semnan .......................................... 145477 288363 260856 24429 3078 2119
Sistan&Baluchestan ...................... 22560 31976 31497 475 4 1371
Fars ............................................... 780436 1423384 1352327 67722 3335 12431
Qazvin .......................................... 202931 418974 384284 32305 2385 5099
Qom .............................................. 171218 397708 372250 22211 3247 2361
Kordestan ...................................... 280648 540541 505202 33662 1677 2923
Kerman ......................................... 391688 611688 578572 29318 3798 7685
Kermanshah ................................. 253848 570991 534553 35106 1332 4216
Kohgiluyeh&Boyerahmad ............ 114816 170302 162452 7375 475 611
Golestan ........................................ 287855 558805 522119 33976 2710 2971
Gilan .............................................. 588560 1041844 961459 74898 5487 6290
Lorestan ......................................... 255668 539266 512750 25129 1387 1765
Mazandaran ................................... 768420 1374720 1276012 88508 10200 7200
Markazi ......................................... 292161 554205 512426 36537 5242 6384
Hormozgan .................................... 15145 9732 9274 312 146 6803
Hamedan ....................................... 319596 601511 558082 40715 2714 3608
Yazd ............................................. 241066 440182 401501 32590 6091 6938
1. Including extensions not yet utilized. 2. Revised figures. Source: Ministry of Oil.

IRAN STATISTICAL YEARBOOK 1397 7. OIL & GAS
316
7.11. LIQUEFIED GAS DELIVERED BY REFINERIES FOR DISTRIBUTION (1) (1000 tons)
Year Total Abadan Arak Esfahan Bandar
Abbas Tabriz Tehran Shiraz Kermanshah
Reservation
centres
1380 ....................................... 1394(2) 310 175 442 235 134 23 49 26 0
1385 ....................................... 1489 295 189 392 201 101 234 54 23 0
1390 ...................................... 1847(2) 438 231 452 241 119 287 58 21 0
1393 ...................................... 2036(2) 293 599 403 282 94 295 50 20 0
1394 ...................................... 2149(2) 425 550 449 256 (2)110 296 49 14 0
1395 ...................................... 2174(2) 508 593 393 239 (2)109 271 49 12 0
1396 ...................................... 2112 472 569 378 246 77 314 42 14 0
1397 ....................................... 2028 315 658 358 237 87 317 40 15 0
1. Excluding total delivery of liquefied gas for Lavan and Setare Khalij Fars Refinery. 2. Revised figures. Source: Ministry of Oil.
7.12. TOTAL PRODUCTION OF NATIONAL PETROCHEMICAL COMPANY BY PRODUCTS
CATEGORY (1) (1000 tons)
Products category Year
1380 1385 1390 1393 1394 1395 1396 1397
Total ..................................... 12543 18000 42736 44511 46408 50624 53624 53350
Polymers................................ 780 1396 4182 5325 5708 6133 6890 6842
Chemicals .............................. 3070 5178 13779 14782 15458 21266 22683 23286
Aromatics .............................. 1032 1241 3283 3086 2825 3343 3292 3879
Fuel ...................................... 2911 5787 12837 12622 13680 14569 14903 12910
Fertilizers and pesticides ....... 4750 4398 8655 8696 8737 5313 5856 6433
1. Including internal consumption of petrochemical complexes. Source: Ministry of Oil.
IRAN STATISTICAL YEARBOOK 1397 7. OIL & GAS
317
7.13. QUANTITY AND VALUE OF NPC’S DOMESTIC SALES BY PRODUCTS CATEGORY
(1000 tons; bln rials)
Products category
Year
1380(1) 1385(1) 1390(1) 1393(1)
Quantity Value Quantity Value Quantity Value Quantity Value
Total ........................................ 4180 6053 4738 19261 4821 51412 9032 206739
Polymers.................................. 741 3300 1149 8811 1946 33641 2644 107838
Chemicals ................................ 777 1032 940 4973 1124 5800 1586 21097
Aromatics ................................ 248 512 338 3212 184 2449 535 16161
fuel .......................................... 501 316 558 1064 628 5934 2317 47865
Fertilizers and pesticides ......... 1913 893 1753 1201 939 3588 1950 13777
Products category
Year
1394(1) 1395(1) 1396(1) 1397(1)
Quantity Value Quantity Value Quantity Value Quantity Value
Total ....................................... 6515 140130 7443 167616 8353 207590 8506 368360
Polymers ................................. 2545 91800 2897 112416 3173 137888 3220 244807
Chemicals ............................... 1186 16573 1356 21623 2116 31118 1691 48751
Aromatics ............................... 395 9780 297 8725 321 11588 493 27848
Fuel ......................................... 697 10672 679 10191 663 12809 726 29423
Fertilizers and pesticides ....... 1692 11305 2214 14661 2081 14187 2376 17531
1. Revised figures. Information for the years 1380 to 1396 excludes inter-complex (plants) sale. Source: Ministry of Oil.

IRAN STATISTICAL YEARBOOK 1397 7. OIL & GAS
318
7.14. QUANTITY AND VALUE OF NPC'S EXPORTS BY PRODUCTS CATEGORY
(1000 tons; mln dollars)
Products category
Year
1380(1) 1385(1) 1390(1) 1393(1)
Quantity Value Quantity Value Quantity Value Quantity Value
Total ..................................... 4011 796 6044 3299 17804 14055 15901 10285
Polymers ............................... 142 73 478 527 1644 2414 2511 3293
Chemicals .............................. 1458 161 2273 845 6980 4055 6283 2512
Aromatics ............................. 385 117 444 457 1244 1711 964 1118
Fuel ...................................... 2010 443 2849 1470 5413 4854 3717 2598
Fertilizers and pesticides ...... 16 2 0 0 2523 1021 2426 764
Products category
Year
1394(1) 1395(1) 1396(1) 1397
Quantity Value Quantity Value Quantity Value Quantity Value
Total ..................................... 18807 9582 21153 9952 22404 11950 20307 11431
Polymers ............................... 2566 3334 3135 3422 3804 4111 3458 3955
Chemicals .............................. 6569 2304 6868 2358 6791 2799 6964 2930
Aromatics ............................. 1312 1002 1374 989 1380 993 1467 1066
Fuel ....................................... 5774 2203 6545 2533 6884 3261 4775 2597
Fertilizers and pesticides ...... 2586 739 3231 650 3545 786 3643 883
1. Revised figures. Source: Ministry of Oil.

IRAN STATISTICAL YEARBOOK 1397 7. OIL & GAS
319
Polymers 12.8%
Chemicals 43.6%
Aromatics 7.3%
Fuel 24.2%
Fertilizers,
pesticides and
related materials
12.1%
7.5 . TOTAL PRODUCTION OF NATIONAL PETROCHEMICAL COMPANY
BY PRODUCTS CATEGORY, THE YEAR 1397
For data see Table 7.12.
0
5000
10000
15000
20000
25000
1393 1394 1395 1396 1397
7.6. VOLUME OF DOMESTIC SALES AND EXPORTS BY THE NATIONAL
PETROCHEMICAL COMPANY
Domestic sale Exports
1000 tons
For data see Tables 7.13 & 7.14.


