Download - Investigation of torrefaction process parameters and characterization of torrefied biomass

Graduate Theses and Dissertations Graduate College
2012
Investigation of torrefaction process parameters andcharacterization of torrefied biomassDorde MedicIowa State University
Follow this and additional works at: http://lib.dr.iastate.edu/etd
Part of the Bioresource and Agricultural Engineering Commons, and the Oil, Gas, and EnergyCommons
This Dissertation is brought to you for free and open access by the Graduate College at Iowa State University Digital Repository. It has been acceptedfor inclusion in Graduate Theses and Dissertations by an authorized administrator of Iowa State University Digital Repository. For more information,please contact [email protected].
Recommended CitationMedic, Dorde, "Investigation of torrefaction process parameters and characterization of torrefied biomass" (2012). Graduate Theses andDissertations. 12403.http://lib.dr.iastate.edu/etd/12403

Investigation of torrefaction process parameters and characterization of torrefied
biomass
by
Dorde Medic
A dissertation submitted to the graduate faculty
in partial fulfillment of the requirements for the degree of
DOCTOR OF PHILOSOPHY
Co-majors: Agricultural Engineering; Biorenewable Resources and Technology
Program of Study Committee:
Matthew J. Darr, Major Professor
Robert C. Brown
D. Raj Raman
Tae Hyun Kim
Thomas J. Brumm
Iowa State University
Ames, Iowa
2012
Copyright © Dorde Medic, 2012. All rights reserved

ii
Table of Contents
List of Tables ..................................................................................................................... iv
List of Figures ..................................................................................................................... v
Acknowledgements ........................................................................................................... vii
Abstract ............................................................................................................................ viii
Chapter 1. General introduction ................................................................................................ 1
Problem identification ......................................................................................................... 1
Research objectives ............................................................................................................. 3
Dissertation organization .................................................................................................... 4
References ........................................................................................................................... 5
Chapter 2. Literature review ..................................................................................................... 6
Lignocellulosic biomass...................................................................................................... 6
Lignocellulosic biomass composition ................................................................................. 8
Thermochemical biomass conversion technologies .......................................................... 11
Torrefaction for biorenewables production ...................................................................... 13
Overview of biomass torrefaction process .................................................................. 13
Torrefaction mechanism ............................................................................................. 14
Torrefaction kinetics ................................................................................................... 18
Torrefaction product distribution and composition .................................................... 22
Torrefaction reactors ................................................................................................... 26
Economics ................................................................................................................... 28
Properties and applications of torrefied biomass ........................................................ 30
References ......................................................................................................................... 35
Chapter 3. Effects of torrefaction process parameters on biomass feedstock upgrading ....... 44
Abstract ............................................................................................................................. 44
Introduction ....................................................................................................................... 45
Methods............................................................................................................................. 49
Samples ....................................................................................................................... 49
Torrefaction Reactor ................................................................................................... 49
Gas Analysis ............................................................................................................... 50
Liquids Analysis ......................................................................................................... 51
Proximate Analysis ..................................................................................................... 51
Ultimate Analysis........................................................................................................ 52
High Heating Value Determination ............................................................................ 52
Design of Experiments ................................................................................................ 52
Results and Discussion ..................................................................................................... 53
Conclusions ....................................................................................................................... 68
Acknowledgements ........................................................................................................... 69
References ......................................................................................................................... 69
Chapter 4. Effect of torrefaction on water vapor adsorption properties and resistance to
microbial degradation of corn stover ...................................................................................... 72
Abstract ............................................................................................................................. 72

iii
Introduction ....................................................................................................................... 73
Methods............................................................................................................................. 76
Sample preparation ..................................................................................................... 76
Water vapor adsorption experiments .......................................................................... 77
Adsorption modeling .................................................................................................. 78
Microbial degradation experiment .............................................................................. 81
Fiber analysis .............................................................................................................. 81
Results and discussion ...................................................................................................... 81
Experimental results.................................................................................................... 81
Fitting sorption models to experimental results .......................................................... 85
Microbial degradation results ..................................................................................... 92
Fiber analysis results ................................................................................................... 93
Conclusion ........................................................................................................................ 94
Acknowledgements ........................................................................................................... 95
References ......................................................................................................................... 95
Chapter 5. Effect of particle size, different corn stover components and gas residence
time on torrefaction of corn stover.......................................................................................... 99
Abstract ............................................................................................................................. 99
Introduction ..................................................................................................................... 100
Materials and Methods .................................................................................................... 103
Corn stover samples .................................................................................................. 103
Torrefaction experiments .......................................................................................... 105
Chemical analysis of raw and torrefied biomass ...................................................... 108
Statistical analysis ..................................................................................................... 109
Results and Discussion ................................................................................................... 109
Conclusions ..................................................................................................................... 119
Acknowledgments........................................................................................................... 120
References ....................................................................................................................... 120
Chapter 6. General conclusions and future work .................................................................. 124
Future work ............................................................................................................... 126
References ....................................................................................................................... 128

iv
List of Tables
Table 1.Yields of different biomass types torrefied for 1h ..................................................... 24
Table 2. Box Behnken experimental design matrix generated by JMP .................................. 53
Table 3. Total mass balance for torrefaction experiments ...................................................... 55
Table 4. Summary statistics for the mass loss response surface model with three
predictors: moisture, temperature and time ............................................................................ 58
Table 5. ANOVA for the mass loss response surface model with three predictors:
moisture, temperature and time............................................................................................... 58
Table 6. List of all terms used to obtain mass loss and energy yield models and their
respective p–values ................................................................................................................. 59
Table 7. Ultimate analysis and computed energy density of torrefied samples ...................... 64
Table 8. Summary statistics for the energy yield response surface model with three
predictors: moisture, temperature and time ............................................................................ 67
Table 9. ANOVA for the for the energy yield response surface model with three
predictors: moisture, temperature, and time ........................................................................... 67
Table 10. ERH of saturated solutions at four temperature levels ........................................... 77
Table 11. EMC of raw and torrefied corn stover .................................................................... 84
Table 12. Water vapor adsorption parameters for the raw and torrefied corn stover ............. 86
Table 13. Fiber analysis of raw and torrefied corn stover ...................................................... 94
Table 14. Sample designation and basic properties .............................................................. 105
Table 15. Proximate analysis of raw corn stover biomass .................................................... 112
Table 16. Elemental analysis and HHV of biomass samples................................................ 115
v
List of Figures
Figure 1. Stages in the torrefaction process ............................................................................ 15
Figure 2. Weight loss of the main biomass constituents ......................................................... 16
Figure 3. Changes in polysaccharides and lignin during torrefaction .................................... 17
Figure 4.Typical mass and energy yields in torrefaction of wood at two conditions ............. 22
Figure 5. Composition of the torrefaction reaction products .................................................. 23
Figure 6. Power consumption and mill capacity during raw and torrefied biomass size
reduction ................................................................................................................................. 31
Figure 7. Particle size distribution of coal, raw and torrefied willow & miscanthus ............. 32
Figure 8. Van Krevelen diagram showing change in the biomass O/C and O/H ratio after
torrefaction .............................................................................................................................. 33
Figure 9. Position of four thermocouples (T5, T6, T7 and T8) utilized for controlling the
temperature inside the reactor ................................................................................................. 50
Figure 10. Temperature profiles for four thermocouples and average temperature profile
(denoted by dashed line) used to determine process temperature and time ............................ 54
Figure 11. The effect of untreated biomass moisture content on mass loss of torrefied
samples. ................................................................................................................................... 56
Figure 12. Surface plot of the effect of temperature and moisture content of raw biomass
on predicted mass loss ............................................................................................................ 60
Figure 13. Composition of condensable volatiles released during torrefaction ...................... 60
Figure 14. Change in permanent gas composition with process parameters and raw
biomass moisture content ........................................................................................................ 61
Figure 15. Proximate analysis of torrefied and raw corn stover ............................................. 63
Figure 16. Effect of process parameters and raw biomass moisture content on energy
density of torrefied material .................................................................................................... 65
Figure 17. Effect of process parameters and initial moisture content of untreated biomass
on energy yield ........................................................................................................................ 66
Figure 18. Surface plot of the effect of temperature and moisture content of raw biomass
on predicted energy yield ........................................................................................................ 68
Figure 19. Residual plots of the water vapor adsorption isotherms for raw and torrefied
corn stover ............................................................................................................................... 87
Figure 20. Experimental and isotherms predicted by Modified Oswin model of raw corn
stover ....................................................................................................................................... 89
Figure 21. Experimental and isotherms predicted by Modified Oswin model of corn
stover torrefied at 200 °C ........................................................................................................ 90
Figure 22. Experimental and isotherms predicted by Modified Oswin model of corn
stover torrefied at 250 °C ........................................................................................................ 90
Figure 23. Experimental and isotherms predicted by Modified Oswin model of corn
stover torrefied at 300 °C ........................................................................................................ 91
vi
Figure 24. Comparison of raw and torrefied corn stover isotherms at 10 and 40 °C ............. 92
Figure 25. Dry matter loss due to microbial degradation at 0.97 ERH and 30 °C ................. 92
Figure 26. Different corn stover components ....................................................................... 104
Figure 27. Temperature programs used to conduct torrefaction experiments in the TGA ... 105
Figure 28. Bench scale reactor setup used in torrefaction experiments ................................ 107
Figure 29. Temperature time profile of the bench scale reactor ........................................... 107
Figure 30. Average dry matter loss of torrefied ground stover and whole stalk samples ..... 111
Figure 31. Average dry matter loss of torrefied stalk shell, stalk pith, and cob shell ........... 111
Figure 32. Average energy yield of torrefied ground stover and whole stalk samples ........ 118
Figure 33. Average energy yield of torrefied stalk shell, stalk pith, and cob shell samples . 119

vii
Acknowledgements
I would like to express my sincere appreciation to my major professor Matthew Darr,
for giving me the opportunity to study at Iowa State University under his mentorship, for
optimism and understanding even during the stressful and tough times, and for great
expertise on the topics that extend the scope of this work. Without his patient guidance, my
learning and working experience at ISU would not be as complete as it is now.
I would also like to thank other members of my committee, Dr. Robert Brown, Dr.
Tae Hyun Kim, Dr. Thomas Brumm and Dr. Raj Raman for their interest in my work and
valuable advice.
I also appreciate the help and assistance of my friends and colleagues, especially Ajay
Shah, Benjamin Potter, Jeffrey Zimmerman, Sarah Rahn, and the rest of my research group.
This work would not be accomplished without the technical assistance from the Center for
Sustainable and Environmental Technologies (CSET) and Biocentury Research Farm staff,
especially Patrick Johnston and Andy Suby, who generously shared their resources and
expertise. I also acknowledge financial support from ConocoPhillips Company.
I would like to express my gratitude to my parents and extended family in Serbia for
their support and encouragement. Finally, I would like to thank my wife Jelena for her
unconditional support, patience, and company during our ISU years, and our son Luka for
making me smile. I wish to dedicate this work to all of them.
viii
Abstract
This study sought to better understand the torrefaction process, and more specifically,
how torrefaction affects the physical and chemical properties of corn stover biomass. The
work done to accomplish this was divided into three sections that map to three research
objectives. First, effect of torrefaction residence time, temperature and untreated biomass
moisture content on chemical properties of torrefied corn stover was addressed. Second,
effect of torrefaction process condition on physical characteristics of torrefied biomass,
namely hydrophobicity was assessed. In addition, resistance to microbial degradation as a
result of torrefaction and increased hydrophobicity was investigated. Third, influence of gas
residence time and biomass particle size on chemical characteristics of torrefied corn stover
was studied.
Corn stover biomass at three moisture contents (30, 45, and 50% wet basis) was
torrefied at three different temperatures (200, 250, and 300 °C), and at three reaction times
(10, 20, and 30 min). In each of the 17 treatments elemental and proximate compositions of
the torrefied stover was determined, along with the composition of released gaseous and
liquid products. Using these data, the mass and energy balance of each torrefaction was
quantified. The energy balance accounted only for energy contained in the biomass. As
torrefaction process temperature increased, an overall increase (2-19%) in the energy density
of torrefied biomass and decrease (3-45% and 1-35% respectively) in mass and energy yield
was observed. At 200 ºC, mass and energy losses increased with an increase in the initial
biomass moisture content. The difference in both mass and energy losses between biomass of
22% and 41% initial moisture content was about 10 percentage points at 200 ºC. The liquid
phase condensed from the stream of volatiles was composed primarily of water, followed by

ix
acetic acid, methanol, hydroxyacetone, and furfural. The yield of condensables increased
with torrefaction temperature. Permanent gas released in the process was mainly composed
of carbon dioxide and carbon monoxide, with traces of hydrogen and methane present only at
300 ºC.
The equilibrium moisture content (EMC) of raw corn stover, along with corn stover
thermally pretreated at three temperatures, was measured using the static gravimetric method
at equilibrium relative humidity (ERH) and temperature ranging from 10 to 98% and from 10
to 40 °C, respectively. Five isotherms were fitted to the experimental data to obtain the
prediction equation which best describes the relationship between the ERH and the EMC of
lignocellulosic biomass. Microbial degradation of the samples was tested at 97% ERH and 30
°C for period of 30 days. Fiber analyses were conducted on all samples. In general, torrefied
biomass showed an EMC lower than that of raw biomass, which implied an increase in
hydrophobicity. The modified Oswin model performed best in describing the correlation
between ERH and EMC. Corn stover torrefied at 250 and 300 °C had negligible dry matter
mass loss due to microbial degradation. Fiber analysis showed a significant decrease in
hemicellulose content with the increase in pretreatment temperature, which might be the
reason for the hydrophobic nature of torrefied biomass. This is probably due to loss of polar
hydroxyl groups that serves as binding sites for water molecules.
The effects of particle size and gas residence time on the torrefaction of corn stover
were investigated via torrefaction of different stover fractions: stalk shell, pith, and corn cob
shell, and particle sizes, in a form of whole corn stalk and ground corn stover. Three levels of
the purge gas residence times (1.2, 12 and 60 sec) were employed to assess the effects of
volatiles and torrefied biomass interaction. Elemental analyses of all the samples were done,

x
and the obtained data was used to estimate the energy contents and energy yields of different
torrefied biomass samples. Particle densities, elemental composition, and fiber composition
of raw biomass fractions were also determined. The dry matter losses, higher heating values,
and energy yields for different torrefied corn stover fractions were significantly different.
This was probably due to the differences in particle densities, hemicellulose quantities, and
the chemical and physical properties of the original biomass samples. Gas residence time did
not have a significant effect on the aforementioned parameters.

1
Chapter 1. General introduction
Problem identification
Alternative energy sources have gained significant interest recently due to uncertainty
of remaining oil resources and their positive effect on the environment, rural development,
diversification of the energy supply and national security. Moreover, biomass is the only
source of renewable carbon, an element essential for production of chemicals and materials.
Nowadays, the majority of biorenewables production falls under biofuels production, with
grain ethanol and bio-diesel being produced in significant quantities. According to the
Environmental Protection Agency, grain ethanol and diesel production, totaling 45.5 billion
liters, will account for about 77% of all biorenewable fuels produced in 2012 [1].
Nevertheless, public concern exists in regards to grain derived fuels production due to their
competition with food production, land use change, and controversial effect on fossil fuel
displacement. These are the main reasons why the US congress limits grain derived fuel
production and mandates production of non-food derived bio-fuels, through the Energy
Independence and Security Act of 2007 (EISA of 2007) [2] and RFS2. As per EISA of 2007,
about 60% of 136 billion liters of biorenewables produced in 2022 need to be from non-food
sources, such as lignocellulosic biomass.
It has been estimated by researchers in Oak Ridge National Laboratory [3] that there
is potentially about 370 million dry tons per year of forest resources, and about 350 million
dry tons per year of agricultural resources available. With high yield increase and use of
perennials, the agricultural resource quantity could ramp up to 1000 million dry tons per
year. Corn stover might be an important lignocellulosic feedstock for the production of

2
advanced bio-fuels, especially in the short term, due to its immediate availability and
abundance. Estimated corn stover resources based in the US are about 75 million dry tons per
year, with the potential for a 2.5 to 3 fold increase due to advances in technology [3].
Obviously, large scale biofuel production will demand significant quantities of biomass
feedstock to be stored, transported, and processed in an economic and sustainable manner.
Although, the lignocellulosic biomass is available in large quantities it possesses
characteristics that make its utilization complex and expensive. For example it has high
moisture content, susceptibility to microbial degradation, low bulk density, low energy
density, recalcitrance, high oxygen content, heterogeneity, and dispersed nature.
Torrefaction can be incorporated in a biorenewables production chain to significantly
reduce the cost of biomass feedstock storage, transportation, and downstream processing,
through the enhancement of biomass hydrophobicity, resistance to microbial degradation ,
energy density, homogeneity, brittleness, and chemical characteristics important for
thermochemical downstream processing [4, 5]. Torrefaction is a thermochemical process
carried out in a temperature range between 200 and 300 ºC, under an inert atmosphere, and
the heating rate below 50 °/min. There have been several studies on torrefaction of different
woody biomasses, either as agricultural residues or herbaceous energy crops, including oak,
willow, pine, birch, larch, wheat straw, miscanthus, and bagasse. The majority of studies
investigated torrefaction of dry, ground material under relatively high purge gas flow rates
[6-8]. Torrefaction of corn stover biomass has not been investigated yet, although it may be
an important near term feedstock for biorenewables production. However, benefits gained
through torrefaction of lignocellulosic biomass could be captured only if the process is
positioned early in the supply chain, to utilize the feedstock without excessive pretreatment,

3
i.e. drying and size reduction, which are both energy intensive processes. Utilization of low
purge gas flow rates might be important for reduction of capital and operating costs, and for
minimizing dilution of volatiles that may be combusted to reduce energy cost and eliminate
waste streams. The main physical characteristic of interest, in the majority of torrefaction
studies, was the grindability of torrefied lignocellulosic biomass [8, 9]. While this is certainly
an important property for downstream processing, hydrophobicity and susceptibility to
microbial degradation represent characteristics crucial for safe and economic long term
storage.
Research objectives
Specific objectives have been identified to help better characterize and understand the
torrefaction process in general, and torrefaction of corn stover, a prevalent biomass source in
the Midwest, in particular. The objective of the first study was to investigate the influence of
reaction temperature, residence time, and raw biomass moisture content on specific energy,
energy yield, mass yield, and chemical properties of both torrefied corn stover, and the
condensable and permanent gases. The outcomes of this study can be used to establish mass
and energy balances for the torrefaction process and serve as a foundation for its further
optimization. The objective of the second study was to assess the effect of torrefaction on
biomass physical property, such as hydrophobicity, and resistance against microbial
degradation. Results of the work completed as a part of the second study, along with
outcomes of the first study, could be utilized for process optimization in a way that will
maximize the beneficial change in the biomass physical and chemical properties, while
minimizing mass and energy losses. The objective of the third study was to determine the
4
influence of the volatiles residence time and biomass particle size on specific energy, energy
and mass yield, and chemical properties of torrefied corn stover. Findings from the third
study could help design and optimize continuous flow reactors in order to lower the cost and
enhance the properties of the torrefied lignocellulosic biomass.
Dissertation organization
This dissertation is organized into six chapters. This first consists of problem
identification, description of objectives, and dissertation organization. The second chapter
provides a comprehensive literature review of lignocellulosic biomass feedstock and the
torrefaction process. The third chapter deals with understanding the effects of basic
torrefaction parameters (temperature and residence time), as well as the effects of untreated
feedstock moisture content, on the chemical properties of torrefied biomass, mass yield, and
energy yield. It is presented in the form of a research article that has been published in Fuel,
under the title “Effects of torrefaction process parameters on biomass feedstock upgrading”.
The fourth chapter covers the study of physical changes induced by torrefaction of
lignocellulosic biomass. It is presented in the form of a manuscript submitted to Energy &
Fuel, under the title “Effect of torrefaction on water vapor adsorption properties and
resistance to microbial degradation of thermally treated corn stover”. The fifth chapter is
related to understanding the effects of feedstock particle size and purge gas residence time on
torrefied biomass chemical properties, mass yield, and energy yield. It is presented in the
form of a manuscript submitted to Energies, under the name “Effect of particle size, different
corn stover components and gas residence time on torrefaction of corn stover”. General
conclusions and suggestions for future work are given in the sixth chapter.

5
References
1. Environmental Protection Agency. Regulation of Fuels and Fuel Additives: 2012
Renewable Fuel Standards. Fed. Regist. 2012, 76, 1320-1358.
2. The Energy Independence and Security Act of 2007, Pub. L. No. 110-40 H.R. 6, 121 Stat.
1492, 2007.
3. Perlack R.D., Wright L.L., Turhollow A.F., Graham R.L., Stokes B.J., Erbach D.C.
Biomass as feedstock for bioenergy and bioproducts industry: the technical feasibility of
a billion-ton annual supply. DOE/GO-102995-2135 and ORNL/TM-2005/66. NTIS,
Springfield, VA, 2005.
4. Uslu A., Faaij A., Bergman P. Pre-treatment technologies, and their effect on
international bioenergy supply chain logistics. Techno-economic evaluation of
torrefaction, fast pyrolysis and pelletisation. Energy 2008, 33, 1206 –1223.
5. Van der Stelt M.J.C., Gerhauser H., Kiel J.H.A., Ptasinski K.J. Biomass upgrading by
torrefaction for the production of biofuels: A review. Biomass Bioenerg. 2011, 35, 3748-
3762.
6. Ciolkosz D., Wallace R. A review of torrefaction for bioenergy feedstock production.
Biofuels, Bioprod. Biorefin. 2011, 5, 317-329.
7. Prins M.J., Ptasinski K.J., Jansen F.J.J.G. Torrefaction of wood. Part 2. Analysis of
products. J. Anal. Appl. Pyrolysis 2006, 77, 35-40.
8. Bridgeman T.G., Jones, J.M., Shield, I., Williams, P.T. Torrefaction of reed canary
grass, wheat straw and willow to enhance solid fuel qualities and combustion
properties. Fuel 2008, 87, 844–856.
9. Bridgeman T.G., Jones, I., Williams, P.T., Waldron D.J. An investigation of the
grindability of two torrefied energy crops. Fuel 2010, 89, 3911-3918.
10. Arias B, Pevida C., Fermoso J., Plaza M.G., Rubiera F., Pis J.J Influence of the
torrefaction on gindability and reactivity of woody biomass. Fuel Process. Technol.
2008, 89, 169-175.

6
Chapter 2. Literature review
Lignocellulosic biomass
Biomass is defined as an organic, non-fossilized material derived from plants,
animals and microorganisms [1]. In general, the term biorenewable resources refers to either
dedicated energy crops or wastes [2]. Both of these categories can be further subdivided into
the following three classes according to chemical characteristics of the source:
lignocellulosic, starch- or sugar-derived, and triglyceride-based biomass [3].
Even though the expression dedicated energy crops may imply that the end use is
exclusively for the production of energy and fuels, these crops are also grown for the
production of chemicals and materials [4]. Dedicated energy crops are planted and harvested
either annually (annuals) or on a three- to ten-year cycle (perennials). The relatively short
production cycle of dedicated energy crops guarantees that the resource is used in a
sustainable manner. These crops are composed of sugars, lipids, proteins, and fibers in
various proportions, depending on species, geological origin, and growing season. However,
maximizing the yield of the lignocellulosic, fibrous portion of the plant, while reducing
simple sugars and lipids, seems to be the most promising route for fuels and chemicals
production. This is mainly due to the higher energy yield (MJ ha-1
yr-1
) of plants that have a
larger fraction of vegetative (fibrous) parts [4].
Dedicated energy crops can be divided into two groups: herbaceous energy crops and
short-rotation woody crops. Herbaceous energy crops are plants with little or no woody
material. Herbaceous perennials are preferred over annuals as energy crops because they
require less weed control, are more drought resistant, and are less likely to cause soil erosion,

7
and can reestablish themselves by vegetative reproduction. Herbaceous energy crops include
switchgrass, wheatgrass, napiergrass, energy and sugar cane, sorghum, miscanthus, reed
canary grass, big bluestem, and eastern gamagrass [4]. Short rotation woody crops are fast
growing trees that are harvested on three- to ten-years cycles. They are grouped into two
categories: hardwood and softwood. The advantages of hardwood species are that they can
sprout from stumps after harvest and have lower ash content than softwood. Softwoods, on
the other hand, have higher carbon content, energy density, and are available in significant
quantities as manufacturing and logging residues. Short rotation woody crops include species
such as hybrid poplar, eucalyptus, sliver maple, sweetgum, sycamore, black locust, and
willow [4, 5, 6].
Wastes are materials of low or no value, originating from manufacturing processes,
agricultural activities, and households. Therefore, wastes include a wide range of materials
such as agricultural and forestry residues (corn stover, manure, sugar cane bagasse, wood
loggings, branches, bark, and rice hulls), municipal solid waste (food residues, paper, plastic
bottles, and containers) and food processing residues (frying grease, organic solutions and
suspensions, low grade meat, vegetables, and fruits). The main advantage of waste materials
is their low cost. Nevertheless, the large variability of properties, compositional complexity,
and uncertainty of supply are some of the disadvantages of using this type of feedstock [1, 2].
Corn stover belongs to the agricultural residues feedstock group. It represents the
above-ground segment of the corn plant, with the exception of grain. It is comprised of
leaves, husks (including silk), stalk (including tassel), and cobs [7]. Corn stover is composed
of 38-40% cellulose, 28% hemicellulose, 7-21% lignin, and 3-7% ash, on average [8, 9]. It
can be an important feedstock for bioenergy and biorenewable production due to its

8
availability, and proximity to existing biorefineries [10]. According to Kadam and McMillan
[11], about 70% of corn stover produced on no-till farms, and 35% produced on the farms
with conventional tilling means can be collected. This means that on average, 40% of all
available corn stover produced can be harvested in a sustainable manner. At the 40%
theoretical level of collection there is about 82 million dry metric tons of corn stover
available in the US per year. This is in agreement with the quantity of corn stover available
for collection (about 75 million metric tons per year) predicted by USDA and DOE [12]. The
production of corn stover at levels of 75-82 dry Mt/y could yield about 4.8-5.5 billion G/y of
cellulosic ethanol at conversion of 190 g EtOH/kg of biomass [13]. The current ethanol
production from grain ethanol is about 13.5 billion G/y. Thus, cellulosic ethanol produced
from corn stover could increase the total amount of ethanol available in the system by 40-
50%, without increase in land area or change in agricultural practices already employed.
Despite significant amounts of corn stover available for biorenewables production, its
economical utilization may be hindered by factors characteristic for biomass feedstock in
general: environmental concerns because of soil erosion and nutrient removal, high
transportation cost due to dispersed areas of collection, low energy, low bulk density, high
storage cost due to mass loss (respiration and microbial degradation) and low bulk density,
and issues with upgrading due to high moisture content, recalcitrance, and heterogeneity [14,
15].
Lignocellulosic biomass composition
Lignocellulosic biomass is made of three major polymers: cellulose, hemicellulose,
and lignin. Cellulose chains form elementary fibrils that further associate to form cellulose
9
crystallites. Cellulose crystallites are bundled together by hemicelluloses and enclosed in a
matrix of hemicellulose and lignin [16]. Ratio and composition of these constituents depends
on plant species, nutrient availability and exposure to environmental conditions during plant
growth, and plant age [17, 18, 19].
Cellulose is the most abundant organic compound on the Earth. It is located primarily
in the secondary cell wall, and accounts for 30-50% of the dry matter of different plant
species [20]. Cellulose is a homopolymer composed of β-D-glucopyranose units (six carbon
monosaccharide) connected via β-(1-4)-glycosidic bonds. It has a high degree of
polymerization (about 10,000) and large molecular weight (about 500,000) [21]. The strong
tendency to form intra-molecular hydrogen bonds between hydroxyl groups of glucose
monomers results in a planar structure of the macromolecule. Planar structures possess fewer
steric hindrances and enable easy intermolecular connections to form the crystalline regions
responsible for inertness toward chemicals and solvents, as well as high tensile strength [18].
Fewer macromolecule interconnections result in lower density regions known as amorphous
cellulose.
Hemicellulose is a heteropolysaccharide composed of several different monomers. It
accounts for about 15-35% of dry matter of most plants. Unlike cellulose, a hemicellulose
molecule has a low degree of polymerization (about 200). It is a highly branched molecule,
which prevents the formation of hydrogen bonds between polymer chains. Thus,
hemicellulose has an amorphous macromolecular structure with little strength which is
responsible for its relatively easy hydrolysis by weak acids and bases [22]. The composition
and structure of hemicellulose varies between softwood and hardwood, with significant
differences even between branches, stems, and roots [18, 20]. Hemicellulose monomers

10
include hexoses (D-glucose, D-mannose, D-galactose), pentoses (D-xylose, L-arabinose, L-
rhamnose), and small amounts of uronic acids (D-glucuronic, 4-O-methyl-D-glucuronic, and
D-galacturonic acid) [23]. Softwood hemicelluloses consist mainly of galactoglucomannans,
arabinoglucuronoxylan, and arabinogalactan. Hardwood hemicellulose consists of
glucuronoxylan and glucomannan. Nevertheless, the most important hemicelluloses are
xylans and glucomannans [24]. Cellulose and hemicellulose macromolecules connect
through hydrogen bonds and van der Waals forces. Hemicellulose is able to bind to lignin by
covalent chemical bonds [18].
Lignin is a distinct plant polymer due to its highly amorphous structure,
heterogeneity, and aromatic nature. In addition, contrary to other macromolecules found in
plants, there are no plant enzymes capable of lignin degradation [25]. It accounts for about
15-35% of dry matter of biomass, and represents the most abundant natural aromatic
compound [26, 27]. Lignin is a highly branched, complex, hydrophobic polymer composed
of phenylpropanoid units generated by the oxidative polymerization of one or more of the
three hydroxycinnamyl alcohol precursors [28]. These alcohol monomers or monolignols are:
p-coumaryl, coniferyl, and sinapyl alcohol. They form p-hydroxyphenyl, guaiacyl, and
syringyl moieties, respectively, upon incorporation into lignin matrix via radical coupling at
several sites with each other, or within the growing lignin oligomer. Softwood lignin contains
mainly guaiacyl and a smaller fraction of p-hydroxyphenyl residues. Hardwood lignin is
composed primarily of syringyl and guaiacyl residues, with fewer amounts of p-
hydroxyphenyl residuals [29, 30]. Grass lignin has a similar composition to hardwood lignin
with the exception of higher quantities of p-hydroxyphenyl residue [31, 32]. There have been
at least 20 different bond classes identified in the lignin macromolecule, with more than two
11
thirds belonging to ether bonds and the rest being carbon-carbon bonds [18, 33]. Lignin is
physically and chemically attached to other plant polymers, such as hemicellulose and
proteins. Lignin-carbohydrate and lignin-protein complexes are formed via covalent benzyl
ether, benzyl ester, glycosidic, and acetal type bonds, as well as hydroxycinnamic acid
bridges [34, 35]. These complexes are of great importance for plant growth and existence due
to their irreplaceable role in water conduction process through plant tissues, enhancing fiber
strength, and protection from pathogens, insects, and herbivores [35, 36]. In addition, they
obstruct hydrolysis of carbohydrates and limit carbohydrate availability to microorganisms
and animals [37, 38]. Although lignin might be a low value by-product in biochemical
pathways for biorenewables production, it may be well suited for thermochemical pathways
as a significant source of heat energy, and liquid transportation fuels and chemicals [39].
Biomass contains, although only in minute proportions, another fraction composed of
a wide variety of chemical compounds, known as extractives. Average content of extractives
in biomass is 1-15%; however, some trees may have about 30% of the extractives know as
tannins. The highly heterogeneous extractive fraction includes resin acids, fats, terpenes,
flavonoids, lignans, stillbenes, carbohydrates, tannins, and inorganic salts. They can have a
protective role against microorganisms, while some can serve as an energy reserve [40].
Thermochemical biomass conversion technologies
Thermochemical biomass conversion technology represents the process of exposing
organic material to elevated temperatures under an oxygen depleted atmosphere. The aim of
such a process is to thermally break down lignocellulosic material into smaller compounds
that can be utilized directly or more easily upgraded into value-added products [41].

12
Burning biomass in an oxidative environment is the oldest conversion process
practiced by man. Combustion, however, does not intend to produce value-added products in
the form of fuels, chemicals or materials, as other thermochemical conversion technologies,
but only heat energy [20].
Pyrolysis has been used for producing charcoal for the past 38,000 years for a wide
variety of uses, such as heating, cooking, art-making, metallurgy, chemical industry,
purification, soil amelioration, and medicine. Pyrolysis is a thermochemical conversion of
biological material into solid (char), liquid (pyrolysis/bio-oil), and permanents gases, under
an inert atmosphere. Fast pyrolysis has been developed relatively lately. It is different from
traditional pyrolysis where charcoal is product of interest, mainly because it is aimed to
produce liquid fuel that can be used as a substitute for crude oil. It utilizes high heating rates
and short vapor reactor residence time. Bio-oil cannot be utilized directly in internal
combustion engines and thus has to be upgraded in order to be used as a replacement for
gasoline or diesel fuel [42-46].
Gasification is a thermochemical conversion process where the primary goal is to
produce a high yield of hydrogen and carbon monoxide, the gas mixture typically recognized
as syngas. This process is different from pyrolysis, as it uses higher process temperatures and
a partially oxidizing atmosphere [46]. Gasification has been used for over 70 years to
produce a low energy, density gas known as “producer gas” [47]. Syngas can be converted
into oxygenated fuels, hydrogen, alkanes by means of catalysts, and into a broad range of
chemicals through intermediate products, such as methanol [46].
The specificity of hydrothermal processing (HTP) that makes it different from other
thermochemical conversion technologies is the liquid reaction environment. High air

13
temperatures (250-350 ºC and 4-17 MPa) or supercritical water temperatures (above 374 ºC
and 22 MPa) are usually utilized in this process. Under such conditions water serves as a
solvent, reactant, and catalyst to assist in decomposition of lignocellulosic material into bio-
crude (similar to bio-oil) or gaseous products (similar to syngas), depending on temperature
and pressure [48]. It was developed in the mid-1970’s at the Massachusetts Institute of
Technology as a waste treatment technology [20]. The advantage of HTP is a relatively high
efficiency for high moisture biomass conversion, which, however, comes at the expense of
high capital and operating cost.
Torrefaction also belongs to the group of thermochemical biomass upgrading
technologies. This process is conducted in a temperature range of 200-300 ºC, at atmospheric
pressure, and under an inert atmosphere for duration of generally less than 1 hour.
Torrefaction for biorenewables production
Overview of biomass torrefaction process
Torrefaction is sometimes also referred to as roasting, slow- and mild-pyrolysis,
wood cooking and high-temperature drying. The link between torrefaction and drying might
be established due to relatively limited changes in biomass properties in 200-230 ºC
temperature regime. Such material resembles biomass that has only been dried. However,
more intensive torrefaction conditions induce decomposition reactions in biomass that are
also part of the pyrolysis process. The term torrefaction has its origin in French, where it
means roasting. Moreover, this name is used to designate the process of roasting coffee
beans that is conducted at lower temperatures and in an oxidative environment. The purpose

14
of torrefaction of coffee beans is, however, similar to one of the goals of biomass
torrefaction: the enhancement of its brittleness [41, 49, 50].
The attempt to utilize the beneficial effect of torrefaction on biomass properties was
first reported in 1930’s in France, in a trial to improve woody biomass properties for
application as gasifier fuel. Until lately, the only industrial application of the torrefaction
process was in France in 1980’s, under the name the Pechiney process, in which wood
feedstock was torrefied to be used as a reducing agent in the metallurgical industry; the
torrefied wood was used as a coke substitute in the production of silicone. At the same site,
two additional batch plants were built for the production of barbeque fuel and firelighters
[51]. However, this demonstration plant was dismantled a decade later. Pioneering work on
torrefaction at two temperatures and two tropical wood species was conducted and published
in the 1980’s by Bourgois and Doat [52]. Comprehensive work in the field of torrefaction
started about 10 years ago as a part of the effort to develop better feedstock for
biorenewables production, specifically thermochemical conversion technologies. Even
though there is still no existing commercial torrefaction facility, Enviva LP and
ConocoPhillips have created the new company ECo Biomass Technologies in 2011 to
produce and market torrefied wood pellets [53]. The torrefaction facility is scheduled to be
on-line in 2013 and sell products to large power generating facilities.
Torrefaction mechanism
The overall torrefaction process is separated into five stages according to
temperature-time profile, as proposed by Bergman et al. [51]. Stage 1 is the initial heating
stage, during which biomass temperature increases until it reaches 100 ºC and water starts to

15
evaporate (Figure 1). Biomass temperature does not change significantly until all free water
evaporates during stage 2. This is the pre-drying phase. Stage 3 corresponds to post-drying
and intermediate heating stage that occurs between 100 and 200 ºC. During this phase
physically bound water is released. In addition, some dry matter loss occurs due to
evaporation of light organic fractions.
Figure 1. Stages in the torrefaction process (data taken from author’s experiment; a 40 min
drying phase was employed to eliminate the influence of moisture absorbed from the
atmosphere on DML)
Stage 4 or the torrefaction phase, during which the decomposition reaction takes
place, starts once the biomass temperature reaches 200 ºC. The end of the torrefaction phase
is considered to be in the moment when the temperature drops below 200 ºC, even though a
very limited mass loss occurs when the temperature falls below the maximum torrefaction
temperature. The temperature of the torrefaction reaction is defined as the maximum biomass
temperature. The stage 4 is responsible for the largest dry matter loss over the course of the

16
whole process. In the stage 5, cooling of the solid, torrefied biomass down to room
temperature takes place.
Hemicellulose is a more reactive polymer in the torrefaction temperature range than
lignin and cellulose. Most of the dry matter loss of biomass comes from hemicellulose, and
to a much smaller extent, devolatilization of the other two polymers (Figure 2). Since it is
hard to obtain pure hemicellulose in its native state, xylan is routinely used in experiments as
it is the major hemicellulose monomer.
Figure 2. Weight loss of the main biomass constituents [54]
Xylan shows a peak mass loss rate at about 250 ºC, and significant mass loss at the
end of the torrefaction temperature range. Its decomposition can be represented by a two-step
mechanism [55]. The first, fast step takes place in the low temperature regime (below 250 ºC)
comprised mainly of depolymerization reactions that yield a distorted solid intermediate
(Figure 2). The second, slow stage takes place in the range between 250-300 ºC and consists
TG
DTG

17
of reactions that produce char and volatiles. Hardwood hemicellulose is more reactive
because it contains mainly 4-O-methyl glucuronoxylan, whereas softwood contains less
reactive glucomannan and arabinogalactan [56]. Lignin decomposes at a much slower rate,
not only in the torrefaction temperature regime, but also over a much wider range, as justified
by the absence of any significant peak on the mass loss rate curve (DTG, i.e. differential
thermogravimetric signal in Figure 2). It shows a modest mass loss at the end of the
torrefaction stage. Moreover, hardwood lignin is more reactive than softwood lignin [57].
Cellulose is most stable of all three macromolecules in the given temperature range, and the
change in its weight at the end of the torrefaction process is very limited. Major reactions
below 250 ºC are depolymerization reactions. Above this temperature some mass loss in
form of permanent gases and condensables may occur (figure 3).
Figure 3. Changes in polysaccharides and lignin during torrefaction [51]

18
Torrefaction kinetics
Chemical kinetics is the study of the rate of chemical reactions, factors affecting the
reaction rates, and the reaction mechanisms. Knowledge of chemical kinetics is necessary for
the proper reactor design, as well as its safe, optimal, and economical operation. Kinetic
models applied to biomass torrefaction have their origins in the field of pyrolysis [58]. The
majority of these studies have investigated the pyrolysis of cellulose, hemicellulose (xylan)
and lignin separately for the sake of simplicity. In addition, products of a pyrolysis reaction
are lumped together into three broad categories: solid (char), permanent gases, and
condensables (liquid bio-oil). As previously mentioned, torrefaction includes the same
decomposition reactions that occur in the first stages of the pyrolysis process, making
attempts to apply pyrolysis kinetics models to torrefaction a logical step.
A simple kinetics model has been applied to the torrefaction of wood model by
Repellin et al. [59], although Orfao et al. [60] described such model as inappropriate for
studying the pyrolysis of hemicellulose (xylan). It is represented by a one-step reaction (Eq.
1) with only two parameters, kOM1 and EAM1.
(EAM1) (1)
Starting woody biomass, volatiles and char are denoted by A, V and C, respectively.
Three species in the reaction are pseudo components whose compositions are not well
defined. Since the molar masses of these pseudo components are not known, an additional
parameter was introduced in the model to account for experimental yields of char and
volatiles. This parameter f (Eq. 2) is defined as the ratio of molar mass of the pseudo
chemical species, volatiles (MV), and it has to be optimized.

19
(2)
Because volatiles are composed of short chain molecules, they have a lower
molecular weight than the polymers in char fraction. Therefore it is expected for the f ratio to
be lower than 1. Repellin et al. [59] have found that this factor is indeed less than 1 (0.71 and
0.47, for spruce and beach, respectively). The kinetic constants (kOM1 ) were 1.02 x 10⁵ s
-1
and 2.88 x 10⁵
s-1
for spruce and beech, respectively. The authors concluded that this is in
agreement with the experimental results, since it is expected that hardwoods possess higher
reactivity than softwoods. The activation energy (EAM1) has been found to be 92.0 kJ/mol for
spruce and is assumed to be the same for beech. Since the simplified model does not give any
insight into the myriad reactions taking place during thermal decomposition, Orfao et al. [60]
suggested that hemicellulose cannot be well described by simple kinetics. Nevertheless,
authors concluded that it provides a good estimation of the anhydrous weight loss of the two
investigated wood species.
Varhegyi et al. [61, 62] proposed a model consisting of two consecutive reactions to
describe thermal decomposition of xylan (Eq. 3).
(3)
Xylan, designated by letter A, is assumed to form an intermediate reaction product
(B) and volatiles (V1), in the first, faster reaction. This solid intermediate has a lower degree
of polymerization than the starting material. It further reacts to form a final solid product,
char (C), and additional volatile products (V2). An issue with this model is that the yields of
f = MV
MC

20
solid products in the reactions (y1 and y2) are assumed to be constant and temperature-
independent, meaning that the model neglects changes in the final char yield with
temperature.
This kinetic model (Eq. 5), comprising of a two-step mechanism with parallel
reactions, was suggested by Di Blasi and Lanzetta [55].
(4)
The yield of the solid products is given by Eq. 6 and Eq. 7.
(5)
(6)
The fact that the ratio of volatile and solid products increases with an increase in
temperature was incorporated in this model by the inclusion of a distinct reaction for
formation of these two product classes. Even though this might not be correct from the
standpoint of analytical chemistry, Prins et al. obtained a good correlation of the model and
experimental data [56].
Rousett et al. [63] developed the model (system of Eq. 7) that treats wood thermal
decomposition as a superimposition of the decomposition of its main components: lignin (L),
cellulose (Cell.) and hemicellulose (A). According to the model, cellulose decomposes into
tar (T), volatiles, and char in two parallel reactions. Lignin decomposes into char and
fB = kB
kB+ kV1
fC = kC
kC+ kV2

21
volatiles according to a simple one step mechanism. Hemicellulose decomposition proceeds,
according to the Di Blasi-Lanzetta model, via two consecutive and two parallel reactions.
(7)
The ratio of molar masses of volatiles to char needs to be defined both for cellulose
(fL and fCC) and lignin [59]. Nevertheless, Repellin et al. [59] had to reformulate the model
due to nonphysical values obtained for the model parameters (system of Eq. 8).
(8)
Adjusted, Rousset’s model performed well in regards to fitting experimental data.
However, according to the model, beech (hardwood) has a higher reactivity than spruce
(softwood), which is contrary to experimental data available in the literature [51, 56, 66]. In
addition, hypotheses made to adjust the model compromised the Rousset model and the
hypothesis of superimposition. Aforementioned, rendered the Rousset’s model inapplicable
in torrefaction process.

22
Torrefaction product distribution and composition
Major products of biomass torrefaction are generally grouped into solid torrefied
biomass and volatiles (Figure 4). Volatiles are further subdivided into permanent gases and
condensables, according to their state at room temperature.
Figure 4.Typical mass and energy yields in torrefaction of wood at two conditions [64]
The composition and yield of products depend on torrefaction temperature, time, and
biomass physical and chemical properties. Although volatiles can account for up to 30-40%
of the initial biomass weight, they contain only about 10-15% of the energy of the initial
material. This is mainly due to the high oxygen and low energy content of this product
stream. The end result is an increase of energy density of torrefied biomass.
The solid product consists of intact polymers from fractions that are less reactive at
the torrefaction conditions and various products of the reaction (Figure 5). The latter include
oligomers formed via depolymerization and recondensation reactions, short chain organics

23
condensed in the matrix of torrefied biomass, carbonized char-like structures, and mineral
matter present in the original biomass [51, 66].
Figure 5. Composition of the torrefaction reaction products [51]
Permanent gases are generally referred to as the volatile fraction that is in a gas phase
at the room temperature. It includes CO2, CO, and smaller amount of H2, CH4 and other light
C2 hydrocarbons [65, 66]. Carbon dioxide represents the largest fraction of permanent gases.
It is probably formed through decarboxylation reactions of organic acid moieties of the
biomass. CO is the second most abundant permanent gas product. Since it cannot be formed
in decarboxylation and dehydration reactions, its generation is assumed to be via a reaction
between CO2 and water molecules, catalyzed by carbonized torrefied biomass. The liquid
fraction condensed from the stream of volatiles comprise numerous compounds such as
water, acetic, acid, formic acid, methanol, lactic acid, furfural, hydroxyl acetone, and trace
amounts of other organics [66]. Water vapor is generated by evaporation of free and
physically bound water, as well as water produced during the thermal breakdown of biomass.
Acetic acid and methanol originate from acid and alcohol groups attached to hemicelluose

24
chains. In general, water, acetic acid, and methanol are the major constituents of the liquid
faction.
The yield of solid product decreases with an increase in torrefaction temperature
(Table 1) due to the extensive devolatilization of hemicellulose, and cellulose and lignin to a
lesser extent, at temperatures close to 300 ºC. The amount of liquids increases more
significantly with the increase in temperature than the amount of permanent gases. It has
been confirmed that temperature has most significant influence on product yield and
composition [67, 68, 69].
Table 1.Yields of different biomass types torrefied for 1h*
[42]
Biomass Temp.
(ºC) Gas (%)
Liquid
(%) Solid (%)
Solids composition (%) % energy
retained C H O
Pine 230 0.6 7.0 92.4 49.7 5.9 44.3 96.5
Pine 250 1.0 10.8 88.2 50.9 5.8 43.2 94.4
Pine 280 2.1 19.8 78.1 56.4 5.5 38.0 93.9
Bagasse 230 2.6 9.9 87.5 48.6 5.6 45.5 96.4
Bagasse 250 10.4 10.7 78.9 50.6 5.6 43.5 92.0
Bagasse 280 12.9 18.5 68.6 52.8 5.3 41.5 82.9
Birch 250 1.7 12.8 85.5 51.5 5.8 42.5 97.9
Birch 230 0.8 6.0 93.2 48.2 5.9 45.7 93.8
Birch 250 1.2 10.8 88.0 49.5 5.7 44.7 90.0
Birch 280 2.0 19.0 79.0 51.3 5.6 43.0 84.3
Salix 230 1.0 8.0 91.0 45.6 5.9 48.2 94.4
Salix 250 1.5 13.0 85.5 45.8 5.8 48.1 88.4
Salix 280 3.0 18.0 79.0 46.3 5.6 47.7 81.8
Miscanthus 230 1.0 10.0 89.0 44.4 6.1 48.7 87.7
Miscanthus 250 2.0 15.0 83.0 47.4 5.8 46.1 87.7
Miscanthus 280 7.0 24.0 69.0 51.3 5.7 42.4 80.0
Straw Pellets 230 0.1 5.0 95.0 47.8 6.3 45.2 95.1
Straw Pellets 250 0.3 9.8 90.0 49.0 6.1 44.1 91.6
Straw Pellets 280 1.0 19.1 79.9 52.8 6.1 40.3 89.8
Wood Pellets 230 0.06 6.5 96.5 49.8 6.3 43.8 97.5
Wood Pellets 250 0.15 5.5 94.4 50.7 6.2 43.0 96.9
Wood Pellets 280 0.6 10 89.4 52.5 6.2 41.3 96.0
*solids composition expressed on a dry ash-free basis
As can be seen in the Table 1, the yield of solids can drop from above 90% to about
70-75% when the reaction temperature increases from 230 to 280 ºC. The yield of permanent
gases increases significantly, but its absolute amount still represents the smallest fraction of

25
all three. Condensables make a significant portion of the mass balance at 280 ºC (about
20%).
Residence time is another parameter that affects product yield. Several studies
investigated the influence of this factor on torrefaction of lignocellulosic biomass.
Nevertheless, torefaction time was less significant than temperature in all conducted
experiments [70, 71, 72]. Residence time is the important parameter when it comes to reactor
design since it determines the reactor volume necessary to achieve the projected capacity.
Minimum residence time can vary depending on torrefaction temperature, biomass type, its
physical and chemical properties, and intended end use. However, there is a maximum after
which any further increase in residence time does not affect biomass properties significantly.
According to Repellin et al. [60] there is an increase of only 1-5% in average weight loss
when residence time increases from 20 to 40 min. Arias et al. [73] concluded that there was
little improvement in biomass grindability at 240 ºC, if the residence time was longer than
30 min. In their work Bergman et al. [51] concluded that torrefaction should be conducted for
17 min at 280 ºC for co-firing applications.
Particle size also affects the torrefaction reaction, but to a lesser extent than
temperature and residence time. Particle size did not have a significant effect on the
torrefaction of willow in the 0-50mm range [51]. Another study confirmed this finding for
willow and miscanthus [74]. Bergaman et al. [51] speculated that this is the consequence of a
slow, kinetically controlled torrefacion reaction, as characterized by the absence of heat and
mass transfer hindrances. The torrefaction reaction can be endothermic (below 275 ºC) and
exothermic (above 275 ºC) [75, 76]. In spite of being relatively small, energy released in
exothermic reaction still can cause problems in process control due to runaway reactions.

26
Particle size can affect the nature of a torrefaction reaction and cause excessive dry matter
loss [77].
It has been found that high moisture content of raw biomass increases dry matter loss
(DML), especially in the temperature regime below 250 ºC. The difference in DML between
3 and 22% moisture content corn stover could be up to 10% if torrefaction is conducted at a
temperature between 200 and 250 ºC [78]. This is probably due to higher heat capacity and
better heat conduction properties of water/water vapor than nitrogen, which accelerates
torrefaction. In addition, higher availability of water molecules in high moisture content
biomass increases rate of hydrolysis during torrefaction.
Torrefaction reactors
The correct choice of the reactor suitable for torrefaction may be very important
given that each reactor has its distinct properties, and cannot equally process all biomass
types with a wide variety of physical and chemical characteristics.
The first and only commercial torrefaction reactor, employed in the Pechiny process
in 1980’s (France) was an auger reactor. It consisted of a horizontal shell and concentrically
placed auger. The heat was supplied to the process by conduction through both the shell and
auger via thermal oil. Thus, this was an indirectly heated reactor. The biomass plug flow
through the reactor was maintained by the auger. The reactor had accurate temperature
control due to limited heat transfer, but it required a long residence time (60-90 min). Free-
flowing material was necessary for this reactor to operate properly. The biomass fill ratio for
this type of reactor was 60-70% [51].

27
A rotating drum reactor design was experimentally tested for torrefaction by Bergman
et al. [51]. This technology is relatively simple and employs a rotating cylinder with metal
bars along its circumference to help tumble the biomass. The rotating drum reactor can be
heated directly and indirectly. In the directly heated reactor heating medium, usually nitrogen
is in a direct contact with biomass. However, in the indirectly heated system heat is supplied
to the biomass through the reactor wall. A directly heated reactor has good heat transfer
characteristics due to the permanent mixing of biomass; however, directly heated reactor
performs worse than the auger reactor due to lower heat transfer coefficient and longer solids
residence time. Its fill ratio is only about 10-15%, which significantly decreases the reactor
throughput.
A moving bed reactor may be vertical or horizontal. Its advantage is simple, compact
design and high fill ratio (100%). It can also be directly or indirectly heated. In the former
case, very high heat transfer coefficients can be achieved, which translates into short
residence times. A pressure drop in vertical reactor can be significant. Non-free flowing
biomass can be processed in this type of reactor [51].
A fluidized bed reactor has been widely used in the thermochemical conversion of
biomass feedstock, such as pyrolysis, gasification, and combustion. In these reactors the
fluidizing medium (usually gas) is passed through a bed of solid, granular, inert material
(sand) at high velocity, causing the solid to behave as a fluid. The advantages of this
technology are the high heating rate and heat transfer coefficient, as well as the stable and
uniform temperature due to the vigorous mixing, large surface area, and thermal mass of the
heat carrier. Nonetheless, attrition of sand particles makes it hard to separate torrefied

28
biomass from sand, which can increase ash content. Moreover, biomass can be hard to
fluidize due to its irregular shape [80].
Microwave radiation is electromagnetic radiation in the frequency range 0.3-300GHz.
Specialized “microwave chemistry” reactors utilize radiation whose frequency is 2.4GHz.
The same frequency can be used to thermally process biomass. This frequency forces polar
molecules of biomass to oscillate at the resonant frequency and induces friction and heating.
Since the heating is generated in the entire volume of biomass at once, this phenomenon is
known as a volumetric heating. The advantage of microwave torrefaction is the uniform
biomass heating, shorter heating time, small footprint, and accurate control [81, 82].
Wet torrefaction does not refer to any specific reactor design, but to the liquid
environment in which the torrefaction reaction is conducted. This makes it fundamentally
different from dry torrefaction in that there is no biomass drying phase (stage 1 in Figure 1);
the material is processed wet. In this process biomass is treated in hot pressurized water
without phase change of the medium. Product characteristics and distribution do not differ
significantly from common, dry torrefaction. The same effect that dry torrefaction has on
biomass can be achieved at a lower temperature in the wet torrefaction process. The
advantages of this process include a completely inert atmosphere, the high heat capacity of
water, the high heat transfer coefficient between solid and liquid, and the ability to process
high moisture content biomass [83, 84, 85].
Economics
Torrefaction unquestionably has a unique potential to improve the physical and
chemical properties of biomass feedstock, such as grindability, storage stability, and energy

29
density, in a relatively simple manner. However, the implementation of any new technology
might be justified only if its overall economics can be competitive on the market. In order to
determine whether or not the cost of adding an extra unit operation to the production chain
can be offset by the gains in biomass properties, techno-economic analysis is frequently
conducted. Techno-economic analysis of the torrefaction process is hindered by the fact that
there is no commercially proven system available, thus requiring many assumption to be
made.
It has been claimed in the literature that torrefaction can have a significant, positive
effect on biomass transportation, logistics, and utilization. Uslu et al. [86] analyzed an
overseas biomass supply chain for energy and fuel production, and concluded that, on the
basis of overall energy efficiency, torrefaction combined with pelletizing performs better
than pelletizing only, for about 4-16% depending on the end use. In another study it was
found that torrefaction is a more cost effective and environmentally friendly pre-treatment
technology for Fischer-Tropsch production than rotating-cone and fluidized-bed pyrolysis
[87]. Zwart et al. [88] have obtained similar findings from their assessment of overseas
biomass supply chains. They have reported that pre-treatment at the front-end significantly
reduces the production cost, with torrefaction being the most promising technology when
compared to pyrolysis and traditional pelletizing. In addition, overseas, centralized facility
that utilizes low-temperature circulating fluidized bed gasification technology had better
economics than torrefaction, but such large facility would fail from the transportation point
of view, due to an unrealistic number of trucks required to supply feedstock. Bergman et al.
[51] analyzed several potential torrefaction reactor designs and concluded that the moving
bed could be economically attractive. In another study Bergman et al. [88] have found that

30
torrefaction combined with pelletizing may have significant economic potential if
incorporated in the biorenewables production chain.
Properties and applications of torrefied biomass
Appearance. Biomass undergoes a change in color during the torrefaction process
that corresponds to changes in, both chemical and physical characteristics. Since the
torrefaction temperature range is relatively wide (200-300 ºC), the color of raw biomass can
be altered to different extents, ranging from shades slightly darker than the original material
to black, depending mainly on the temperature. Even though torrefied biomass retains the
shape and dimensions of raw biomass, it has a lower bulk density due to devolatilization and
drying. Moreover, it can appear as friable to the touch as original biomass or significantly
more, depending on the treatment temperature.
Grindability. One of the most important benefits of the torrefaction process is the
enhancement of biomass brittleness, which translates into its improved grindability. Biomass
grindability is an important property not only for direct co-firing in existing coal-fired power
plants but also for gasification and pyrolysis, especially in pulverized and fluidized bed
systems. The tenacious, fibrous structure of biomass makes size reduction very energy
intensive and a cost ineffective process. In addition, ground raw biomass includes a
combination of spherical particles and fibers that encumber proper dispersion and
fluidization [75]. In order to be suitable for utilization in existing power production systems,
biomass has to have properties similar to coal. Bergman et al. [51] have found that grinding
torrefied biomass required only 10-30% of energy needed for comminution of untreated
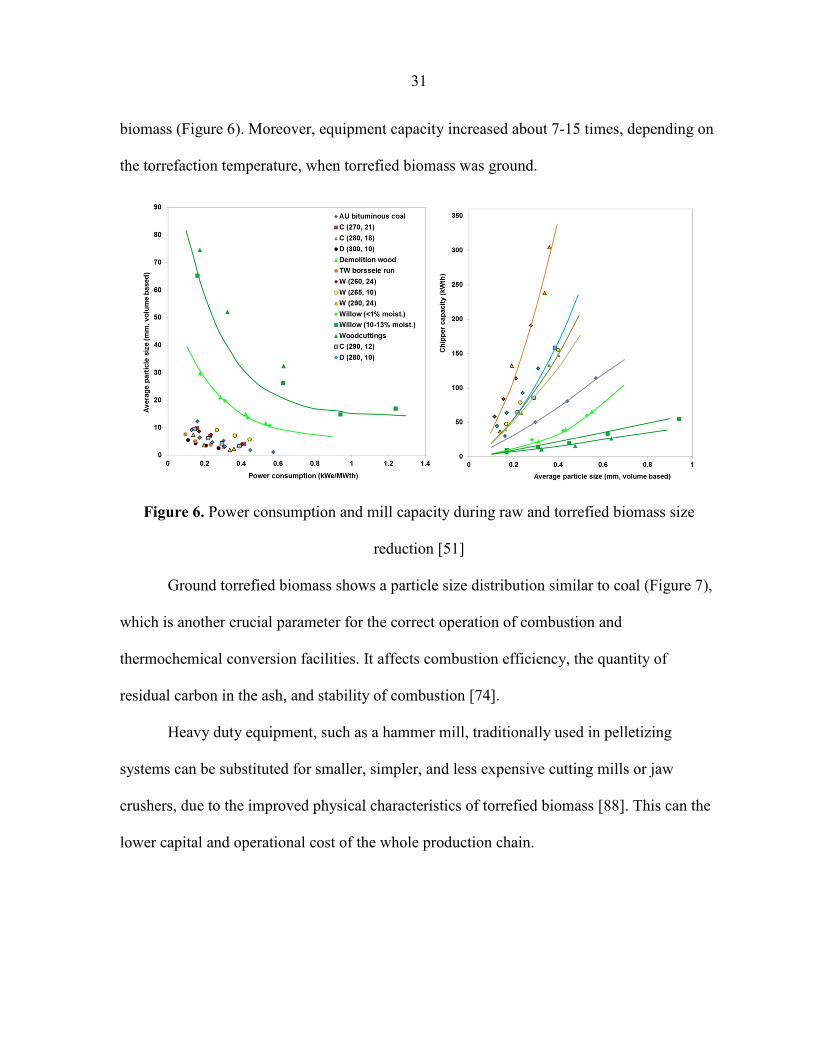
31
biomass (Figure 6). Moreover, equipment capacity increased about 7-15 times, depending on
the torrefaction temperature, when torrefied biomass was ground.
Figure 6. Power consumption and mill capacity during raw and torrefied biomass size
reduction [51]
Ground torrefied biomass shows a particle size distribution similar to coal (Figure 7),
which is another crucial parameter for the correct operation of combustion and
thermochemical conversion facilities. It affects combustion efficiency, the quantity of
residual carbon in the ash, and stability of combustion [74].
Heavy duty equipment, such as a hammer mill, traditionally used in pelletizing
systems can be substituted for smaller, simpler, and less expensive cutting mills or jaw
crushers, due to the improved physical characteristics of torrefied biomass [88]. This can the
lower capital and operational cost of the whole production chain.

32
Figure 7. Particle size distribution of coal, raw and torrefied willow & miscanthus [74]
Hydrophobicity. Hydrophobicity plays an important role in the storage of biomass
feedstock, since a large amount of biomass needs to be stored to support year-round
biorefinery, or power plant operation. Hydrophobicity decreases the quantity of excess water
that needs to be transported and removed in the combustion or upgrading steps, thus
increasing overall cost. Furthermore, extra water makes biomass a suitable medium for
microorganism growth [51, 89, 90]. Torrefaction improves the water repelling characteristics
of biomass through the elimination of hydroxyl groups responsible for hydrogen bonding
with water molecules, and the generation of a non-polar, hydrophobic compound [90, 91].
According to Acharjee et al. [90], the equilibrium moisture content of biomass
dropped from 15 (raw biomass) to about 5% after wet torrefaction at 260 ºC. Bergman et al.
[88] conducted a 15 hour water uptake test on pelletized, torrefied biomass by submerging it
in the water. The condition of the pellets was observed, while water uptake was determined
gravimetrically. They concluded that torrefied pellets did not change significantly (swelling,
disintegration) compared to raw biomass pellets, and absorbed about 7-20% moisture on a
weight basis. Hydrophobicity of torrefied biomass briquettes was assessed by Felfli et al.
[92]. They have found that water uptake decreased 73% after torrefaction, compared to

33
untreated biomass, probably due to tar condensation in the biomass particle and the formation
of a hydrophobic chemical species. However, hydrophobicity decreased with an increase in
torrefaction temperature most likely because of an increase in porosity. Felfli et al.
investigated nature of torrefied pellets in regards to water uptake and reported findings
similar to Bergman et. al. [51]. Torrefied pellets were more durable than raw biomass pellets,
as justified by the absence of crumbling and excessive swelling.
Energy density. Chemical species rich in oxygen and hydrogen, such as water, acetic
acid, methanol, and carbon dioxide are released via devolatilization of the raw biomass
during the torrefaction process. Since these compounds contain more oxygen and hydrogen
than carbon, the O/C and H/C ratio of torrefied biomass decreases. The change in the
biomass O/C and H/C ratio upon torrefaction is depicted and compared to coal by van
Krevelen diagram (Figure 8).
Figure 8. Van Krevelen diagram showing change in the biomass O/C and O/H ratio after
torrefaction [64]

34
This change in the chemical properties of biomass is valuable for gasification, since
organic material with high oxygen content causes excessive oxidation and reduces process
thermal efficiency [64, 67]. Moreover, the energy density of biomass increases as a
consequence of oxygen loss during torrefaction. This increase can be in the range between
102-120%, depending on reaction conditions [42]. Energy and bulk density of torrefied
biomass can be further improved via pelletizing.
Combustion properties. The combustion conversion of torrefied woody biomass
(about 95%) was found to be comparable to untreated wood and considerably higher than
high- and low-volatile bituminous coal (about 80 and 60%, respectively). The high fixed
carbon content of torrefied biomass indicates high reactivity. Moreover, complete carbon
conversion can be expected. This implies that complete conversion can be reached in co-
firing systems [51]. Bridgeman et al. [69] investigated combustion properties of torrefied
biomass and concluded that there exists numerous differences between untreated and
torrefied biomass. Moreover, combustion of the volatiles released during torrefied biomass
combustion took place over the shorter temperature range and generated a higher heat of
combustion. Torrefied biomass created a greater heat of combustion due to a higher fixed
carbon content. In addition, the ignition time of volatiles and char decreased as a
consequence of torrefaction, which could be an advantage during combustion.
Gasification properties. Prins et al. [64] assessed the properties of torrefied biomass
for gasification using several reactor systems: air-blown gasification of wood, air-blown
gasification of torrefied wood in a circulating fluidized-bed, and oxygen-blown gasification
of torrefied wood in an entrained-flow gasifier. They concluded that the overall efficiency of
the air-blown gasification of torrefied wood was lower than the gasification of untreated

35
wood. However, upon integration of torrefaction and gasification processes, overall
efficiency increases to a level comparable to gasification of raw wood. Svoboda et al. [93]
have found that torrefaction with grinding below 0.2 mm can be beneficial for gasification
due to the minimization of overall loss, ease of feeding, and high specific energy of torrefied
biomass. The gasification of torrefied biomass can be done at elevated pressures, which may
be useful for downstream energy production in turbines or for production of chemicals.
Nonetheless, this cannot be achieved with raw biomass due to issues with its feeding in
pressurized systems [94].
References
1. Demirbas A. Biofuels. Springer: London, UK, 2009.
2. Montross M., Crofcheck C. Energy Crops for the Production of Biofuels. In
Thermochemical Conversion of Biomass to Liquid Fuels and Chemical. Croker M., Ed.
RSC Publishing: Cambrige, UK, 2010, pp 26-45.
3. Huber G.W., Corma A. Synergies between Bio- and Oil Refineries for the Production of
Fuels from Biomass. Angew. Chem. Int. Ed. 2007, 46, 7184-7201.
4. Brown R. C. Biorenewable Resources: Engineering New Products from Agriculture.
Blackwell Publishing Professional: Ames, IA, 2003.
5. Hohenstein W.G., Wright L.L. Biomass energy production in the united states: An
overview. Biomass Bioenerg. 1994, 6, 161-173.
6. Graham R.L. An analysis of the potential land base for energy crops in the conterminous
United States. Biomass Bioenerg. 1994, 6, 175-189.
7. Demirbas A. Conversion of Corn Stover to Chemicals and Fuels. Energy Sciences, Part A
2008, 30, 788-796.
8. Ganjyal G.M., Reddy N., Yang Y.Q., Hanna M.A. Biodegradable Packiging Foams of
Starch Acetate Blended with Corn Stalk Fibers. J. Appl. Ploy. Sci. 2004, 93, 2627-2633.

36
9. Reddy N. Structure and properties of natural cellulose fibres obtained from cornhusks,
cornstalks, rice, wheat, soybean straw and sorghum stalks and leaves. Ph.D. Dissertation,
University of Nebraska, Lincoln, NE, 2006.
10. Pordesimo L.O., Hames B.R., Sokhansanj S., Edens W.C. Variation of corn stover
composition and energy content with crop maturity. Biomass Bioenerg. 2005, 28, 366-
374.
11. Kadam K.L., McMillan J.D. Availability of corn stover as a sustainable feedstock for
bioethanol production. Bioresour. Technol. 2003, 88, 17-25.
12. Perlack R.D., Wright L.L., Turhollow A.F., Graham R.L., Stokes B.J., Erbach D.C.
Biomass as feedstock for bioenergy and bioproducts industry: the technical feasibility of
a billion-ton annual supply. DOE/GO-102995-2135 and ORNL/TM-2005/66. NTIS,
Springfield, VA, 2005.
13. Lau M.W., Dale B.E. Cellulosic ethanol production from AFEX-treated corn stover
using Saccharomyces cerevisiae 424A(LNH-ST). Proc. Natl. Acad. Sci. U. S. A. 2009,
106, 1368-1373.
14. Hettenhaus J.R., Wooley R., Wiselogel A. Biomass Commercialization Prospects in the
Next 2-5 Years. NREL report no. NREL/SR-580-28886, DOE-AC36-99-GO10337,
NREL, Golden, CO, 2000.
15. Gold S., Seuring S. Supply chain and logistics issues of bio-energy production. J. Clean
Prod. 2011, 19, 32-42.
16. Ramos L.P. The chemistry involved in the steam treatment of lignocellulosic materials.
Qui. Nova 2003, 26, 863-871.
17. Goyal C.G., Fischer J.J., Krohn M.J., Packwood R.E., Olson J.R. Variability in pulping
and fiber characteristics of hybrid poplar trees due to their genetic makeup,
environmental factors, and tree age. TAPPI J. 1999, 82, 141-147.
18. Sjorstrom E. Wood Chemistry: Fundamental and Applications. Academic Press: London,
UK, 1981.
19. Mandre M. Responses of Norway spruce (Picea abies L.) to wood ash application. For.
Stud. 2005, 42, 34-47.

37
20. Basu P. Biomass Gasification and Pyrolysis: Practical Design. Academic Press:
Burlington, MA, 2010.
21. Klass D.L. Biomass for Renewable Energy, Fuels, and Chemicals. Academic Press: San
Diego, CA, 1998.
22. Erbingerova A., Hromadkova Z., Heinze T. Hemicellulose. Adv. Plym. Sci. 2005, 186, 1-
67.
23. Ramos L.P., Fontana J.D. Enzymatic Saccharification of Cellulosic Materials. Methods
Biotechnol. 2004, 16, 219-233.
24. Girio F.M., Fonseca C., Carvalheiro F., Duarte L.C., Marques S., Bogel-Lukasik R.
Hamicelluloses for fuel ethanol: A review. Bioresour. Technol. 2010, 4775-4800.
25. Sedorf R.R., MacKey J.J., Ralph J., Hatfield R.D. Unexpected variation in lignin. Curr.
Opin . Plant. Biol. 1999, 2, 145-152.
26. Brebu M., Vasile C. Thermal degradation of lignin-A review. Cellulose Chem. Technol.
2010, 44, 353-363.
27. Lora J.H., Glasser W.G. Recent Industrial Applications of Lignin: A Sustainable
Alternative to Nonrenewable Materials. J. Polym. Environ. 2002, 10, 39-48.
28. Boudet A.M., Lapierre C., Grima-Pettenati J. Biochemistry and molecular biology of
lignification. New Phytol. 1995, 129, 203-236.
29. Whetten R.W., MacKey J.J., Sederoff R.R. Recent advances in understanding lignin
biosynthesis. Annu. Rev.Plant Physiol. 1998, 49, 585-609.
30. Adler E., Lunquist K., Miksche G.E. The Structure and Reactivity of Lignin. Adv. Chem.
Ser. 1996, 59, 22-35.
31. El Hage R., Brosse N., Chrusciel L., Sanchez C., Sannigrahi P., Ragauskas A.
Characterization of milled wood lignin and ethanol organosolv from miscanthus. Plym.
Degrad. Stab. 2009, 94, 1632-1638.
32. Buranov A.U., Mazza G. Lignin in straw of herbaceous crops. Ind. Crop. Prod. 2008, 28,
237-259.
33. Hatfield R., Vermerris W. Lignin Formation in Plants. The Dilemma of Linkage
Specificity. Plant Physiol. 2001, 126, 1351-1357.

38
34. Whitmore F.W. Lignin-protein complex in cell walls of pinus elliottii: amino acid
constituents. Phytochemistry 1982, 21, 315-318.
35. Iiyama K. Lam T.B.T. Covalent cross-links in the cell wall. Plant. Physiol. 1994, 104,
315-320.
36. Khanam L.A.M., Talukder D., Hye M.A. Toxic and repellent action of sugarcane
bagasse-based lignin against some stored grain insect pests. Univ. J. Zool. Rajshahi Univ.
2006, 25, 27-30.
37. Ferguson L.R., Chavan R.R., Harris P.J. Changing concepts of dietary fibre: Implications
for carcinogens. Nutr. Cancer. 2001. 39, 155-169.
38. Grabber J.H. How Do Lignin Composition, Structure, and Cross-Linking Affecting
Degradability? A Review of Cell Wall Model Studies. Crop Sci. 2005, 45, 820-831.
39. Holladay J.E., Bozell J.J., White J.F., Johnson D. Top Value-Added Chemicals from
Biomass. Volume II-Results of Screening for Potential Candidates from Biorefinery
Lignin. PNNL-16983, DE-AC05-76RL01830, 2007.
40. Rowell R.M., Pettersen R., Han J.S., Rowell J.S., Tshabalala M.A. Cell Wall Chemistry.
In Hanbook of Wood Chemistry and Wood Composites. Rowell R.M., Ed. CRC Press:
Boca Raton, FL, 2005, pp. 35-76.
41. Biomass feedstock composition and property database.
http://www.eere.energy.gov/biomass/progs/search1.cgi.
42. Ciolkosz D., Wallace R. A review of torrefaction for bioenergy feedstock production.
Biofuels, Bioprod. Biorefin. 2011, 5, 317-329.
43. Antal, M.J., M. Gronli. The art, science and technology of charcoal production. Industrial
and Engineering Chemistry Research, 42, 1619-1640, 2003.
44. Bell, M.J., F. Worrall. Charcoal addition to soils in NE England: A carbon sink with
environmental co-benefits? Sci. Total Environ. 2011, 409, 1704-1714.
45. Rousset, P., C. Figueiredo, M. De Souza, W. Quirino. Pressure effect on the quality of
eucalyptus wood charcoal for the steel industry: A statistical approach. Fuel Process.
Technol., 92, 1890-1897, 2011.
46. Mohan D., C.U. Pittman, P.H. Steele. Pyrolysis of wood/biomass for bio-oil: A critical
review, Energ. Fuel. 2006, 20, 848-889.

39
47. Huber G.W., S. Iborra, A. Corma. Synthesis of transportation fuels from biomass:
chemistry, catalysis and engineering. Chemical Reviews, 106, 4044-4096.
48. Neathery, J.K. Biomass gasification. In Thermochemical Conversion of Biomass to
Liquid Fuels and Chemical. Croker M., Ed. RSC Publishing: Cambrige, UK, 2010, pp.
68-94, 2006.
49. Savage P.E., Levine R.B., Huelsman C.M. Hydrothermal Processing of Biomass. In
Thermochemical Conversion of Biomass to Liquid Fuels and Chemical. Croker M., Ed.
RSC Publishing: Cambrige, UK, 2010, pp. 192-221.
50. Van der Stelt M.J.C., Gerhauser H., Kiel J.H.A., Ptasinski K.J. Biomass upgrading by
torrefaction for the production of biofuels: A review. Biomass Bioenerg. 2011, 35, 3748-
3762.
51. Bergman, P. C., Boersma, A. R., Zwart, R. W. R., Kiel, J. H. A. Torrefaction for biomass
co-firing in existing coal-fired power stations (Biocoal). ECN-C--05-013, Energy
Research Centre of the Netherlands: Petten, NL, 2005.
52. Bourgeois, J. P., Doat, J. Torrefied Wood from Temperate and Tropical Species.
Bioenergy 1984, 3, 153-159.
53. Enviva. http://www.envivabiomass.com/press-releases/conocophillips-enviva-lp-partner-
to-develop-torrefied-wood-pellet-business/
54. Yang H., Yan R., Chen H., Zheng C., Lee D.H., Liang D.T. In-Depth Investigation of
Biomass Pyrolysis Based on Three Major Components: Hemicellulose, Cellulose and
Lignin. Energy Fuels 2006, 20, 388-393.
55. Di Blasi C., Lanzetta M. Intrinsic kinetics of isothermal xylan degradation in inert
atmosphere. J. Anal. Appl. Pyrolysis 1997, 40-41, 287-303
56. Prins M.J., Ptasinski K.J., Jansen F.J.J.G. Torrefaction of wood. Part 1. Weight loss
kinetics. J. Anal. Appl. Pyrolysis 2006, 77, 28-34.
57. Muller-Hagedorn M., Bockhorn H., Krebs L., Muller U. A comparative study on the
pyrolysis of three different wood species. J. Apnal. Appl. Pyrolysis 2003, 68-69, 231-249.
58. Chew J.J., Doshi V. Recent advantages in biomass pretreatment – Torrefaction
fundamentals and technology. Renew. Sust. Energ. Rev. 2011, 15, 4212-4222.

40
59. Repellin V. Govin A., Rolland M., Guyonnet R. Modelling anhydrous weight loss of
wood chips during torrefaction in a pilot kiln. Biomass Bioenerg. 2010, 34, 602-609.
60. Orfao J.J.M., Antunes F.J.A., Figueiredo J.L. Pyrolysis kinetics of lignocellulosic
materials – three independent reaction models. Fuel 1999, 78, 349-358.
61. Varhegyi G., Antal M.J., Jakab E., Szabo P. Kinetic modelling of biomass pyrolysis. J.
Anal. Appl. Pyrolysis 1997, 42, 73-87.
62. Varhegyi G., Anatal M.J., Szekely T., Szabo P. Kinetics of the Thermal Decomposition
of Cellulose, Hemicellulose, and Sugar Cane Bagasse. Energy Fuel 1989, 3, 329-335.
63. Rousset P, Turner I, Donnot A, Perre´ P. The choice of a low-temperature pyrolysis
model at the microscopic level for use in a macroscopic formulation. Ann. For. Sci. 2006,
63, 213–229.
64. Prins M.J., Ptasinski K.J., Janssen F.J.J.G. More efficient biomass gasification via
torrefaction. Energy 2006, 31, 3458-3470.
65. Pach M, Zanzi R, Bjørnbom E. Torrefied biomass a substitute for wood and
charcoal. In Proceedings of the 6th Asia-Pacific International Symposium on
Combustion and Energy Utilization, Kuala Lumpur, Malaysia, 2002. (I 34 U TABELI 1)
66. Prins M.J., Ptasinski K.J., Jansen F.J.J.G. Torrefaction of wood. Part 2. Analysis of
products. J. Anal. Appl. Pyrolysis 2006, 77, 35-40.
67. Couhert C., Salvador S., Commandre J. Impact of torrefaction on syn-gas production
from wood. Fuel 2009, 88, 2286–2290. (33 U TABELI 1)
68. Zanzi R., Ferro D., Torres A., Soler P.B., Bjornbom E. Biomass torrefaction,. In Second
World Conference and Technology Exhibition on Biomass for Energy, Industry and
Climate Protection, Rome, Italy, 2004. (32 u tabeli 1).
69. Bridgeman T.G., Jones, J.M., Shield, I., Williams, P.T. Torrefaction of reed canary
grass, wheat straw and willow to enhance solid fuel qualities and combustion
properties. Fuel 2008, 87, 844–856.
70. Pimchuai, A., Dutta, A., Basu, P. Torrefaction of agriculture residue to enhance
combustible properties. Energy and Fuel 2010, 24, 4638–4645.

41
71. Ferro, D. T., Vigouroux , V., Grimm, A., Zanzi, R., Torrefaction of agricultural and
forest residues. In Proceedings of Cubasolar International Conference, Guantanamo,
Cuba, 2004.
72. Kargbo F.R., Xing J., Zhang Y., . Pretreatment for energy use of rice straw: A
review. African Journal of Agricultural Research 200, 94, 1560-1565.
73. Nimlos, M.N., Brooking, E., Looker, M.J., Evans, R.J. Biomass torrefaction studies with
a molecular beam mass spectrometer. Prep. Pap.-Am. Chem. Soc., Div. Fuel Chem.
2003, 48, 590-591.
74. Bridgeman T.G., Jones, I., Williams, P.T., Waldron D.J. An investigation of the
grindability of two torrefied energy crops. Fuel 2010, 89, 3911-3918.
75. Arias B, Pevida C., Fermoso J., Plaza M.G., Rubiera F., Pis J.J Influence of the
torrefaction on gindability and reactivity of woody biomass. Fuel Process. Technol.
2008, 89, 169-175.
76. Yan W, Hastings J, Acharjee T, Coronella C and Vasquez V, Mass and energy balances
of wet torrefaction of lignocellulosic biomass. Energ. Fuel 2010, 24, 4738–4742.
77. Lipinsky RS, Arcate JR and Reed T, Enhanced wood fuels via torrefaction. Am. Chem.
Soc. Div. Fuel Chem. 2002, 47, 408–410.
78. Turner, I., Rousset, P., Remond, R., Perre, P., . An experimental and theoretical
investigation of the thermal treatment of wood (Fagus sylvatica L.) in the range
200-260 °C. Int. J. Heat Mass Trans. 2010, 53, 715-725.
79. Medic D, Darr M, Potter B, Shah A. Effect of torrefaction process parameters on biomass
feedstock upgrading. Fuel 2012, 91, 147-154.
80. Li H., Liu X., Legros L., Bi X.T., Lim C.J., Sokhansanj S. Torrefaction of sawdust in a
fluidized bed reactor. Bioresource. Technol. 2012, 103, 453-458.
81. Budarin, V.L., Milkowski, K.J., Shuttleworth, P., Lanigan, B., Clark, J.H., Macquarrie,
D.J., Wilson, A., Microwave torrefaction of biomass, US PatentUS 2011/021979 A1,
07.01.2010.
82. Ren S., Lei H., Julson J., Wnag L., Bu Q., Ruan R. Microwave Torrefaction of Corn
Stover. Paper 1110765. Annual International Meeting of the ASABE, Louisville, KN,
2010.

42
83. Yan W, Hastings J, Acharjee T, Coronella C and Vasquez V, Mass and energy balances
of wet torrefaction of lignocellulosic biomass. Energ. Fuel 2010, 24, 4738–4742.
84. Allen S, Kam L, Zemann A and Antal M, Fractionation of sugar cane with hot,
compressed, liquid water. Ind. Eng. Chem. Res 1996, 35, 2709–2715.
85. Petchpradab P, Yoshida T, Charinpanitkul T and Matsumura Y, Hydrothermal pre-
treatment of rubber wood for the saccharification process. Ind. Eng. Chem. Res. 2009, 48,
4587–4591.
86. Uslu A., Faaij A., Bergman P. Pre-treatment technologies, and their effect on
international bioenergy supply chain logistics. Techno-economic evaluation of
torrefaction, fast pyrolysis and pelletisation. Energy 2008, 33, 1206 –1223.
87. Magalhaes A., Petrovic D., Rodriguez A., Putra Z., Thielemans G. Techno-economic
assessment of biomass pre-conversion processes as a part of biomass-to-liquids line-up.
Biofuels, Bioprod. Biorefin. 2009, 3, 584–600.
88. Bergman, P. C., Boersma, A. R., Zwart, R. W. R., Kiel, J. H. A. Combined torrefaction
and pelletisation. The TOP process. ECN-C--05-073, Energy Research Centre of the
Netherlands: Petten, NL, 2005.
89. Sadaka, S., Negi, S.Improvements of biomass physical and thermochemical
characteristics via torrefaction process. Environ. Prog. Sustainable Energy 2009, 28,
427–434.
90. Acharjee T.C., Coronella C.J., Vasquez V.R. Effect of thermal pretreatment on
equilibrium moisture content of lignocellulosic biomass. Bioresour. Technol. 2011, 102,
4849-4854.
91. Kobayashi, N., Okada, N., Hirakawa, A., Sato, T., Kobayashi, J., Hatano, S., Itaya, Y.,
Mori, S.,. Characteristics of solid residues obtained from hot-compressed-water treatment
of woody biomass. Ind. Eng. Chem. Res. 2009, 48, 373–379.
92. Felfli, F.F., Luengo, C.A., Suarej, J.A., Beaton, P.A. Wood briquette torrefaction. Energy
Sustainable Dev. 2005, 9, 19-22.
93. Svoboda K, Pohorely M, Hartman M and Martinec J. Pre-treatment and feeding of
biomass for pressurized entrained fl ow gasifi cation. Fuel Process. Technol. 2009, 90,
629–635

43
94. Deng J, Wang G, Kuang J, Zhang U and Luo Y. Pre-treatment of agricultural residues
for co-gasifi cation via torrefaction. J. Anal. Appl. Pyrol. 2009, 86, 331–337.
44
Chapter 3. Effects of torrefaction process parameters on biomass
feedstock upgrading
A paper published in Fuel
D. Medic *, M. Darr, A. Shah, B. Potter, and J. Zimmerman
Department of Agricultural and Biosystems Engineering, Iowa State University, 100
Davidson Hall, Ames, IA 50011, USA
* Corresponding author. E-mail address: [email protected] (D. Medic)
Abstract
Biomass is a primary source of renewable carbon that can be utilized as a feedstock
for biofuels or biochemicals production in order to achieve energy independence. The low
bulk density, high moisture content, degradation during storage and low energy density of
raw lignocellulosic biomass are all significant challenges in supplying agricultural residues
as a cellulosic feedstock. Torrefaction is a thermochemical process conducted in the
temperature range between 200 and 300 °C under an inert atmosphere, which is currently
being considered as a biomass pretreatment. Competitiveness and quality of biofuels and
biochemicals may be significantly increased by incorporating torrefaction early in the
production chain, while further optimization of the process might enable its autothermal
operation. In this study, torrefaction process parameters were investigated in order to
improve biomass energy density, and reduce its moisture content. The biomass of choice
(corn stover) was torrefied at three moisture content levels (30, 45 and 50%), three different
temperatures (200, 250 and 300 °C), and three unique reaction times (10, 20 and 30 min).

45
Solid, gaseous, and liquid products were analyzed, and the mass and energy balance of the
reaction was quantified. An overall increase in energy density (2-19%) and decrease in mass
and energy yield (3-45% and 1-35% respectively) was observed with the increase in process
temperature. Mass and energy losses also increased with an increase in the initial biomass
moisture content.
Keywords. Biomass; corn stover; torrefaction; pretreatment.
Introduction
Energy has always played an important role in life, survival, and the development of
mankind. Even though it has been superseded by more potent fossil energy sources during
the last 200 years, biomass has played a major role in supplying energy since the beginning
of civilization, and still plays an important role in economies of developing countries.
Biomass recently has received renewed attention worldwide, mainly as a consequence of
high and volatile oil prices, and global climate changes caused by increased fossil fuel
consumption. Moreover, rapid economic growth in developing countries, high dependence
on global and local transportation, pollution, depletion of sources, and endangered national
security of energy importing countries have raised the awareness of the need for non-fossil
based renewable energy sources [1-3]. Among renewable energy sources, such as wind,
solar, geothermal, wave, tidal and ocean thermal, biomass is the most likely short term
energy source, with mature and readily applicable conversion technologies for the production
of transportation compatible liquid fuels. Although in the long term other forms of renewable
energy may supersede biomass it will still remain as the only source of renewable carbon
needed for chemicals and synthetic materials production.
46
According to the Renewable Fuel Standard (RFS) from the Energy Independence and
Security Act of 2007, the minimum annual quantity of renewable fuel in the US
transportation sector should be increased from 9 billion in 2008 to 36 billion gallons in 2022,
where after 2016 most of renewable fuel must be advanced biofuel derived from cellulosic
feedstocks instead of food crops [4]. In order to sustain production demanded by the RFS
significant amounts of lignocellulosic biomass has to be collected, stored, and converted into
biofuels.
The low bulk density, high moisture content, and low energy density of biomass
feedstocks have a negative effect on the feasibility of long distance feedstock transportation.
Moreover, in order to supply a feedstock for continuous operation of biorefineries year
round, biomass has to be collected from large and often distant areas and hauled either to
local storage facilities, or to a refinery where it would be stored until conversion.
Unfavorable physical properties of biomass dictate utilization of large storage facilities,
which would further compromise economical use of biomass feedstock. In addition, storing
such large amounts of wet biomass will further increase expenses through the high rate of dry
matter loss due to microbial activity and the hazard of self-heating/combustion [5-8].
Thermochemical conversion technologies, such as pyrolysis, gasification and
hydrothermal processing, along with biomass co-firing in existing coal fired power plants,
might have an important role in the production of heat energy, advanced energy carriers,
chemicals, solvents, and materials. However, all aforementioned technologies have strict
demands regarding the physical condition of biomass feedstocks, such as particle size and
shape which are conducive to optimal processing. Additionally the final end product
characteristics and yields are also influenced by feedstock quality and composition [2].

47
Moreover, due to the recalcitrant nature of biomass it is difficult to grind it in a continuous
and cost effective manner [7]. Heterogeneity of feedstocks can also influence refinery
operation considering not only different types of biomass, for example demolition wood,
agricultural residues, and dedicated energy crops, or different plant species, but also the same
plant species grown in different areas [9, 10].
Torrefaction, sometimes also referred to as mild-pyrolysis, is a thermochemical
process conducted in the temperature range between 200 and 300 °C, under an inert
atmosphere and low heating rate. Torrefaction is currently being considered as a biomass
feedstock pretreatment particularly for thermal conversion systems. During torrefaction
various permanent gases and condensables, with high oxygen content, are formed mainly due
to hemicellulose degradation. As a consequence the final solid product, so called torrefied
biomass, will be composed mainly of cellulose and lignin, and characterized by increased
brittleness, hydrophobicity, microbial degradation resistance, and energy density. Thus
torrefaction can play a significant role in decreasing transportation and storage costs of large
quantities of biomass needed to sustain biofuels production. In addition, torrefaction may
have positive effect on pyrolysis, gasification, and co-firing units operation by lowering
power consumption and cost for biomass grinding, eliminating compounds responsible for
high acidity of pyrolysis oil, and by increasing the uniformity of biomass feedstocks [9-12].
About 30 years ago, the process of torrefaction was first utilized and operated
commercially for the production of a reducing agent for the metallurgical industry, but since
then it has received little attention. There have been several studies that investigated the
effects of torrefaction on biomass properties and the composition of different fractions
released during the process, but the majority of these have focused on dry woody biomass
48
which was finely ground before torrefaction. These experiments were conducted by utilizing
either thermogravimetric analysis equipment (TGA) or small scale reactors [7, 10, 13, 14].
Since agricultural residues will play an important role in the production of advanced biofuels
more research is needed to investigate the optimum torrefaction conditions for such
feedstock.
The potential for torrefaction of agricultural residues immediately after the harvest,
without drying and before significant size reduction should be investigated in order to
incorporate torrefaction early in the supply chain, and maximize the benefit of the physical
property changes induced through torrefaction. In this research the influence of torrefaction
reaction time, temperature, and moisture content on the quantity and composition of torrefied
corn stover was investigated. Quantitative and qualitative data from the analysis of solids,
permanent gases, and condensable volatiles were used to investigate mass and energy flows
in the torrefaction process. A Box-Behnken design of experiments was utilized in this
research to statistically model the torrefaction process in terms of mass and energy yields,
and evaluate the significance of temperature, time, and untreated corn stover moisture
content as predictors of response variables. The results from this work will provide
knowledge not only related to the influence of process parameters (time and temperature),
but also related to the effect of moisture content of an untreated feedstock on the torrefied
biomass characteristics.

49
Methods
Samples
Corn stover samples, harvested during the fall 2009, were obtained from Department
of Agricultural and Biosystems Engineering at Iowa State University, Ames, Iowa. Corn
stover biomass is a highly available agricultural residue in the Midwest, and has been
proposed as a feedstock for advanced biofuels production. After harvest samples were stored
in a cooling chamber at 3-5 °C to prevent feedstock degradation and minimize moisture loss.
Field harvested corn stover at 22 and 41% moisture content were selected as the
medium and high test moisture levels. Additional corn stover was dried to provide a suitable
low moisture test level. The size of samples was reduced in a hammer mill equipped with 25
mm screen.
Torrefaction Reactor
Torrefaction experiments were conducted in 2 liters stainless steel fixed bed reactor
with 0.1m diameter and 0.25m height, heated by three ceramic heaters in close contact with
the reactor wall and separately controlled by PID controllers. This setup was used for coarse
control of temperature, while fine temperature control was performed through circulation of
preheated nitrogen gas. Figure 9 shows the position of four thermocouples inside the
torrefaction reactor used for the temperature control. Thermocouples were immersed in the
biomass at four different heights (0.05, 0.1, 0.15 and 0.2m from the bottom of reactor). They
were positioned along the circumference (diameter of 0.08m and origin at the axis of reactor)
and shifted by 90°, as shown in Figure 9, top view. Nitrogen purge gas was used for
maintaining an inert atmosphere during the experiments. For each experiment 4.5 L min-1

50
(0.000075 m3 s
-1) of nitrogen was purged through the reactor. Outlet tubing was maintained
at an elevated temperature of about 200 °C to prevent condensation of released volatiles.
Figure 9. Position of four thermocouples (T5, T6, T7 and T8) utilized for controlling the
temperature inside the reactor (not to scale)
For the purpose of comprehensively characterizing the torrefaction of corn stover the
final torrefied solid product was recovered from the process and analyzed, while the volatiles
released during the process as torrefaction gas were first separated into permanent gases and
condensable volatiles (liquid), and then analyzed separately.
Gas Analysis
Volatiles and permanent gases released from the process were cooled immediately
following release from the reactor, by means of glass impingers submerged in an ice bath.
This facilitated removing the majority of the condensables and water from the gas sample.
The remaining permanent gasses were then passed through desiccant columns before they

51
were analyzed by a Varian 490-GC micro-gas chromatograph (Varian, Palo Alto, CA)
equipped with a Molsieve 5A and Poraplot U columns.
Liquids Analysis
Liquid fraction developed during the torrefaction process and collected in glass
impingers was stored in the cooling chamber at 3-5 °C until it was analyzed. The water
content in the condensed phase was analyzed according to the Karl-Fischer method by a
moisture titrator (KEM MKS-500, Kyoto Electronics, Tokyo, Japan) and ASTM E 203–08
standard method [15]. Quantitative and qualitative analysis of organics present in condensed
phase was conducted by a gas chromatograph equipped with Restek Stabilwax-DA column
(Varian, Palo Alto, CA).
Proximate Analysis
Torrefied biomass samples were analyzed in a thermogravimetric analyzer TGA/DSC
Star System (Mettler Toledo) according to a modified ASTM D 5142–04 method, in order to
determine the content of moisture, volatiles, ash and fixed carbon [16]. Analysis was done
under an inert atmosphere, obtained by purging nitrogen gas at flow rate of 100mL/min.
Initially samples were heated to 105 °C at the heating rate of 10 °C/min. After retaining the
samples at 105 °C for 40 min, these were further heated at the rate of 10 °C/min to 900 °C,
and maintained at this temperature for 20 min. Subsequently the environment was changed to
oxidative by purging 100mL/min of air for 30 min. The moisture content is determined by
the mass loss after the heating period at 105 °C. Mass evolved between 105 °C and 900 °C
represented volatile content, while the remaining was the fixed carbon content. The

52
remaining after heating the sample in oxidative atmosphere at 900 °C was considered to be
ash.
Ultimate Analysis
Ultimate analysis of the solid fraction was done with PerkinElmer 2400 Series II
CHNS/O Analyzer (PerkinElmer, Waltham, MA), according to ASTM D 5373–08 method
[17]. Biomass samples were dried in an oven at 103 °C for 24 h before the ultimate analysis
was conducted. Combustion was conducted at 925 °C under a helium atmosphere, while
reduction was conducted at 650 °C.
High Heating Value Determination
The higher heating value of raw and torrefied biomass samples was computed using
Equation 1 developed by Sheng and Azevedo [18].
HHV (MJ/kg) = -1.3675 + 0.3137*C + 0.7009*H + 0.0318*O (1)
Where: C=percentage of carbon in biomass as determined by ultimate analysis; H=
percentage of hydrogen in biomass as determined by ultimate analysis; O=percentage of
oxygen determined by difference on dry and ash free basis, i.e. O (db, ash free)=100-C-H-N.
Design of Experiments
The set of torrefaction experiments conducted to meet the objectives of this project
was based on a Box-Behnken experimental design, which is a three level design based on the
combination of a two level factorial design and incomplete block design. It is useful for
statistical modeling and optimization of a response variable of interest, which is a function of
three or more independent variables. Moreover, Box Behnken design allows estimating
coefficients in a second degree polynomial regression and modeling of a quadratic response

53
surface. The response surface can be further used for process optimization, identification of
maximum or minimum responses, and significance of each involved factor or their
combination. Furthermore, response surfaces can be used for calculating responses not only
at experimentally investigated points, but also at any point on the surface [19-21]. Three
factor-three level Box Behnken design, with 5 replicates at the center point and 17 runs in
total was used in the experiments (Table 2). JMP statistical package from SAS (SAS
Institute, Cary, NC) was used for the statistical analysis of experimental data.
Table 2. Box Behnken experimental design matrix generated by JMP
No. Pattern Moisture Temperature Time
1 − −0 3 200 20 2 − 0− 3 250 10
3 − 0 + 3 250 30
4 − + 0 3 300 20
5 0 − − 22 200 10
6 0 − + 22 200 30
7 0 0 0 22 250 20
8 0 0 0 22 250 20
9 0 0 0 22 250 20
10 0 0 0 22 250 20
11 0 0 0 22 250 20
12 0 + − 22 300 10
13 0 + + 22 300 30
14 + − 0 41 200 20
15 + 0 − 41 250 10
16 + 0 + 41 250 30
17 + + 0 41 300 20
Results and Discussion
Process time and temperature were defined such that the torrefaction process
temperature was the average of temperatures measured by four thermocouples within the
torrefaction reactor during the experiment. The torrefaction start time was measured from the
point when the temperature first reached the temperature proposed by the experimental

54
design. Figure 10 depicts an average temperature profile for one of the experiments at 250
°C.
Figure 10. Temperature profiles for four thermocouples and average temperature profile
(denoted by dashed line) used to determine process temperature and time
Mass balances for the torrefaction process were computed based on the results from
the solid, liquid and gas analysis, and expressed on dry basis in the Table 3. Mass balances
for torrefaction experiments conducted at low temperatures proved accurate, regardless of
moisture content and time. However, at 300 °C errors in mass balance occurred mainly due
to the lower yield of directly weighable torrefied solids, and an increased yield of volatiles
that condensed throughout the exhaust system, and were hard to recover completely.
Additionally, a high amount of aerosols formed at this temperature would require either
electrostatic precipitators or filters to accurately account for their mass.

55
Table 3. Total mass balance for torrefaction experiments
Sample ID
Raw
Biomass
Moisture
Content (%)
Process Parameters
Torrefied
Biomass
Yield
(%)
Yield of
Condensables
(%)
Yield of
Permanent
Gases (%) Temp. (°C) Time (min)
3-200-20 3.2 200 20 97.1 0.02 0.4
3-250-10 3.2 250 10 86.6 1.79 1.1
3-250-30 3.2 250 30 84.4 4.07 1.4
3-300-20 3.2 300 20 57.4 13.30 2.7
22-200-10 22.1 200 10 98.1 0.39 0.5
22-200-30 22.1 200 30 98.4 0.40 0.6
22-250-20 22.1 250 20 86.2 4.32 1.3
22-250-20 22.1 250 20 85.3 4.37 1.3
22-250-20 22.1 250 20 83.4 4.39 1.5
22-250-20 22.1 250 20 83.5 4.26 1.4
22-250-20 22.1 250 20 83.4 4.09 1.4
22-300-10 22.1 300 10 58.0 11.52 2.0
22-300-30 22.1 300 30 53.9 18.39 3.3
41-200-20 41.0 200 20 91.2 0.66 0.6
41-250-10 41.0 250 10 80.0 3.79 1.2
41-250-30 41.0 250 30 78.7 6.11 1.3
41-300-20 41.0 300 20 56.3 18.59 2.9
There was an overall trend toward a decrease in yield of solids, and increase in yield
of permanent gases and condensable products as both temperature and reaction time
increased (Table 3). Loss of solids was much more pronounced between 250 and 300 °C,
than between 200 and 250 °C, regardless of moisture content of samples. This was likely due
to higher reactivity or more extensive devolatilization and carbonization of hemicellulose
fraction above 250 °C. Along with degradation of hemicellulose, initial reactions of cellulose
decomposition might occur in this temperature regime, as proposed by other researchers [22].
The same trend was observed for the yield of condensables and permanent gases. However,
at 300 °C, regardless of moisture content of raw feedstock, yield of condensables was much
higher than yield of permanent gases, which might be evidence of more intensive

56
decomposition of not only hemicellulose, but also other polymer fractions. This would
support the production of heavier compounds responsible for tar formation observed in
condensed phase. There was an evident influence of moisture content on dry matter loss at
250 °C and especially at 200 °C, where mass loss of samples with 45% moisture content was
3 times higher than that of samples with 3 and 22% raw biomass moisture content (Figure
11).
Figure 11. The effect of untreated biomass moisture content on mass loss of torrefied
samples.
This interaction of mass loss and moisture content of the feedstock has not previously
been reported in scientific journals, and is of high importance for designing a commercial
scale torrefaction system. A possible reason for this might be the expansion of water vapor
inside the plant polymer matrix during the ramping stage of biomass heating. This expansion
loosens the material and makes it less resistive to heat transfer. Since water has a higher heat
conduction coefficient than both air and nitrogen it enhances heat transfer through samples
20m
in
10m
in
20m
in
10m
in
20m
in
10m
in
20m
in
10m
in
20m
in
0
10
20
30
40
50
200 250 300
Mass lo
ss (%
)
Temperature (°C)
3% MC 22% MC 41% MC

57
with high moisture content. Prins [23] has proposed that at heating rates lower than 50
°C/min the parameter that restricts torrefaction reaction is reaction kinetics rather than heat
transfer through the particle. Nevertheless, this might not be true since the particle size in
these experiments were relatively large and representative of a real agricultural residue
feedstock.
Moreover, since a packed bed reactor was used in this project a higher specific heat of
water vapor than nitrogen gas might increase the amount of heat delivered to the zones closer
to the top of reactor and enhance degradation of biomass. Another cause might be probability
of close contact between released acids with biomass polymers, especially hemicellulose, as
a result of increased specific area caused by expansion of water vapor. According to Huber et
al. [24], short chain organic acids may act as a catalyst, thus promoting mainly hemicellulose
degradation at this reaction condition, but also to a lesser extent, degradation of other
polymers. As a consequence of a more aggressive environment during the processing of high
moisture biomass, milder conditions (temperature/time) might be used to achieve the same
effect as in the case of lower moisture content biomass torrefied at more extreme conditions.
Nevertheless, there was almost no difference between mass losses of different samples at the
most extreme time/temperature combinations regardless of sample moisture content. This
might be due to accelerated thermal degradation of cellulose and lignin, in this temperature
zone, after the total amount of hemicellulose was decomposed at lower temperatures, which
would ultimately eliminate any initial difference between the samples.
Experimentally obtained mass loss data were analyzed using JMP statistical software
and fitted into response surface quadratic model. The reduced model, containing only
significant terms is shown in Equation 2.

58
Predicted Mass Loss = 95.68 – 1.0396*Temperature + 0.2491*Moisture +
0.00284*(Temperature)2 (2)
Where: Temperature = °C and Moisture = wt%db.
The summary of fit and analysis of variance are included in Table 4 and Table 5
respectively. As can be seen from Table 4 the mass loss response surface model is in good
agreement with actual data obtained in experiments.
Table 4. Summary statistics for the mass loss response surface model with three predictors:
moisture, temperature and time
R2 0.993
R2 adjusted 0.985
Root Mean Square Error 1.807
Table 5. ANOVA for the mass loss response surface model with three predictors: moisture,
temperature and time
Source DF Sum of Mean F Ratio Prob. > F
Model 9 3465.10 385.01 117.82 <0.0001*
Error 7 22.87 3.268
Corrected 16 3487.97
* Significant
According to the model, temperature, moisture, and temperature squared were the
only significant parameters (Table 6). The strength of effect of two significant process
parameters on the dry matter mass loss is better revealed by surface plot in Figure 12. The
effect of the moisture content of the raw biomass on dry matter loss is depicted in the plot by
the more pronounced curvature in the temperature region below 260 °C and moisture content
above 20%.
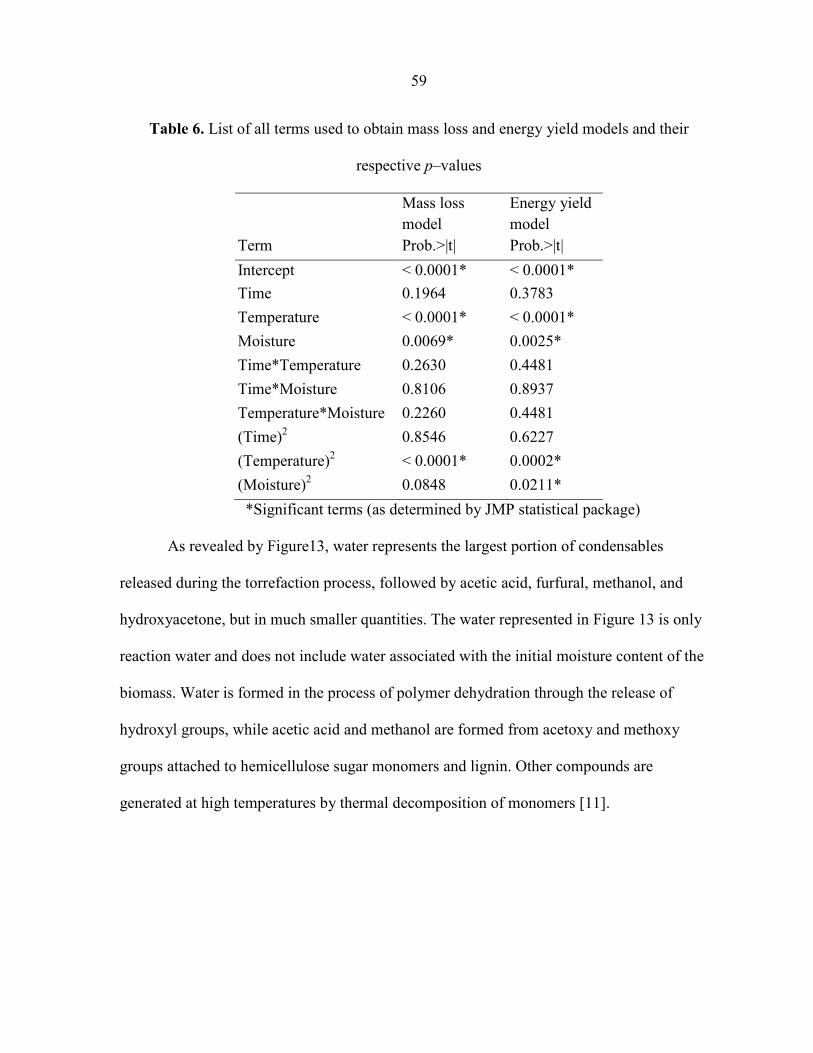
59
Table 6. List of all terms used to obtain mass loss and energy yield models and their
respective p–values
Mass loss
model
Energy yield
model
Term Prob.>|t| Prob.>|t|
Intercept < 0.0001* < 0.0001*
Time 0.1964 0.3783
Temperature < 0.0001* < 0.0001*
Moisture 0.0069* 0.0025*
Time*Temperature 0.2630 0.4481
Time*Moisture 0.8106 0.8937
Temperature*Moisture 0.2260 0.4481
(Time)2
0.8546 0.6227
(Temperature)2
< 0.0001* 0.0002*
(Moisture)2
0.0848 0.0211*
*Significant terms (as determined by JMP statistical package)
As revealed by Figure13, water represents the largest portion of condensables
released during the torrefaction process, followed by acetic acid, furfural, methanol, and
hydroxyacetone, but in much smaller quantities. The water represented in Figure 13 is only
reaction water and does not include water associated with the initial moisture content of the
biomass. Water is formed in the process of polymer dehydration through the release of
hydroxyl groups, while acetic acid and methanol are formed from acetoxy and methoxy
groups attached to hemicellulose sugar monomers and lignin. Other compounds are
generated at high temperatures by thermal decomposition of monomers [11].

60
Figure 12. Surface plot of the effect of temperature and moisture content of raw biomass on
predicted mass loss (time = 20 min)
Figure 13. Composition of condensable volatiles released during torrefaction (The amount of
water produced in torrefaction reaction and condensed together with organics was
determined as a difference between the total water content in condensable phase and initial
biomass moisture content. Only the reaction water is shown in Figure 13.)

61
As can be seen in Figure 13, the amount of condensables released during torrefaction of
biomass samples with initial moisture content of 22 and 41% are not significantly different.
However, they are two times higher than in the case of torrefaction of samples with 3%
initial moisture content.
Figure 14 shows the composition of permanent gas phase released during the
torrefaction of biomass with different initial moisture contents and at various combinations of
process parameters. In Figure 14, only carbon monoxide and carbon dioxide are shown, since
these are the main gas components, even though traces of methane and hydrogen were
present at high reaction temperature.
Figure 14. Change in permanent gas composition with process parameters and raw biomass
moisture content
As can be seen in Figure 14, the ratio of carbon monoxide and carbon dioxide
increases with the increase in both temperature and time. This is different from the influence
0%
20%
40%
60%
80%
100%
3-2
00-2
0
3-2
50-1
0
3-2
50-3
0
3-3
00-2
0
22-2
00-1
0
22-2
00-3
0
22-2
50-2
0
22-2
50-2
0
22-2
50-2
0
22-2
50-2
0
22-2
50-2
0
22-3
00-1
0
22-3
00-3
0
41-2
00-2
0
41-2
50-1
0
41-2
50-3
0
41-3
00-2
0
Com
positio
n o
f perm
anent gas
phase (w
t%)
Moisture (%) - Temperature (°C) - Time (min)
CO2 CO

62
of time on mass yield which does not have a significant effect. The composition of the
permanent gas phase is not affected significantly by moisture content of raw feedstock.
Production of carbon dioxide during the process might be explained by decarboxylation of
acid groups attached to hemicellulose, while carbon monoxide may be produced in the
reaction of carbon dioxide and steam with char at high temperatures [25].
Figure 15 shows the results of the proximate analysis of corn stover torrefied at
different treatment conditions. As can be seen in Figure 15, temperature has the strongest
effect on torrefied biomass composition. Moreover, as the temperature increases the amount
of fixed carbon follows the same trend and rises from about 1.5 up to 3 times, at 250 °C and
300 °C respectively, relative to untreated biomass. This is a consequence of the more
extensive removal of hydrogen and oxygen from biomass, although some carbon will be
released in the form of hydrocarbons. There is a trend in the reduction of volatiles content by
about 30% at the highest temperature as a result of aforementioned changes in biomass
composition. This torrefied material will produce less organic compounds and aerosols
during combustion, and has a higher heating value. Water content of torrefied corn stover
determined during proximate analysis was water adsorbed by biomass while it was waiting
for the analysis in the TGA’s auto-sampler.

63
Figure 15. Proximate analysis of torrefied and raw corn stover
Torrefaction increases the amount of atomic carbon while decreases the amount of
atomic hydrogen and oxygen as shown in Table 7. A consequence of this change in the
chemical composition was a decrease in the O/C and H/C ratio of torrefied biomass in
comparison to raw biomass. This is due to the release of volatiles rich in hydrogen and
oxygen, such as water and carbon dioxide. The decrease in O/C, regardless of the moisture
content in the raw biomass, can be up to about 7, 15 and 45% at 200, 250 and 300 °C
respectively. This change in the chemical composition of biomass improves its quality as an
energy source through an increase in energy density, since more oxygen than carbon is lost in
the form of volatiles.
0102030405060708090
100
3-2
00-2
0
3-2
50-1
0
3-2
50-3
0
3-3
00-2
0
22-2
00-1
0
22-2
00-3
0
22-2
50-2
0
22-2
50-2
0
22-2
50-2
0
22-2
50-2
0
22-2
50-2
0
22-3
00-1
0
22-3
00-3
0
41-2
00-2
0
41-2
50-1
0
41-2
50-3
0
41-3
00-2
0
raw
Rela
tive a
mount (w
t%)
Temperautre (°C ) - Time (min) - Moisture (%)
Moisture(%) Volatiles(%) Fixed carbon(%) Ash(%)

64
Table 7. Ultimate analysis and computed energy density of torrefied samplesa
Sample C H N Ob
HHVc
3-200-20 45.8 5.5 0.5 48.2 18.4
3-250-10 47.7 5.3 0.6 46.4 18.8
3-250-30 49.1 5.4 0.6 45.0 19.2
3-300-20 58.7 4.7 0.7 35.8 21.5
22-200-10 45.7 5.7 0.7 47.9 18.5
22-200-30 45.8 5.5 0.6 48.1 18.4
22-250-20 49.1 5.4 0.7 44.8 19.2
22-250-20 48.3 5.5 0.6 45.6 19.1
22-250-20 49.2 5.4 0.7 44.7 19.3
22-250-20 49.4 5.4 0.6 44.5 19.3
22-250-20 48.7 5.4 0.6 45.3 19.1
22-300-10 56.6 4.9 0.9 37.6 21.0
22-300-30 59.0 4.7 1.0 35.4 21.6
41-200-20 45.6 5.4 1.0 48.0 18.2
41-250-10 48.2 5.3 0.9 45.6 18.9
41-250-30 48.8 5.2 0.9 45.1 19.0
41-300-20 55.8 4.8 1.1 38.2 20.8
Raw 44.2 5.8 0.5 49.5 18.2 aSulfur levels for all analyzed samples were at levels lower than analyzer’s precision level
and were discarded as uncertain. bDetermined by difference
c Calculated
Another important characteristic of torrefied corn stover is its increase in energy
density when compared to raw biomass. This is the result of a decrease in mass of torrefied
samples through the release of compounds rich in oxygen and hydrogen. It can be seen in
Figure 16 that temperature has strongest impact on energy density of torrefied biomass, while
the effect of time and moisture is much less expressed.

65
Figure 16. Effect of process parameters and raw biomass moisture content on energy density
of torrefied material
Energy yield per dry raw biomass indicates the total energy preserved in the torrefied
biomass. It was computed from mass yield and higher heating values using Equation 3 and
expressed as a percentage of energy content of untreated dry biomass.
Eyield (%) = (mtorrefied / minitial)dry basis*(Etorrefied / Einitial)dry basis*100 (3)
Where: mtorrefied = mass of biomass feedstock measured after torrefaction expressed
on dry basis; minitial = mass of untreated (raw) biomass feedstock measured before
torrefaction expressed on dry basis; Etorrefied = specific energy content of biomass feedstock
after torrefaction expressed on dry basis; Einitial-dry basis = specific energy content of biomass
feedstock before torrefaction expressed on dry basis
Energy yields computed using Equation 3 are shown in Figure 17.
22%
a
3%
22%
3%
41%
3%
41% 2
2%
41%
22% 3
%
22%
41%
16
17
18
19
20
21
22
200 250 300
Energ
y d
ensity(M
J/k
g)
Temperature(°C)
10min 20min 30min
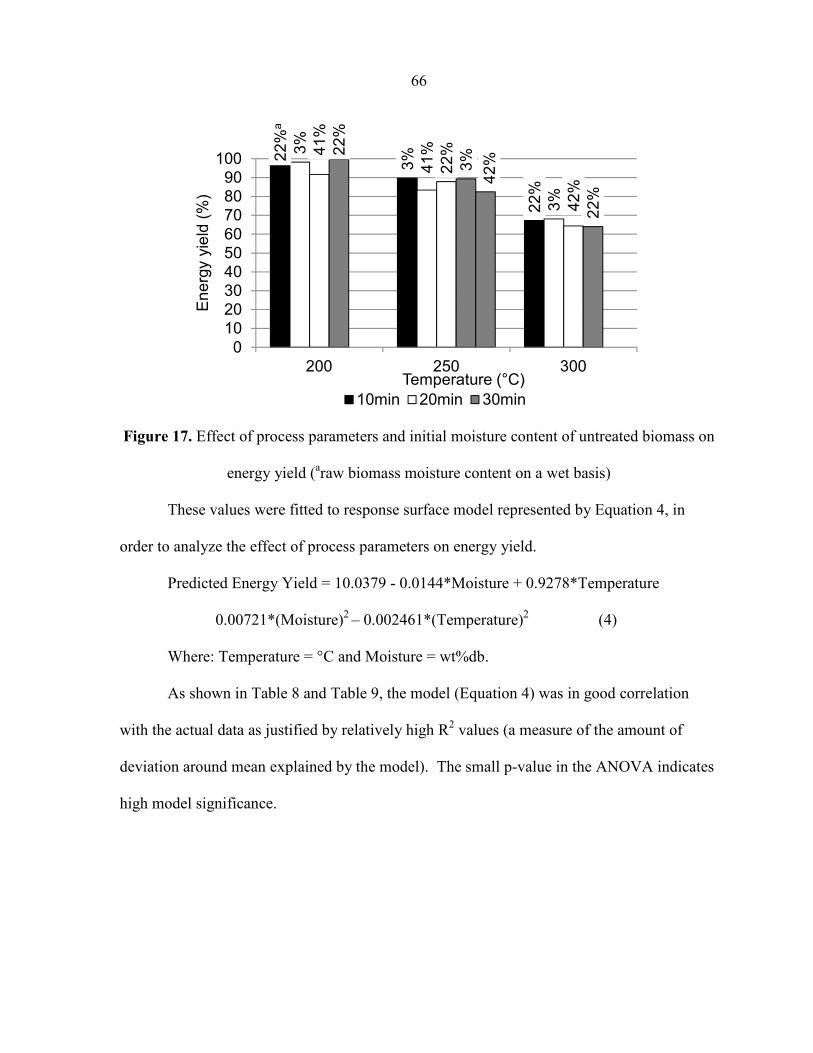
66
Figure 17. Effect of process parameters and initial moisture content of untreated biomass on
energy yield (araw biomass moisture content on a wet basis)
These values were fitted to response surface model represented by Equation 4, in
order to analyze the effect of process parameters on energy yield.
Predicted Energy Yield = 10.0379 - 0.0144*Moisture + 0.9278*Temperature
0.00721*(Moisture)2
– 0.002461*(Temperature)2
(4)
Where: Temperature = °C and Moisture = wt%db.
As shown in Table 8 and Table 9, the model (Equation 4) was in good correlation
with the actual data as justified by relatively high R2 values (a measure of the amount of
deviation around mean explained by the model). The small p-value in the ANOVA indicates
high model significance.
22%
a
3%
22%
3%
41%
3%
41%
22%
42%
22%
3%
22%
42%
0
10
20
30
40
50
60
70
80
90
100
200 250 300
Energ
y y
ield
(%
)
Temperature (°C)
10min 20min 30min

67
Table 8. Summary statistics for the energy yield response surface model with three
predictors: moisture, temperature and time
R2 0.989
R2 adjusted 0.977
Root Mean Square Error 1.804
Table 9. ANOVA for the for the energy yield response surface model with three predictors:
moisture, temperature, and time
Source DF Sum of Mean Square F Ratio Prob. > F
Model 9 2253.06 250.341 76.88 < 0.0001*
Error 7 22.79 3.256
Corrected 16 2275.86
*Significant
In this model (Equation 4) the significant parameters are temperature, temperature
squared, moisture and moisture squared (Table 6). As revealed in Figure 18, biomass
torrefied at lower temperatures has the highest energy yield, which was expected since this
parameter was strongly dependent on mass yield which was significantly affected by process
temperature. Moisture has much less influence on energy yield than temperature as seen in
Figure 18.

68
Figure 18. Surface plot of the effect of temperature and moisture content of raw biomass on
predicted energy yield (time = 20 min)
However, the initial moisture content induced up to 10% more energy loss at
temperatures below 220 °C and raw biomass moisture content higher than 20%. This was
correlated with mass loss and justified by the similar contour plot curvature in Figure 12.
Moreover, as displayed in Figure 18, moisture had a stronger influence on energy yield than
on mass loss, even at 300 °C. This might be due to the loosening effect of water on fibrous
matrix, its role in polymer hydrolysis, and formation of organic acids that promotes more
extensive cellulose and lignin degradation through high energy volatile compounds, such as
tar.
Conclusions
Corn stover undergoes changes in chemical composition, mass, and energy content
during the torrefaction process. As expected these changes were more extensive at high
temperatures and characterized by mass loss of up to 45% as well as a decrease in the O/C

69
ratio from 1.11 to 0.6 and an increase in the energy density of about 19%. However, high
mass loss offset gain in energy density and significantly reduced overall energy yield.
Moisture content had a significant effect on energy density, mass and energy yield, and
generally induced a reduction in each of these parameters. Moreover, the effect of moisture is
more pronounced at lower temperatures, where if moisture content in raw biomass is
increased from 22% to 44%, energy yield could be reduced by about 10%. Nevertheless,
there is a raw biomass moisture content window between 3% and approximately 20% that
can allow for the use of corn stover feedstock directly from the field without any negative
effect on energy yield.
Despite inevitable losses in energy yield during the process, additional research in the
future might justify the use of torrefaction as a biomass pretreatment or upgrading step, by
obtaining data that will prove savings in torrefied biomass particle size reduction,
improvements in storage stability, hydrophobicity, and chemical properties important for
thermochemical processes, such as pyrolysis, gasification, and co-firing.
Acknowledgements
Funding for this project was provided by the ConocoPhillips Company. Additional
technical support was provided by CSET (Center for Sustainable Energy, Iowa State
University, Ames) and BCRF (Biocentury Research Farm, Iowa State University, Ames). We
would like to thank Andy Suby, Samuel Jones, Patrick Johnston and Marge Rover for their
contribution to this work.
References
1. Demirbas A. Biofuels. London: Springer; 2009.

70
2. Klass D. L. Biomass for Renewable Energy, Fuels and Chemicals. San Diego: Academic
Press; 1998.
3. WEC, World Energy and Climate Policy: 2009 Assessment. 2009, World Energy
Council: London, UK.
4. The Energy Independence and Security Act of 2007, Pub. L. No. 110-40 H.R. 6, 121 Stat.
1492 (January 7. 2007)
5. BRDI, Roadmap for Bioenergy and Biobased Products in the United States. Biomass
Research and Development Initiative, October 2007.
6. Bridgeman T. G., Jones J. M., Shield I., Williams P.T. Torrefaction of reed canary grass,
wheat straw and willow to enhance solid fuel qualities and combustion properties. Fuel
2008;87:844-56.
7. Arias B., Pevida C., Fermoso J., Plaza M. G., Rubeira F., Pis J. J. Influence of
torrefaction on the grindability and reactivity of woody biomass. Fuel Processing
Technology 2008;89:169-75.
8. Lipinsky E. S., Arcate J. R., Reed T. B. Enhanced Wood Fuels via Torrefaction.
Inovative Thinking, Inc.: Fuel Chemistry Division Preprints 2002;47:408-10.
9. Yan W., Acharjee T. C., Coronella C. J., Vaquez R. V. Thermal Pretreatment of
Lignocellulosic Biomass. Environmental Progress and Sustainable Energy 2009;28:435-
40.
10. Bergman P. C. A., Boersma A. R., Zwart R. W. R., Kiel J.H.A. Torrefaction for Biomass
Co-firing in Existing Coal-Fired Power Stations, The Netherlands: ECN: Petten; 2005.
11. Prins M. J., Ptasinski K. J., Janssen F. J. J.G. Torrefaction of wood. Part 2. Analysis of
products, J Anal Appl Pyrol 2006;77:35-40.
12. Bergman P. C. A. Combined Torrefaction and Pelletization: The TOP Process, The
Netherlands: ECN: Petten; 2005.
13. Couhert C., Salvador S., Commandre J-M. Impact of torrefaction on sygas production
from wood. Fuel 2009;88:2286-90.
14. Prins M. J., Ptasinski K. J., Janssen F. J. J.G. Torrefaction of wood. Part 1. Weight Loss
Kinetics, J Anal Appl Pyrol 2006;77:28-34.

71
15. ASTM E 203 – 08: Standard Test Method for Water Using Volumetric Karl Fischer
Titration. 2008, ASTM Standards, Vol. 15.05.
16. ASTM D 5142 – 04: Standard Test Method for Proximate Analysis of the Analysis
Sample of Coal And Coke by Instrumental Procedures. 2008, ASTM Standards, Vol.
05.06.
17. ASTM D 5373 – 08: Standard Test Method for Instrumental Determination of Carbon,
Hydrogen and Nitrogen in Laboratory samples of Coal. 2008, ASTM Standards, Vol.
05.06.
18. Sheng C., Azevedo J. L. T. Estimating the higher heating value of biomass fuels from
basic analysis data. Biomass Bioenerg 2005;28:499-507.
19. Box G. E. P., Behnken D. W. Some New Three Level Design for the Study of
Quantitative Variables. Tehcnometrics 1960;2:455-75.
20. Carlborn K., Matuana L. M. Modeling and Optimization of Formaldehyde-Free Wood
Composites Using a Box-Behnken Design. Polym Composites 2006;27:497-503.
21. Muthukumar M., Mohan D., Rajendran M. Optimization of Mix Properties of Mineral
Aggregates Using Box Behnken Design of Experiments. Cement Concrete Comp
2003;25:751-8.
22. Koukious E. G., Mavrokoukoulakis J., Abatzoglou N. Energy densification of biomass.
Proceedings of 1st. National Conference on Soft Energy Forms; 1982; Thessaloniki,
Greece.
23. Prins M. J. Thermodynamic analysis of biomass gasification and torrefaction. The
Netherlands: Technische Universiteit Eindhoven: Eindhoven; 2005
24. Huber G. W., Iborra S., Corma A. Synthesis of Transportation Fuels from Biomass:
Chemistry, Catalysis and Engineering. Chem Rev 2006;106:4044-98.
25. White R. H., Dietenberger M. A. Wood Products: thermal degradation and fire. In:
Buchow K. H. J., Cahn R. W., Flemings M. C., Ilschner B., Kramer E. J., Mahajan S.
,editors. The Encyclopedia of Materials: Science and Technology. Amsterdam, the
Netherlands: Elsevier; 2001.

72
Chapter 4. Effect of torrefaction on water vapor adsorption
properties and resistance to microbial degradation of corn stover
A paper published in Energy & Fuels
D. Medic*, M. Darr, A. Shah, S. Rahn
Department of Agricultural and Biosystems Engineering, Iowa State University, 100
Davidson Hall, Ames, IA 50011, USA
* Corresponding author. E-mail address: [email protected] (D. Medic)
Abstract
The equilibrium moisture content (EMC) of biomass affects transportation, storage,
downstream feedstock processing, and the overall economy of biorenewables production.
Torrefaction is a thermochemical process conducted in the temperature regime between 200
and 300 °C under an inert atmosphere that, among other benefits, aims to reduce the innate
hydrophilicity and susceptibility to microbial degradation of biomass. The objective of this
study was to examine water sorption properties of torrefied corn stover. The EMC of raw
corn stover, along with corn stover thermally pretreated at three temperatures, was measured
using the static gravimetric method at equilibrium relative humidity (ERH) and temperature
ranging from 10 to 98% and from 10 to 40 °C, respectively. Five isotherms were fitted to the
experimental data to obtain the prediction equation which best describes the relationship
between the ERH and the EMC of lignocellulosic biomass. Microbial degradation of the
samples was tested at 97% ERH and 30 °C. Fiber analyses were conducted on all samples. In
general, torrefied biomass showed an EMC lower than that of raw biomass, which implied an

73
increase in hydrophobicity. The modified Oswin model performed best in describing the
correlation between ERH and EMC. Corn stover torrefied at 250 and 300 °C had negligible
dry matter mass loss due to microbial degradation. Fiber analysis showed a significant
decrease in hemicellulose content with the increase in pretreatment temperature, which might
be the reason for the hydrophobic nature of torrefied biomass. The outcomes of this work can
be used for torrefaction process optimization, and decision-making regarding raw and
torrefied biomass storage and downstream processing.
Keywords: equilibrium moisture content, torrefaction, microbial degradation, corn stover,
hydrophobicity
Introduction
Lignocellulosic biomass has recently gained renewed attention in developed countries
as a sustainable, abundant, and readily available energy and carbon source. Furthermore,
public concern about the negative environmental impacts of fossil fuels use, energy
dependence on foreign petroleum, and volatile oil prices have promoted the use of biomass
feedstock in energy, fuel, and chemical production. Biomass has characteristics distinct from
traditional, fossil energy/carbon sources that make its application more costly and complex
than traditional fossil fuels. A number of factors increase the cost of biorenewables
production, including the high oxygen content of biomass and products derived from it, the
low energy and bulk density of biomass, a recalcitrant and heterogeneous nature, and high
moisture content [1]. Unlike other unfavorable biomass characteristics, high moisture content
is the parameter that affects multiple steps in a biorenewables production chain, such as
transportation, storage, and upgrading of lignocellulosic biomass. Moisture increases the cost

74
of transportation by increasing the amount of superfluous material that has to be transported
[2]. Dry matter loss of wet biomass can be up to 30% depending on pretreatment and storage
type, which increases overall production cost [1-3]. Furthermore, storage of large quantities
of high moisture biomass represents a fire hazard due to spontaneous ignition [4,5]. The
energy requirement for size reduction increases significantly as a consequence of the increase
in moisture content of biomass [6,7]. Gasification of high moisture feedstock causes an
increase in tar yield, a decrease in thermal efficiency of the system, and a decrease in
operation temperature [8]. Moisture increases char yield and has a mixed effect on bio-oil
yield and composition, depending on temperature and mineral matter content [9]. Moreover,
the high water content decreases the heating value of biomass, causes ignition issues,
demands large process equipment to handle large flue gas volume, and affects the overall
combustion quality [10].
Adsorption is a process of gas, liquid or dissolved solid uptake by the surface of solid
phase, driven by minimization of the surface free energy. Desorption is a process opposite to
adsorption. Adsorbed atoms or molecules leave the surface of the solid phase, and return to
gas or liquid phase as a result of desorption. It depends on temperature and pressure, so as
adsorption [11,12]. Equilibrium moisture content (EMC) is established when the moisture
content of material in question is in thermodynamic equilibrium with the relative humidity of
the surrounding atmosphere at a particular temperature and pressure [13]. Therefore, change
in the relative humidity of the environment affects the moisture content of any biological
material at constant pressure and temperature [7]. The relationship between the EMC and the
equilibrium relative humidity (ERH) at a constant temperature is expressed by moisture
sorption isotherms [14]. The shape of isotherms gives insight into the mechanism of water

75
adsorption and depends on structure and composition of material, in addition to pressure and
temperature [15]. Desorption isotherm does not necessarily have to be the same as adsorption
isotherm. The former usually has higher values than adsorption isotherm in the midrange
levels of relative humidity. This is referred to as sorption hysteresis. Several theories have
been developed to explain occurrence of hysteresis, such as capillary condensation, phase
change of non-porous solids and structural changes of non-rigid solids [11]. Understanding
the relationship between EMC and ERH helps in designing drying, combustion, and
thermochemical conversion systems; making decisions regarding storage methods for
different biomass types; and improving product quality in general [16].
More than 270 models have been used in the literature to predict water vapor sorption
characteristics in materials of biological origin. According to Van der Berg and Bruin [17],
these models can be broadly classified into three categories: theoretical, semi-empirical, and
empirical. Theoretical models are based on a monolayer/multilayer sorption and a condensed
film, and employ constants that have physical meaning. This is the opposite of empirical
models, whose constants are not related to material properties [18]. Moreover, there is no
single model that is capable of representing sorption behavior of every biological material
over a wide range of temperatures and relative humidity levels [19]. Five isotherm equations:
modified Henderson, modified Chung-Pfost, modified Halsey, modified Oswin and
Guggenheim-Anderson-deBoer (GAB) are accepted by the American Society of Agricultural
and Biological engineers as standard models for describing the relationship between the ERH
and the EMC of agricultural products [20].
Torrefaction is a thermochemical process conducted in the temperature range between
200 and 300 °C under an inert atmosphere and low heating rate. It is currently being

76
considered as a biomass feedstock pretreatment, particularly for thermal conversion systems.
The final solid product, referred to as torrefied biomass, is composed mainly of cellulose and
lignin. It is characterized by increased brittleness, hydrophobicity, microbial degradation
resistance, and energy density. Thus, torrefaction can play a significant role in decreasing the
costs of transportation and storage of biomass in the large quantities needed to sustain
biofuels production [6,21].
A lot of research on the EMC-ERH relationship has been dedicated to fruits and
vegetables, dairy, forage, grain, agricultural residues, and wood [22-27]. Several researchers
investigated the water sorption of charcoal, coals, and activated carbon [28-30]. However,
there have been only a few studies that investigated water adsorption properties of torrefied
biomass [21,31].
The objective of this work was to assess the hydrophobic nature of thermally treated
biomass. Therefore, water adsorption characteristics of raw and torrefied corn stover were
determined experimentally at four temperatures and five relative humidity levels. In addition,
the suitability of five models for fitting ASABE accepted isotherms was evaluated. A
microbial degradation test was conducted to assess dry matter loss due to microbial growth at
high ERH. Furthermore, fiber analysis test was performed to explain the lower water vapor
adsorption onto torrefied corn stover.
Methods
Sample preparation
Corn stover biomass was harvested in the fall 2010 from Iowa State University
research fields located in Story County, IA. The bulk wet samples were stored in a cooling

77
chamber at a temperature below 5 °C to preserve their original qualities and to prevent the
microbial degradation.
Subsamples of the wet material were dried at 60 °C for 72h and stored in a desiccator
until torrefaction or water vapor sorption experiments were conducted. The moisture content
of samples before and after experiments was determined according to the ASAE standard for
forage moisture measurement D358.2 [32]. All samples were ground and sifted before
experiments to obtain physically uniform samples with a particle size less than 2mm. Ground
corn stover biomass was torrefied at 200, 250 and 300 °C according to the method employed
by Medic and co-workers [33] with the modifications that all samples were dried before the
processing and were torrefied for 20 minutes.
Water vapor adsorption experiments
The EMC of biomass was determined at 10, 20, 30 and 40 °C using the static
gravimetric method [34]. For this, 2g (0.0001g resolution) of samples were spread in a thin
layer in Petri dishes and placed in hygrostats, which were sealed plastic containers.
Duplicates of raw corn stover, and corn stover samples torrefied at 200, 250 and 300 °C were
set in each hygrostat. Five saturated solutions of inorganic salts were used to control the ERH
in the hygrostats as shown in Table 10 [35].
Table 10. ERH of saturated solutions at four temperature levels
Salt
Chemical
formula
ERH (decimal)
10 °C 20 °C 30 °C 40 °C
Lithium chloride LiCl 0.113 0.113 0.113 0.112
Magnesium chloride MgCl2 0.335 0.331 0.324 0.316
Magnesium nitrate Mg(NO3)2 0.574 0.544 0.514 0.484
Sodium chloride NaCl 0.757 0.755 0.751 0.747
Potassium sulfate K2SO4 0.982 0.976 0.970 0.964

78
All salts were reagent grade (Fischer Scientific, Pittsburgh, PA). Solutions were
prepared at 50 °C with excess salt to ensure a saturation condition. Remote data loggers to
continuously measure and record temperature and relative humidity (HOBO U23 Pro v2,
Onset Computer Corporation, Pocasset, MA) were placed in each hygrostat. An incubator
with refrigeration capability (Isotemp incubator, Fischer Scientific, Pittsburgh, PA) was
utilized to maintain different temperature levels (± 1 °C) during experiments. Samples EMC
were assumed to be in equilibrium with the ERH when there was no difference (≤ 0.001g) in
three subsequent weight measurements. The weights of the biomass samples were measured
every two days. The samples were covered with the lids immediately after removing them
from the hygrostats. Only one sample at a time was outside the hygrostat. The duration of the
whole process was less than 60 seconds per sample. Tukey-Kramer Honestly Significant
Difference procedure, available in JMP pro 9 statistical package (SAS Institute, Cary, CA)
was used for pairwise comparison of all EMC means.
Adsorption modeling
Relationships between ERH and EMC of raw and torrefied corn stover at four
different temperatures and five different ERH levels were determined by fitting the
experimental data using five isotherm models (Equations 1-5) suggested in ASAE standard
D245.6 [20]. The GAB model is used in its adapted form to account for temperature
influence [13, 36].
1. Modified Henderson model:
(1)
EMC= �ln�1-ERH�-A·(t+B)
�1C

79
2. Modified Chung-Pfost model:
(2)
3. Modified Halsey model:
(3)
4. Modified Oswin model:
(4)
5. Modified GAB (Guggenheim-Anderson-deBoer) model:
(5)
Where: EMC = equilibrium moisture content (%db); ERH = equilibrium relative
humidity (decimal); A, B, C, B0, C0, H1, H2 = empirical constants (Note: Their values are
specific to particular model.); t = temperature ( °C); T = absolute temperature (K); R =
universal gas constant (kJ kmol-1
K-1
).
Non-linear regression was used to fit the aforementioned models into experimental
results and obtain unknown coefficients. Regression analysis was done using JMP pro 9
statistical package (SAS Institute, Cary, CA). The procedure employed the Gauss-Newton
algorithm to minimize the residual sum of squares between predicted and observed data in an
iterative way. The adequacy of tested models was evaluated using different statistical criteria,
EMC=- 1
Cln �ln�ERH�(t+B)
-A�
EMC= �-exp�A+B·t�ln(ERH)
�1C
EMC=(A+B·t) � ERH
1-ERH�1
C
EMC= A·B0·C0·ERH�1-B0·ERH�(1-B0·ERH+B0·C0·ERH)
B0=B·exp( H1
R·T)
C0=C·exp( H2
R·T)

80
including mean percent relative error (MRE), residual sum of squares (RSS), root mean
square error (RMSE), coefficient of determination (R2), and plot of residuals [19, 37].
Relations 6-8 were used to determine MRE, RSS RMSE, and residuals, respectively.
(6)
(7)
(8)
(9)
Where: n = number of observations; EMCexp. = experimentally obtained equilibrium
moisture content; EMCpred. = equilibrium moisture content predicted by the model; df =
degree of freedom.
The model with the smallest values of MRE, RMSE and RSS, as well as the largest
value of R2 was considered to be the best fit for the experimental data, and the most accurate
description for the relationship between sample’s EMC and ERH. Furthermore, a model was
considered acceptable only if its plot of residual vs. predicted EMC showed no systematic
spread or pattern [19].
MRE=100n ��EMCexp.-EMCpred.�EMCexp.ni=1
RSS=� (EMCexp.-EMCpred.)2
n
i=1
RMSE=�RSS
df
Residual=EMCexp.-EMCpred.

81
Microbial degradation experiment
The microbial degradation test was conducted using the same equipment and
experimental set up that was used for water vapor adsorption tests. The duration of the test
was 30 days. During the experiment, temperature was maintained at 30 °C with the help of
incubator. Relative humidity was maintained at 97% (saturated solution of K2SO4 salt).
These parameters were chosen to promote natural microbial growth without any attempt to
inoculate material by specific fungi species. Dry matter content of samples was determined
before and after the experiment, according to ASAE standard method D358.2 [32].
Fiber analysis
Fiber analysis was done according to the National Renewable Energy Laboratory
procedure [38]. In short, carbohydrates present in the biomass were dissolved in two stage
sulfuric acid hydrolysis and the resulting monomers were analyzed by means of high
performance liquid chromatography with refractive index detector (Varian ProStar 355/356,
Varian Inc., Palo Alto, CA) and a column (Bio-Rad Aminex HPX-87P, Hercules, CA). Solid
residual was weighed and considered to be acid insoluble lignin, while acid soluble lignin in
hydrolysate was determined spectrometrically.
Results and discussion
Experimental results
The EMCs of raw and corn stover torrefied at 200 (T200), 250 (T250) and 300 °C
(T300) are included in Table 11. EMC of all four types of biomass decreased with an
increase in temperature during water adsorption experiments. The minimum and maximum
EMC, with temperature in parentheses, of raw, T200, T250 and T300 were 1.77 (40 °C) and

82
45.38 (10 °C) %db; 1.63 (40 °C) and 42.88 (10 °C) %db; 1.18 (40 °C) and 25.68 (10 °C)
%db; and 1.54 (40 °C) and 30.44 (20 °C) %db; respectively. This phenomenon is typical for
biological products, and might be a consequence of the enhanced excitation states of water
molecules at higher temperatures, which lowers cohesive forces between them [36].
Clausius-Clapeyron equation predicts shift of adsorption isotherms downwards due to
increase in temperature, which is a consequence of more energy available for water
vaporization and decrease in moisture binding energy [39,40]. As expected, EMC of biomass
increased with an increase in ERH and, with no exception, samples exposed to the lowest and
highest ERH also respectively had the lowest and highest EMC, regardless of pretreatment
temperature. Dry raw corn stover had the highest EMC values at all temperatures for ERH
above 0.4. There was no significant difference between samples below 0.4, according to
Tukey-Kramer HSD test, regardless of environmental temperature. Furthermore, EMC of
thermally treated samples decreased with the increase in torrefaction process temperature.
This is mainly a consequence of a decrease in the number of water adsorption sites and
changes in the material structure due to cleavage of hydroxyl groups from biomass polymers
and the formation of non-polar unsaturated structures [6,41,42]. Moreover, hemicellulose
fraction in biomass is degraded to different extents during torrefaction, depending on
temperature [21]. Since the main mechanism of water adsorption onto biomass is binding to
polar sites, such as hydroxyl groups in sugar molecules, elimination of hemicellulose also
increases hydrophobicity [43]. The difference between hydrophobicity of corn stover
torrefied at 250 and 300 °C is not statistically significant. Tukey-Kramer HSD test revealed
that differences between ERH levels for the same sample and environmental temperature are
all significant (not shown in Table 11). This is true regardless of sample type. If the samples

83
of the same kind and ERH, but different environmental temperature, are compared to each
other no straightforward conclusion could be established. Moreover, the only exception is the
highest ERH value at which all samples were significantly different. Therefore,
hydrophobicity of thermally treated material was clearly expressed only at the highest ERH
level, regardless of environmental temperature, with raw and samples torrefied at 250 °C
having highest and lowest EMC, respectively.

84
Table 11. EMC of raw and torrefied corn stover
RH
(decimal)
T
(°C) Sample
EMC
(%db)
S.D.
(%db) Sample
EMC
(%db)
S.D.
(%db) Sample
EMC
(%db)
S.D.
(%db) Sample
EMC
(%db)
S.D.
(%db)
0.113 10 Raw 2.35 0.02 T200 2.13 0.19 T250 1.73 0.16 T300 1.86 0.04
0.335 10 Raw 5.75 0.10 T200 4.98 0.14 T250 3.84 0.21 T300 4.34 0.04
0.574 10 Raw 9.93 0.00 T200 8.53 0.16 T250 6.80 0.14 T300 6.84 0.13
0.757 10 Raw 15.50 1.07 T200 12.35 0.45 T250 9.95 0.04 T300 9.76 0.01
0.982 10 Raw 45.38 1.53 T200 42.88 0.91 T250 25.68 0.10 T300 26.13 0.86
0.113 20 Raw 2.06 0.05 T200 2.03 0.04 T250 1.51 0.14 T300 1.67 0.19
0.331 20 Raw 5.04 0.13 T200 4.31 0.05 T250 3.32 0.07 T300 3.90 0.01
0.544 20 Raw 8.04 0.02 T200 6.76 0.14 T250 5.20 0.08 T300 5.87 0.02
0.755 20 Raw 13.11 0.03 T200 11.20 0.04 T250 8.62 0.00 T300 8.90 0.06
0.976 20 RawF 41.48 0.94 T200 33.14 0.02 T250 24.00 1.03 T300 30.34 0.27
0.113 30 Raw 1.99 0.02 T200 2.00 0.02 T250 1.70 0.09 T300 1.82 0.20
0.324 30 Raw 4.86 0.00 T200 4.01 0.03 T250 3.25 0.03 T300 3.66 0.09
0.514 30 Raw 7.41 0.05 T200 6.23 0.05 T250 4.84 0.01 T300 5.44 0.03
0.751 30 Raw 12.22 0.10 T200 10.68 0.05 T250 8.34 0.13 T300 8.65 0.01
0.97 30 RawF 24.81 0.44 T200F 23.24 1.45 T250F 16.44 0.12 T300 15.57 0.06
0.112 40 Raw 1.77 0.27 T200 1.63 0.13 T250 1.18 0.00 T300 1.54 0.06
0.316 40 Raw 4.66 0.26 T200 3.79 0.25 T250 2.92 0.05 T300 3.62 0.06
0.484 40 Raw 6.41 0.08 T200 5.35 0.05 T250 4.07 0.00 T300 4.74 0.21
0.747 40 Raw 10.94 0.40 T200 9.25 0.15 T250 7.30 0.09 T300 7.99 0.09
0.964 40 Raw 18.17 2.38 T200 13.78 0.21 T250 10.16 0.47 T300 11.06 0.27 F Fungi growth observed

85
Growth of fungi colonies was observed at the highest ERH values on raw samples
at 20 °C and 30 °C, and on T200 and T250 samples only at 30 °C. This might affect EMC
of the samples. However, samples with mold contamination did not show any abnormally
high EMC values caused by dry matter loss due to microbial degradation. Hence, the
aforementioned samples were also included in the statistical analysis and fitting of water
adsorption isotherms.
Fitting sorption models to experimental results
Five water sorption isotherms, selected according to the ASABE standards, were
used to fit experimental data presented in Table 11. Non-linear regression was used for
fitting yielded unknown model parameters that are shown in Table 12. Statistical criteria
for model performance characterization (MRE, RMSE, RSS, and R2) are also given in
Table 12. These were used for the selection of the model that described the relationship
between ERH and EMC most accurately. Lowest MRE, RMSE and RSS values are used
to indicate the best model for fitting experimental data. The modified Oswin model
represented the best model for fitting raw and torrefied biomass, as with this model lowest
values of the aforementioned three parameters were obtained. The modified Henderson
was the second best performing model.
In addition to previously discussed statistical parameters used for model
performance characterization, a residual plot is often used as a main criterion for model
acceptance or rejection. Residual plots for all five selected models are shown in Figure
19. As can be seen in the figure 19, modified Chung-Pfost, modified Henderson, and
modified GAB models show a systematic distribution of residuals.

86
Table 12. Water vapor adsorption parameters for the raw and torrefied corn stover
Sample Model A B C H1 H2 R2
MRE
(%) RSS RMSE
Raw Modified
Chung-Pfost 80.3430 12.9223 0.1395 0.8942 44.01 3.028 0.0422
Modified
Halsey 4.7831 -0.0358 2.1794 0.9645 31.39 1.017 0.0245
Modified
Oswin 10.6784 -0.1340 2.4557 0.9766 20.02 0.671 0.0199
Modified
Henderson 0.0018 26.4117 1.0734 0.9686 17.99 0.899 0.0230
GAB 3.8848 0.3849 47.3216 2090.335 45000 0.9594 30.14 1.162 0.0278
T200 Modified
Chung-Pfost 70.4461 9.3173 0.1601 0.8740 48.19 2.835 0.0408
Modified
Halsey 4.4186 -0.0420 2.1203 0.9783 25.45 0.489 0.0170
Modified
Oswin 9.3512 -0.1311 2.3795 0.9875 15.44 0.281 0.0129
Modified
Henderson 0.0027 20.9265 1.0297 0.9748 22.72 0.568 0.0183
GAB 3.2719 0.3362 47.6590 2427.192 42356.11 0.9749 25.37 0.565 0.0194
T250 Modified
Chung-Pfost 93.4331 13.4685 0.2416 0.9106 32.11 0.836 0.0222
Modified
Halsey 4.1963 -0.0353 2.3710 0.9548 29.51 0.423 0.0158
Modified
Oswin 6.9828 -0.0826 2.6851 0.9712 18.92 0.270 0.0126
Modified
Henderson 0.0022 26.6979 1.1954 0.9661 14.32 0.317 0.0137
GAB 2.6351 0.3527 61.0000 2256.327 41223.2 0.9529 27.73 0.440 0.0171
T300 Modified
Chung-Pfost 107.560 18.4000 0.2239 0.8551 31.15 1.663 0.0313
Modified Halsey 4.2505 -0.0321 2.3463 0.9076 27.49 1.060 0.0250
Modified
Oswin 7.3975 -0.0848 2.6590 0.9223 18.38 0.891 0.0229
Modified
Henderson 0.0019 32.5443 1.1756 0.9072 19.47 1.064 0.0250
GAB 2.7887 0.3993 39.1527 1965.523 44322 0.9016 24.27 1.129 0.0274

87
Residual equilibrium m
oisture content (decim
al)
Predicted equilibrium moisture content (decimal)
Figure 19. Residual plots of the water vapor adsorption isotherms for raw and torrefied
corn stover (A – Modified Chung-Pfost, B – Modified Halsey, C - Modified Oswin, D -
Modified Henderson, E – GAB)
-0.1
-0.05
0
0.05
0.1
0 0.1 0.2 0.3 0.4 0.5
A-0.1
-0.05
0
0.05
0.1
0 0.1 0.2 0.3 0.4 0.5
B
-0.1
-0.05
0
0.05
0.1
0 0.1 0.2 0.3 0.4 0.5
C -0.1
-0.05
0
0.05
0.1
0 0.1 0.2 0.3 0.4 0.5
D
-0.1
-0.05
0
0.05
0.1
0 0.1 0.2 0.3 0.4 0.5
E

88
Therefore, these were poor models for describing the correlation of ERH and
EMC of corn stover and had to be rejected. Modified Oswin and Halsey models had a
random distribution of residuals, but since the former one has better statistical parameters
it has been accepted as the best among five investigated models. The modified Oswin
model provided the best fit not only for raw corn stover, but also for torrefied corn stover.
Igathinathane and co-workers [27] investigated the EMC of three corn stover components
and concluded that the modified Oswin and Halsey isotherm models performed best
based on prediction capabilities and randomized residuals.
As can be seen in Figure 20, 21, 22, and 23, the fitted modified Oswin equation
shows that EMC data of raw and torrefied corn stover follow a sigmoidal curve, typical
for the most agricultural products [44]. This type of curve represents a type II isotherm,
according to Brunauer and Emmet’s classification [45]. This family of isotherms
describes multilayer adsorption with an asymptotic trend as water activity approaches 1.0.
Type II isotherm is concave downward in the low and concave upward in the high RH
region. It represents isotherms typical for BET adsorption mechanism that allows infinite
adsorption for RH values close to 1. The concavity in the low RH range is considered to
represent the end of formation of monomolecular layer, and the beginning of the
development of the multilayer of water molecules [46]. In case of lignocellulosic material
the monolayer is created via strong hydrogen bonding of single molecules in amorphous
regions of plant fiber matrix. Almost linear mid-portion of the isotherm corresponds to
weak bonds between multiple layers of water molecules or to filling of the fine
capillaries. The steep portion of the isotherm beyond concavity in the high RH region is
consequence of the swelling of the cellulose, and condensation of free water in coarse
capillaries where they exist in a bulk state [47,48]. The previously discussed trend of
decrease in EMC with increase in environmental temperature, regardless of sample type,

89
is clearly depicted in these figures. However, this trend is less expressed in the case of
corn stover torrefied at 250 (T250) and 300 °C (T300). It can be seen in the figures that
increase in ERH causes increase in EMC of all samples. This is especially pronounced at
ERH values above 0.9. The abrupt increase in EMC at ERH above 0.9 is larger for raw
(45% db) and T200 (40% db) than for T250 (25% db) and T300 (25% db). As already
stated, the difference between raw and corn stover torrefied at higher temperatures may
be due to degradation of hemicellulose. Moreover, the elimination of hemicellulose leads
to the elimination of monosaccharide and hydroxyl moieties that served as water binding
sites. Curves show a sharp increase at about 0.8-0.9 ERH, which is characteristic for type
II isotherms [49].
Figure 20. Experimental and isotherms predicted by Modified Oswin model of raw corn
stover
0
10
20
30
40
50
0 0.2 0.4 0.6 0.8 1
Equilibruim
moisture content (%
db)
Equilibrium relative humidity (decimal)
Experimental 10°C Experimental 20°CExperimental 30°C Experimental 40°CPredicted 10°C Predicted 20°CPredicted 30°C Predicted 40°C

90
Figure 21. Experimental and isotherms predicted by Modified Oswin model of corn
stover torrefied at 200 °C
Figure 22. Experimental and isotherms predicted by Modified Oswin model of corn
stover torrefied at 250 °C
0
10
20
30
40
50
0 0.2 0.4 0.6 0.8 1
Equilibrium m
oisture content (%
db)
Equilibrium relative humidity (decimal)
Experimental 10°C Experimental 20°C
Experimental 30°C Experimental 40°C
Predicted 10°C Predicted 20°CPredicted 30°C Predicted 40°C
0
10
20
30
40
50
0 0.2 0.4 0.6 0.8 1
Equilibrium m
oisture content (%
db)
Equilibrium relative humidity (decimal)
Experimental 10°C Experimental 20°C
Experimental 30°C Experimental 40°C
Predicted 10°C Predicted 20°C
Predicted 30°C Predicted 40°C

91
Figure 23. Experimental and isotherms predicted by Modified Oswin model of corn
stover torrefied at 300 °C
As can be seen in Figure 24, torrefied biomass has distinct water vapor adsorption
properties from raw biomass. Therefore, all predicted isotherms of torrefied samples are
grouped together at 40 °C. However, raw corn stover at 10 °C and corn stover torrefied at
200 °C had a similar predicted EMC, but they were significantly different from samples
torrefied at 250 and 300 °C, which had similar behavior at this environmental
temperature.
0
10
20
30
40
50
0 0.2 0.4 0.6 0.8 1
Equilibrium m
oisture content (%
db)
Equilibrium relative humidity (decimal)
Experimental 10°C Experimental 20°C
Experimental 30°C Experimental 40°C
Predicted 10°C Predicted 20°C
Predicted 30°C Predicted 40°C

92
Figure 24. Comparison of raw and torrefied corn stover isotherms at 10 and 40 °C
Microbial degradation results
Microbial degradation tests were conducted at 30 °C and 0.97 ERH. These values
were chosen as they were the only conditions that sustained fungi growth on all four
samples. The results are presented in Figure 25. Dry matter loss (DML) of the raw corn
stover sample was about 17% after 30 days, and was the highest among all samples
(Figure 25).
Figure 25. Dry matter loss due to microbial degradation at 0.97 ERH and 30 °C
0
10
20
30
40
50
0 0.2 0.4 0.6 0.8 1
Equilibruim
moisture content (%
db)
Equilibrium relitve humidity (decimal)
Predicted Raw Predicted T200
Predicted T250 Predicted T300
10°
40°C
0
5
10
15
20
Raw T200 T250 T300
Dry m
atter loss (%) Error bar: standard error of the mean

93
This value was about 3 times higher than the dry matter mass loss of T200 sample.
DML for corn stover torrefied at 250 and 300 °C were less than 1%.
As discussed in the section 3.1 and 3.2, even though torrefied biomass is
comparatively more hydrophobic in nature than raw biomass, it still adsorbs a relatively
significant amount of water vapor. At the temperature and ERH used in the microbial
degradation experiment, raw and T200, and T250 and T300 samples had EMC values of
about 25 and 15%db, respectively. However, DML was significantly lower in the case of
corn stover torrefied at 250 °C and 300 °C than in the case of raw biomass. This might be
not only due to the elimination of hemicellulose and an increase in hydrophobicity, but
also the formation of sugar and lignin degradation products toxic to microorganisms, such
as furan and phenol derivatives that are trapped in the pores of torrefied material [50-53].
Fiber analysis results
Results of the fiber analysis are shown in Table 13. There was an overall trend of
decrease in both xylan and arabinan quantity with increase in torrefaction temperature. In
this work, these two compounds are considered to represent hemicellulose fraction of
corn stover, since other minor components, such as galactan and mannan were registered
only in traces. As expected, raw and biomass pretreated at 300 °C had respectively the
highest (28%) and the lowest (4%) amount of hemicellulose. Similar trend was also
observed by several other researchers [6, 22]. Increase in the torrefaction temperature
from 250 to 300 °C caused cellulose degradation and decrease in its contents from about
45 to 20%, respectively. Nevertheless, there was no significant difference between raw,
T200, and T250 in regards to cellulose content, which was expressed as a glucan
percentage. Relative total lignin content increased from 20 to 75% with the temperature

94
increase, probably due to carbohydrate elimination and conversion to acid insoluble
products during the thermal pretreatment.
Table 13. Fiber analysis of raw and torrefied corn stover
Sample ASL (%) AIL (%) Glucan (%) Xylan (%) Arabinan
(%) Raw 2.6 ± 0.14 a 19.4 ± 0.37a 45.7 ± 0.14a 27.8 ± 0.07a 4.6 ± 0.01a
T200 2.6 ± 0.14a
22.9 ± 0.25
b 44.9 ±
0.31
a 25.5 ± 0.04
b 4.0 ± 0.23
b
T250 2.7 ± 0.21a
33.3 ± 0.55 c
46.0 ± 0.41
a 15.8 ± 0.70
c 2.3 ± 0.05
c
T300 1.0 ± 0.04b 75.1 ± 0.49 d 19.9 ± 0.27b 3.6 ± 0.27d 0.4 ± 0.01d
ASL = acid soluble lignin
AIL = acid insoluble lignin
Note: Values are given as mean ± standard deviation of two measurements. Samples
marked with different letters in superscript are significantly different at α = 0.05
according to the Tukey-Kramer pair-wise mean comparison test. Different fiber
categories were not compared to each other.
Conclusion
The EMC of raw and thermally pretreated corn stover was measured at ERH and
temperature ranging from 10 to 98% and 10 to 40 °C, respectively. Except at the highest
ERH value, sample torrefied at 200 °C did not have water adsorption properties different
from the raw biomass. However, the adsorption properties of samples torrefied at 250 and
300 °C were significantly different from the raw biomass. Torrefaction may have
increased hydrophobicity of biomass through the elimination of the hydrophilic
carbohydrate fraction and its partial conversion into non-polar, hydrophobic degradation
products. Five isotherms were fitted to the experimental data to obtain the EMC-ERH
prediction equations. Isotherms of all samples belong to type II. Modified Oswin model,
followed by modified Halsey model, showed the best performances and were
recommended for the characterization of water vapor sorption behavior of raw and
torrefied corn stover. Modified Chung-Pfost, modified Henderson and GAB models were
not recommended since their residual plots were systematic. Degradation test at highest
ERH and 30 °C showed that raw biomass had about 17% dry matter loss due to microbial

95
degradation. Samples torrefied at 250 and 300 °C had negligible dry matter loss when
compared to raw and samples torrefied at 200 °C. This might be predominantly due to
higher hydrophobicity and probably the formation of degradation products toxic to fungi.
Fiber analysis showed a significant decrease in hemicellulose content and a relative
increase in the lignin content of torrefied corn stover. Optimal torrefaction temperature
was found to be 250 ºC, since higher process temperatures cause excessive dry matter loss
during the torrefaction process without significantly enhancing hydrophobicity and
resistance to microbial degradation of torrefied corn stover.
Acknowledgements
Funding for this project was provided by the ConocoPhillips Company.
Additional technical support was provided by Center for Sustainable Energy (CSET) and
Biocentury Research Farm (BCRF) of Iowa State University, Ames, IA. We would also
like to thank Andy Suby and Patrick Johnston for their contribution to this work.
References
1. Brown, R. C. Biorenewable Resources: Engineering New Products from Agriculture,
1th ed.; Blackwell Publishing Professional: Ames, IA, 2003; pp 3-12.
2. Jenkins, B. M.; Sumner, H. R. T. ASABE 1986, 29 (3), 824-836.
3. Shinners, J. K.; Binversie, J. B.; Muck, E. R.; Weimer, J. P. Biomass Bioenerg. 2007,
31, 211-221.
4. Nurmi, J. Biomass Bioenerg. 1999, 17, 41-47.
5. Wadsö, L. Fire Mater. 2007, 31, 241-255.
6. Bergman, P. C.; Boersma, A. R.; Zwart, R. W. R.; Kiel, J. H. A. Torrefaction for
biomass co-firing in existing coal-fired power stations (Biocoal); ECN-C--05-013;
Energy Research Centre of the Netherlands: Petten, NL, July 2005.
7. Igathinathane, C.; Womac, A. R.; Sokhanasanj, S.; Narayan, S. Biomass Bioenerg.
2009, 33, 547-557.

96
8. Neathery, J. K. Biomass gasification. In Thermochemical Conversion of Biomass to
Liquid Fuels and Chemicals, 1st ed.; Crocker, M., Ed.; Royal Society of Chemistry:
Cambridge, UK, 2010; pp 67-94.
9. Gray, M. R.; Corcoran, W. H.; Gavalas, G. R. Ind. Eng. Chem., Process Des. Dev.
1985, 24, 646-651.
10. Khan, A. A.; De Jong, W.; Jansens, P. J.; Spliethoff, H. Fuel Process. Technol. 2009,
98, 21-58.
11. Mantell, C. L. Adsorption. McGraw Hill: New York, NY, 1951; pp 1-19.
12. Crittenden, B.; Thomas, W. J. Adsorption Technology & Design. Butterworth-
Heinmann: Oxford, UK, 1998; pp 31-65.
13. Cordeiro, D. D.; Raghavan, G. S. V.; Oliveira, W. P. Biosyst. Eng. 2006, 94 (2), 221-
228.
14. Nurhan A.; Hasan T. J. Stored Prod. Res. 2006, 42, 112-135.
15. Mayor L.; Moreira R.; Chenlo F.; Sereno A. Eur. Food Res. Technol. 2005, 220, 163-
167.
16. Singh, R. N. Biomass Bioenerg. 2004, 26, 251-253.
17. Van der Berg, C.; Bruin, S. Water Activity and Its Estimation in Food Systems:
Theoretical Aspects. In Water activity: Influences on Food Quality; Rockland, L. B.,
Steward, G. F., Eds.; Academic Press: New York, NY, 1981; pp 1-61.
18. Labuza T. P.; Altunakar B. Water Activity Prediction and Moisture Sorption
Isotherms. In Water Activity in Foods: Fundamentals and Application, 1st ed.;
Barbosa-Canovas, G. V., Fontana, A. J., Jr., Schmidt, S. J., Labuza, T. P., Eds.;
Blackwell Publishing Professional: Ames, IA, 2007; pp 109-154.
19. Chen, C. C.; Morey, R. V. T. ASAE 1989, 32, 983-990.
20. ASAE standard D245.6. Moisture Relationships of Plant-Based Agricultural Products.
St. Joseph, MI, 2007.
21. Yan, W.; Acharjee, T. C.; Coronella, C. J.; Vasquez, V. R. Environ. Prog. Sustainable
Energy 2009, 28 , 435-440.
22. Greig, S. J.; Sing, K. S. Adsorption, Surface Area and Porosity, 2nd ed., Academic
Press: New York, NY, 1982.
23. Chirife, J.; Fontan F. C.. J. Food Sci. 1982, 47, 661-663.
24. Rüegg, M. Water in Dairy Products Related to Quality, with Special Reference to
Cheese. In Properties of water in foods in relation to quality and stability; Simatos, D.,

97
Multon J. L., Eds.; NATO ASI Series E 90; Martinus Nijhoff Publishers: Dordrecht,
NL, 1985; pp 603-625.
25. Sakaar, C. Wood-Water Relations, 1st ed.; Springer-Verlag: Berlin, DE, 1988.
26. Fasina, O. O.; Sokhansanj, S. J. Agr. Eng. Res. 1993, 55, 51-63.
27. Igathinathane, C.; Womac, A. R.; Sokhansanj, S.; Pordesimo, L. O. T. ASAE 2005,
48 (4), 1449-1460.
28. Wiig, E. O.; Juhola A. J. J. Am. Chem. Soc. 1949, 71, 516-568.
29. Monzam, E. R.; Shadle, L. J.; Evans, R.; Schroeder, K. Energy Fuels 1998, 12, 1299-
1304.
30. Bedia J.; Rodriguez-Mirasol J.; Cordero T. J. Chem. Technol. Biotechnol. 2007, 82,
548-557.
31. Acharjee , T. C.; Coronella , C. J.; Vasquez , V. R. Bioresour. Technol. 2011, 102,
4849-4854.
32. ASAE standard D358.2 (R2008). Moisture Measurement - Forages. St. Joseph, MI,
1998.
33. Medic, D.; Darr, M.; Shah, A.; Potter, B.; Zimmerrnan, J. Fuel 2011, 91, 147-154.
34. Spiess, W. E. L.; Wolf, W. Water activity. In Water Activity: Theory and Application
to Food; Rockland, L. B., Beuchat, L. R., Eds.; IFT Basic Symposium Series 664;
Marcel Dekker: New York, NY, 1987; pp 215-233.
35. Greenspan, L. J. Res. Natl. Bur. Stand. Sec. A 1977, 81, 89-96.
36. Mohamed, L. A.; Kouhila, M.; Jamali, A.; Lahsani, S.; Mahrouz, M. J. Food Eng.
2005, 67, 491-498.
37. Osborn, G. S.; White, G. M.; Sulaiman, A. H.; Walton, L. R. T. ASAE 1989, 32,
2109-2113.
38. Sluiter, J.; Hames, B.; Ruiz, R.; Scarlata, C.; Sluiter, J.; Tempelton, D.; Croker, D.
Determination of Structural Carbohydrates and Lignin in Biomass; Technical report
NREL/TP-510-42618; National Renewable Energy Laboratory: Golden, CO, July
2011.
39. Okos, M. R.; Narsimhan, G.; Singh, R. K.; Weitnauer, A. C. Food Dehydration. In
Handbook of Food Engineering; Heldman, D. R., Lund, D. B., Eds.; Marcel dekker:
New York, NY, 1992; pp 437-562.
40. Barbosa-Canovas G. V.; Juliano P. Desorption Phenomena in Food Dehydration
Process. In Water Activity in Foods: Fundamentals and Application, 1st ed.; Barbosa-
98
Canovas, G. V., Fontana, A. J., Jr., Schmidt, S. J., Labuza, T. P., Eds.; Blackwell
Publishing Professional: Ames, IA, 2007; pp 109-154.
41. Olsson A-M.; Salmen, L. Carbohydr. Res. 2004, 339, 813-818.
42. Taniguchi, T.; Harada, H,; Nakato, K. Nature 1978, 272, 230-231.
43. Bjork, H.; Rasmunson, A. Fuel 1995, 74, 1887-1890.
44. Lewicki, P. P. Data and Models of Water Activity. II: Solid Foods. In Food properties
handbook, 2nd ed.; Shafiur, R., M., Ed.; CRC Press: Boca Raton, FL, 2009; pp 66-
151.
45. Brunauer, S.; Deming, L. S.; Dming W. E.; Troller, E. J. Am. Chem. Soc. 1940, 62,
1723-1732.
46. Rouqu?rol, F.; Rouquerol, J.; Sing, K. S. W. Adsorption by Powders & Porous Solids:
Principles, Methodology and Applications; Academic Press: New York, NY, 1998; pp
19-20.
47. Assaf, A. G.; Haas R. H.; Purves, C. B. J. Am. Chem. Soc. 1944, 66, 66-73.
48. Inagaki, T.; Yonenbou, H.; Tsuchikawa, S. App. Spectrosc. 2008, 62, 860-865.
49. Do, D. D. Adsorption Analysis: Equilibrium and Kinetics; Imperial College Press:
London, UK, 1998; pp 49-148.
50. Rivilli, P. L.; Alarcon, R.; Isasmendi, G. L.; Perez, J. D. BioRes. 2012, 7, 112-117.
51. Jung, K-H.; Yoo, S. K.; Moon, S-K.; Lee, U-S. Mycobiology 2007, 35, 29-47.
52. Gutierrez, T.; Buszko, M. L.; Ingram, L.O.; Preston J. F. Appl. Biochem. Biotechnol.
2002, 98-100, 327-340.
53. Voda, K.; Boh, B.; Vrtacnik, M.; Pohleven, F. Int. Biodeterior. Biodegrad. 2003, 51,
51-59.

99
Chapter 5. Effect of particle size, different corn stover
components and gas residence time on torrefaction of corn
stover
A paper accepted with pending revisions by Energies
Dorde Medic *, Matthew Darr, Ajay Shah, and Sarah Rahn
Department of Agricultural and Biosystems Engineering, Iowa State University, 100
Davidson Hall, Ames, IA 50011, USA
* Corresponding author. E-mail address: [email protected]
Abstract
Large scale biofuel production will be possible only if significant quantities of
biomass feedstock can be stored, transported, and processed in an economic and
sustainable manner. Torrefaction has the potential to significantly reduce the cost of
transportation, storage, and downstream processing through the improvement of physical
and chemical characteristics of biomass. The main objective of this study was to
investigate the effects of particle size, plant components, and gas residence time on the
production of torrefied corn (Zea mays) stover. Different particle sizes included 0.85 mm
and 20 mm. Different stover components included ground corn stover, whole corn stalk,
stalk shell and pith, and corn cob shell. Three different purge gas residence times were
employed to assess the effects of interaction of volatiles and torrefied biomass. Elemental
analyses were performed on all of the samples, and the data obtained was used to estimate
the energy contents and energy yields of different torrefied biomass samples. Particle
density, elemental composition, and fiber composition of raw biomass fractions were also
determined. Stalk pith torrefied at 280 °C and stalk shell torrefied at 250 °C had highest
100
and lowest dry matter loss, of about 44% and 13%, respectively. Stalk pith torrefied at
250 °C had lowest energy density of about 18-18.5 MJ/kg, while cob shell torrefied at
280 °C had the highest energy density of about 21.5 MJ/kg. The lowest energy yield, at
59%, was recorded for stalk pith torrefied at 280 °C, whereas cob and stalk shell torrefied
at 250 °C had highest energy yield at 85%. These differences were a consequence of the
differences in particle densities, hemicellulose quantities, and chemical properties of the
original biomass samples. Gas residence time did not have a significant effect on the
aforementioned parameters.
Keywords: torrefaction; corn stover; particle size; gas residence time
Introduction
Transportation fuels produced from lignocellulosic biomass have recently gained
attention due to their positive effects on fossil fuel displacement, greenhouse gas emission
reduction, rural development, and national security enhancement. The Energy
Independence and Security Act (EISA) of 2007 mandates an increase in the minimum
annual quantity of renewable fuels in the United States transportation sector, from 58
billion liters in 2012 to 136 billion liters in 2022. As per the EISA mandate, out of the
total renewable fuels produced in 2022, 79 billion liters should be advanced biofuels
derived mainly from cellulosic feedstock, which does not compete with food production
[1]. Large amounts of lignocellulosic biomass have to be collected, stored, and processed
to support biofuels production at levels demanded by EISA. There is a variety of
conversion technologies available for the production of biofuels, such as fermentation,
pyrolysis, gasification, and hydrothermal processing. Although thermochemical pathways
employ higher temperatures and/or pressures than biochemical pathways, they have
numerous advantages, such as higher reaction rates, fewer feedstock pretreatment

101
requirements, and an easier integration with the existing fossil fuel production
infrastructure.
All conversion technologies are constrained by a narrow tolerance range for the
physical characteristics of the converted biomass, such as particle size, shape, and
moisture content. For example, a particle size larger than the accepted range will increase
the amount of gas produced in the gasification process but, due to a slower gas diffusion
speed, will decrease the quality of the gas produced, by reducing the amount of hydrogen
and carbon monoxide present.[2-4]. A large particle size also gives rise to the inter-
particle vapor-char interaction and increases the yield of undesirable, light bio-oil
fractions [5-7]. The shape of particle can influence proper fluidization, interfere with
reactor feeding, induce material bridging, and affect product distribution in
thermochemical systems [8-10]. The gasification of biomass with high moisture content
results in more tar formation, unreliable operation, and low process efficiency [11]. An
increase in the moisture content could enhance char yield during pyrolysis [12, 13].
Size reduction and drying are energy intensive processes that significantly
deteriorate the economy of biofuel production. A high heterogeneity of a lignocellulosic
biomass, even among the same plant species, may degrade the quality of the final product
produced by pyrolysis or gasification [14-17]. In addition, long distance feedstock
transportation increases the cost of biorenewable production due to the feedstock’s low
bulk and energy densities. Large scale production requires large quantities of biomass to
be stored in order to support the operation of biorefineries over the whole year. Biomass
feedstock’s susceptibility to microbial degradation during storage further compromises its
economical utilization for fuel production [18, 19]. Torrefaction can be employed to
significantly reduce the cost of transportation, storage, and downstream processing by

102
improving biomass brittleness, hydrophobicity, resistance to microbial degradation,
energy density, homogeneity, and chemical characteristics [20, 21, 22].
Torrefaction is a thermochemical process conducted in a temperature regime
between 200 and 300 ºC under an inert atmosphere, with a low heating rate. It induces
depolymerization and devolatilization of hemicellulose, the most reactive polymer under
torrefaction reaction conditions [23 - A]. As a consequence, various volatile species with
high oxygen contents are formed, along with a solid product composed of mainly
cellulose and lignin [17, 20, 24]. The product distribution from the torrefaction process, as
well as the characterization of different product streams has been conducted by several
researchers [25, 26]. The suitability of many biomass feedstocks, including woody crops,
agricultural residues, and dedicated energy crops, have been investigated. Most of the
studies only assessed the torrefaction temperature and residence time as the variables
influencing the quality and quantity of the solid product, permanent gases, and
condensables produced [15-17, 19, 20, 24, 28-30]. Feedstock particle size and purge gas
residence time are two other important parameters that has not yet been addressed. The
positive effect of torrefaction on energy consumption during biomass size reduction can
be captured only if the large particle size of biomass is utilized in the torrefaction process.
A large particle size induces higher char production and lower liquid yield in the
pyrolysis process [5-7]. However, how this affects the torrefaction process, or product
yield and quality is not known. Purge gas residence times or volatile residence times have
a strong impact on bio-oil and char yield in the pyrolysis process. Secondary reactions
between char and volatiles in pyrolysis process enhance the yield of solids and decrease
bio-oil yield. Prins et al. [24] concluded that formation of carbon monoxide during
torrefaction can be explained by the reaction of carbon dioxide and steam with solid char.
This confirms that there is indeed potential for solid-volatiles interaction in the

103
torrefaction process. Torrefaction, as a process that has some similarities to pyrolysis, also
might be affected by the purge gas flow rate. The reduction of purge gas use may be
important for reducing capital and operating costs. In addition, both factors are important
for proper reactor design, scale up, and operation.
The objective of this study was to investigate the torrefaction behavior of two
particle sizes, (< 0.85mm and 20mm) and three corn stover components (stalk shell, stalk
pith, and cob shell. Three purge gas flow rates, i.e. gas residence times, (List the three
rates here) were employed to assess potential interaction between volatiles and torrefied
biomass that can influence biomass yield and quality, in the same manner as in the
pyrolysis process. Torrefaction of the corn stover was conducted in a thermogravimetric
analyzer (TGA) and a bench scale reactor. The dry matter loss (DML) during torrefaction
experiments was recorded. All samples were analyzed for carbon, hydrogen, nitrogen, and
sulfur contents, and the obtained data were used to calculate the energy content of
torrefied samples and their energy yields. Results of the proximate analysis of raw
biomass were used to determine ash content of the torrefied biomass. Particle density and
the composition of raw biomass were determined as well.
Materials and Methods
Corn stover samples
Corn stover biomass was harvested Fall 2010 from Iowa State University research
fields located in Story County, IA. The bulk wet samples were dried at 60 ºC for 72 h
immediately after the harvest. Dry samples were stored in a cooling chamber at a
temperature below 5 °C to preserve their original quality and prevent microbial
degradation.

104
A subsample of the bulk material was ground by hammer mill and sifted through
an 850 µm sieve to obtain ground stover sample. Subsamples of corn stalk and cobs were
handpicked from bulk corn stover samples. Stalks were cut into discs to enable separation
of shell and pith. Cobs were also cut into discs and separated from the pith. Discs were
cut further into 5x5x5 mm cubes by hand (Figure 26). Stalk shell samples were cut into
5x5x2 mm cuboid (Figure 26). The shape of cube was chosen for stalk pith and cob shell,
because it is closest to a spherical shape. A spherical shape is preferable because it does
not favor any dimension in the heat transfer process; however, since this shape is difficult
to cut reliably, the cube was used. In addition, the natural geometry of stalk shell dictated
its shape to be in a form of a cuboid prism. Finally, the largest sample size was obtained
by handpicking stalks of about 20 mm diameter and cutting them into rods 100 mm long
(Table 14).
Figure 26. Different corn stover components

105
Table 14. Sample designation and basic properties
Factor Level Dimensions (mm) Shape
Particle size Ground stover <0.85 Spherical
Whole stalk 19x16x100 Elliptic cylinder
Corn stover
component
Stalk shell 5x5x2 Prism
Stalk pith 5x5x5 Cube
Cob shell 5x5x5 Cube
Gas residence
time
1.2 sec
12 sec
60 sec
All samples were dried at 60 °C for 72 h and stored in a desiccator until the
torrefaction experiments were conducted. The moisture contents of samples before and
after the experiments were determined according to the ASAE standard D358.2 for forage
moisture measurement [31].
Torrefaction experiments
Torrefaction of ground stover, stalk shell, stalk pith, and cob shell was conducted
in a TGA (TGA/DSC Star System, Mettler-Toledo, Columbus, OH) equipped with an
autosampler. Experiments were done at 250 and 280 ºC using two temperature time
programs and 900 µl pans (Figure 27).
Figure 27. Temperature programs used to conduct torrefaction experiments in the TGA
0
100
200
300
0 20 40 60 80 100
Te
mp
era
ture
(°C
)
Time (min)
Torrefaction at 250°C Torrefaction at 280°C

106
The drying phase at 105 °C was employed before torrefaction to eliminate the
influence of water evaporation on DML during torrefaction. Both ramping phases
employed a 10 °C/min heating rate. Torrefaction was conducted for 20 min, regardless of
the torrefaction temperature. In order to register the correct sample weight after
torrefaction, a final isothermal step at 25 °C was utilized. An inert atmosphere was
maintained by means of nitrogen purge gas.
A stainless steel bench scale reactor was constructed to accommodate the largest
particle size samples. The reactor was 20 mm in diameter and 120 mm in length. It was
heated indirectly by two heaters controlled independently by PID controllers (Figure 28).
This setup enabled the formation of two distinct heating zones for stable temperature
control. Two thermocouples were used to sense the reactor temperature. Furthermore,
preheated nitrogen purge gas was used to supply additional heat to the system and prevent
temperature fluctuations. Samples were loaded into the reactor through the end farther
from the gas heater. The reactor was purged with nitrogen for 5 min at flow rate of
1L/min before every run. The samples were unloaded once the temperature in the reactor
was below 100 °C, in the same manner as the loading procedure. The cooling phase from
the torrefaction temperature to 200 °C took 7-9 min, depending on the torrefaction
temperature. The torrefaction reaction is considered to start above 200 °C [23]. The
reactor was purged with nitrogen at 1 L/min during the cooling phase to maintain a
constant pressure, evenly cool the biomass, and terminate the torrefaction process. The
weight of each whole stalk sample was about 1.5-1.6 g.

107
Figure 28. Bench scale reactor setup used in torrefaction experiments (R-reactor; GH –
gas heater; H1, H2, H3-heaters; T1, T2, T3, T4 – thermocouples; all thermocouples were
positioned inside the respective unit of the system, except T3, which was positioned
between the metal gas line and the heater)
The temperature profiles recorded during torrefaction experiments in the bench
scale reactor at 250 and 280 °C are shown in Figure 29.
Figure 29. Temperature time profile of the bench scale reactor
Each experiment was conducted in triplicate. The final solid products were
recovered and further analyzed while volatile gases were not collected.

108
Chemical analysis of raw and torrefied biomass
Moisture, volatiles, ash, and fixed carbon contents of the raw biomass samples
were determined using the same TGA that was used for torrefaction experiments,
according to the modified ASTM D 5142–04 method [32]. The analysis was done under a
nitrogen atmosphere (100 mL/min). Initially samples were heated to 105 °C at the heating
rate of 5 °C/min and retained at 105 °C for 40 min to determine the moisture content.
They were further heated at the rate of 5 °C/min to 900 °C and maintained at this
temperature for 20 min to determine the quantity of the volatiles. Subsequently the
environment was changed to oxidative by purging 100mL/min of air for 30 min to
determine the fixed carbon content. The remainder, after heating the sample under an
oxidative atmosphere at 900 °C, was considered ash.
Elemental analyses of different raw and torrefied biomass samples were done
using a CHNS/O analyzer (PerkinElmer 2400 Series II CHNS/O Analyzer, PerkinElmer,
Waltham, MA), according to the ASTM D 5373–08 method [33]. Biomass samples were
dried in an oven at 103 °C for 24 h before the elemental analysis. Combustion and
reduction were conducted at 925 and 650 °C under a helium atmosphere, respectively.
The HHV of raw and torrefied biomass samples were computed using Eq. (1)
developed by Sheng and Azevedo [34]. In Eq. (1), C and H are the percentages of carbon
and hydrogen in the biomass as determined by the ultimate analysis, and O is the
percentage of oxygen determined by the difference, on both a dry and ash free basis (i.e.,
O (daf) = 100 - C - H – N – S).
HHV (MJ/kg) = -1.3675 + 0.3137*C + 0.7009*H + 0.0318*O (1)
Compositional analyses of raw corn stover fractions were conducted to obtain the
content of neutral detergent fiber (NDF), acid detergent fiber (ADF), and acid detergent
lignin (ADL).The analyses were done according to AOAC Standards 973.18. and 2002.04

109
[35, 36]. The hemicellulose and cellulose contents were calculated from the obtained
NDF, ADF, ADL, and ash contents. The hemicellulose and cellulose contents were
calculated as the difference between NDF and ADF, and ADF and ADL, respectively.
Lignin was determined gravimetrically from ADL. The ash content was determined
gravimetrically from the reminder after calcination of dry ADL in the muffle furnace.
Statistical analysis
The experimental design used to accomplish the objectives of this work consisted
of 3 factors. The torrefaction temperature factor consisted of two levels: 250 and 280 ºC.
The feedstock factor consisted of three levels: stalk shell and pith, and cob shell (Table
14). The gas residence time factor consisted of three levels: 1.2, 12, and 60 seconds. A
statistical analysis was done to determine the significant difference between average
DML, O/C (oxygen to carbon ratio), H/C (hydrogen to carbon ratio) HHV, and energy
yields of torrefied biomass at a 95% confidence interval. Ground stover and whole stalk
samples were analyzed separately from stalk shell, pith, and cob shell samples. A Tukey-
Kramer Honestly Significant Difference (Tukey-Kramer HSD) test was conducted after
performing a One-Way Analysis of Variance (ANOVA). The JMP statistical package
from SAS (SAS Institute, Cary, NC) was used for the statistical analysis of the
experimental data.
Results and Discussion
The average DML of ground stover and whole stover samples torrefied at 250 and
280 °C are shown in Figure 30. DML of the samples torrefied at 250 °C did not differ
significantly, according to a Tukey-Kramer HSD test (not shown). This was probably due
to a limited devolatilization of hemicellulose at this process temperature. Under these
conditions the torrefaction reaction might be localized in the stalk shell of whole stover,
110
but it is sufficient to cause DML similar to the smallest particle size. Products of the
reaction in the pith of whole stover might condense and retain in the particle due to higher
mass transfer resistance of the less porous stalk shell. At 280 °C there was a significant
difference (p<0.0001) between the ground stover and whole stover components’ DML of
2-5 percentage points, regardless of residence time. Under these conditions, the
differences in the physical characteristics of two sample types significantly influence the
torrefaction reaction. Devolatilization of hemicellulose in the shell of the whole stalk
sample may not be sufficient to offset the limited devolatilization of the pith. Volatile
gases, developed during the process and condensed in the particle, further deteriorate both
the heat and mass transfer properties of whole stover samples. These aforementioned
constraints in the transfer phenomena were less expressed in ground stover samples,
which is why they had higher DML. As per the Tukey-Kramer HSD test, there was no
significant difference in DML of ground stover and whole stover induced by gas
residence time, regardless of the torrefaction temperature.

111
Figure 30. Average dry matter loss of torrefied ground stover and whole stalk samples
(error bar=standard deviation)
Figure 31. Average dry matter loss of torrefied stalk shell, stalk pith, and cob shell (error
bar=standard deviation)

112
Table 15. Proximate analysis of raw corn stover biomass*
Sample Volatiles (%) Fixed carbon (%) Ash (%)
Particle density
(kg/m3)
Fiber composition (%)
Cellulose Hemicellulose Lignin Other
Ground stover 77.05±0.22 17.56±0.01 5.45±0.33 - 43.3±0.5 32. 3±0.1 6.3±0.4 18.03±0.0
Stalk shell 75.43±0.20 21.31±0.00 3.18±0.06 444.61±48.39 56.6±0.2 15.2±1.0 13.5±0.1 15.62±1.3
Stalk pith 80.57±1.27 13.89±1.13 5.49±0.12 34.93±6.66 57.6±0.4 21.3±1.8 6.1±0.6 14.40±0.8
Cob shell 76.88±2.43 18.96±2.24 4.13±0.27 357.40±47.84 45.2±0.3 38.3±1.1 10.3±0.0 7.17±1.4
Whole stover 76.74±0.87 17.20±0.73 3.86±0.17 116.48±18.02 56.2±1.8 17.6±1.0 11.6±0.8 14.60±0.0 *All values are expressed on dry basis as a mean of two measurements ± standard deviation.
113
The two anatomical fractions of corn stalk and corn cob showed different behavior
under torrefaction reaction conditions (Figure 31). At 250 °C there was no significant
difference in DML between cob shell and stalk pith samples. However, these two samples
differed significantly from the stalk shell sample. Corn cob and stalk shell have the
highest and the lowest hemicellulose content, respectively, among all corn stover
fractions (Table 15). The same findings have been reported by Krull et al. [37] and
Garlock et al. [38]. Cob shell particle density, approximately 350 kg/m3, is comparable to
stalk shell density, and much higher than stalk pith density, approximately 40 kg/m3,
(Table 15). Therefore, the torrefaction reaction at 250 °C might not be intensive enough
to cause significant devolatilization of stalk shell samples due to their lower
hemicellulose content and high particle density. The high content of reactive
hemicellulose in cob shell makes it prone to higher DML during torrefaction.
Nonetheless, the high particle density of cob shell increases the resistance to heat and
mass transfer, thus preventing excessive DML by limiting hemicellulose’s exposure to
high temperatures. Stalk pith, on the other hand, has a lower hemicellulose content and
lower particle density. Therefore, even though the hemicellulose present in stalk pith is
more exposed to high temperatures, its low content limits DML. The opposite effect of
hemicellulose content and particle density might be the reason for the same DML of cob
shell and stalk pith at 250 °C.
At 280 °C there was no significant difference between cob shell and stalk shell,
but these two samples differed significantly from stalk pith. Heat and mass transfer might
be more significant factors once most of the hemicellulose was degraded at 280 °C and
devolatilization of cellulose and lignin had started. As can be seen in Figure 31, stalk pith,
which offers less resistance to heat/mass transfer, has a DML approximately 15
percentage points higher than the other two corn stover fractions. Furthermore, there were

114
no significant differences in DML of stalk shell, stalk pith, and cob shell due to different
gas residence times, regardless of torrefaction process temperatures.
Differences between the carbon, nitrogen, sulfur, hydrogen, and oxygen contents
of biomass samples were not statistically analyzed. Instead the O/C ratio and HHV were
analyzed using the Tukey-Kramer HSD test to determine their significant differences (not
shown in Table 16). According to statistical analysis, the O/C ratio of ground stover and
whole stalk were significantly different, (p≤0.002), regardless of the temperature. The
difference was about 9 and 5 percentage points at 250 and 280 °C, respectively. Stalk pith
had the highest O/C, 1.06 and 0.88 at 250 and 280 °C, respectively. Cob shell had the
lowest O/C, 0.77 and 0.66 at 250 and at 280 °C, respectively. The reason for the decrease
in the O/C ratio during torrefaction is the generation of volatiles rich in oxygen such as
CO2 and H2O [20, 24]. Apart from the higher initial value of the O/C ratio, the highest
O/C value of corn pith after torrefaction might be due to devolatilization of cellulose and
lignin, in addition to hemicellulose. Therefore, the O/C ratio did not change significantly
since both C and O were lost in comparable quantities through devolatilization.

115
Table 16. Elemental analysis and HHV of biomass samples
Sample Torrefaction
temperature (°C)
Gas residence
time (sec) C (wt %) H (wt %) N (wt %) S (wt %) O (wt %) O/C H/C HHV
(MJ/kg)
Ground
stover
250 1.2 45.76±0.37 5.99±0.13 0.62±0.06 0.36±0.10 47.28±0.43 1.03±0.02 0.13±0.01 18.68±0.14
12 45.78±1.08 5.27±1.20 0.46±0.08 0.32±0.08 48.17±2.42 1.05±0.08 0.11±0.00 18.85±1.10
60 46.27±0.22 5.81±0.24 0.63±0.06 0.56±0.03 46.73±0.13 1.01±0.01 0.12±0.02 18.70±0.11
280 1.2 49.59±0.25 5.56±0.08 0.65±0.10 0.33±0.08 43.86±0.31 0.88±0.02 0.11±0.00 19.48±0.07
12 50.21±0.10 5.57±0.07 0.70±0.07 0.39±0.05 43.13±0.09 0.86±0.00 0.13±0.00 19.66±0.02
60 50.35±0.31 5.45±0.08 0.71±0.05 0.36±0.03 43.14±0.29 0.85±0.01 0.11±0.00 19.61±0.10
Raw - 44.84±0.70 6.32±0.07 0.46±0.15 0.12±0.03 48.26±0.67 1.08±0.03 0.14±0.00 18.66±0.24
Stalk
shell
250 1.2 48.76±0.18 5.75±0.21 0.19±0.02 0.23±0.16 45.06±0.30 0.92±0.01 0.12±0.00 19.39±0.18
12 48.35±0.68 5.77±0.20 0.19±0.01 0.31±0.17 45.38±1.00 0.94±0.03 0.10±0.00 19.45±0.30
60 48.60±0.37 5.67±0.06 0.14±0.02 0.36±0.44 45.22±0.83 0.93±0.02 0.12±0.00 19.29±0.12
280 1.2 53.97±1.30 5.54±0.19 0.16±0.05 0.66±0.71 39.67±1.13 0.74±0.04 0.09±0.01 20.70±0.25
12 55.83±0.38 5.29±0.14 0.32±0.06 0.24±0.14 38.32±0.32 0.69±0.01 0.12±0.01 21.07±0.20
60 53.78±0.62 5.37±0.04 0.15±0.04 0.40±0.43 40.30±1.01 0.75±0.03 0.11±0.01 20.54±0.14
Raw - 47.87±0.06 6.28±0.07 0.04±0.03 0.10±0.04 45.72±0.15 0.95±0.01 0.13±0.00 19.50±0.05
Stalk
pith
250 1.2 46.40±0.06 5.48±0.05 0.33±0.12 0.15±0.02 47.64±0.04 1.03±0.00 0.12±0.00 18.54±0.06
12 45.61±0.54 5.58±0.14 0.31±0.04 0.18±0.02 48.32±0.45 1.06±0.02 0.10±0.01 18.46±0.14
60 45.18±0.08 5.34±0.09 0.26±0.05 0.08±0.05 49.14±0.08 1.09±0.00 0.12±0.01 18.10±0.08
280 1.2 49.99±0.67 4.77±0.18 0.46±0.07 0.11±0.07 44.67±0.57 0.90±0.02 0.10±0.01 19.07±0.12
12 51.27±1.31 5.02±0.29 0.47±0.23 0.12±0.03 43.13±1.41 0.84±0.05 0.12±0.00 19.60±0.53
60 49.89±0.40 4.75±0.12 0.54±0.30 0.02±0.01 44.79±0.57 0.90±0.02 0.10±0.01 19.04±0.03
Raw - 44.69±0.77 5.93±0.12 0.12±0.01 0.16±0.07 49.10±0.83 1.10±0.04 0.13±0.00 18.36±0.30
Cob
shell
250 1.2 52.74±0.13 5.80±0.01 0.51±0.25 0.18±0.03 40.77±0.26 0.77±0.01 0.11±0.00 20.54±0.04
12 53.23±0.83 6.07±0.14 0.29±0.01 0.19±0.02 40.22±0.94 0.76±0.03 0.10±0.00 20.67±0.33
60 52.42±0.40 5.68±0.05 0.31±0.06 0.10±0.02 41.49±0.41 0.79±0.01 0.11±0.01 20.37±0.10
280 1.2 56.52±0.30 5.48±0.09 0.40±0.04 0.05±0.03 37.56±0.20 0.66±0.01 0.10±0.01 21.39±0.03
12 56.44±0.69 5.86±0.10 0.41±0.03 0.18±0.04 37.11±0.62 0.66±0.02 0.11±0.00 21.62±0.15
60 56.12±0.48 5.41±0.05 0.37±0.07 0.05±0.04 38.05±0.54 0.68±0.02 0.10±0.01 21.23±0.14
Raw - 47.15±0.14 6.25±0.02 0.10±0.04 0.08±0.04 46.41±0.21 0.98±0.01 0.13±0.00 19.28±0.04
Whole
stover
250 1.2 47.96±0.41 5.83±0.35 0.30±0.08 0.26±0.04 45.65±0.67 0.95±0.02 0.12±0.01 19.21±0.33
12 48.36±1.27 5.73±0.11 0.41±0.03 0.25±0.02 45.25±1.33 0.94±0.06 0.11±0.00 19.25±0.39
60 47.78±1.00 5.98±0.12 0.30±0.04 0.29±0.12 45.65±0.93 0.95±0.04 0.12±0.00 19.26±0.34
280 1.2 52.57±0.95 5.42±0.23 0.40±0.11 0.32±0.10 41.30±0.95 0.79±0.03 0.11±0.00 20.23±0.22
12 51.83±0.82 5.68±0.14 0.35±0.01 0.23±0.03 41.90±0.94 0.81±0.03 0.12±0.01 20.20±0.31
60 50.94±0.31 5.72±0.13 0.29±0.04 0.27±0.04 42.77±0.35 0.84±0.01 0.11±0.01 19.98±0.17
Raw - 47.95±0.23 6.18±0.02 0.14±0.06 0.16±0.02 45.63±0.25 0.95±0.01 0.13±0.00 19.45±0.08
*All values are expressed on dry basis as a mean of two measurements ± standard deviation.

116
The differences between the O/C ratios due to gas residence time were not
significant, regardless of temperature. According to statistical analysis, there was no
significant difference (p≥0.2766) between the H/C ratios of ground stover and whole stalk,
regardless of temperature. This is a consequence of the limited change in hydrogen content
when compared to the change in carbon content. The former was less than 1 percentage
point, while the latter was up to 6 percentage points. Cob shell had a significantly lower H/C
ratio (p<0.0001) than stalk pith and shell at 250 °C, which correlates to a higher loss of
hydrogen than carbon, probably through the elimination of organics, such as acetic acid and
methanol [20]. However, the absolute difference between the average C/H ratio of cob shell,
and stalk shell and pith was only 0.008 percentage points. There was not any significant
difference (p>0.3105) between these samples at 280 °C, where the absolute difference was
0.003 percentage points. The gas residence time did not have any significant effect on H/C
ratio, regardless of torrefaction temperature, particle size or corn stover component. The
contents of nitrogen and sulfur remained almost constant and did not show any trend
regardless of particle size, corn stover component, or gas residence time. Moreover, these
two elements are present in very limited amounts and do not significantly contribute to the
energy density of the biomass.
Ash content of the raw biomass samples (Table 15) was used to compute the ash
content of torrefied biomass using Eq. (2). Furthermore, the ash content of torrefied biomass
was used to compute HHV on an ash free basis (Table 16).
(2)
Ashtorrefied(%db) = Ashraw
(%db)
100-DML (%db)·100

117
Where:
db= dry basis
HHV followed a trend opposite to the O/C ratio (Table 16). All samples were
significantly different (p≤0.0065) regardless of torrefaction temperature. Whole stalk
samples had a higher HHV than ground stover by approximately 0.7 and 0.5 MJ/kg at 250
and 280 °C, respectively. Cob shell had the lowest O/C ratio and consequently had the
highest HHV of 20.6 and 21.5 MJ/kg at 250 and 280 °C, respectively. Stalk pith had the
lowest values of 18.3 and 19.23 MJ/kg at 250 and 280 °C, respectively. The HHV of the
samples at distinct gas residence time levels was not significantly different (p≥0.5520),
regardless of the torrefaction temperature.
The average energy yields of the torrefied samples are shown in Figures 32 and 33.
Yields were computed using Eq. (3):
(3)
The Tukey-Kramer HSD test was conducted to determine the significant differences
between torrefied samples. According to the statistical analysis, the ground stover and whole
stover samples torrefied at 250 °C were not significantly different; however, the samples did
show a significant difference of approximately 6 percentage points at 280 °C (Figure 32).
Energy yields followed a trend opposite to DML. This is probably due to a large change in
DML that could not be offset by the change in HHV of torrefied samples. Gas residence
times did not show any significant effect on the energy yield as revealed by statistical
analysis. This is in accordance with the effect of gas residence time on DML and HHV.
Energy yield (%)= �mtorrefied
mraw
�db
�HHVtorrefied
HHVraw
�db
·100

118
Figure 32. Average energy yield of torrefied ground stover and whole stalk samples (error
bar=standard deviation)
Average energy yields of stalk shell and cob shell were not significantly different at
both 250 and 280 °C (Figure 33). The absence of any difference between these two samples
at 250 °C was caused by a larger HHV of cob shell than stalk shell, which offset the
difference in DML. However, these two samples had energy yields different from stalk pith
samples, regardless of temperature. The energy yield of stalk pith was approximately 6 and
15 percentage points lower than the energy yields of stalk shell and cob shell at 250 and 280
°C, respectively. There was no difference between average energy yields due to gas residence
time, regardless of sample type.

119
Figure 33. Average energy yield of torrefied stalk shell, stalk pith, and cob shell samples
(error bar=standard deviation)
Conclusions
The effects of corn stover particle size and fraction type, as well as gas residence
times on torrefaction were investigated through the analysis of DML, energy yield, and
chemical properties of torrefied biomass. Torrefaction of ground corn stover at 280 °C
induced higher DML than torrefaction of the whole stalk. The whole corn stalk had higher
HHV and energy yield values, probably due to its different fiber composition and less energy
lost through devolatilization. In general, stalk pith and stalk shell had respectively the highest
and the lowest DML, regardless of the torrefaction temperature. Stalk pith and cob shell had
the lowest and the highest HHV, respectively. The energy yield of stalk pith was the lowest
at both 250 and 280 °C. Furthermore, the energy yield of stalk shell was the highest but not
significantly different than cob shell, regardless of temperature. The difference in the

120
behavior of corn stover fractions was the consequence of different physical characteristics
and fiber composition. Gas residence time did not have any significant effect on DML, HHV,
and energy yield.
Acknowledgments
This research project was supported by funding provided by the ConocoPhillips
Company. Additional technical support was provided by the Center for Sustainable Energy
(CSET) and Biocentury Research Farm (BCRF) of Iowa State University, Ames, IA. We
would also like to thank Patrick Johnston for his contribution to this work.
References
1. The Energy Independence and Security Act of 2007, Pub. L. No. 110-40 H.R. 6, 121 Stat.
1492; January 7. 2007.
2. Feng, Y.; Xiao, B.; Goerner, K.; Cheng, G.; Wang, J. Influence of particle size and
temperature on gasification performance in externally heated gasifier. Smart Grid
Renewable Energy 2011, 2, 158-164.
3. Luo, S.; Xiao, B.; Guo, X.; Hu, Z.; Liu, S.; He, M. Hydrogen-rich gas from catalytic
steam gasification of biomass in a fixed bed reactor: Influence of particle size on
gasification performance. Int. J. Hydrogen Energy 2009, 34, 1260-1264.
4. Moghiman, M.; Hashemi, T.; Zahmatkesh, I.; Daghighi, Y. Effects of particle size and
equivalence ratio on cyclone gasification of wood powder. J. Energy Inst. 2007, 80, 29-
34.
5. Shen, J.; Wang, X-S.; Garcia-Perez, M.;Mourant, D.; Rhodes, M. J.; Li, C-Z. Effects of
particle size on the fast pyrolysis of oil mallee woody biomass, Fuel 2009,88, 1810-1817.
6. Gaston, K. R.; Jarvis, M. W.; Pepiot, P.; Smith, K. M.; Frederick, W. J.;Nimlos, M. R.
Biomass Pyrolysis and Gasification of Varying Particle Sizes in a Fluidized-Bed
Reactor.Energ. Fuel 2011; 25, 3747-3757.
121
7. Zhu, W.; Song, W.; Lin, W. Effect of the Coal Particle Size on Pyrolysis and Char
Reactivity for Two Types of Coal and Demineralized Coal, Energ. Fuel 2008, 22, 2482-
2487.
8. Bergman, P. C. A.; Boersma, A. R.; Kiel, J.H.A.; Prins, M. J; Ptasinski, K. J.; Janssen F.
J. J. G. Torrefaction for entrained-flow gasification of biomass, ECN-C-05-067,
ECN:Petten, The Netherlands, 2005.
9. Paulrud, S.; Mattson, J. E.; Nilsson, C. Particle and handling characteristics of wood fuel
powder: effects of different mills. Fuel Process. Technol. 2002, 76, 23-39.
10. Lu, H.; Ip, E.; Scott, J.; Foster, P.; Vickers, M.; Baxter, L. L. Effects of particle shape and
size on devolatilization of biomass particle. Fuel 2010, 89, 1156-1168.
11. Neathery, J. K. Biomass gasification. In Thermochemical conversion of biomass to liquid
fuels and chemicals; Crocker, M., Ed.; Blackwell Publishing Professional: Ames, IA,
USA, 2007; pp.67-94.
12. Antal, M. J.; Gronli, M. The art, science, and technology of charcoal production. Ind.
Eng. Chem. Res. 2003, 42, 1619-1640.
13. Antal, M. J.; Croiset, E.; Dai, X.; DeAlmeida, C.; Shu-lai Mok, W.; Norberg, N. High-
yield biomass charcoal. Energy Fuel. 1996, 10, 652-658.
14. Klass, D. L. Biomass for Renewable Energy, Fuels and Chemicals,Academic Press:San
Diego, CA, 1998.
15. Arias, B.; Pevida, C.; Fermoso, J.; Plaza, M. G.; Rubeira, F.;Pis, J. J. Influence of
torrefaction on the grindability and reactivity of woody biomass. Fuel Process. Technol.
2008, 89, 169-75.
16. Yan, W.; Acharjee, T. C.; Coronella, C. J.;Vaquez, R. V. Thermal Pretreatment of
Lignocellulosic Biomass. Environ. Prog. Sustainable Energy 2009, 28, 435-40.
17. Bergman, P. C. A.; Boersma, A. R.; Zwart, R. W. R.; Kiel, J.H.A. Torrefaction for
Biomass Co-firing in Existing Coal-Fired Power Stations, ECN:Petten, The Netherlands,
2005.
18. BRDI, Roadmap for Bioenergy and Biobased Products in the United States. Biomass
Research and Development Initiative, October 2007.

122
19. Bridgeman, T. G.; Jones, J. M.; Shield, I.; Williams, P.T. Torrefaction of reed canary
grass, wheat straw and willow to enhance solid fuel qualities and combustion properties.
Fuel 2008, 87, 844-56.
20. Medic, D.; Darr, M.; Shah, A.; Potter, B.; Zimmerrnan, J. Effects of torrefaction process
parameters on biomass feedstock upgrading. Fuel 2011, 91, 147-154.
21. Shah A.; Darr, M.; Medic, D.; Anex, R.; Khanal, S.; Maski, D. Techno-economic
analysis of a production-scale torrefaction system for cellulosic biomass upgrading,
Biofuels, Bioprod. Biorefin. 2012, 6, 45-57.
22. Medic D.; Darr, M.; Shah, A.; Rahn. S. Effect of torrefaction on water vapor adsorption
properties and resistance to microbial degradation of corn stover, Enenrgy Fuels,
Available online February 2012. DOI: 10.1021/ef3000449
23. Chen, W-H.; Kuo, P-C. Torrefaction and co-torrefaction characterization of
hemicellulose, cellulose and lignin as well as of some basic constituents in biomass.
Energy 2011, 36, 803-811.
24. Prins, M. J., Ptasinski, K. J.; Janssen, F. J. J.G; Torrefaction of wood. Part 2. Analysis of
products, J. Anal. Appl.Pyrol. 2006; 77:35-40.
25. Ciolkosz D.; Wallace R. A review of torrefaction for bioenergy feedstock production.
Biofuels, Bioprod. Biorefin. 2011, 5, 317-329.
26. Van der Stelt, M. J. C.; Gerhauser, H.; Kiel, J. H.A.; Ptasinski, K. J. Biomass upgrading
by torrefaction for the production of biofuels: A review. Biomass. Bioenerg, 2011, 35,
3748-3762.
27. Chen, W-H.; Kuo, P-C. Torrefaction and co-torrefaction characterization of
hemicellulose, cellulose and lignin as well as of some basic constituents in biomass.
Energy 2011, 36, 803-81
28. Bergman, P. C. A. Combined Torrefaction and Pelletization: The TOP
Process,ECN:Petten,The Netherlands, 2005.
29. Couhert, C.; Salvador, S.; Commandre, J-M. Impact of torrefaction on sygas production
from wood. Fuel 2009, 88, 2286-2290.
30. Prins, M. J.; Ptasinski, K. J.; Janssen, F. J. J.G. Torrefaction of wood. Part 1. Weight Loss
Kinetics, J. Anal. Appl.Pyrol. 2006, 77, 28-34.

123
31. ASAE standard D358.2 (R2008). Moisture Measurement - Forages. American Society of
Agricultural Engineers: St. Joseph, MI, 1998.
32. ASTM D 5142 – 04: Standard Test Method for Proximate Analysis of the Analysis
Sample of Coal and Coke by Instrumental Procedures. ASTM International: West
Conshohocken, PA,2008.
33. ASTM D 5373 – 08: Standard Test Method for Instrumental Determination of Carbon,
Hydrogen and Nitrogen in Laboratory samples of Coal.ASTM International: West
Conshohocken, PA,2008.
34. Sheng, C.; Azevedo, J. L. T. Estimating the higher heating value of biomass fuels from
basic analysis data. Biomass Bioenerg. 2005,28, 499-507.
35. AOAC Standard 973.18. Fiber (Acid Detergent) and Lignin in Animal Feeds;
Association of Official Analytical Chemists: Gaithersburg, MD, USA, 1990.
36. AOAC Standard 2002.04. Gravimetric Determination of Amylase-Treated Neutral
Detergent Fiber in Feeds Using Refluxing in Beaker or Crucibles; Association of Official
Analytical Chamists: Gaithersburg, MD, USA, 2002.
37. Krull, L.H.; Inglett, G. E. Analysis of Neutral Carbohydrate in Agricultural Residues by
Gas-Liquid Chromatography. J. Agric. Food Chem. 1980, 28, 917-919.
38. Garlock, R. J.; Chundawat, S. P.; Balan, V.; Dale, B. E. Optimizing harvest of cont stover
fractions based on overall sugar yields following ammonia fiber expansion pretreatment
and enzymatic hydrolysis. Biotechnol. Biofuels. 2009, 2:art. #29.

124
Chapter 6. General conclusions and future work
During torrefaction corn stover undergoes significant changes in chemical and
physical properties which are responsible for increased energy density, reduced O/C ratio,
improved hydrophobicity, increased resistance to microbial degradation, and increased
grindability, as well as mass and energy losses in the process. It has been found that
temperature has the most significant effect on changes in biomass properties during
torrefaction, followed by initial feedstock moisture content and residence time. However,
high mass loss due to extensive devolatilization at a high temperature offsets the gain in
energy density, and significantly reduced the overall energy yield. Moisture content had a
significant effect on energy density, mass and energy yield, and generally induced a
reduction in each of these parameters. The effect of moisture is more pronounced in the low
torrefaction temperature regime (200-250 ºC) and initial moisture content above about 20%.
One of the most desired changes induced during the torrefaction process is an
increase in brittleness of biomass. That is the reason why the majority of researchers studied
this property and utilized it to determine optimal torrefaction conditions. Hydrophobicity and
resistance to microbial degradation, although very important for transportation and storage of
biomass, have not received the same attention. It has been found in this study that only
samples torrefied above 250 ºC had water sorption properties significantly different from the
raw biomass. This might be due to the elimination of the hydrophilic carbohydrate fraction
and its partial conversion into non-polar, hydrophobic degradation products. Five isotherms
were fitted to the experimental data to obtain the EMC-ERH prediction equations. The
modified Oswin model, followed by the modified Halsey model, showed the best
performances. Samples torrefied above 250 °C had negligible dry matter loss due to

125
microbial degradation when compared to raw biomass and samples torrefied at 200 °C. This
might be predominantly due to higher hydrophobicity and the formation of degradation
products toxic to fungi. Fiber analysis showed a significant decrease in hemicellulose content
and a relative increase in the lignin content of torrefied corn stover.
The effect of biomass’ particle size and purge gas residence time on the final product
characteristics have not been investigated in the torrefaction literature. It has been found in
the current work that torrefaction of ground corn stover at 280 °C induced higher DML than
torrefaction of the whole stalk. Whole corn stalk had higher HHV and energy yield values,
probably due to the different fiber composition and less energy rich species lost through
devolatilization. In general, stalk pith and stalk shell had respectively the highest and the
lowest DML, regardless of the torrefaction temperature. Stalk pith and cob shell had the
lowest and the highest HHV, respectively. The energy yield of stalk pith was the lowest at
both torrefaction temperatures. Furthermore, energy yield of stalk shell was the highest, but
not significantly different than cob shell, regardless of temperature. The difference in the
behavior of corn stover fractions was the consequence of different physical characteristics
and fiber composition. Gas residence time did not have any significant effect on DML, HHV,
and energy yield.
This study provides knowledge about the effect of main reactor parameters
(temperature, solids and volatiles residence time) and feedstock properties (particle size and
initial moisture content) on final product characteristics. Insights on correlation between
process and feedstock parameters, and final product characteristics can help optimization of
torrefaction process parameters in a way that will favor most desired properties, such as
energy density, fixed carbon content, acidity, hemicellulose content, hydrophobicity or

126
resistance to microbial degradation. According to the results of this study, optimum
torrefaction temperature is 250 °C due to modest DML, significant decrease in hemicellulose
content without negatively affecting cellulose content, increase in fixed carbon content and
decrease in acidity of torrefied biomass. Moisture content of corn stover feedstock should be
below 25%wb due to higher DML in at torrefaction temperatures lower than 250 °C.
However, this is not major concern at temperatures higher than 250 °C. Residence time of
solids was not statistically significant factor and can be as short as 10 min. Gas residence
time did not show any significant effect on DML or chemical properties, and can be as long
as 60 sec. Corn stover particle size can be up to 20mm without any negative effect on DML,
HHV or energy yield. Different corn stover components have distinct DML, HHV, energy
yield and elemental composition after torrefaction. Therefore, grinding to particle size of
about 5 mm can cause separation into fractions that yield heterogeneous torrefied product.
In general, the current work can help development and optimization of integrated,
highly autonomous and robust thermochemical biomass upgrading systems to support
sustainable and economic feedstock transportation, storage, and downstream processing.
Future work
In the recent literature, torrefaction has been recognized as a viable pretreatment
option to reduce the cost of transportation, size, and storage of lignocellulosic feedstock. It
has been proposed that torrefaction should be optimized to achieve maximum brittleness of
biomass [1-3]. However, torrefaction also enhances other biomass properties, such as fixed
carbon content, hydrophobicity, acidity, and oxygen-to-carbon ratio that are relevant for co-
firing, pyrolysis, and gasification. Optimizing torrefaction for specific end use of torrefied

127
biomass might deteriorate final product characteristics important for other purposes, as well
as process economy, and decrease profit by narrowing market for the end product. For
example, process optimized to yield high energy density feedstock suitable for co-fining
purpose might not be the best one for producing feedstock for downstream processing in
pyrolysis or gasification. Torrefaction process optimized to increase biomass hydrophobicity
might not be severe enough to significantly increase biomass brittleness. Therefore,
comprehensive torrefaction optimization work should be conducted to select proper operating
conditions that would yield feedstock suitable for not only one, but multiple downstream
processes. Such feedstock would have the best chemical and physical properties, without
sacrificing efficiency and yield of the torrefaction process.
Traditional methods, such as proximate, ultimate, compositional analysis, and
calorimetry, have been routinely applied in research to assess chemical changes in torrefied
biomass [1-4]. Nevertheless, these methods are slow, time consuming, and sometimes
technically demanding. Therefore, rapid methods for process and quality control must be
developed and applied in both research and production systems to enable quick adjustments
to fluctuations in the torrefaction process parameters, feedstock composition, and final
product utilization. Rapid analytical methods for characterization of torrefied and untreated
biomass, such as infra-red (IR) spectroscopy, would enable frequent sampling and
consequently greater flexibility and agility in process and quality control. Thus far, there has
been very limited literature available on the application of IR spectroscopy to torrefied
woody biomass [4], but none on herbaceous torrefied biomass characterization.
Additional resources should be directed toward the development of reactor designs
that would utilize feedstock with as few pretreatment requirements as possible. This is a
128
crucial step for justification of the importance of torrefaction for the economy of
biorenewables production. Potential for volatiles combustion should be experimentally
confirmed. Success of this work would eliminate waste treatment and management issues,
and increase overall process efficiency.
References
1. Bergman P. C., Boersma A. R., Zwart R. W. R., Kiel J. H. A. Combined torrefaction and
pelletisation. The TOP process. ECN-C--05-073, Energy Research Centre of the
Netherlands: Petten, NL, 2005.
2. Bridgeman T.G., Jones, I., Williams, P.T., Waldron D.J. An investigation of the
grindability of two torrefied energy crops. Fuel 2010, 89, 3911-3918.
3. Arias B., Pevida C., Fermoso J., Plaza M.G., Rubiera F., Pis J.J Influence of the
torrefaction on gindability and reactivity of woody biomass. Fuel Process. Technol.
2008, 89, 169-175.
4. Rousset P., Davireux F., Macedo L., Perre P. Characterisation of the torrefaction of beech
wood using NIRS: Combined effects of temperature and duration. Biomass Bioenerg.
2011, 35, 1219-1226.


