P13.197 INVESTIGATIONS OF POLARIMETRIC RADAR SIGNATURES IN WINTER STORMS AND THEIR
RELATION TO AIRCRAFT ICING AND FREEZING RAIN
Alexander Ryzhkov(1,2), Heather Reeves(1,2), Terry Schuur(1,2), Matthew Kumjian(1), and Dusan Zrnic(2)
(1)Cooperative Institute for Mesoscale Meteorological Studies, Norman, Oklahoma (2)National Severe Storms Laboratory, Norman, Oklahoma
1. INTRODUCTION
Winter precipitation events are some of the most challenging phenomena to forecast, even on short time scales. Seemingly subtle differences in the environmental thermodynamic profiles can alter the precipitation type observed at the surface, which can produce anything from a minor nuisance (in the case of frozen ice pellets) to widespread damage (in the case of freezing rain). Until recently, the focus of most efforts in the areas of polarimetric radar applications was primarily on severe warm‐season convective storms producing flash floods, large hail, and tornadoes. The role of dual‐polarization radar measurements in the detection and short‐term forecast of hazardous cold‐season weather events such as icing, freezing rain, and heavy snowfall remains to be explored but holds great promise.
This study presents an overview of numerous polarimetric signatures in winter storms observed with S‐ and C‐ band radars and speculations on their association with different microphysical processes and possible practical utilization. The data in winter storms have been collected in central Oklahoma using a prototype of S‐band polarimetric WSR‐88D radar (KOUN) and C‐band polarimetric OU‐PRIME radar belonging to the University of Oklahoma.
2. PREVIOUS STUDIES
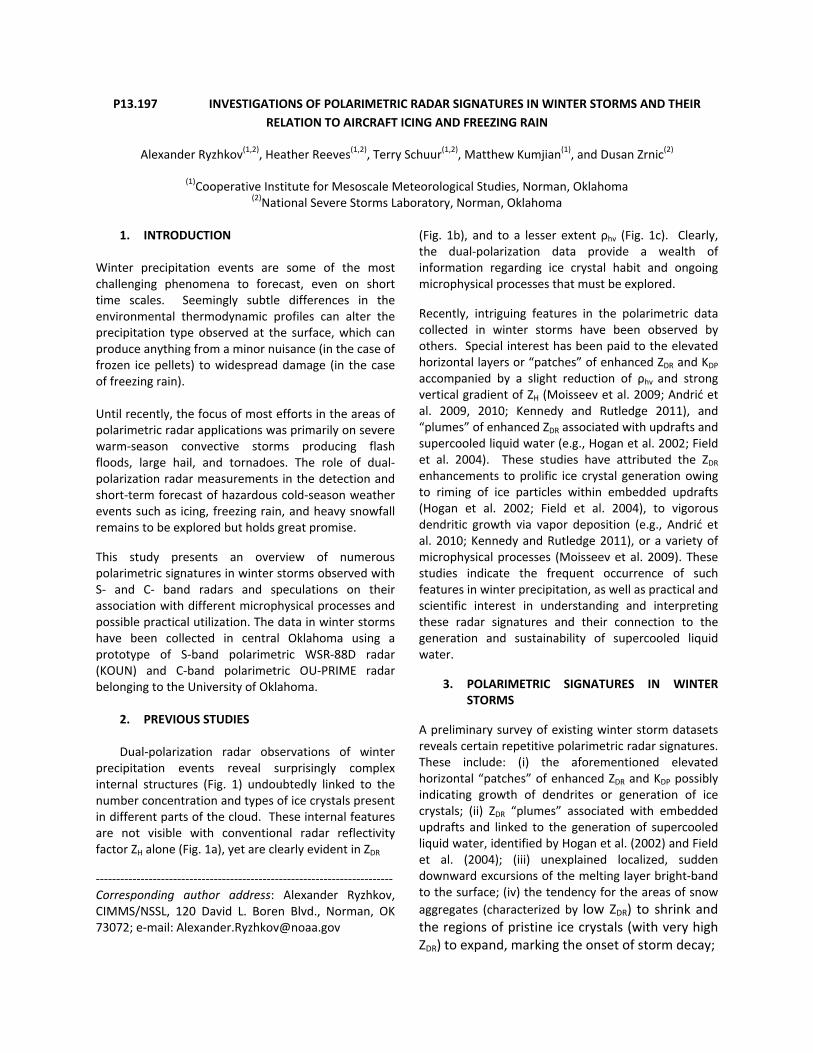
Dual‐polarization radar observations of winter precipitation events reveal surprisingly complex internal structures (Fig. 1) undoubtedly linked to the number concentration and types of ice crystals present in different parts of the cloud. These internal features are not visible with conventional radar reflectivity factor ZH alone (Fig. 1a), yet are clearly evident in ZDR
‐‐‐‐‐‐‐‐‐‐‐‐‐‐‐‐‐‐‐‐‐‐‐‐‐‐‐‐‐‐‐‐‐‐‐‐‐‐‐‐‐‐‐‐‐‐‐‐‐‐‐‐‐‐‐‐‐‐‐‐‐‐‐‐‐‐‐‐‐‐‐‐‐Corresponding author address: Alexander Ryzhkov, CIMMS/NSSL, 120 David L. Boren Blvd., Norman, OK 73072; e‐mail: [email protected]
(Fig. 1b), and to a lesser extent ρhv (Fig. 1c). Clearly, the dual‐polarization data provide a wealth of information regarding ice crystal habit and ongoing microphysical processes that must be explored.
Recently, intriguing features in the polarimetric data collected in winter storms have been observed by others. Special interest has been paid to the elevated horizontal layers or “patches” of enhanced ZDR and KDP accompanied by a slight reduction of ρhv and strong vertical gradient of ZH (Moisseev et al. 2009; Andrić et al. 2009, 2010; Kennedy and Rutledge 2011), and “plumes” of enhanced ZDR associated with updrafts and supercooled liquid water (e.g., Hogan et al. 2002; Field et al. 2004). These studies have attributed the ZDR enhancements to prolific ice crystal generation owing to riming of ice particles within embedded updrafts (Hogan et al. 2002; Field et al. 2004), to vigorous dendritic growth via vapor deposition (e.g., Andrić et al. 2010; Kennedy and Rutledge 2011), or a variety of microphysical processes (Moisseev et al. 2009). These studies indicate the frequent occurrence of such features in winter precipitation, as well as practical and scientific interest in understanding and interpreting these radar signatures and their connection to the generation and sustainability of supercooled liquid water.
3. POLARIMETRIC SIGNATURES IN WINTER STORMS
A preliminary survey of existing winter storm datasets reveals certain repetitive polarimetric radar signatures. These include: (i) the aforementioned elevated horizontal “patches” of enhanced ZDR and KDP possibly indicating growth of dendrites or generation of ice crystals; (ii) ZDR “plumes” associated with embedded updrafts and linked to the generation of supercooled liquid water, identified by Hogan et al. (2002) and Field et al. (2004); (iii) unexplained localized, sudden downward excursions of the melting layer bright‐band to the surface; (iv) the tendency for the areas of snow
aggregates (characterized by low ZDR) to shrink and the regions of pristine ice crystals (with very high ZDR) to expand, marking the onset of storm decay;
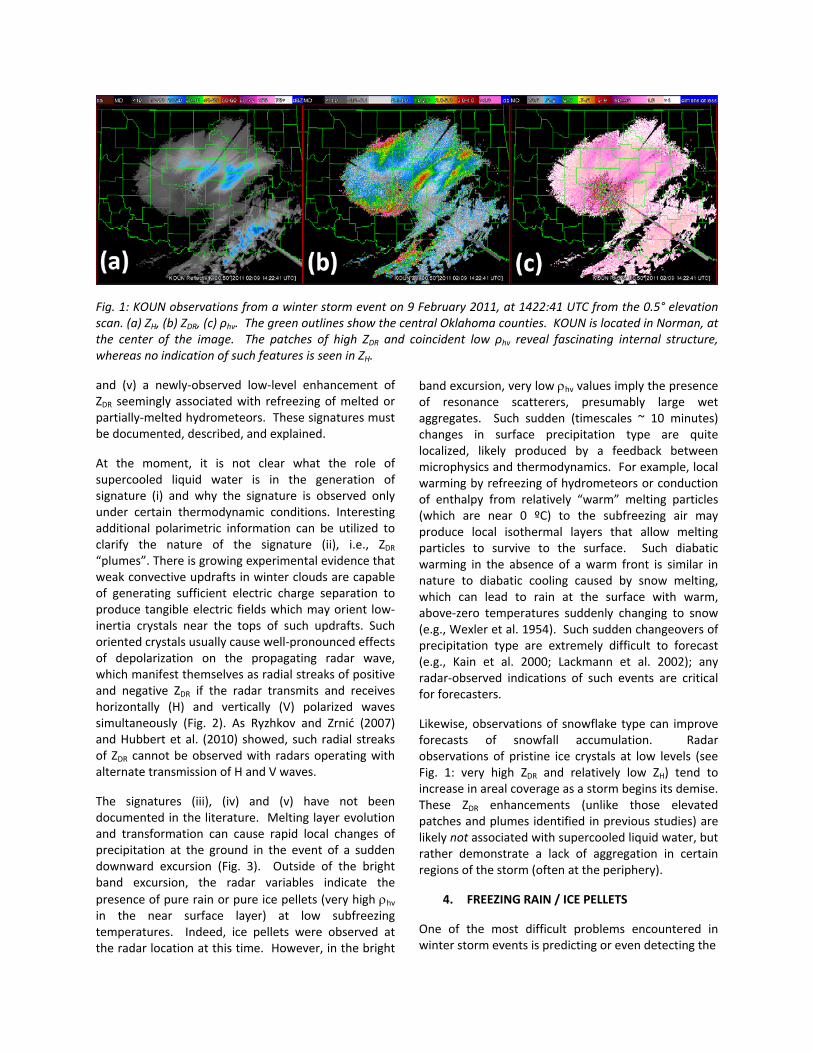
Fig. 1: KOUN observations from a winter storm event on 9 February 2011, at 1422:41 UTC from the 0.5° elevation scan. (a) ZH, (b) ZDR, (c) ρhv. The green outlines show the central Oklahoma counties. KOUN is located in Norman, at the center of the image. The patches of high ZDR and coincident low ρhv reveal fascinating internal structure, whereas no indication of such features is seen in ZH.
and (v) a newly‐observed low‐level enhancement of ZDR seemingly associated with refreezing of melted or partially‐melted hydrometeors. These signatures must be documented, described, and explained.
At the moment, it is not clear what the role of supercooled liquid water is in the generation of signature (i) and why the signature is observed only under certain thermodynamic conditions. Interesting additional polarimetric information can be utilized to clarify the nature of the signature (ii), i.e., ZDR “plumes”. There is growing experimental evidence that weak convective updrafts in winter clouds are capable of generating sufficient electric charge separation to produce tangible electric fields which may orient low‐inertia crystals near the tops of such updrafts. Such oriented crystals usually cause well‐pronounced effects of depolarization on the propagating radar wave, which manifest themselves as radial streaks of positive and negative ZDR if the radar transmits and receives horizontally (H) and vertically (V) polarized waves simultaneously (Fig. 2). As Ryzhkov and Zrnić (2007) and Hubbert et al. (2010) showed, such radial streaks of ZDR cannot be observed with radars operating with alternate transmission of H and V waves.
The signatures (iii), (iv) and (v) have not been documented in the literature. Melting layer evolution and transformation can cause rapid local changes of precipitation at the ground in the event of a sudden downward excursion (Fig. 3). Outside of the bright band excursion, the radar variables indicate the
presence of pure rain or pure ice pellets (very high hv in the near surface layer) at low subfreezing temperatures. Indeed, ice pellets were observed at the radar location at this time. However, in the bright
band excursion, very low hv values imply the presence of resonance scatterers, presumably large wet aggregates. Such sudden (timescales ~ 10 minutes) changes in surface precipitation type are quite localized, likely produced by a feedback between microphysics and thermodynamics. For example, local warming by refreezing of hydrometeors or conduction of enthalpy from relatively “warm” melting particles (which are near 0 ºC) to the subfreezing air may produce local isothermal layers that allow melting particles to survive to the surface. Such diabatic warming in the absence of a warm front is similar in nature to diabatic cooling caused by snow melting, which can lead to rain at the surface with warm, above‐zero temperatures suddenly changing to snow (e.g., Wexler et al. 1954). Such sudden changeovers of precipitation type are extremely difficult to forecast (e.g., Kain et al. 2000; Lackmann et al. 2002); any radar‐observed indications of such events are critical for forecasters.
Likewise, observations of snowflake type can improve forecasts of snowfall accumulation. Radar observations of pristine ice crystals at low levels (see Fig. 1: very high ZDR and relatively low ZH) tend to increase in areal coverage as a storm begins its demise. These ZDR enhancements (unlike those elevated patches and plumes identified in previous studies) are likely not associated with supercooled liquid water, but rather demonstrate a lack of aggregation in certain regions of the storm (often at the periphery).
4. FREEZING RAIN / ICE PELLETS
One of the most difficult problems encountered in winter storm events is predicting or even detecting the
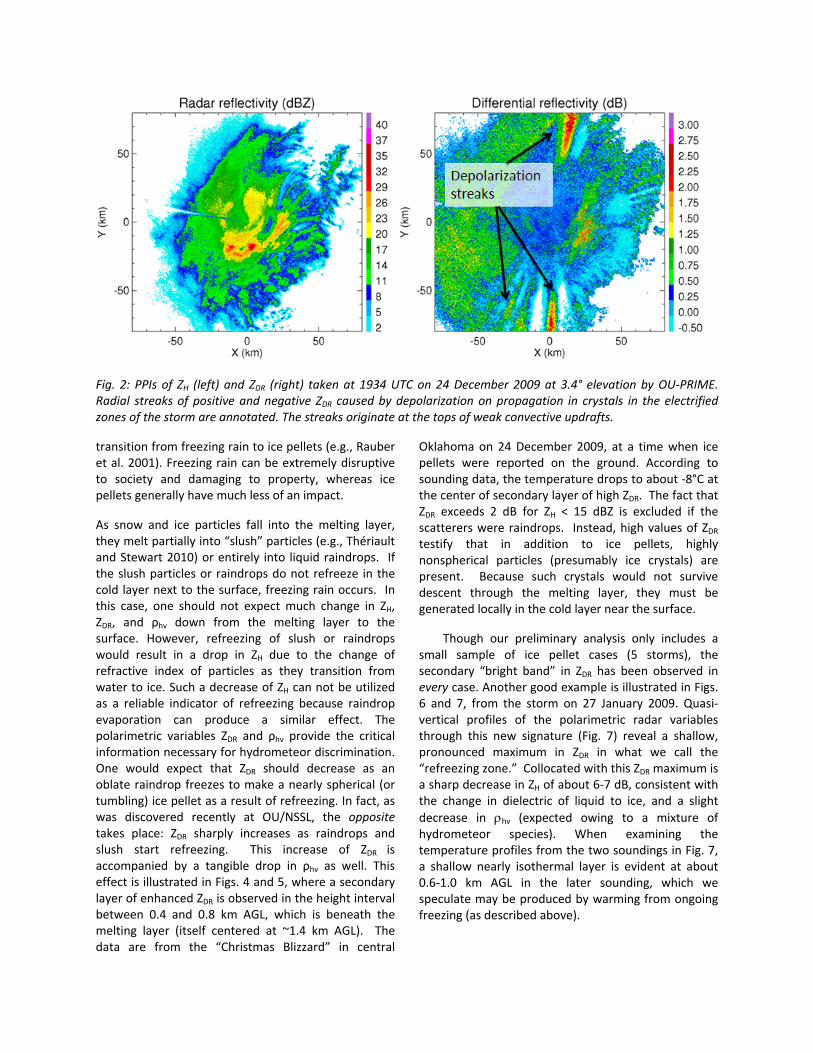
Fig. 2: PPIs of ZH (left) and ZDR (right) taken at 1934 UTC on 24 December 2009 at 3.4° elevation by OU‐PRIME. Radial streaks of positive and negative ZDR caused by depolarization on propagation in crystals in the electrified zones of the storm are annotated. The streaks originate at the tops of weak convective updrafts.
transition from freezing rain to ice pellets (e.g., Rauber et al. 2001). Freezing rain can be extremely disruptive to society and damaging to property, whereas ice pellets generally have much less of an impact.
As snow and ice particles fall into the melting layer, they melt partially into “slush” particles (e.g., Thériault and Stewart 2010) or entirely into liquid raindrops. If the slush particles or raindrops do not refreeze in the cold layer next to the surface, freezing rain occurs. In this case, one should not expect much change in ZH, ZDR, and ρhv down from the melting layer to the surface. However, refreezing of slush or raindrops would result in a drop in ZH due to the change of refractive index of particles as they transition from water to ice. Such a decrease of ZH can not be utilized as a reliable indicator of refreezing because raindrop evaporation can produce a similar effect. The polarimetric variables ZDR and ρhv provide the critical information necessary for hydrometeor discrimination. One would expect that ZDR should decrease as an oblate raindrop freezes to make a nearly spherical (or tumbling) ice pellet as a result of refreezing. In fact, as was discovered recently at OU/NSSL, the opposite takes place: ZDR sharply increases as raindrops and slush start refreezing. This increase of ZDR is accompanied by a tangible drop in ρhv as well. This effect is illustrated in Figs. 4 and 5, where a secondary layer of enhanced ZDR is observed in the height interval between 0.4 and 0.8 km AGL, which is beneath the melting layer (itself centered at ~1.4 km AGL). The data are from the “Christmas Blizzard” in central
Oklahoma on 24 December 2009, at a time when ice pellets were reported on the ground. According to sounding data, the temperature drops to about ‐8°C at the center of secondary layer of high ZDR. The fact that ZDR exceeds 2 dB for ZH < 15 dBZ is excluded if the scatterers were raindrops. Instead, high values of ZDR testify that in addition to ice pellets, highly nonspherical particles (presumably ice crystals) are present. Because such crystals would not survive descent through the melting layer, they must be generated locally in the cold layer near the surface.
Though our preliminary analysis only includes a small sample of ice pellet cases (5 storms), the secondary “bright band” in ZDR has been observed in every case. Another good example is illustrated in Figs. 6 and 7, from the storm on 27 January 2009. Quasi‐vertical profiles of the polarimetric radar variables through this new signature (Fig. 7) reveal a shallow, pronounced maximum in ZDR in what we call the “refreezing zone.” Collocated with this ZDR maximum is a sharp decrease in ZH of about 6‐7 dB, consistent with the change in dielectric of liquid to ice, and a slight
decrease in hv (expected owing to a mixture of hydrometeor species). When examining the temperature profiles from the two soundings in Fig. 7, a shallow nearly isothermal layer is evident at about 0.6‐1.0 km AGL in the later sounding, which we speculate may be produced by warming from ongoing freezing (as described above).
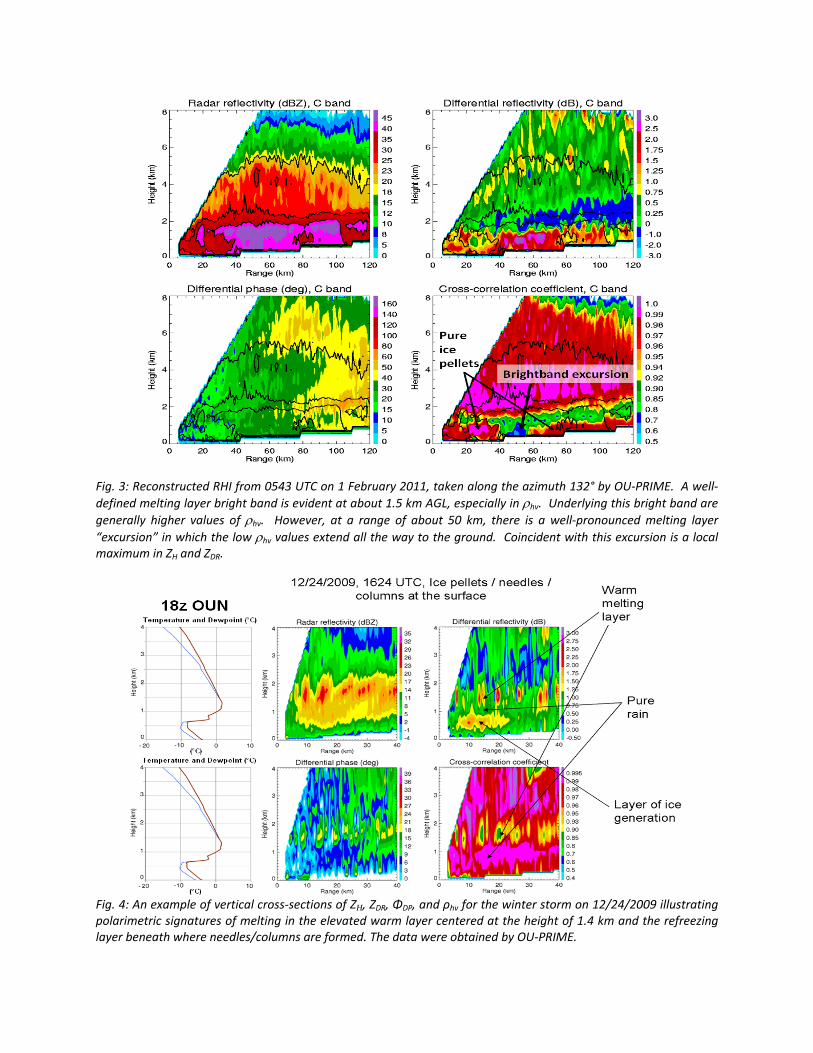
Fig. 3: Reconstructed RHI from 0543 UTC on 1 February 2011, taken along the azimuth 132° by OU‐PRIME. A well‐
defined melting layer bright band is evident at about 1.5 km AGL, especially in hv. Underlying this bright band are
generally higher values of hv. However, at a range of about 50 km, there is a well‐pronounced melting layer
“excursion” in which the low hv values extend all the way to the ground. Coincident with this excursion is a local maximum in ZH and ZDR.
Fig. 4: An example of vertical cross‐sections of ZH, ZDR, ΦDP, and ρhv for the winter storm on 12/24/2009 illustrating polarimetric signatures of melting in the elevated warm layer centered at the height of 1.4 km and the refreezing layer beneath where needles/columns are formed. The data were obtained by OU‐PRIME.
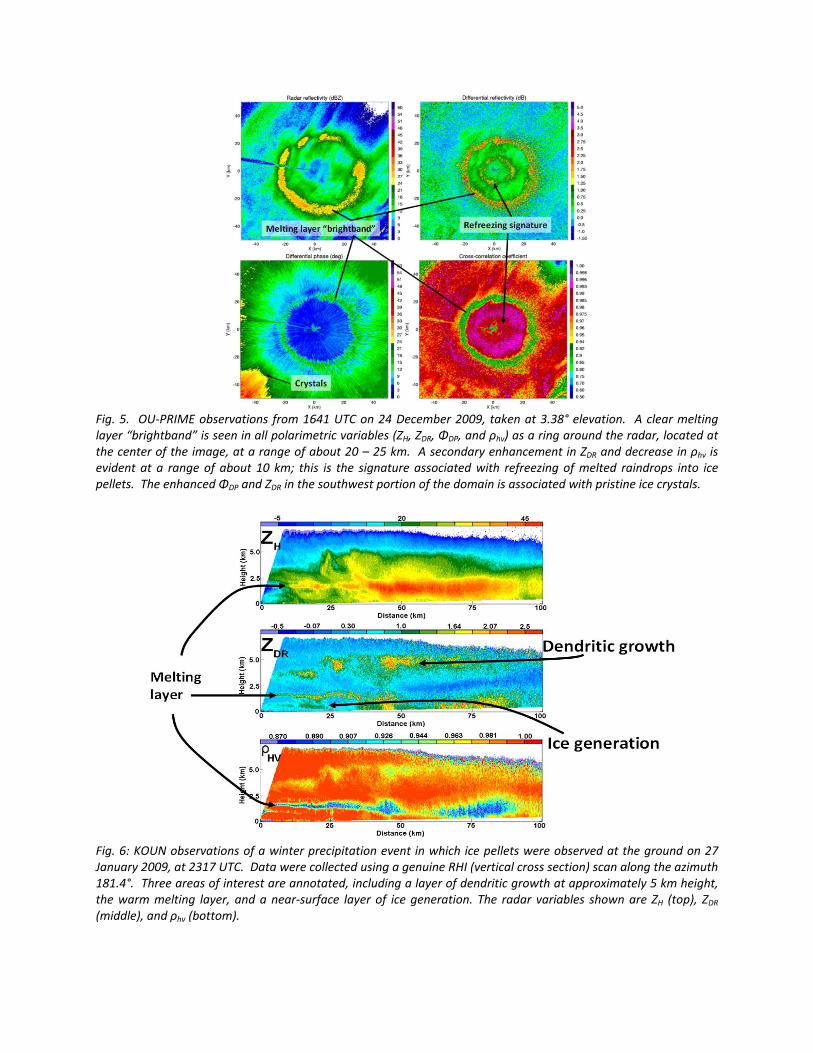
Fig. 5. OU‐PRIME observations from 1641 UTC on 24 December 2009, taken at 3.38° elevation. A clear melting layer “brightband” is seen in all polarimetric variables (ZH, ZDR, ΦDP, and ρhv) as a ring around the radar, located at the center of the image, at a range of about 20 – 25 km. A secondary enhancement in ZDR and decrease in ρhv is evident at a range of about 10 km; this is the signature associated with refreezing of melted raindrops into ice pellets. The enhanced ΦDP and ZDR in the southwest portion of the domain is associated with pristine ice crystals.
Fig. 6: KOUN observations of a winter precipitation event in which ice pellets were observed at the ground on 27 January 2009, at 2317 UTC. Data were collected using a genuine RHI (vertical cross section) scan along the azimuth 181.4°. Three areas of interest are annotated, including a layer of dendritic growth at approximately 5 km height, the warm melting layer, and a near‐surface layer of ice generation. The radar variables shown are ZH (top), ZDR (middle), and ρhv (bottom).

Fig. 7: Vertical profiles of temperature and dewpoint temperature (top left panel; solid and dashed lines, respectively) observed from the 1200 UTC (black lines) and 0000 UTC (gray lines) soundings on 27‐28 January 2009. The remaining three panels show median quasi‐vertical profiles of the radar variables (over all 720 azimuths) reconstructed from the 3.3°‐elevation scans from KOUN at 1934 UTC (blue), 1945 UTC (green), 1955 UTC (red), and 2005 UTC (cyan). The radar variables shown are ZDR (top right), ZH (bottom left), and ρhv (bottom right).
5. CONCLUSIONS A number of interesting repetitive polarimetric signatures has been observed in winter storms at two different radar wavelengths. The origin and nature of these signatures is not fully understood at the moment but it is likely that they may have important practical applications. The enhancement of ZDR associated with possible refreezing of supercooled raindrops at subfreezing temperatures below the melting layer may be possibly utilized for radar detection of freezing rain and its transition to ice pellets / sleet. Greatest challenge is to understand the role of supercooled water (invisible to the radar) in microphysical processes leading to generation of the well pronounced and detectable polarimetric radar signatures.
REFERENCES Andrić, J., D.S. Zrnić, and V.M. Melnikov, 2009: Two‐layer patterns of enhanced ZDR in clouds. Extended Abstracts, 34th Conf. on Radar Meteorology, Williamsburg, VA, Amer. Meteor. Soc., P2.12. [Available online at http://ams.confex.com/ams/pdfpapers/155481.pdf].
Andrić, J., D.S. Zrnić, J.M. Straka, and V.M. Melnikov, 2010: The enhanced ZDR signature in stratiform clouds above melting layer. Extended Abstracts, 13th Conf. on Cloud Physics, Amer. Meteor. Soc., Portland, Oregon, P2.89. [available in the online archive of the AMS].
Field, P., R. Hogan, P. Brown, A. Illingworth, T. Choularton, P. Kaye, E. Hirst, and R. Greenway, 2004: Simultaneous radar and aircraft observations of mixed‐phase cloud at the 100 m scale. Quart. J. Roy. Meteor. Soc., 139, 1877‐1904.
−15 −10 −5 0 5 100
500
1000
1500
2000
2500
3000
T, Td (°C)
Hei
ght (
m A
GL)
0 0.5 1 1.50
500
1000
1500
2000
2500
3000
ZDR
(dB)
Hei
ght (
m A
GL)
20 25 30 350
500
1000
1500
2000
2500
3000
ZH
(dBZ)
Hei
ght (
m A
GL)
0.95 0.96 0.97 0.98 0.99 10
500
1000
1500
2000
2500
3000
ρhv
Hei
ght (
m A
GL)
1934z1945z1955z2005z
1934z1945z1955z2005z
1934z1945z1955z2005z
12z Td
12z T00z T
d
00z TBrightband
Bright bandBright band
Refreezing zone
Refreezing zone Refreezing zone
Pure rain
Pure rainPure rain
Warming?
Hogan, R., P. Field, A. Illingworth, R. Cotton, and T. Choularton, 2002: Properties of embedded convection in warm‐frontal mixed‐phase cloud from aircraft and polarimetric radar. Quart. J. Roy. Met. Soc., 128, 451‐476.
Hubbert, J.C., S.M. Ellis, M. Dixon, and G. Meymaris, 2010: Modeling, error analysis, and evaluation of dual‐polarization variables obtained from simultaneous horizontal and vertical polarization transmit radar. Part II: Experimental data. J. Atmos. Oceanic Technol., 27, 1599‐1607.
Kain, J.S., S.M. Goss, and M.E. Baldwin, 2000: The melting effect as a factor in precipitation‐type forecasting. Wea. And Forecasting, 15, 700‐714.
Kennedy, P.C., and S.A. Rutledge, 2011: S‐band dual‐polarization radar observations of winter storms. J. Appl. Meteor. Clim., 50, 844‐858.
Lackmann, G.M., K. Keeter, L.G. Lee, and M.B. Ek, 2002: Model representation of freezing and melting precipitation: Implications for winter weather forecasting. Wea. And Forecasting, 17, 1016‐1033.
Moisseev, D., E. Saltikoff, and M. Leskinen, 2009: Dual‐polarization weather radar observations of snow growth processes. 34th Conference on Radar Meteorology. Williamsburg, VA, Amer. Meteor. Soc., 13B.2. Available online at [http://ams.confex.com/ams/pdfpapers/156123.pdf].
Rauber, R.M., L.S. Olthoff, M.K. Ramamurthy, and K.E. Kunkel, 2001: Further investigation of a physically‐based, nondimensional parameter for discriminating between locations of freezing rain and ice pellets. Wea. Forecasting, 16, 185‐191.
Ryzhkov, A.V. and D.S. Zrnić, 2007: Depolarization in ice crystals and its effect on radar polarimetric measurements. J. Atmos. Oceanic Technol., 24, 1256‐1267.
Thériault, J.M. and R.E. Stewart, 2010: A parameterization of the microphysical processes forming many types of winter precipitation. J. Atmos. Sci., 67, 1492‐1508.
Wexler, R., R.J. Reed, and J. Honig, 1954: Atmospheric cooling by melting snow. Bull. Amer. Meteor. Soc., 35, 48‐51.


