Investing in U.S. Commercial Real Estate Debt Products

WHO WE ARE
CRE Finance Council (CREFC) is the global trade association for over 300 companies and 8,000 individuals throughout the $3.5 trillion commercial real estate finance industry. It is the only trade association exclusively devoted to CRE finance. Our mission is to promote liquidity and strong capital markets globally through industry best practices and standards, policy advocacy, education, marketplace information and professional connectivity.
CREFC Members include all of the leading portfolio, multifamily, and commercial mortgage-backed securities (“CMBS”) lenders; issuers of CMBS including banks, insurance companies, Government Sponsored Enterprises (GSEs), and private equity funds; loan and bond investors such as insurance companies, pension funds, specialty finance companies, Real Estate Investment Trusts (“REITs”), and money managers; servicers; rating agencies; accounting firms; law firms; and other service providers.
CREFC is the voice of the commercial real estate finance industry and the platform for promoting capital formation and encouraging commercial real estate finance market efficiency, transparency and liquidity. Our industry plays a critical role in the financing of office buildings, industrial complexes, multifamily housing, shopping centers, hotels, and other types of commercial real estate.
WHAT WE OFFER
Industry Connectivity CRE Finance Council provides high-quality connectivity with decision makers from leading commercial real estate finance companies around the world including networking at the highest level for industry leaders and for aspiring professionals.
Conferences & Seminars CREFC hosts two major industry conferences each year (January and June) that are the meeting place for leading industry participants representing every market sector. We also host frequent regional conferences and After-Work Seminars in locations around the country that cover the breadth of commercial real estate finance issues including best practices, transactions and trends.
Industry Sector Specific Forums CREFC offers our Members the opportunity to participate in one or more sector-specific Forums. These Forums provide Members with the platform to address specific issues and needs unique to participants in the various sectors of the industry such as investors, lenders, issuers and servicers.

Government Relations & Advocacy As the recognized leading voice of commercial real estate finance, CREFC is the primary advocate for federal policies affecting our industry. We continually educate lawmakers and regulators about the commercial real estate finance industry and its importance to the overall economy. This allows us to effectively advocate policies that promote the ongoing strength and liquidity of the markets.
Industry Standards & Best Practices CREFC facilitates the development of best practices and industry standards that enable the commercial real estate finance market’s efficiency, transparency and liquidity worldwide. We educate lenders, investors, servicers, rating agencies, borrowers, and other market participants on the benefits derived from such standards and practices.
Global InitiativesCREFC is global with trade association affiliates in Europe, Japan and Canada. We provide conference programming about the U.S. markets to investors and industry professionals across the globe.
Member Communications – Magazine & Industry News CRE Finance World® is the industry’s premier magazine, available to our Members. Written by leading participants incommercial real estate finance, CRE Finance World is considered the best source available for the market. The magazine complements other ongoing Member communications provided on a daily and weekly basis.
Research & Surveys CREFC offers research and insightful information developed by our Members. We also conduct periodic surveys that provide specific sectors of the industry with performance benchmarking and trend analysis.
Education & Young Professional ProgramsCREFC provides quality and innovative educational content, programming and collaboration to the commercial real estate finance industry. Through live programming, video replays and webinars, we offer case studies, panel discussions and workshops that address the most relevant industry topics. We also host mentor/mentee events to counsel and connect young professionals within the industry.
JAPAN
CRE Finance Council-Japan Ochanomizu Motomachi Bldg.2-3-7 Hongo, Bunkyo-kuTokyo 113-0033 Japan
CRE Finance Council Europe46 New Broad StreetLondon EC2M 1JHUnited Kingdom
CRE Finance Council900 7th Street, NW, Suite 501Washington, DC 20001
28 West 44th Street, Suite 1205 New York, NY 10036
www.crefc.org
CRE Finance Council Canada88 Queens Quay W Toronto, ON M5JOB8
CANADA

Co
mm
erc
ial M
orta
ge
sS
ub
ord
ina
ted
De
bt
CM
BS

U.S. Subordinated Debt

U.S. Subordinated Debt
I. Description of U.S. Subordinated Debt and Market Overview A. What is Subordinated Real Estate Debt
i. Description and Illustrative Examplesii. Benefit to Investors (Why the Market Exists)
B. How is Subordinated Debt Structured (Types of Investment)i. Subordinated “B” Notes ii. Mezzanine Loansiii. Preferred Equity
C. Risks Associated with Subordinated Debt
II. Investment Opportunity in U.S. Subordinated Debt A. Spectrum of Risk and Available Yields B. Flow of Capital Into the Sector and Pricing TrendsC. Why the Strategy May Be Appealing to Investors
Table of Contents

Commercial real estate loans that are subordinated in interest and rights to more senior debt positions.
Subordinated debt can be structured in various forms, the most common are the following:
• Subordinated B Notes• Mezzanine Debt• Preferred Equity
Annual volume of subordinated real estate debt origination in the U.S. is estimated at $12-$20 billion (consensus of the panel members)
Subordinated debt investors include: Pension Funds, Insurance Companies, Mortgage REITs, Sovereign Wealth Funds, plus Endowments, Foundations, and Other Investors, primarily through Funds
Subordinated debt exists as the result of leverage constraints of traditional lending sources (Banks, Insurance Companies, CMBS Conduit Lenders) and the capital needs of borrowers
SponsorEquity
Subordinated Debt
Senior Mortgage
50-65% LTV
65-80% LTV
100% LTV
Borrowers desiring higher leverage are implementing either: “De-Leveraging” or “Up-Leveraging” Strategies
What is Subordinated Real Estate Debt?

60% LTV SeniorMortgage
4.0% InterestRate
PropertyAcquired at a
5.5% Cap Rate
40% Equity
(Levered Equity Return of 9.0%)
Normal Capitalization
60% LTV Senior Mortgage
4.0% InterestRate
Property Acquired at a 5.5% Cap Rate
30% EquityLevered Equity Return of 9.3%
Capital Stack with Subordinated Debt
Subordinated Debt Up to 70% LTV at 8%
Interest Rate
Higher Leverage Amount
Enhances a Property Owner’s Return
Use of Subordinated Debt Increases the Borrower’s Levered Return from 9.0% to 9.3% WhileRequiring Less Equity Investment
Note: There is no guarantee that investors will achieve the returns outlined above. Example is only illustrative and not associated with aspecific investment.
Example of “Up-Leveraging” Strategy
Example of “Up-Leveraging” Strategy by a Borrower

$70,000,000 Debt(70% LTV)
$30,000,000 Equity
Original Capitalization
$70,0000,000 Debt
Outstanding(93% LTV)
$5,000,000 Original Equity Remaining
Debt Maturity
$48,750,000 Take-Out Debt
(65% LTV)
$10,000,000New Equity
Recapitalization
$11,250,000 “Capital Gap”
(80% LTV)
Property Value
Declines 25% in the
“Great Recession” and Has Yet to Recover
$75,000,000 Property Value
at Loan Maturity
Need for Subordinate Debt to address “Capital Gap” in the debt stack
$5,000,000 Original Equity
$75,000,000 Value at Loan
Maturity Resulting in a
93% current LTV
Combined 80% Last Dollar LTV Including New First Mortgage
and Subordinate Debt Loan
Loan Acquired in 2006-2007 Time Frame2016 (Today)
Example of “De-Leveraging” Strategy
Example of “De-Leveraging” Strategy by a Borrower
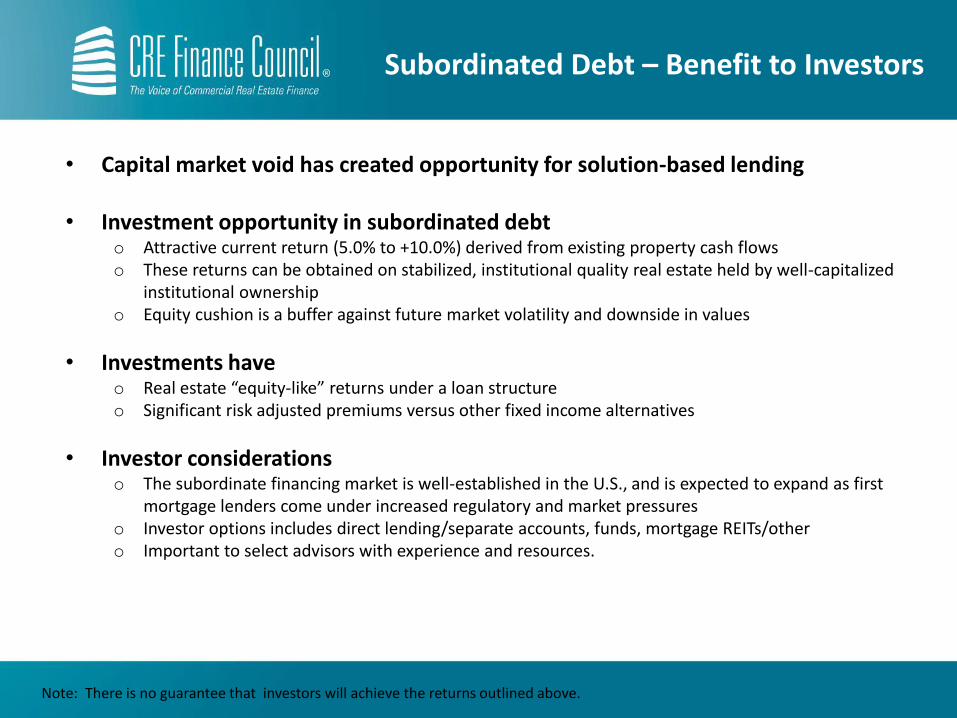
• Capital market void has created opportunity for solution-based lending
• Investment opportunity in subordinated debto Attractive current return (5.0% to +10.0%) derived from existing property cash flows o These returns can be obtained on stabilized, institutional quality real estate held by well-capitalized
institutional ownership o Equity cushion is a buffer against future market volatility and downside in values
• Investments haveo Real estate “equity-like” returns under a loan structureo Significant risk adjusted premiums versus other fixed income alternatives
• Investor considerationso The subordinate financing market is well-established in the U.S., and is expected to expand as first
mortgage lenders come under increased regulatory and market pressureso Investor options includes direct lending/separate accounts, funds, mortgage REITs/othero Important to select advisors with experience and resources.
Note: There is no guarantee that investors will achieve the returns outlined above.
Subordinated Debt – Benefit to Investors

• Subordinated “B” Notes o Notes or participation interests in first mortgage loans secured by underlying propertyo Payment priority and lender rights are subordinated to those of any senior note holdero Mortgage foreclosure process is a well established path in the United States
• Mezzanine Financingo Portion of the capital stack between secured mortgage loans and owner equityo Secured by pledge of 100% of ownership interests o Offers expeditious foreclosure process in the event of a default
o Payment priority and lender rights are subordinated to those of any senior note holder
• Preferred Equityo Investment is made as preferred contributions with transaction specific terms and conditions
between the property owner and preferred equity investors o Granted a preferred return which is paid after all debt payments are satisfied, but prior to
distributions to common equity o Preferred equity investor protections and remedies are comparable to those of a mezzanine
lender
Types of Subordinated Debt

Advantages and Disadvantages of Each Form of Subordinated Debt
Mezzanine Loans
Main AdvantagePotential for lender to execute an expedited foreclosure of pledged ownership interests and gain full control of an asset from a borrower (provided a Senior Mortgage Lender is either acceptably cured or fully repaid).
Main DisadvantageIf not acceptably cured or repaid, the Senior Mortgage Lender can execute a foreclosure and terminate the mezzanine lender’s interests.
Subordinated “B” Notes
Main AdvantageSubordinated debt position is typically secured by the same mortgage that secures the senior “A” note. B Note is generally not terminated through foreclosure and can often participate in liquidation proceeds after more senior positions have received payments in full.
Main Disadvantage Foreclosing on the mortgage loan documentation will often require more time than for a mezzanine loan (timing is dependent upon the State where the asset is located). Holder of the B Note generally does not have the right to independently exercise remedies.
Preferred Equity
Main AdvantagePreferred equity commonly receivesa premium in pricing relative to mezzanine loans and B note financing structures. Potential for the lender to rapidly step into a control position over the common equity after certain events have occurred.
Main Disadvantage Foreclosure by any secured debt tranches will terminate the preferred equity interests. Also, failure to receive the preferred return is not a loan default since there is no loan; however, the preferred equity investor typically have certain rights such as “change of control” triggers comparable to mezzanine loan events of default.
Note: For all the investment structures above, inter-creditor agreements negotiated between lenders within the capital stack or documentation with the borrower can enhance or negatively impact the rights of a subordinated debt lender. Due to the complex nature of the issues, investors are encouraged to seek the assistance of Legal Counsel. These materials are for informational purposes only, and do not constitute legal advice.
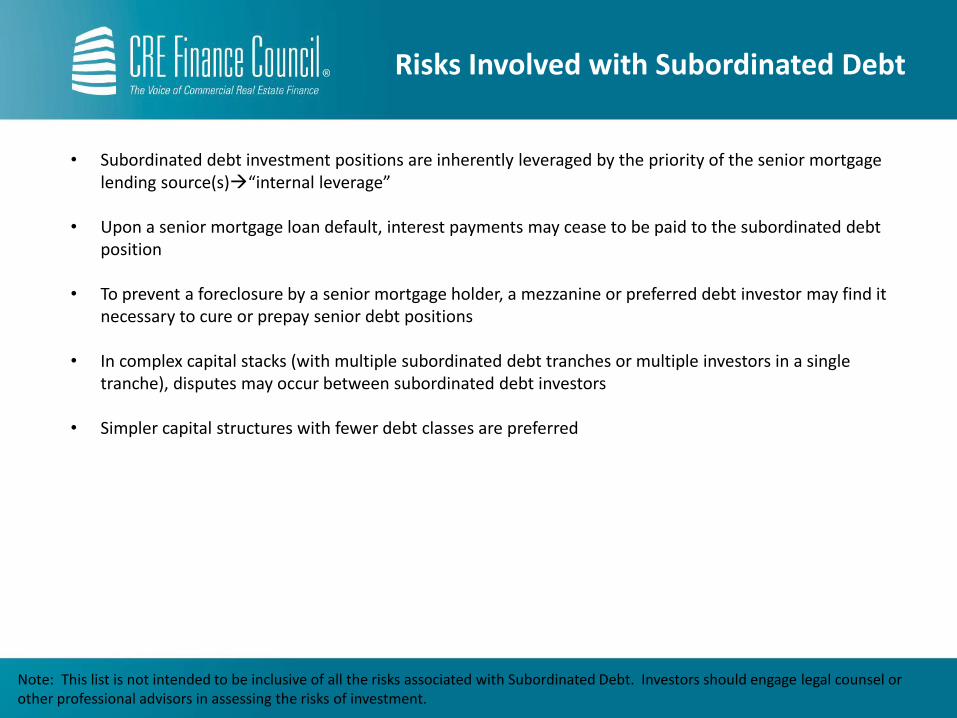
• Subordinated debt investment positions are inherently leveraged by the priority of the senior mortgage lending source(s)“internal leverage”
• Upon a senior mortgage loan default, interest payments may cease to be paid to the subordinated debt position
• To prevent a foreclosure by a senior mortgage holder, a mezzanine or preferred debt investor may find it necessary to cure or prepay senior debt positions
• In complex capital stacks (with multiple subordinated debt tranches or multiple investors in a single tranche), disputes may occur between subordinated debt investors
• Simpler capital structures with fewer debt classes are preferred
Note: This list is not intended to be inclusive of all the risks associated with Subordinated Debt. Investors should engage legal counsel orother professional advisors in assessing the risks of investment.
Risks Involved with Subordinated Debt
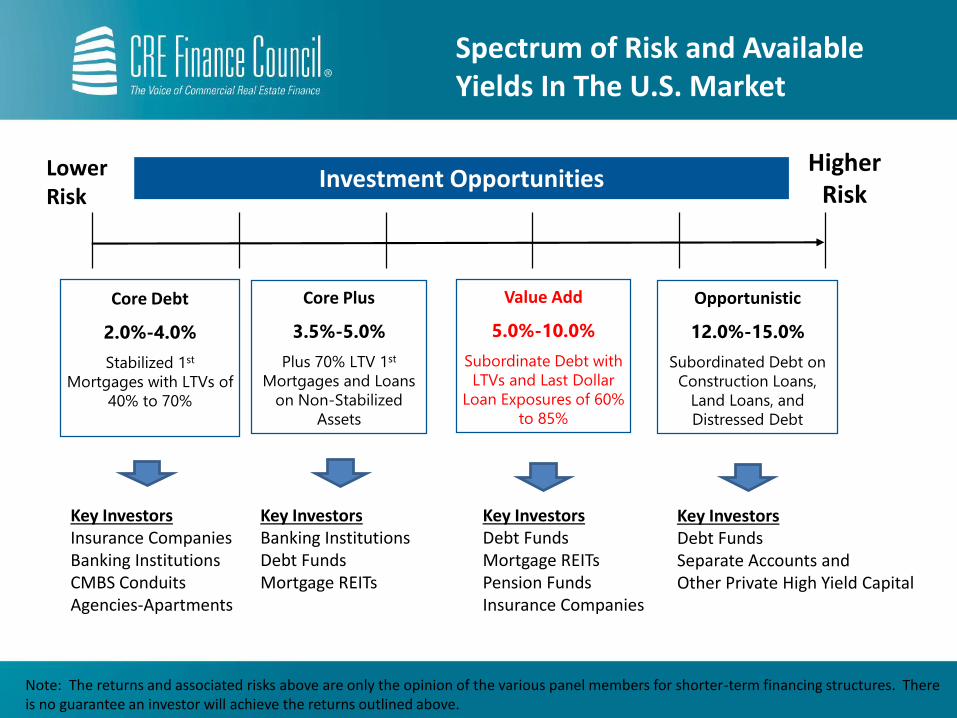
Core Debt
2.0%-4.0%
Stabilized 1st
Mortgages with LTVs of
40% to 70%
Core Plus
3.5%-5.0%
Plus 70% LTV 1st
Mortgages and Loans
on Non-Stabilized
Assets
Value Add
5.0%-10.0%
Subordinate Debt with
LTVs and Last Dollar
Loan Exposures of 60%
to 85%
Opportunistic
12.0%-15.0%
Subordinated Debt on
Construction Loans,
Land Loans, and
Distressed Debt
Higher Risk
Investment Opportunities
Key InvestorsInsurance CompaniesBanking InstitutionsCMBS ConduitsAgencies-Apartments
Key InvestorsBanking InstitutionsDebt Funds Mortgage REITs
LowerRisk
Key InvestorsDebt FundsMortgage REITsPension FundsInsurance Companies
Key InvestorsDebt Funds Separate Accounts and Other Private High Yield Capital
Note: The returns and associated risks above are only the opinion of the various panel members for shorter-term financing structures. There is no guarantee an investor will achieve the returns outlined above.
Spectrum of Risk and Available Yields In The U.S. Market

Low Leverage Sub Debt
5.0%-6.5%
Last Dollar Exposures
of 50% to 65% LTV
Most Often B Note or
Mezzanine/Senior
Mezzanine in Structure
Limited Market of
Opportunities As Fist
Mortgage Leverage
Levels Have Increased
Moderate Leverage Sub Debt
6.0%-9.0%
Last Dollar Exposures
of 65% to 80% LTV
Most Often B Note or
Mezzanine/Junior
Mezzanine in Structure
Higher Leverage Sub Debt
7.0%-11.0%
Last Dollar Exposures of
80% to 85% LTV
Most Often Mezzanine,
Junior Mezzanine or
Preferred Equity in
Structure
Highest Leverage Sub Debt
+11%
Last Dollar Exposures
Over 85% LTV
Most Often Preferred
Equity in Structure and
High Risk in Nature
Higher Risk
Investment OpportunitiesLowerRisk
Note: The returns and associated risks above are only the opinion of the various panel members for shorter-term financing structures. There is no guarantee an investor will achieve the returns outlined above.
[Subordinated Debt on Less Than Stabilized Assets May Offer Higher Yields]
Spectrum of Risk and Available Yields For Subordinated Debt

Panel Member Discussion of Market (Trends and Future Sector Outlook)
*floating-rate finance has historically been the biggest source of subordinate debt financing opportunities
Trends in The U.S. Subordinated Debt Market
Demand for subordinate debt is expected to grow in 2016 and into the future:
• U.S. Banking Sector — portfolios and lending activities under increased regulatory scrutiny; banks will be pressured to lower LTVs and reduce portfolios
• CMBS – floating-rate CMBS* is a structurally inefficient product for securitization and is becoming harder for Wall Street due to increased volatility in the floating-rate securities markets

Panel Member Discussion of Market (Trends and Future Sector Outlook)
Supply and Demand for U.S. Subordinated Debt Product
Are “financing gaps” in the U.S. real estate capital markets set to increase again?
• How large could the market need become?
• Views on new inflows into high yield real estate debt investment strategies?
• Future direction of spreads and investment yields?
• Where are the best risk adjusted return opportunities today?
• How will these strategies perform in a recession?
• Recent changes in panel member approach to the market or investment strategies?

Why the Strategy May Appeal to Investors
• An opportunity to invest in the highly transparent U.S. commercial real estate market
• Ability to achieve current returns that are equity real estate like (but in a debt structure)
• Relative investment values appear strong relative to other fixed income alternatives
• A number of investment options and structures are available

Co
mm
erc
ial M
orta
ge
sS
ub
ord
ina
ted
De
bt
CM
BS
Direct Investments in U.S. Commercial Mortgage Loans

Direct Investments in U.S. Commercial Mortgage Loans
I. What and Why of Commercial MortgagesA. What are Whole Loan Commercial MortgagesB. Investment Advantages of Commercial Mortgage LoansC. Whole Loans vs. CMBSD. Ability to Invest Directly or Pari-PassuE. Servicing Responsibilities and Fees
II. Investment ApproachA. Investment LandscapeB. Core Plus and Value-Add InitiativesC. Property Sector Characteristics
i. Apartmentsii. Industrialiii. Officeiv. Retail
Table of Contents
I. What and Why of Commercial Mortgages

• Whole Loan Commercial Mortgages are debt instruments collateralized by a first mortgage or deed of trust that encumbers an income producing property
• The primary property types are: retail, office, industrial, and multi-family properties
• Revenue source is rent paid by tenants that occupy commercial properties
• Rents often increase with inflation, providing some measure of inflation hedge
• Interest and principal payments are made monthly, enhancing yield relative to other fixed income products and reducing risk relative to core equity income
• Mortgages generally provide yield protection through make-whole covenants
• Fee and servicing income adds to the profitability of commercial mortgage investment
• Two key ratios to illustrate mortgage asset risk include:o Loan-to-value (leverage), ando Debt service coverage (cashflow in excess of debt payment)
• Whole Loan Commercial Mortgages are non-securitized products that are subject to book value under accounting for non Investment Companies (not mark-to-market) and those that have not elected fair value accounting
What are Whole Loan Commercial Mortgages?
What and Why of Commercial Mortgages

• Portfolio diversification
• Attractive risk-adjusted returns
• Low historical volatility relative to traditional fixed income investments
• Ability to target short, medium or long duration asset
• Higher recoveries in the event of default
• Stable monthly income
• Call protection
• Favorable risk based capital treatment relative to other fixed income assets
• Subject to book value accounting
Investment Advantages of Commercial Mortgage Loans
What and Why of Commercial Mortgages
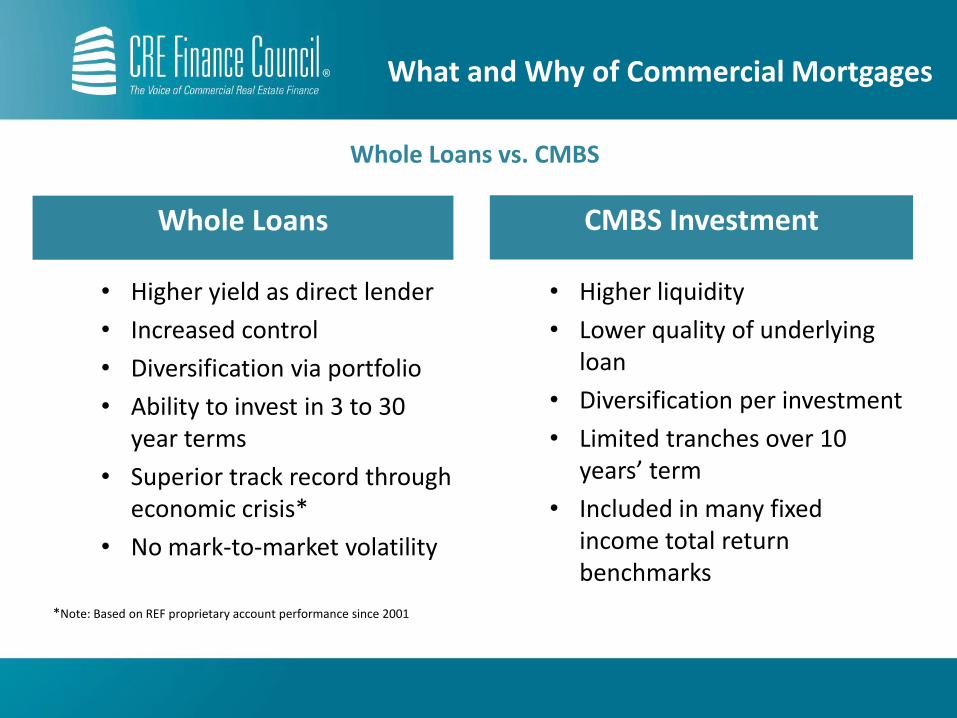
Whole Loans vs. CMBS
Whole Loans CMBS Investment
• Higher yield as direct lender
• Increased control
• Diversification via portfolio
• Ability to invest in 3 to 30 year terms
• Superior track record through economic crisis*
• No mark-to-market volatility
*Note: Based on REF proprietary account performance since 2001
• Higher liquidity
• Lower quality of underlying loan
• Diversification per investment
• Limited tranches over 10 years’ term
• Included in many fixed income total return benchmarks
What and Why of Commercial Mortgages
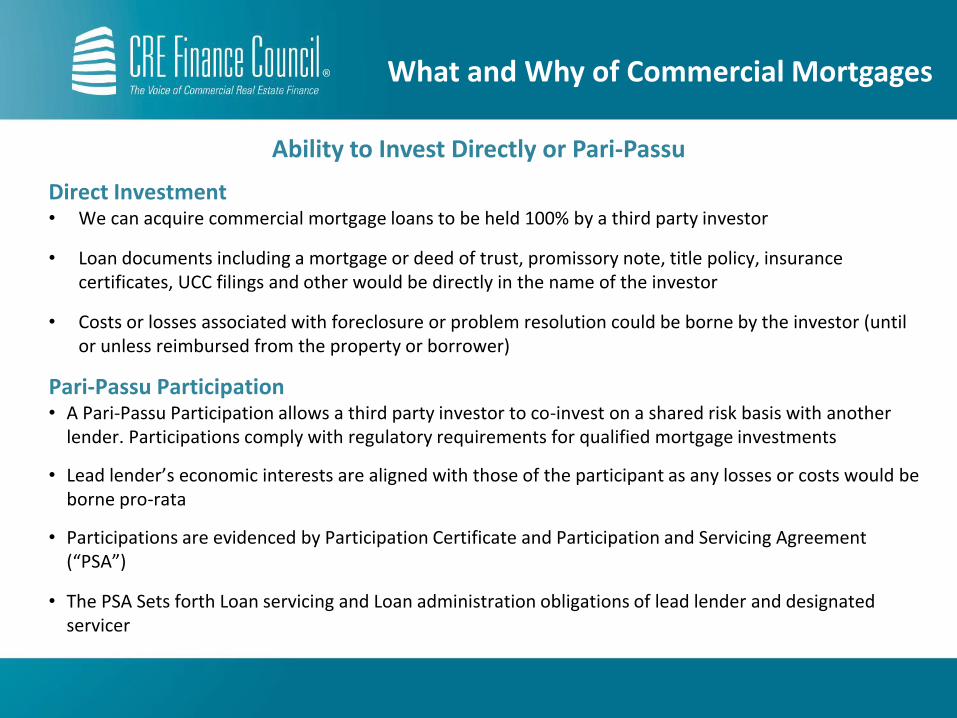
Direct Investment• We can acquire commercial mortgage loans to be held 100% by a third party investor
• Loan documents including a mortgage or deed of trust, promissory note, title policy, insurance certificates, UCC filings and other would be directly in the name of the investor
• Costs or losses associated with foreclosure or problem resolution could be borne by the investor (until or unless reimbursed from the property or borrower)
Pari-Passu Participation• A Pari-Passu Participation allows a third party investor to co-invest on a shared risk basis with another
lender. Participations comply with regulatory requirements for qualified mortgage investments
• Lead lender’s economic interests are aligned with those of the participant as any losses or costs would be borne pro-rata
• Participations are evidenced by Participation Certificate and Participation and Servicing Agreement (“PSA”)
• The PSA Sets forth Loan servicing and Loan administration obligations of lead lender and designated servicer
Ability to Invest Directly or Pari-Passu
What and Why of Commercial Mortgages
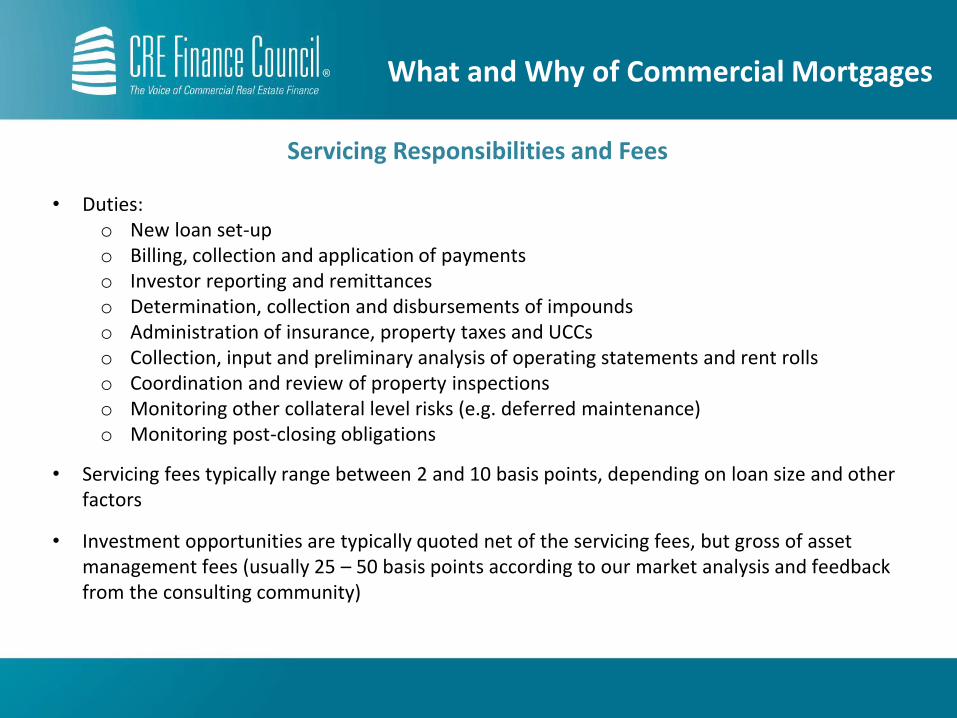
• Duties:o New loan set-upo Billing, collection and application of paymentso Investor reporting and remittanceso Determination, collection and disbursements of impoundso Administration of insurance, property taxes and UCCso Collection, input and preliminary analysis of operating statements and rent rollso Coordination and review of property inspectionso Monitoring other collateral level risks (e.g. deferred maintenance)o Monitoring post-closing obligations
• Servicing fees typically range between 2 and 10 basis points, depending on loan size and other factors
• Investment opportunities are typically quoted net of the servicing fees, but gross of asset management fees (usually 25 – 50 basis points according to our market analysis and feedback from the consulting community)
Servicing Responsibilities and Fees
What and Why of Commercial Mortgages
II. Investment Approach

Investment Landscape
Loan Characteristics• Leverage up to 65%• Amortization• 5-to 20-year term• Experienced
sponsor
Property Characteristics • Multi-tenant• Class A or B buildings• Good to excellent
location• Occupancy at market
level• Major geographic
markets
Core
Loan Characteristics• Leverage up to 75%• Amortization with potential
interest only• 3-to 10-year term• Reserves required for tenant /
capital improvements• Experienced sponsor with value-
added properties
Value-Added
Property Characteristics • Class A or B buildings• Recovering markets• Leasing / tenant risk• Under-managed
Assets• Re-development
Opportunistic
Loan Characteristics• Leverage greater than 75% • Major financial restructuring• Significant interest-only period• 2-to 5-year term• Reserves required for tenant /
capital improvements• Experienced sponsor with
opportunistic properties
Property Characteristics • Less than 50% leased• Asset repositioning or new
development
Ret
urn
Risk
Investment Approach
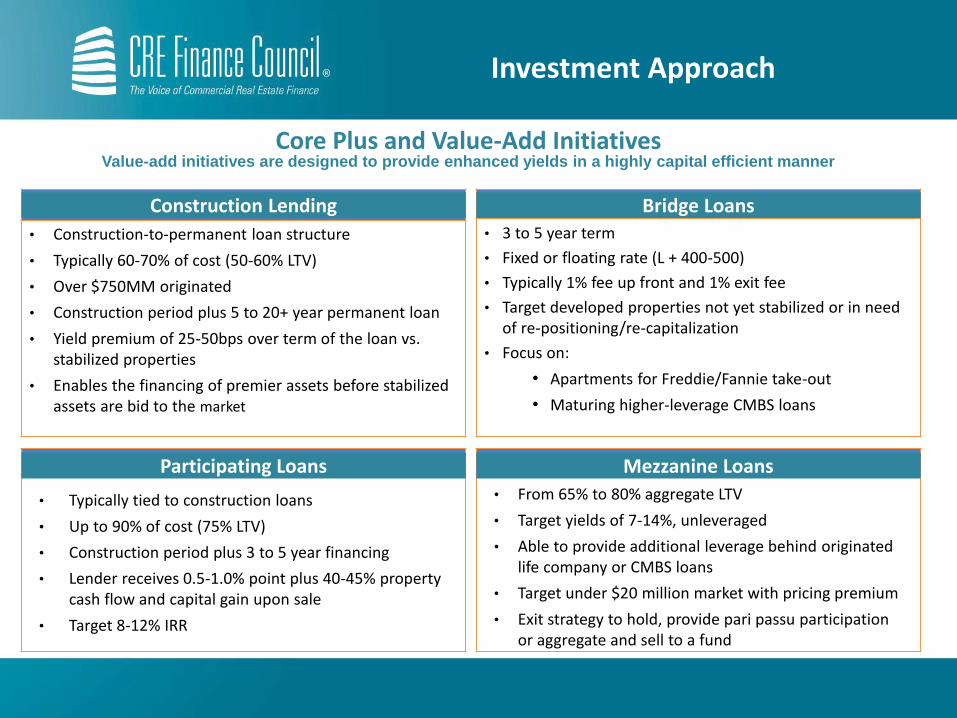
Core Plus and Value-Add InitiativesValue-add initiatives are designed to provide enhanced yields in a highly capital efficient manner
Construction Lending Bridge Loans
Participating Loans Mezzanine Loans
Bridge Loans
• Construction-to-permanent loan structure
• Typically 60-70% of cost (50-60% LTV)
• Over $750MM originated
• Construction period plus 5 to 20+ year permanent loan
• Yield premium of 25-50bps over term of the loan vs. stabilized properties
• Enables the financing of premier assets before stabilized assets are bid to the market
• 3 to 5 year term
• Fixed or floating rate (L + 400-500)
• Typically 1% fee up front and 1% exit fee
• Target developed properties not yet stabilized or in need of re-positioning/re-capitalization
• Focus on:
• Apartments for Freddie/Fannie take-out
• Maturing higher-leverage CMBS loans
• Typically tied to construction loans
• Up to 90% of cost (75% LTV)
• Construction period plus 3 to 5 year financing
• Lender receives 0.5-1.0% point plus 40-45% property cash flow and capital gain upon sale
• Target 8-12% IRR
• From 65% to 80% aggregate LTV
• Target yields of 7-14%, unleveraged
• Able to provide additional leverage behind originated life company or CMBS loans
• Target under $20 million market with pricing premium
• Exit strategy to hold, provide pari passu participation or aggregate and sell to a fund
Investment Approach

Apartments
Property Sector Characteristics
Source: CBRE Clarion Research & Investment Strategy, Voya Investment Management
Apartments
• Three main types: garden style, low-rise, and high rise
• Historically higher occupancy rates compared to other core properties
• Relative short development time and ability to develop in phases enables sector to be highly responsive to changes in demand
• Require a high degree of active management
• Relatively low capital intensive
Industrial
• Generally categorized as warehouse, research and development (R&D) facilities, flex space, and manufacturing
• Leases typically three to five years
• Short construction timelines of six to nine months enable greater responsiveness to market conditions
• Less volatile returns as measured by the NCREIF index than other core properties
• Require little active management
• Relatively low capital intensive
Office
• Generally categorized based upon location, quality, and size
• Leases are typically five to ten years
• Construction timelines are very long and markets are susceptible to over-building
• Require a high degree of active management
• Capital intensive, requiring large financial outlays for purchase, renovations, and tenant improvements
Retail
• Five main formats: neighborhood retail, community centers, regional centers, super-regional centers and single-tenant stores
• Location, convenience, accessibility and tenant mix are key criteria for successful investments
• Leases tend to range from three to five years for small tenants and ten to twenty years for large anchor tenants
• Require a high degree of active management
• Can be significantly more capital intensive higher than other sectors
Investment Approach

Co
mm
erc
ial M
orta
ge
sS
ub
ord
ina
ted
De
bt
CM
BS
U.S. Commercial Mortgage-Backed Securities (CMBS)

U.S. CMBS
I. CMBS OverviewII. Bond StructureIII. Property TypesIV. Credit MetricsV. CMBS Market UpdateVI. CMBS TodayVII. CMBS New Issue Market
Table of Contents

• CMBS are bonds collateralized by pools of first mortgages on commercial real estate properties
• Commercial mortgage loans typically require a 25-35% borrower down payment at loan closing (in the form of cash or borrower equity)
• On average, legacy1 issuances are collateralized by 100-200 loans (CMBS 2.01 average 65-100 loans)
• Issuances are diversified by property type and geography (see below)
• Majority of loans are fully call protected up to 3-6 months prior to maturity
As of 31 December 2014Source: Trepp, LLC1 Legacy CMBS refers to issuances originated in 2008 and prior years; issuances originated in 2009 and beyond are referred to as CMBS 2.0
What is CMBS (Commercial Mortgage-Backed Securities)?
Office
33%
Retail
31%
Multi-Family
13%
Lodging
9%
Industrial
6% Other
8%
Property Type Diversification
CA
15%
NY
13%
TX
8%FL
6%VA
4%IL
4%
PA
4%NJ
3%
GA
3%
Other
41%
Geographic Diversification
CMBS Overview

CMBS Structural Example
$1-$3 Billion in Commercial Mortgages
Bond Class(Original Ratings1)
Typical Original Subordination
Typical Original Subordination
Legacy CMBS2 CMBS 2.02
Super Senior AAA 30% 30%
Mezzanine AAA (AM/AS)
20% 20% - 25%
Junior AAA (AJ) 12% – 14% n/a
AA 9% – 12% 14% – 18%
A 6% – 9% 10% – 14%
BBB 4% – 6% 6% - 8%
BB 2% – 4% 4% – 5%
B 1% – 2% 2% – 3%
Unrated CMBS 0% 0%
As of 31 December 20141Original ratings. Current ratings may be significantly lower. 2Legacy CMBS defined as bonds issued prior to 2009; CMBS 2.0 defined as bonds issued post 2009.The above example is provided for illustrative purposes only. The mechanics and structure of assets may differ materially from those outlined above.
CMBS Bond Structure Key Points:
• Losses impact the lowest rated bonds first.
• Payments and recoveries are applied to the highest rated bonds first.
• Lower rated bonds provide a loss cushion to higher rated bonds (subordination)
CMBS offers loss protection through a combination of:
• Borrower’s initial equity
• CMBS bond structure
• Discount market prices (select bonds)
CMBS Overview
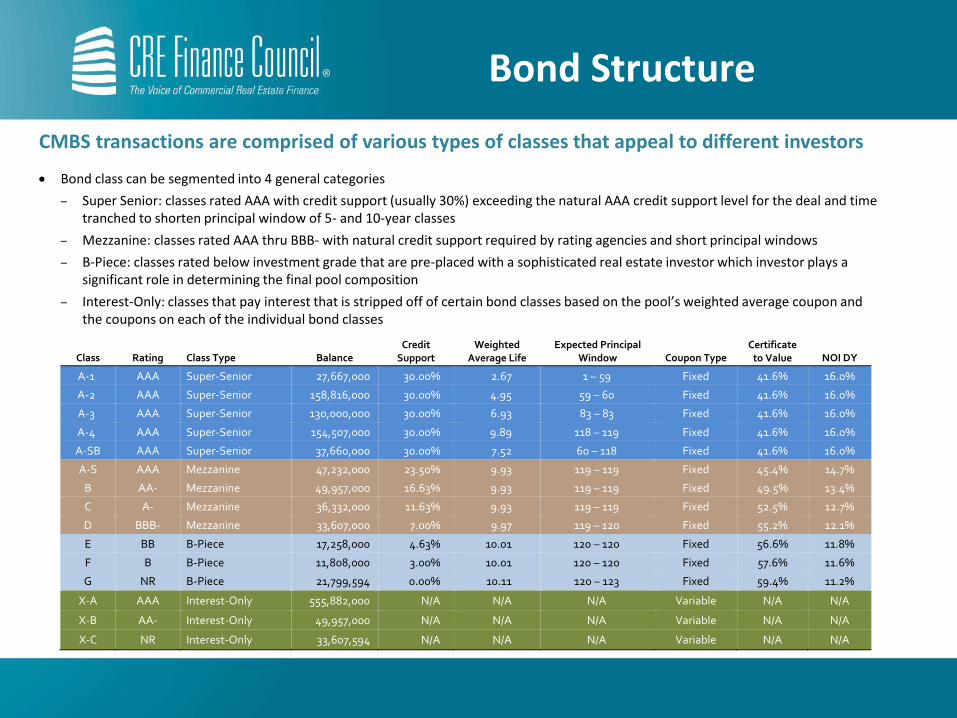
Bond class can be segmented into 4 general categories
– Super Senior: classes rated AAA with credit support (usually 30%) exceeding the natural AAA credit support level for the deal and time tranched to shorten principal window of 5- and 10-year classes
– Mezzanine: classes rated AAA thru BBB- with natural credit support required by rating agencies and short principal windows
– B-Piece: classes rated below investment grade that are pre-placed with a sophisticated real estate investor which investor plays a significant role in determining the final pool composition
– Interest-Only: classes that pay interest that is stripped off of certain bond classes based on the pool’s weighted average coupon and the coupons on each of the individual bond classes
Class Rating Class Type Balance Credit
Support Weighted
Average Life Expected Principal
Window Coupon Type Certificate
to Value NOI DY
A-1 AAA Super-Senior 27,667,000 30.00% 2.67 1 – 59 Fixed 41.6% 16.0%
A-2 AAA Super-Senior 158,816,000 30.00% 4.95 59 – 60 Fixed 41.6% 16.0%
A-3 AAA Super-Senior 130,000,000 30.00% 6.93 83 – 83 Fixed 41.6% 16.0%
A-4 AAA Super-Senior 154,507,000 30.00% 9.89 118 – 119 Fixed 41.6% 16.0%
A-SB AAA Super-Senior 37,660,000 30.00% 7.52 60 – 118 Fixed 41.6% 16.0%
A-S AAA Mezzanine 47,232,000 23.50% 9.93 119 – 119 Fixed 45.4% 14.7%
B AA- Mezzanine 49,957,000 16.63% 9.93 119 – 119 Fixed 49.5% 13.4%
C A- Mezzanine 36,332,000 11.63% 9.93 119 – 119 Fixed 52.5% 12.7%
D BBB- Mezzanine 33,607,000 7.00% 9.97 119 – 120 Fixed 55.2% 12.1%
E BB B-Piece 17,258,000 4.63% 10.01 120 – 120 Fixed 56.6% 11.8%
F B B-Piece 11,808,000 3.00% 10.01 120 – 120 Fixed 57.6% 11.6%
G NR B-Piece 21,799,594 0.00% 10.11 120 – 123 Fixed 59.4% 11.2%
X-A AAA Interest-Only 555,882,000 N/A N/A N/A Variable N/A N/A
X-B AA- Interest-Only 49,957,000 N/A N/A N/A Variable N/A N/A
X-C NR Interest-Only 33,607,594 N/A N/A N/A Variable N/A N/A
CMBS transactions are comprised of various types of classes that appeal to different investors
Bond Structure

Multifamily Retail Office Hotel Industrial
Description Rental buildings with
four or more units
Garden-style, high rise
Neighborhood,
community centers,
and regional malls
Freestanding stores
Downtown and
suburban
Class A, B, C
Budget to Luxury Warehouse,
manufacturing,
distribution, mixed use
Lease Term 1-year 5/7/10 year for smaller
stores. Major anchors
10-year +. Percentage
rents. Neighborhood
centers 3/5/7yr
5-10 year plus 24-Hour 5-10 year plus
Tenant Profile Household profile: 2.6
people, USD 54K
average HH income.
Department stores,
national chains,
grocery stores and
local operators
Various industries and
corporate credits
(rated/unrated,
public/private)
Business and leisure
travelers
Retail food/beverage
Manufacturing and
industrial
The CMBS universe is dominated by the five major property types, although most transactions contain some exposure to other property types as well
Property Types
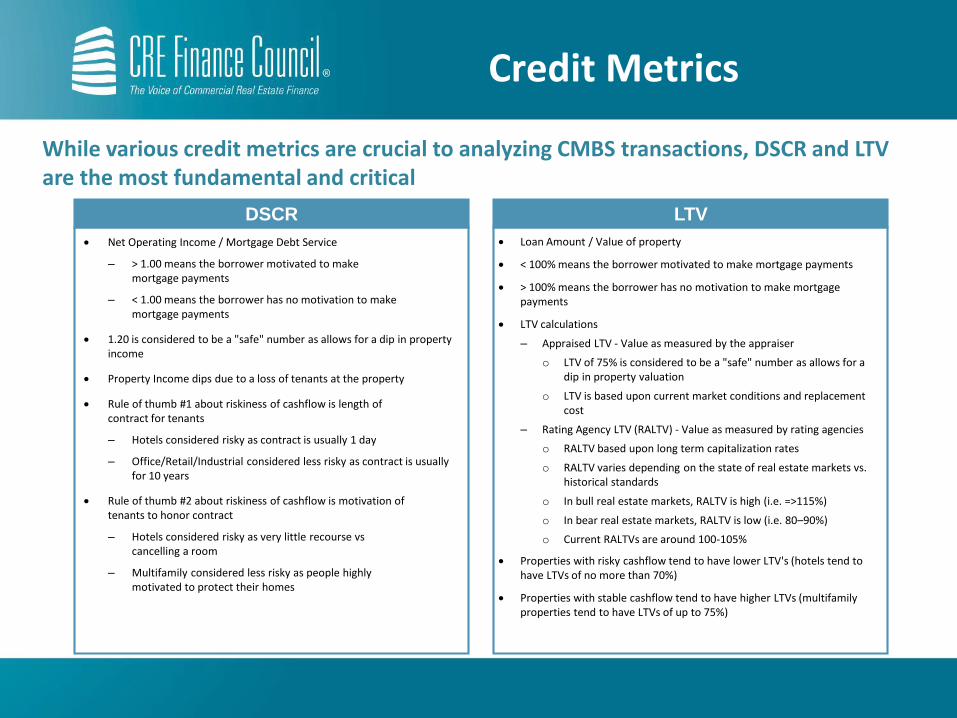
Loan Amount / Value of property
< 100% means the borrower motivated to make mortgage payments
> 100% means the borrower has no motivation to make mortgage payments
LTV calculations
– Appraised LTV - Value as measured by the appraiser
o LTV of 75% is considered to be a "safe" number as allows for a dip in property valuation
o LTV is based upon current market conditions and replacement cost
– Rating Agency LTV (RALTV) - Value as measured by rating agencies
o RALTV based upon long term capitalization rates
o RALTV varies depending on the state of real estate markets vs. historical standards
o In bull real estate markets, RALTV is high (i.e. =>115%)
o In bear real estate markets, RALTV is low (i.e. 80–90%)
o Current RALTVs are around 100-105%
Properties with risky cashflow tend to have lower LTV's (hotels tend to have LTVs of no more than 70%)
Properties with stable cashflow tend to have higher LTVs (multifamily properties tend to have LTVs of up to 75%)
DSCR LTV
Net Operating Income / Mortgage Debt Service
– > 1.00 means the borrower motivated to makemortgage payments
– < 1.00 means the borrower has no motivation to makemortgage payments
1.20 is considered to be a "safe" number as allows for a dip in property income
Property Income dips due to a loss of tenants at the property
Rule of thumb #1 about riskiness of cashflow is length ofcontract for tenants
– Hotels considered risky as contract is usually 1 day
– Office/Retail/Industrial considered less risky as contract is usually for 10 years
Rule of thumb #2 about riskiness of cashflow is motivation oftenants to honor contract
– Hotels considered risky as very little recourse vscancelling a room
– Multifamily considered less risky as people highlymotivated to protect their homes
While various credit metrics are crucial to analyzing CMBS transactions, DSCR and LTV are the most fundamental and critical
Credit Metrics

Despite relatively wide
current CMBS spreads
relative to CMBS 1.0,
historically low treasury
rates have kept CMBS
borrowing costs low
– Attractive all-in rates
compared to prior years
portend continued
borrower demand for
CMBS loans
2015 private label US
CMBS issuance totaled
$101.0 billion, up 7.3%
from 2014 and 17.3% from
2013
Securitized loans continue to be a compelling product to borrowers
CMBS Borrowing Rates are Attractive
CMBS Issuance has Returned with 2015 Issuance the Highest Since 2007
Source: Commercial Mortgage Alert, TreppAs of February 2016
CMBS Market Update
8.217.38
6.655.66 5.57 5.40
5.91 5.846.55
5.74 5.675.13 4.73 4.82 4.49 4.78
38 52 46 37 30 27 26 46
341
711
346 228 190
118 109 120 155
0
200
400
600
800
1,000
1,200
0
2
4
6
8
10
2000 2001 2002 2003 2004 2005 2006 2007 2008 2009 2010 2011 2012 2013 2014 2015 2016
Sp
rea
d (b
ps)C
ou
po
n (
%)
Ave. 10-yr Conduit Loan Coupon Ave. 10-yr AAA CMBS Spread
4767
52
78 93
167
198
229
123 12
3348
86 94 101
612 23
29 21
35
70
96 85
7 5 3 3 4 13 6 5 01 5 7 8 6 5 7 3 4 9
27 34 51 59 51
62
0
0
50
100
150
200
250
2000 2001 2002 2003 2004 2005 2006 2007 2008 2009 2010 2011 2012 2013 2014 2015 2016
CM
BS
Issu
an
ce
($
bn
)
US Non-US Agency
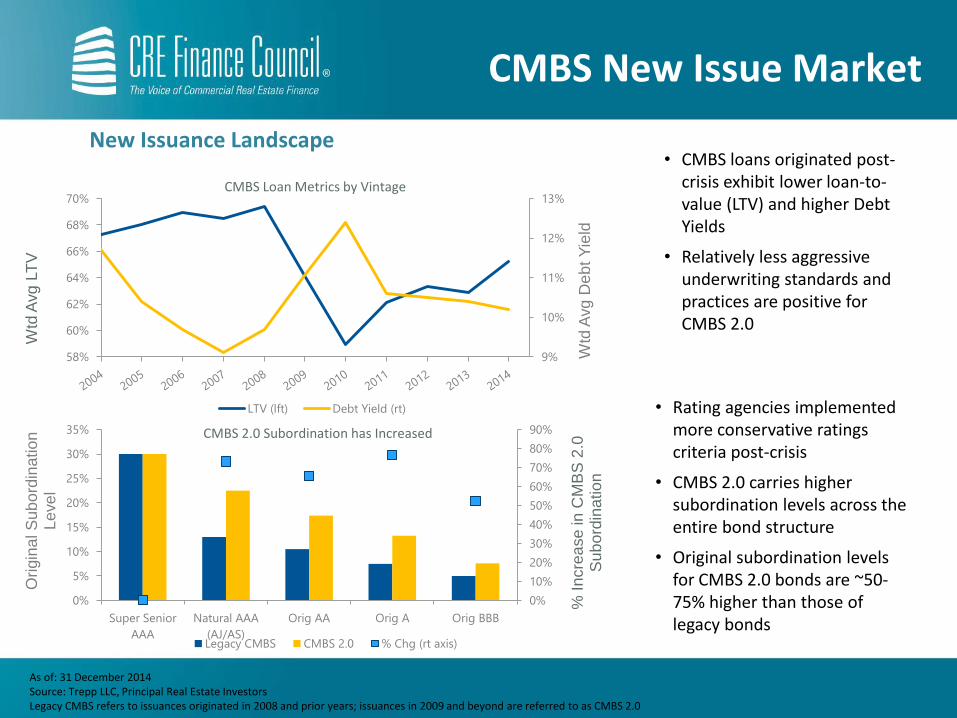
New Issuance Landscape
As of: 31 December 2014Source: Trepp LLC, Principal Real Estate InvestorsLegacy CMBS refers to issuances originated in 2008 and prior years; issuances in 2009 and beyond are referred to as CMBS 2.0
• CMBS loans originated post-crisis exhibit lower loan-to-value (LTV) and higher Debt Yields
• Relatively less aggressive underwriting standards and practices are positive for CMBS 2.0
• Rating agencies implemented more conservative ratings criteria post-crisis
• CMBS 2.0 carries higher subordination levels across the entire bond structure
• Original subordination levels for CMBS 2.0 bonds are ~50-75% higher than those of legacy bonds
9%
10%
11%
12%
13%
58%
60%
62%
64%
66%
68%
70%
Wtd
Avg D
eb
t Y
ield
Wtd
Avg L
TV
CMBS Loan Metrics by Vintage
LTV (lft) Debt Yield (rt)
0%
10%
20%
30%
40%
50%
60%
70%
80%
90%
0%
5%
10%
15%
20%
25%
30%
35%
Super Senior
AAA
Natural AAA
(AJ/AS)
Orig AA Orig A Orig BBB
% I
ncre
ase
in C
MB
S 2
.0
Su
bo
rdin
atio
n
Origin
al S
ub
ord
ina
tio
n
Le
ve
l
CMBS 2.0 Subordination has Increased
Legacy CMBS CMBS 2.0 % Chg (rt axis)
CMBS New Issue Market
CMBS New Issue Market
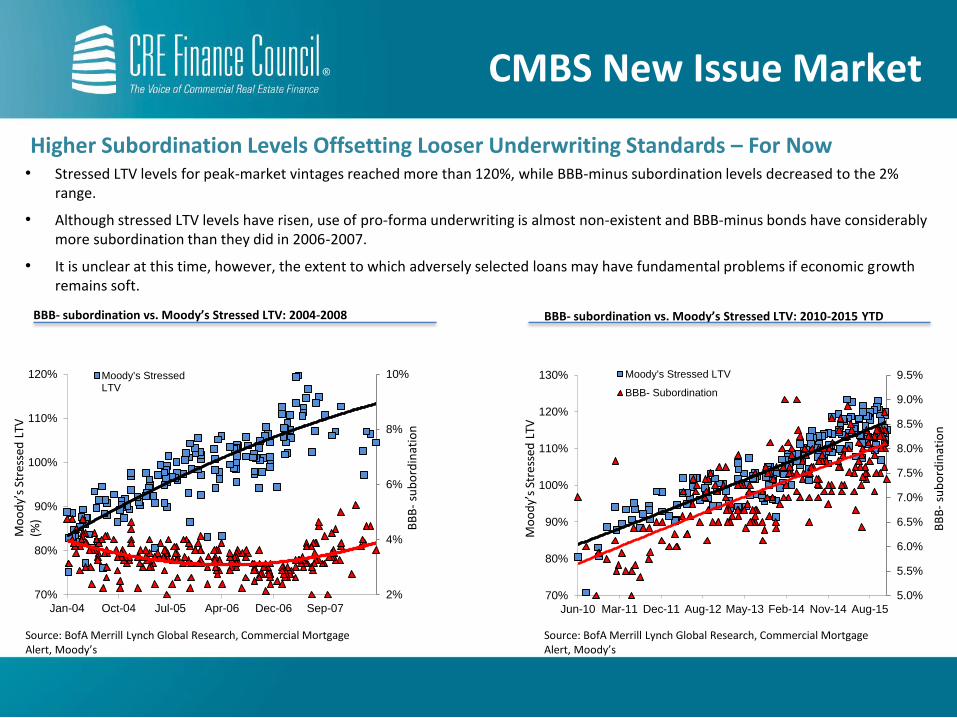
Higher Subordination Levels Offsetting Looser Underwriting Standards – For Now• Stressed LTV levels for peak-market vintages reached more than 120%, while BBB-minus subordination levels decreased to the 2%
range.
• Although stressed LTV levels have risen, use of pro-forma underwriting is almost non-existent and BBB-minus bonds have considerably more subordination than they did in 2006-2007.
• It is unclear at this time, however, the extent to which adversely selected loans may have fundamental problems if economic growth remains soft.
2%
4%
6%
8%
10%
70%
80%
90%
100%
110%
120%
Jan-04 Oct-04 Jul-05 Apr-06 Dec-06 Sep-07
Moody's StressedLTV
Mo
od
y’s
Stre
ssed
LTV
(%
)
Source: BofA Merrill Lynch Global Research, Commercial Mortgage Alert, Moody’s
BB
B-
sub
ord
inat
ion
BBB- subordination vs. Moody’s Stressed LTV: 2010-2015 YTD
5.0%
5.5%
6.0%
6.5%
7.0%
7.5%
8.0%
8.5%
9.0%
9.5%
70%
80%
90%
100%
110%
120%
130%
Jun-10 Mar-11 Dec-11 Aug-12 May-13 Feb-14 Nov-14 Aug-15
Moody's Stressed LTV
BBB- Subordination
Mo
od
y’s
Stre
ssed
LTV
BB
B-
sub
ord
inat
ion
Source: BofA Merrill Lynch Global Research, Commercial Mortgage Alert, Moody’s
BBB- subordination vs. Moody’s Stressed LTV: 2004-2008
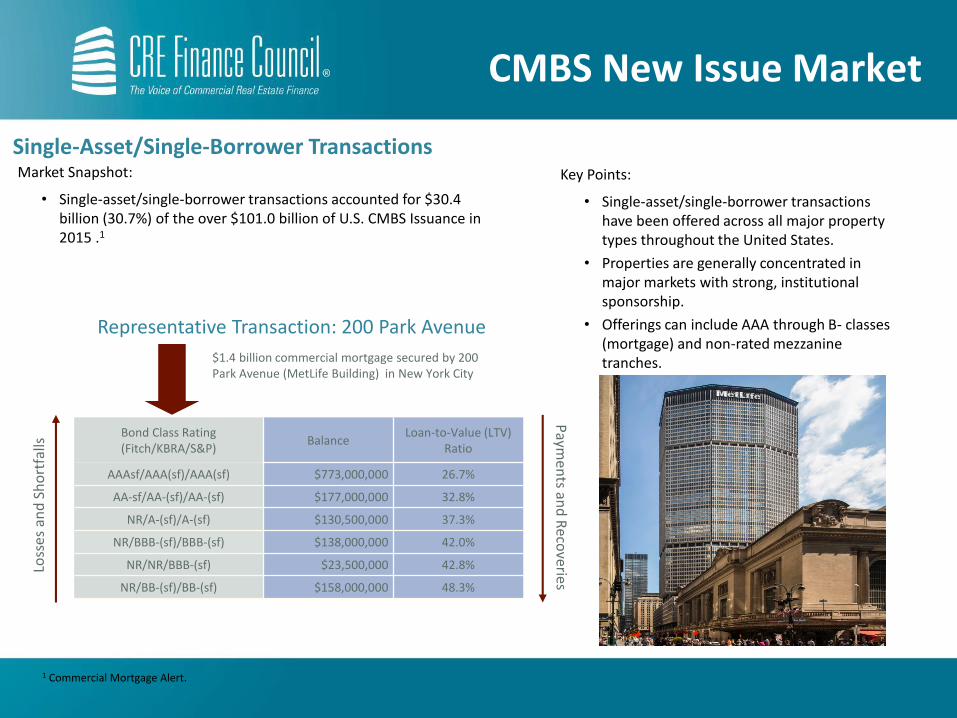
Representative Transaction: 200 Park Avenue
$1.4 billion commercial mortgage secured by 200 Park Avenue (MetLife Building) in New York City
Bond Class Rating (Fitch/KBRA/S&P)
BalanceLoan-to-Value (LTV)
Ratio
AAAsf/AAA(sf)/AAA(sf) $773,000,000 26.7%
AA-sf/AA-(sf)/AA-(sf) $177,000,000 32.8%
NR/A-(sf)/A-(sf) $130,500,000 37.3%
NR/BBB-(sf)/BBB-(sf) $138,000,000 42.0%
NR/NR/BBB-(sf) $23,500,000 42.8%
NR/BB-(sf)/BB-(sf) $158,000,000 48.3%
Single-Asset/Single-Borrower TransactionsKey Points:
• Single-asset/single-borrower transactions have been offered across all major property types throughout the United States.
• Properties are generally concentrated in major markets with strong, institutional sponsorship.
• Offerings can include AAA through B- classes (mortgage) and non-rated mezzanine tranches.
Market Snapshot:
• Single-asset/single-borrower transactions accounted for $30.4 billion (30.7%) of the over $101.0 billion of U.S. CMBS Issuance in 2015 .1
1 Commercial Mortgage Alert.
CMBS New Issue Market

Representative Floating Rate Transaction: 2015-BXRP
$796.6 million commercial mortgage secured by 45 anchored-retail, grocery-anchored, and grocery shadow-anchored properties located throughout the U.S.
Bond Class Rating (S&P/Fitch) BalanceLoan-to-Value (LTV)
Ratio
AAA(sf)/AAAsf $410,050,000 38.4%
AA-(sf)/AA-sf $87,950,000 46.6%
A-(sf)/A-sf $62,000,000 52.4%
BBB-(sf)/BBB-sf $68,000,000 58.8%
BBB-(sf)/NR $18,500,000 60.5%
BB-(sf)/NR $118,340,000 71.6%
B+(sf)/NR $31,747,500 74.6%
Floating Rate TransactionsKey Points:
• Floating rate transactions have been offered across all major property types throughout the United States.
• Properties are generally concentrated in major markets with strong, institutional sponsorship.
• Offerings can include AAA through B- classes (mortgage) and non-rated mezzanine tranches.
• Allows for maximum prepayment flexibility.
Market Snapshot:
• Floating rate transactions accounted for $2.0 billion (2.0%) of the over $101.0 billion of U.S. CMBS Issuance in 2015.1
1 Commercial Mortgage Alert and Citi Research
CMBS New Issue Market
~18%
10%
7.5%Acc
rued
cer
tifi
cate
inte
rest
, th
en p
rin
cip
al
Allo
cation
of Lo
sses
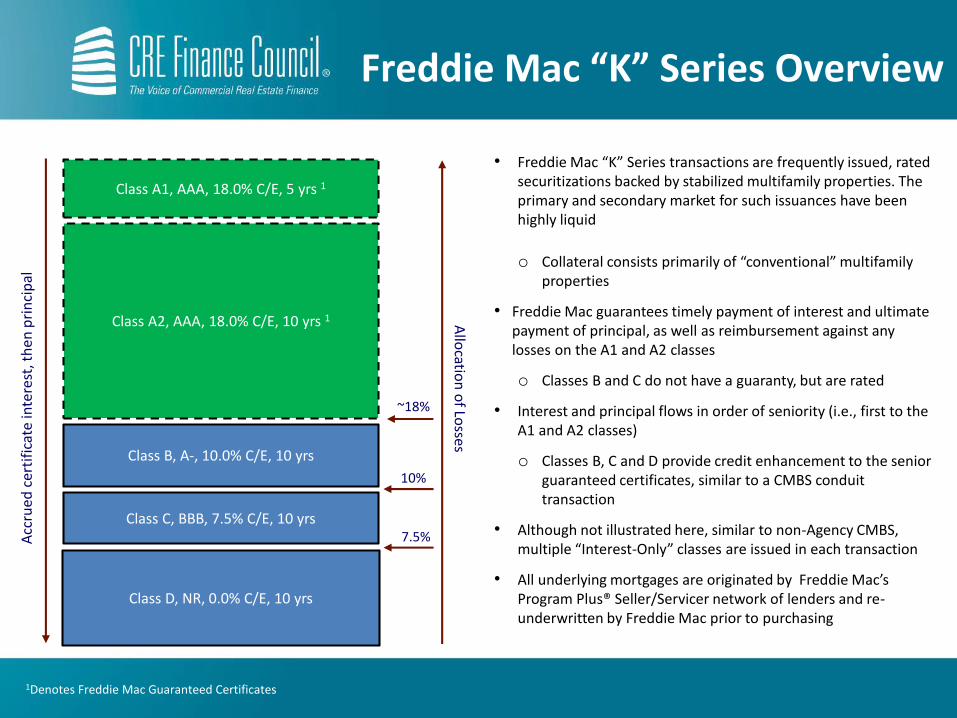
• Freddie Mac “K” Series transactions are frequently issued, rated securitizations backed by stabilized multifamily properties. The primary and secondary market for such issuances have been highly liquid
o Collateral consists primarily of “conventional” multifamily properties
• Freddie Mac guarantees timely payment of interest and ultimate payment of principal, as well as reimbursement against any losses on the A1 and A2 classes
o Classes B and C do not have a guaranty, but are rated
• Interest and principal flows in order of seniority (i.e., first to the A1 and A2 classes)
o Classes B, C and D provide credit enhancement to the senior guaranteed certificates, similar to a CMBS conduit transaction
• Although not illustrated here, similar to non-Agency CMBS, multiple “Interest-Only” classes are issued in each transaction
• All underlying mortgages are originated by Freddie Mac’s Program Plus® Seller/Servicer network of lenders and re-underwritten by Freddie Mac prior to purchasing
Class A1, AAA, 18.0% C/E, 5 yrs 1
Class A2, AAA, 18.0% C/E, 10 yrs 1
Class B, A-, 10.0% C/E, 10 yrs
Class C, BBB, 7.5% C/E, 10 yrs
Class D, NR, 0.0% C/E, 10 yrs
1Denotes Freddie Mac Guaranteed Certificates
Freddie Mac “K” Series Overview

10%
7.5%Acc
rued
cer
tifi
cate
inte
rest
, th
en p
rin
cip
al
Allo
cation
of Lo
sses
• Freddie Mac “K” Series floating rate issuances are similar in size, collateral, and Freddie Mac senior certificate guarantee as with the fixed rate transactions, however the structure differs in certain ways:
• Pro rata principal repayment subject to Waterfall Trigger Events
• One senior principal & interest class (no “time-tranching”)
• None of the classes are rated
• Generally requires underlying borrowers to purchase interest rate protection in the form of a cap from an approved counterparty
• A Waterfall Trigger Event occurs when (i) the number of non-specially serviced loans remaining in the pool falls below the designated threshold as defined in the Pooling & Servicing Agreement or (ii) the total outstanding principal balance of the non-specially serviced loans is less than 15% of the initial total pool balance
• Floating rate “K” series transactions have typically been backed by seven year collateral, however, Freddie Mac securitized its first floating rate ten-year securitization in 2015
Class A, 10.0% C/E, 7 yrs1
Class B, 7.5% C/E, 7 yrs
Class C, 0.0% C/E, 7 yrs
1Denotes Freddie Mac Guaranteed Certificates
Freddie Mac “K” Series Overview

www.crefc.org
Participating U.S. Companies:
Apollo Global Management
Bank of America Merrill Lynch
CCRE
Citigroup Global Markets
Deutsche Bank Securities
KeyBank Real Estate Capital
MetLife Real Estate Investors
Morgan Stanley
Pine River Capital
Principal Real Estate Investors
Related Companies
Square Mile Capital Management
Talmage, LLC
UBS Investment Bank
USAA Real Estate Company
Wells Fargo Securities


