Download - Investment in greener cities: Mind the gap

Public Policy & Economic Research
Investment in greener cities: Mind the gap


Investment in greener cities: Mind the gap


Inve
stm
ent i
n gr
eene
r citi
es: M
ind
the
gap
5Cities are the heart of the world’s climate change dilemma: they account for three quarters of global greenhouse gas emissions – a share that is set to rise further as billions more move from rural to urban areas over coming decades. But cities also produce the bulk of global output and wealth. The world’s top 600 cities alone generate half of global GDP.
Unless effective action is taken soon, the world will heat up to a devastating degree over the course of this century. Storms, floods and other extreme weather will hurt us all, and some coastal or otherwise exposed cities in particular.
Many governments use the gridlock in global climate talks as an excuse for inaction. Cities and municipalities will have to drive change instead. In much of Europe, local governments account for the vast majority of public spending on environmental policies. Not only Copen-hagen, Chicago and Munich, but also Mexico City, Rio de Janeiro and Shanghai have ambitious programs to become greener.
The task is enormous. Various studies suggest that around USD 2 trillion will have to invested every year over the next 20 years to upgrade urban infrastructure and make it more sustainable. Public budgets are under strain everywhere; they will not cover a fraction of these investment needs. The private sector will have to step in. However, banks, which have traditionally financed the majority of infrastructure investments, are struggling to repair or shrink their balance sheets. New regulation, such as the Basel III rules on capital, may make it difficult for banks to return to their previously prominent role in infrastructure finance.
Private institutional investors, such as pension funds and insurance companies, are another potential source of funding. They have some USD 70 trillion in assets under management in the OECD countries, and should, in principle, find sustainable urban infrastructure an attractive addition to their portfolios. But although some private entities are starting to invest in municipal projects for renewable energy or public transport, the sums are miniscule compared with need and potential. The area of energy savings, which should be at the heart of the municipal climate change agenda, is particularly undercapitalized. Already, most cities are falling woefully behind on their green targets.
The question of how to attract more private money into the modernization and greening of urban infrastructure is therefore crucial for sustainable growth worldwide.
Local governments need to get smarter in dealing with the private sector. But many of the barriers to private investment can only be overcome at the national or even supranational level, especially in the European Union. National governments need to improve the legal frameworks for private long-term investments and redesign the rules of public-private co-investments.
However, national governments should also look at the structure of the market in which sustainable urban infrastructure investment takes place. Urban investment projects tend to be small and highly diverse. For institutional and other investors, the costs of finding and assessing such projects are too high compared with the return they can expect. National governments should therefore set up centralized one-stop shops – we call them Green Cities Platforms – to package, market and sell urban infrastructure investments to the private sector. Institutional investors can offer their expertise and active participation in making such Green Cities Platforms work.
The world will not tackle climate change unless cities modernize their infrastructure. But cities cannot shoulder this responsibility alone. As one of the world’s biggest insurers and institutional investors, Allianz is looking forward to helping foster this much-needed dialogue between the public and the private sector.
Executive summary

Table of content

1. Cities and climate change ................................................................................................. 9 1.1 Why cities matter .................................................................................................10 1.2 Cities to the rescue ..............................................................................................11
2. Investment in sustainable urban infrastructure ...................................................17 2.1 The investment gap .............................................................................................18 2.2 The investment case ...........................................................................................20 2.3 What private investors are doing...................................................................25 2.4 Why is investment falling short of potential? ..........................................27 2.4.1 Policies and politics .....................................................................................27 2.4.2 Matching funds and projects ...................................................................29 2.4.3 The special case of energy efficiency ....................................................31
3. How to narrow the financing gap .................................................................................35 3.1 Local initiatives .....................................................................................................36 3.2 National policies ...................................................................................................39 3.3 The European framework .................................................................................41 3.4 What investors can do ........................................................................................44
4. Where next? ..........................................................................................................................49
Annex: What cities are doing to reduce CO2 ................................................................52
End notes ....................................................................................................................................56
References ..................................................................................................................................60


1.
Cities and climate change

1. C
ities
and
clim
ate
chan
ge
10
in %
Chart 1: Increasing urbanization, share of total population living in urban areas
1.1 Why cities matter
Cities matter hugely for climate change. They al-
ready consume around 70% of the world’s energy
and they are responsible for over 70% of global
emissions of greenhouse gases.1 What is more,
their contribution to global pollution will keep
growing. Today roughly half of the world’s 7.2
billion people live in urban areas. By 2050, this
share is expected to rise towards three-quarters,
with the fastest growth expected in emerging re-
gions (see Chart 1). Since the world’s population
is projected to grow to 9.6 billion by 2050, there
could be almost as many people living in urban
areas in 2050 as are alive today.
Cities are also at the heart of global pro-
duction and growth. Tokyo alone generates 40%
of Japan’s GDP; Paris makes up 30% of the French
economy. The world’s 600 major cities together
generate over half of global GDP, with less than
a quarter of the world’s population. Over the
next 20 years, almost two-thirds of global GDP
growth will be generated by these cities.2 This
tremendous urban growth will lead to a further
rise in the carbon emissions produced by cities –
unless current trends change dramatically.
Although the dynamics and causal rela-
tionships of climate change are not yet fully un-
derstood, climate researchers broadly agree that
increased atmospheric concentrations of green-
house gases are the main reason. Most climate
projection models show that unless effective
measures are taken, the global mean tempera-
ture will increase by between 2.6°C and 4.8°C
by the year 2100, while the global mean sea level
1950
1955
1960
1965
1970
1975
1980
1985
1990
1995
2000
2005
2010
2015
2020
2025
2030
2035
2040
2045
2050
90
80
70
60
50
40
30
20
10
0
Source: UN Population Division. Northern AmericaLatin America, Caribbean
Europe
OceaniaAsia
Africa

Inve
stm
ent i
n gr
eene
r citi
es: M
ind
the
gap
11could rise by as much as 80 centimeters.3 The
trend towards more extreme weather events,
such as storms, floods, droughts, forest fires and
extreme cold, is likely to accelerate.4 Climate
change also has various indirect consequences.
For example, weather-related disruptions at ma-
jor supply hubs cause problems for businesses
around the globe.
While effective action on climate change
is becoming more urgent, the chances of a global
accord on cutting greenhouse gas emissions re-
main uncertain. Successive UN climate change
conferences have passed without an effective
agreement. Some national governments are tak-
ing this lack of a global framework as an excuse
for their own inaction. The world can no longer
afford to wait for these intergovernmental ne-
gotiations to yield results. New actors below the
national level must be found – actors who can
take effective measures without further delay.
1.2 Cities to the rescue
In recent years, the focus has increasingly shift-
ed towards cities as leading actors in the fight
against climate change. Cities usually have a de-
gree of autonomy in policy making, and they are
often good at devising and implementing com-
prehensive strategies across various sectors.
Also, urban areas tend to have a higher density
of innovative businesses and experts than ru-
ral areas, and these are a vital ingredient to any
green transformation. Many cities also have
control over funds: The OECD estimates that in
Europe local governments are responsible for
75% of governmental expenditures on environ-
mental protection.5
Many of the world’s cities are proactively
adopting and implementing programs to be-
come greener and adapt to climate change.6 Of
the 90 cities around the world that responded
to a survey by LSE Cities in 2012, a full 94% had
adopted some sort of green strategy – although
these strategies differed widely, from legally
binding and monitored targets to vague sus-
tainability commitments.7 All bar two of the 27
cities included in the Siemens North American
Green City Index have developed their own green
energy projects, such as wind farms or thermal
heating.8 Since 2007, 19 out of 22 cities in the
Asian Green City Index have conducted an en-
vironmental review.9 If cities followed through
on these climate change initiatives, they would
have a significant effect on CO2 reduction ef-
forts worldwide. Chart 2 shows a selection of cit-
ies worldwide and their CO2 reduction targets.
Annex 1 has more examples of what cities, from
Copenhagen to Shanghai, are doing to become
greener.

1. C
ities
and
clim
ate
chan
ge
12Cities around the world are not only
developing their own climate mitigation strate-
gies, they are increasingly working together to
exchange best practice and encourage each oth-
er. The largest climate-focused network of mega-
cities worldwide is the “C40 Cities” (which has
grown to over 50 cities). The C40 members, rang-
ing from Addis Ababa to Yokohama, account for
18% of global GDP and pride themselves in having
adopted over 4,700 measures to combat climate
change.10 Within the EU, over 5,000 mayors of cit-
ies, towns and villages have signed a Covenant
of Mayors, which obliges them to work towards
self-imposed CO2 reduction targets.11
Many of these initiatives combine incen-
tives for urban inhabitants and businesses to
change their behavior with investment in new,
or upgrading of old, infrastructure. For the pur-
pose of this report, we summarize initiatives to
make urban bus networks, apartment buildings,
power supplies or care homes greener under the
heading investment in “sustainable urban in-
frastructure”. In this, we also include infrastruc-
ture that is built to help cities cope with the con-
sequences of climate change, for example flood
defenses and more resilient roads and bridges.
Toronto1990-2050
-80%
Munich1990-2030
-50%
Vienna2009-2020
-21%
Mexico City2008-2012
-12%
New York2005-2030
-30%
London1990-2025
-60%
Chicago1990-2050
-80%
Rio de Janeiro2005-2020
-20%
Chart 2: CO2 reduction targets of selected cities
Source: Green City Index Siemens, ERCD research

Inve
stm
ent i
n gr
eene
r citi
es: M
ind
the
gap
13Without such “climate adaptation”
infrastructure, many cities will be ever more
vulnerable to the extreme weather events as-
sociated with climate change. The devastating
impact that Hurricane Sandy had on New York
and other East Coast cities was exacerbated by
a lack of storm infrastructure in key areas.12
Many of the one billion people who live in urban
and suburban areas in developing countries are
vulnerable to landslides and flooding – unless
large-scale investment in environmental infra-
structure takes place.13
Sustainable infrastructure must be at
the heart of cities’ efforts to cut CO2 emissions
because three quarters of all emissions in rich
countries come from just four types of infra-
structure, namely power generation, buildings
(or more specifically, the energy that is used in
them), transport and waste management.14 Al-
though urban sustainability programs encom-
pass a vast array of measures (see Table 1 for
examples), most cities have focused on three
areas. They aim to:
• switchtheirenergysuppliestorenewable
sources;
• makebuildings,bothresidentialandcom-
mercial, more energy efficient; and
• encouragetheuseofpublictransportor
emissions-free private transport.
Helsinki2010-2015
Carbon neutral
Wuhan2005-2020
-20%
Stockholm2010-2015
-25%
Chongqing2005-2020
-20%
Melbourne2007-2020
Carbon neutral
Copenhagen2005-2025
Carbon neutral
Singapore2007-2020
-16%
Jakarta2009-2020
-30%

1. C
ities
and
clim
ate
chan
ge
14
Renewable energy• Reducingrelianceonenergycomingfromcoalandoilwhileincreasingthe
share of renewable sources, most notably wind, solar, biomass, hydro and geothermal. Natural
gas, which produces less CO2 than coal, can act as a bridge fuel where needed.
• Expandingdistrictheatingnetworksandmakingthemmoreefficient
• Installinglocal,highlyflexibleenergystoragecapacitiesandsmall,
natural gas-based local combined heat and power stations
• Convertinglandfillgasintoelectricityforlocalconsumers
• Designatingsitesforlocalrenewableenergyproductioninurbanplanning
Energy efficiency • Creatingtaxincentivesandsubsidiesforinvestmentsintheenergyefficiencyofbuildings
• Settingbindingefficiencystandardsforexistingandnewbuildings
• Usingsmarttechnologyforlighting,ventilationandotherinstallationsinprivateand
public buildings
• Designatingpilotmunicipalitieswithexemplaryenvironmentalpolicies
• Savingelectricityintheprivateandpublicsector,forexamplethroughLEDstreetand
underground lighting
• Employingnewmodelsofenergycontractsforpublic,private,commercialand
industrial buildings
• Usingcompetitionsandawardstoencouragebusinessandindustrytobecomeclimateneutral
• Increasinghousingdensity
• Demolishingbuildingsifclimate-friendlyupgradingdoesnotmakesense
• Constructingclimate-neutralbuildingingreenfieldurbandistricts
• Mappingenergyefficiencycity-wideandmonitoringallbuiltinfrastructure
• Offeringmapsofbuildings’thermallossesonthemunicipalwebsite
• Conductinganon-goingdialoguewithbuildingoccupantsaboutenergyupgradingandsavings
Transport • Reducingtheuseofprivate,conventionallyfuelledcarsthroughaccessrestrictions,congestion
charges and road capacity reduction
• Upgradingconventionalbussesforexamplethroughbio-dieselandfilters
• Addingseparatelanesforpublictransportandgenerallymakingpublictransportmoreattractive
• Establishingincentivesforelectricvehicles,forexamplethroughlowertaxes,freeparkingand
free recharging
• Encouragingclimatefriendlymobilitytechnologies,suchasLNG,hydrogenandfuelcells
• Extendingpublicspacesforcyclingandwalking,designatingcar-freedays
Table 1: Measures for making cities greener
Inve
stm
ent i
n gr
eene
r citi
es: M
ind
the
gap
15Cities do not operate in a vacuum. Sustainable
urban infrastructure planning needs strong
partnerships with regional and national gov-
ernments and a solid national and international
legal framework. Cities in countries or regions
with ambitious climate targets tend to find it
easier to implement their own climate initia-
tives. For example, cities in the European Union
can count on the commitment of their national
governments to meet EU climate targets, most
notably to reduce CO2 emissions by 20% by 2020.
In Germany, a national “Energy Performance
Certificate” sets enforceable standards for all
residential and commercial buildings nation-
wide and thus provides a clear framework for
municipal policy.


2.
Investment in sustainable urban infrastructure

2. In
vest
men
t in
sust
aina
ble
urba
n in
frast
ruct
ure
18 2.1 The investment gap
Estimates of global infrastructure investments
needs are daunting. Climate change aside, most
infrastructure in developed countries was built
30 to 50 years ago and must now be renovated
or replaced. Developing countries have their
own huge infrastructure requirements, to allow
them to catch up economically and accommo-
date their growing populations. Both developed
and developing countries face the challenge of
reducing the greenhouse gas emissions of ex-
isting and new power stations, buildings and
means of transport. As explained above, a lot of
this will need to happen at the local level. More-
over, both continued urbanization and climate
change will mean additional strains for urban
infrastructure. For example, water and sewage
systems may not cope with additional precipita-
tion, while dikes and flood defenses will be over-
whelmed by more frequent and more violent
storms.15
Estimates of infrastructure require-
ments differ widely, not least since economists
use different methodologies and timeframes
and refer to different scenarios, for example the
costs of keeping current infrastructure intact
or the costs of making infrastructure carbon
neutral. Estimates are therefore not usually
comparable and many of them overlap with cost
estimates of fighting climate change. But, as
Table 2 shows, economists agree that the world
will have to invest tens of trillions over coming
decades to upgrade infrastructure, make energy
systems greener and keep cities livable. Avail-
able studies imply that for urban infrastructure
alone, the global investment requirement could
be USD 40 trillion over the next 20 years, that is
USD 2 trillion per year.
Table 2: Infrastructure investment needs
How much? For what? When? Source
Over USD 40 trillion
Global infrastructure investment most of which will be spent on urban infra-
structure development and maintenance
2012 - 2037 KPMG (2012)
Around USD 41 trillion
Amount that cities worldwide will need to invest in expanding their water, power
and transportation systems
2005 - 2030
Booz&Company (2007), quoted in Siemens (2010a)
Around USD 50 trillion Global infrastructure requirements 2007 -
2030
OECD 2006/07 estimates, quoted
in OECD (2013c)
USD 57 trillionGlobal infrastructure investment
needed (even without green targets and development goals)
2013 - 2030 McKinsey (2013)

Inve
stm
ent i
n gr
eene
r citi
es: M
ind
the
gap
19 Public infrastructure investment has
actually been falling in many countries, both
as a portion of overall public spending and as a
share of GDP. In the US, for example, public in-
vestment in infrastructure fell to a 20-year low
of 1.7% of GDP in 2013, compared with rates of
around 5% in the 1960s.16 In the EU-15 countries,
public infrastructure spending fell by more than
1 percentage point of GDP between 1970 and the
onset of the financial crisis, when public stimu-
lus programs drove the numbers up a bit (see
Chart 3).
In most developed countries (and some
emerging markets, too), the need to consoli-
date public finances and to accommodate the
requirements of ageing populations suggests
that government investment is more likely to
fall than rise in the future. Budgetary pressures
also exist at the local level. Some countries, like
the US, have long-standing debt limits for local
governments, while others have adopted them
in the wake of the financial crisis. Germany’s
constitutional debt brake (which will come into
force in 2016 for the federal government and in
2020 for the Länder) will not apply directly to cit-
ies and municipalities. But it will affect them in-
directly because Länder governments are likely
to transfer some of the burden of balancing their
budgets down to the local level.17
Chart 3: Public investment in infrastructure in Europe
Ratio of government investment to GDP EU-15
Source: EIB
5
4
3
2
1
0
TotalInfrastructure
How much? For what? When? Source
Over USD 40 trillion
Global infrastructure investment most of which will be spent on urban infra-
structure development and maintenance
2012 - 2037 KPMG (2012)
Around USD 41 trillion
Amount that cities worldwide will need to invest in expanding their water, power
and transportation systems
2005 - 2030
Booz&Company (2007), quoted in Siemens (2010a)
Around USD 50 trillion Global infrastructure requirements 2007 -
2030
OECD 2006/07 estimates, quoted
in OECD (2013c)
USD 57 trillionGlobal infrastructure investment
needed (even without green targets and development goals)
2013 - 2030 McKinsey (2013)
1971
1973
1975
1977
1979
1981
1983
1985
1985
1987
1989
1991
1993
1995
1997
1999
2001
2003
2005
2007
2009

2. In
vest
men
t in
sust
aina
ble
urba
n in
frast
ruct
ure
20As a consequence, even less public mon-
ey might be available for municipal infrastruc-
ture in the future. In a 2009 worldwide survey of
public officials involved in infrastructure, more
than half of the respondents said that a “lack of
funding” was the biggest infrastructure issue.18
Standard & Poor’s estimates that the gap be-
tween infrastructure financing needs and what
the public sector can pay for could be USD 500
billion a year globally – provided public infra-
structure spending does not decrease further
in the future.19 Boston Consulting Group puts
the gap between demand and investment in in-
frastructure even higher, at over USD 1 trillion a
year worldwide between 2013 and 2030.20
Given this dearth of funding, it is per-
haps not surprising that most cities are falling
far short of their sustainability goals. For exam-
ple, British cities had met only 5% of their carbon
emission reduction targets by 2008, leaving 95%
to be achieved in the years to 2020.21 In Germany,
only one quarter of the cities that have adopted
emission reduction targets were on course to
meet them in 2010. Most of the successful cit-
ies were in the eastern part of Germany, which
implies that their emission reductions were
mainly due to the industrial decline that set in
after 1990.22
2.2 The investment case
With public sources severely constrained, pri-
vate investors are expected to finance a rising
share of the world’s infrastructure, including
what is needed to make cities low-carbon. Al-
ready in the past, the private sector accounted
for around two-thirds of infrastructure spend-
ing in Europe23, and this share is more likely to
rise than fall in the future. The World Bank reck-
ons that the private sector will have to finance
85% of the investment gap in sustainable infra-
structure.24
Today, the vast majority of private in-
vestment in infrastructure comes from the com-
panies that own and operate power stations, toll
roads or hospitals (often referred to as owner-
operated assets). Outside investors help to fi-
nance infrastructure mainly through investing
in such companies. However, utilities, construc-
tion groups and health care providers usually do
a myriad of other things apart from operating
infrastructure. Therefore, investors’ exposure to
infrastructure – and the specific benefits they
hope to gain from this asset class – can become
diluted.
Many investors are therefore looking
for more targeted and tailored ways of invest-
ing in infrastructure. There are a variety of ways
in which investors can put money into infra-
structure projects (see Table 3 for examples) but
broadly speaking, infrastructure investments
come in two forms, namely debt and equity.

Inve
stm
ent i
n gr
eene
r citi
es: M
ind
the
gap
21• Debt
Lending to infrastructure ventures often takes
the form of project finance. Project finance is a
type of financial contract in which the investors
gets repaid through the cash flow that is gener-
ated by a particular infrastructure asset, such
as the toll collected from a new road or the elec-
tricity sold by a power station. Project finance
was traditionally the domain of banks and it can
also take place alongside governments in a PPP
framework (see below). A smaller share of infra-
structure lending comes in the form of conces-
sionary loans from governments or their public
lenders.
Beyond project finance, investors can
acquire the debt issued by infrastructure ven-
tures outright, for example through buying
infrastructure bonds, or they can invest in in-
frastructure debt funds. These markets are still
developing.
• Equity
Investors can buy infrastructure ventures such
as solar power stations or water works outright.
They then keep these assets on their balance
sheet, although they usually do not operate
them themselves. However, only a very limited
number of investors has the financial muscle
and the in-house expertise to invest in infra-
structure ventures directly.
Some infrastructure projects are big
enough to get financing through initial public
offerings on stockmarkets. Investors can then
buy their equity outright. Equity investment can
also take place through specialized infrastruc-
ture equity funds. For investors, such funds have
the advantage that the projects are chosen by
experienced professionals and that they can buy
into a portfolio of infrastructure assets, which
can help them to manage risk.
If the infrastructure fund is listed on an
exchange, the shares are also tradable. However,
the value of listed infrastructure funds often
depends on broader stockmarket movements,
which makes them less suitable for investors
who want to diversify their portfolio with the
aim of smoothing the impact of market move-
ments. Unlisted infrastructure funds are not
subject to market movements but they tend to
be illiquid and often incur high fees.

22 Table 3: Risk-return profiles of infrastructure investments
Equity Debt
Direct investment Funds Direct investment Invest-ment
funds (in-frastruc-
ture bond or loan funds)
SharesProject invest-ment
Infra-structure
equity funds
Unlisted infrastruc-ture funds
Infrastruc-ture bonds
Infrastruc-ture loans
Type of assets
Shares in a company
Physical object
Shares in a company
Shares in an
existing company
Security Loan Security
Invest-ment
volume
Minimum 1 share
Typically over
EUR 100 million
Minimum 1 share
Typically more than
EUR 5-10 million
Minimum 1 security n/a Minimum
1 share
Market depth
Broad availabil-
ity
Limited availabil-ity (since
2001 in Europe incl. UK
only about 1,000 PPP-projects)
Broad availabil-
ity
Limited availabil-
ity (globally
350 funds, excl.
closed German
funds, plus 10 FOF)
Limited availabil-
ity
Broad availabil-
ity
Limited availabil-
ity
Leverage No lever-age
Typically 60-70%
leverage for project financing, up to 90% for PPPs
No lever-age
Typically 70-80% for the fund
Typically no lever-
age for funds
No lever-age
Typically no lever-
age
Time horizon
Short- to long-term Long-term Short- to
long-term
Medium- to long-
term
Short- to long-term
Medium- to long-
term
Short- to long-term
Yield ex-pectation
(p.a.)
5-9%, depending on region/
project
Early stage 10-15%,
later 7-9%
5-9%, depending on region/
project
8-14% for a diversified
portfolio
Gov.: 3-7% Corp.: 4-10%
2-5% depend-
ing on the rating
6-10%, depending on region
Know-how require-
ments
Stock invest-
ment and sector-specific
know-how
Very high
Stock invest-
ment and sector-specific
know-how
Very high
Bond invest-
ment and sector-specific
know-how
Expertise in credit markets
Bond invest-
ment and sector-specific
know-how
Source: Steinbeis Research Center for Financial Services (2012)Note: The table is for illustration purposes only and not exhaustive. Numbers with regard to investment volumes, leverage, projects and yield expectations vary in practice.

Inve
stm
ent i
n gr
eene
r citi
es: M
ind
the
gap
23Increasingly, infrastructure projects
combine public and private capital. The most
widely used frameworks are public-private part-
nerships, or PPPs. A PPP is a medium to long-
term collaboration between a government body
and private companies to finance, build, and in
some cases operate an infrastructure project
such as a road, school or hospital. PPPs can take
a variety of forms and involve both equity and
debt investment. Usually, the private investor
provides the capital and takes over some of the
risks of the project, for example the construc-
tion and performance risk. In return, the inves-
tor receives a share of the operating profit. After
a fixed period of, say, 20 to 30 years, ownership of
the asset might revert to the public sector.
PPPs were pioneered by the UK in the
1990s and are now used in about half of the
world’s countries. Nevertheless, many private
investors shy away from them because they
find them slow, complicated and bureaucratic.
Some governments have had mixed experi-
ence with PPPs that had large cost-overruns or
performed poorly. On the other hand, investors
have become cautious after some governments
renegotiated PPP contracts half-way through the
projects lifespan. In many places, there are now
efforts to redesign PPPs to make them more at-
tractive to both governments and investors.
Although there is some disagreement
whether infrastructure can be treated as a dis-
tinct asset class, infrastructure projects tend to
have certain features in common that can make
them attractive to private investors:
• Potential to increase risk-adjusted returns
Infrastructure investments can in principle offer
good returns with comparatively low variability
(Sharpe ratios25) and low default risk.26 Infra-
structure assets often benefit from a so-called
illiquidity premium, which arises from the fact
that for most infrastructure assets there is no
liquid secondary market. Investors are required
to commit large sums for a long time, without
being able to exit the project prematurely at ac-
ceptable costs. This means that infrastructure
investments are less vulnerable to hard-to-pre-
dict market risks than other assets; instead, op-
erational and general macro-economic and po-
litical risks dominate, which are, under certain
circumstances, better manageable.
Many traditional infrastructure assets,
such as power stations or motorways, have a
quasi-monopoly over the service they supply.
The profits that private investors make from
building or operating them is then usually regu-
lated and should therefore be predictable. Other
infrastructure projects, such as renewable en-
ergy projects, receive public support in the form
of tax incentives or subsidies, which can further
increase post-tax returns for private investors.
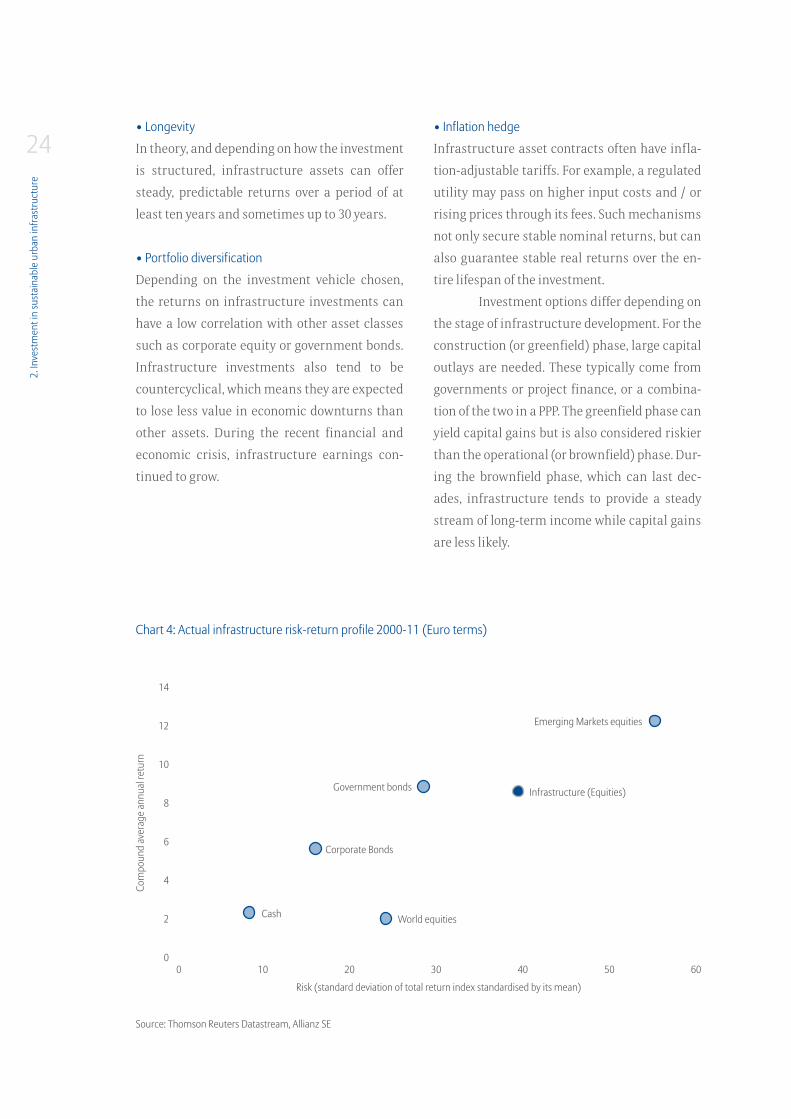
Given the diversity of infrastructure
investments, it is not possible to make gener-
alizations about their historical performance.
But infrastructure equities have performed well
relative to other equities on a risk-adjusted to-
tal return basis, as shown in Chart 4. And some
unlisted infrastructure funds have significantly
outperformed bonds and slightly outperformed
equities.27
Equity Debt
Direct investment Funds Direct investment Invest-ment
funds (in-frastruc-
ture bond or loan funds)
SharesProject invest-ment
Infra-structure
equity funds
Unlisted infrastruc-ture funds
Infrastruc-ture bonds
Infrastruc-ture loans
Type of assets
Shares in a company
Physical object
Shares in a company
Shares in an
existing company
Security Loan Security
Invest-ment
volume
Minimum 1 share
Typically over
EUR 100 million
Minimum 1 share
Typically more than
EUR 5-10 million
Minimum 1 security n/a Minimum
1 share
Market depth
Broad availabil-
ity
Limited availabil-ity (since
2001 in Europe incl. UK
only about 1,000 PPP-projects)
Broad availabil-
ity
Limited availabil-
ity (globally
350 funds, excl.
closed German
funds, plus 10 FOF)
Limited availabil-
ity
Broad availabil-
ity
Limited availabil-
ity
Leverage No lever-age
Typically 60-70%
leverage for project financing, up to 90% for PPPs
No lever-age
Typically 70-80% for the fund
Typically no lever-
age for funds
No lever-age
Typically no lever-
age
Time horizon
Short- to long-term Long-term Short- to
long-term
Medium- to long-
term
Short- to long-term
Medium- to long-
term
Short- to long-term
Yield ex-pectation
(p.a.)
5-9%, depending on region/
project
Early stage 10-15%,
later 7-9%
5-9%, depending on region/
project
8-14% for a diversified
portfolio
Gov.: 3-7% Corp.: 4-10%
2-5% depend-
ing on the rating
6-10%, depending on region
Know-how require-
ments
Stock invest-
ment and sector-specific
know-how
Very high
Stock invest-
ment and sector-specific
know-how
Very high
Bond invest-
ment and sector-specific
know-how
Expertise in credit markets
Bond invest-
ment and sector-specific
know-how
2. In
vest
men
t in
sust
aina
ble
urba
n in
frast
ruct
ure
24• Longevity
In theory, and depending on how the investment
is structured, infrastructure assets can offer
steady, predictable returns over a period of at
least ten years and sometimes up to 30 years.
• Portfolio diversification
Depending on the investment vehicle chosen,
the returns on infrastructure investments can
have a low correlation with other asset classes
such as corporate equity or government bonds.
Infrastructure investments also tend to be
countercyclical, which means they are expected
to lose less value in economic downturns than
other assets. During the recent financial and
economic crisis, infrastructure earnings con-
tinued to grow.
• Inflation hedge
Infrastructure asset contracts often have infla-
tion-adjustable tariffs. For example, a regulated
utility may pass on higher input costs and / or
rising prices through its fees. Such mechanisms
not only secure stable nominal returns, but can
also guarantee stable real returns over the en-
tire lifespan of the investment.
Investment options differ depending on
the stage of infrastructure development. For the
construction (or greenfield) phase, large capital
outlays are needed. These typically come from
governments or project finance, or a combina-
tion of the two in a PPP. The greenfield phase can
yield capital gains but is also considered riskier
than the operational (or brownfield) phase. Dur-
ing the brownfield phase, which can last dec-
ades, infrastructure tends to provide a steady
stream of long-term income while capital gains
are less likely.
Chart 4: Actual infrastructure risk-return profile 2000-11 (Euro terms)
Com
poun
d av
erag
e an
nual
retu
rn
Risk (standard deviation of total return index standardised by its mean)
Source: Thomson Reuters Datastream, Allianz SE
Government bonds
Corporate Bonds
Infrastructure (Equities)
Emerging Markets equities
World equitiesCash
14
12
10
8
6
4
2
00 10 20 30 40 50 60

Inve
stm
ent i
n gr
eene
r citi
es: M
ind
the
gap
25Investment options also differ depend-
ing on the sector. The markets for private invest-
ments in mobility and transport, both key to
urban environmental sustainability, have been
functioning for a while, both for greenfield and
brownfield investments. Private investors have
owned and operated airports, toll roads, ports
and railways for decades. Going forward, partic-
ipation of private operators in public transport
will increase further, as will competition from
new, private entrants.
The same can be said of energy-related
investments. Corporate investments by private,
semi-private or public utilities have provided the
bulk of today’s energy infrastructure. In more re-
cent years, energy finance has changed, as many
governments have provided incentives, such as
feed-in tariffs28, to get private investors engaged
in renewable energy projects. Such subsidies are
not the only reason why renewable energy can
offer good investment opportunities with rela-
tively high long-term certainty – provided the
policy and regulatory environment is supportive
and predictable.29 Investment in clean energy
rose from USD 40 billion in 2004 to a peak of USD
279 billion in 2011 (although it then fell slightly
in 2012).30
While transport and energy will contin-
ue to attract private investment, other areas of
sustainable infrastructure, for example energy
efficient buildings, are lagging behind (of which
more below).
2.3 What private investors are doingThe financial crisis has not only constrained
public investment, it has also hit private sector
infrastructure financing. Banks, which have
historically provided most project finance, have
cut back their lending as they have sought to re-
pair balance sheets, cope with new regulation
and adjust to a more uncertain economic envi-
ronment. Loans for project finance fell in most
parts of the world during the financial crisis,
but most precipitously in Europe, where they
dropped by 38% in 2012 alone.31 Some of Europe’s
most active project finance banks have either
gone bankrupt or they have largely withdrawn
from that market, taking with them their expe-
rience and inhouse expertise in this area. Look-
ing ahead, Basel III requirements for banks to
have sufficient liquidity levels and to hold more
capital against long-term debt (such as project
finance) make it unlikely that they will return to
predominance in infrastructure finance.32

2. In
vest
men
t in
sust
aina
ble
urba
n in
frast
ruct
ure
26Therefore, many people are now looking
to institutional investors, notably pension funds
and insurance companies but also mutual
funds and sovereign wealth funds, to help bridge
the infrastructure investment gap. Of course,
institutional investors cannot cover the world’s
infrastructure finance needs. But, in theory at
least, they should be a in a good position to make
a valuable contribution:
• Institutional investors in the OECD coun-
tries alone have over USD 70 trillion in as-
sets under management.33 This sum is likely
to grow as populations age and countries
supplement pay-as-you-go pension systems
with fully funded pension solutions. Since
institutional investors need to diversify their
investment portfolios, only a fraction of their
assets under management would, in princi-
ple, be available for infrastructure. Never-
theless, they could cover a substantial part
of sustainable infrastructure investment
needs.34
• Both pension funds and life insurers need
long-term stable investments to match the
long-term liabilities they have vis-à-vis their
clients (this is called asset/liability match-
ing). The stable long-term cash flows offered
by infrastructure could be a good match for
the financial promises (in terms of fixed re-
turns or annuities) that insurers and pension
funds give to their clients.
• Insurersinparticularoftenhavegoodknowl-
edge of the risks associated with infrastruc-
ture projects because they also insure these
projects and know their lifecycles.
• Atpresent,lowinterestratesandvolatileeq-
uity markets are encouraging institutional
investors to diversify their portfolios away
from their traditional investments in bonds
and shares.
Although there are no consistent and
comparable data for institutional investment in
infrastructure, it is clear that investors’ interest in
this asset class has been growing in recent years.
In a 2013 survey of European financial institu-
tions involved in infrastructure finance, 84% of
the respondents confirmed that insurers and
pension funds are currently “extremely inter-
ested” in infrastructure investments.35
Anecdotal evidence seems to corrobo-
rate such surveys. Among the insurers, for ex-
ample, Swiss Re in 2012 earmarked USD 500
million for Northern European infrastructure
opportunities identified by the Macquarie In-
frastructure Debt Investment Solutions plat-
form.36 Aviva has committed 1.5% of its assets
to infrastructure investments.37 Allianz has to
date invested more than EUR 1.7 billion in re-
newable energy projects; and in January 2013,
Allianz launched an infrastructure debt fund in
the UK with initial planned assets of GBP 1 bil-
lion. In France, AXA in June 2013 announced that
it would invest EUR 10 billion in infrastructure
over the next five year.38
Inve
stm
ent i
n gr
eene
r citi
es: M
ind
the
gap
27Among pension funds, the Australian
superannuation funds and Canadian pension
funds were the first to raise significantly their
infrastructure exposure. For example, the On-
tario Municipal Employees Retirement Scheme
(OMERS) had almost 15% of its assets in infra-
structure in 2012 and was planning to increase
that share to 20%.39 AustralianSuper aimed
for 14% of its assets in infrastructure in 2013.40
Funds in other countries have been following,
albeit often from a low base. CalPERS, one of the
largest pension funds in the US, increased its
target allocation to infrastructure from 2% to 3%
of total plan assets in 2012.41 In the UK, the Uni-
versities Superannuation Scheme (USS, Britain’s
second largest) increased its target allocation to
7%, earmarking GBP 2 billion for infrastructure
in the three years following 2013.42
On the whole, however, institutional
investors’ engagement in infrastructure has so
far remained limited – although tracking down
the exact numbers is difficult. In the European
Union, dedicated infrastructure funds had at-
tracted 1-3% of pension investment funds’ asset
allocation in 2011, according to one study.43 The
numbers are even smaller when it comes to sus-
tainable infrastructure. Generally, institutional
investors have so far made only a very small con-
tribution to climate finance.44
2.4 Why is investment fall-ing short of potential? Why is there such a mismatch between demand
for new infrastructure and actual private invest-
ment? The financial crisis is one major reason,
as explained above. But there are also structural
challenges that are holding back potential in-
vestors. Many investors appear unconvinced
that the risks and costs involved in infrastruc-
ture investments are sufficiently compensated
through the returns available.
2.4.1 Policies and politicsOne set of obstacles that is facing institutional
investors is related to the fact that the profitabil-
ity of infrastructure investments – more than
that of other assets – is determined by their po-
litical and economic environment.
• Political risk
The profitability of many infrastructure projects
depends on governments honoring previously
made commitments – often over very long peri-
ods of time. Such commitments could be to al-
low the investor to collect a certain amount of
tolls or tariffs, or to keep the regulatory frame-
work or market structure unchanged. Circum-
stances, however, might change: new technol-
ogy becomes available; public opposition to an
infrastructure project rises; or new interna-
tional commitments require the liberalization
of previously protected markets. Governments
then often react with policy changes that affect
investor interests.
2. In
vest
men
t in
sust
aina
ble
urba
n in
frast
ruct
ure
28What is more, government incentives of-
ten depend on the electoral cycle and other polit-
ical considerations.45 For example, a government
might be tempted to lower usage fees as part of
its social policy program; it might decide that
a previously negotiated concession was overly
generous to the investor; or a new government
might simply not feel obliged to honor commit-
ments made by its predecessor. Politics can thus
undermine an investor’s ability to recoup the
capital he has invested in water supplies, energy
provision or roads.
For example, in December 2012, the UK
government re-evaluated the previous adminis-
tration’s use of “private finance initiatives” (PFI,
a type of PPP) and renegotiated the terms of pre-
vious deals in order to save some GBP 2.5 billion
for taxpayers. Portugal in 2011 started renegoti-
ating dozens of PPP contracts, especially in the
transport sector, triggering a wave of compensa-
tion claims.
The temptation of governments to re-
define the terms of a project, and to cap private
profits earned through the provision of “public”
services, means that infrastructure investments
have potentially many downside risks but very
little upside risk for private investors.
• Externalities
Sustainable infrastructure tends to depend even
more on government action than conventional
infrastructure. The reason is that so-called ex-
ternalities (for example the pollution caused by
a coal-fired power plant) are not usually priced
into conventional infrastructure, which then
looks relatively more profitable than sustain-
able infrastructure. Government action is often
needed to level the playing field between sus-
tainable and conventional infrastructure. This
can be done through laws, taxes, subsidies or
market mechanisms, such as emissions trading
schemes. However, governments might later de-
cide to alter rules and subsidy regimes because
of fiscal considerations or technological change,
rendering the initial private investment unprof-
itable. For example, the Spanish government in
2011 retroactively reduced subsidies for solar
power installations, as did Bulgaria in 2012.
• Legal framework
Laws and regulations – local, national or supra-
national – can impede or even prevent private fi-
nance flowing into infrastructure. In the US, for
example, tax regulation makes public financing
of infrastructure more competitive than private
funding. Furthermore, US federal law prohibits
toll collection on interstate highways, which
complicates the establishment of public-private
partnerships that could be attractive for private
investors.46
Another example is EU financial regula-
tion that discourages long-term investment. Sol-
vency II (the EU’s directive that sets the amount
of capital that insurers must hold to mitigate
risk, due to come into force in 2016) and Basel
III (stricter rules on bank capital and liquidity)
impose onerous capital requirements for invest-
ments in infrastructure and renewable energy.
Some regulations have unintended consequenc-
es for investors. For instance, the EU’s rules on
“unbundling” of energy generation, transport
and distribution are designed to foster compe-
tition in previously monopolistic markets for
power and gas. But they can also make it harder
for institutional investors to invest in different
segments of infrastructure at the same time.
Inve
stm
ent i
n gr
eene
r citi
es: M
ind
the
gap
29• Bureaucracy
Even when the policy framework is stable and fa-
vorable, the sheer complexity of regulation and
slow-moving bureaucratic procedures can be a
drawback for investors. In the UK, for instance, it
takes almost three years on average to conclude
a PFI tender.47 In Brazil, it can take five years to
secure the environmental licenses required for
large infrastructure projects.48 In India “regula-
tory hassles” associated with large infrastruc-
ture projects can be so burdensome that one
fund manager asks poignantly why private in-
vestors would bother with them at all.49
Investors also often struggle with pub-
lic administrations that lack the capabilities
needed for attracting private money for public
projects. In one survey, executives working for in-
frastructure companies said that an ineffective
public sector was the main obstacle for private
sector involvement in infrastructure.50 Some
governments have established national bodies
to facilitate such public-private partnerships,
like Partnerschaften Deutschland or Infrastruc-
ture UK. But at the local level, only very few city
officials have experience in working with private
institutional investors; in some cities civil serv-
ants may even harbor suspicions of doing so.
2.4.2 Matching funds and projects Another set of hurdles exists on the side of the
institutional investors themselves. Infrastruc-
ture projects are often very complex undertak-
ings. They are also illiquid and tend to require
large upfront payments, which means that in-
vestment mistakes can be expensive and hard to
undo. Many projects, in particular in the sustain-
able infrastructure sector, depend on new and
untested technologies, which can increase the
“hurdle rate” that investors consider before they
commit funds. Many infrastructure projects de-
pend on networks (such as power grids or road
networks) for their functioning and profitability,
so they cannot be evaluated on a stand-alone
basis.
In short, investing successfully in infra-
structure requires the kind of expertise and ex-
perience that can only be provided by a team of
dedicated professionals. Project finance banks
and some specialized funds have that expertise,
as do some very large institutional investors. But
most smaller financial institutions do not.
In a 2013 survey of German-based in-
stitutional investors, just 4% said that they had
“good knowledge” of the infrastructure sector.51
Another study reckons that only 150 institu-
tional investors worldwide are large enough to
warrant setting up teams for direct investment
in renewable energy.52 Some institutional inves-
tors are trying to overcome the lack of in-house
expertise by teaming up with others, or by “tag-
ging along” with a bigger investor that has more
experience and proficiency. For example, in 2013
ten UK pension funds came together to launch
the Pension Infrastructure Platform, which is
supposed to help them invest their money in
this new asset class more effectively.53

2. In
vest
men
t in
sust
aina
ble
urba
n in
frast
ruct
ure
30Even those institutions that have dedi-
cated teams for infrastructure or green invest-
ing can find it hard to find suitable projects. A
few very large projects have usually been over-
subscribed. Most smaller ones have struggled
to get funding. One reason is that the plethora
of projects that fall under the heading “infra-
structure” or “sustainable infrastructure” are
very diverse. They do not (yet) constitute a fully
distinct asset class for which regulators could
set standardized rules (for example for capital)
and to which investors could apply standardized
practices regarding asset allocation and risk
management. Often there are not sufficient data
on the performance of (unlisted) infrastructure
assets to allow investors to plan their asset al-
location with confidence.54
Another reason is that, in the eyes of
the institutional investors, smaller projects do
not warrant the effort that would be required
for finding, evaluating and monitoring them.
Most sustainable urban infrastructure projects
are small from an institutional investor point of
view.
Infrastructure or green investment
funds can bundle smaller investment projects
and thus make them more easily accessible for
institutional investors. However, such invest-
ment funds tend to seek high short-term returns
and therefore engage in practices, such as lever-
aging and churning their portfolio or reinvesting
cash flows instead of paying out dividends, that
undo some of the potential benefits that institu-
tional investors hope to gain from (sustainable)
infrastructure, including low risk, longevity and
predictable returns.55 Moreover, in one 2013 sur-
vey, over 70% of the institutional investors polled
took issue with the high management and per-
formance fees typically charged by infrastruc-
ture funds.56 While pooling of both projects and
investment funds will be necessary to attract
more institutional money into sustainable ur-
ban infrastructure, the conditions will have
to be tailored more specifically to the needs of
long-term investors.

Inve
stm
ent i
n gr
eene
r citi
es: M
ind
the
gap
312.4.3 The special case of energy ef-ficiencyIn this report on sustainable urban infrastruc-
ture, the issue of energy efficiency warrants
specific treatment. Residential and commercial
buildings alone contribute around 40% of the
greenhouse gas emissions of an average met-
ropolitan area. Research shows that cites could
most quickly reduce their carbon emissions by
renovating their housing stock57 and that the po-
tential for emissions reductions in public build-
ings ranges from one quarter in hospitals to over
half in schools.58
Although energy efficiency investments
are critical for climate policy, they tend to get lit-
tle public attention or political support. “Spend-
ing to save” is a tough investment proposition
at the best of times, but especially for the public
sector in times of stringent budget constraints.
With the exception of district heating and cogen-
eration59 – which can achieve significant energy
savings – most energy efficiency projects tend to
be small and often hard to sell. Politicians often
prefer to support (visible and popular) renew-
able energy projects, rather than the obscure
and hard-to-explain energy efficiency agenda.
While spending on the energy efficiency of a
big new development, such as London’s Olympic
Park, may have some public appeal, retrofitting
projects often do not.
So far, at least in Europe, most energy
efficiency financing is provided by state-owned
or sponsored financial institutions, such as KfW
Förderbank in Germany or the European Ener-
gy Efficiency Fund (EEEF)60, as well as by utility
companies under national programs. Private in-
vestors, meanwhile, face multiple challenges:
• Theinterestsofthevariousstakeholdersare
hard to align. In many cases the building’s
owner or landlord is supposed to pay for an
energy efficiency renovation; but it is the ten-
ant who reaps the benefits in terms of lower
electricity or gas bills, while the wider bene-
fits of lower emissions accrue to all the city’s
inhabitants or the whole global population.61
• Energyefficiencyinvestmentsdonotonlyin-
volve various stakeholders, they are also usu-
ally characterized by a large number of small
projects that are spread across many sectors
and technologies. They are difficult to scale
up without becoming prohibitively expen-
sive and complex.
• Energy efficiency investments tend to have
high upfront costs, their credit risk is hard to
assess because so many parties are involved,
and pay-back times can be very long.
• Thereisnoestablishedthird-partyfinancing
model, like there is for other infrastructure
sectors.
• Energy efficiency investments are often
amalgamated with financing for other ac-
tivities, for example when a utility issues a
bond for general corporate finance. Energy
efficiency is therefore not a separate invest-
ment with distinct risk and return charac-
teristics.

32 Box 1: The UK Green Deal
At the beginning of 2013, the British government launched the Green Deal to encourage businesses,
house owners and tenants to make energy efficiency improvements to their homes or premises.
Property owners and tenants can install new technologies without taking on a large loan. Unlike
conventional loans, the Green Deal loans stay with the building if the tenant or owner moves.
The new resident then assumes the debt. The loan is repaid through the energy savings generated
over a period of up to 25 years.
For Green Deal loans to work, the expected savings in energy costs have to equal or
outweigh the initial investment. Accredited Green Deal assessors evaluate the buildings to make
sure that only properties in which the finances add up are admitted to the scheme.
The loans can be used for the insulation of lofts, floors, walls and windows; metering and controls of
water, gas and power; and improvements to the heating and hot water system.
Green Deal Providers can be energy companies, consumer companies or specialized finance
providers. They may use funds from their retained earnings, raise them on capital markets or sell the
Green Deal Receivables to a third party financier. One financier is a consortium
supporting a new special purpose vehicle, the Green Deal Finance Company (TGDFC), which provides
finance to Green Deal Providers across the market. The British Department for Energy and
Climate helped TGDFC with a GBP 7 million implementation loan. As of 2013, however, take-up was
lower than the government had hoped for.
Sources: www.greendealinitiative.co.uk; Vaughan & Collinson (2014)
Inve
stm
ent i
n gr
eene
r citi
es: M
ind
the
gap
33Some countries have started address-
ing the investment gap in energy efficiency.
Germany in 2000 established the Deutsche En-
ergie Agentur (German Energy Agency), a public
agency with private-sector participation that
provides expertise, advice and support to mu-
nicipalities and private investors for projects
in energy efficiency.62 The UK in 2013 launched
the Green Deal to incentivize property owners
and tenants to make energy efficiency improve-
ments to their homes (see Box 1). The US State of
Vermont has achieved notable results through
a free-standing efficiency utility.63 The EU has
adopted several initiatives to prompt its mem-
ber states to do more to encourage energy sav-
ings and efficiency (see below). Nevertheless,
energy efficiency investments remain far below
what is needed – and even well below the sums
available to renewable energy. This underinvest-
ment is the main reason why the EU is likely to
miss its energy savings target of 20% by 2020 by
a wide margin.


3.
How to narrow the financing gap

3. H
ow to
nar
row
the
finan
cing
gap
36Private capital is urgently needed to help cities
manage their climate change challenges. Al-
though there are some encouraging signs that
institutional investors are becoming more en-
gaged in this sector, the financing gap remains
daunting. The policy and regulatory framework
needs to be more conducive for this gap to be
narrowed. With other investment opportuni-
ties looking lackluster, and cities’ need for green
infrastructure growing fast, now is the time to
begin a dialogue on how to facilitate greater
investment. We see scope for improvements at
several levels.
3.1 Local initiatives
Urban agglomerations will be the immediate
beneficiaries of improved infrastructure, and
there are good reasons to assume that they are
particularly well suited for driving the efforts
to attract more private finance into sustainable
infrastructure (see Box 2). Provided they have
the authority, municipal governments could
attract more private financing through adopt-
ing and publishing long-term infrastructure
and climate policy plans – and sticking to them
through the political cycle. Larger cities could set
up exchanges to match infrastructure projects
with financial backers, as Chicago has already
done with some success (see Box 3). Smaller ones
would benefit from regional, national or supra-
national institutions that help them find private
funding at acceptable terms. City officials could
also use such institutions (such as the “Green
Cities Platform” we propose below) to share their
experience with private infrastructure finance
and to collaborate on specific projects to attain
a scale that makes them attractive to private in-
vestors.

37Box 2: Why cities are key to attracting private finance into infrastructure
• Citiesandmunicipalitiesfeelthepressuresofageingorinadequateinfrastructure
more acutely than national politicians in far-away capitals. They may therefore be highly
motivated to attract additional sources of finance for improvements and renewal.
• Citiescanbemoredirectlyaccountableandlessbureaucraticthannationalgovernments.They
should be able to implement initiatives faster and more economically.
• Peoplelivingincitieshaveamoredirectconnectionto“their”roads,hospitalsandmetrolines
than to, say, overland gridlines, motorways or wind parks. This could have the following
implications:
a) greater acceptance of infrastructure construction (less NIMBYism)
b) broader application of the user-pays principle
c) deeper understanding of the benefits – in terms of efficiency and transparency –
that can stem from private sector involvement.
d) Potential for urban citizens to invest in local infrastructure.
• Mostcitiesaregrowing,someofthemveryfast.Thismeans:
a) up-front financing of infrastructure is even more important, as urban infrastructure
should be larger than current requirements – which in return puts excessive
strain on current budgets
b) the consequences are particularly severe if short-term budgetary considerations prevent
a much-needed expansion and improvement of infrastructure
c) a privately-funded shift of current expenditures to future users could be more bearable.
Source: Allianz SE research

38 Box 3: The Chicago Infrastructure Trust
In March 2012, the city of Chicago established the Chicago Infrastructure Trust (CIT). The CIT is an
exchange that matches public infrastructure projects and private investors.
The city is paying for the CIT’s USD 2.5 million running costs, while financial institutions, including
Macquarie Infrastructure and Real Assets, Ullico, Citibank and JPMorgan, have committed
to investing some USD 1.7 billion in the scheme.
According to initial plans, the CIT itself will provide some capital, bond financing and
grants as well as offering tax-exempt debt to attract more investment. Returns on investment could
vary from 3% on tax-exempt bonds to 8% for equity partners.
The city hopes to raise about USD 7 billion in total to finance improvements to streets, parks, water
and sanitation, schools, commuter rail and O’Hare airport. The private sector will
invest money in projects and receive returns via tolls, user fees, premium pricing or tax breaks.
The CIT’s first project is a USD 13 million investment to make 62 city buildings more energy-efficient
due to start in March 2014 (the scale of the project was reduced significantly from over
USD 100 million during the preparation phase). Other projects discussed in 2013 were the conversion
of some of Chicago’s 340,000 street lights to energy efficient lighting and replacing almost
4,000 city-owned cars and trucks with gas-driven vehicles.
Sources: www.chicagoinfrastructure.org; The Economist (2012a); Ruthhard (2014)

Inve
stm
ent i
n gr
eene
r citi
es: M
ind
the
gap
39City governments need to redesign their PPPs
and usage tariffs in such a way as to attract pri-
vate finance while at the same time providing
incentives for consumers to save resources. At
present, most private concession operators re-
ceive profits in the form of usage fees, and hence
it is in their interest to maintain or increase us-
age levels. For example, a privately run water
provider has little incentive to conserve water
since this reduces income and makes it harder
to recoup the initial investment. Cities could, for
example, use mixed payment systems in which
users pay usage fees to operators while taxes
cover public goods such as the reduction of wa-
ter use and the prevention of leaks.64
3.2 National policies
Often policy at the national level matters as
much, if not more, for local investment condi-
tions than action at the municipal level. The
national government can provide a framework
for pro-green investment policies that benefits
all cities. On the broadest level, governments
can help to level the playing field between sus-
tainable and conventional investments by mak-
ing sure that investors account for externalities
such as climate change from emissions. This can
be done, for example, through putting a price
on carbon, either through emissions trading or
taxation. Fuel taxes can encourage the use of
public or emissions-free private transport, while
energy or carbon taxes can encourage a switch
to renewable energy as well as energy savings.
Many countries are seeking to adopt a more
holistic approach to sustainable infrastructure
investment. For example, the British National
Infrastructure Plan, first published in 2010 and
since updated annually, aims to encourage in-
vestment in existing and new infrastructure,
also with the aim of fulfilling the UK’s climate
change objective.65

3. H
ow to
nar
row
the
finan
cing
gap
40Governments could redesign the na-
tional legal frameworks for PPPs, to make them
more attractive for private investors. They could,
for example, reduce the complexity of tendering
processes and involve private investors more
deeply in the set-up of PPP projects by allowing
them to identify suitable projects.66 Looking for-
ward, governments should explore the use of al-
ternatives to the traditional PPP model, such as
the “regulatory asset base” model (RAB, a type of
contract that guarantees private investors their
capital in, say, a utility while also balancing the
interests of consumers and public policy) and
more sophisticated risk-sharing models.
However, one of the biggest hurdles to
institutional investment in sustainable urban
infrastructure is that such projects tend to be
small, sporadic and spread across various sec-
tors and locations. To open this entire sector to
private capital, a new approach beyond project-
related public-private partnerships is needed.
Both municipalities and private investors would
benefit hugely from an institution that can ag-
gregate projects, match investment demand and
supply and provide knowledge-based advice.
Governments should therefore estab-
lish national “Green Cities Platforms”. These
would be one-stop shops with the sole task of at-
tracting private finance into sustainable urban
infrastructure. Semi-public institutions might
work best, combining government support with
private-sector participation (perhaps fee-based)
and the technical and financial know-how that
some private investors can bring.
In the first stage, the Green Cities Plat-
form would collect and disseminate data on
sustainable urban infrastructure, provide con-
sultancy services and be a forum for knowl-
edge sharing. It would intermediate between
city officials, many of whom have only limited
experience with private finance, and potential
investors. It would thus foster a more focused
and effective dialogue between the public and
the private sector than can be achieved through
sporadic conferences or project-based coopera-
tion. The Platform could help to design public
guarantees for investment projects that require
them. City officials could use the new Platform
to exchange experience and best practice among
themselves with regard to sustainability plan-
ning, energy efficiency, PPPs and risk sharing.
In the next step, the Green Cities Plat-
form would act as an aggregator by packaging,
standardizing, marketing and selling urban in-
frastructure investments to the private sector,
and handling their administration. Questions of
which cities and projects could participate and
who is liable for the jointly issued debt would
have to be answered beforehand.67 By consolidat-
ing the sellers from different municipalities and
departments, the Green Cities Platform would
help to streamline processes, reduce transac-
tion costs and develop economies of scale.
Once the Green Cities Platform has
reached a critical size, it could perhaps also
start raising capital in the markets to co-invest
in sustainable urban infrastructure projects.
Governments could make such an expansion of
mandate dependent on the availability and ac-
tivities of national or regional development and
infrastructure banks. In a final stage, the Green
Cities Platform could seek to sell sustainable
urban infrastructure investments also to retail
investors.

Inve
stm
ent i
n gr
eene
r citi
es: M
ind
the
gap
413.3 The European framework The natural locus of measures to stimulate in-
vestments is the local or national level. However,
policy developments at the international or su-
pranational level also determine whether in-
stitutional investors find urban infrastructure
attractive or not. Nowhere is this truer than in
Europe, where environmental targets, market
structures and financing conditions are increas-
ingly determined by EU directives and policies.
The EU member states agree the broad
framework for their climate change policies
at the EU level. The EU has firm targets for the
use of renewables, CO2 emissions and energy
savings to 2020 and, at the time of writing, was
discussing a 2030 target of reducing CO2 by 40%
compared with 1990 levels. Beyond 2030, there
is only a general commitment to reduce carbon
emissions by 85-90 % by 2050. Since infrastruc-
ture investment horizons are often measured
in decades, the absence of binding longer-term
targets leaves potential investors with a degree
of uncertainty.
The EU’s key instrument for combatting
climate change is supposed to be the Emission
Trading System (ETS).68 The price for emitting a
ton of carbon fell from around EUR 30 in 2008 to
a low of EUR 3 in early 2013 and by the start of
2014 had recovered only modestly, to EUR 7 – a
level that is inadequate for encouraging invest-
ment in energy savings or a widespread switch
away from fossil fuels and polluting industries.
In November 2013, EU governments agreed to re-
duce the number of permits that will be issued
over coming years in an attempt to prop up the
carbon price. But more wide-ranging proposals
on how to fix the system are still under discus-
sion. Progress is needed here to increase the rel-
ative attractiveness of sustainable investments.
More specific questions of urban policy
and planning have been mainly left to the mem-
ber states under the EU principle of subsidiarity.
The EU has launched some urban policy ini-
tiatives under its existing competences, such as
environmental or regional policy, but there is no
EU-level legal or institutional framework for ur-
ban planning or investment. What programs did
exist were aimed more at urban renewal, sup-
port for the local economy or reducing inner-city
poverty than fighting climate change.
More recently, the EU has launched a
couple of policy initiatives designed specifically
to make European cities greener. The JESSICA
program seeks to leverage the EU Structural
Funds to attract additional resources into green
urban infrastructure (See Box 4) while the Eu-
ropean Innovation Partnership on Smart Cities
and Communities (EIP-SCC) brings together cit-
ies, industry and civil society to produce ideas
for better urban planning, innovation and en-
ergy efficiency.

42 Box 4: The EU’s JESSICA program
Joint European Support for Sustainable Investment in City Areas
JESSICA was set up as cooperation between the European Commission and the European
Investment Bank (EIB) for the use of EU Structural Funds (grants from the EU budget for regional
development in EU countries) for the 2007-13 budget period.
EU countries can allocate money from the Structural Funds into Urban Development Funds
(sometimes via holding funds) and then use it for public-private partnerships and other projects that
are part of an integrated plan for sustainable urban development. One example of a
JESSICA supported project is the London Energy Efficiency Fund (LEEF), with GBP 100 million capital
to be fully invested until 2015.
JESSICA is supposed to leverage Structural Fund allocation through private-sector capital while also
resorting to the expertise of private investors in project management. The capital can
be invested in form of equity, loans and/or guarantees. Project returns are supposed to be reinvested
in urban development.
Sources: EIB (2008), European Commission (2013c), LEEF (2013)

Inve
stm
ent i
n gr
eene
r citi
es: M
ind
the
gap
43The European Investment Bank, the EU’s
main public lender, has billions of euros avail-
able for infrastructure development. However,
since the EIB operates on the basis of EU trea-
ties and within the confines of EU policy it has,
until recently, not had a mandate to lend to ur-
ban infrastructure projects. Since 2008, the EIB’s
Sustainable Communities concept has provided
a basis for targeted investments in sustain-
able urban infrastructure, although the overall
share of EIB investments in urban infrastruc-
ture projects remains small. Through its co-in-
vestments and guarantees, the EIB could make
a significant contribution to the development
of a market for sustainable urban infrastruc-
ture investments in the future. The EU’s new
Project Bonds could also be harnessed for this
purpose.69 At present, however, both the Project
Bond pilot phase and the European Commis-
sion’s EUR 30 billion “Connecting Europe” infra-
structure facility are focused on cross-border
infrastructure for transport and energy as well
as broadband provision. In 2014, the European
Commission was discussing the possibility of
expanding the Project Bond initiative to smaller,
local infrastructure projects.
To address the gap in energy efficiency
financing, the EU in 2006 adopted a directive on
Energy Performance Contracting (EPC), a type
of debt contract that allows private investors in
energy efficiency projects to be recompensed
through the energy efficiency savings achieved.
EPC spread only slowly in the EU countries, and
various EU countries implemented and inter-
preted the directive differently. In 2010, the EU
added the Energy Performance of Buildings
directive, and in 2012 the EU adopted a more
ambitious package in the shape of the Energy
Efficiency directive, which now obliges member
countries to improve policy frameworks and
financing opportunities for energy savings by
mid-2014 and to renovate 3% of the public hous-
ing stock.70 The European Commission, together
with the European Investment Bank, has also
launched a campaign to support the take-up of
EPC across Europe.
Beyond climate change and investment
policies, a large number of EU directives and
policies affect the attractiveness of sustainable
urban infrastructure. In March 2013, the Euro-
pean Commission published a Green Book on
long-term investment in Europe, which is sup-
posed to help define a more favorable framework
for infrastructure and green investments.71 The
Commission might want to follow this up with
an audit of the EU rules and regulations that
matter specifically for sustainable infrastruc-
ture in urban areas. It should then issue recom-
mendations about which EU directives need to
be abolished or modified and in which areas
there is a need for new legislation to improve the
investment environment for sustainable city in-
frastructure in EU countries.

3. H
ow to
nar
row
the
finan
cing
gap
44 3.4 What investors can do
Of course, it is not the sole responsibility of
governments to tackle the investment gap in
sustainable infrastructure; private sector inves-
tors have their role to play. The infrastructure
investment market is still heavily fragmented.
Most investors are too small to invest directly
in infrastructure – or to be advocates for im-
proved investment conditions at the national or
European level. Smaller institutional investors
should therefore be active participants in efforts
to pool resources.
If governments decide to establish
Green Cities Platforms, private investors should
support and use them so that they quickly reach
a critical size. Private investors could use such
platforms to exchange experience and knowl-
edge with regard to investments in sustainable
urban infrastructure. They could also co-oper-
ate to help develop new financial products, in
particular to facilitate public-private co-invest-
ment.
New financing instruments are urgently
needed to encourage private funding of energy
efficiency projects. At present, private investors
find that the disadvantages of most energy ef-
ficiency investment projects – small size, diffi-
cult policy and regulatory environments, unat-
tractive financial structure – tend to outweigh
the potential benefits. Moreover, while there is
already a range of distinct funding vehicles for
renewables and infrastructure, there are hardly
any funds focused purely on energy efficiency.72
New structures are needed to make sure that the
returns from energy efficiency investments flow
back to the investor (See Box 5 for examples).
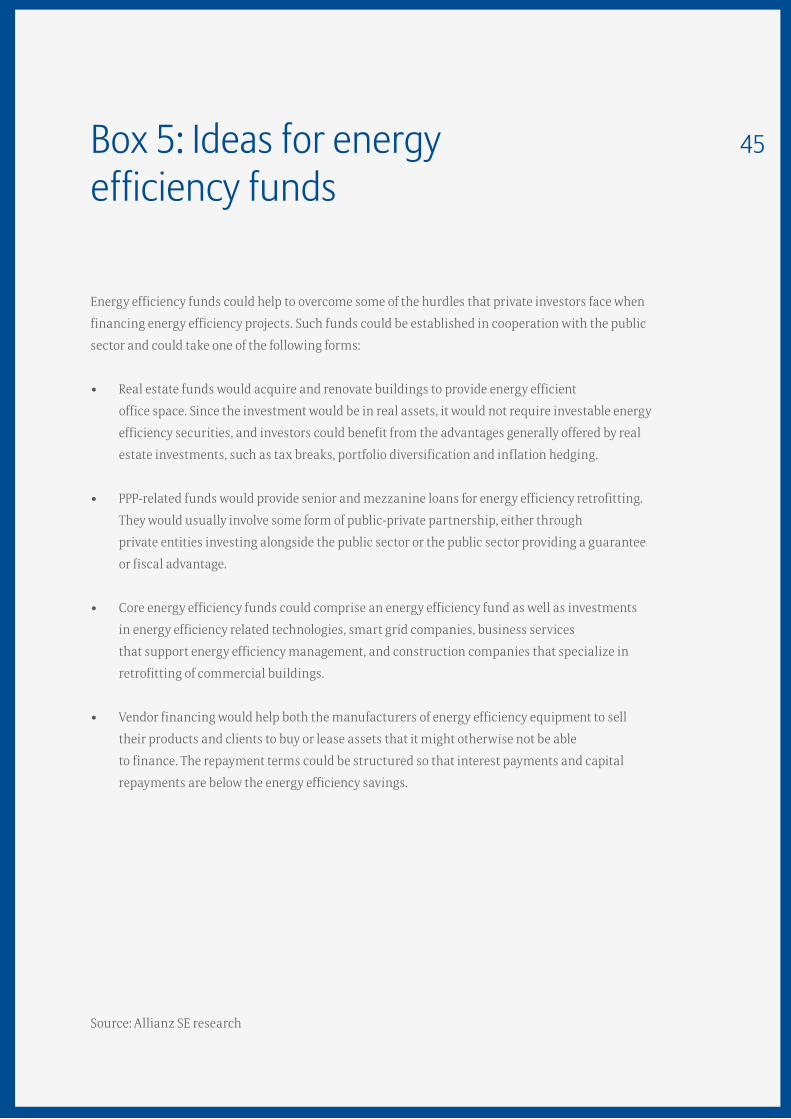
45Box 5: Ideas for energy efficiency funds
Energy efficiency funds could help to overcome some of the hurdles that private investors face when
financing energy efficiency projects. Such funds could be established in cooperation with the public
sector and could take one of the following forms:
• Realestatefundswouldacquireandrenovatebuildingstoprovideenergyefficient
office space. Since the investment would be in real assets, it would not require investable energy
efficiency securities, and investors could benefit from the advantages generally offered by real
estate investments, such as tax breaks, portfolio diversification and inflation hedging.
• PPP-relatedfundswouldprovideseniorandmezzanineloansforenergyefficiencyretrofitting.
They would usually involve some form of public-private partnership, either through
private entities investing alongside the public sector or the public sector providing a guarantee
or fiscal advantage.
• Coreenergyefficiencyfundscouldcompriseanenergyefficiencyfundaswellasinvestments
in energy efficiency related technologies, smart grid companies, business services
that support energy efficiency management, and construction companies that specialize in
retrofitting of commercial buildings.
• Vendorfinancingwouldhelpboththemanufacturersofenergyefficiencyequipmenttosell
their products and clients to buy or lease assets that it might otherwise not be able
to finance. The repayment terms could be structured so that interest payments and capital
repayments are below the energy efficiency savings.
Source: Allianz SE research

46 Table 4: Ideas for greener cities
City governments
• Adopttransparentandreliablelong-terminfrastructure and environmental plans• Setuplocalexchangestopairprojectsandpotentialinvestors• Re-designPPPsandusagetariffstodiscourageresource consumption
National governments
• EstablishaGreenCitiesPlatformtopackage,marketandsell sustainable urban infrastructure projects• Re-evaluatetheinvestmentframeworkwithaparticular focus on attracting private finance to sustainable urban infrastructure, including improvements to PPP frameworks• Usetaxationoremissionstradingtocreatealevelplayingfield for green and non-green projects
The EU
• Helptoprovidelong-termcertaintyforinvestors,forexample by clarifying climate change targets beyond 2030 and fixing flaws in the ETS• ConductanauditofEUrulesandpoliciesthataffectprivate financing of climate-friendly urban infrastructure; modify those that impede long-term investment (including capital requirements for banks and insurers) • Harnessexistingpolicies,includingProjectBonds,tosupport investment in sustainable urban infrastructure
Private investors
• SupportanduseGreenCitiesPlatformsiftheseareestablished• Exchangeexpertiseandexperienceonsustainableurban infrastructure • Explorenewfinancingvehicles,inparticulartofacilitate public-private co-investments• Conductadialogueontheestablishmentofenergyefficiency pilot funds

Inve
stm
ent i
n gr
eene
r citi
es: M
ind
the
gap
47
City governments
• Adopttransparentandreliablelong-terminfrastructure and environmental plans• Setuplocalexchangestopairprojectsandpotentialinvestors• Re-designPPPsandusagetariffstodiscourageresource consumption
National governments
• EstablishaGreenCitiesPlatformtopackage,marketandsell sustainable urban infrastructure projects• Re-evaluatetheinvestmentframeworkwithaparticular focus on attracting private finance to sustainable urban infrastructure, including improvements to PPP frameworks• Usetaxationoremissionstradingtocreatealevelplayingfield for green and non-green projects
The EU
• Helptoprovidelong-termcertaintyforinvestors,forexample by clarifying climate change targets beyond 2030 and fixing flaws in the ETS• ConductanauditofEUrulesandpoliciesthataffectprivate financing of climate-friendly urban infrastructure; modify those that impede long-term investment (including capital requirements for banks and insurers) • Harnessexistingpolicies,includingProjectBonds,tosupport investment in sustainable urban infrastructure
Private investors
• SupportanduseGreenCitiesPlatformsiftheseareestablished• Exchangeexpertiseandexperienceonsustainableurban infrastructure • Explorenewfinancingvehicles,inparticulartofacilitate public-private co-investments• Conductadialogueontheestablishmentofenergyefficiency pilot funds


4.
Where next?

4. W
here
nex
t?
50Urbanization and climate change are inextrica-
bly linked. More than 50% of the world’s popula-
tion already lives in urban areas, and that share
is set to rise to around 70% by 2050. Cities gener-
ate most of the world’s GDP, and global growth
will continue to depend on them. But cities also
account for around 70% of global greenhouse gas
emissions. They are therefore the natural start-
ing-point for establishing effective emissions
reduction policies.
Cities will only develop economically
while coping with both population growth and
climate change if they invest much more in re-
generating and upgrading their infrastructure.
However, there is already a huge gap between
most cities’ infrastructure needs and the invest-
ment capital available. Public funding will not be
sufficient to climate-proof and renovate infra-
structure while bank lending is likely to remain
constrained. Institutional investors will need to
help bridge the gap. However, this will not hap-
pen unless the policies and interests of cities,
investors, national governments and regional
policymakers become more closely aligned.
Cities need to make sure that their poli-
cies and regulations are conducive to long-term
private investment while also encouraging re-
source conservation. Local investment condi-
tions also depend critically on national as well
as supranational policy frameworks. Increased
investment in sustainable urban infrastructure
will therefore require strong partnerships be-
tween local and national governments as well as
international cooperation, in particular in the
EU. National governments need to do more to
develop sustainable investment policies and to
encourage private finance flows into infrastruc-
ture. The rules for public-private co-investments
could be simplified and improved in many plac-
es. The EU could do an inventory of all its rules
and policies that matter for private investment
in sustainable urban infrastructure. Existing
rules – from energy unbundling provisions to
capital requirements for banks and insurers –
should not impede long-term and sustainable
investing.
Importantly, all players involved need
to start a dialogue on how the marketplace for
sustainable urban infrastructure could be im-
proved. Even with the best regulations in place,
many institutional investors will struggle with
finding and evaluating urban infrastructure
projects, which tend to be small, sporadic and
highly diverse. National governments should
therefore consider the establishment of new
“Green Cities Platforms”. These organizations
would help to standardize, package and sell
sustainable urban infrastructure projects to po-
tential investors and thus help to overcome one
of the barriers to private investment into urban
infrastructure.

Inve
stm
ent i
n gr
eene
r citi
es: M
ind
the
gap
51Private investors can do their bit to help
bridge the investment gap. They can offer their
expertise and active participation in making
Green Cities Platforms work. They can help de-
velop new investment products and opportu-
nities in sustainable urban infrastructure. In
particular, potential investors and public bodies
should discuss how to establish pilot energy ef-
ficiency investment funds that could stimulate
increased investment both at the institutional
and retail level.
Insurers – with ample experience as
long-term institutional investors as well as a
deep understanding of the risks involved in
infrastructure – are in a strong position to ad-
vance sustainable urban infrastructure financ-
ing. They are also looking for new investment
opportunities. With the right policy framework
and market structure, institutional investment
in sustainable urban infrastructure could grow
significantly in future years, helping to narrow
the gap between cities’ financing needs and
available public capital.
The time to act is now. If cities cannot
find new financing to reach their carbon emis-
sion reduction goals, the global climate will heat
up – and many cities will suffer from climate-re-
lated extreme weather and natural disasters. If,
however, barriers to private sustainable urban
infrastructure investment can be overcome,
there is a greater chance to prevent climate
change while at the same time creating new in-
vestment opportunities.

Annex: What cities are doing to reduce CO2

Inve
stm
ent i
n gr
eene
r citi
es: M
ind
the
gap
53
The cities of Nordic countries are the most advanced in their climate policies. Nordic societies, living
at the edge of temperate zones, have long realized that adaptation to extreme weather conditions is a
matter of survival. They became frontrunners in adopting long-term strategies to protect the environ-
ment and to achieve a sustainable balance between society and nature. In the post-industrial era, it
was only a small step from there to comprehensive strategies for climate protection and the reduction
of greenhouse gas emissions, with a focus on urban areas. Other European countries, including Ger-
many, and parts of North America are not far behind, and cities in emerging market countries are now
following suit in their efforts to become greener. Here are a few examples from cities around the world
and below is a table of individual projects in OECD countries:
Copenhagen
The Danish capital wants to become 100% carbon neutral by 2025, according to its Climate Plan.73 Co-
penhagen is well on its way to reaching this ambitious goal: it has already either completed or started
50 initiatives in energy production, transport, energy efficiency and other areas. At the core of the
strategy is a move to sustainable energy production, which is supposed to cut emissions by 855,000
tons CO2 per year. Greener transport, a city-wide cycling scheme and more energy efficient buildings
are also supposed to make a significant contribution to carbon reduction targets.
Helsinki
The Helsinki City Council in January 2008 approved new energy guidelines that were aligned with EU
objectives to reduce greenhouse gas emissions by 20% and increase the share of renewables to 20% by
2020. In February 2010, Helsingin Energia, the municipality-owned energy provider, adopted its “HelEn
2020+” development plan which foresees different paths to carbon neutral energy production by 2050
at the latest. Following the most ambitious path, greenhouse gas emissions from energy production
could be reduced by up to 98% by 2030.74 The main pillars of this strategy are: combined heat and power
production based on the city’s district heating system; maximizing the energy efficiency of public and
private buildings (existing and new-built); efficient public transport system with low emission buses;
further waste reduction and intelligent waste treatment, including extended biogas energy production
from organic waste; and, last but not least, enhanced environmental education.
Munich
In Germany, too, many cities have embarked on the path towards a climate-neutral urban environ-
ment, partly driven by the Nationale Klimaschutzinitiative (the National Climate Protection Initia-
tive).76 One of the most advanced German cities is Munich. The Stadtwerke München, the local power
and water utility, is aiming to cover 100% of the city’s electricity demand from renewables by 2025,
according to its “Renewable Energy Offensive”.77 The strategy is based on several pillars: an increase
in geothermal energy production; direct investments in on- and offshore wind; extension of the city’s
hydro-electric sector, including the world’s first high-capacity hydro power station installed under a
river bed; an increase in biogas energy capacities; a program for solar panel installation on municipal
buildings; and increasing energy efficiency, for example of street lights. The city of Munich also has
pans for transport, including hybrid buses and priority cycling lanes. Munich also wants to build Ger-
many‘s first climate-neutral residential areas (Freiham, Neuaubing).
Anne
x: W
hat c
ities
are
doi
ng to
redu
ce C
O2
54
Stockholm
The Swedish capital wants to be fossil fuel-free by 2050. As an intermediate step, it seeks to reduce
emissions from today’s 4 tons of CO2 equivalent per resident to 3 tons in 2015. Stockholm is well known
for an administrative system that mainstreams environmental issues and conducts environmental
impact assessments for all policy and administrative decisions. Stockholm’s climate agenda encom-
passes all key areas. In energy production, the city is increasingly relying on a centralized district heat-
ing and cooling system and renewable sources as well as energy from waste. To save energy, Stockholm
is increasing subsidies for building investments and imposes standards for the energy efficiency of
buildings when they are sold or rented. In the transport sector, it operates public buses running on
electricity, ethanol or hybrid technologies, the city’s entire car fleet is renewables-based and it operates
a congestion charging zone to reduce traffic.75
Shanghai
Shanghai’s energy consumption is unusually high due to its agglomeration of energy-intensive heavy
industries (steel, construction, automotive manufacturing). What is more, Shanghai relies mostly on
coal to cover this heavy demand for energy: coal accounted for 95% of the city’s electricity production
and 47% of its total energy use in 2007 (although that was down from 65% in 2000). As a result, Shang-
hai, with its almost 20 million people, emits 9.7 tons of CO2 per capita, which is more than twice the
average of the 22 major Asian cities assessed in the Asian Green City Index.78 However, Shanghai could
become a frontrunner in moving from coal to renewables in coming years, through large long-term
investments in wind, solar, and biomass. Shanghai built its first wind power station in 2003. By 2007,
it had three of them, with a total capacity of 24 megawatts supplying power to 24,000 households. The
city is planning to have, by 2020, 13 offshore wind farms producing a total of 2.1 gigawatts for more
than 4 million households – Asia’s largest offshore wind farm project. If the investments go according
to plan, Shanghai would cut its coal use by 100,000 tons per year and its carbon emissions by 246,000
tons annually. Amongst many other low carbon projects, Shanghai aims to double the size of its metro
system which is already the world’s largest metro (with 420 km of track, compared with London’s 408
km and New York’s 368 km). Although the net effect of this expansion has not yet been quantified, it
should lead to a substantial reduction in carbon emissions.
Rio de Janeiro
“Rio Sustainable”, the city’s climate change plan adopted in 2009, foresees a cut in greenhouse gas
emissions of 8% by 2012 (from 2005 levels), 16% by 2016 and 20% by 2020. In contrast to Shanghai’s de-
pendence on coal, 88% of Rio’s electricity comes from renewable sources, mainly hydropower. As a re-
sult, Rio’s per capita emissions from electricity consumption is a fraction of the 17-city average in the
Latin America Green City Index79 (0.073 tons of CO2 compared with 0.202). Rio – host of the agenda-
setting first Earth Summit in 1992 – has a long track record of coherent environmental and clean en-
ergy policies. Rio was the first city in Latin America, for example, to publish a CO2 emissions inventory.
The city’s mayor is now heading the C40 cities initiative. The preparations for hosting the World Cup
in 2014 and the Olympic Games in 2016 are leading to further green initiatives, including: congestion
reduction policies; massive expansion of public transport capacities, which will also help to protect
the two large urban forests; closing the city’s old Gramacho waste landfill in 2011 and replacing it by
a new state-of-the-art waste facility at Seropedica; cutting CO2 emissions by 1.4 million tons per year
and generating biogas.
Project City Capital costs, USD million
Annual savings in CO2, kilo tons
TransportationBus rapid transit Vancouver 39.2 1.8
Congestion charging London 244 120Bike sharing Paris 132 18
BuildingsPublic building efficiency Berlin 80 31.6
Thermal building refurbishment Vienna 196 150
EnergySolar Center receiver station Seville 41 110
Offshore wind power Munich 652 598Traffic signal lighting Stockholm 3 1.54
Solid WasteSource seperation/ methane production Sydney 75 0.36
CHP district heating system Copenhagen 562 720Incineration-based CHP Gothenburg 453 205
District heating & cooling Helsinki 77 (2005-07) 2,700
Waste/ WastewaterBiogas from sewage Stockholm 15 14
Landfil gas reuse Christchurch 2.9 63.4

Inve
stm
ent i
n gr
eene
r citi
es: M
ind
the
gap
55
Johannesburg
Johannesburg faces the particular challenge that roughly half of its 4 million inhabitants live in
cramped townships with poor infrastructure and buildings. In contrast to the hot coastal cities of
Shanghai and Rio, Johannesburg needs a lot of energy in its often harsh winters. To make matters
worse, 90% of Johannesburg’s electricity comes from coal. Add the widespread burning of wood in
the townships, and CO2 emissions per person reach 1.5 tons – well above the 15-city average of 0.984
tons in the African Green City Index.80 Despite this difficult starting point, and motivated by the 2010
World Cup, Johannesburg launched its 2040 Growth Development Strategy in 2011. This strategy aims
gradually to replace fossil fuels with renewable energy, with a focus on solar energy for decentralized
electricity production and warm water supply. Other components of the program are: energy saving
initiatives; congestion reduction projects; enhancement of public transport (such as electric train net-
work, bus rapid transit system); a prosecution and fine-based waste separation and recycling system;
and innovative approaches to reducing urban sprawl by rehabilitating under-populated city areas and
building new mixed-density housing developments with short access to municipal services and public
transport. All these should substantially contribute to carbon emission reduction, although actual
results are still to be published.
Table 3: Sustainable urban infrastructure projects in OECD cities
Project City Capital costs, USD million
Annual savings in CO2, kilo tons
TransportationBus rapid transit Vancouver 39.2 1.8
Congestion charging London 244 120Bike sharing Paris 132 18
BuildingsPublic building efficiency Berlin 80 31.6
Thermal building refurbishment Vienna 196 150
EnergySolar Center receiver station Seville 41 110
Offshore wind power Munich 652 598Traffic signal lighting Stockholm 3 1.54
Solid WasteSource seperation/ methane production Sydney 75 0.36
CHP district heating system Copenhagen 562 720Incineration-based CHP Gothenburg 453 205
District heating & cooling Helsinki 77 (2005-07) 2,700
Waste/ WastewaterBiogas from sewage Stockholm 15 14
Landfil gas reuse Christchurch 2.9 63.4

End notes
Inve
stm
ent i
n gr
eene
r citi
es: M
ind
the
gap
57
1International Energy Agency (2009)
2 McKinsey (2012b)
3 IPCC (2014)
4 Munich Re (2013); IPCC (2012)
5 OECD (2012), p. 13
6 KPMG (2012)
7 LSE Cities (2013)
8 Siemens (2011b)
9 Siemens (2011a)
10 http://www.c40.org/
11 http://eumayors.eu/
12 After hurricane Sandy, both New York Governor Andrew Cuomo and Mayor Michael Bloomberg championed new storm protection infrastructure, which could cost the city more than USD 10 billion, Miller (2012)
13 The World Bank (2011)
14 European Commission (2013b)
15 The World Bank (2011)
16 Standard & Poor’s (2014); Thomasson (2012)
17 Kuntze et al. (2013)
18 KPMG (2010)
19 Standard & Poor’s (2014)
20 Boston Consulting Group (2013)
21 GVA (2010/2011)
22 The UN usually uses 1990 as base year for CO2 trends. Sippel (2010)
23 Wagenvoort (2011)
24 Baietti et al. (2012)
25 The Sharpe ratio is the ratio of an investment or portfolio’s excess return (risk premium) to its standard deviation
26 The average annual default rate for project finance debt has been 1.5% since 1998. Standard & Poor’s (2014)
27 Inderst (2013)
28 A widely used subsidy scheme under which the producers of renewable energy receive a guaran-teed, cost-based price
29 Swiss Re (2011)
30 Bloomberg New Energy Finance (2013)

End
note
s
58
31 OECD (2013a, c)
32 Bearing Point Institute (2013)
33 Estimate for 2011, OECD (2013c)
34 Under ideal circumstance, institutional investors could cover between one quarter and one half of renewable energy project debt and equity, respectively. Climate Policy Initiative (2013a)
35 Bearing Point Institute (2013)
36 Swiss Re (2012)
37 OECD (2013c).
38 “Axa Plans to Invest $13.3 Billion in Infrastructure Debt”, Bloomberg, June 18th 2013.
39 Omers (2012).
40 AustralianSuper (2013).
41 OECD (2013b)
42 USS (2013)
43 OECD (2011a)
44 Institutional investors accounted for only USD 0.4 billion out of a total USD 224 billion in private climate finance in 2012. The biggest private investors were energy utilities and renewable energy companies as well as manufacturing companies and corporate users of energy. Climate Policy Initia-tive (2013b)
45 Dieter Helm in EIB (2010)
46 Edwards (2013)
47 Allen (2012). As part of a PFI overhaul, the government aims to restrict tendering to 18 months.
48 The Economist (2012b)
49 Prakash (2012)
50 2009 KPMG survey on “Bridging the Global Infrastructure Gap: Views from the Executive Suite”, cited in KPMG (2010)
51 Steinbeis Research Center (2013)
52 Climate Policy Initiative (2013a).
53 National Association of Pension Funds (2013).
54 Lin & Lu (2013)
55 Climate Policy Initiative (2013).
56 Preqin (2013)
57 Deutsche Bank Research (2010)
58 Siemens (2012b)
59 District heating distributes heat generated in a central location to local houses and businesses. Often the heat comes from a cogeneration or combined heat-and-power plant.

Inve
stm
ent i
n gr
eene
r citi
es: M
ind
the
gap
59
60 The European Energy Efficiency Fund was launched in 2011 with EUR 265 million in funds from the European Commission, EIB, Cassa Deposit e Prestiti and Deutsche Bank. The aim is to increase the fund to EUR 800 million by attracting more investors.
61 Schiellerup in Centre for European Reform (2011)
62 http://www.dena.de/
63 Tindale (2010)
64 OECD (2012) pp. 32-33
65 HM Treasury (2013)
66 McKinsey (2013) p. 64
67 Deutsche Bank Research (2012)
68 Through the ETS, the EU sets a limit for the total amount of CO2 that industries are allowed to emit. Within this limit, companies are allocated or sold emission rights, which they can then trade with each other as needed. The overall CO2 limit is reduced over time so that total emissions fall.
69 The Europe2020 Project Bonds – a joint project of the European Commission and the EIB – will use credit enhancement features to attract institutional investors to infrastructure finance in transport, energy and communications. A pilot phase started in 2012 and the full program was due to get under way in 2014. EIB (2013)
70 Directive 2012/27/EU, http://ec.europa.eu/energy/efficiency/eed/eed_en.htm
71 European Commission (2013a)
72 Among the first privately-run, pure energy efficiency funds in Europe were the SUSI Energy Ef-ficiency Fund, launched in June 2013 in Switzerland, with € 300 million and CHF 100 million in capital to invest in energy efficiency retrofits of existing buildings; and the cooperative B.A.U.M. Zukunfts-fonds in Germany which is investing in energy efficiency projects in private mid-size companies and public buildings
73 City of Copenhagen (2009)
74 City of Helsinki (2010)
75 City of Stockholm (2012)
76 http://klimaschutz.de
77 Stadtwerke München (2011)
78 Siemens (2011a)
79 Siemens (2010b)
80 Siemens (2011c)

References

Inve
stm
ent i
n gr
eene
r citi
es: M
ind
the
gap
61
Alfen, H.W., Kalidindi, S. and Ogunlana, S. (2009): “Public-private partnership in infrastructure development: Case studies from Asia and Europe,“ University of Weimar. http://www.econstor.eu/obitstream/10419/56429/1/630589232.pdf
Allen, K. (2012): “Doubling down – PFI become PF2,” Financial Times, December 5th.
AustralianSuper (2013): “Asset allocation at AustralianSuper,” June.
Baietti, A.; Shlyakhtenko, A.; la Rocca, R.; Patel, U. (2012): “Green infrastructure finance: Leading initiatives and research,” The World Bank. http://dx.doi.org/10.1596/978-0-8213-9488-5
Bearing Point Institute (2013): “Are insurers the new banks for infrastructure investments?”
Bloomberg New Energy Finance (2013): “Global trends in renewable energy investment 2013,” Frankfurt School of Finance & Management. http://fs-unep-centre.org/system/files/globaltrendsreportlowres_0.pdf
Boston Consulting Group (2013): “Bridging the gap – Meeting the infrastructure challenge with public-private partnerships,” February.
Carbon Disclosure Project (2011): “CDP Cities 2011 – Global report on C40 cities”. https://www.cdproject.net/Documents/CDP-Cities-2011-Report.pdf
Centre for European Reform (2011): “Green, safe, cheap – Where next for EU energy policy?” http://www.cer.org.uk/pdf/rp_003.pdf
Ceres and Mercer (2009): “Energy efficiency and real estate: Opportunities for investors”. http://www.ceres.org/resources/reports/energy-efficiency-and-real-estate-opportunities-2009
City of Copenhagen (2009): “Copenhagen carbon neutral by 2025,” City of Copenhagen, The Technical and Environmental Administration. www.kk.dk/klima
City of Helsinki (2010): “Environmental sustainability issues and challenges in Helsinki 2010”. http://www.hel.fi/hki/ymk/en/Environmental+Programmes/The+City+of+Helsinki_s+Sustainability+Action+Plan
City of London (2013): “Low carbon London”. http://www.london.gov.uk/priorities/business-economy/low-carbon-economy
City of Stockholm (2012): “The Stockholm environment programme”. http://international.stockholm.se/PageFiles/135805/The%20Stockholm%20Environment%20Programme%202012-2015.pdf
City of Vienna (2013): “Umwelt und Klimaschutz”. http://www.wien.gv.at/umwelt-klimaschutz/
Clark, G. L.; Monk, A. H. B.; Orr, R.; Scott, W. (2011): “The new era of infrastructure investing”. http://dx.doi.org/10.2139/ssrn.1837813
Climate Policy Initiative (2013a): “The challenges of institutional investment in renewable energy”, by Nelson, D. and Pierpont, B., March. http://climatepolicyinitiative.org/publication/the-challenge-of-institutional-investment-in-renewable-energy/
Climate Policy Initiative (2013b): “The global landscape of climate finance,” October. http://climatepolicyinitiative.org/wp-content/uploads/2013/10/The-Global-Landscape-of- Climate-Finance-2013.pdf
Deutsche Bank Research (2010): “Green buildings. A niche becomes mainstream,” by Nelson, A.J., Rakau, O. and Dörrenberg, P.
Deutsche Bank Research (2012): “Einer für alle, alle für Einen? Kommunale Finanzagentur – ein Überblick,” by Zipel, F.
Refe
renc
es
62
Dobbs, R.; Rimes, J. (2012): “Introducing… the most dynamic cities of 2025,” Foreign Policy Magazine Oct/Nov 2012. http://www.foreignpolicy.com/articles/2012/08/13/introducing_the_most_dynamic_cities_of_2025
The Economist (2012a): “Investing in infrastructure: A question of trust,” May 12th. http://www.economist.com/node/21554579
The Economist (2012b) “The road forsaken: Brazil’s infrastructure needs are huge. So is the job of at-tracting private capital,” August 11th. http://www.economist.com/node/21560309
Edenhofer, O.; Carraro, C.; Hourcarde, J-C; Neuhoff, K. (2009): “Report on energy and climate policy in Europe – The economics of decarbonization,” Research report sponsored by Allianz SE and WWF. Potsdam-Institute for Climate Impact Research. www.pik-potsdam.de/recipe
Edwards, C. (2013): “Hurdles to private infrastructure investment, “Cato Institute, July 24th 2013. http://www.cato.org/blog/hurdles-private-infrastructure-investment
EIB (European Investment Bank) (2008): “JESSICA – A new way of using EU funding to promote sustainable investments and growth in urban areas”. http://eib.europa.eu/attachments/thematic/jessica_2008_en.pdf
EIB (European Investment Bank) (2010): “Public and private financing of infrastructure: Evolution and economics of private infrastructure finance,” European Investment Bank Papers Volume 15 No. 1. http://www.eib.org/attachments/efs/eibpapers/eibpapers_2010_v15_n01_en.pdf
EIB (European Investment Bank) (2013): “The Europe 2020 Project Bond Initiative – Innovative infrastructure financing”. http://eib.europa.eu/products/project-bonds/index.htm?lang=en
Ernst and Young (2010): “Capitalizing the Green Investment Bank – Key issues and next steps,” October. http://www.transformuk.org/en/research/greeninvestmentbank/
European Commission (2010): “Financing energy efficiency: Forging the link between financing and project implementation,” Joint Research Centre of the European Commission.
European Commission (2011): “Cities of tomorrow: Challenges, visions, ways forward,” Directorate-General for Regional Policy.
European Commission (2013a): “Green Paper – Long-term financing of the European Economy”.
European Commission (2013b): ”Long-term financing of the European economy”, Commission staff working document accompanying the Green Book.
European Commission (2013c): “JESSICA: Joint European support for sustainable investment in city areas,” website of the Directorate-General for Regional Policy. http://ec.europa.eu/regional_policy/thefunds/instruments/jessica_en.cfm#7
GDV (2012): “Positionspapier zur Verbesserung der Bedingungen für Investitionen in Erneuerbare Energien und Infrastruktur,“ Gesamtverband der Deutschen Versicherungswirtschaft. March 23rd. http://www.gdv.de
GVA (2010/2011): “Emission impossible: Can cities deliver on their carbon reduction targets?” Winter. http://www.bpf.org.uk/en/files/reita/reita_org_documents/analysis/GVA_- _EmissionImpossibleWinter2011-11.pdf .
HM Treasury (2013): “National Infrastructure Plan – Update 2013”. https://www.gov.uk/government/collections/national-infrastructure-plan
Inderst, G. (2013): “Infrastructure – A new asset class for investors?“, Financing infrastructure. A review of the 2010 EIB Conference in Economics and Finance.
International Energy Agency (2009): “World energy outlook 2009”. http://www.worldenergyoutlook.org/media/weowebsite/2009/WEO2009.pdf
Inve
stm
ent i
n gr
eene
r citi
es: M
ind
the
gap
63
International Energy Agency (2012): “World energy outlook 2012”. http://www.worldenergyoutlook.org/publications/weo-2012/
IPCC (2012): “Summary for policymakers,” in: “Managing the risks of extreme events and disasters to advance climate change adaptation,” by Field, C.B. et al (eds), A special report of Working Groups I and II of the Intergovernmental Panel on Climate Change.
IPCC (2013): “Summary for policymakers,” in: “Climate change 2013: The physical science basis – fifth assessment report,” Working Group I contribution to the IPCC fifth assessment report. http://www.ipcc.ch/report/ar5/wg1/
IPCC (2014): “The fifth assessment report of the United Nations Intergovernmental Panel on Climate Change,” March 2014
KPMG (2010): “The changing face of infrastructure – Public sector perspectives”. http://www.kpmg.com/Ca/en/IssuesAndInsights/ArticlesPublications/Documents/ TheChangingFaceofInfrastructurePublicSectorPerspectives.pdf
KPMG (2012): “Cities infrastructure – A report on sustainability”. www.kpmg.no/arch/img.aspx?file_id=9805584&ext=.pdf
Kuntze, M., Rottmann, R., Rinn, G. (2013): “Auswirkungen der Schuldenbremse auf die kommunale Ebene,“ Kommunale Gemeinschaftsstelle für Verwaltungsmanagement.
LEEF (London Energy Efficiency Fund) (2013): “About LEEF”. http://www.leef.co.uk/about/index.html
Lin, J.; Lu, K. (2013): “To finance the world’s infrastructure, we need a new asset class,” The World Post, October 10th.
Lowder, T. (2012): “Who’s afraid of Basel III?” National Renewable Energy Laboratory of the U.S. Department of Energy, Office of Energy Efficiency and Renewable Energy. https://financere.nrel.gov/finance/content/whos-afraid-basel-iii
LSE Cities (2013): “Going green – How cities are leading the next economy,” London School of Economics and Political Sciences, ICLEI & Global Green Growth Institute.
McKinsey Global Institute (2011a): “Urban world – Mapping the economic power of cities,” March. http://www.mckinsey.com/insights/urbanization/urban_world
McKinsey Global Institute (2011b): “2011 urban sustainability index, China”. http://www.mckinsey china.com/wp-content/uploads/2012/05/McKinsey-2011-Urban-Sustainability-Index.pdf
McKinsey Global Institute (2012): “Global cities of the future,” June. http://www.mckinseyquarterly.com/Cities_the_next_frontier_for_global_growth_2758
McKinsey Global Institute (2013): “Infrastructure productivity – How to save $1 trillion a year,” Janu-ary. http://www.mckinsey.com/insights/mgi/research/urbanization/infrastructure_productivity
Miller, C. (2012): “Will politicians actually heed the lessons of Sandy?” Slate.com November 5th. http://www.slate.com/articles/technology/future_tense/2012/11/hurricane_sandy_demonstrated_that_our_infrastructure_is_not_ready_for_climate.html
Munich Re (2013): 2NatCatSERVICE Welt 1980 – 2013”. As of January 2014. www.munichre.com
National Association of Pension Funds (2013): “Infrastructure fund secures ten pension funds and hits 1bn,” press release, February 18th. http://www.napf.co.uk/PressCentre/NAPFbuzz/ 0350_Infrastructure_fund_secures_ten_pension_funds_and_hits_10bn.aspx
OECD (2010): “Cities and climate change,” http://dx.doi.org/10.1787/9789264091375-en
OECD (2011a): “Pension funds investment in infrastructure – A survey”, by Della Croce, R.; Kaminker, C.; Steward, F., International Futures Programme, September. http://www.oecd.org/sti/futures/infrastructureto2030/48634596.pdf

Refe
renc
es
64
OECD (2011b): “The role of pension funds in financing green growth initiatives,” by Della Croce, R.; Kaminker, C.; Stewart, F. OECD Working Papers on Finance, Insurance and Private Pensions, no 10. http://www.oecd-ilibrary.org/finance-and-investment/the-role-of-pension-funds-in-financing-green-growth-initiatives_5kg58j1lwdjd-en
OECD (2011c): “Creating a better business environment for financing business, innovation and green growth, ” by Pelly, R.; Krämer-Eis, H., OECD Journal: Financial Markets Trends Volume 2011, Issue 1. http://www.oecd-ilibrary.org/finance-and-investment/creating-a-better-business-environment-for-financing-business-innovation-and-green-growth_fmt-2011-5kg55qw0x7xx
OECD (2012): “Financing green urban infrastructure,“ by Merk, O.; Saussier, S.; Staropoli, C.; Slack, E.; Kim, J.-H. (eds), OECD Regional Development Working Papers 2012-10. http://www.oecd.org/greengrowth/financinggreenurbaninfrastructure.htm
OECD (2013a): “The role of banks, equity and institutional investors in long-term financing for growth and development,“ Report for G20 Leaders.
OECD (2013b): “Annual survey of large pension funds and public pension reserve funds,” October. http://www.oecd.org/pensions/private-pensions/survey-large-pension-funds.htm
OECD (2013c): “Institutional investors and infrastructure finance,” by Della Croce, R.; Yermo, J., OECD Working Papers on Finance, Insurance and Private Pensions, No 36. http://www.oecd-ilibrary.org/finance-and-investment/institutional-investors-and-infrastructure-financing_5k3wh99xgc33-en
OMERS (Ontario Municipal Employees Retirement System) (2012): “Annual report 2012”.
Prakash, A. (2012): “Who will build India’s infrastructure?” Business Standard, September 14th.
Preqin (2013): “Infrastructure spotlight,” November https://www.preqin.com/docs/newsletters/inf/Preqin_Infrastructure_Spotlight_November_2013.pdf
PWC (2012): “Cities of opportunity 2012”. http://www.pwc.com/us/en/cities-of-opportunity/
Ruthhard, B. (2014): “City looking at investors to pay for energy efficient street lighting,” Chicago Tribune, February 25th.
Siemens AG (2009): “Siemens European Green City Index,” http://www.siemens.com/entry/cc/ features/greencityindex_international/all/de/pdf/report_de.pdf
Siemens (2010a): “Sustainable cities: Trends, investment challenges & financing solutions,” White Paper by Siemens Financial Services. http://finance.siemens.com/financialservices/global/en/press/studies/documents/whitepaper_2010_sustainable-cities.pdf
Siemens (2010b): “Siemens Latin American Green City Index.” http://www.siemens.com/entry/cc/de/greencityindex.htm
Siemens (2011a): “Siemens Asian Green City Index”. http://www.siemens.com/entry/cc/features/greencityindex_international/all/en/pdf/report_asia.pdf
Siemens (2011b): “Siemens US and Canada Green City Index”. http://www.siemens.com/entry/cc/de/greencityindex.htm
Siemens (2011c): “Siemens African Green City Index”. http://www.siemens.com/entry/cc/features/greencityindex_international/all/de/pdf/report_africa_en.pdf
Siemens (2012a): “Siemens Green City Index: A summary of the Green City Index research series”. http://www.siemens.com/entry/cc/en/greencityindex.htm
Siemens (2012b): “Sustainable urban infrastructure – Low carbon cities, » presentation by Pedro Pires de Miranda to the Allianz Global Issues Forum, April 24th.

Inve
stm
ent i
n gr
eene
r citi
es: M
ind
the
gap
65
Sippel, M. (2010): “Cities in Germany and their climate commitments – More hype than substance?”, MPRA, No. 23011.
http://mpra.ub.uni-muenchen.de/23011/1/MPRA_paper_23011.pdf
Stadtwerke München (2011): “Ausbauoffensive erneuerbare Energien”. www.swm.de
Standard & Poor’s (2014): “Global infrastructure – How to fill a $500 billion hole,”, S&P Research, Global Credit Portal, January 16th.
Steinbeis Research Center for Financial Services and Deka Bank (2012): “Rendite- und Risiko-Profile bei Eigen- und Fremdkapitalinvestitionen in Infrakstruktur.”
Steinbeis Research Center for Financial Services and Commerz Real (2013): “Infrastrukturinvest-ments bei institutionellen Investoren”. http://www.steinbeis-research.de/images/pdf-documents/Studie_CommerzReal_Infrastruktur_2013.pdf
Swiss Re (2011): “Introduction to renewable energy infrastructure investing,” http://media.swissre.com/documents/An_introduction_renewable_energy_en.pdf
Swiss Re (2012): “Swiss Re to invest USD 500 million in infrastructure debt through Macquarie platform,” press release, November 28th.
Tindale, S. (2010): “Repowering communities case studies – Vermont,” Climate Answers, July 16th. http://climateanswers.info/2010/07/repowering-communities-case-study-vermont/
Thomasson, S. (2012): “Encouraging U.S. infrastructure investment”, Policy Innovation Memorandum No. 17, Council on Foreign Relations, April 2012. http://www.cfr.org/infrastructure/encouraging-us-infrastructure-investment/p27771
US Department of the Treasury (2010): “A new economic analysis of infrastructure investment,” A report prepared by the Department of the Treasury with the Council of Economic Advisers, October 10th.
Vaughan, A.; Collinson, P. (2014): “How the Green Deal turned into the green disaster,” The Guardian, January 18th.
Wagenvoort, R. (2011): “Key facts and figures on infrastructure finance,” Financing infrastructure. A review of the 2010 EIB Conference in Economics and Finance.
Weber, B.; Alfen, H. W. (2010): “Infrastructure as an asset class – Investment strategies, project finance and PPP,”. Wiley Finance.
The World Bank (2010): “A city-wide approach to carbon finance,” http://citiesalliance.org/sites/citiesalliance.org/files/A_city-wide_approach_to_carbon_finance.pdf
The World Bank (2011): “Climate change, disaster risk, and the urban poor,” by Baker, J. (ed). http://web.worldbank.org/WBSITE/EXTERNAL/TOPICS/EXTURBANDEVELOPMENT/0,,contentMDK:22923088~menuPK:337184~pagePK:148956~piPK:216618~theSitePK:337178,00.html
The World Bank (2012a): “Investment decision making under deep uncertainty – Application to climate change,” by Hallegatte, S.; Shah, A.; Lempert, R., Brown, C.; Gill, S. http://elibrary.worldbank.org/doi/book/10.1596/1813-9450-6193
USS (2013): “Infrastructure,” website of the Universities Superannuation Scheme, http://www.uss.co.uk/UssInvestments/alternativeassets/privatemarkets/Infrastructure/Pages/default.aspx
World Economic Forum (2009): “Green investing – Towards a clean energy infrastructure,” http://www3.weforum.org/docs/WEF_IV_GreenInvesting_Report_2009.pdf


Imprint
PublisherAllianz SEPublic Policy & Economic ResearchKöniginstraße 2880802 Munichwww.allianz.com
Chief EconomistDr. Michael Heise
AuthorsKatinka BaryschRichard HewittDr. Peter KöferlDinah McLeod
DesignSchmitt. Kommunikation, Hamburg
Closing date2. April 2014
Legal disclaimerThe information contained in this publication has been carefully researched and checked by Allianz SE or reliable third parties. However, Allianz Group and any third party do not assume liability for the accuracy, completeness and up-to-dateness of the contents. The authors’ opinions are not necessarily those of Allianz SE. Statements do not constitute any offer or recommendation of certain investments, even if individual issuers and securities are mentioned. Information given in this issue is no substitute for specific investment advice based on the situation of the individual investor. For personalized investment advice please contact Allianz SE.

Zusa
mm
enfa
ssun
g
68


